
Submitted:
15 January 2025
Posted:
16 January 2025
You are already at the latest version
Abstract
Pressure Injury(PI) are localized damages to the skin or underlying soft tissues typically caused by intense and/or prolonged pressure, shearing, friction, or combination of these factors. The wound is difficult to heal and easily leads to infection and other complications. The repair of PI has become a global health problem. This paper describes the preparation and characterization of Graphene Oxide (GO)/Alginate (Alg) gel-loaded Platelet-Rich Plasma (PRP), and the effects of GO/Alg/PRP on cell proliferation and angiogenesis have been evaluated by cell experiments. The effects of GO/Alg/PRP on the Ischemic Reperfusion (I/R) model in mice were evaluated in animal experiments, and the relationship between oxidative stress and p38 Mitogen-Activated Protein Kinase (P38MAPK)/ Nuclear Factor-κB (NF-κB) pathway was investigated. GO/Alg, PRP and GO/Alg/PRP all promote cell proliferation, migration, angiogenesis, wound healing, collagen deposition and epithelial regeneration, and reduce oxidative stress damage of cells and tissues. Among these, GO/Alg/PRP plays the most significant role. We also found a relationship between oxidative stress and the p38MAPK/NF-κB pathway. Our findings suggest that GO/Alg/PRP could be an effective strategy for the treatment of I/R injuries and may serve as a basis for the development of novel PRP based bioactive wound dressings.
Keywords:
graphene oxide/alginate gel
; platelet-rich plasma
; wound healing
; oxidative stress
; pressure injury
1. Introduction
The treatment methods of PI mainly include conservative dressing change, surgical debridement, negative pressure therapy, platelet and growth factor application, etc [1]. However, due to impaired cell function and the lack of bioactive factors around the wound, these traditional therapies are not effective in promoting wound healing and blood vessel formation [2]. Due to the limitations of various treatment modalities, the treatment of PI remains a challenge and it is necessary to seek new therapeutic approaches.
Free radical-mediated oxidative stress causes DNA to break and lipid peroxidase to be inactivated, further hindering wound healing [3]. Reactive oxygen species (ROS) produced by oxidative stress are one of the important factors that increase I/R injury, resulting in inflammation and endothelial dysfunction. This disrupts cytokine synthesis, delays healing, leads to extensive tissue necrosis and the development of ulcers [4]. In addition, ROS is also essential for angiogenesis, which is a key link in the wound healing process [5]. Therefore, the search for effective regulation of oxidative stress treatment has become a research hotspot. Recent studies indicate that P38MAPK/NFκB signaling pathway can inhibit oxidative stress injury and inflammatory infiltration, and then promote PI healing and angiogenesis after skin I/R [6]. P38MAPK is a signal transduction molecule that exists in cells and is mainly involved in cell response to stress stimuli. When ROS levels rise in vivo, ROS can modify protein kinases located on the P38MAPK signaling pathway, change their activity state, and then activate the P38MAPK signaling pathway, triggering a series of stress responses in cells, including inflammation, cell proliferation, differentiation, and apoptosis [7].
PRP is used to repair and rebuild wounds by activating growth factors released after the treatment. PRP is safe and has been in use since the 1970s, It has great application prospect in the field of biomedicine [8,9]. GO and Alg gels are two kinds of nanomaterials and natural polymer materials with good biocompatibility and drug transport capacity. When they are used together, drug carriers with excellent biological activity and therapeutic function can be prepared [10]. Studies have shown that hydrogels containing PRP and Alg help human cells proliferate [11]. Studies have proved that hydrogels containing PRP and oxidized alginate can promote the proliferation of human cells. The composite hydrogel of platelet-rich plasma fibrin matrix and alginate can promote wound healing in diabetic mice [12]. Other studies have proved that GO can improve the physical properties of biomaterials and promote tissue repair. PRP gels with different concentrations of graphene oxide can promote bone tear healing and supraspinatus tendon reconstruction in rabbit models [13]. However, there are no relevant studies on PRP supported by GO/Alg gel. We have explored the safety and feasibility of GO/Alg/PRP before [9,14]. The aim of this study was to investigate the effects of GO/Alg gel-loaded PRP on mice skin I/R PI and human keratinocyte (HaCaT) cells in vitro, and to explore the relationship between PRP and ROS and p38MAPK/NF-κB pathway.
2. Results and Discussion
2.1. Characterization of GO/Alg/PRP Gels
The preparation process of GO/Alg/PRP is shown in Figure 1A. The freeze-dried samples of GO/Alg and GO/Alg/PRP were cut by gold spray and their microstructure was observed by electron microscope. GO/Alg forms a three-dimensional mesh-like structure with uniform folds on the pore wall and prominent granular inclusions covering the fold surface, suggesting a close relationship with neighboring structures (Figure 1B). GO/Alg/PRP also presents a three-dimensional mesh-like structure, with fibrin connected between the fold walls of GO/Alg, making the network structure denser (Figure 1C). GO has unique physical and chemical properties, which provide a suitable interface for cell growth and adhesion [15]. Alg is a biocompatible material, and its natural threedimensional grid structure can simulate the extracellular matrix and provide a scaffold for cell adhesion, thus promoting cell proliferation and migration. The porous network structure provides a good environment for gas exchange and nutrient transport [16]. After PRP is added to GO/Alg material, it is evenly distributed in the pores of the material, and the fibrin in the material is crosslinked with the pore wall to form a more stable three-dimensional structure. The stable threedimensional structure provides ample adhesion space for platelets, closely mimicking the body’s physiological environment. This facilitates the slow release of growth factors, extending their effectiveness [14]. As a result, tissue repair and regeneration are promoted more effectively and permanently. This structure also enhances the biological activity of PRP, allowing for precise and expanded regulation of the wound microenvironment.
2.2. GO/Alg/PRP Promotes Cell Proliferation In Vitro
The effect of GO/Alg/PRP gel on the proliferation of HaCaT cells under oxidative stress was observed by live/dead fluorescence staining, as shown in Figure 2A, and the image analyzed and quantified by ImageJ software, as shown in Figure 2B. The proportion of living cells in the control group, model group, GO/Alg group, PRP group, and GO/Alg/PRP group were as follows: 97.84%±0.55%, 54.57%±13.08%, 74.36%±6.27%, 92.30%±3.40%, and 97.71%±1.30%, respectively. When compared to the control group, the proliferation rate of HaCaT oxidative stress cells in the model group significantly decreased, and the difference was statistically significant (P < 0.001). Compared with the model group, the application of GO/Alg gel, PRP gel, and GO/Alg/PRP gel all increased the proliferation rate of HaCaT oxidative stress cells to varying degrees. The proliferation rate of the GO/Alg/PRP group was the highest (P < 0.001). These results indicate that H2O2 intervention has a greater degree of damage to HaCaT cells and significantly reduces the cell proliferation rate. GO/Alg gel, PRP gel, and GO/Alg/PRP gel have been shown to enhance the activity of HaCaT cells under oxidative stress. Specifically, the application of PRP gel and GO/Alg/PRP gel was found to be effective in enhancing cell activity. Furthermore, the effect of GO/Alg/PRP gel was significantly greater than that of the GO/Alg group (P < 0.05). Considering that PRP and GO/Alg had a synergistic effect, the effect of promoting the proliferation of HaCaT oxidative stress cells was more significant. Our results suggest that GO/Alg/PRP gel significantly promotes H2O2-induced proliferation of HaCaT cells, implying a potential protective effect against cell growth inhibition caused by oxidative damage. The large specific surface area of GO provides more attachment space for cell growth, and its physical and chemical properties can reduce oxidative damage and facilitate cell proliferation [17]. The action of Alg is synergistic with GO, and its good biocompatibility helps to maintain the microenvironment of cells [18]. Growth factors in PRP activate cell metabolism and accelerate the cell cycle. The combination of the three forms a good microenvironment that promotes cell proliferation.
2.3. GO/Alg/PRP Promotes Cell Migration In Vitro
The influence of cell migration ability was reflected in the mobility of human foreskin fibroblast (HFF-1) cell model after different interventions under light microscope. The effects of GO/Alg gel and PRP on the migration ability of HFF-1 cells were observed by transwell assay. The quantitative statistical results of cell mobility conducted by ImageJ software showed that, as shown in Figure 3A and Figure 3B, the proportion of HFF-1 cells in the control group, model group, GO/Alg group, PRP group, and GO/Alg/PRP group was 60.01%±2.48%, 20.64%±1.20%, 38.09%±7.67%, 46.05%±6.22%, and 52.29%±0.57%, respectively. Compared with control group, the mobility of HFF-1 cells in model group was significantly decreased, and the difference was significant (P < 0.001). Compared with model group, the use of GO/Alg gel, PRP gel and GO/Alg/PRP gel all increased the mobility of HaCaT oxidative stress cells to varying degrees, and the mobility of cells in GO/Alg/PRP group was the highest (P < 0.001). The intervention of H2O2 was found to cause greater damage to HFF-1 cells and significantly reduce cell mobility. The migration ability of HaCaT cells under oxidative stress was significantly promoted by the GO/Alg group, PRP group, and GO/Alg/PRP group. The mobility of HFF-1 oxidative stress cells in the GO/Alg/PRP group was higher compared to both the GO/Alg and PRP groups. However, there was no statistical significance when compared to the control group (P > 0.05), which had a similar level of mobility as normal cells. When considering the combined action of GO/Alg and PRP, the effect on promoting the migration ability of HFF-1 oxidative stress cells was more significant. GO provides physical support for cell attachment, provides a relatively favorable physical environment for cell migration, and promotes cell movement. GO can adsorb growth factors in PRP, play a role in slow release of growth factors, maintain a high local effective concentration of growth factors, extend the effective time of interaction between cell receptors and growth factors, and more effectively stimulate the migration of HFF-1 cells [16]. PRP and GO can also jointly regulate adhesion connections and communication connections between cells, and contribute to the coordinated movement of cell populations and promote cell migration [14].
2.4. GO/Alg/PRP Promotes Cell Angiogenesis In Vitro
We used angiogenesis experiment to study the angiogenesis of human umbilical vein endothelial cells (HUVEC) cells in vitro, and observed the effect of GO/Alg/PRP gel on the angiogenesis ability of HUVEC cells. Angiogenesis analyzer, a software plug-in of ImageJ, was used to conduct quantitative analysis of the captured photos, as shown in Figure 4A, Figure 4B and Figure 4C. In comparison to the control group, the model group exhibited a significant reduction in both the total vascular length and the number of vascular branches of HUVEC cells (P < 0.001). Conversely, the GO/Alg, PRP, and GO/Alg/PRP groups showed an increase in the total vessel length and the number of vessel branches compared to the model group. Furthermore, the cells in the GO/Alg/PRP group demonstrated enhanced tube-forming ability, leading to a significant increase in the number of tube branches and the total length of tubes formed in HUVEC cells (P < 0.001). These results indicated that H2O2 intervention significantly inhibited the angiogenesis of HUVEC cells in vitro. After treatment with GO/Alg gel, PRP gel and GO/Alg/PRP gel, the tube formation ability of HUVEC cells was enhanced to varying degrees. There was no significant difference in tube forming ability between the GO/Alg/PRP group and the control group (P > 0.05), indicating that the tube forming ability of the cells treated with GO/Alg/PRP gel may be comparable to that of normal cells. Because of their good biocompatibility, GO and Alg may enhance cell response to angiogenesis signals by regulating the expression of intracellular growth factor receptors, and help endothelial cells to form a more complete tubular structure [19]. The growth factors in PRP can directly stimulate the proliferation and differentiation of HUVEC cells, regulate the local inflammatory response, promote the connection between endothelial cells and the stability of tubular structure, improve the quality and efficiency of angiogenesis, and jointly promote the oxygenation-induced angiogenesis of HUVEC cells [20].
2.5. GO/Alg/PRP Alleviates Cell Lipid Peroxidation Damage In Vitro
In order to study the effect of GO/Alg/PRP on oxidative stress in vitro, flow cytometry was used to detect the effect of GO/Alg/PRP on H2O2-induced ROS accumulation in HaCaT cells, and the results were shown in Figure 5A. The levels of malondialdehyde (MDA) and superoxide dismutase (SOD) in HaCaT cells of each experimental group were detected by enzyme-linked immunosorbent assay (ELISA), and the results were shown in Figure 5B and 5C. Compared to the control group, the model group showed a significant increase in the proportion of total ROS positive cells and MDA content in HaCaT cells induced by oxidation (P<0.001), and a significant decrease in SOD content (P<0.001). In comparison to the model group, the GO/Alg group, PRP group, and GO/Alg/PRP group exhibited varying degrees of decrease in intracellular total ROS quantity and MDA content, with statistically significant differences (P<0.05). Additionally, the SOD content in these groups showed varying degrees of increase, with statistically significant differences (P<0.05). These results indicated that H2O2 aggravated the lipid peroxidation damage of HaCaT cells. However, the application of GO/Alg gel, PRP gel, and GO/Alg/PRP gel effectively alleviated this damage. Among these, GO/Alg/PRP gel had the most significant effect. There was no statistically significant difference (P > 0.05) compared to the control group, suggesting that the application of GO/Alg/PRP gel normalized the lipid peroxidation damage of HaCaT cells. These results all suggest that GO/Alg/PRP may reduce the H2O2-induced oxidative stress of HaCaT cells in vitro. MDA is the result of excessive ROS production under oxidative stress, and the activity of SOD is decreased, indicating a decrease in the antioxidant capacity of cells, an aggravation of lipid peroxidation damage, and a decrease in cell activit [21]. Normal levels of ROS are effective in promoting angiogenesis and fighting bacterial infections. However, long-term excessive ROS levels can cause irreversible cell damage and chronic inflammation in the microenvironment, make the wound more fragile, inhibit the function of endogenous stem cells and macrophages, and hinder wound healing [22].
2.6. GO/Alg/PRP Inhibits the p38MAPK/NF-κB Signaling Pathway in Oxidative Stress Cells
Using GAPDH as the internal reference, Western blotting was used to detect the expression of TGF-β, p-p38MAPK, p38MAPK, p-NF-κB-p65, NF-κB-p65, IκBα, and p-IκBα proteins, and the results were shown in Figure 6A. The protein was quantitatively analyzed using ImageJ software, and the ratios of p-p38MAPK/p38MAPK, p-NF-κB-p65/NF-κB-p65, and p-IκBα/IκBα were calculated to explore the association between the material and the p38MAPK/NF-κB pathway, as shown in Figure 6B-E. Compared with the control group, the model group showed significantly increased levels of TGF-β, p-p38MAPK, p-NF-κB-p65/NF-κB-p65, and p-IκBα/IκBα (p < 0.01, p < 0.001, p < 0.001, P < 0.01), indicating H2O2 oxidative stress-induced overexpression of TGF-β and activation of the p38MAPK/NF-κB signaling pathway in HaCaT cells. Compared with the model group, the expressions of TGF-β, p-p38MAPK, p-NF-κB-p65/NF-κB-p65, and p-IκBα/IκBα in the GO/Alg, PRP, and GO/Alg/PRP groups were decreased to varying degrees. The effect of GO/Alg/PRP was more significant, indicating that GO/Alg/PRP gel inhibited the expression of TGF-β and the progression of p38MAPK/NF-κB signaling pathway. Overexpression of TGF-β can lead to excessive deposition of extracellular matrix and accelerate the fibrosis process [23]. The p38MAPK pathway plays a role in cell stress response, apoptosis, and inflammation, leading to the production of inflammatory factors and cell apoptosis [24]. On the other hand, the NF-κB pathway is responsible for regulating the expression of inflammatory factors, immune-related receptors, and other genes, playing a crucial role in inflammatory and immune responses, as well as cell survival [25]. Under normal conditions, IκBα binds to NF-κB in a deactivated state, and when cells are stimulated, IκBα is phosphorylated and degraded to release NF-κB, so the increased p-IκBα/IκBα ratio also indicates the initiation of the NFκB pathway [26]. These results indicated that H2O2-induced HaCaT cells significantly enhanced the cell stress response, apoptosis degree and inflammatory response, and the use of GO/Alg gel, PRP gel and GO/Alg/PRP gel inhibited the cell stress response, apoptosis degree and inflammatory response, and reduced the stress damage of the signaling pathway to the cells.
2.7. GO/Alg/PRP Promotes Wound Healing in I/R Injury
We observed the wound healing of experimental mice in each group, as shown in Figure 7A and 7B. It is evident that the wounds in each group exhibit a healing trend over time. Data analysis with ImageJ software. On day 4, the wound healing rates of control group, model group, GO/Alg group, PRP group, and GO/Alg/PRP group were 45.57%±3.53%, 42.12%±4.09%, 50.66%±4.35%, 54.93%±2.47%, 69.29%±4.73%, respectively. The wound area of GO/Alg/PRP group was significantly reduced. The wound healing rate of PRP group was higher than that of GO/Alg group, mainly due to the fact that PRP gel released a large amount of growth factors in the early stage of wound healing. From day 7 to day 14, the wound healing rate of GO/Alg group was higher than that of PRP group, mainly due to the slow-release effect of GO/Alg on growth factors, so that the growth factors could continue to act on the wound and promote wound healing. 14 days, plus or minus 0.63%, 87.32% and 81.49% plus or minus 1.7%, 91.57%, plus or minus 1.27%, 3.22%, 93.29%, plus or minus 98.65% plus or minus 0.6%. Compared to the model group, the wound area was significantly reduced in the GO/Alg, PRP, and GO/Alg/PRP groups (P<0.001, P<0.01, P<0.001), indicating improved wound healing. Furthermore, the healing effect of the GO/Alg/PRP group was found to be more significant than that of the GO/Alg group and the PRP group. After considering the combined effect of GO/Alg and PRP, it has been determined that the promotion of wound healing is more effective. The healing rate of the model group was consistently the lowest throughout the entire process. Given that I/R injury exacerbated the level of oxidative stress on the wound, the application of materials helped alleviate oxidative stress and expedited wound healing. The wound healing rate was highest in the GO/Alg/PRP group. With the rich growth factor content of PRP and the slow-release effect of GO/Alg, the healing rate of the wound was significantly enhanced. Alg can absorb wound exudates, be applied to the wound in gel form, maintain the moisture of the wound, and provide a conducive environment for wound healing [27]. GO can enhance the toughness of the material and prevent the gel material from cracking [28]. A variety of growth factors in PRP can promote the formation of blood vessels, collagen deposition and epithelial regeneration, providing sufficient nutrition and oxygen for wound repair [20,29].
2.8. GO/Alg/PRP Promotes Reepithelialization and Collagen Deposition of I/R Injured Wound Tissue
Hematoxylin-Eosin(HE) staining was used to observe the complete re-epithelialization ability of wound tissue in each group on the 14th day after injury, and Masson staining was used to evaluate the epidermal thickness, as shown in Figure 8A and Figure 8B. The quantitative analysis results are shown in Figure 8C and Figure 8D. Compared to the control group, the model group showed a significant decrease in epithelial thickness and collagen deposition content in the wound tissue (P < 0.01, P < 0.001). This suggests that I/R injury is more damaging to the skin tissue of mice compared to acute injury, leading to reduced epithelial regeneration and collagen production capacity in the wound. Additionally, the GO/Alg group, PRP group, and GO/Alg/PRP group all demonstrated varying degrees of accelerated wound reepithelialization and collagen deposition compared to the model group, with statistically significant differences (P < 0.001). Among them, the reepithelialization in GO/Alg/PRP group was more significant than that in GO/Alg and PRP groups. When GO/Alg and PRP are considered to work together, the effect of promoting wound healing is better, and the content of collagen deposition in wound tissue is increased. These results suggest that GO/Alg/PRP can significantly promote wound reepithelialization and collagen deposition. GO has excellent mechanical properties, providing support for cells, adsorbing growth factors, promoting cell proliferation and accelerating epithelial regeneration [17]. Alg provides a good adhesion environment for cells, keeps the wound moist, facilitates cell migration, and stimulates fibroblasts to produce collagen [30]. PRP contains a large number of growth factors, such as platelet-derived growth factor (PDGF), transforming growth factor-β (TGF-β), etc. The combination of the three elements can mimic the physiological environment in the body, utilize their individual strengths, and effectively enhance epithelial regeneration and collagen deposition. TGF-β can regulate the synthesis of extracellular matrix, promote the production of collagen, and stimulate the growth and migration of epithelial cells, strengthen the anti-damage ability of the wound, regulate the inflammatory response of the wound, and reduce the adverse effects of inflammation on the wound [20,31]. The combination of the three can simulate the physiological environment in the body, play their respective advantages, and better promote epithelial regeneration and collagen deposition.
2.9. GO/Alg/PRP Promotes the Angiogenesis of I/R Injury Wounds
The expression of VEGF-A, CD31 and α-SMA was detected by immunohistochemistry to evaluate the angiogenic ability of hydrogels. The immunohistochemical staining results were shown in Figure 9A, and the brown part of the GO/Alg/PRP group was significantly higher than that of the other three groups. In Figure 9B, 9C, and 9D, the expression of VEGF-A, CD31, and α-SMA was significantly reduced in the model group compared to the control group, with statistical significance (P < 0.01, P < 0.001, P < 0.001). The expression of VEGF-A, CD31, and α-SMA in the GO/Alg, PRP, and GO/Alg/PRP groups was significantly increased compared to the model group. Additionally, angiogenesis in the GO/Alg/PRP group was significantly higher than in the GO/Alg and PRP groups (P < 0.001). When GO/Alg and PRP are considered to act together, they have a stronger ability to promote wound angiogenesis. These results suggest that the combination of GO/Alg/PRP can effectively promote vascular proliferation in wound repair. Oxidative stress-induced inflammation leads to collagen and angiogenesis [20]. Alg provides a suitable extracellular matrix environment, facilitates the adhesion, proliferation and migration of endothelial cells, and regulates cell-cell and cell-matrix interactions [16,32]. GO can stabilize the scaffold constructed by Alg, contribute to the growth and extension of vascular endothelial growth factor, and build a stable “skeleton” for the generation of blood vessels [13]. Vascular endothelial growth factor (VEGF) contained in PRP is a highly specific pro-vascular endothelial cell growth factor, which stimulates the proliferation, migration and lumen formation of endothelial cells, and is a key regulatory factor in the process of vascular growth. PDGF can stimulate smooth muscle cells and peripheral cells to migrate and proliferate to the site of angiogenesis, providing stable support for new blood vessels [33,34]. The combination of GO and Alg can slowly release the growth factors in PRP and continuously stimulate the formation of blood vessels around the wound.
2.10. GO/Alg/PRP Reduces Oxidative Stress Caused by Skin I/R Damage
Several widely recognized molecules related to oxidative stress were measured. MDA and SOD contents were detected by ELISA to investigate the effects of GO/Alg/PRP on oxidative stress damage in cells. The results indicated that the total MDA content (Figure 10A) in the model group were significantly higher (P<0.001) compared to the control group. Additionally, the SOD content (Figure 10B) in the model group was significantly lower (P<0.001). On the other hand, the total MDA content in the GO/Alg, PRP, and GO/Alg/PRP groups were significantly lower (P<0.01, P<0.001, P<0.001) compared to the model group. Furthermore, the SOD content in these groups was significantly higher (P>0.05, P<0.05, P<0.001). These results suggest that I/R injury exacerbates lipid peroxidation damage in mouse skin tissue. The use of gel in the GO/Alg group, PRP group, and GO/Alg/PRP group can effectively reduce oxidative stress induced by I/R injury. Specifically, the GO/Alg/PRP group demonstrated a higher antioxidant effect compared to both the GO/Alg and PRP groups. High levels of ROS produced by immune cells in the wound activate NF-κB, significantly increase the expression of inflammatory mediator interleukin-6 (IL-6) and tumor necrosis factor-α (TNF-α), leading to chronic inflammation and slowing wound healing. PRP can block the apoptosis pathway by activating some signal pathways, and promote the proliferation, regeneration and migration of endothelial and epithelial cells, thus alleviating lipid peroxidation MDA injury and effectively improving the healing ability of I/R injured wounds in mice [35,36]. Therefore, keeping ROS at the wound site at appropriate levels may help promote wound healing [22].
2.11. GO/Alg/PRP Reduces Wound Damage by Inhibiting the p38MAPK/NF-κB Signaling Pathway
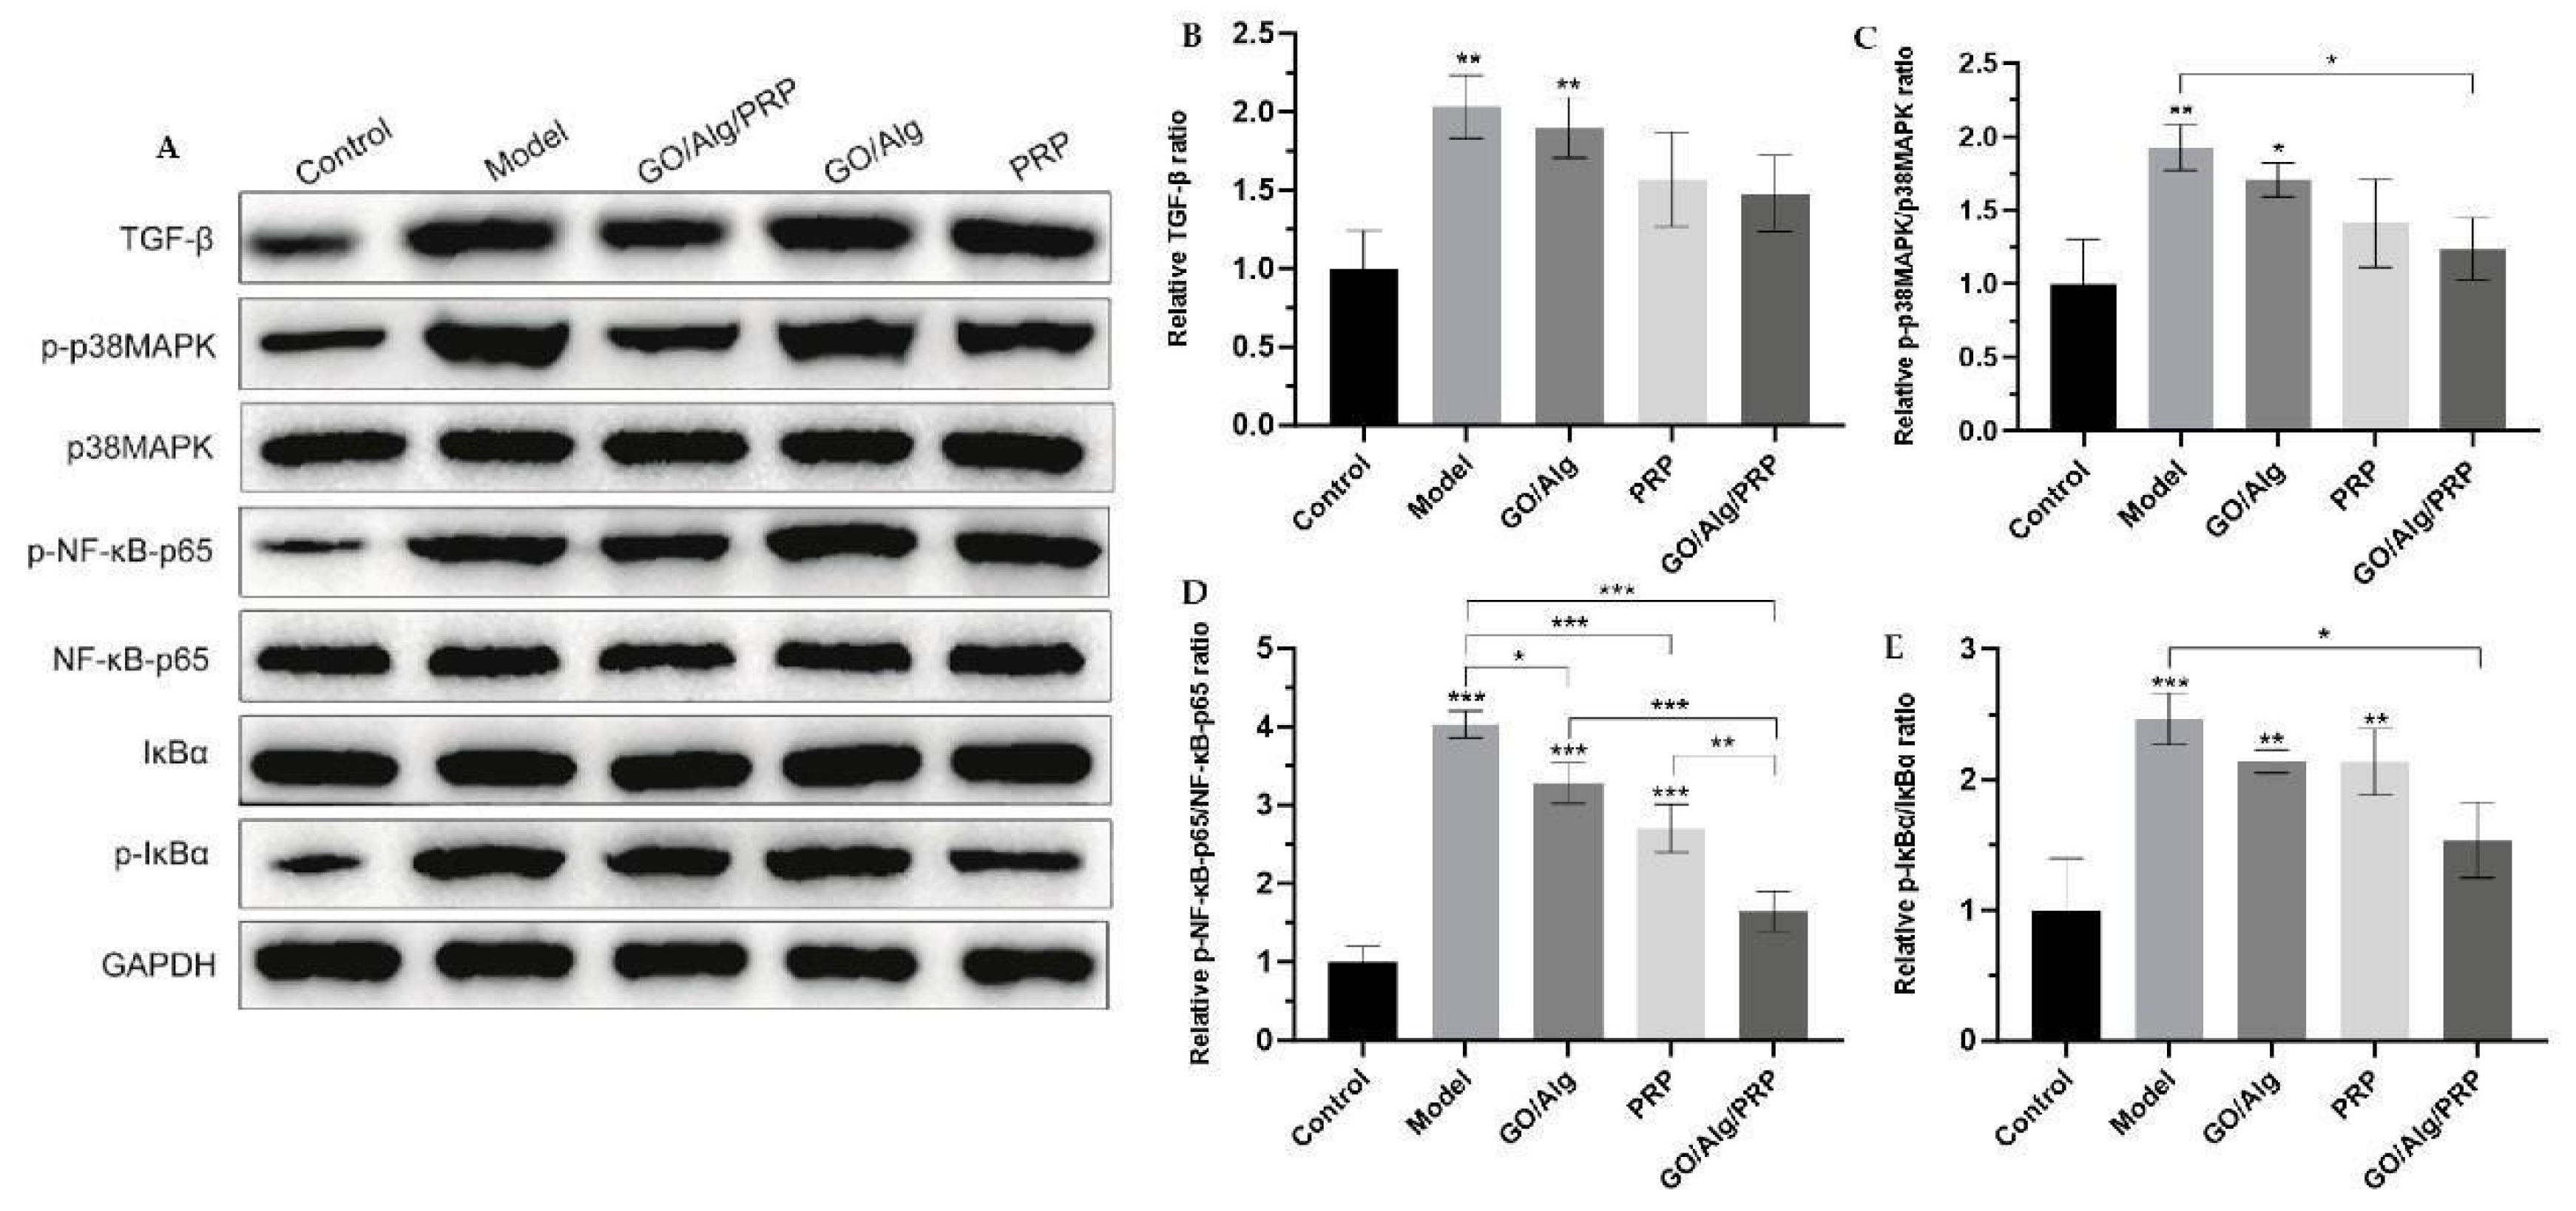
Western blotting was utilized to detect the expression levels of TGF-β, p-p38MAPK, p38MAPK, p-NF-κB-p65, NF-κB-p65, p-IκBα, and IκBα proteins, with the results presented in Figure 11A. The protein levels were quantitatively analyzed using ImageJ software, and the ratios of pp38MAPK/p38MAPK, p-NF-κB-p65/NF-κB-p65, and p-IκBα/IκBα were calculated to investigate the relationship between the material and the p38MAPK/NF-κB pathway, as depicted in Figure 11B-E. In comparison to the control group, the expressions of TGF-β, p-p38MAPK, p-NF-κB-p65/NF-κBp65, and p-IκBα/IκBα were significantly elevated in the model group. The difference was statistically significant (P < 0.01, P < 0.01, P < 0.001, P < 0.001). In comparison to the model group, the GO/Alg group, PRP group, and GO/Alg/PRP group all significantly inhibited the expression of TGF-β protein and decreased the content of p-p38MAPK/p38MAPK, p-NF-κB-p65/NF-κB-p65, and p-IκBα/IκBα to varying degrees. The differences were statistically significant. These results indicate that TGF-β is overexpressed and the p38MAPK/NF-κB signaling pathway is activated in I/R damaged tissues. GO/Alg gel, PRP gel, and GO/Alg/PRP gel all inhibited the expression of TGF-β and the progression of the p38MAPK/NF-κB signaling pathway. However, the effect of GO/Alg/PRP gel was found to be more significant. Overexpression of TGF-β can lead to excessive deposition of extracellular matrix and increase scar formation [37,38]. The p38MAPK pathway and the NF-κB pathway are involved in inflammation, immune response and cell survival, and the increased p-IκBα/IκBα ratio also indicates the activation of the NF-κB pathway. These results indicated that stress response, apoptosis and inflammation were significantly enhanced by I/R injury [26,39]. The use of GO/Alg gel, PRP gel and GO/Alg/PRP gel inhibited the stress response, apoptosis degree and inflammatory response of cells, reduced the stress damage of signal pathway to the wound, and alleviated the damage of inflammatory cells and inflammatory factors to tissues.
3. Conclusions
GO/Alg and PRP alone or in combination can significantly promote the healing of full-thickness skin wounds in mice. GO/Alg/PRP therapy shows superior results, including improving the regeneration of extracellular matrix tissue, increasing collagen deposition, promoting angiogenesis and reducing cell peroxidation damage. This may be due to its synergistic effect on angiogenesis and inflammation regulation. This comprehensive method is more conducive to re-epithelization and wound healing. These findings emphasize the potential of combining GO/Alg with PRP as an effective strategy for the treatment of stress injury. Further research is needed to improve the treatment plan and confirm the long-term efficacy of this method in different clinical environments.
4. Materials and Methods
According to our experimental design, 8 weeks old healthy male BALB/c mice (25~30g) were selected, and all the animals were kept in standard laboratory conditions, eating and drinking freely. Animal care and experimental procedures are approved by the Ethics Committee of Shandong University and Weihai Municipal Hospital and comply with all applicable institutional and governmental regulations regarding the ethical use of animals. Strictly follow the guidelines for the care and use of laboratory animals.
4.1. Preparation of PRP
PRP was separated by secondary centrifugation. Male BALB/c mice weighing 25~30g were selected for the preparation of PRP. They were successfully anesthetized with 10% chloral hydrate (Shanghai McLean Biochemical Technology Co., LTD., China). Peripheral blood was then extracted from the mice and placed in an anticoagulant tube containing 3.2% sodium citrate (Peripheral blood: sodium citrate =10: 1). The samples were thoroughly mixed to prevent blood clotting. Part of the sample was analyzed within 1 hour using an automatic cell counting system to detect the whole blood platelet concentration. The whole blood was put into a centrifuge (Hunan Xiangyi Laboratory Instrument Development Co., LTD., China) for the first centrifugation (centrifugation parameter was 2000rmp, 15 minutes). After centrifugation, the whole blood was divided into three layers, the upper layer contained most platelets and plasma, the bottom layer was red blood cell layer, and the middle layer (buffer) contained white blood cells and platelets. Platelets are mainly found in the upper and middle layers. The upper layer and part of the middle layer were slowly transferred to a new aseptic centrifuge tube, and a second centrifuge was performed after leveling (centrifuge parameter was 3000rmp, 10 minutes). The upper 2/3 was platelet-poor plasma (PPP), in which the platelet content was low, and the lower 1/3 was PRP. Discard the upper 2/3 of the PPP and gently shake the centrifugal tube to obtain the final PRP. The PRP prepared using this method obtained a platelet concentration approximately 6 times higher than the baseline concentration.
4.2. Preparation of GO / Alg
An appropriate amount of GO powder (Shenzhen Guosen Linghang Technology Co., Ltd., China) was dispersed in sterilized distilled water with a concentration of 2 mg/ml. The dispersion was then placed in an ultrasonic washer (Ningbo Xinzhi Biotechnology Co., Ltd., China) at room temperature and evenly dispersed for 2 hours. An appropriate amount of Alg powder (Shanghai Aladdin Biochemical Technology Co., Ltd., China) was added to the GO dispersion (3%wt), stirred well, and left at room temperature for later use.
4.3. Preparation of PRP Gel and Activation of PRP
Fresh PRP was evenly mixed with 2000U thrombin powder and 5ml 10% calcium gluconate solution at a ratio of 10:1. The mixture was shaken evenly and condensed into a gelatinous form after 3-5 minutes. After allowing it to stand for 2 hours at 37°C, PRP was fully activated. The activated PRP supernatant was placed in a centrifuge at 4°C for a gradient centrifuge at 1000rpm for 20 minutes. The underlying debris was discarded, and the supernatant was extracted and placed in a new sterile tube. In PRP activation, Platelet Rich Plasma Activation Supernatant (PRP-AS) is preserved in the refrigerator at -80°C for follow-up experiments.
4.4. Preparation of GO/Alg and GO/Alg/PRP Gel
The GO / Alg and PRP(or phosphate buffer saline) were mixed evenly with the ratio of 1:2 to obtain GO/Alg/PRP and GO/Alg homogeneous solutions. Calcium carbonate powder (Shanghai Aladdin Biochemical Technology Co., Ltd., China) and glucose-delta-lactone (GDL) powder (Shanghai Aladdin Biochemical Technology Co., Ltd., China) were weighed and added into the above two mixed solutions respectively to prepare a uniform solution with a mass concentration of 0.4% calcium carbonate and a molar ratio of GDL powder to calcium carbonate of 2.65.After shaking and mixing thoroughly, allow the mixture to stand until a gel forms to obtain GO/Alg/PRP gel and GO/Alg gel.
4.5. Gel Lyophilization and Electron Microscopy Observation
GO/Alg/PRP and GO/Alg gels were prepared according to method 4.4. They were then divided into sterile EP tubes and left at room temperature for 1 hour. Samples with good shape were taken and frozen in a refrigerator at -80℃ for 24 hours. The frozen samples were then removed and placed in a vacuum freeze dryer (-88°C, 0.011 kPa, Labconco Co., US) for 24 hours to obtain fluffy GO/Alg/PRP and GO/Alg freeze-dried samples. The middle part of the freeze-dried sample with good shape was sharply cut and treated with vacuum gold spraying. The microstructure of the sample after goldplating was observed by Scanning Electron Microscopy.
4.6. Cells
HFF - 1, HaCaT and HUVEC were Purchased from Wuhan Punosai Life Technology Co., LTD. (Wuhan, China), The cells were stored in DMEM medium containing 1% penicillin/streptomycin and 10% fetal bovine serum (Beijing Biogas Biotechnology Co., LTD., China) and cultured in a 5%CO2 environment at 37℃.
4.7. Cells Culture
H2O2 is a highly active compound that can induce cell damage. H2O2-induced oxidation models have been widely used to study cellular responses to oxidative stress [40]. HFF-1, HaCaT, and HUVEC cells were cultured to a concentration of 1×10⁵ cells/mL, and after 24 hours of stabilization, oxidative stress was induced by treating the cells with H2O2 at 37℃ and 5% CO2 for 12 hours. Subsequently, gels containing PBS, GO/Alg, PRP, and GO/Alg/PRP were added to the cells, creating the model group, GO/Alg group, PRP group, and GO/Alg/PRP group. In addition, cells without H2O2 intervention were set as the control group, and PBS was added. The above 5 groups of cells were stored in the incubator for 24 hours. Subsequently, the cells were collected using a mechanical method combined with a washing method, and the relevant experiments were carried out.
4.8. Transwell Assay
Transwell Cell (Beijing Lange Technology Co., LTD., China) was irradiated with ultraviolet light for 30 minutes under aseptic operation and operated in a 24-well plate. 5 groups of HFF-1 cells prepared in 4.7 were removed, and the cells were digested respectively and re-suspended with serum-free medium to obtain HFF-1 cell suspension with a concentration of 2 x 10^5 cells/ml. A 100µL cell suspension was added to the upper chamber of the Transwell chamber, and 600µL of serum medium was added to the lower chamber of the Transwell chamber. After incubating for 24 hours, the Transwell chamber was washed with PBS. Polyethylene terephthalate (PET) membrane was immersed in 70% methanol to fix the cells, and then the cells were stained with crystal violet solution. Finally, we used an inverted fluorescence microscope to obtain the final results, which were taken for quantitative analysis using the ImageJ software.
4.9. Tube Formation Assay
The day prior to the experiment, Matrigel was stored in an ice box and then transferred to a refrigerator set at 4℃. The adhesive was allowed to gradually thaw overnight. Before the experiment, Matrigel was kept in the ice box at all times. Matrigel is mixed with a pre-cooled gun head and worked on ice. The 96-well plate and the gun head were pre-cooled in advance, and 50 µL of matrix glue was added to each hole to avoid bubbles. The 5 groups of HUVEC cells prepared in 4.7 were placed in an incubator at 37°C for 45 minutes to 1 hour. When the HUVEC cells reached 70 to 80% confluence, they were digested and re-suspended in DMEM containing 10% FBS. The cells were then counted and 50µL of the re-suspension was added to each well at a concentration of 30,000 cells/well. This process was repeated for three wells. After incubation at 37℃, blood vessel formation was visible 4 hours later. After taking photos, we performed quantitative analysis using ImageJ software.
4.10. Live-Dead Cell Staining
The cell viability of HaCaT keratinocytes was studied by live/dead experiments. The five groups of cells prepared in Section 4.7 were stained with the live/dead detection kit (Invitrogen R37601) according to the manufacturer’s protocol. Images were taken with Olympus fluorescence microscope (FV300), and the results were further analyzed with Image-J software.
4.11. Flow Cytometry Analysis
The ROS content of HaCaT oxidative stress cells was analyzed by flow cytometry. DCFH-DA (Solarbio, Beijing) was diluted with serum-free medium at 1:1000 ratio. The final concentration is 10 mmol/L. The 5 groups of cells prepared by method 4.7 above were collected and suspended in diluted DCFH-DA at a cell concentration of 1 x 10^6 - 10^7 cells/mL, and incubated in a cell incubator at 37°C for 20 minutes. Invert and mix every 3-5 minutes so that the probe is in full contact with the cells. The cells were washed with serum-free cell culture medium 5 times for 10 minutes each time to fully remove the DCFH-DA that did not enter the cells. Intracellular ROS levels were measured by flow cytometry [41].
4.12. Mice
Fifty healthy male BALB/c mice aged 8 weeks, weighing 25~30g, were purchased from Jinan Pengyue Experimental Animal Breeding Co., LTD.(Jinan, China), and placed under standard laboratory conditions(Temperature :25℃±2℃, relative humidity :55%, light period 12h/ dark period 12h). The mice ate and drank freely and acclimated for 1 week before the experiment. The mouse stress injury model was established by pressurizing tissue damage with magnets. The experiments were divided into control group, model group, GO/Alg group, PRP group and GO/Alg/PRP group(n=10). Animal experiments are approved by the Experimental Animal Ethics Committee of Qilu Medical College of Shandong University, and all experiments involving the use of animals are conducted in accordance with China’s Animal Management Regulations. At the end of the experiment, the mice were euthanized by 30% ventricular gas /min CO2 asphyxia.
4.13. PI Mouse model
The PI model with 40 experimental mice was established using the method reported by Stadler et al. [42]. Mice were anesthetized using isoflurane by Rodent Anesthesia Machine Gas Anesthesia (ABS Full Anesthesia Machine, Louisville, KY, USA), and drug concentrations in the anesthesia were approximately 2.5%. The back hair of the mice was scraped with an electric razor and the area was cleansed with 70% alcohol. The position of the magnetic plate was marked at the same spot on each mouse. The skin was gently pulled up and placed between two circular ceramic magnetic plates (12.0mm in diameter and 5.0mm in thickness) with an average weight of 2.4g and a magnetic force of 1000g (Magnetic Source, Castle Rock, CO, USA), The magnet was applied for three I/R cycles, with one cycle consisting of 12 h of compression, followed by 12 h of release. Animals were not immobilized, anesthetized, or treated during the I/R cycles. Forty mice underwent the same procedure and posttreatment process (Figure 3-2a). After the surgery, the mice returned to normal activities and diet and were able to bear the weight of the fixed magnet throughout the experiment. After successful modeling, they were randomly divided into three groups: sterile saline group (model group; n = 10), GO/Alg treatment group (wounds were applied with GO/Alg gel without other active ingredients; n = 10), PRP treatment group (wounds were applied with homologous rat PRP; n = 10), GO/Alg/PRP treatment group (wounds were applied with GO/Alg/PRP gel; n = 10). In addition, 10 mice in the nonI/R group underwent the above anesthesia, removed the hair, and used a 12mm skin biopsy punch (Acuderm, Fort Lauderdale, FL, USA) to create a full-thickness wound with a diameter of 12mm at the same position as the model established on the back of other mice, named control group.
4.14. Wound Closure Analysis
The wounds were photographed on days 0, 4, 7, 10, and 14 using a digital single-lens reflex camera (D750, Nikon, Japan). A ruler next to the wounds was used to show wound size, and ImageJ software was used to estimate the wound area. These measurements were then used to calculate the percentage of wound closure as follows: (area of original wound - area of actual wound) divided by the area of original wound, multiplied by 100%.
4.15. Histopathology and Immunohistochemistry
On the 14th day of the experiment, the mice were euthanized, and the wound tissues were respectively stained with HE, Masson, vWF, α-sma, CD31 and VEGF-A immunohistochemistry. Tissue specimens were immediately fixed with 4% paraformaldehyde (Shanghai McLean Biochemical Co., LTD., China) for 48 hours after removal. And then, dehydration, embedding, and sectioning (performed by Hua Yong from China using Leica RM2265) were conducted for follow-up inspection [43]. Three pathologists utilized Image J to quantitatively analyze the levels of collagen and blood vessels.
4.16. ELISA
Cells: The 5 groups of cells prepared in 4.7 above were added to the cell culture medium for culture. The cell supernatant was collected when the cells grew to the required state. Tissue: Mouse skin tissue was extracted. 1.5mL buffer was added per gram of tissue, and then ground into homogenate. The homogenate was transferred to a 1.5mL centrifuge tube and spun at 1300rpm at 4°C for 10 minutes to obtain the supernatant. The obtained supernatant was then analyzed using the ELISA kit instructions to determine the levels of MDA and SOD in tissues and cells. This analysis helped assess the extent of oxidative stress and antioxidant capacity in the cells.
4.17. Western Blot Analysis
Cells: Preparation of each group of HaCaT cells: 100 µg of protein was extracted from the abovementioned 4.7 oxidative stress in the cell extract. The same amount of protein was processed using 10% sodium dodecyl sulfate gel electrophoresis and then transferred to a nitrocellulose membrane (Millipore, Billerica, MA, USA). Tissue: Cells and tissues were pyrolyzed using radioimmunity precipitation (RIPA) buffer (Solarbio, Beijing, China). The same amount of protein was processed using 10% sodium dodecyl sulfate gel electrophoresis and then transferred to a nitrocellulose membrane (Millipore, Billerica, MA, USA). After blocking the above substances with 5% skim milk in PBS for 1hour, specific primary antibodies were used for detection. These included TGFβ (11000), p-p38MAPK (11000), p38MAPK (11000), p-NF-κB-p65 (11000), NF-κB-p65 (11000), p-IκBα (11000), IκBα (1:1000), and GAPDH (11000), all sourced from Santa Cruz Biotechnology in Santa Cruz, CA. The incubation took place at 4°C for 18 hours, followed by a 1hour incubation with horseradish peroxidase coupling. Subsequently, the membrane was rinsed with tris buffered saline water and the peroxide-labeled Protein bands labeled with peroxidase were detected by enhanced chemiluminescence reagent (Millipore, Billerica, MA, USA), and band imaging was carried out by using Sense-Q2000 (Lugencico., Ltd., Bucheon, Korea), and the results were further analyzed by using ImageJ software.
4.18. Statistical Analysis
GraphPad Prism 8.0 was used to statistically analyze the experimental data. All quantitative results are expressed as mean ± SD, and unpaired two-tailed Student t-test was used for statistical analysis. Differences between groups were analyzed by one-way ANOVA followed by Tukey’s posttest.
Author Contributions
Conceptualization, S.Y. and Q.S.W.; methodology, S.Y. and J.N.C.; writing— original draft preparation, S.Y. and Q.S.W.; formal analysis, S.Y. and T.H.W.; resources, J.N.C and D.D.C.; data curation, S.Y. and D.D.C.; project administration, T.H.W.; Supervision, C.J.Y.; software, P.Q.X. and Y.S.F. All authors have read and agreed to the published version of the manuscript.
Funding
The author(s) declare financial support was received for the research, authorship, and/or publication of this article. This work was supported by grants from Shandong Province Medical and Health Development Plan Project (202104030779).
Institutional Review Board Statement
The animal research program was approved by the Medical Ethics Committee of Weihai Municipal Hospital (ethical acceptance number 2021075).
Informed Consent Statement
Not applicable.
Data Availability Statement
The raw data supporting the conclusions of this article will be made available by the authors, without undue reservation.
Acknowledgments
We highly appreciate the warmhearted discussions from Prof Zhou-Weiwei for their critical reading and suggestions on the manuscript.
Conflicts of Interest
The authors declare that the research was conducted in the absence of any commercial or financial relationships that could be construed as a potential conflict of interest.
References
- Hajhosseini, B.; Longaker, M.T.; Gurtner, G.C. Pressure Injury. Ann Surg. 2020, 271, 671–679. [Google Scholar] [CrossRef] [PubMed]
- Gillespie, B.M.; Walker, R.M.; Latimer, S.L.; et al. Repositioning for pressure injury prevention in adults: An abridged Cochrane systematic review and meta-analysis. Int J Nurs Stud. 2021, 120, 103976. [Google Scholar] [CrossRef] [PubMed]
- Fleming, A.M.; Burrows, C.J. On the irrelevancy of hydroxyl radical to DNA damage from oxidative stress and implications for epigenetics. Chem Soc Rev. 2020, 49, 6524–6528. [Google Scholar] [CrossRef] [PubMed]
- Jomova, K.; Raptova, R.; Alomar, S.Y.; et al. Reactive oxygen species, toxicity, oxidative stress, and antioxidants: chronic diseases and aging. Arch Toxicol. 2023, 97, 2499–2574. [Google Scholar]
- Yamazaki, S.; Sekiguchi, A.; Uchiyama, A.; et al. Apelin/APJ signaling suppresses the pressure ulcer formation in cutaneous ischemia-reperfusion injury mouse model. Sci Rep. 2020, 10, 1349. [Google Scholar] [CrossRef]
- Wang, Z.; Bao, X.; Song, L.; et al. Role of miR-106-mediated mitogen-activated protein kinase signaling pathway in oxidative stress injury and inflammatory infiltration in the liver of the mouse with gestational hypertension. J Cell Biochem. 2021, 122, 958–968. [Google Scholar] [CrossRef]
- Shi, T.; van Soest, D.M.K.; Polderman, P.E.; et al. DNA damage and oxidant stress activate p53 through differential upstream signaling pathways. Free Radic Biol Med. 2021, 172, 298–311. [Google Scholar] [CrossRef]
- Liu, Q.; Zhang, N.; Li, Z.; et al. Efficacy of autologous platelet-rich plasma gel in the treatment of refractory pressure injuries and its effect on wound healing time and patient quality of life. Clinics (Sao Paulo). 2021, 76, e2355. [Google Scholar] [CrossRef]
- Chen, N.; Wang, H.; Shao, Y.; et al. A Comparative Study on Platelet-Rich Plasma from Elderly Individuals and Young Adults to Treat Pressure Ulcers in Mice. J Surg Res. 2024, 294, 198–210. [Google Scholar] [CrossRef]
- Lakkakula, J.R.; Gujarathi, P.; Pansare, P.; et al. A comprehensive review on alginate-based delivery systems for the delivery of chemotherapeutic agent: Doxorubicin. Carbohydr Polym. 2021, 259, 117696. [Google Scholar] [CrossRef]
- Growney, E.A.; Linder, H.R.; Garg, K.; et al. Bio-conjugation of platelet-rich plasma and alginate through carbodiimide chemistry for injectable hydrogel therapies. J Biomed Mater Res B Appl Biomater. 2020, 108, 1972–1984. [Google Scholar] [CrossRef] [PubMed]
- Garcia-Orue, I.; et al. Bioactive and degradable hydrogel based on human platelet-rich plasma fibrin matrix combined with oxidized alginate in a diabetic mice wound healing model. Mater Sci Eng C Mater Biol Appl, 2022. 135: p. 112695.
- Bao, D.; et al. Combination of graphene oxide and platelet-rich plasma improves tendon-bone healing in a rabbit model of supraspinatus tendon reconstruction. Regen Biomater, 2021. 8(6): p. rbab045.
- Chen, N.; Li, M.; Yang, J.; et al. Slow-sculpting graphene oxide/alginate gel loaded with platelet-rich plasma to promote wound healing in rats. Front Bioeng Biotechnol. 2024, 12, 1334087. [Google Scholar] [CrossRef] [PubMed]
- Nichols, F.; Chen, S. Graphene Oxide Quantum Dot-Based Functional Nanomaterials for Effective Antimicrobial Applications. Chem Rec. 2020, 20, 1505–1515. [Google Scholar] [CrossRef]
- Sanchez-Ballester, N.M.; Bataille, B.; Soulairol, I. Sodium alginate and alginic acid as pharmaceutical excipients for tablet formulation: Structure-function relationship. Carbohydr Polym. 2021, 270, 118399. [Google Scholar] [CrossRef] [PubMed]
- Chen, X.; Zou, M.; Liu, S.; et al. Applications of Graphene Family Nanomaterials in Regenerative Medicine: Recent Advances, Challenges, and Future Perspectives. Int J Nanomedicine. 2024, 19, 5459–5478. [Google Scholar] [CrossRef]
- Tomić, S.L.; Babić Radić, M.M.; Vuković, J.S.; et al. Alginate-Based Hydrogels and Scaffolds for Biomedical Applications. Mar Drugs. 2023, 21, 177. [Google Scholar] [CrossRef]
- D’Amora, U.; Dacrory, S.; Hasanin, M.S.; et al. Advances in the Physico-Chemical, Antimicrobial and Angiogenic Properties of Graphene-Oxide/Cellulose Nanocomposites for Wound Healing. Pharmaceutics. 2023, 15, 338. [Google Scholar] [CrossRef]
- Bloom, S.I.; Islam, M.T.; Lesniewski, L.A.; et al. Mechanisms and consequences of endothelial cell senescence. Nat Rev Cardiol. 2023, 20, 38–51. [Google Scholar] [CrossRef]
- Zhou, D.; Liang, Q.; Ge, X.; et al. Allogeneic platelet-rich plasma inhibits ferroptosis in promoting wound repair of type 2 diabetic ulcers. Free Radic Biol Med. 2024, 215, 37–47. [Google Scholar] [CrossRef]
- Angelova, P.R.; Esteras, N.; Abramov, A.Y. Mitochondria and lipid peroxidation in the mechanism of neurodegeneration: Finding ways for prevention. Med Res Rev. 2021, 41, 770–784. [Google Scholar] [CrossRef]
- Budi, E.H.; Schaub, J.R.; Decaris, M.; et al. TGF-β as a driver of fibrosis: physiological roles and therapeutic opportunities. J Pathol. 2021, 254, 358–373. [Google Scholar] [CrossRef] [PubMed]
- Aravani, D.; Foote, K.; Figg, N.; et al. Cytokine regulation of apoptosis-induced apoptosis and apoptosisinduced cell proliferation in vascular smooth muscle cells. Apoptosis. 2020, 25, 648–662. [Google Scholar] [CrossRef]
- Barnabei, L.; Laplantine, E.; Mbongo, W.; et al. NF-κB: At the Borders of Autoimmunity and Inflammation. Front Immunol. 2021, 12, 716469. [Google Scholar] [CrossRef] [PubMed]
- Yu, H.; Lin, L.; Zhang, Z.; et al. Targeting NF-κB pathway for the therapy of diseases: mechanism and clinical study. Signal Transduct Target Ther. 2020, 5, 209. [Google Scholar] [CrossRef] [PubMed]
- Yuan, N.; Shao, K.; Huang, S.; et al. Chitosan, alginate, hyaluronic acid and other novel multifunctional hydrogel dressings for wound healing: A review. Int J Biol Macromol. 2023, 240, 124321. [Google Scholar] [CrossRef]
- Carrasco, S.; González, L.; Tapia, M.; et al. Enhancing Alginate Hydrogels as Possible Wound-Healing Patches: The Synergistic Impact of Reduced Graphene Oxide and Tannins on Mechanical and Adhesive Properties. Polymers (Basel). 2024, 16, 1081. [Google Scholar] [CrossRef]
- Qiu, M.; He, Y.; Zhang, H.; et al. Platelet-Rich Plasma (PRP) Based on Simple and Efficient Integrated Preparation Precises Quantitatively for Skin Wound Repair. Int J Mol Sci. 2024, 25, 9340. [Google Scholar] [CrossRef]
- Karami, F.; Saber-Samandari, S. Synthesis and characterization of a novel hydrogel based on carboxymethyl chitosan/sodium alginate with the ability to release simvastatin for chronic wound healing. Biomed Mater. 2023, 18, 10.1088–1748. [Google Scholar] [CrossRef]
- Cecerska-Heryć, E.; Goszka, M.; Serwin, N.; et al. Applications of the regenerative capacity of platelets in modern medicine. Cytokine Growth Factor Rev. 2022, 64, 84–94. [Google Scholar] [CrossRef]
- Trujillo, S.; Seow, M.; Lueckgen, A.; et al. Dynamic Mechanical Control of Alginate-Fibronectin Hydrogels with Dual Crosslinking: Covalent and Ionic. Polymers (Basel). 2021, 13, 433. [Google Scholar] [CrossRef]
- Beitia, M.; Delgado, D.; Mercader, J.; et al. Action of Platelet-Rich Plasma on In Vitro Cellular Bioactivity: More than Platelets. Int J Mol Sci. 2023, 24, 5367. [Google Scholar] [CrossRef] [PubMed]
- Liu, W.; Liu, Y.; Li, T.; et al. Long-term stability of frozen platelet-rich plasma under -80 °C storage condition. Regen Ther. 2024, 26, 826–830. [Google Scholar] [CrossRef] [PubMed]
- Akhter, N.; Wilson, A.; Arefanian, H.; et al. Endoplasmic Reticulum Stress Promotes the Expression of TNF-α in THP-1 Cells by Mechanisms Involving ROS/CHOP/HIF-1α and MAPK/NF-κB Pathways. Int J Mol Sci. 2023, 24, 15186. [Google Scholar] [CrossRef]
- Sekiguchi, A.; Motegi, S.I.; Uchiyama, A.; et al. Botulinum toxin B suppresses the pressure ulcer formation in cutaneous ischemia-reperfusion injury mouse model: Possible regulation of oxidative and endoplasmic reticulum stress. J Dermatol Sci. 2018, 90, 144–153. [Google Scholar] [CrossRef]
- Gao, Y.; Liu, Y.; Zheng, D.; et al. HDAC5-mediated Smad7 silencing through MEF2A is critical for fibroblast activation and hypertrophic scar formation. Int J Biol Sci. 2022, 18, 5724–5739. [Google Scholar] [CrossRef]
- Zhang, T.; Wang, X.F.; Wang, Z.C.; et al. Current potential therapeutic strategies targeting the TGF-β/Smad signaling pathway to attenuate keloid and hypertrophic scar formation. Biomed Pharmacother. 2020, 129, 110287. [Google Scholar] [CrossRef]
- Gao, P.; Gao, P.; Zhao, J.; et al. MKL1 cooperates with p38MAPK to promote vascular senescence, inflammation, and abdominal aortic aneurysm. Redox Biol. 2021, 41, 101903. [Google Scholar] [CrossRef]
- Ge, R.; Gao, G. Anti-antioxidant impacts of circZNF609 silence in HaCaT cells through regulating miR-145. Artif Cells Nanomed Biotechnol. 2020, 48, 384–392. [Google Scholar] [CrossRef]
- Robinson, J.P.; Ostafe, R.; Iyengar, S.N.; Rajwa, B.; Fischer, R. Flow Cytometry: The Next Revolution. Cells. 2023, 12, 1875. [Google Scholar] [CrossRef]
- Strong, A.L.; Bowles, A.C.; MacCrimmon, C.P.; et al. Adipose stromal cells repair pressure ulcers in both young and elderly mice: potential role of adipogenesis in skin repair. Stem Cells Transl Med. 2015, 4, 632–642. [Google Scholar] [CrossRef]
- Tan, W.C.C.; Nerurkar, S.N.; Cai, H.Y.; et al. Overview of multiplex immunohistochemistry/immunofluorescence techniques in the era of cancer immunotherapy. Cancer Commun (Lond). 2020, 40, 135–153. [Google Scholar] [CrossRef]
Figure 1.
Preparation diagram of GO/Alg/PRP (A). General appearance and Scanning Electron Microscopy images of GO/Alg(B) and GO/Alg/PRP(C) and their porous structures at specified magnification scales.
Figure 1.
Preparation diagram of GO/Alg/PRP (A). General appearance and Scanning Electron Microscopy images of GO/Alg(B) and GO/Alg/PRP(C) and their porous structures at specified magnification scales.
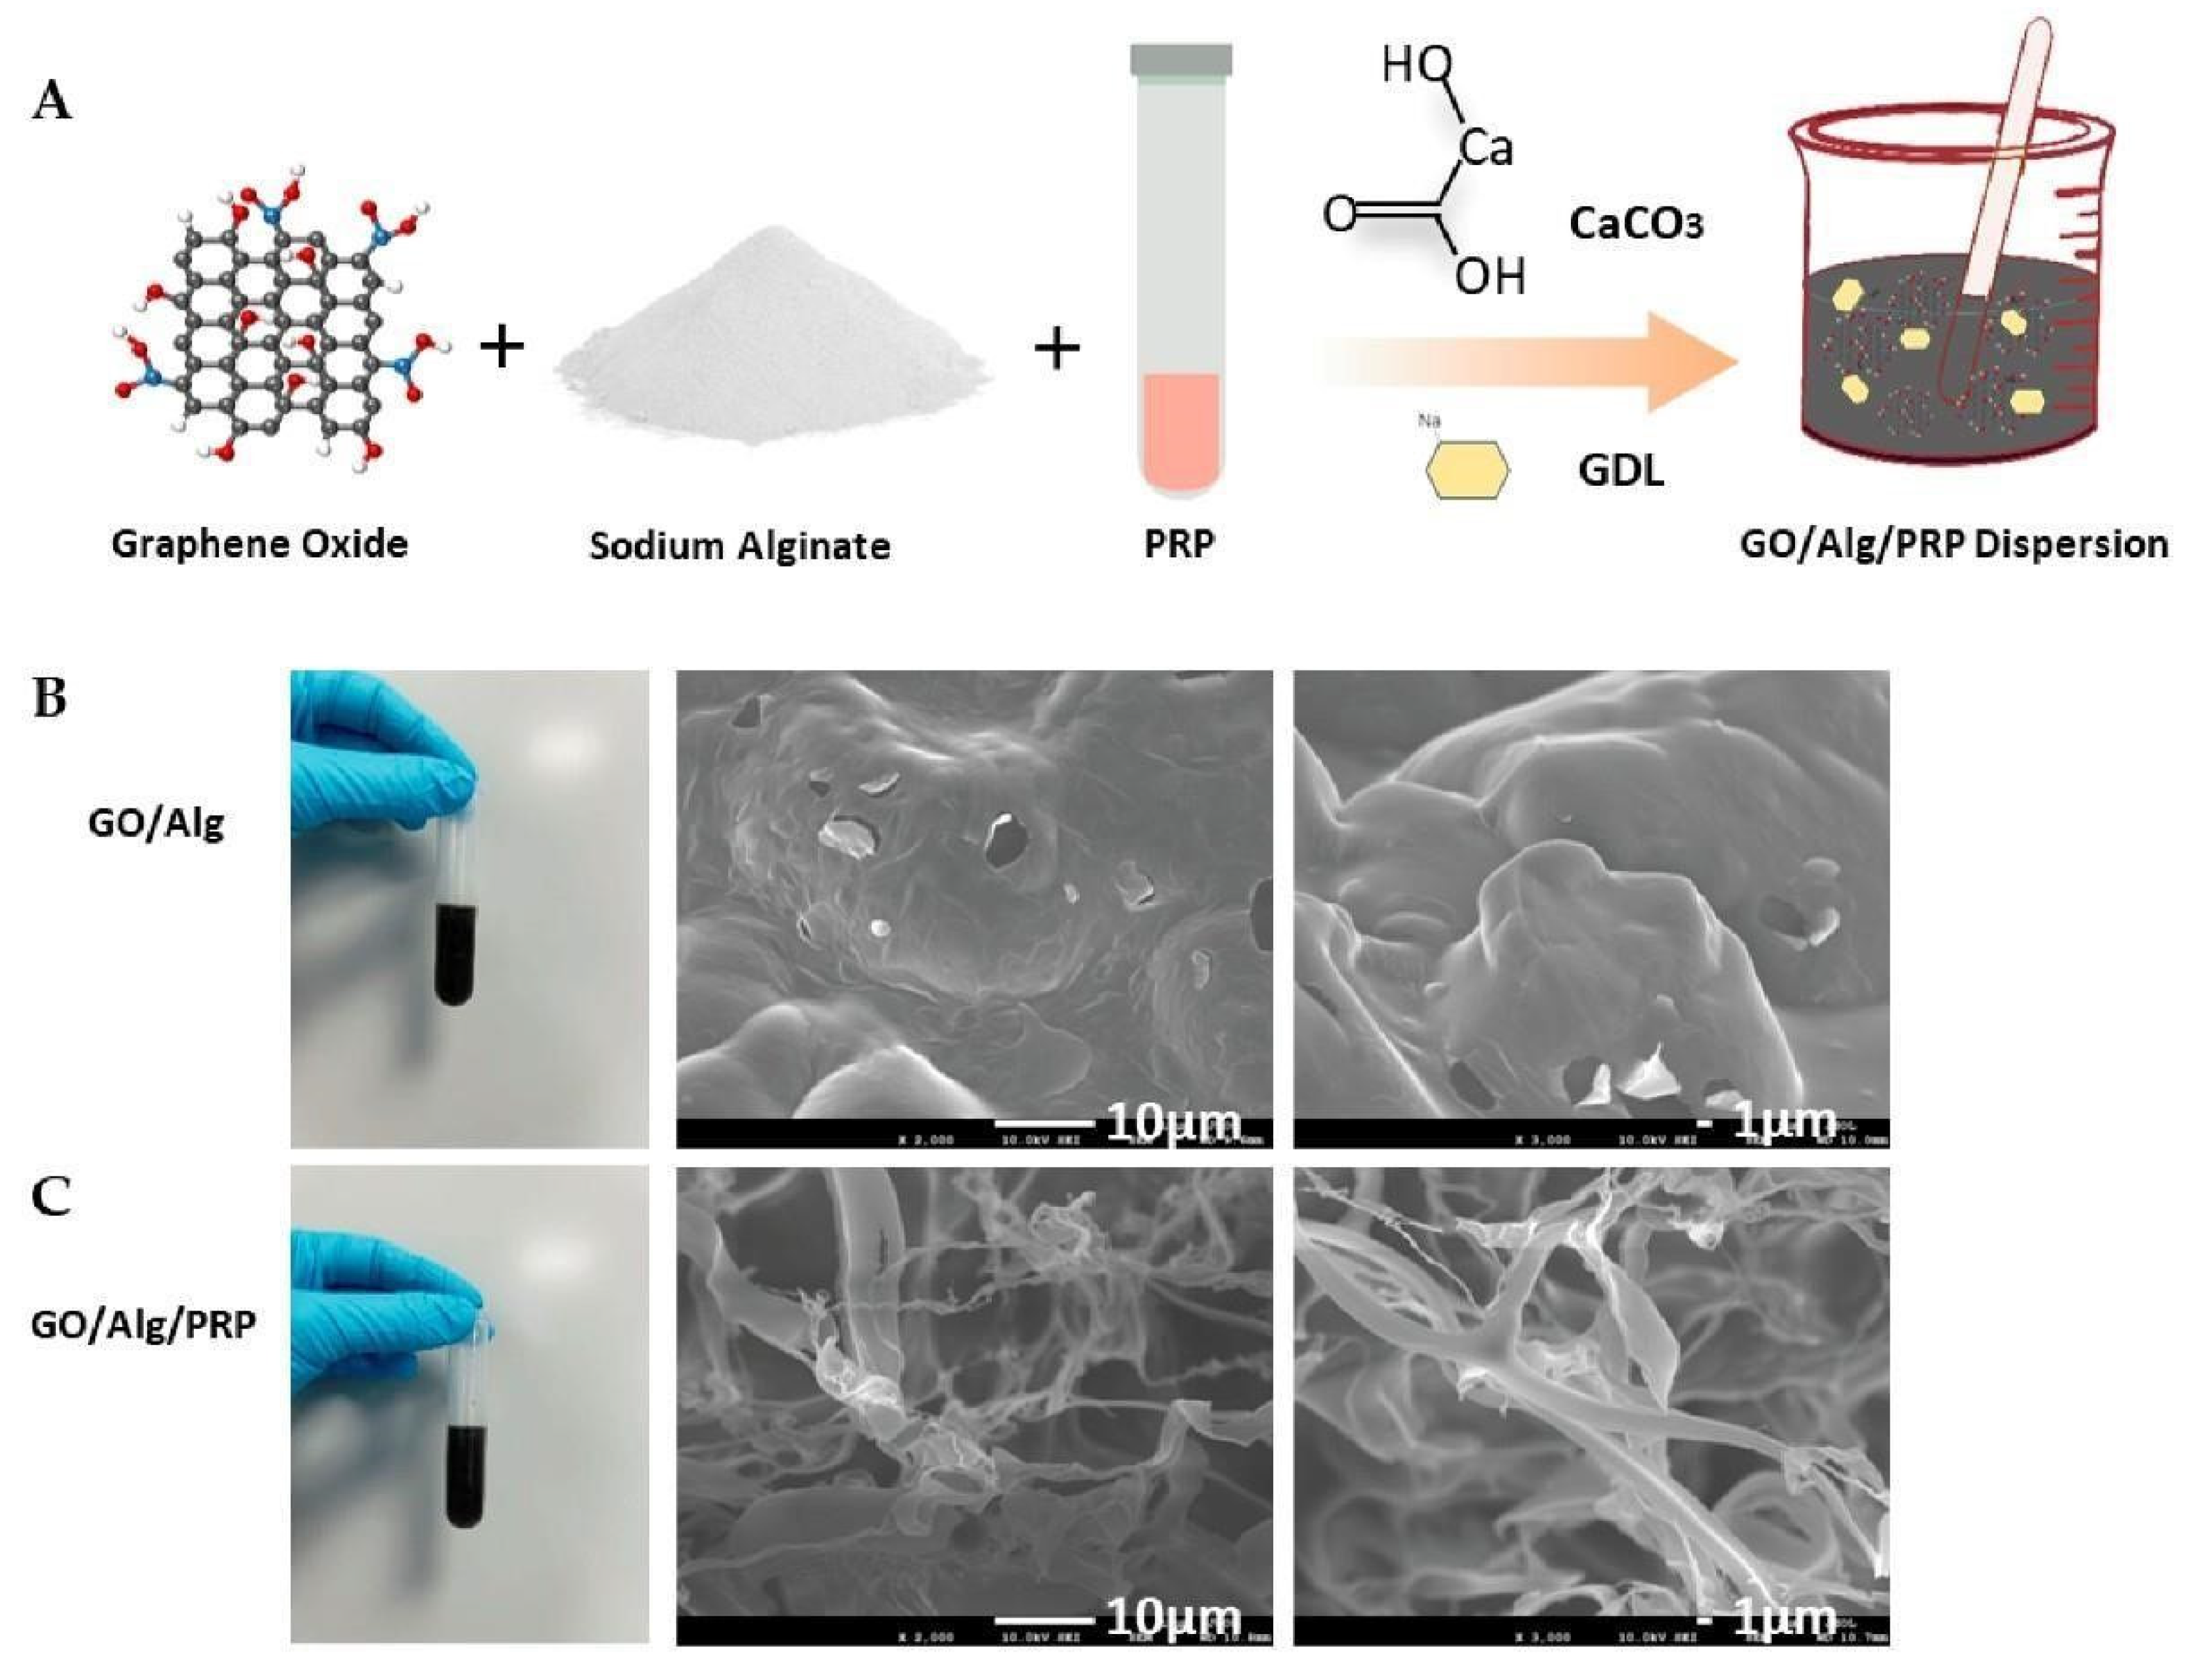
Figure 2.
Fluorescent photos of different groups of living and dead cells were stained. The green channel represents the living cells, while the red channel represents the dead cells, and the scale in the lower right corner indicates that the scale is 50µm (A). Quantitative comparison of the percentage of living/dead cells can be observed in the image (B). All data are statistically significant(* p < 0.05,** p < 0.01,*** p < 0.001).
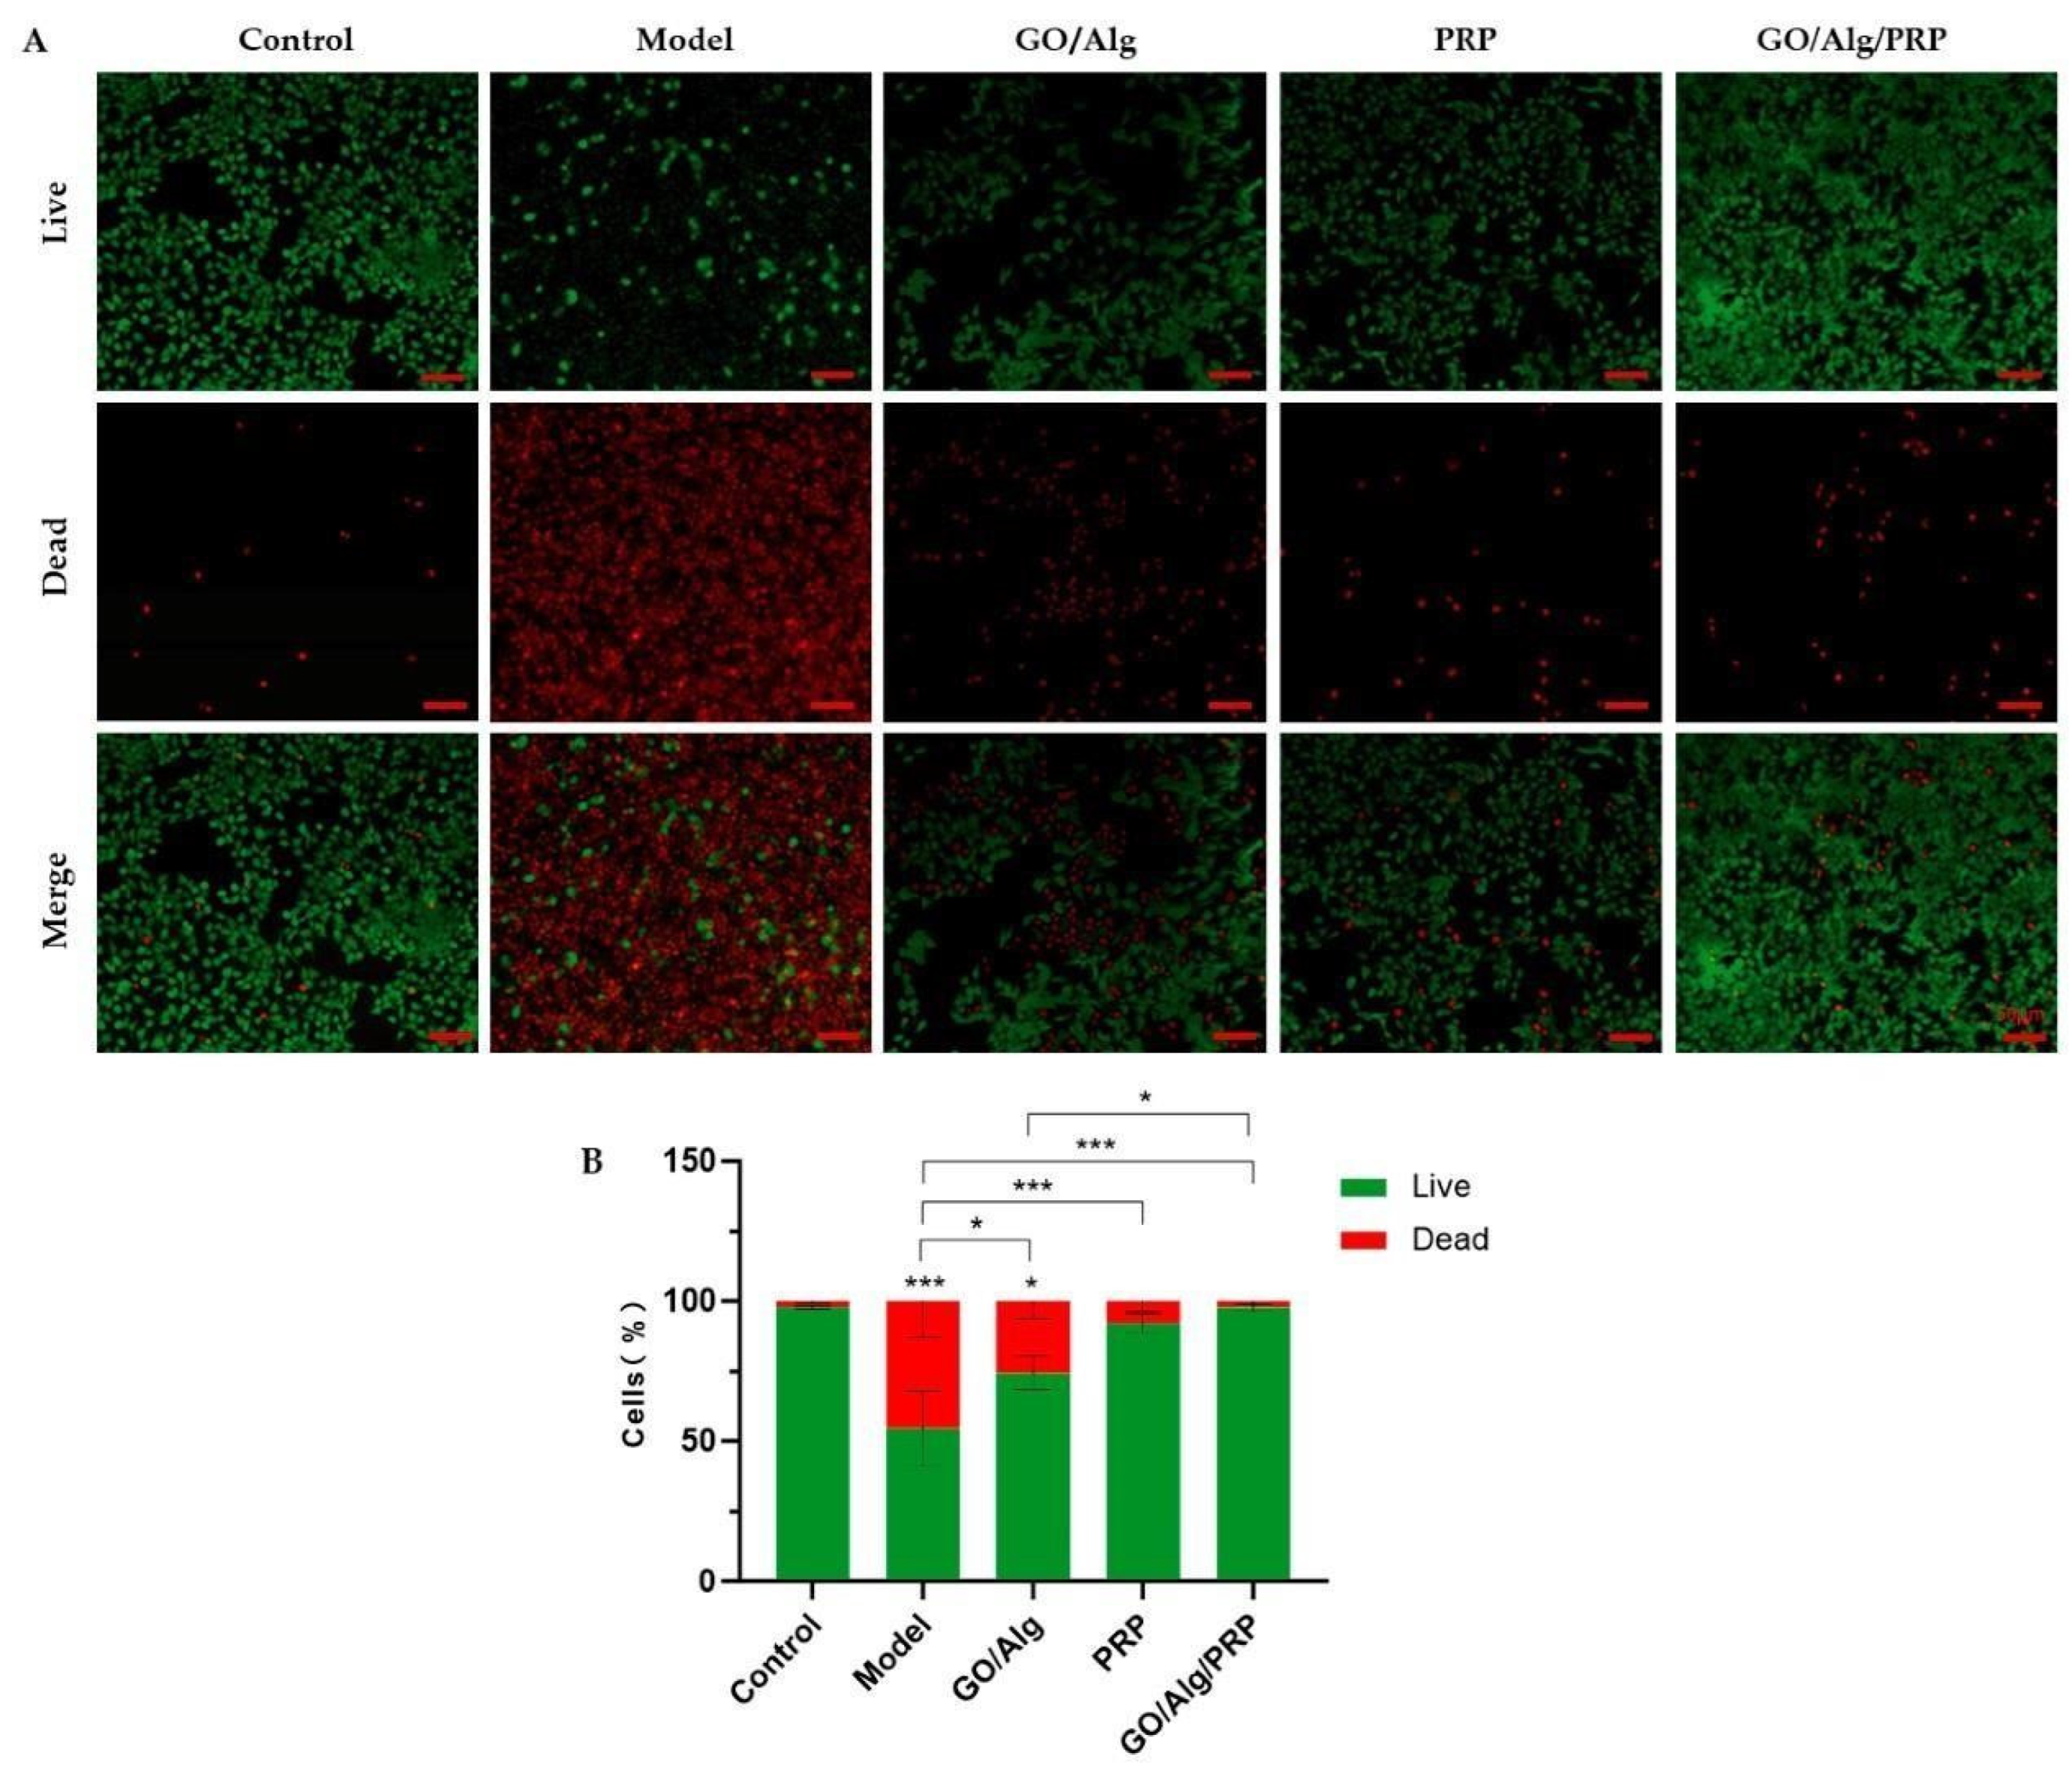
Figure 3.
Transwell assay of HFF-1 cells in different groups, and the scale in the lower right corner indicates that the scale is 50µm (A). Additionally, quantitative analysis of HFF-1 cells was performed(B). All data are statistically significant(* p < 0.05, ** p < 0.01, *** p < 0.001).
Figure 3.
Transwell assay of HFF-1 cells in different groups, and the scale in the lower right corner indicates that the scale is 50µm (A). Additionally, quantitative analysis of HFF-1 cells was performed(B). All data are statistically significant(* p < 0.05, ** p < 0.01, *** p < 0.001).
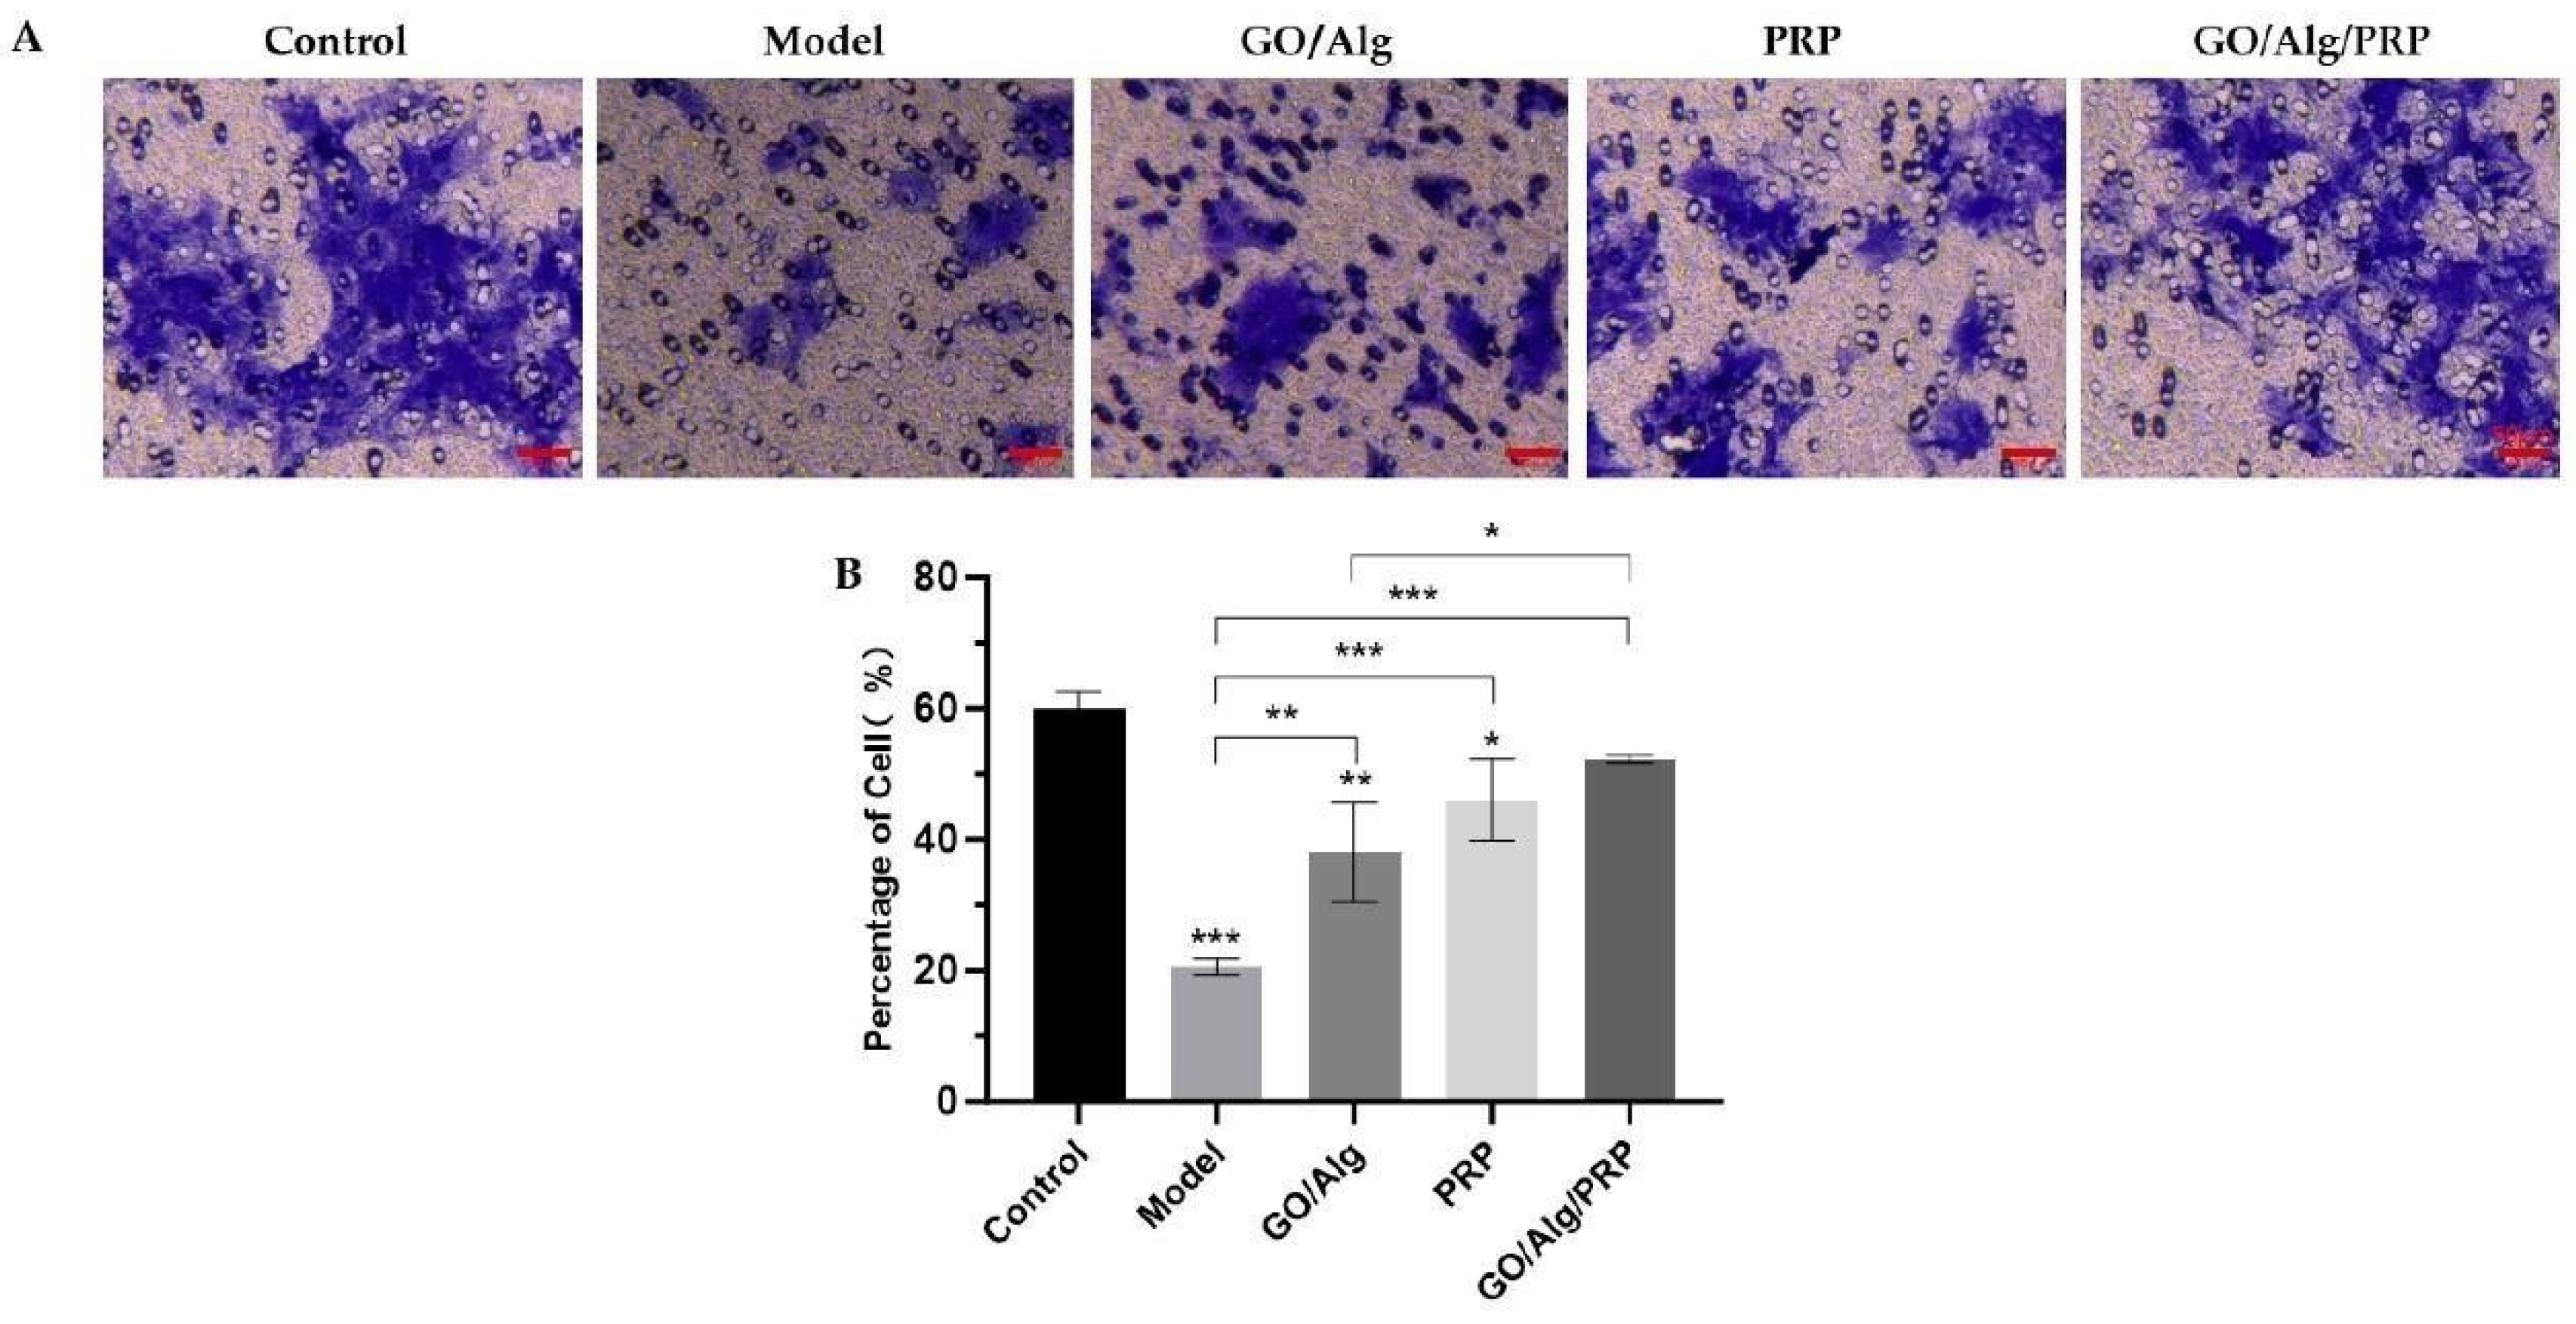
Figure 4.
Effect of materials in each group on the angiogenesis of HUVEC cells induced by oxidation. Photos of the angiogenesis of HUVEC cells induced by oxidative stress in each group are presented, and the scale in the lower right corner indicates that the scale is 50µm (A). The number of vascular branches induced by oxidative stress in HUVEC cells in each group(B). Total vascular length after intervention of HUVEC cells induced by oxidative stress in each group(C). All data are statistically significant (* p < 0.05, ** p < 0.01, *** p < 0.001).
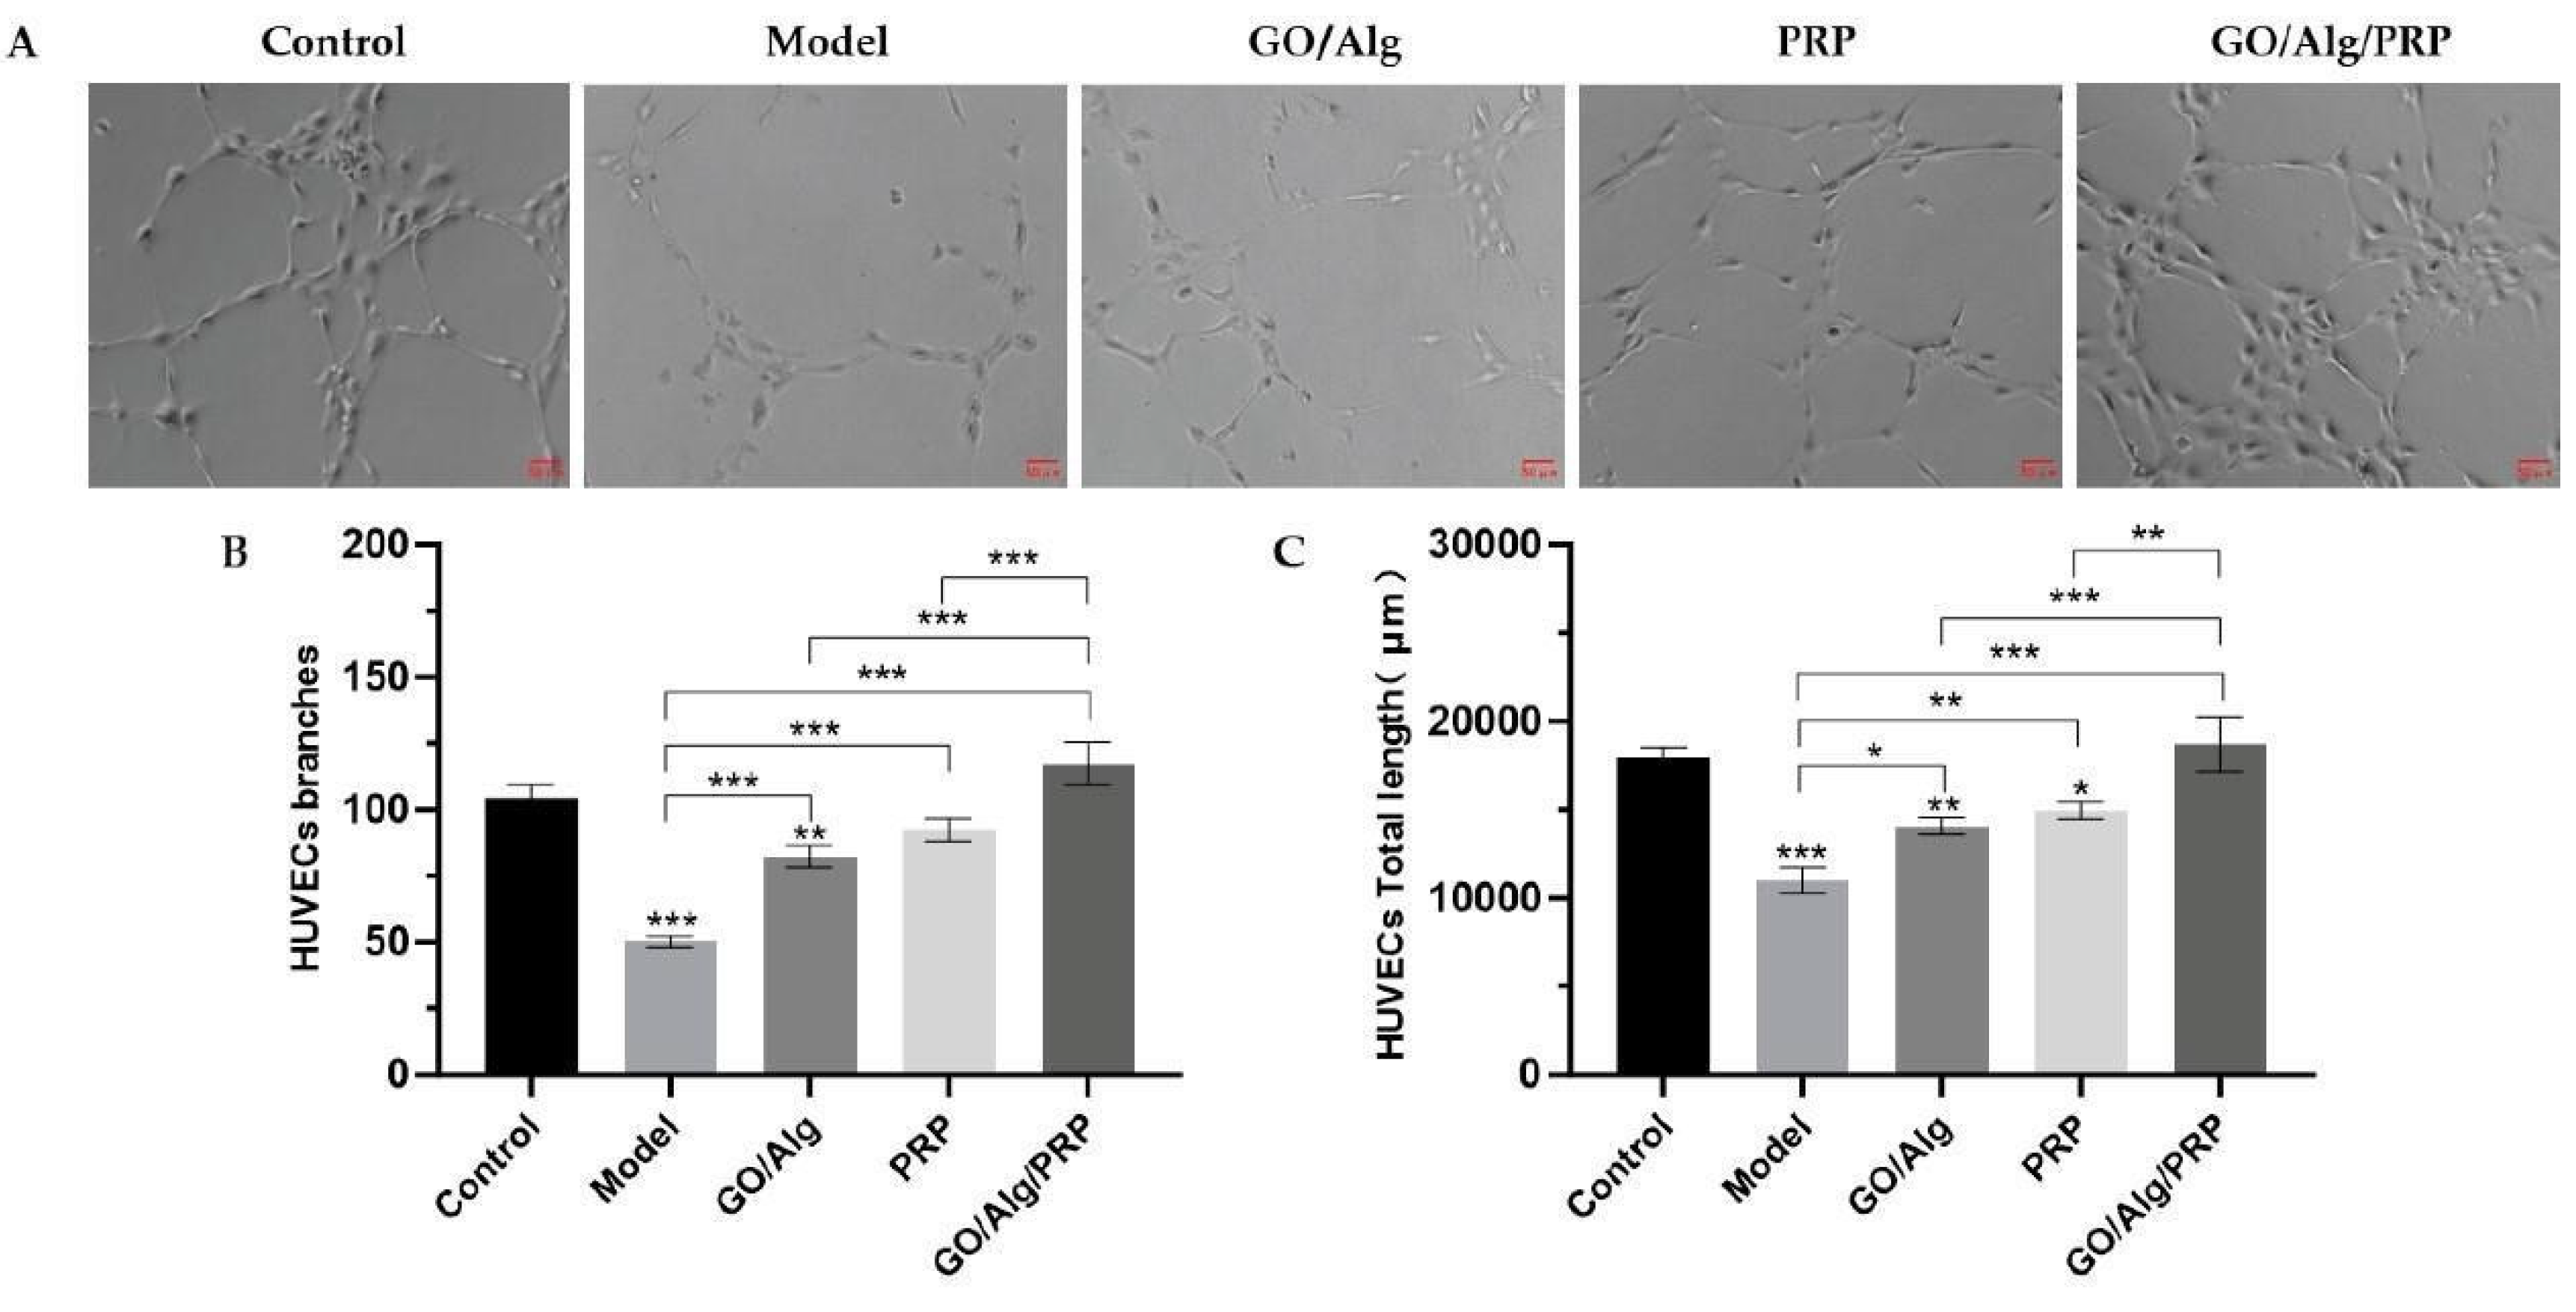
Figure 5.
The degree of lipid peroxidation damage to HaCaT cells induced by oxidation in each group. The content of intracellular ROS production in HaCaT cells induced by oxidative stress was interfered by materials in each group (A). The content of MDA in HaCaT cells induced by oxidative stress in each group (B). The content of SOD in HaCaT cells induced by oxidative stress in each group(C). All data are statistically significant (* p < 0.05, ** p < 0.01, *** p < 0.001).
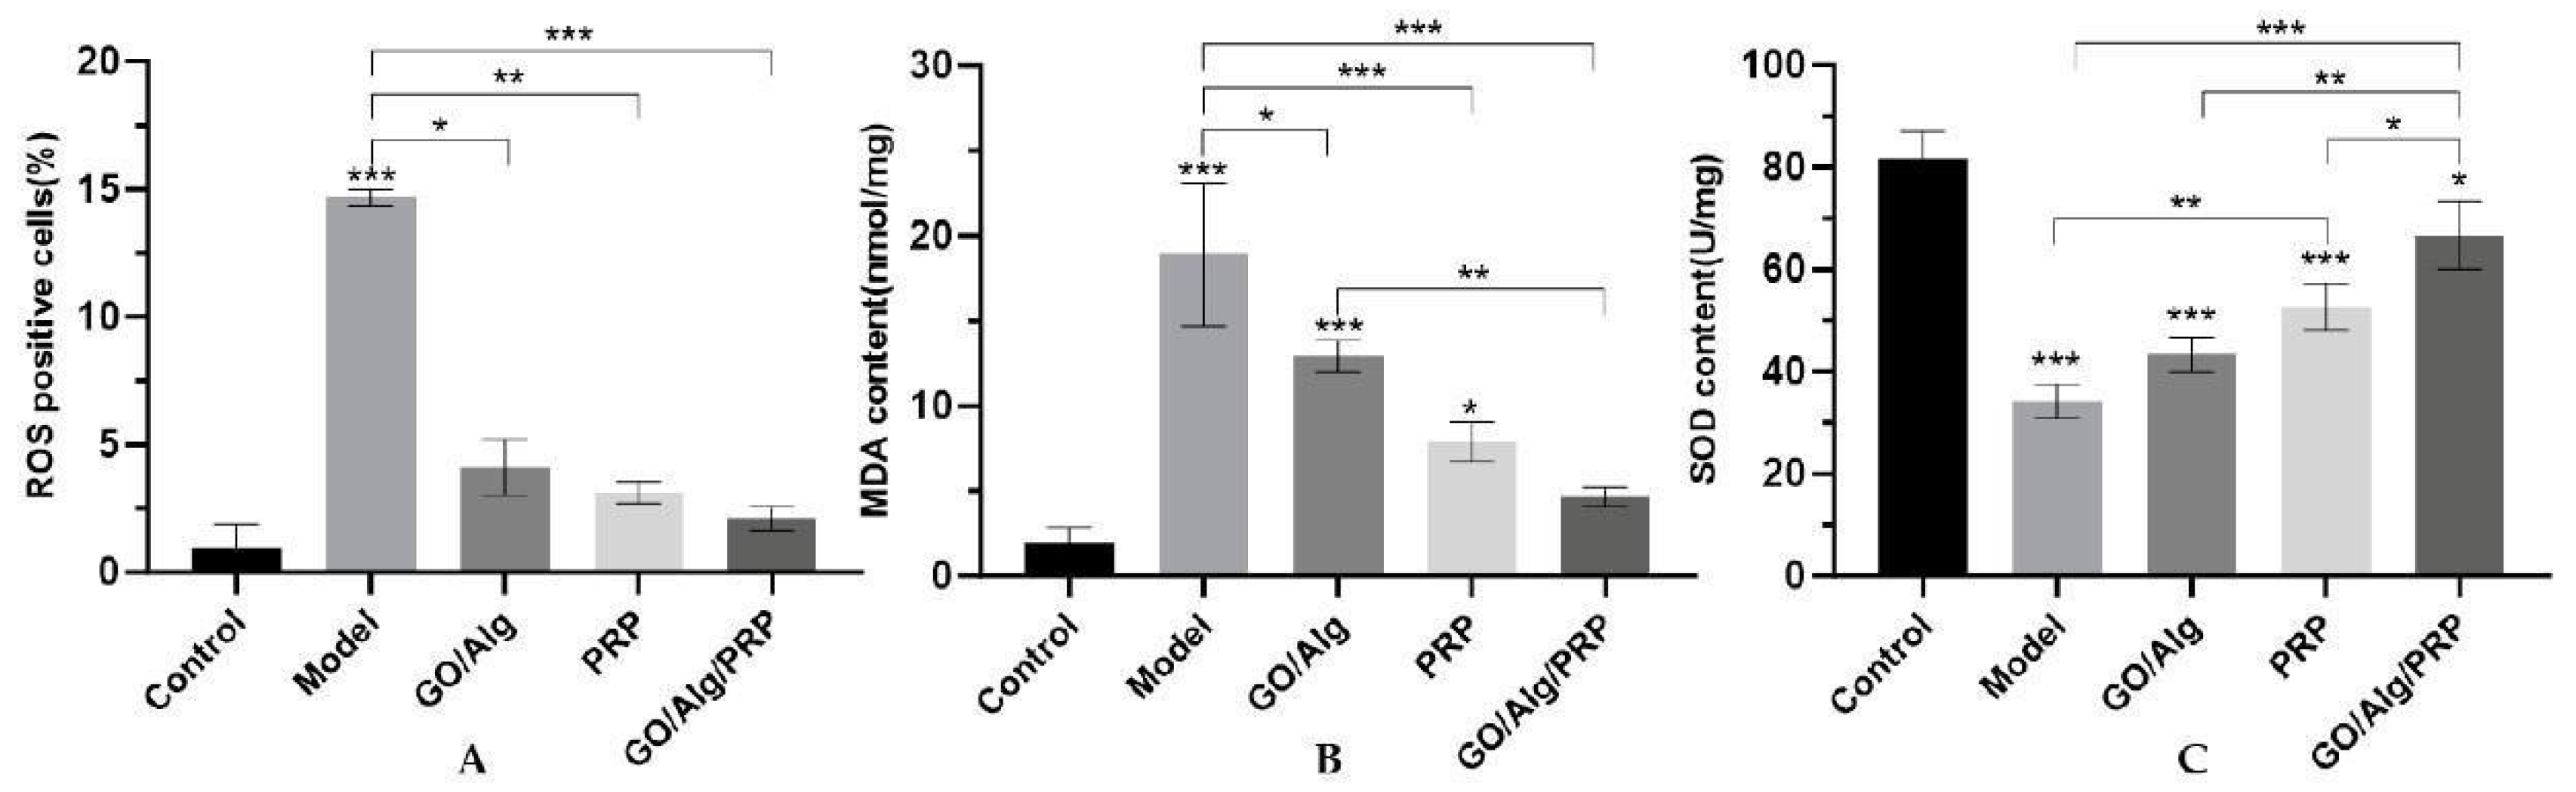
Figure 6.
Western blotting detected the expression of TGF-β, p-p38MAPK, p38MAPK, p-NF-κB-p65, NF-κB-p65, IκBα, and p-IκBα proteins in cells(A). Additionally, the relative ratio of TGF-β after intervention in each group is presented (B). The relative ratio of p-p38MAPK/p38MAPK after material intervention was measured in each group (C), and the relative ratio of p-NF-κB-p65/NF-κB-p65 was determined for each material after intervention (D). The relative ratio of p-IκBα/IκBα for each group after the intervention (E). All data are statistically significant (* p < 0.05, ** p < 0.01, *** p < 0.001).
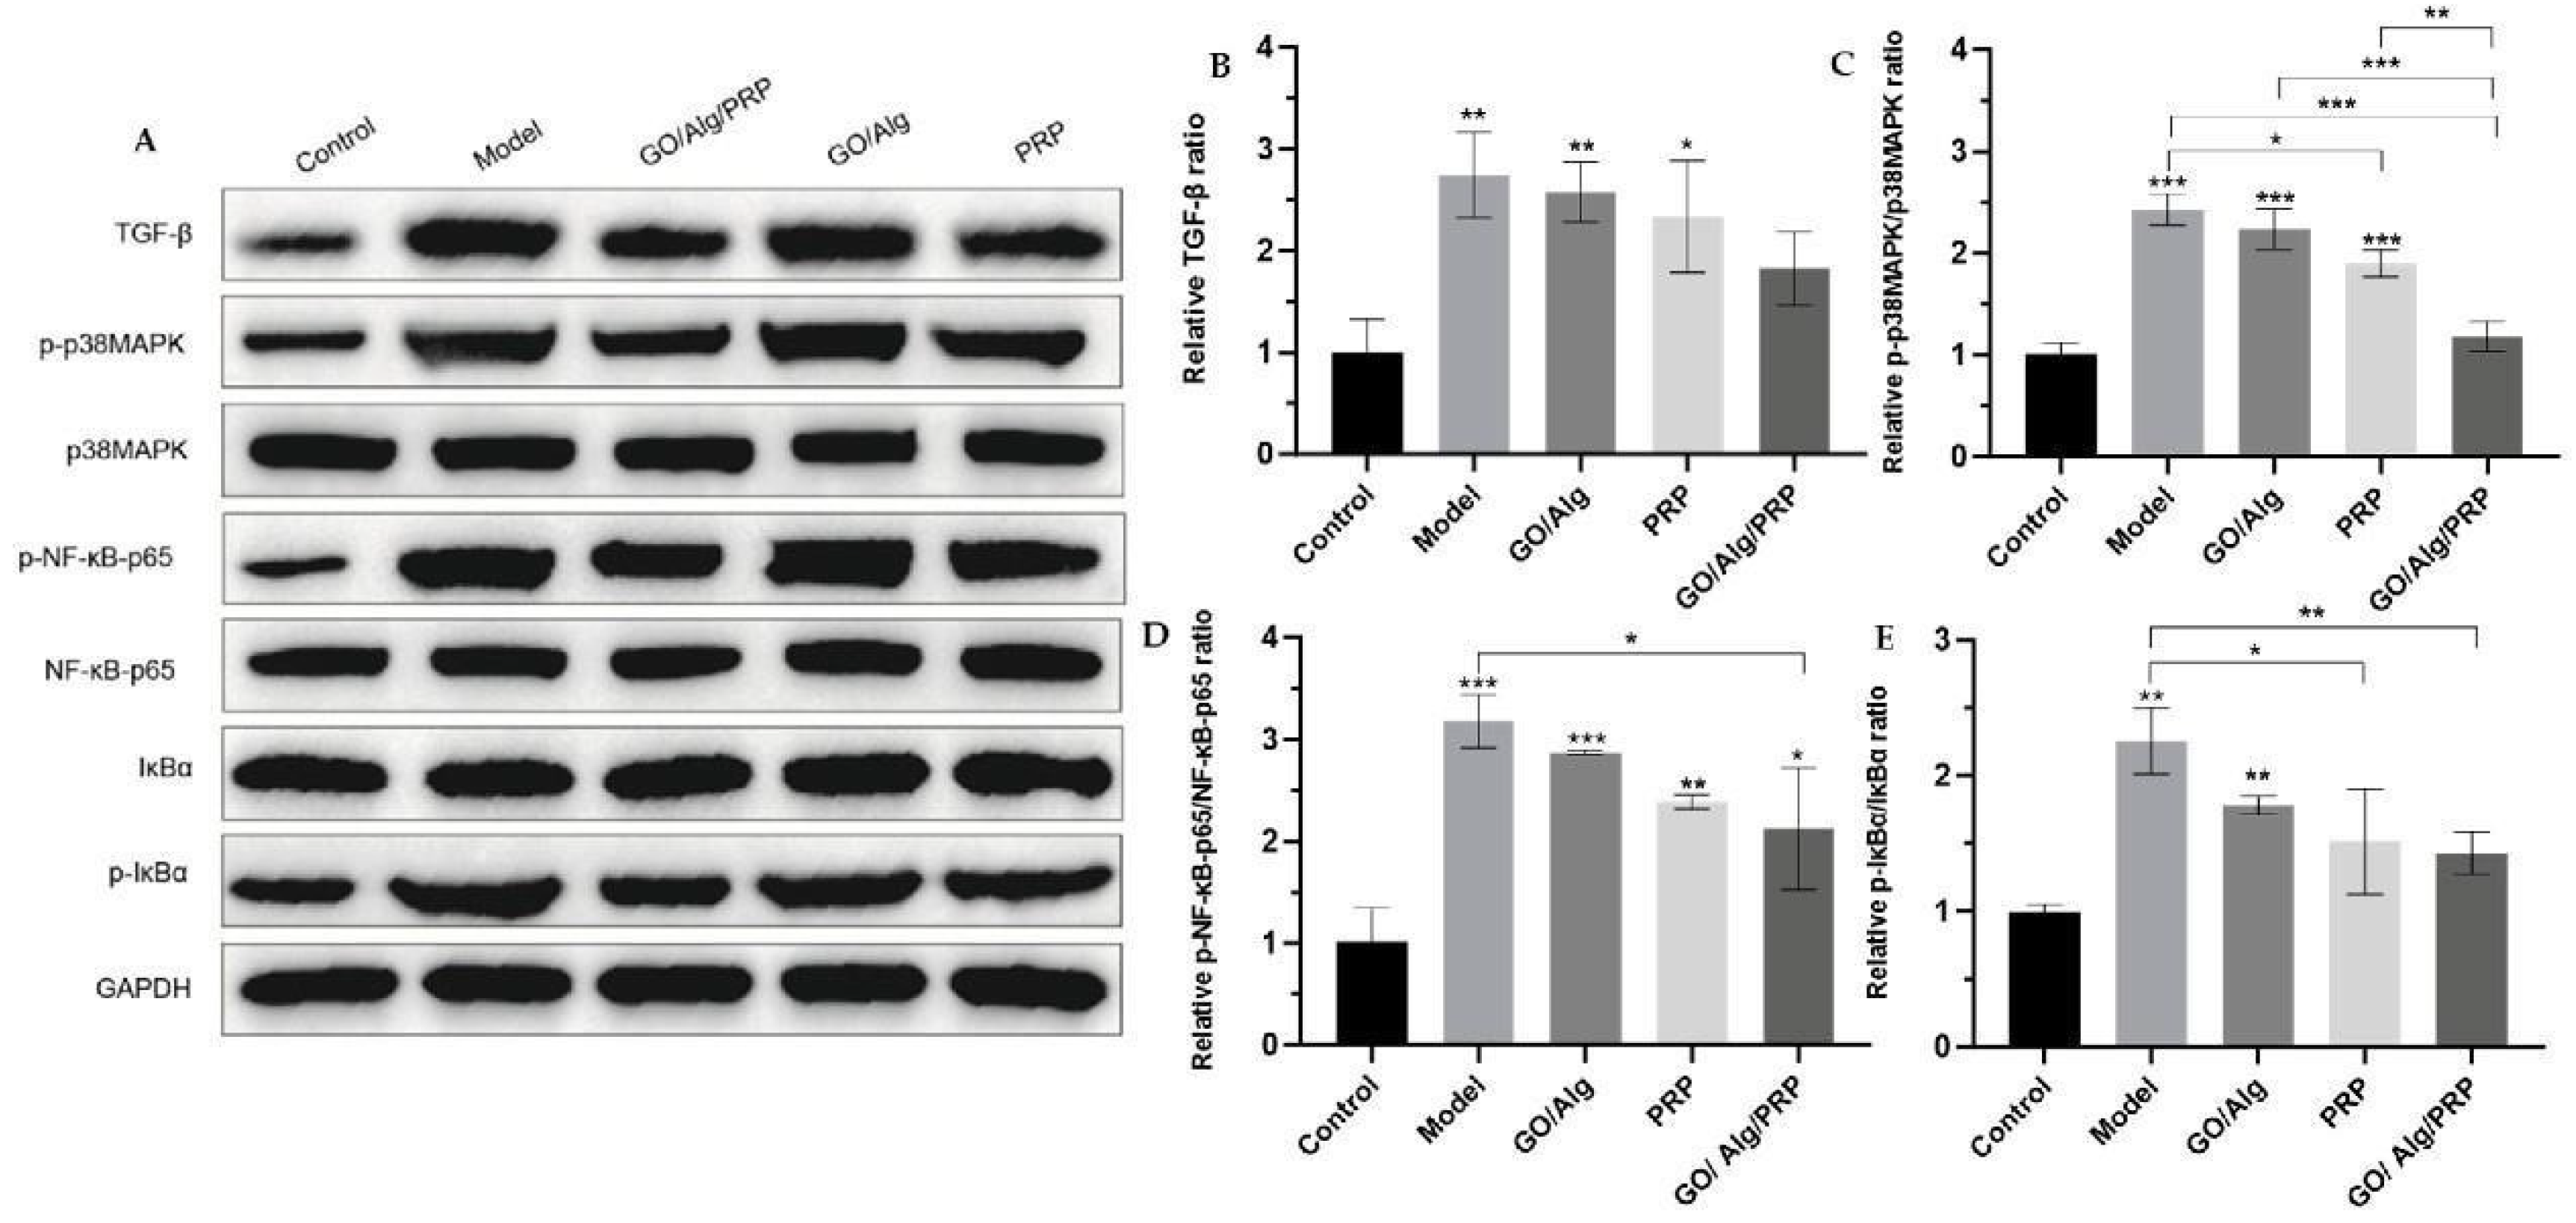
Figure 7.
The treatment of each group of materials promoted wound healing in mouse full-layer skin wound model. Representative images of full-layer wounds at 0, 4, 7, 10, and 14 days after treatment with materials in each group are shown. Scale=1.6 cm(A). Quantification of wound healing. The wound size is expressed as a percentage relative to the initial wound area(B). All data are statistically significant (* p < 0.05, ** p < 0.01, *** p < 0.001).
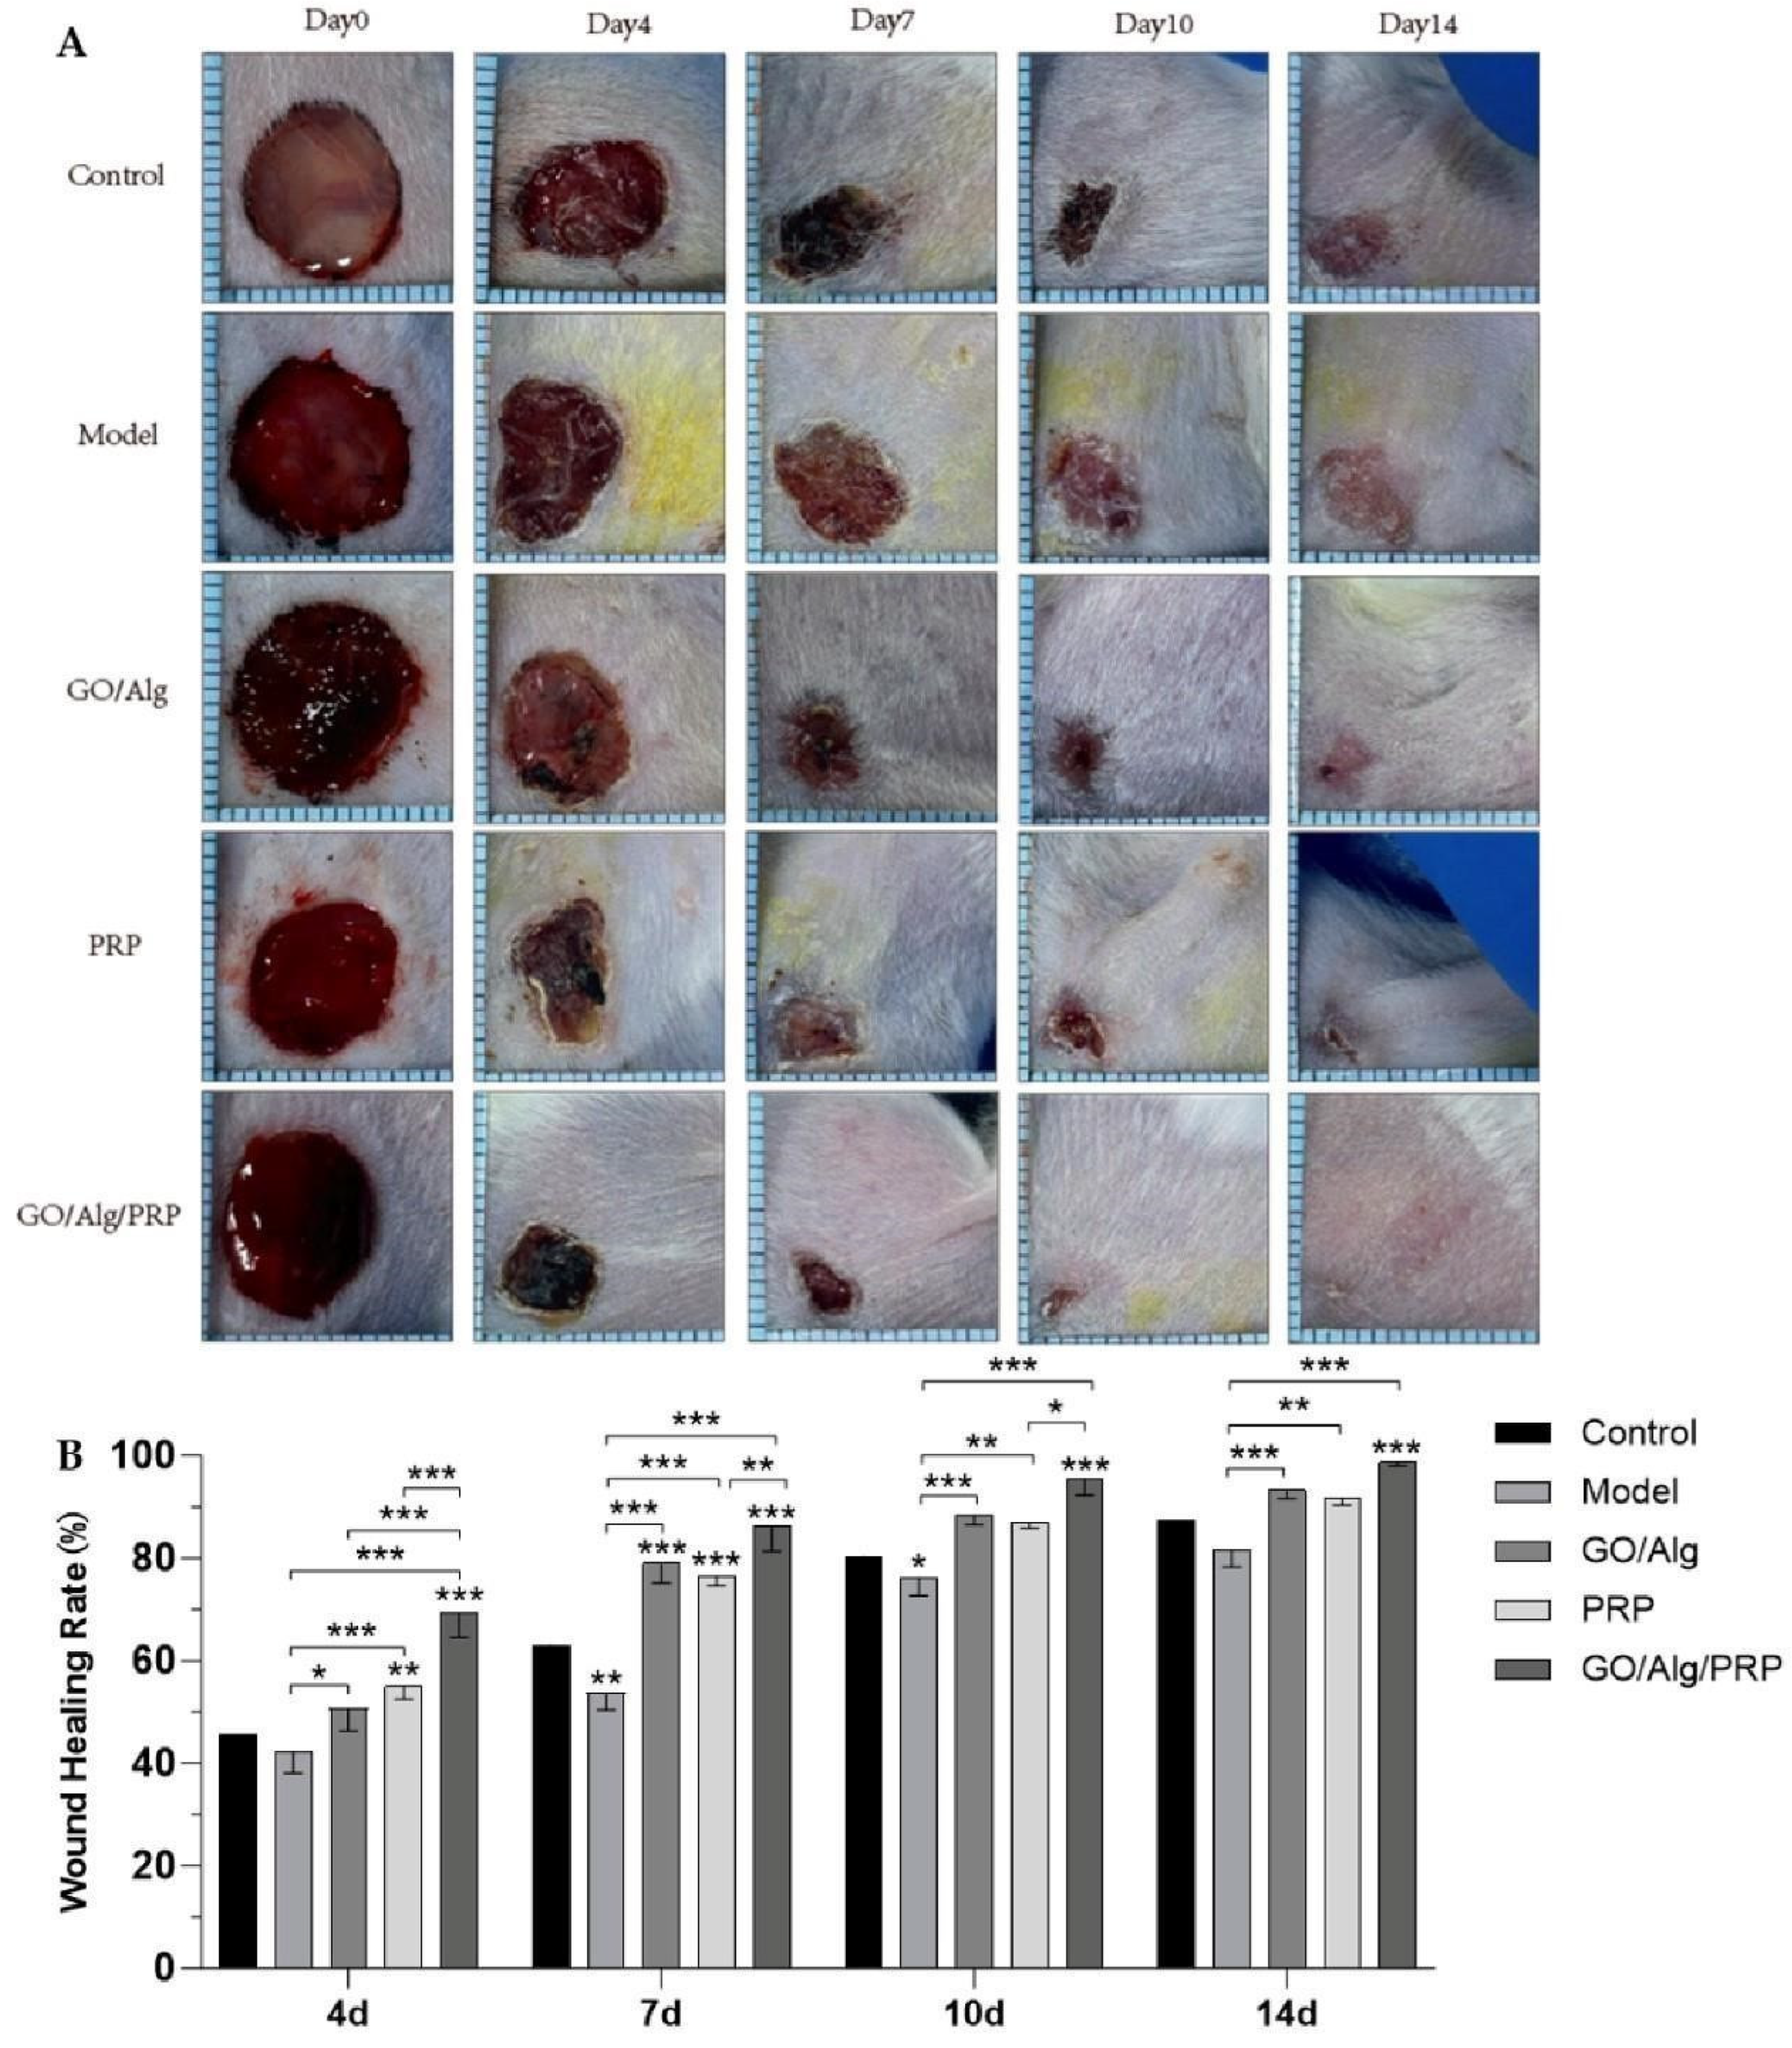
Figure 8.
The application of materials in each group enhanced tissue reepithelialization and collagen deposition. The representative images of H&E staining of fully reepithelialized wounds on day 14 post-injury are shown in (A). Masson-stained representative images of fully reepithelialized wounds on day 14 post-injury (B), and the scale in the lower right corner indicates that the scale is 50µm. Quantitative measurement of epidermal thickness (C). Quantitative collagen content (D). All data are statistically significant(* p < 0.05, ** p < 0.01, *** p < 0.001 ).
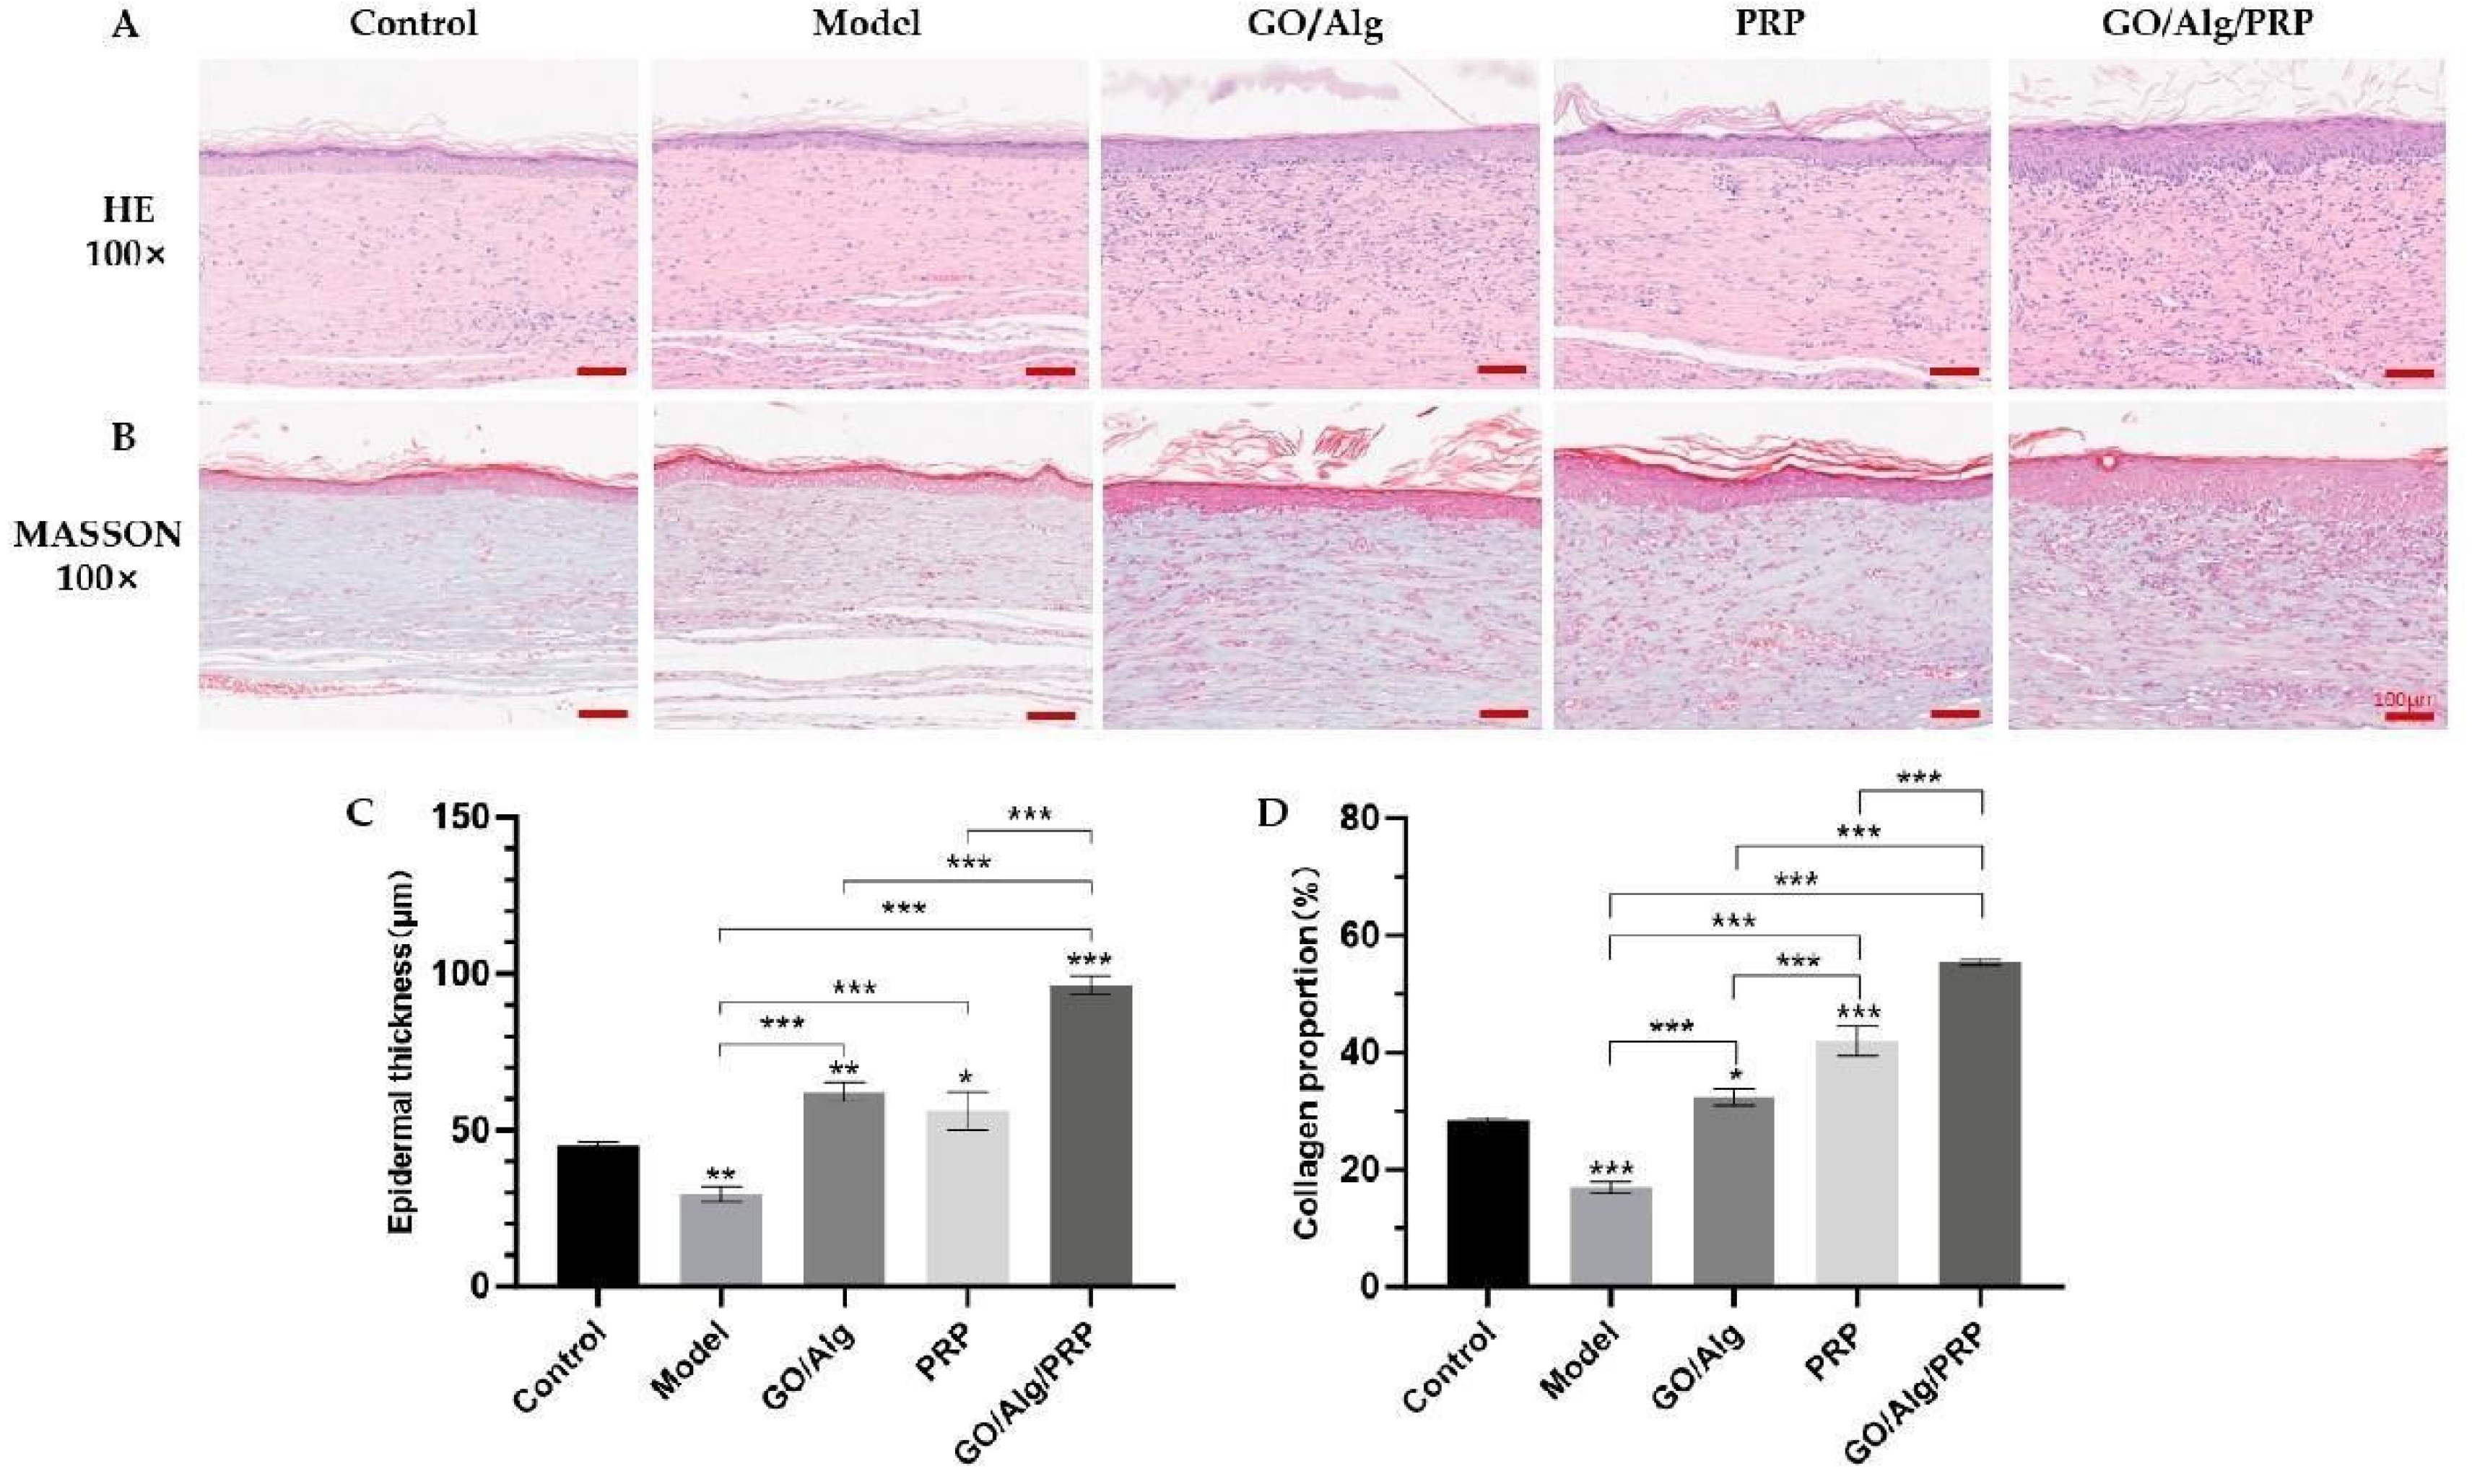
Figure 9.
The levels of VEGF, CD31 and α-SMA in vascular endothelial cells were detected by immunohistochemistry. Images of immunohistochemical staining results are presented in the figure, and the scale in the lower right corner indicates that the scale is 100µm (A). expression rates of VEGF, CD31, and α-SMA in vascular endothelial cells, respectively(B-D). All data are statistically significant (* p < 0.05, ** p < 0.01, *** p < 0.001).
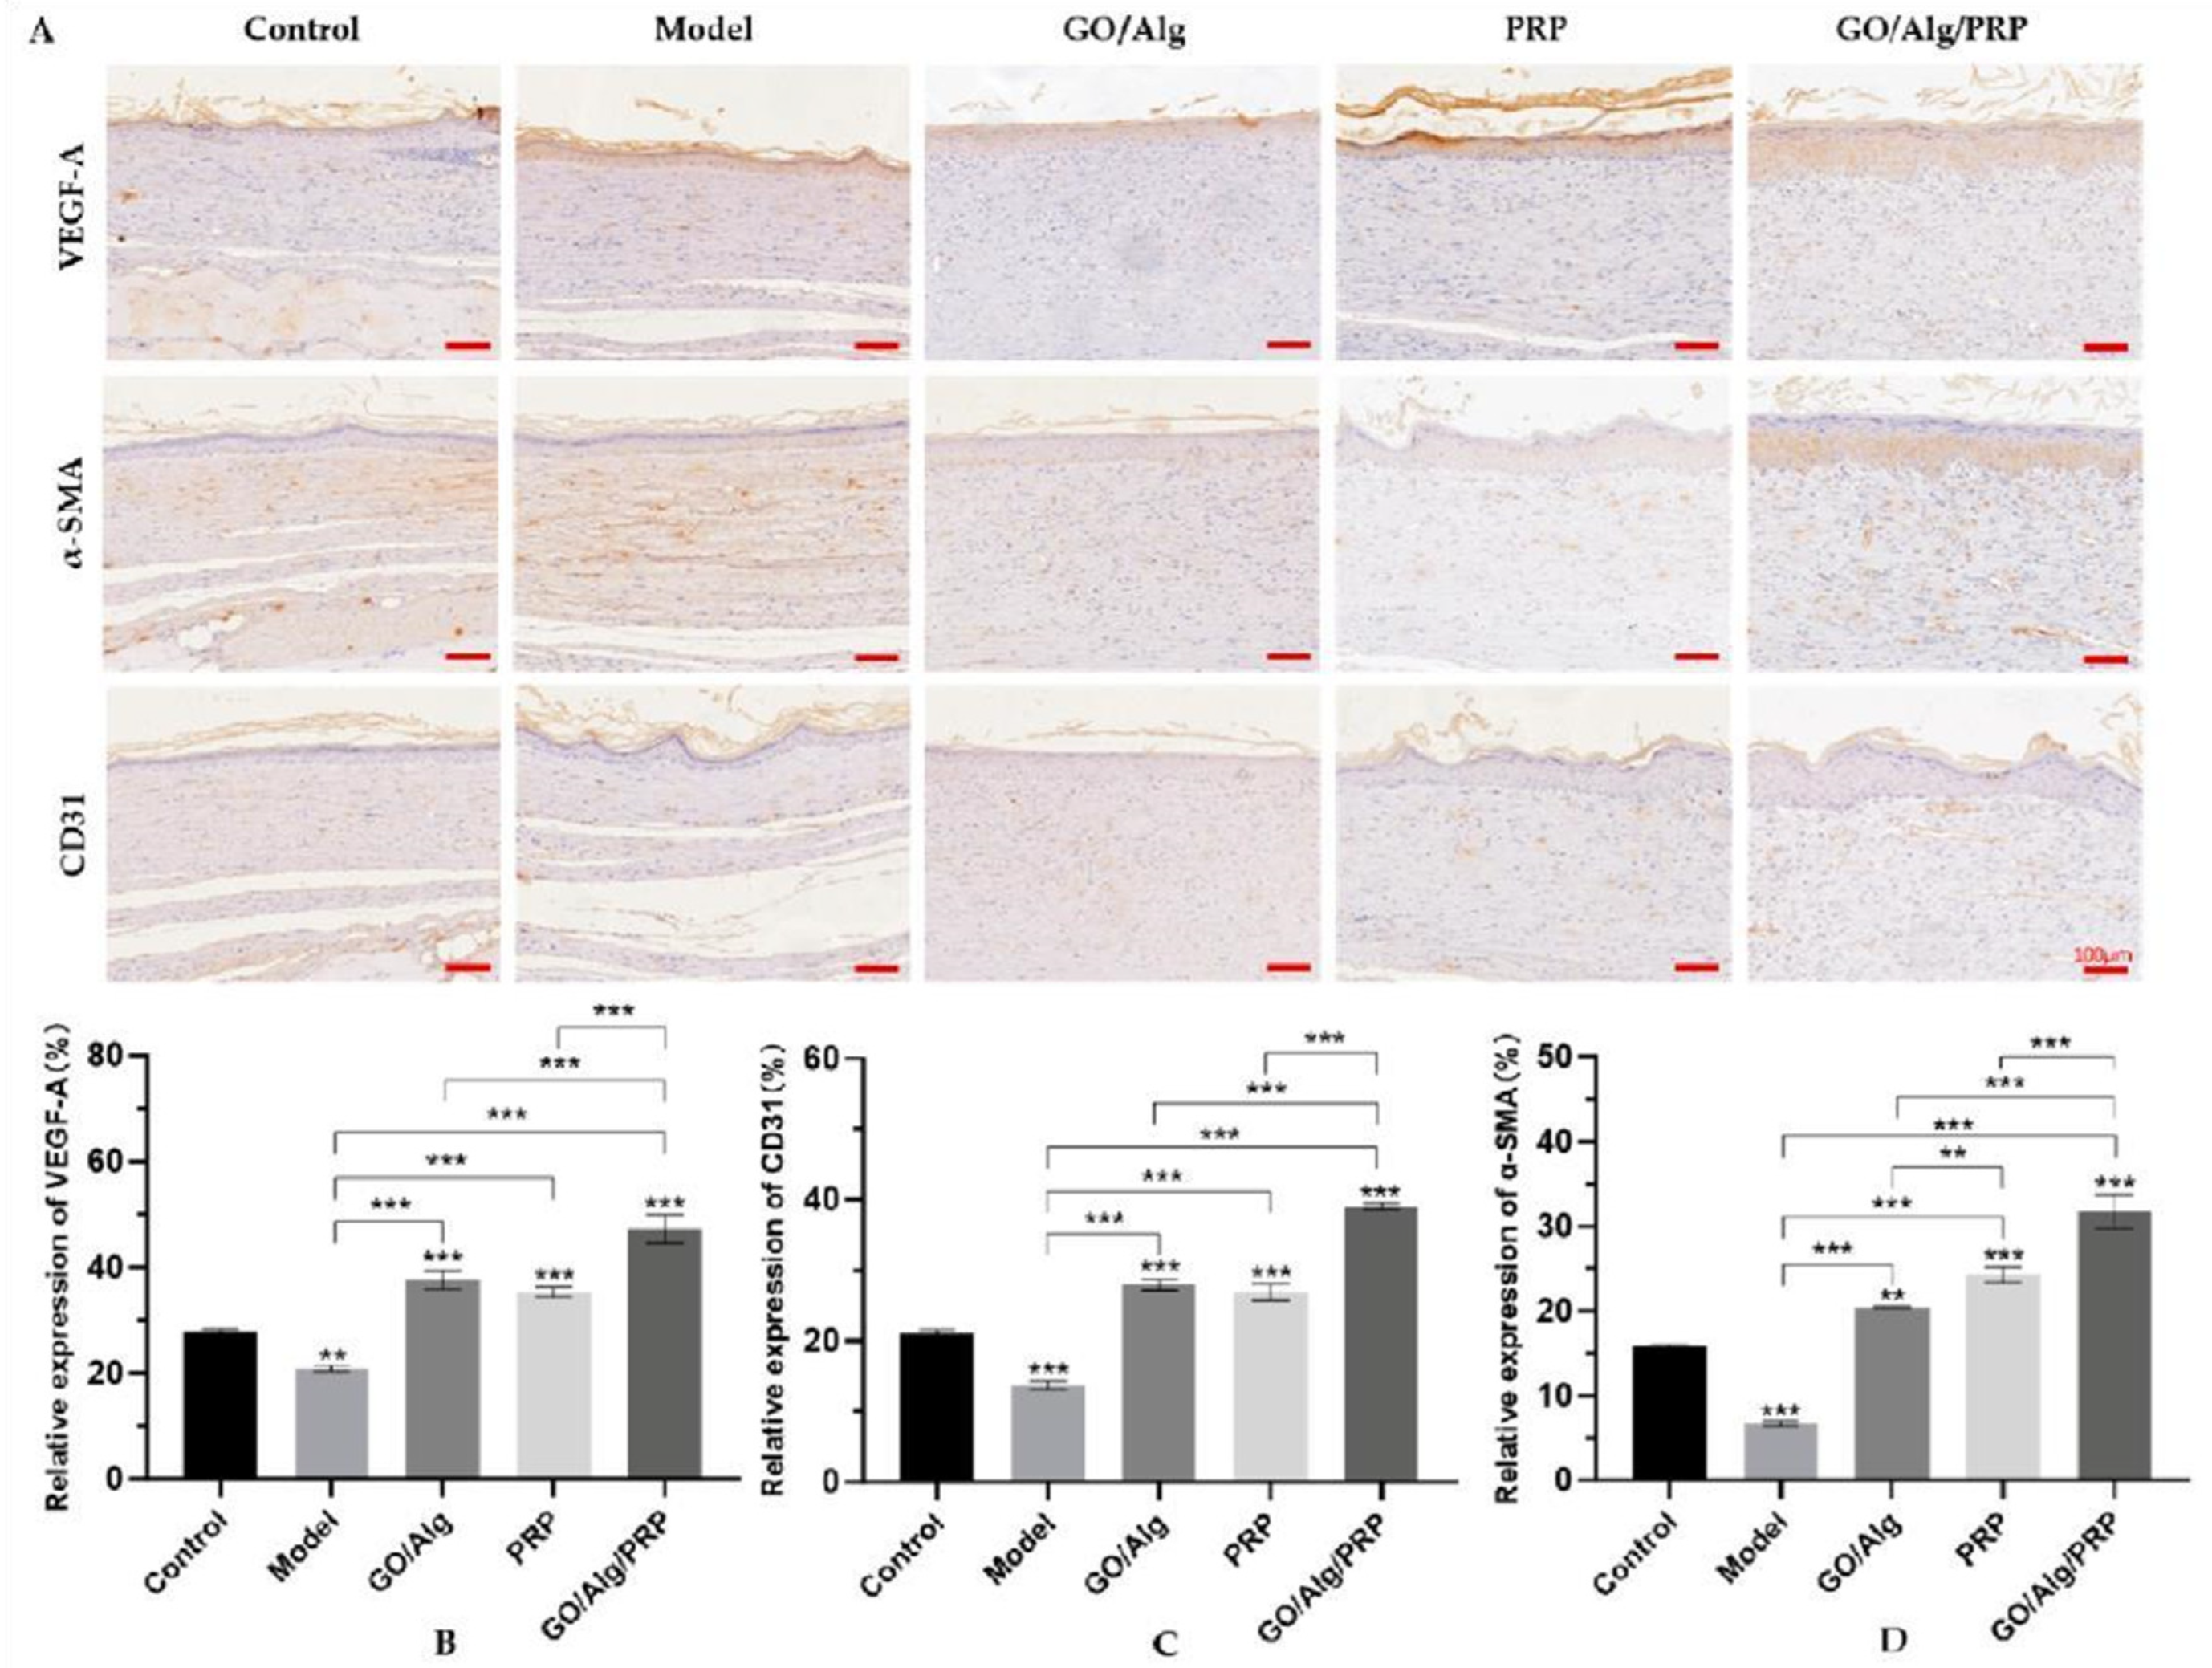
Figure 10.
The content of MDA in tissue induced by oxidative stress in each group (A). The content of SOD in tissue induced by oxidative stress in each group(B). All data are statistically significant (* p < 0.05, ** p < 0.01, *** p < 0.001).
Figure 10.
The content of MDA in tissue induced by oxidative stress in each group (A). The content of SOD in tissue induced by oxidative stress in each group(B). All data are statistically significant (* p < 0.05, ** p < 0.01, *** p < 0.001).
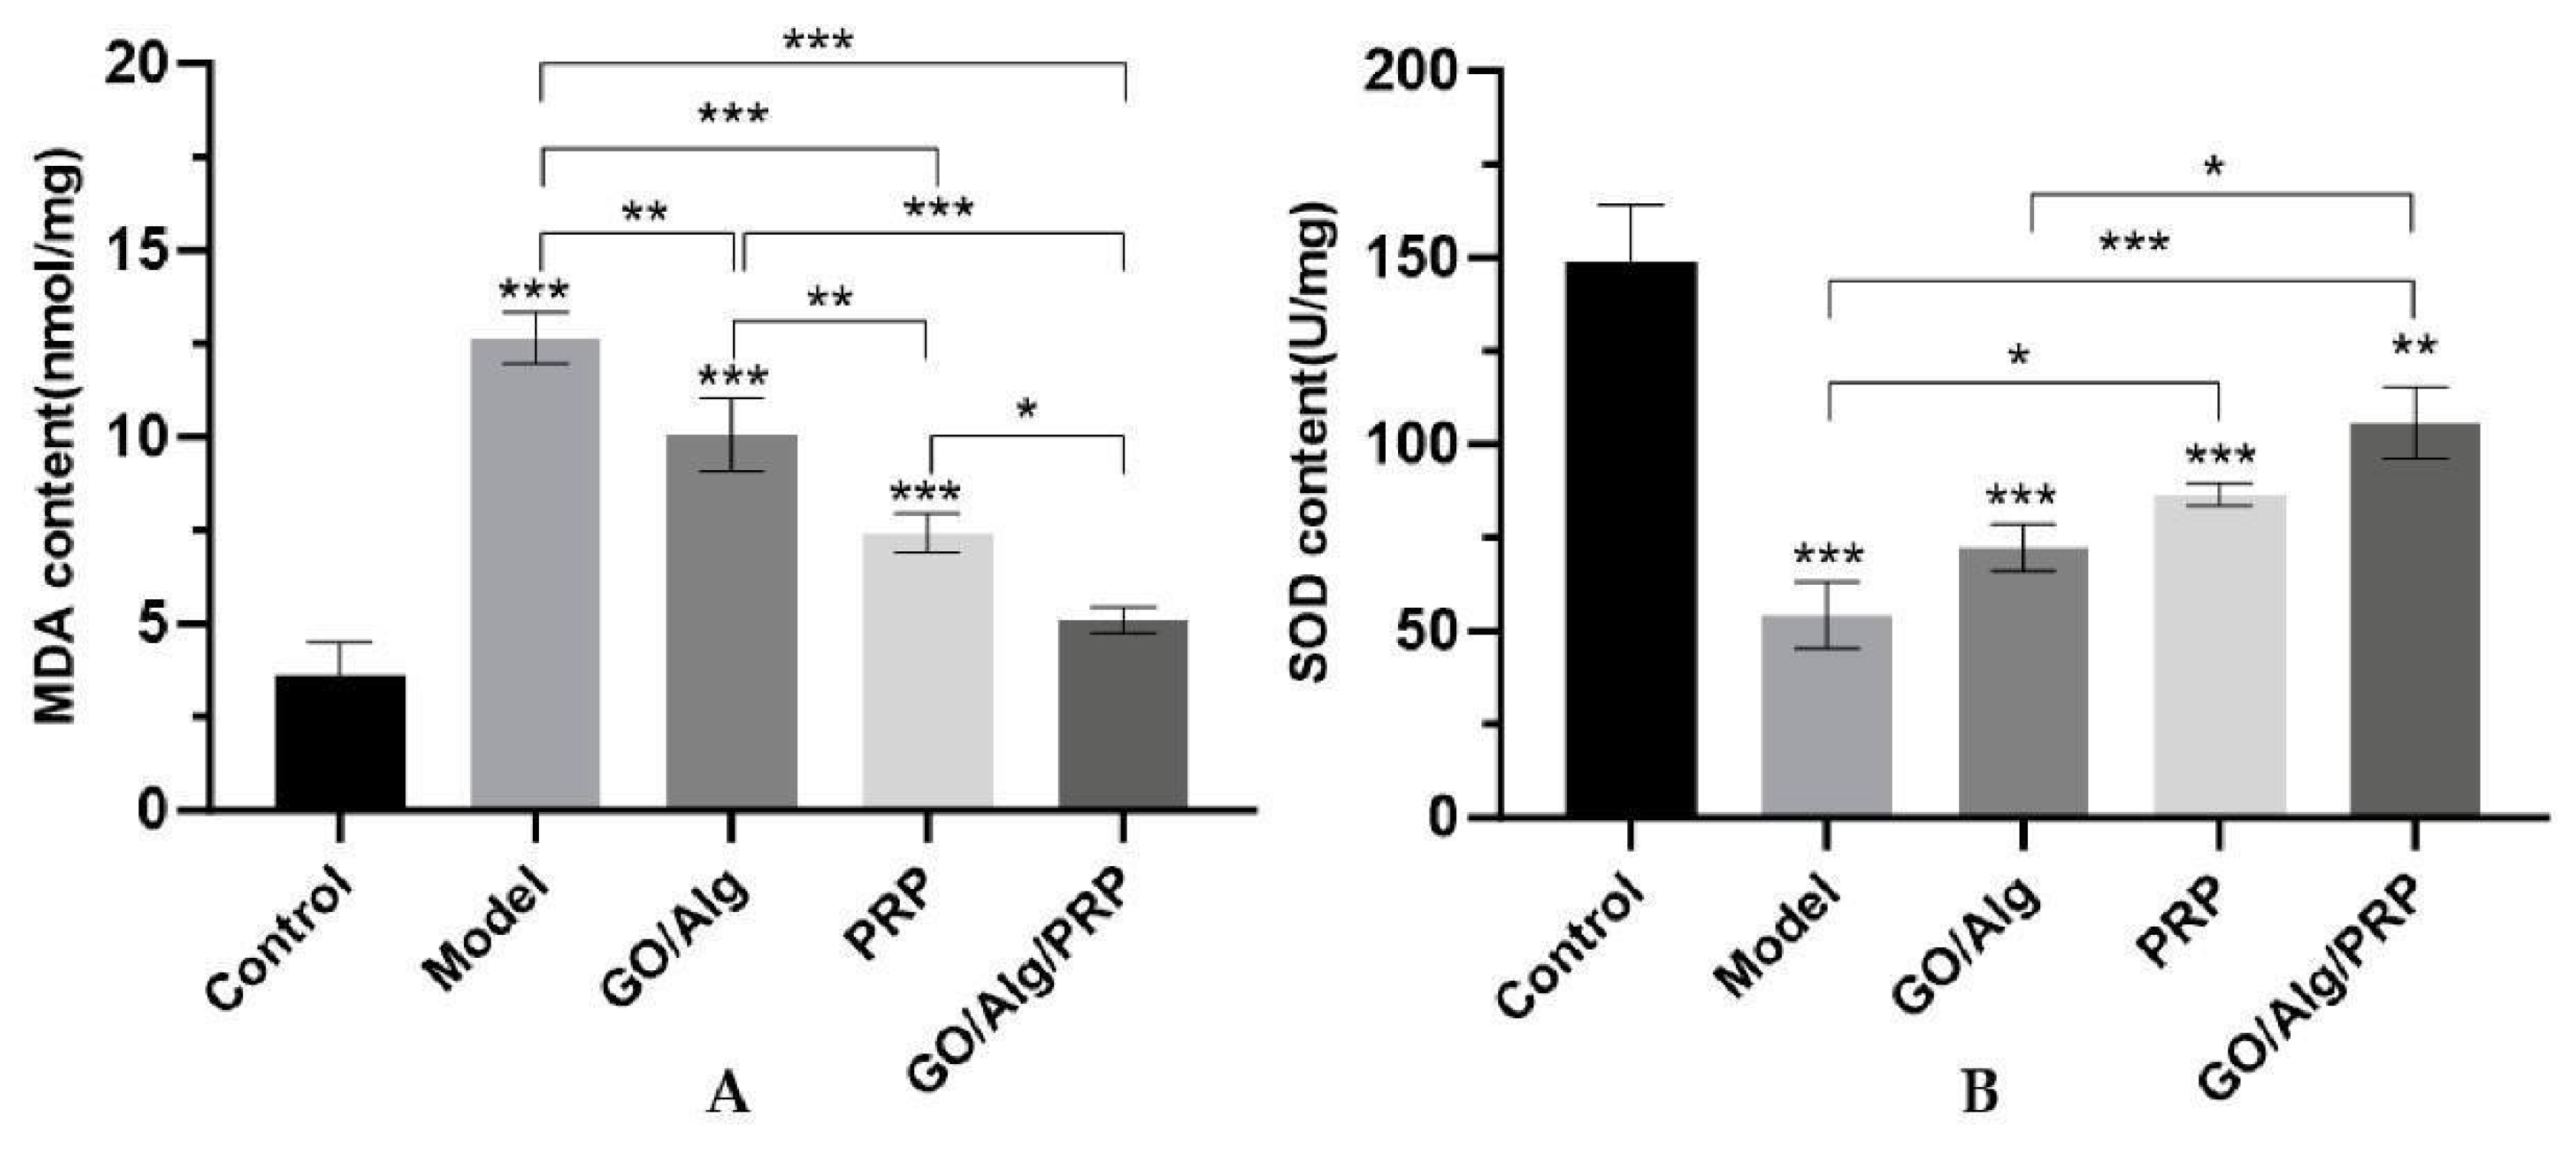
Figure 11.
Western blotting was used to detect the expression of TGF-β, p-p38MAPK, p38MAPK, p-NF-κB-p65, NF-κB-p65, IκBα, and p-IκBα proteins in tissues (A). Additionally, the relative ratio of TGF-β after intervention in each group was determined (B). The relative ratio of p-p38MAPK/p38MAPK after material intervention was measured in each group (C). Additionally, the relative ratio of p-NF-κB-p65/NF-κB-p65 was determined for each material after intervention (D). The relative ratio of p-IκBα/IκBα for each group after intervention (E) has been determined. All the data are statistically significant (* p < 0.05, ** p < 0.01, *** p < 0.001).
Disclaimer/Publisher’s Note: The statements, opinions and data contained in all publications are solely those of the individual author(s) and contributor(s) and not of MDPI and/or the editor(s). MDPI and/or the editor(s) disclaim responsibility for any injury to people or property resulting from any ideas, methods, instructions or products referred to in the content. |
© 2025 by the authors. Licensee MDPI, Basel, Switzerland. This article is an open access article distributed under the terms and conditions of the Creative Commons Attribution (CC BY) license (http://creativecommons.org/licenses/by/4.0/).
Copyright: This open access article is published under a Creative Commons CC BY 4.0 license, which permit the free download, distribution, and reuse, provided that the author and preprint are cited in any reuse.


