1. Introduction
Commercial use of nuclear reactors started in the 1950s [
1], based mainly on using thermal fission reactors to produce electricity. First-generation reactors (primarily prototypes) followed second-generation commercial reactors, where the reactor power output was according to customer needs.
To reduce construction uncertainty, 3rd Generation Reactors were developed, where standardization was one of the guiding principles along with the use, in some cases, of passive systems 3rd Generation reactors came around the 1990s. Most new units built in the last decade belong to this generation.
The ABWR (Advanced Boiling Water Reactor) in the Kashiwazaki-Kariwa power plant in Japan was the first 3rd generation reactor built, followed by a second unit there. Taiwan also chose that technology and deployed two reactor units, but they never operated for political reasons. In Japan, the other two ABWRs are operable but pending restart, and the other two are in undefined construction [
2]. The last BWR design, the Economic and Simplified Boiling Water Reactor (ESBWR), was certified by the US-NRC without known plans for its construction.
Five different PWR 3rd generation reactor designs are already in operation or construction. APR-1400 (Advanced Pressurized Reactor – 1400) was developed by Korea Electric Power Corporation (KEPCO); two countries have this reactor in commercial operation: the United Arab Emirates, with four units, and the Republic of Korea, with three units in commercial operation and another three in construction [
3].
AP-1000 (Advanced Pressurized–1000) reactors were built and in operation in China (four units). The other two units are in the USA, one already in commercial operation and the second in 2024. There are some agreements with Ukraine and Poland to build three and two units, respectively [
3], but they still need consolidation.
Regarding the EPR (European Pressurized Reactor), two units are in China, a third one is in Finland, the fourth unit is still under construction in France, and the fifth and sixth units are under construction in the UK. China has developed a new third-generation PWR reactor [
3], the HPR (Hualong Power Reactor), built in Pakistan (one unit); there are three in operation and five in construction in China [
3].
Russia has developed two new Generation III reactors: the VVER-TOI [
3], which has two units in construction, and the AES-1200, which has four reactor units in operation, both in Russia, one in Belarus, and five more in Belarus, India, and Turkey [
3].
With the evolution of nuclear power installed capacity at the end of 1980, the number of reactor units and installed capacity reached their highest values; since then, they have remained at the same level. New reactor additions and reactor power upgrades have offset the permanent shutdown of other reactors.
Initially, the lifetime of nuclear reactors would be 40 years; however, different tests showed that the reactor could be in the condition to operate for up to 60 years. In several countries, operational license renewals are in place for several units. The USA has gone further to the extent that regulations have been approved for reactors with a second operational license extension of up to 80 years; this process is called a subsequent license renewal. Several reactors in the USA have obtained this subsequent license [
4].
In this century, there were several initiatives to incentivize the deployment of more nuclear reactors to increase nuclear worldwide capacity, but they have been unsuccessful. Current countries with nuclear reactors are the likely candidates to increase their nuclear capacity because they already have the legal and regulatory infrastructure; on the other hand, nuclear reactors newcomer countries are required to set up an adequate framework before nuclear reactors can be part of their electricity source options.
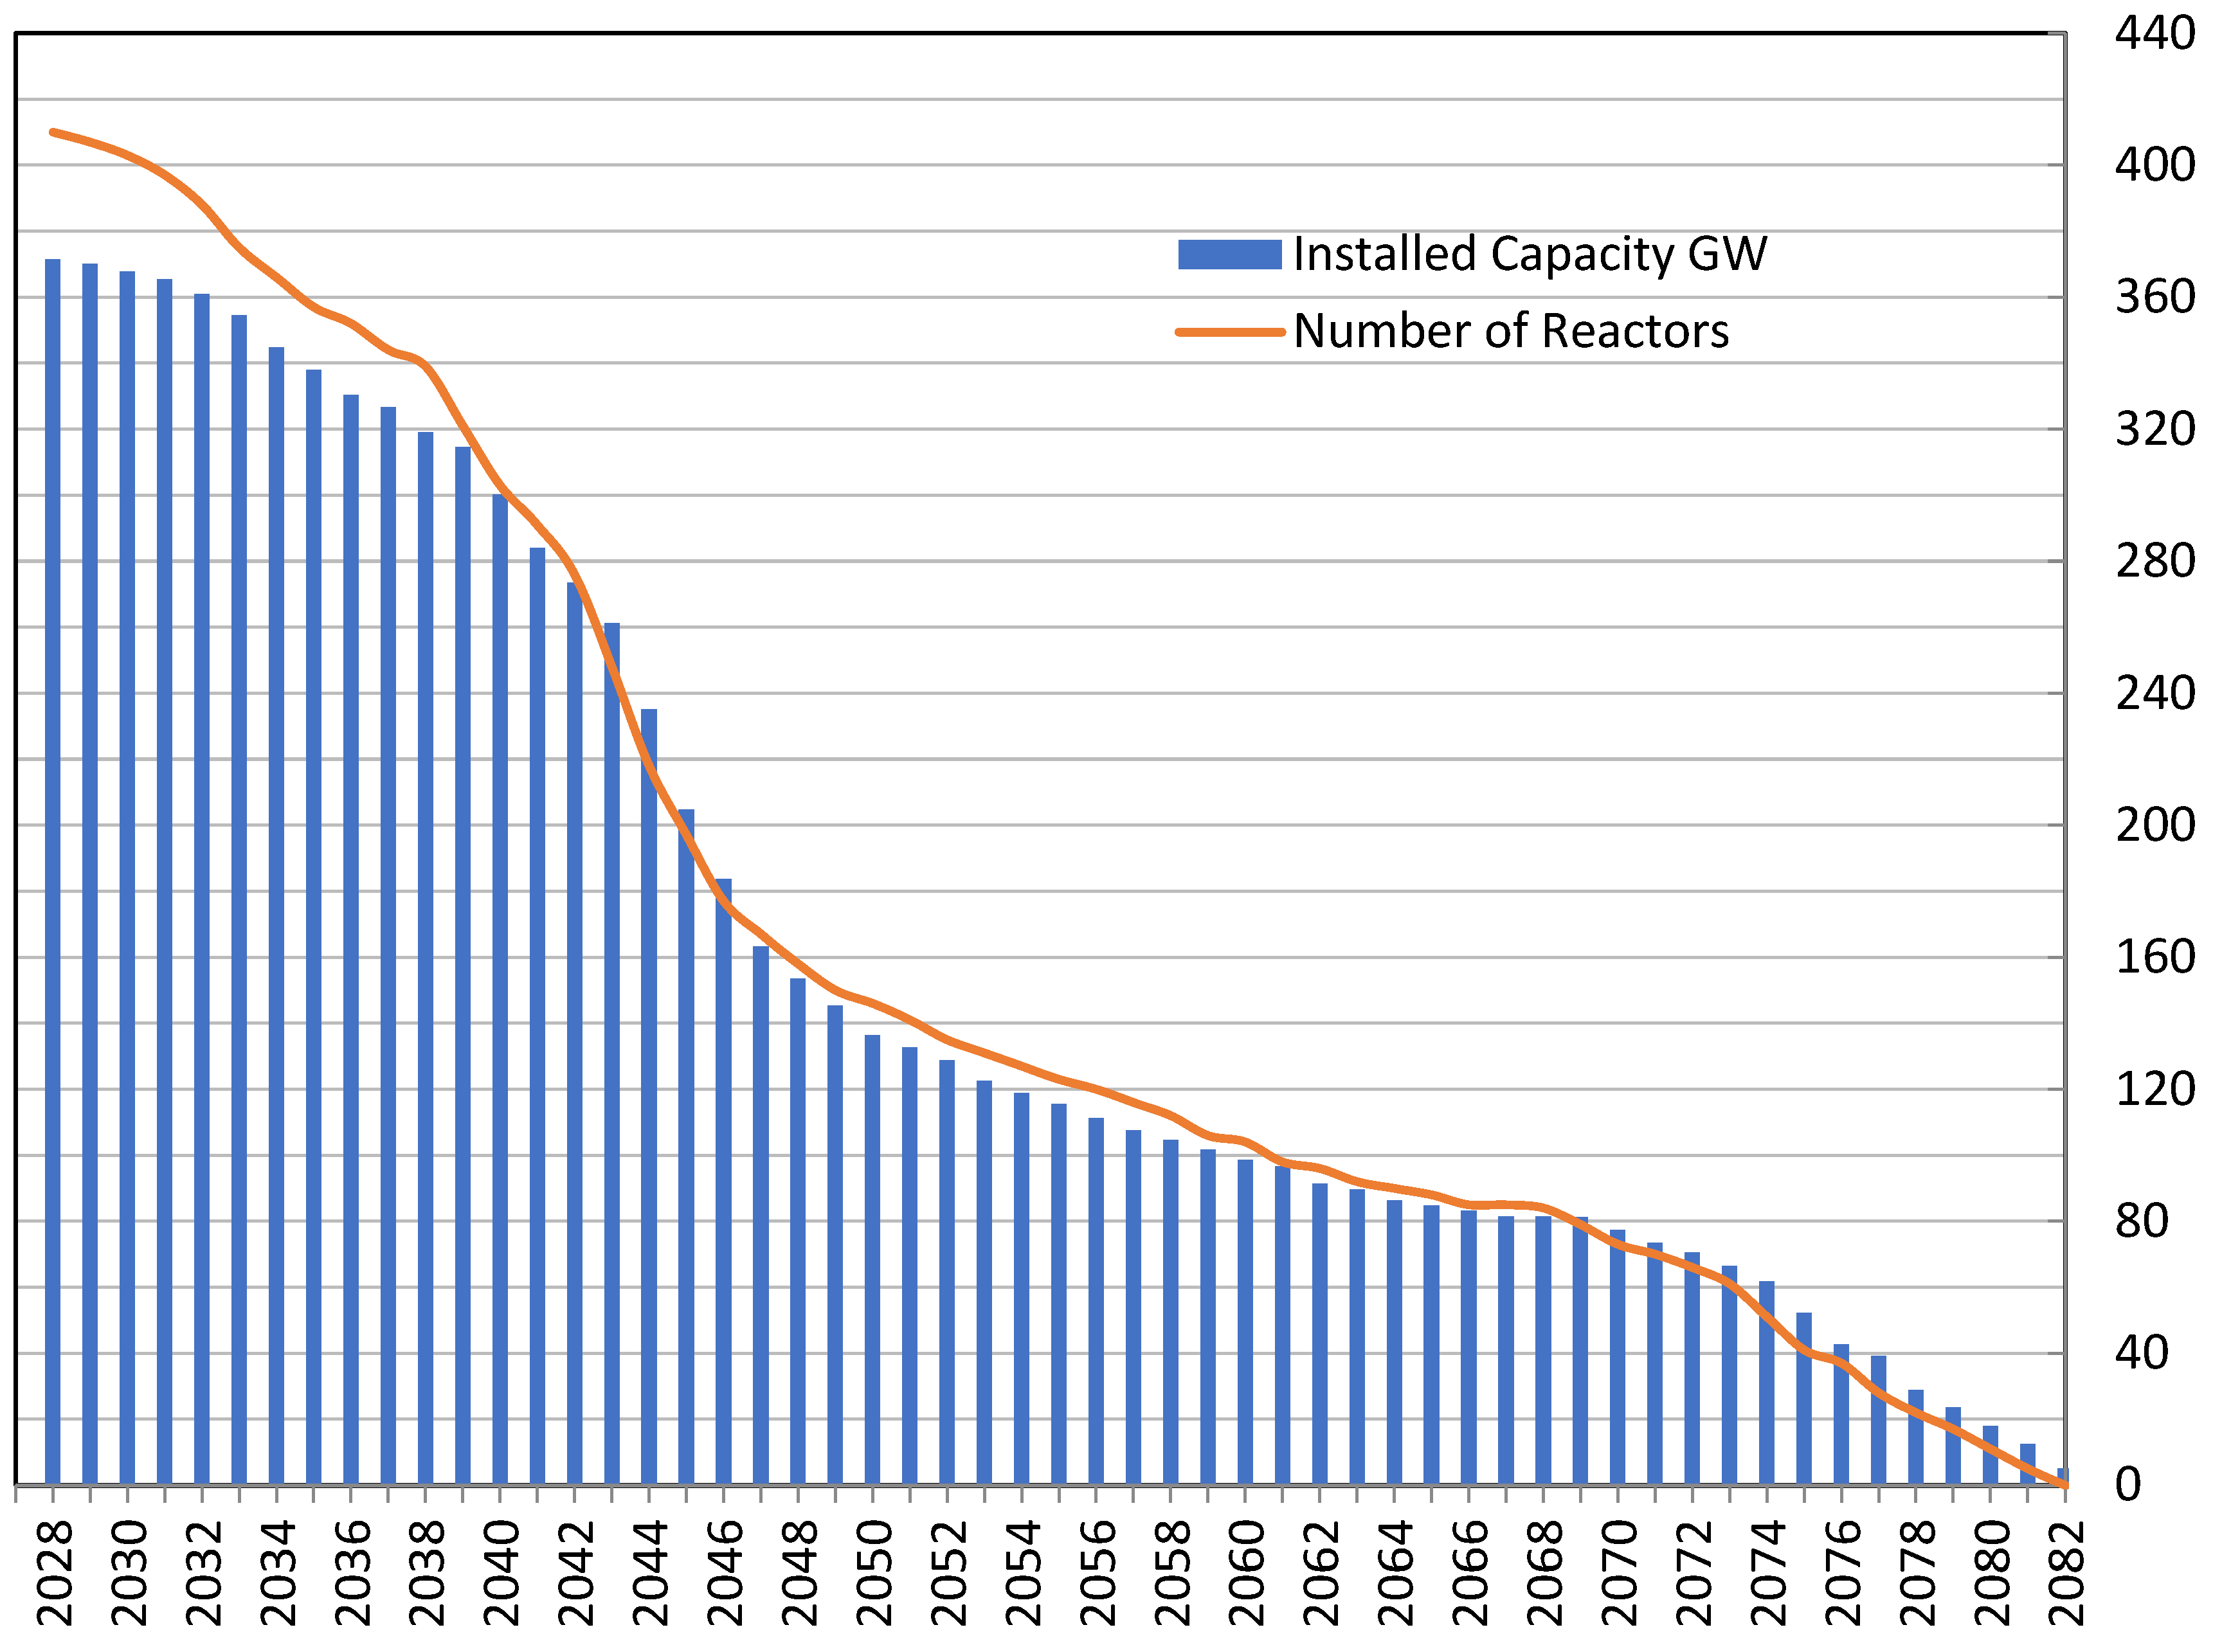
For the current nuclear reactor fleet, assuming that the reactor’s operational life is 60 years and that there are no new reactor additions beyond 2024, the capacity will decrease to half the actual installed capacity by 2046. Under this scenario,
Figure 1 shows when nuclear reactors will go out of service. Starting now, at least 9.04 GW/year additions are required to maintain the current installed capacity [
5] by 2050.
If the newly installed capacity comes from third-generation reactors, it is necessary to incorporate between 6 to 8 new reactors per year, because third-generation reactors have a capacity between 1,100 and 1,600 MW per unit.
According to the information provided by the Power Reactor Information System [
5], 59 reactors with a 61.637 GW capacity are in construction. At least four of them have stopped construction for quite a long time. However, if construction is constant and keeps at that pace, new reactor additions would be slightly higher than the ones required to keep the current capacity. Nonetheless, a more determined engagement by governments worldwide must be in place to make the possibility of having more clean energy from nuclear power come true.
The preferred option for adding a new unit is Light Water Reactors, specifically the Pressurized Water Reactor. There are 59 new nuclear reactors in construction, and 51 are PWRs; most of these PWRs are Generation III reactors. Furthermore, three newcomer nuclear countries are building large PWRs. With these newcomers, there are 34 countries with a nuclear-installed capacity to produce electricity.
Only two SMR designs have already been deployed. The first is the KLT-40S, a 35 MW gross power PWR reactor floating type with two units, Akademik Lomonosov-1 and -2. The second one is the HTR-PM 200, an HTGR type in China. Also in construction is the ACP-100, a PWR reactor type in China. Moreover, the CAREM-25, a PWR with 25 MW power in Argentina, is also under construction.
Several countries have set the need for nuclear energy as part of the solution, aiming for a net zero policy by 2050 [
6]; the possible role played by nuclear energy requires adding new nuclear capacity. The International Energy Agency [
7] set three electricity demand scenarios: the Stated Policies Scenario (STEPS), the Announced Pledged Scenario (APS), and the Net Zero Emissions by 2050 scenario (NZE). Under these scenarios, there are different expectations about the addition of nuclear capacity.
Table 1 provides information about the nuclear capacity needed, assuming that the nuclear power plants have a plant capacity factor of 0.87, which is the one currently reported as an average factor worldwide.
This objective requires a significant commitment from many countries. This engagement has been stated in the document “Nuclear Energy for a Net Zero World” (IAEA, 2021; IAEA, 2023), but it still needs to materialize. One obstacle to breaking is economic competitiveness, which will be assessed in this study.
The current nuclear reactor construction pace can maintain the installed capacity by 2050, with an annual addition of 9.04 GW. Now, if the scenarios here considered must be met, the addition for the STEPS scenario must be 16.25 GW per year, for the APZ scenario, it must be 20.52 GW per year, and for the NZE scenario, it must be 24.06 GW per year.
To reach the goal of new nuclear capacity by 2050, at least 9.04 GW must be added to keep the current capacity. In particular, for the STEPS scenario, a total addition of 16.25 GW per year of new nuclear capacity is required (it means an additional 7.21 GW per year). This represents 10 to 15 new large reactors, depending on their capacity, or 15 to 22 new reactors per year in the NZE. That pace is comparable to the one that happened in the 1980s.
Large and small modular reactors are the options to be pursued, but how many of each can be deployed will depend on the financial conditions, and it will be according to the site where these reactors are needed. This study assesses the conditions in which small modular reactors can be a competitor of large reactors and where they can be a complementary option.
2. Small Modular Reactors
Small modular reactors (SMRs) can be considered 3rd generation reactors [
8]. Their output power is smaller than 300 MWe and can be deployed in a modular construction, where the modules are built somewhere else and can be easily transported to the site to be assembled there. The reactor initiative was created to meet different power generation needs with the utmost efficiency. Using SMRs eliminates the risk of construction delays that often plague large reactors, and the up-front capital required for the project is significantly reduced. The installation of smaller capacity reactors ensures maximum resource optimization and timely completion of the project.
Small modular reactors can provide a practical solution for regions and countries with low electricity demand and small electrical grids. These reactors are designed to be highly efficient, safe, and cost-effective, providing a reliable source of power for isolated areas. By implementing small modular reactors, communities can reduce their reliance on expensive and environmentally harmful fossil fuels. With their modular design, these reactor systems can be easily scaled up or down by increasing or decreasing reactor units to meet changing energy demands, making them a flexible solution for a variety of settings. It also can compete for high electricity demand as an alternative for large reactor units by using the staggered grid (multiple units).
IAEA reports 85 different concepts for SMRs at different stages, divided into 33 water-cooled, 25 land-based, 8 marine-based, 17 gas-cooled, 8 fast neutron, 13 molten salt, and 12 micro-reactors (less than 10 MW).
Pressurized water reactors are the preferred option for SMRs that have been deployed up to now, and as mentioned, these reactors have government backup. China is building the ACP100 and Argentina the CAREM; both of them are integral PWRs land-based; meanwhile, Russia has already in operation the KLT-40S, which is a PWR marine-based reactor.
Other concepts have also been explored. China recently deployed an HTGCR, the HTR-PM, which is in operation, and Russia has the BREST-OD, a liquid metal-cooled fast neutron spectrum reactor in construction.
NuScale, a company in the USA, has also developed the VOYGR reactor, which is an integral PWR. It has already received design certification from the US-NRC. Several agreements have been signed for its construction, but they have yet to materialize in the USA or abroad.
Many other concepts have gotten attention, for example, the SMART reactor, which got the Republic of Korea reactor certification in 2012 but not deployed yet, or recently, the NUWARD, a concept developed by EDF in consideration for different country regulators. However, its possible construction is still being determined. The BWRX-300 is a possible candidate in Canada, but it is still deciding when its construction could start.
These designs must overcome some significant hurdles to become a reality. However, with the right support from the government or a motivated customer willing to own and operate one of these reactors, it is possible to transform these concepts into licensed and deployed projects.
2.1. Economy of Scale
Currently, large Generation III reactors have a more standardized design, aiming to reduce capital costs and construction time. In general, the average capacity factors have increased through the years, reaching records of about 95% and worldwide average values of 85%. Large reactors are working now in this way. The same principle applies to small modular reactors.
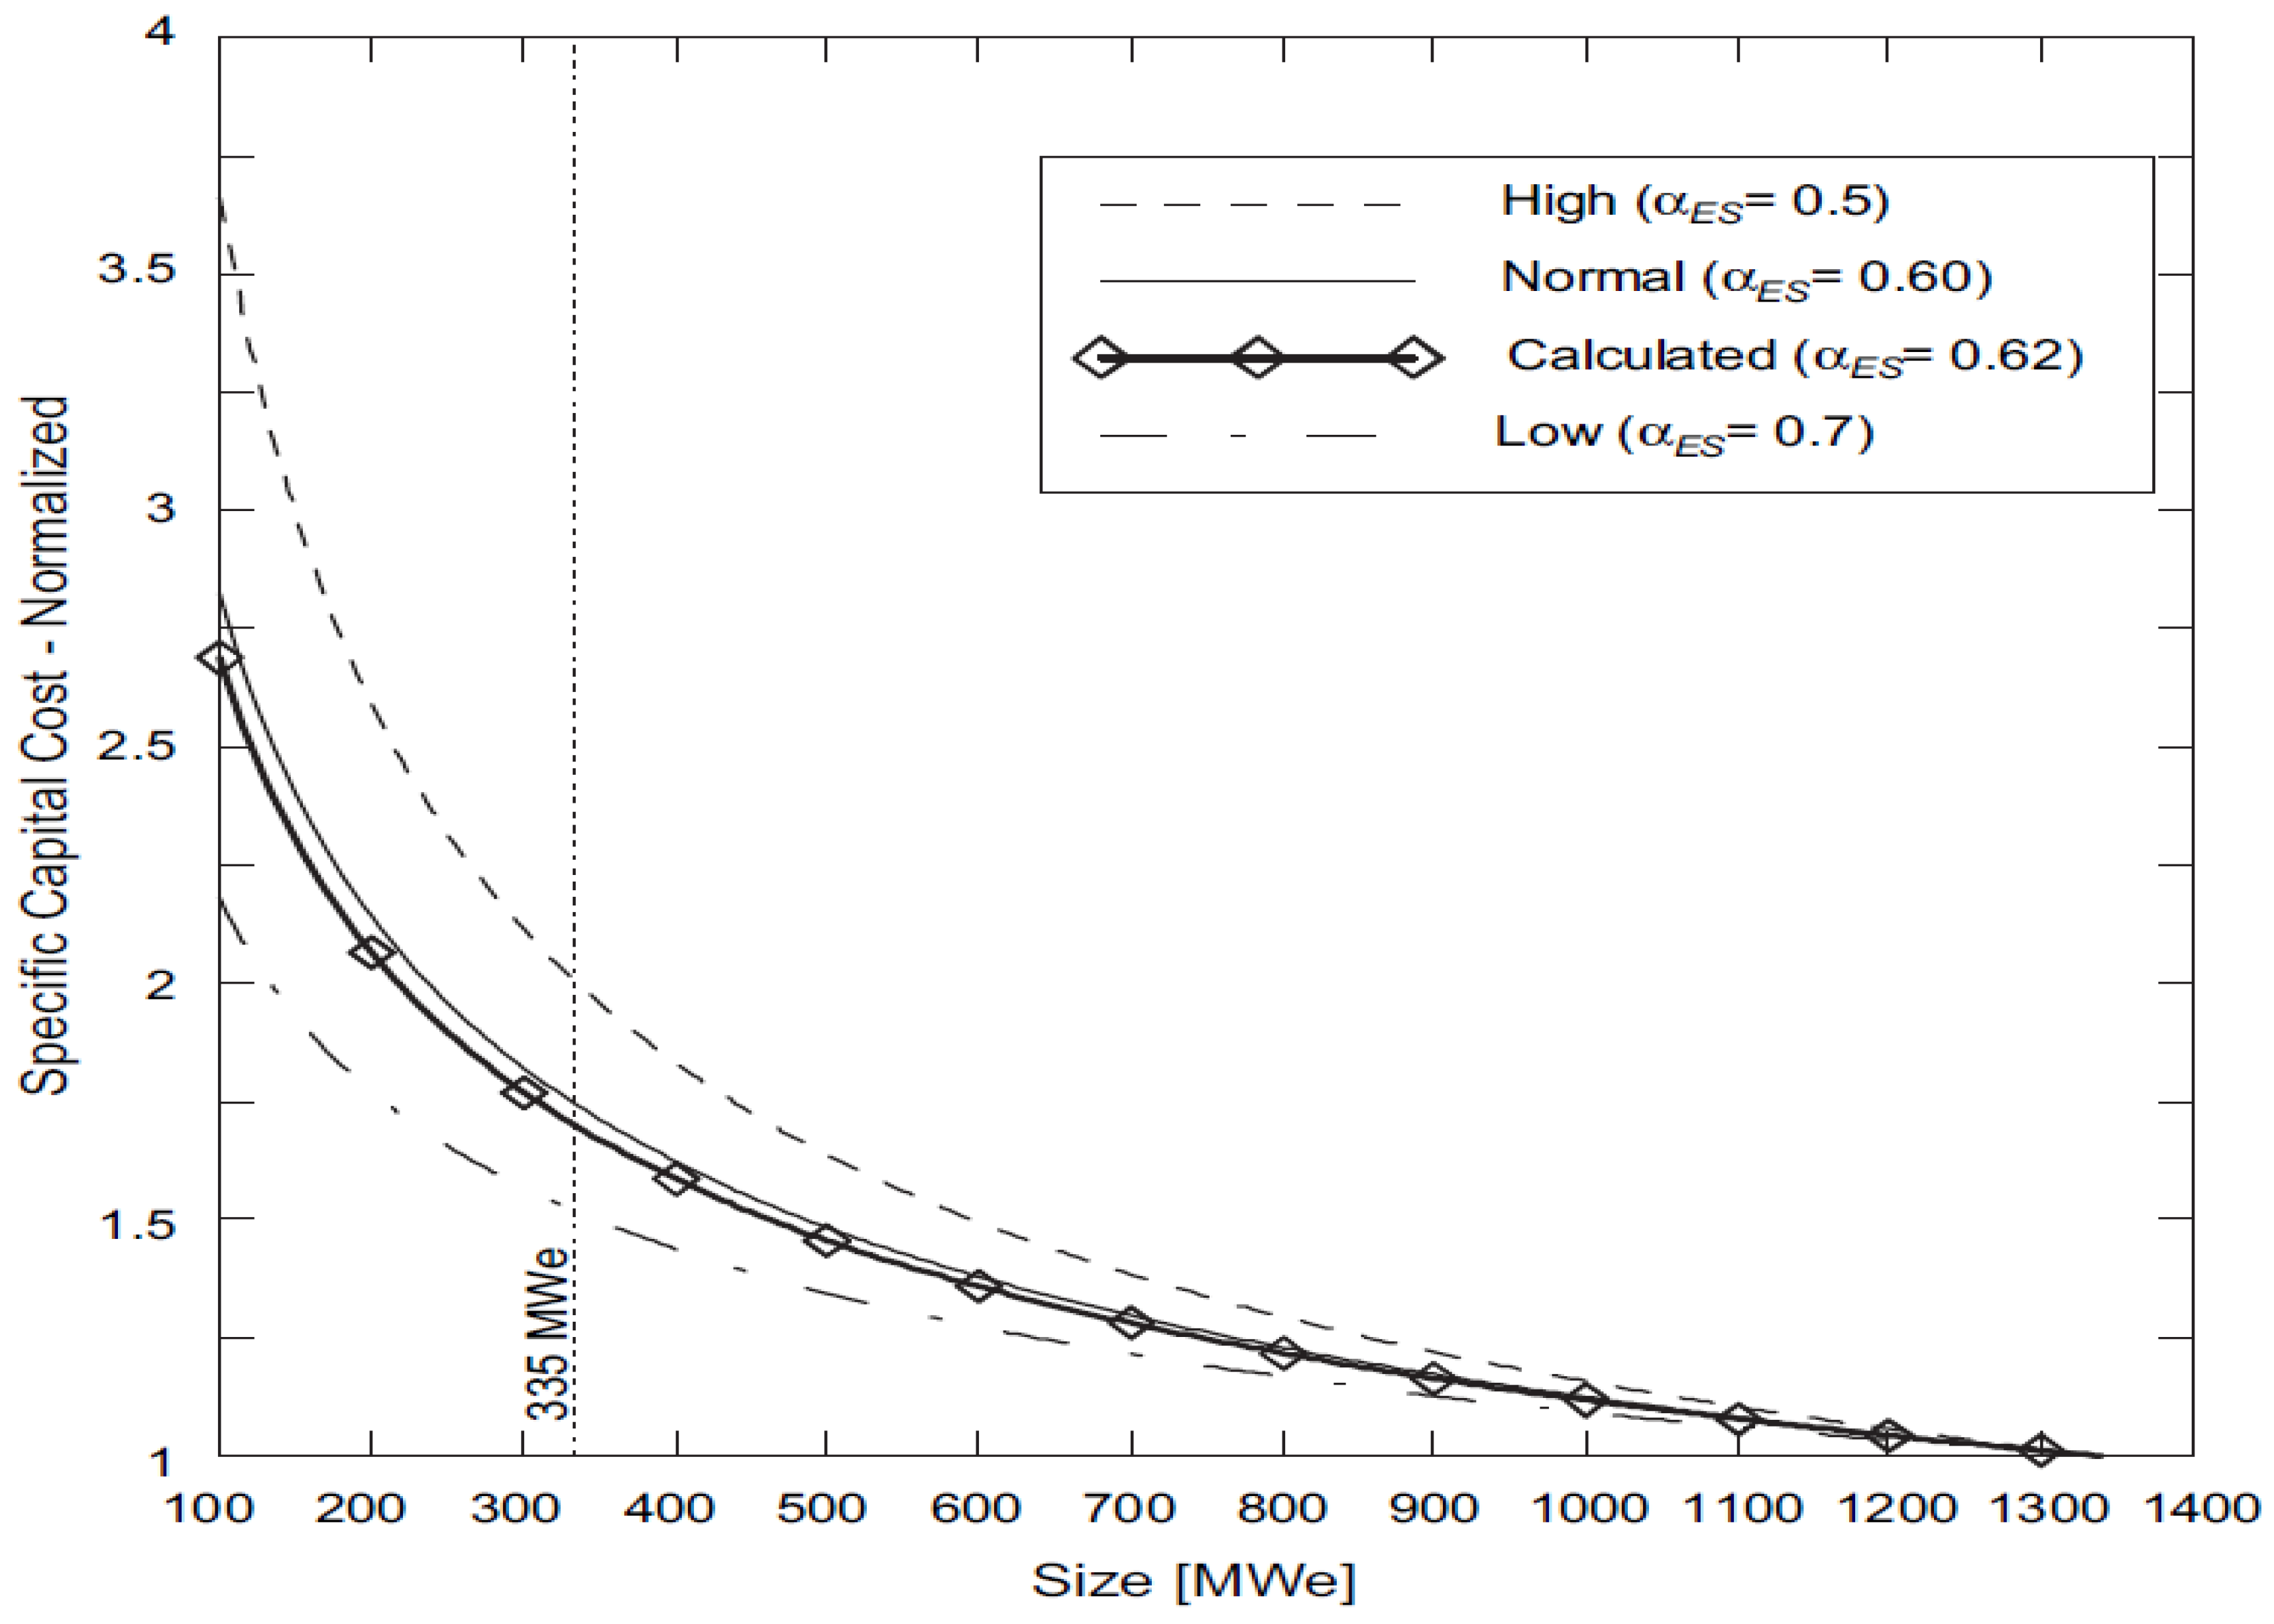
The capital cost per unit of power will decrease when the size of the power plant is increased; this is the principle of the economy of scale. This is because larger equipment benefits from a reduction in investment activities and better performance. Carelli et al. [
9] performed a comparative analysis of small reactors versus large reactors, and they determined different exponents of an economy of scale factor; their results are shown in
Figure 4, where the normalized specific capital cost (NSCC=1) corresponds to 1340 MW. Power outputs for the different types of Generation III reactors span between 1100 and 1600 MWe with a 1350 MWe average.
For an SMR having a 335 MWe output, from
Figure 2, its specific capital cost, if nothing else is considered, could be up to 1.7 times more than a large unit for installed MW. Several factors could help to decrease that ratio; Carelli et al. [
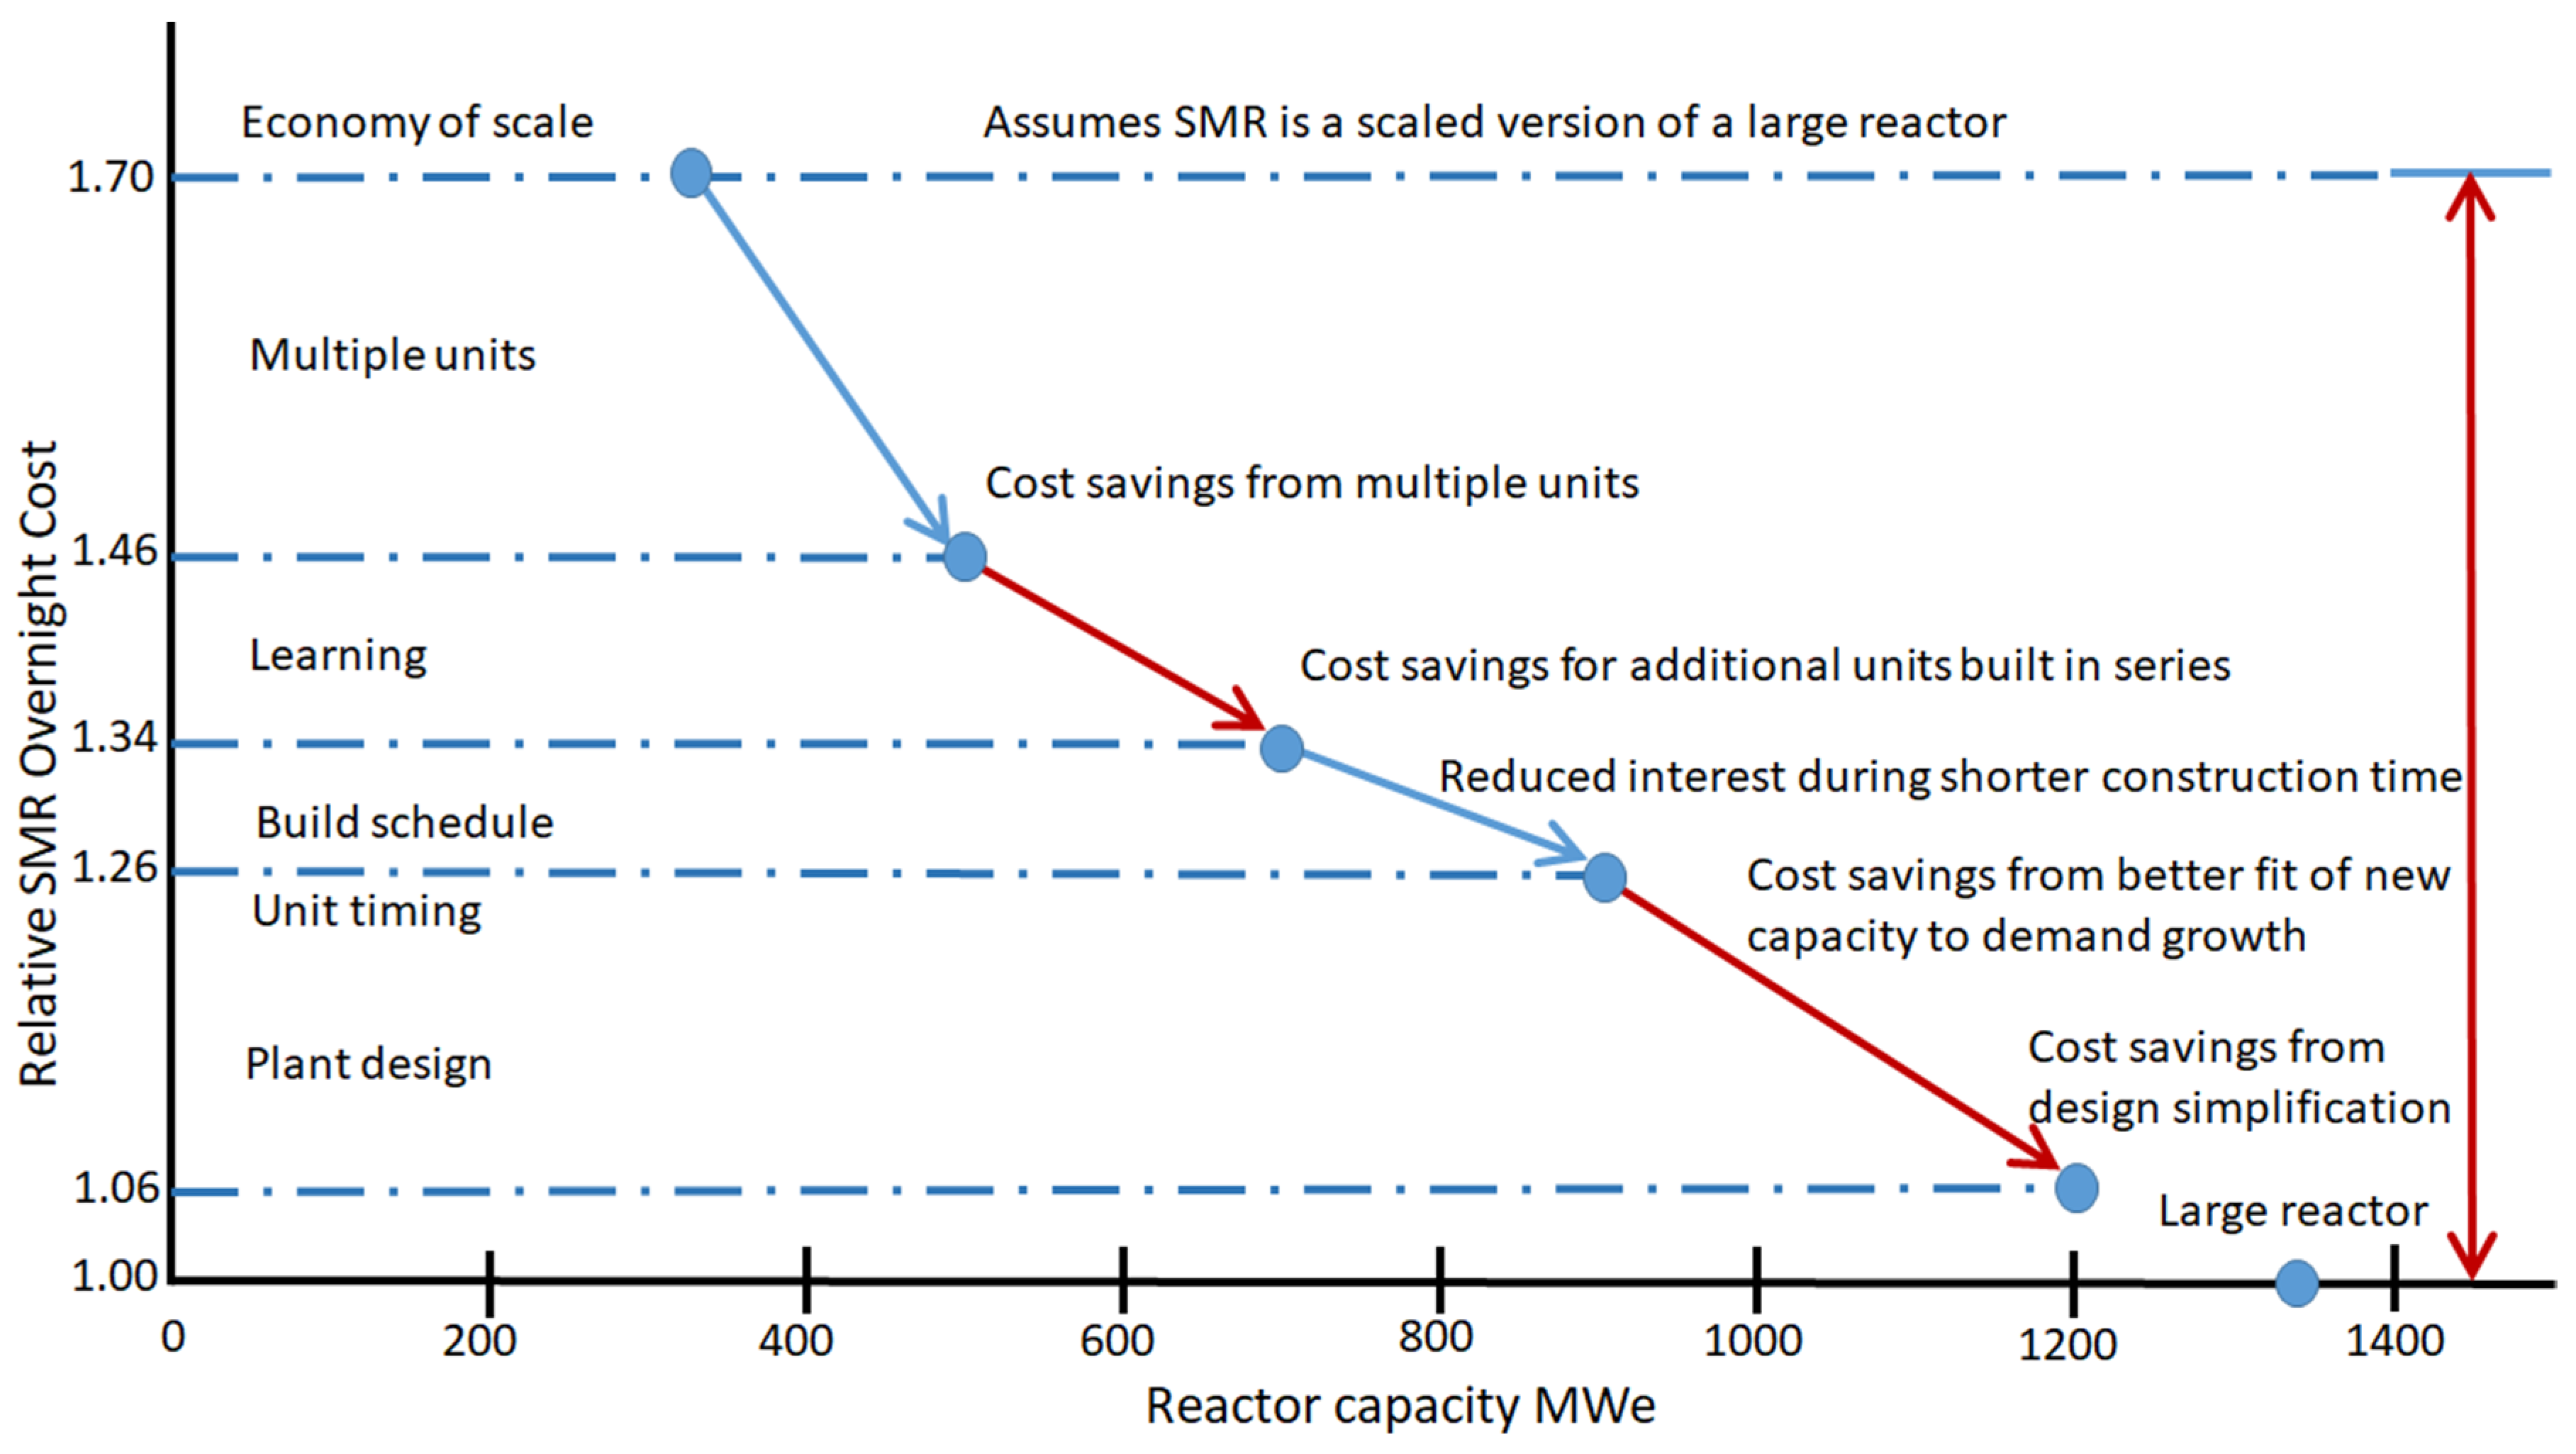
9] performed an investigation and came up with several factors and their impact on the SMR capital cost. These factors are:
a) Constructing multiple units in the same place could reduce costs because the site studies correspond to the same place, and only licensing permits will be required.
b) If the construction is done sequentially, the first operating plant can provide resources for the subsequent reactors in construction.
c) Minimizing construction time helps reduce capital interest.
d) Smaller size permits better planning to fit the electricity demand, reducing the required investment
e) By making modularization, the design is simpler, and the construction time is reduced.
Those cost-saving factors in an SMR can help reduce its specific capital cost to be only between 1.06 and 1.26 times higher than that of a large reactor for a nth-of-a-kind SMR (Carelli et al., 2010). Thus, SMRs are a competitive option with smaller upfront investment capital compared with a large reactor’s investment cost.
Figure 3 shows how these factors can decrease the cost ratio by kW between a large and small modular reactor.
In addition, Rothwell and Ganda [
11] performed a probabilistic analysis showing a likely SMR overnight capital cost higher than 5.9% of large reactors with a standard deviation of 20%, the comparison is for an nth-of-a-kind SMR.
Both analyses show a similar cost range of SMRs; thus, in the best case, SMR will cost between 1.06% and 1.26% more than a large reactor. At this time, it is too early to meet the saving factors considered for cost reduction. Just a very few SMR concepts are FOAK (first-of-a-kind) projects and still need to get to the position to be built in a series of units to get down to the points 1.26 and 1.06, but even if they get those points, they will be more expensive by installed MW than a large reactor.
Assuming that the cost of an nth-of-a-kind SMR is between 1.06 and 1.026 the following levelized electricity cost analysis will be performed to compare the economic performance of SMR vs large reactors. The “Projected Cost of Electricity Generation 2020” [
12] states an overnight cost in the USA of 4,250 US
$/kW for large nuclear reactors, thus the SMR overnight cost could be as low as 4,505 US
$/kW up to 5,355 US
$/kW.
3. Methodology
Levelized cost methodology [
13] starts by calculating the Levelized investment cost (LIC), where the “present value factor” (pvf) and a “capital recuperation factor” (
) are considered as follows:
where:
TEG is the average annual generation of electricity in MWh
PI is the cost of the investment per installed capacity in US$/MWe
i is the discount rate
N is construction time in years
wk is the share investment per year and
is the economic life of the plant
Fuel, Operation, and Maintenance do not depend on the discount rate; they are calculated at the present value
This analysis does not include operational information for SMR as a first approach; the costs will be the same as those for large reactors [
12].
Table 2 shows the data for the levelized cost analysis performed in this study.
The feasibility of a nuclear project depends on the selling electricity price, which varies worldwide for different reasons [
14].
Figure 4 shows electricity prices for selected OECD countries in 2019. In some of these countries, electricity is sold between 100 and 200 US
$/MWh. In this study, three electricity-selling prices, 100, 150, and 200 US
$/MWh, will comprise the analysis.
The assessed economic analysis considers the net present value, the internal rate of return, the benefit/cost, and the investment recovery time (IAEA, 1984). The difference between cash inflows and outflows defines the net present value and it must be positive for all cash flows to make the project feasible:
Figure 4.
Electricity prices 2023 [
14].
Figure 4.
Electricity prices 2023 [
14].
where:
: Net cash inflow during the period t
: Total initial investment cost
: Discount rate
t: Number of periods
The discount rate for which the net present value equals zero is the internal rate of return (IRR), to make a project feasible it must exceed the discount rate.
The cost-benefit indicator should indicate that the benefit is higher than the cost, and the recovery time should indicate the necessary time to recover the investment.
Table 4,
Table 5 and
Table 6 show the results of this economic analysis, considering three different electricity-selling prices and four different discount rates.
4. Results
Table 3 shows the levelized cost of electricity for large reactors and SMRs. The latter has two different overnight costs, 4,505 US
$/kW up to 5,355 US
$/kW. Four discount rates are used according to the document “Projected Cost of Electricity Generation 2020” (IEA,2020). As expected, a higher overnight cost results in a higher levelized cost of electricity, and the difference increases when the discount rate increases.
Table 4,
Table 5 and
Table 6 show the total levelized electricity cost (TLEC), the Internal Rate of Return (IRR), the Benefit/Cost, the Net Present Value (NPV), and the Recovery Time for different discount rates and different electricity selling prices for Large and small modular reactors
Economic indicators for a 100 US$/MWh electricity-selling price show, for either a large reactor or an SMR, that deployment is not feasible if the discount rate is 10%. It is worth mentioning that when the SMR overnight cost is 1.06 times the cost of a large reactor, it presents a higher internal return rate and better benefit/cost indicators than the large reactor, and the investment can be recovered in a shorter time. However, when the SMR overnight cost is 1.26 times the cost of a large reactor, the economic indicators are better in the large reactor for all the discount rates considered.
When the electricity-selling price in the project increases over 150 US$/MWh, the SMR, with an overnight cost of 1.06 times the cost of a large reactor, presents better economic indicators than the large reactor. For the SMR with an overnight cost of 1.26 times the cost of a large reactor, it starts to be more competitive, and it has a shorter recovery time of the investment
Table 4.
Economic indicators for large and SMR reactors for a 100 US$/MWh electricity-selling price.
Table 4.
Economic indicators for large and SMR reactors for a 100 US$/MWh electricity-selling price.
| Overnight Cost US$/kW |
DR
% |
TLEC
US$/MWh |
IRR
% |
Benefit/Cost |
NPV
Millions of US$
|
Recovery Time
Years |
Large Reactor
4,250 |
3 |
41.13 |
8.90 |
2.70 |
10,813.88 |
11.49 |
| 5 |
54.80 |
8.38 |
1.63 |
4,302.56 |
16.04 |
| 7 |
69.82 |
7.88 |
1.11 |
840.49 |
28.96 |
| 10 |
95.08 |
7.19 |
0.76 |
-1,921.48 |
Not recovery |
SMR
4,505 |
3 |
47.24 |
9.02 |
2.91 |
3,097.88 |
11.51 |
| 5 |
59.42 |
8.63 |
1.92 |
1,562.16 |
14.20 |
| 7 |
73.46 |
8.27 |
1.36 |
651.21 |
19.18 |
| 10 |
96.98 |
7.75 |
0.90 |
-186.47 |
Not recovery |
SMR
5,355 |
3 |
51.81 |
7.68 |
2.44 |
2,786.67 |
14.20 |
| 5 |
66.29 |
7.34 |
1.61 |
1,232.37 |
18.48 |
| 7 |
82.98 |
7.01 |
1.14 |
302.06 |
29.50 |
| 10 |
110.94 |
6.56 |
0.75 |
-566.16 |
Not recovery |
Table 5.
Economic indicators for large and SMR reactors for a 150 US$/MWh electricity-selling price.
Table 5.
Economic indicators for large and SMR reactors for a 150 US$/MWh electricity-selling price.
| Overnight Cost US$/kW |
DR
% |
TLEC
US$/MWh |
IRR
% |
Benefit/Cost |
NPV
Millions of US$
|
Recovery Time
Years |
Large Reactor
4,250 |
3 |
41.13 |
13.37% |
4.46 |
21,908.17 |
6.41 |
| 5 |
54.8 |
12.65% |
2.63 |
11,063.78 |
8.06 |
| 7 |
69.82 |
11.97% |
1.73 |
5,318.30 |
10.68 |
| 10 |
95.08 |
11.02% |
1.10 |
771.56 |
22.45 |
SMR
4,505 |
3 |
47.24 |
14.09% |
4.85 |
6,240.45 |
6.45 |
| 5 |
59.42 |
13.52% |
3.21 |
3,753.33 |
7.34 |
| 7 |
73.46 |
12.99% |
2.30 |
2,307.28 |
8.51 |
| 10 |
96.98 |
12.23% |
1.54 |
1,022.22 |
11.36 |
SMR
5,355 |
3 |
51.81 |
12.15% |
4.08 |
5,929.24 |
7.82 |
| 5 |
66.29 |
11.65% |
2.70 |
3,423.54 |
9.07 |
| 7 |
82.98 |
11.18% |
1.93 |
1,958.13 |
10.85 |
| 10 |
110.94 |
10.52% |
1.28 |
642.53 |
16.17 |
Table 6.
Economic indicators for large and SMR reactors for a 200 US$/MWh electricity-selling price.
Table 6.
Economic indicators for large and SMR reactors for a 200 US$/MWh electricity-selling price.
| Overnight Cost US$/kW |
DR
% |
TLEC
US$/MWh |
IRR
% |
Benefit/Cost |
NPV
Millions of US$
|
Recovery Time
Years |
Large Reactor
4,250 |
3 |
41.13 |
17.18% |
6.24 |
33,205.20 |
4.42 |
| 5 |
54.8 |
16.30% |
3.64 |
17,948.55 |
5.38 |
| 7 |
69.82 |
15.47% |
2.36 |
9,877.94 |
6.72 |
| 10 |
95.08 |
14.31% |
1.44 |
3,513.80 |
10.34 |
SMR
4,505 |
3 |
47.24 |
18.59% |
6.79 |
9,383.02 |
4.49 |
| 5 |
59.42 |
17.87% |
4.50 |
5,944.49 |
4.96 |
| 7 |
73.46 |
17.19% |
3.23 |
3,963.34 |
5.55 |
| 10 |
96.98 |
16.23% |
2.17 |
2,230.91 |
6.72 |
SMR
5,355 |
3 |
51.81 |
16.14% |
5.71 |
9,071.81 |
5.40 |
| 5 |
66.29 |
15.50% |
3.78 |
5,614.70 |
6.05 |
| 7 |
82.98 |
14.90% |
2.71 |
3,614.19 |
6.88 |
| 10 |
110.94 |
14.05% |
1.82 |
1,851.22 |
8.67 |
Finally, at a 200 US$/MWh electricity-selling price, SMRs are more competitive even though they cost 1.26 times the cost of a large reactor. If the discount rate is 10%, the SMR is a better option.
Thus, the possible role of an nth-of-a-kind SMR, assuming that it could have an overnight cost between 1.06 and 1.26 times the overnight cost of a large reactor, will depend on the project conditions. As the electricity-selling price increases and the discount rate increases, it could become a competitor. However, if the electricity-selling price and the discount rate decrease, it can be more of an economic complement
In addition, the SMR’s role will depend on the electricity capacity needs; if the SMR is economically viable as a competitor, several SMRs can be deployed to fill large electricity needs; if not, the choice is a large reactor.
5. Additional Issues
This study assesses the economic competitiveness of small modular reactors as a baseload capacity without any additional cogeneration capacity; further analysis is needed if an associated cogeneration capacity is included. There are still some issues to be solved in several countries about small modular reactors, these are licensing, nuclear infrastructure and industrial applications.
5.1. Licensing
Besides light water technology, there needs to be more knowledge and experience in using other technologies by the different regulatory bodies worldwide; thus, the licensing process could be longer for non-light water technologies.
Set a licensing process for a small modular reactor has several challenges to overcome, Sainati et al. [
15] set five topics to consider for licensing SMRs:
1. Typology of licensing approach
2. Duration and predictability of the Licensing Process
3. Regulatory harmonization and international certification
4. Manufacturing License
5. Ad Hoc legal and regulatory framework.
SMRs are promoted because their size and intrinsic designs could reduce the possibility of an accident and decrease the amount of radioactive material released if an accident occurs. These characteristics are adduced to make SMRs safer, such as reducing the emergency planning zone; this statement needs to be proven before being accepted by the regulatory body.
Countries developing SMR technologies are eager to demonstrate their technology and deploy new units in their own countries. They are also establishing a licensing process that can be shared with other countries through regulatory harmonization and international certification.
However, some countries developing SMR technologies count with large nuclear programs where the main additions are through large reactors. Again, SMRs are seen more as a complement and a possible export product for developing countries where SMRs can fit electricity needs.
Licensing processes for SMRs are still being developed, and many agreements with other countries must be reached before licensing and standards harmonization can be considered part of the technology being exported.
5.2. Nuclear Infraestructure
To guarantee the safe deployment and operation of a nuclear plant, guidelines, safety codes, and standards are required; they are the infrastructure for providing safety practices and environmental protection. The “Handbook on Nuclear Law” issued by the International Atomic Energy Agency provides guidelines for setting the legal framework needed by a country setting a nuclear program.
The legal framework will set the responsibilities of the operator and regulator of the nuclear facility. The regulatory body in each country will define the licensing process and provide the regulatory rules for nuclear facilities, where the primary goal is to care for public safety.
Technology that has already been proven is more accessible to assimilate than new technology, making it a longer process to set safety standards. Thus, licensing and the deployment of new reactor technologies will be more complicated and could be successful only if several countries pursue them and share resources to meet that goal.
For example, the fuel used by SMR light water reactors is very similar to the current fuel assemblies, where the supply chain is in place, and the design will vary, assuring their supply. Meanwhile, other fuel designs will struggle to set up a production line because they need sufficient clients to justify the investment and make a profit.
5.3. Industrial Applications
SMRs are proposed to be used in conjunction with many different industrial applications. These applications could make SMRs more economically competitive. However, for each application, the association must be analyzed as a guiding principle for the safety operation of the nuclear plant and the associated industrial processes. Every case must be assessed in a particular manner to prove its feasibility [
16]
5. Conclusions
This review assesses several economic indicators to determine the possible role of SMRs as a complement or a competitor of large nuclear reactors. Two referenced studies with different considerations show the possible overnight cost for nth-of-a-kind SMRs, which is between 1.06 and 1.26 of the overnight cost of a large reactor.
The analysis here shows that a higher overnight cost produces a higher levelized cost of electricity for an SMR. However, the deployment of a new reactor depends on different economic factors. These factors depend, among other things, on the discount rate and the electricity-selling price.
Obtained results for the assessed factors, net present value, internal return rate, benefit-cost, and recovery time, provide the possible role of an SMR. Thus, an nth-of-a-kind SMR, assuming that it could have an overnight cost between 1.06 and 1.26 times the overnight cost of a large reactor, will depend on the project conditions. As the electricity-selling price increases and the discount rate increases, it could be a competitor. However, if the electricity-selling price and the discount rate decrease it can be more of a complement from an economic point of view.
In addition, the role of the SMR will depend on the electricity capacity needs; if the selling electricity price and the corresponding discount rate provide the SMR quality of being a competitor; several SMRs can be deployed to fill large electricity needs. If not, the choice is a large reactor.
Size is also important, small modular reactors may be an option for low electricity demand in isolated regions and countries with small electrical grids where large reactors do not fit.
Implementing nuclear energy for newcomers and countries with electricity demands smaller than 300 MW per node is an opportunity to provide reliable energy to the grid with smaller financial risk. Still, the energy policy will decide whether to support nuclear energy for the particular country. If the decision is based on economics, it will be supported by the electricity selling price and the discount rate.
Finally, the pace of nuclear power addition requires both large and small reactors; they will have different roles in different countries. They could be an option that can be considered part of the solution to provide enough clean energy worldwide to meet the energy transition toward a world free of fossil fuels.
However, all the forecast scenarios considered here show the need to increase the deployment of new nuclear capacity, large or small units. If this new capacity only serves to keep the current nuclear capacity still, the economic competitiveness of nuclear energy must be proved. Countries like the USA, the Republic of Korea, and Mexico, among others countries, have an electricity selling price of around 100 US$/MWh; in these countries, it will require additional incentives or specific country policies to promote the addition of new nuclear build.
Funding
This research received no external funding.
Data Availability Statement
No new data were created or analyzed in this study. Data sharing is not applicable to this article.
Conflicts of Interest
The author declare no conflicts of interest.
References
- Goldberg, S.M.; Rosner, R. Nuclear reactors: Generation to Generation; Academy of Sciences USA: 2011.
- GE Hitachi Nuclear Energy. The ABWR Plant General Description. 2007.
- IAEA. Power Reactor Information System. 2023.
- US-NRC. Nuclear Reactors Licensing. 2024.
- 2050.
- IAEA. Nuclear Energy for a Net Zero World, 2021.
- IEA. World Energy Outlook 2022, 22. 20 November.
- IAEA. Advances in Small Modular Reactor Technology Developments. 2022 Edition.
- Carelli, M.D.; Garrone, P.; Locatelli, G.; Mancini, M.; Mycoff, C.; Trucco, P.; Ricotti, M.E. Economic features of integral, modular, small-to-medium size reactors. Prog. Nucl. Energy 2010, 52, 403–414. [Google Scholar] [CrossRef]
- Alonso, G.; Bilbao, S.; del Valle, E. Economic competitiveness of small modular reactors versus coal and combined cycle plants. Energy 2016, 116, 867–879. [Google Scholar] [CrossRef]
- Rothwell, G.; Ganda, F. Electricity generating portfolios with small modular reactors; Argonne National Laboratory: 2014.
- IEA. Projected Cost of Generating Electricity, edition 2020.
- IAEA, Expansion Planning for Electrical Generating Systems. A Guidebook, 1984.
- IEA. Electricity 2024—Analysis and Forecast to 2026, 24. 20 January.
- Sainati, T.; Locatelli, G.; Brookes, N. Small Modular Reactors: Licensing constraints and the way forward. Energy 2015, 82, 1092–1095. [Google Scholar] [CrossRef]
- Hidayatullah, H.; Susyadi, S.; Subki, M.H. Design and technology development for small modular reactors - Safety expectations, prospects and impediments of their deployment. Prog. Nucl. Energy 2015, 79, 127–135. [Google Scholar] [CrossRef]
|
Disclaimer/Publisher’s Note: The statements, opinions and data contained in all publications are solely those of the individual author(s) and contributor(s) and not of MDPI and/or the editor(s). MDPI and/or the editor(s) disclaim responsibility for any injury to people or property resulting from any ideas, methods, instructions or products referred to in the content. |
© 2025 by the authors. Licensee MDPI, Basel, Switzerland. This article is an open access article distributed under the terms and conditions of the Creative Commons Attribution (CC BY) license (http://creativecommons.org/licenses/by/4.0/).