Submitted:
30 January 2025
Posted:
31 January 2025
You are already at the latest version
Abstract
The paper develops the Mountain Precision Agriculture Index realized in 2020 at Oradea University – Doctoral School, Agronomy Specialization (Covaci-Sterpu, 2020). The article points the importance of entrepreneurship development, focusing on precision agriculture index in the mountain area. The reviewed papers show that the implementation of precision farming within an IoT framework in highland regions (ζ9) must be developed with attention to various essential aspects, precisely the elevation of the mountain (ζ1), the gradient of the terrain (ζ2), the mean local altitude (ζ3), signal degradation due to the mountainous topography (ζ4), access to internet connectivity (ζ6), the level of smart technology utilization (ζ7), and the concentration of active ICT businesses in the region (ζ8). The current paper show that ζ9 is dependent of other indices too, respectively the interaction with the intensity of geomagnetic storms or weather shortcomings (ζ5).The paper presents a specific map of the mountain peaks from the European area, highlighting the importance of the altitude in applying the precision agriculture index.The paper is a review of the articles Covaci, B., & Covaci, M. (2023). Mountain Index Business Model Nexus Internet of Things Development and Sustainability. J. Mountain Res. Vol. 18(2), 191-205 (https://doi.org/10.51220/jmr.v18i2.21) and Covaci, B., & Covaci, M. (2023). Systemic Practice in the Business Mountain Models nexus Internet of Things, Research Square (https://doi.org/10.21203/rs.3.rs-2682687/v1).
Keywords:
Business model
; IoT environment
; Mountain entrepreneurship
; Precision agriculture index
INTRODUCTION
Mountain Precision Agriculture Index (MPAI) represent a precision agriculture index developed for mountain area, using entrepreneurship coordinates. Various researchers show the importance of precision agriculture for modern rural development.
Due to the numerous problems in the mountainous area, with unforeseen situations being much more numerous than in the plain area, the mountain index of precision agriculture is essential in the maintenance and sustainability of highland zones.
Certain researchers consider that digital agriculture represents the application of advanced technologies, including sensors, robotics, and data analytics, to transform traditional agricultural practices into highly automated and efficient systems. The effective management of information and systematic data collection have played a pivotal role in driving technological advancements and digitalization, facilitating a shift in the workforce from unskilled to skilled sectors. Agriculture, as a critical industry for meeting human needs, has greatly benefited from the integration of robotic technologies, which have significantly reduced operating costs and delivery times while enhancing the accuracy and precision of agricultural practices. Contemporary robotic systems are being designed to streamline and improve autonomous processes such as weed control, field analysis, and the harvesting of crops. This scientific paper explores key engineering innovations and examines the evolving trends in the adoption of new technologies, emphasizing their potential to modernize and advance precision agriculture. (Petre et al., 2022)
Other researchers believe that analyzing the feasibility of implementing precision agriculture reveals that it is not a rigid or static system but rather a framework composed of multiple interrelated concepts, including:
- Designing precision agriculture strategies tailored to diverse soil types and varying climatic conditions.
- Adopting different management and marketing approaches to suit specific agricultural contexts.
- Employing varied solutions to mechanize agricultural operations effectively.
From an agronomic perspective, the foundational elements critical to the realization of precision agriculture include comprehensive databases encompassing soil structure and composition, climatic data, crop diseases and pests, weed species, and other relevant parameters.
From a technical standpoint, precision agriculture relies heavily on advanced soil mapping systems, which can be achieved through:
1. Mapping agricultural plots using location-detection technologies, such as GPS or non-satellite systems, in conjunction with specialized software tools.
2. Performing precision agricultural operations based on real-time terrain mapping to ensure optimal resource utilization.
3. Soil mapping based on soil properties, aimed at determining the precise quantities of fertilizer required for specific units of land, ensuring efficient and sustainable use of inputs.
4. Soil mapping focused on weed infestation levels and species, facilitating the design of precision agricultural interventions tailored to controlling specific weed populations.
5. Weed infestation assessment systems, which utilize image transmission and automated processing via specialized software to detect and map infested areas. These systems rely on attributes such as crop size and color to distinguish infested zones and identify weed species.
This framework underscores the integration of agronomic knowledge and technological advancements as essential for achieving the objectives of precision agriculture. (Ioan et al., 2006)
A group of professors show that compared to conventional agricultural machinery, agricultural robots in precision agriculture offer significant advantages, including enhanced flexibility, adaptability, and environmental sustainability. These benefits are attributed to advanced technologies such as spectral sensors and cameras, which enable the detection of weeds, pests, diseases, and nutrient deficiencies in soil or plants. Additionally, agricultural robots exhibit interoperability with other robotic systems or individuals, integrate soil analysis subsystems, and utilize sophisticated algorithms and navigation systems. Precision agriculture, as a relatively novel paradigm, has transformed traditional agricultural practices by incorporating processes of observation, measurement, analysis, and response. This evolution is further augmented by the integration of advanced intelligent systems, including innovative materials and products, state-of-the-art equipment and machinery, dynamic process control strategies, and tailored management approaches, all designed to achieve superior agricultural performance and sustainability. (Pandelea et al., 2018)
A complex study regarding precision agriculture, develop a structured research which present advanced technologies and equipment utilized in agricultural measurements that should include: artificial vision, spectroscopy, X-ray technology, magnetic resonance, chemical detection methods, wireless sensor networks and RFID sensors. The application of multispectral detection methods is essential for assessing crop nutritional levels by analyzing reflectance across multiple spectral bands. For effective monitoring, hyper- or multispectral equipment is preferred, as it enables the observation of large areas with high precision. To detect, identify, quantify, and monitor crop diseases, optical sensors are employed, with thermography, chlorophyll fluorescence, and multi- and hyperspectral sensors delivering particularly effective results. Challenges associated with mobile terrestrial systems in monitoring crop vegetation status can be mitigated through the adoption of aerial solutions. Some key limitations of land-based systems include:
- Potential damage to crops in areas traversed by the mobile system.
- Shocks and vibrations caused by uneven terrain.
- Misalignment of sensors with the intended measurement direction.
- Challenges in synchronizing data acquisition speed with the velocity of agricultural machinery.
- Limited scanning speed, reducing operational efficiency.
Aerial solutions address these obstacles by enabling more efficient, accurate, and less invasive monitoring of agricultural landscapes. (Afanas, 2022)
MATERIAL AND METHOD
In accordance with literature review from the introduction and others research, authors consider that the implementation of precision agriculture within an IoT framework in highland regions (ζ9) must be developed with attention to various essential aspects: the elevation of the mountain (ζ1), the gradient of the terrain (ζ2), the mean local altitude (ζ3), signal degradation due to the mountainous topography (ζ4), the interaction with the intensity of geomagnetic storms or weather problems (ζ5), access to internet connectivity in the mountain area (ζ6), the level of smart technology utilization in the mountain area (ζ7), and the concentration of active ICT businesses in the region in the mountain area (ζ8).
The precision agriculture mountain index focus on the deployment of precision agriculture within an IoT infrastructure in mountainous areas (ζ9), as showed in the published papers reviewed through this article, and the resulted equation is given below (Covaci, B., & Covaci, M. 2023a; Covaci, B., & Covaci, M. 2023b):
ζ9 = 1/ζ1 + 1/ζ2 + 1/ζ3 + 1/ζ4 + 1/ζ5 + ζ6/100+ ζ6/100+ ζ8/100
ζ1, ζ2, ζ3, ζ4, ζ5 are sub unitary indices, while ζ5, ζ6, ζ7 are expressed percentual.
The indices have been composed by the authors. The figure has been realized using drawings software in accordance with the data presented in the original papers.
This paper has been academic language revised using artificial intelligence.
RESULTS AND DISCUSSION
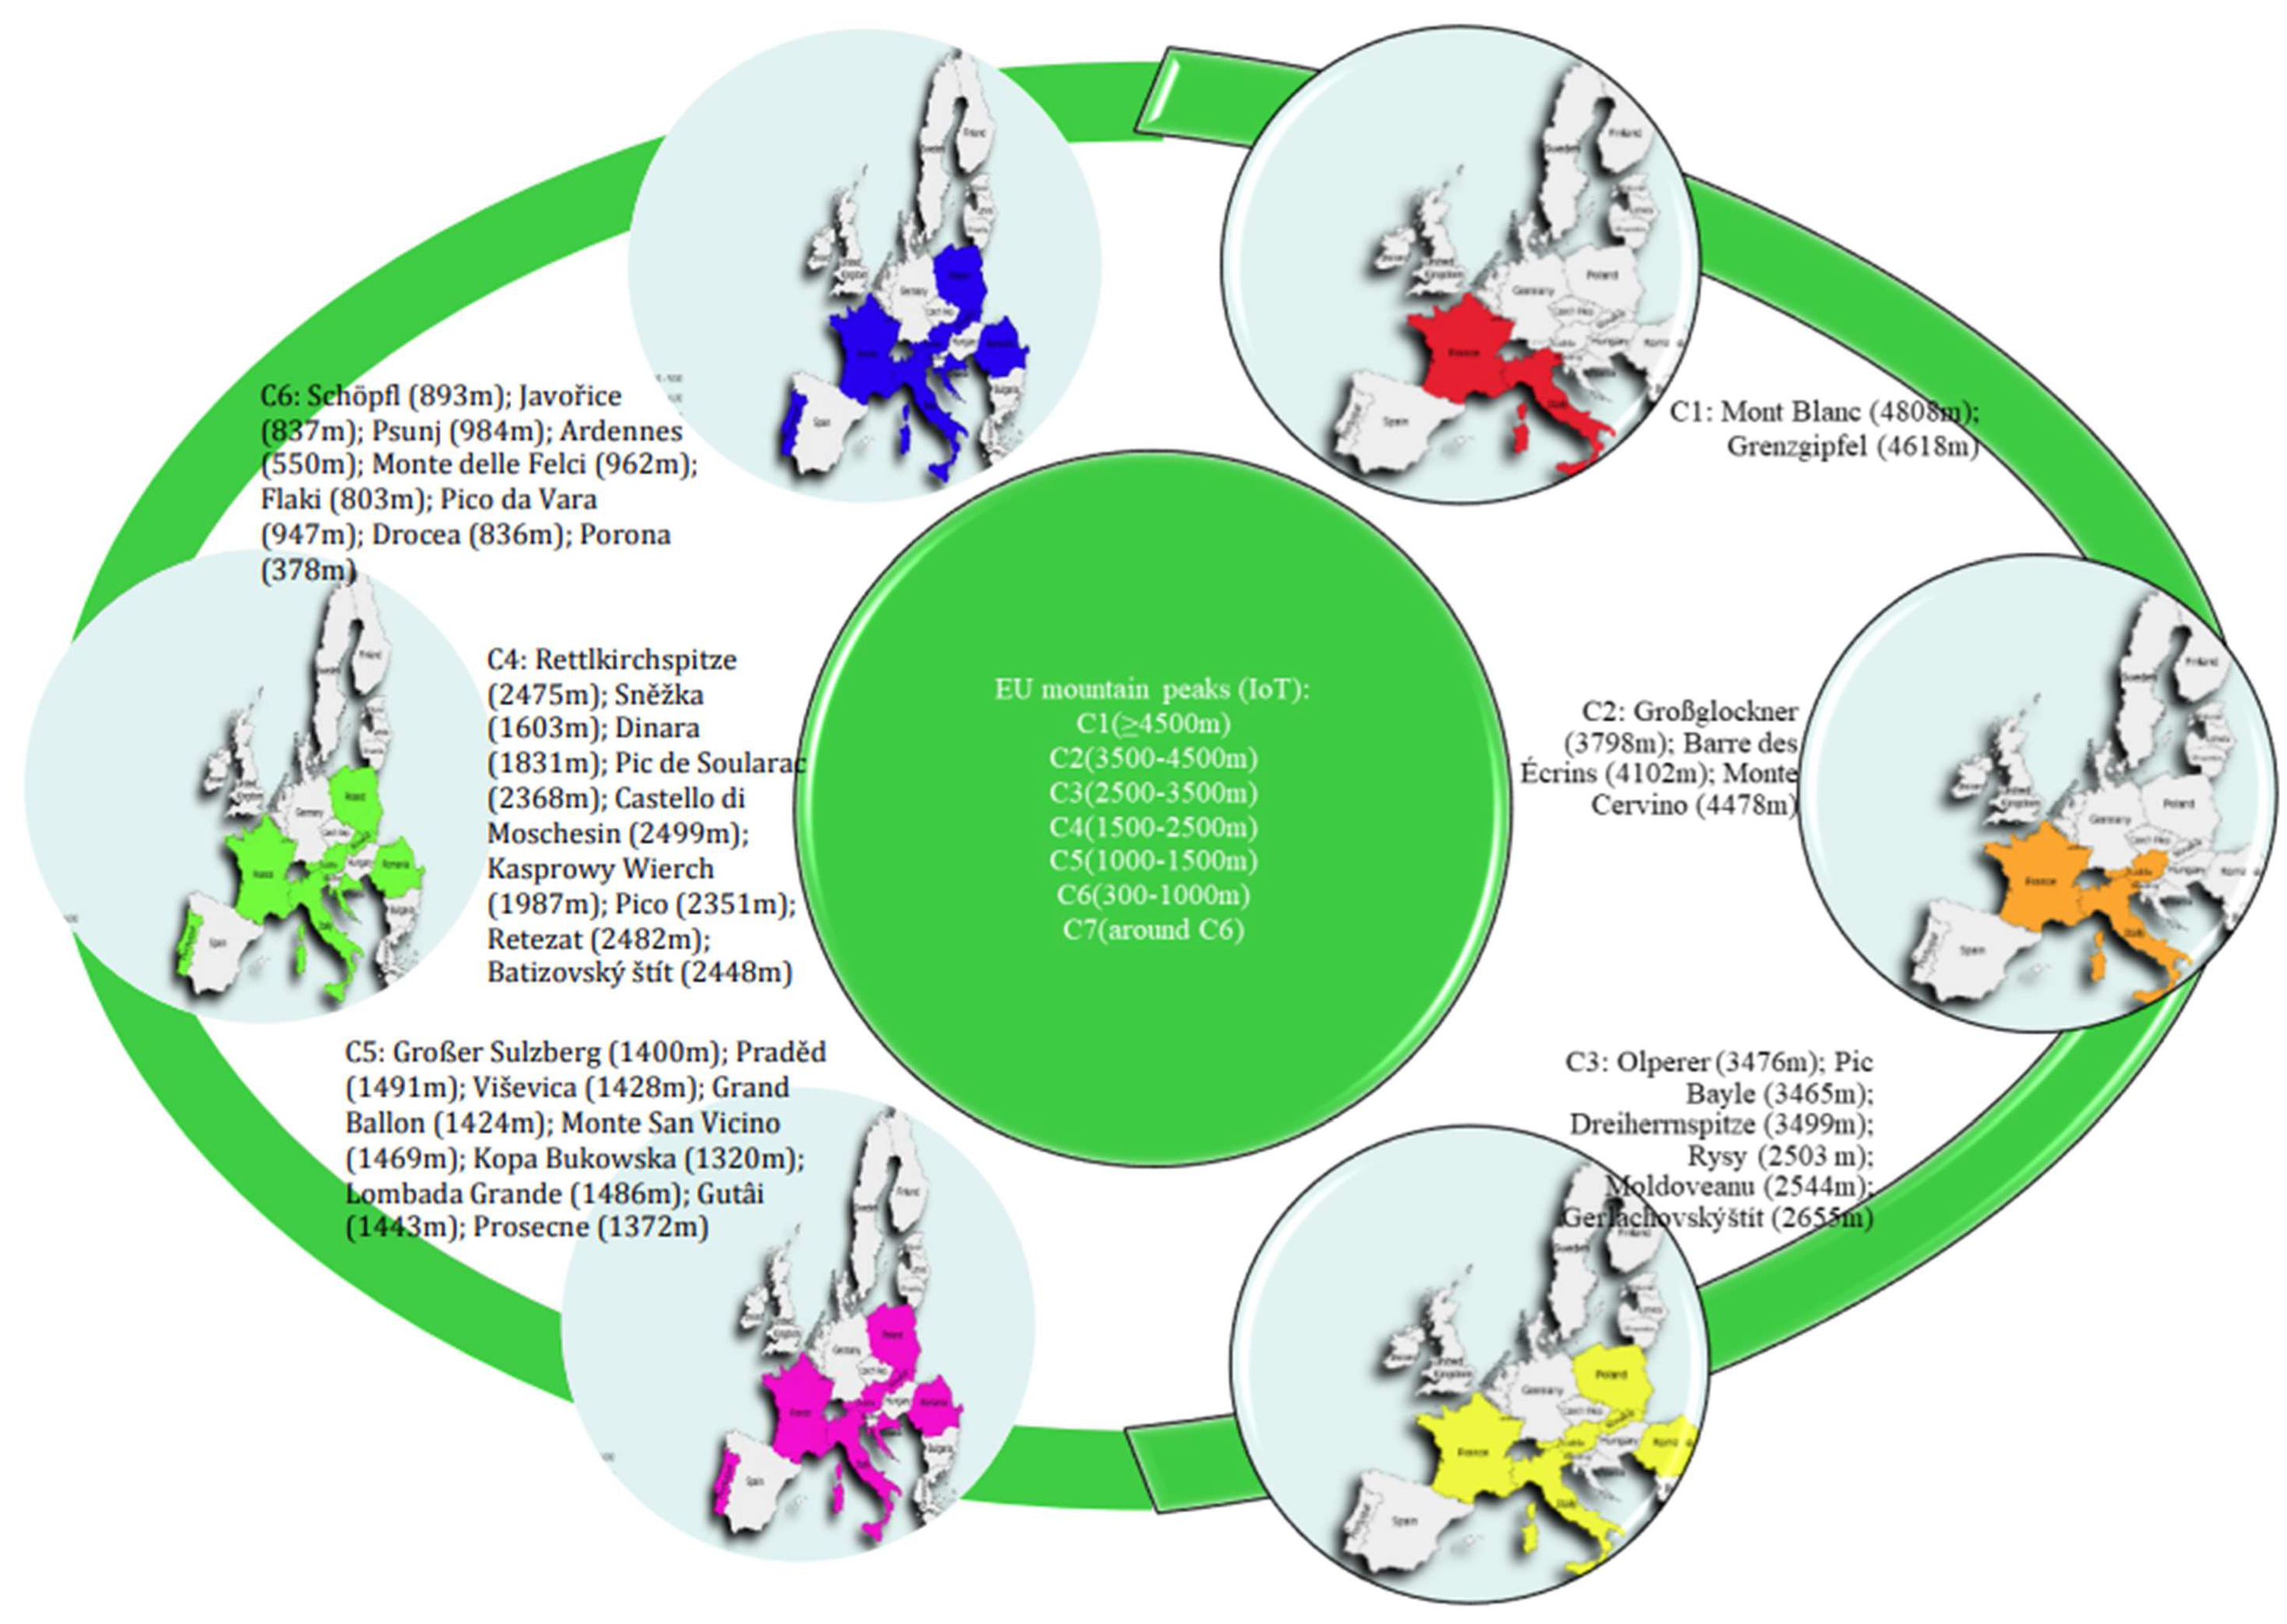
ζ1 develop the most significant part of the precision agriculture in the mountain area, and it has provided values (Figure 1).
Strictly for this indicator, precision agriculture mountain it is increasingly easier to apply gradually, from class 1 to class 7. For this indicator IoT comport different types of precision agriculture in the mountain area. In the European mountain zone, class 1 is marked on the figure with red, class 2 – orange, class 3 – yellow, class 4 – blue, class 5 – purple, and class 6 – blue.
Specific for the European area, from the figure can be understood that, according to FAO, precision agriculture is hardly to apply in some mountain areas from France and Italy (classes 1, 2, 3, 4), Austria (classes 2, 3, 4), Poland (classes 3, 4), Romania (classes 3, 4), Slovakia (classes 3, 4), Czech Republic (class 4), Croatia (class 4), Portugal (class 4).
From the 5th to 7th classes precision agriculture mountain become simpler to apply for all the European analyzed countries, respectively Austria, Czech Republic, Croatia, France, Italy, Poland, Portugal, Romania, Slovakia.
ζ2 is a percentual calculated value – a distance with maximum and minimum slopes, while ζ3 take into consideration maximum and minimum local altitudes.
The most important factor in the precision agriculture mountain index is ζ4, due to signal degradation, considering µ, D, Ic (Covaci, B., & Covaci, M. 2023a; Covaci, B., & Covaci, M. 2023b).
The mountainous region has numerous factors that contribute to signal attenuation, frequency and wavelength being the most significant.
As shown in the reviewed papers, the general attenuation index takes into consideration the signal degradation, as follow (Covaci, B., & Covaci, M. 2023a; Covaci, B., & Covaci, M. 2023b):
The explanations can be found in the original papers (Covaci, B., & Covaci, M. 2023a; Covaci, B., & Covaci, M. 2023b).
This review addresses dz (which was not properly explained in the previous papers).
For µv, dz represents the distance of the spectral frequency flux from beginning to end, while for μλ, dz refers to the distance of the spectral wavelength flux from start to finish.
While D represent the distance from the signal emission source to the signal reception source, Ic (Id in the original papers) is the concentration index of a forest.
Regarding ζ5, associated with the influence of geomagnetic storms (K-index) or with simple weather problems, it should be noted that this have fixed values. This indicator can be used or substituted for all types of storms. K-index is used to determine the magnitude of geomagnetic storms. Some researchers consider that weather index is associated with temperature, wind, precipitation, UV index, and fire danger (”Farmonaut’s weather intelligence for Ellerslie, Tasmania”) (Farmonaut, 2024).
The other indices outlined in the original papers remain unchanged, namely access to internet connectivity in the mountain region (ζ6), the level of smart technology adoption in the mountain region (ζ7), and the concentration of active ICT businesses in the mountain region (ζ8).
CONCLUSION
This paper presents a comprehensive review of the original Mountain Precision Agriculture Index based on articles published in 2023.
It underscores the critical role of spectral frequency flux and spectral wavelength flux in the development of the Mountain Precision Agriculture Index.
The study emphasizes the necessity of establishing a specialized precision agriculture index tailored to mountain regions, which are characterized by numerous challenges, notably high altitude.
Additionally, the paper identifies geomagnetic disturbances and meteorological conditions as significant constraints impacting agricultural precision in these areas.
Focusing on the European mountain regions, the paper highlights the strategic importance of fostering entrepreneurial activities through precision agriculture.
Specific emphasis is placed on efforts undertaken in Austria, the Czech Republic, Croatia, France, Italy, Poland, Portugal, Romania, and Slovakia, illustrating the regional commitment to advancing precision agriculture practices in mountainous terrains.
References
- Afanas, D. (2022). SKiM-Aplicatii ale Sistemelor Mobile fara Pilot in Agricultura de Precizie. https://hdl.handle.net/20.500.11766/68163.
- Boestel, J.; Francks, P.; Kim, C.H. (2013) Agriculture and economic development in East Asia: from growth to protectionism in Japan, Korea and Taiwan, Routledge: Abington.
- Bîrsan, G. , (2018). Research on the Structure, Auxology and Biodiversity of Forest Ecosystems Located on Extreme Resorts in the Bistrița Basin. Ph.D. Thesis Universitatea din Suceava. https://usv.ro/fisiere_utilizator/file/Doctorat/2018/11/birsan/Rezumat%20teza%20de%20doctorat%20-romana%20si%20lb%20straina-converted.pdf.
- Britannica, (2020). List of mountains. https://www.britannica.com/topic/list-of-mountains-2009175#ref327049.
- Cheng, Y.; Tao, F.; Xu, L.; Zhao, D. Advanced manufacturing systems: supply–demand matching of manufacturing resource based on complex net-works and Internet of Things. Enterprise Information Systems 2018, 12, 780–797. [Google Scholar] [CrossRef]
- Covaci, B.; Covaci, M. Mountain Index Business Model Nexus Internet of Things Development and Sustainability. J. Mountain Res. 2023, 18, 191–205. [Google Scholar] [CrossRef]
- Covaci, B.; Covaci, M. (2023b). Systemic Practice in the Business Mountain Models nexus Internet of Things, Research Square. [CrossRef]
- Covaci, B.; Brejea, R.; Covaci, M. Developing European Mountain entrepreneurship through employment sustainability. Realities and perspectives 2030, Annals of the Academy of Romanian Scientists Series Agriculture. Silviculture and Veterinary Medicine Sciences 2021, 10, 14. [Google Scholar]
- Covaci, B.; Covaci, M. (2023) A Common Trade Framework–Support for Agricultural and Food Products. Models of New Zealand, South Korea, and Romania Mountains. Research Square. [CrossRef]
- Covaci-Sterpu, B. (2020). Courses and Laboratory of ”Scientific Research Methodology” and ”Ethics and Academic Integrity”. Oradea University – Doctoral School.
- European Commission (2022a) Eurostat – Business demography statistics. https://ec.europa.eu/eurostat/statistics-explained/index.php?title=Business_demography_statistics#High_growth_enterprises.
- European Commission (2022b) Eurostat – Structural business statistics - Business demography statistics. https://ec.europa.eu/eurostat/web/structural-business-statistics/business-demography.
- Eurostat, (2020a). Business Demography Statistics. https://goo.gl/fpmXZA.
- Eurostat, (2020b). Regional GDP. https://goo.gl/EoyR38.
- Eurostat, (2020c). Structural Business Statistics. https://goo.gl/KMtkVV.
- Eurostat, (2021a). Business demography and high growth enterprise. https://ec.europa.eu/eurostat/web/products-datasets/product?code=urt_bd_hgn2.
- Eurostat, (2021b). Business demography by size class (from 2004 onwards, NACE Rev. 2) – Mountain region. https://ec.europa.eu/eurostat.
- Eurostat, (2022). Business demography and high growth enterprise by NACE Rev. 2 and NUTS 3 regions [bd_hgnace2_r3] https://ec.europa.eu/eurostat/databrowser/product/page/bd_hgnace2_r3.
- Farmonaut (2024).Precision Farming Weather Intelligence: Farmonaut’s Comprehensive Guide for Australian Farmers. https://farmonaut.com/australia/precision-farming-weather-intelligence-farmonauts-comprehensive-guide-for-australian-farmers/.
- Gao, J.; Li, J.; Yuan, K.; Liu, W. The Influence of South Korea's OFDI under the effects of multinational enterprises' investment motivations and host country institutions. Journal of Korea Trade 2022, 26, 1–22. [Google Scholar] [CrossRef]
- Gouk, S.Y. Linkages between agriculture and food industry, and food processing by farmers in Korea. Journal of Rural Development 2012, 35, 103–108. [Google Scholar]
- Hanafizadeh, P.; Mehrabioun, M. , A Systemic framework for green business model design and development-Part B: Practical Perspective. Systemic Practice and Action Research 2020, 33, 639–674, https://link.springer.com/article/10.1007/s11213-019-09501-z. [Google Scholar] [CrossRef]
- Hearn, G.; Metcalfe, A. (1995) Spectral analysis in engineering: concepts and case studies. Butterworth-Heinemann, Elsevier: Oxford OX / Burlington MA, 122.
- International Organization for Standardization – ISO, (1998). Thermal insulation - Heat transfer by radiation - Physical quantities and definitions (ISO 9288:1998) 1-17: 1989. https://www.iso.org/standard/16943.html.
- Ioan, T.; Victor, V.; Petru, C. (2006). Studii privind conditiile de implementare a conceptului de agricultura de precizie. Lucrari stiintifice USAMV Iasi - Seria Horticultura.
- Kang, H.M.; Choi, S.I.; Kim, J.S.; Jeong, I.S.; Oh, S.W.; Lee, S.H.; Sato, N. A study on the development project of mountain settlements in Korea. Journal of the Faculty of Agriculture, Kyushu University 2005, 50, 295–311. [Google Scholar] [CrossRef]
- Kelly, S.; Smith, W. Marginality, adaptation and farming in the New Zealand high country, Journal of Alpine Research. Revue de géographie alpine 2012, 100. [Google Scholar]
- Kelsey, J. (2015) Reclaiming the future: New Zealand and the global economy, Bridget Williams Books.
- Kim, K.P. The neoliberal strategy of south Korean conglomerates. World Review of Political Economy 2022, 13, 97–117. [Google Scholar] [CrossRef]
- Kook, J.H.; Choi, S.G. A Comparative Study of Household Consumption Patterns and Optimal Commodity Tax Rates between Korea and Japan. Korean Economic Review 2022, 38, 479–507. [Google Scholar]
- Kramp, T.; Kranenburg, R.; Lange, S. (2020). Introduction to the Internet of Things. In: A. Bassi et al. (eds) Enabling Things to Talk. Springer, Berlin – Heidelberg, 1-10: 2013. [CrossRef]
- Land Cover Database (July 1, 2009) The New Zealand Land Cover Database - Ministry for the Environment. Archived from the original on 14 March 2011, Retrieved 26 April 2011.
- Lee, I. The Internet of Things for enterprises: An ecosystem, architecture, and IoT service green business model. Internet of Things 2019, 7, 100078, https://www.sciencedirect.com/science/article/abs/pii/S2542660519301386. [Google Scholar] [CrossRef]
- Lee, Y.; Hemmert, M. Performance implications of combining innovation and internationalization for Korean small-and medium-sized manufacturing firms: an exploration–exploitation perspective. Asian Business and Management 2021, 1. [Google Scholar] [CrossRef]
- Liesbet, J.; Dewitte, O.; Poesen, J.; Delvaux, D.; Thiery, W.; Kervyn, M. The Rwenzori Mountains, a landslide-prone region? Landslides 2020, 13, 519–536, https://link.springer.com/article/10.1007/s10346-015-0582-5. [Google Scholar]
- Liu, Q.; Wu, Y.; Jun, Z.; Li, X. Deep learning in the information service system of agricultural Internet of Things for innovation enterprise. The Journal of Supercomputing 2021, 78, 5010–5028, https://link.springer.com/article/10.1007/s11227-021-04070-2. [Google Scholar] [CrossRef]
- López-i-Gelats, F. (2013) Is mountain farming no longer viable?, In The future of mountain agriculture, 89-104. Springer: Berlin, Heidelberg.
- Macrotrends (2022) Korea. https://www.macrotrends.net/countries/KOR/south-korea/surface-area-km.
- Mann, S. (Ed.) (2013) The future of mountain agriculture. Springer: Berlin/Heidelberg, 176. https://link.springer.com/book/10.1007/978-3-642-33584-6.
- MathWorks (2022) Tukeywin - Tukey (tapered cosine) window. https://www.mathworks.com/help/signal/ref/tukeywin.html.
- Melyukhina, O. (2011-02-10) Risk Management in Agriculture in New Zealand, OECD Food Agriculture and Fisheries Papers. OECD Publishing, Paris, 42. [CrossRef]
- Moller, H.; MacLeod, C.J.; Haggerty, J.; Rosin, C.; Blackwell, G.; Perley, C.; … Gradwohl, M. Intensification of New Zealand agriculture: implications for biodiversity. New Zealand Journal of Agricultural Research 2008, 51, 253–263. [Google Scholar] [CrossRef]
- Murray, N.J.; Phinn, S.R.; DeWitt, M.; Ferrari, R.; Johnston, R.; Lyons, M.B.; Clinton, N.; Thau, D.; Fuller, R.A. The global distribution and trajectory of tidal flats. Nature 2019, 565, 222–225. [Google Scholar] [CrossRef]
- Nayek, S.; Gupta, S.; Pobi, K.K. , Physicochemical characteristics and trophic state evaluation of post glacial mountain lake using multivariate analysis. Global Journal of Environmental Science and Management https://www.gjesm.net/article_32470.html. 2018, 4, 451–464. [Google Scholar]
- New Zealand Government (2022) Mountains (New Zealand). https://anyquestions.govt.nz/many-answers/mountains-new-zealand#:~:text=Aotearoa%20New%20Zealand%20is%20a,Island%20being%20covered%20in%20mountains.
- Nordregio, (2020). Mountain Areas in Europe: Analysis of mountain areas in EU member states, acceding and other European countries. Nordregio Publishing House: Stockholm (European Commission contract No 2002.CE.16.0.AT.136). https://ec.europa.eu/regional_policy/sources/docgener/studies/pdf/montagne/mount1.pdf.
- OECD (2022) Dataset: Trade in Value Added (TiVA) 2018 ed., Principal indicators - EXGR: Gross exports, EXGR_DVAFXSH: Domestic value added embodied in foreign exports as share of gross exports, EXGR_DVASH: Domestic value added share of gross exports, EXGR_FNLDVASH: Domestic value added in exports of final products as a share of total gross exports, EXGR_FVASH: Foreign value added share of gross exports, EXGR_INTDVASH: Domestic value added in exports of intermediate products as a share of total gross exports. https://stats.oecd.org/OECDStat_Metadata/ShowMetadata.ashx?Dataset=TIVA_2018_C1andShowOnWeb=trueandLang=en.
- Pandelea, M.; Vladareanu, L.; Cretu, C.; Iliescu, M. (2018). Studiu privind Importanta si Rolul Inteligentei Artificiale în Agricultura de Precizie. Lucrari Stiintifice, 7. Lucrari Stiintifice Seria I, Vol. IV, 2018 Management si Dezvoltare Rurala http://www.managcalarasi.usamv.ro/files/LUCRARI%20STIINTIFICE%20Seria%20I,%20Vol%20IV%202018%20CALARASI.pdf#page=7.
- Partap, T. Hill Agriculture: Challenges and Opportunities. Ind. Journal of Agri.Econ. (Jan.-March 2011).. 2011, 66. [Google Scholar]
- Patras, R. (2022) The voice of the third party: Brexit in Romanian ‘migrature', In Brexit and the migrant voice, Routledge: Abington, 177-191.
- Petre, A.A.; Vanghele, N.; Matache, A.; Grigore, I.A.; Vladutoiu, L. (2022). Research on the practices and application of robots in the context of the digitization of agriculture. International Symposium ISB-INMA THE Agricultural and Mechanical Engineering https://www.cabidigitallibrary.org/doi/full/10.5555/20230113245.
- Rad, N.N.; Mohtashami Borzadaran, G.R.; Yari, H. , Estimation of inequality indices based on ranked set sampling. Hacettepe Journal of Mathematics and Statistics https://dergipark.org.tr/en/pub/hujms/issue/38121/440366. 2018, 47, 709–720. [Google Scholar] [CrossRef]
- Rey, R. (coord.) (2020). O viziune de dezvoltare sustenabilă – montană – axată pe valorificarea „produselor montane”, de calitate. Creșterea importanței zonelor montane în conjunctura post-coronavirus, Centrul de Economie Montană al Academiei Române.
- Rey, R. New challenges and opportunities for mountain agri-food economy in South Eastern Europe. A scenario for efficient and sustainable use of mountain product, based on the family farm, in an innovative, adapted cooperative associative system–horizon 2040. Procedia Economics and Finance 2015, 22, 723–732. [Google Scholar]
- Reytar, K.; Hanson, C.; Henninger, N. (2014) Indicators of sustainable agriculture: a scoping analysis, World Resources Institute, Washington DC, 1-20.
- Romeo, R.; Vita, A.; Testolin, R.; Hofer, T. (2015). Mapping the vulnerability of mountain peoples to food insecurity. FAO Publishing House: Rome. http://www.fao.org/3/i5175e/i5175e.pdf.
- Shakya, B.; Schneider, F.; Yang, Y.; Sharma, E. A multiscale transdisciplinary framework for advancing the sustainability agenda of mountain agricultural systems. Mountain Research and Development 2019, 39, A1–A7. [Google Scholar] [CrossRef]
- Shin, Y.; Hur, J. Effects of financial soundness on export activities: Evidence from firm-level data of Korea. Global Economic Review 2022, 51, 175–194. [Google Scholar] [CrossRef]
- Siemens (Aug 29, 2019) Window Types: Hanning, Flattop, Uniform, Tukey, and Exponential, SimCenter, https://community.sw.siemens.com/s/article/window-types-hanning-flattop-uniform-tukey-and-exponential.
- Statista, (2020). Smart Home Report 2020 - Smart Appliances. https://www.statista.com/study/50587/smart-home-report-smart-appliances/.
- TradeMap – International Trade Center (2022) Trade statistics for international business development. https://www.trademap.org/Index.aspx.
- Trademap, (2021). Trade statistics for international green business development. https://www.trademap.org/.
- Trifu, A.; Lupu, D.V. Romania's international exposure in the context of the crisis. Anuarul Universităţii Petre Andrei Iaşi - Fascicula Drept, Ştiinţe Economice, Ştiinţe Politice. Lumen 2010, 1, 109–120. [Google Scholar]
- Vimal, S.; Harold Robinson, Y.; Kadry, S.; Viet Long, H.; Nam, Y. , IoT Based Smart Health Monitoring with CNN Using Edge Computing. Journal of Internet Technology 2021, 22, 173–185, https://jit.ndhu.edu.tw/article/view/2471. [Google Scholar]
- Weisstein, E.W., (2015). Slope, MathWorld-A Wolfram Web Resource. https://www.researchgate.net/publication/246780128_MathWorld-A_Wolfram_Web_Resource.
- World Bank – WITS (2022a) Global Preferential Trade Agreements Database. Agriculture Index. https://wits.worldbank.org/gptad/database_landing.aspx.
- World Bank – WITS (2022b) International Trade Indicators. https://wits.worldbank.org/country-indicator.aspx.
- World Trade Organization – WTO (2022) World Trade Organization Good Schedules - Consolidated Tariff Schedules for South Korea and New Zealand. https://goods-schedules.wto.org/.
- Wright, W.; Wilkinson, B.; Cropper, W. , Development of a GPS forest signal absorption coefficient index. Forests https://www.mdpi.com/1999-4907/9/5/226. 2018, 9, 1–11. [Google Scholar] [CrossRef]
- Wu, J.; Yang, Q.; Li, Y. Partitioning of Terrain Features Based on Roughness. Remote Sensing https://www.mdpi.com/2072-4292/10/12/1985. 2018, 10, 1–21. [Google Scholar] [CrossRef]
- Wu, S.; Hsu, C.; Xia, Z.; Zhang, J.; Wu, D. , Symmetric-bivariate-polynomial-based Lightweight Authenticated Group Key Agreement for Industrial Internet of Things. Journal of Internet Technology https://jit.ndhu.edu.tw/article/view/2432. 2020, 21, 1969–1979. [Google Scholar]
- Yin, Z.; Hwan Choi, C.; Ko, J. Economic and non-economic determinants of environmental sustainability in the long run: Evidence from G20 Economies. Journal of Korea Trade 2022, 26, 1–19. [Google Scholar] [CrossRef]
- Zhang, X.E.; Teng, X. Effects of environmental orientation on agricultural enterprises’ performance: mediation and moderation analyses. Asian Business & Management 2022, 1. [Google Scholar]
Figure 1.
European mountain peaks from ζ9, FAO classes (c) classifications (Britannica, 2020).
Disclaimer/Publisher’s Note: The statements, opinions and data contained in all publications are solely those of the individual author(s) and contributor(s) and not of MDPI and/or the editor(s). MDPI and/or the editor(s) disclaim responsibility for any injury to people or property resulting from any ideas, methods, instructions or products referred to in the content. |
© 2025 by the authors. Licensee MDPI, Basel, Switzerland. This article is an open access article distributed under the terms and conditions of the Creative Commons Attribution (CC BY) license (http://creativecommons.org/licenses/by/4.0/).
Copyright: This open access article is published under a Creative Commons CC BY 4.0 license, which permit the free download, distribution, and reuse, provided that the author and preprint are cited in any reuse.


