
Submitted:
14 February 2025
Posted:
18 February 2025
You are already at the latest version
Abstract
The paper is a plea in favor of statistical quantitative analyzes in the modeling of the mountain economic development. The arguments in favor of the use of statistics in the modeling of mountain businesses reside in the need to map the present to establish future trends. The future is built through constructs, and abstractions made only conceptually intuitively - without quantitative data validation - can ensure sustainability or failure in predicting the trends of the current society. Science and reality in the 21st century are metamorphosing more rapidly and chaotically than until now, especially against the background of the insertion of new technologies in contemporary society, the dynamics of various phenomena being difficult to predict without applicative substantiation. As a model, the paper presents statistical analyzes and econometric models carried out at the European and national level for mountain entrepreneurship in the EU, related to the supporting sectors of mountain agriculture, respectively industry, services, and the quaternary sector. The authors of the study carried out the analysis for the indicators Population of active enterprises in t - number, Establishments of enterprises in t - number, Dissolutions of enterprises in t - number, Newly established enterprises in t-3 that survived until t - number. The indicators presented, analyzed for the period 2008-2018, and forecasted for the period 2019-2026, integrate the mountain business environment into the considerable development of the demographics of European businesses. The results of the paper demonstrate the importance of using statistical analyzes and econometric models in establishing the reality and forecasting mountain economic phenomena. Specific to the European business environment, the results of the paper present a general picture favorable to mountain entrepreneurship.
Keywords:
development and modelling
; mountain statistic
; statistical quantitative analyzes
1. Introduction
The modeling of the mountain development involves the implementation of business intelligence in the development of mountain areas through the integrated application of different methods of analysis and forecasting. (Stettler and Mayer 2023; Liu et al 2022; Krutina and Faltová Leitmanová 2005; Covaci B and Covaci M 2023a; Covaci B and Covaci M 2023b)
Mountain science, a construct in full ascent in the last 20 years, is solidifying its position as a science – moving from a paradigm to a complex system of a scientific type – which is why the quantitative modeling of trends gives decisive character to new types of development. Qualitative analysis, mainly exploratory, is interesting from the perspective of ease of application in the study of the mountain economy, but the demographic trends of mountain businesses can be calibrated mainly through statistical analysis, mathematical modeling, and econometrics. The demography of mountain business sets the direction of the mountain economy, the entrepreneurial environment being the one that predominantly supports the mountain areas of the world. Therefore, statistical analysis represents a strong argument for the sustainable and sustainable development of the mountain economy. Applied research in the mountain economy spectrum requires continuous integration of new data into a specific analysis and ensures the balance between data quality and quantity. Statistical analyzes lend objectivity to models, but more than that they ensure transparency, consensus, impartiality, and correspondence with observable reality. (David et al 2017)
The economic growth models of the second half of the 20th century, especially related to aggregate productivity, highlighted apparent contradictions related to new technologies. For this reason, both theorists and practitioners began to avoid statistical analysis - so necessary in mountain science - a development that led to the deceleration of productivity measurement, consequently providing adequate information for the real economy. The stagnation did not stop only at the informational level, but also at the application level, noting that even productivity was considerably reduced due to the non-use of statistics in the modeling of the economic development (Brynjolfsson et al 2017). This tendency, weakly felt in emerging economies, provides clearer support for the sustainability of productivity than in the case of developed economies. From the perspective of the implications of new technologies on the modeling of the economic development, it seems that there is a resumption of the Solow paradox (1957/1987) - which postulates that new transformative technologies appear continuously that must be integrated into the economic modeling - but in the productivity statistics, it is not found, at their true magnitude, their added value (Brynjolfsson et al 2017). In this context, the discordance between the effect of new technologies and the actual productivity observable in the real economy requires the dynamism of statistical measurement. In other words, the econometric models - especially regarding the mountain area - require a more authentic dynamism, so that their effectiveness in the real economy is more obvious.
Solutions for high accuracy of statistical data and resulting models refer to the need for correct use of real data, balancing theory with practice, incorporating the effective use of statistical data in the mountain business environment, creating dynamic models that allow metamorphosis in real-time depending on the existing realities at the level of the studied mountain area, the application of autoregressive models that consider the flattening of the gap between the statistical significance and the existing reality, etc. (Hoerl and Snee 2020)
Risk and uncertainty, chaotic realities of today's mountain economy, can be predicted through statistical tools and methods, which provide deep insight into the data and realities of mountain business. Statistical analysis is relevant in any phase of data modeling, such as data on business initiation and development, data exploration, data analysis and model building, model validation, representation, and reporting. (Weihs and Ickstadt 2018)
In an increasingly informationally polarized world, the notion of metadata presents itself as a means of addressing the problem of pluralities. The integration of mountain realities in statistics, especially socio-economic ones, represents the main problem of sustainable development models of mountain areas. Data quality means more than aspects of institutional independence (guaranteed by public funding and law), requiring an integrated theoretical approach that provides realistic models for intelligent manufacturing development. (Diaz-Bone and Horvath 2021)
The resistance of some researchers to statistical analysis, mathematical modeling, and econometrics is justified in terms of the errors of the economic models made so far, but compared to the qualitative models of the economy, the quantitative models confer a lower degree of error. Errors in well-built and calibrated econometric models are insignificant (below 3%), meaning their use confers greater credibility than other models. Consequently, the best variants of economic modeling also call on the statistical-mathematical apparatus.
2. Material and Methods
The materials used in support of the plea for statistical research in the mountain economy refer to the exploratory research of similar and adjacent works to this research, as well as to the quantitative research on important indicators reported in Eurostat concerning mountain business demography. Statistical analyzes and econometric models were obtained by simulating the data in SPSS, the results being validated without significant errors.
The indicator Population of active enterprises in t - number, the most relevant indicator for the mountain business environment, shows the importance of developing the business environment through the application of mountain policies that support the economic entities created so that they last at least three years after their establishment. At the same time, boosting the mountain business environment must integrate start-up policies so that mountain start-ups and spin-offs become a reality, not just a wish. Another sustainable aspect of the mountain business environment considers the degree of occupation as defining for the sustainable development of mountain areas. The employment used as a threshold for the mountain business environment should be based on the annual average number of persons for the period of operation of the enterprise.
The population of active enterprises is of particular importance also because the other mountain indicators develop according to it. This indicator also shows mountain entrepreneurial trends, particularly by capturing the speed and extent of the shift to types of economies needed in mountain areas, such as service-based or information and communication technology-based economies. However, even if there is a relatively large number of formations and dissolutions in a given period, the number of active enterprises in that period may be higher than in previous periods. This development may only reflect increasing volatility, not necessarily a true increase in the economic importance of this category. For this reason, it is recommended that indicators related to the population of active enterprises be permanently accompanied by indicators on establishment, dissolution, and employability.
These indicators, especially the Population of Active Enterprises, provide both a short-term and a medium-term view of the evolution of the mountain business environment. (OECD 2012)
The statistical analysis and forecasting models used specifically for each case refer to econometric smoothing methods, such as Holt-type simple exponential flattening, autoregressive time series adaptation through Arima-type moving average, and Brown's primary exponential adjustment. The statistical descriptors analyzed for each indicator are Average, SE (standard error), Minimum, Maximum, respectively the 5th and 10th percentiles, and the reported values are for stationary R-square, R-square, RMSE (root mean square error square root of the mean), MAPE (mean absolute percentage error), MaxAPE (mean maximum absolute percentage error), MAE (mean absolute error), MaxAE (mean absolute error – the maximum error of the absolute mean), Normalized BIC (Normalized Bayesian Information Criterion – normalized Bayesian information criterion).
According to Eurostat, the statistical models used to analyze and forecast the indicator Population of active enterprises in t – number (I1) in mountain area are for Austria Model_1 Holt, Bulgaria Model_2 ARIMA(0,0,0), Croatia Model_3 Holt, Czech Republic Model_4 ARIMA(0,0,0), France Model_5 Holt, Italy Model_6 ARIMA(0,0,0), Poland Model_7 Holt, Portugal Model_8 Brown, Romania Model_9 Holt, Slovakia Model_10 Brown, Spain Model_11 Holt, Sweden Model_12 ARIMA(0,1,0), Switzerland Model_13 Brown.
The statistical models used for the analysis and forecasting of the indicator Business establishment in t – number (I2) in mountain area are for Austria Model_1 Holt, Bulgaria Model_2 Holt, Croatia Model_3 Simple, Czech Republic Model_4 ARIMA(0,0,0), France Model_5 Holt, Italy Model_6 Holt, Poland Model_7 ARIMA(0,2,0), Portugal Model_8 ARIMA(0,0,0), Romania Model_9 Holt, Slovakia Model_10 ARIMA(0,0,0), Spain Model_11 ARIMA(0,0,0), Sweden Model_12 ARIMA(0,0,0), Switzerland Model_13 Brown.
The statistical models used for the analysis and forecasting of the indicator Dissolution of enterprises in t – number (I3) in mountain area are for Austria Model_1 ARIMA(0,0,0), Bulgaria Model_2 ARIMA(0,0,0), Croatia Model_3 Holt, Czech Republic Model_4 Holt, France Model_5 ARIMA(0,0,0), Italy Model_6 ARIMA(0,0,0), Poland Model_7 Holt, Portugal Model_8 Holt, Romania Model_9 Holt, Slovakia Model_10 Holt, Spain Model_11 ARIMA(0,0,0), Sweden Model_12 ARIMA(0,0,0), Switzerland Model_13 ARIMA(0,0,0).
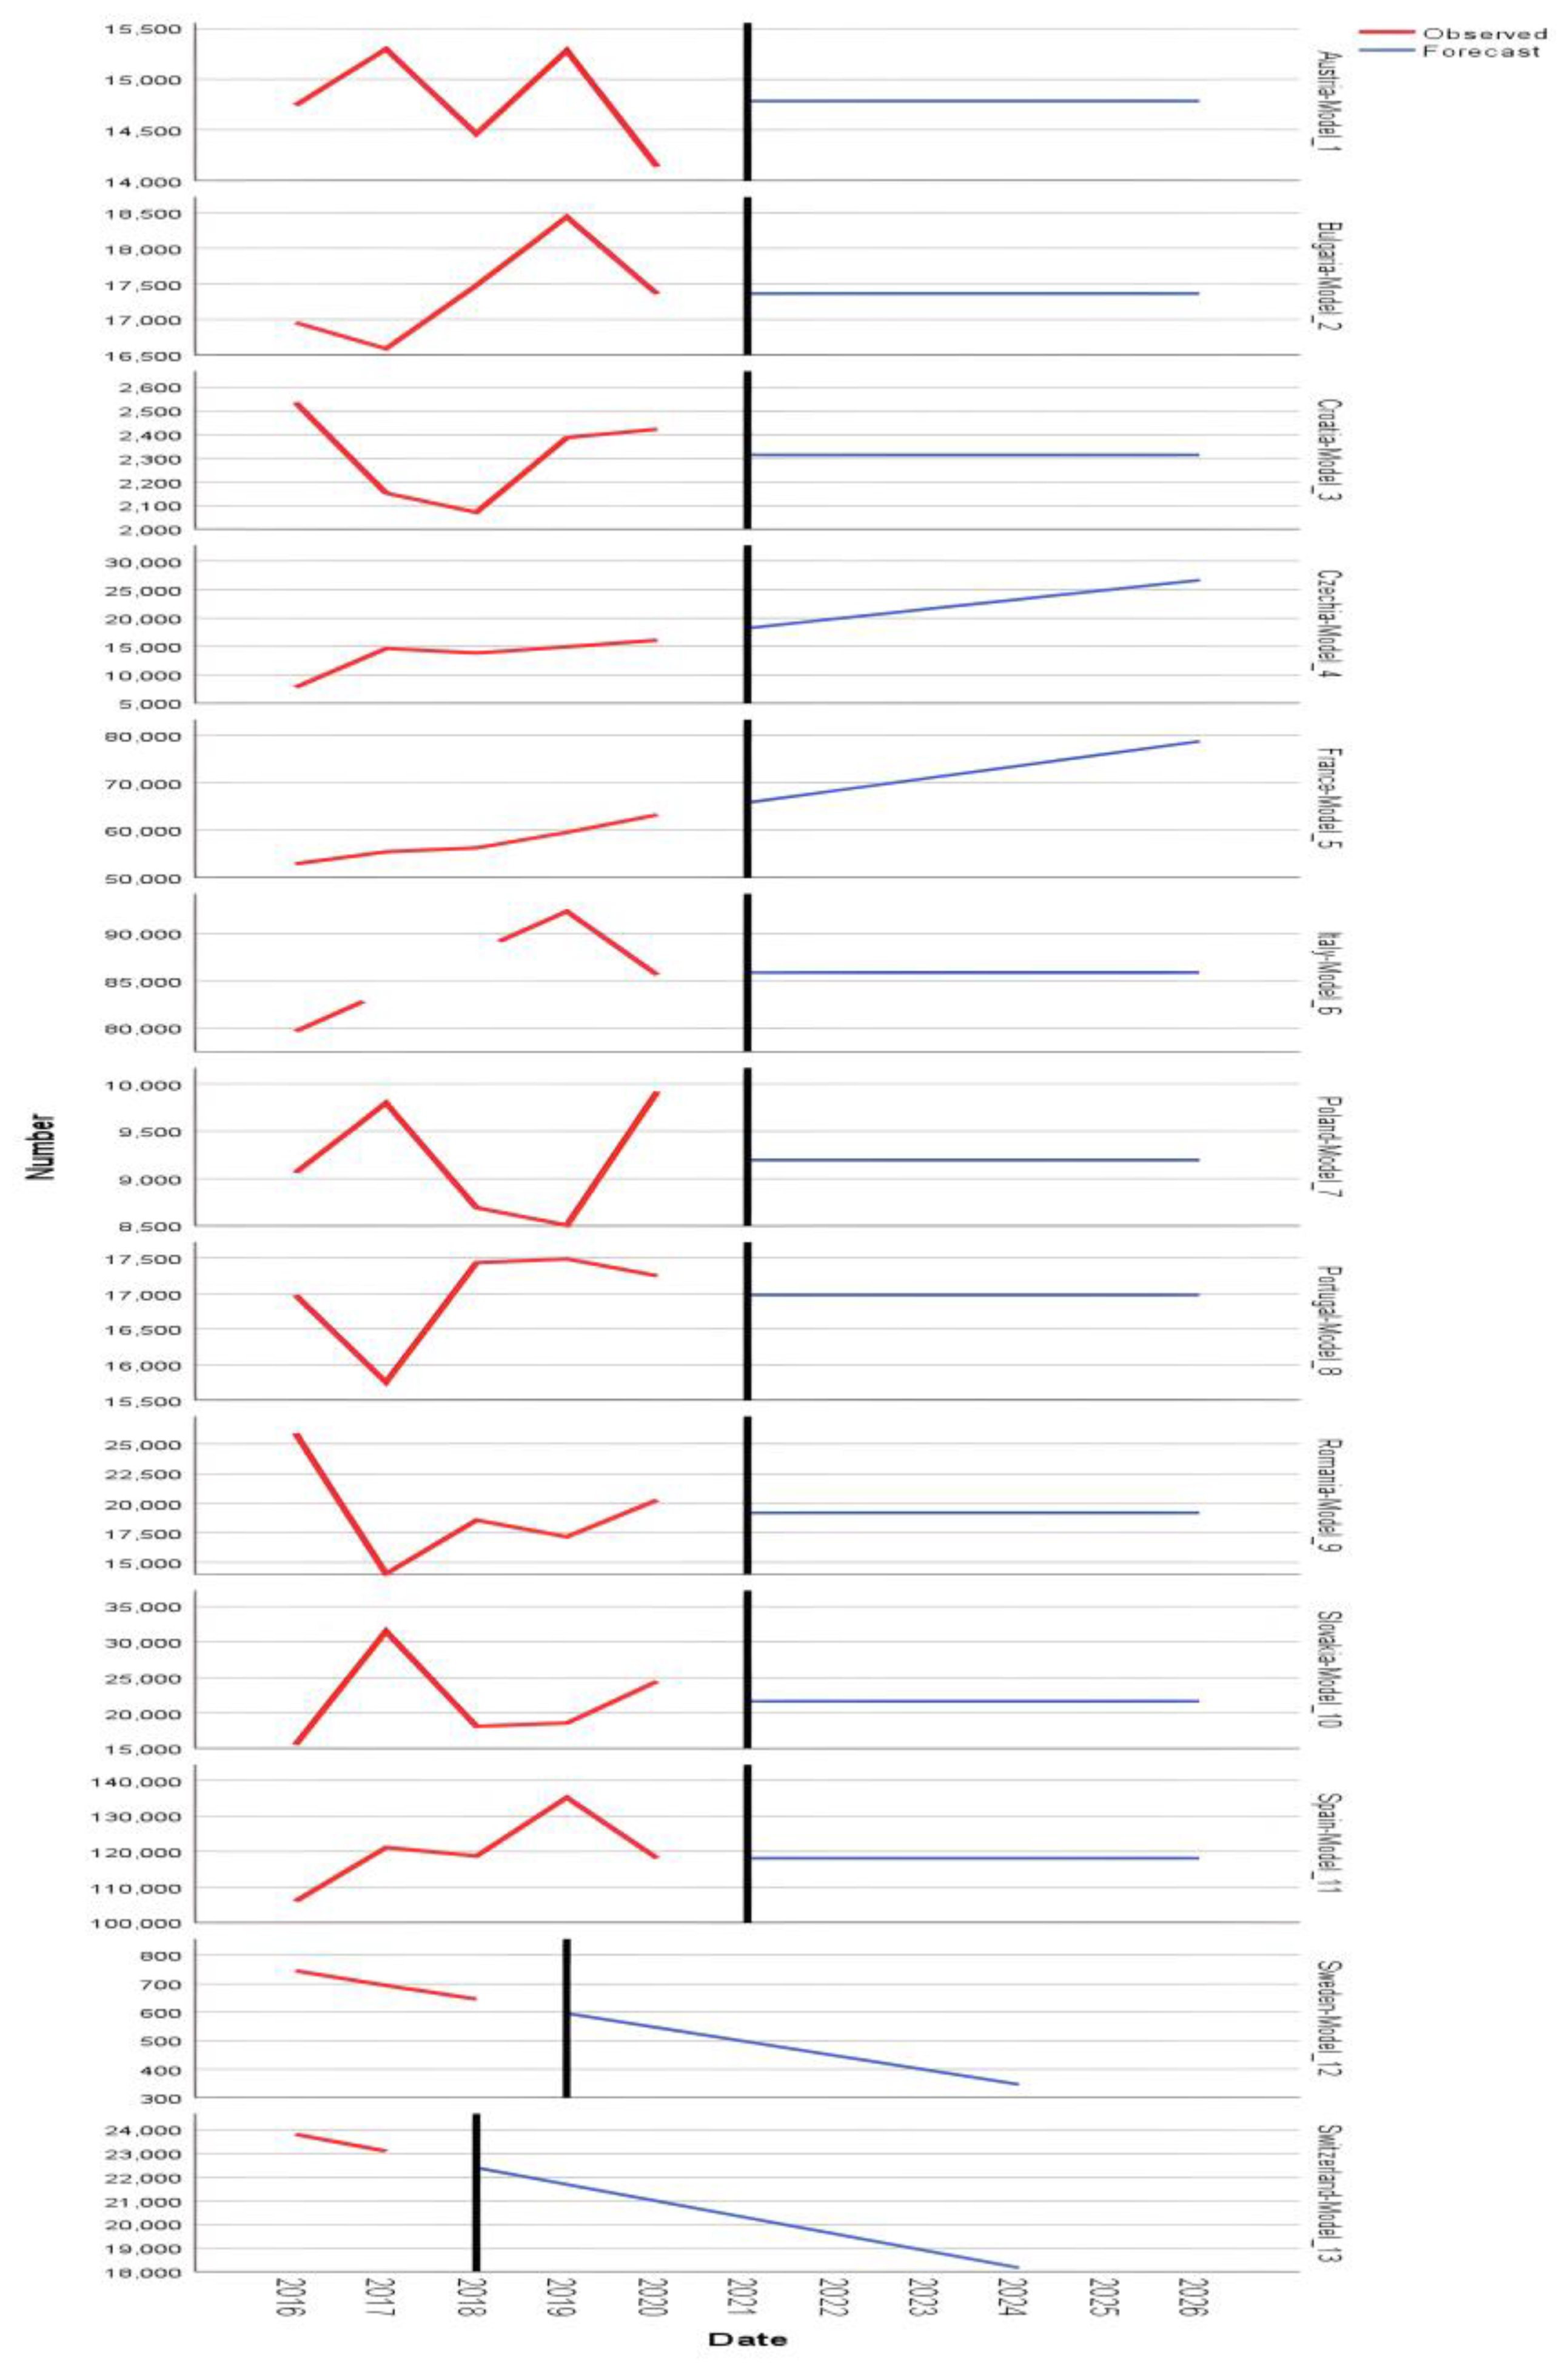
The statistical models used for the analysis and forecasting of the indicator Newly established enterprises in t-3 that survived until t – number (I4) in mountain area are for Austria Model_1 ARIMA(0,0,0), Bulgaria Model_2 ARIMA(0,0,0), Croatia Model_3 ARIMA(0,0,0), Czech Republic Model_4 Holt, France Model_5 ARIMA(0,1,0), Italy Model_6 ARIMA(0,0,0), Poland Model_7 ARIMA(0,0,0), Portugal Model_8 ARIMA(0,0,0), Romania Model_9 ARIMA(0,0,0), Slovakia Model_10 ARIMA(0,0,0), Spain Model_11 Simple, Sweden Model_12 ARIMA(0,1,0), Switzerland Model_13 Brown.
The parameters of the exponential smoothing model are Alpha (Level) - which implies the probability of making a wrong decision when the null hypothesis is true, respectively Gamma (Trend) - which represents a two-parameter family of continuous probability distributions. The returned trend values are of type Forecast, Upper Control Limit, and Lower Control Limit.
3. Results and Discussion
The results returned from the analysis present an emerging overview of all the mountain countries considered, especially Romania. The population of active enterprises in t - number shows a stable and growing mountain business environment for Romania.
The statistical descriptors Mean, SE, Minimum, Maximum, 5th, and 10th Percentiles, listed in this order for all indicators in this paper, show stationary R-squared values of .238, .661, -1.331, .906, -1.331, -1.053; R-square .565, .379, -6.397E-13, 1.000, -6.397E-13, -3.844E-13; RMSE 13429.650, 16824.033, 2.719, 47120.528, 2.719, 46.038; MAPS 2,372, 3,966, .000, 14,889, .000, .220; MaxAPE 5.922, 12.119, .000, 45.500, .000, .223; MAE 9285,887, 12057,580, 1,824, 33615,680, 1,824, 32,494; MaxAE 17984.495, 24491.900, 2.432, 84039.200, 2.432, 32.859; Normalized BIC 16,707, 5,390, 2,347, 21,902, 2,347, 5,314.
The predictive model for Romania, Romania-Model_9, presents the values of stationary R-squared .730, R-squared .939, RMSE 3647.065, and MAE 2229.928 (the values are presented in this order for all indicators in the paper).
The parameters of the Exponential Smoothing Model are for Alpha (Level) .329 and Gamma (Trend) .294.
The predictive values of the Romania-Model_9 model is presented for each indicator in the work for the period 2020-2026, thus for Forecast 299093, 307000, 314906, 322813, 330719, 338625, UCL 310700, 319113, 327505, 335879, 3442 37, 352581 and LCL 287487, 294887, 302307, 309746, 317201, 324670.
For the other countries studied, the forecasting models demonstrate the efficiency of mountain businesses in European countries, with the forecast for 2026 showing linearity only for Bulgaria-Model_2, Czechia-Model_4, Italy-Model_6, and Portugal-Model_8 (Figure 1, immediately next).
About the second analyzed indicator, Establishments of enterprises in t – number in mountain area, the statistical descriptors present the stationary R-squared values .312, .371, .000, .837, .000, .000; R-square .388, .421, -.007, 1.000, -.007, -.004; RMSE 4657.430, 6800.023, .81, 25521.459, .818, 18.047; MAP 7.152, 5.872, .001, 19.880, .001, .536; MaxAPE 14.859, 14.585, .002, 53.268, .002, 1.197; MAE 3330.493, 5148.976, .549, 19411.600, .549, 13.840; MaxAE 6713.361, 11158.056, .731, 41938.000, .731, 20.706; Normalized BIC 14.662, 5.407, -.056, 20.616, -.056, 3.138.
The predictive model for Romania, Romania-Model_9, presents the values .725, .387, 2213.152, 1509.108.
The parameters of the Exponential Smoothing Model are for Alpha (Level) .401 and Gamma (Trend) .368.
The predictive values of the Romania-Model_9 model is presented as follows: Forecast 33795, 34950, 36105, 37260, 38415, 39571; UCL 40838, 42301, 43751, 45190, 46620, 48041; LCL 26751, 27599, 28459, 29330, 30211, 31100.
The forecasting models for the European countries studied show that certain countries will experience a sustained regression until 2026 due to the establishment of many enterprises in the period before 2018, these are Austria-Model_1, Bulgaria-Model_2, Italy-Model_6, and Poland-Model_7.
Other countries, such as Croatia-Model_3, Czechia-Model_4, Portugal-Model_8, Slovakia-Model_10, Spain-Model_11, and Sweden-Model_12, will experience a linear stagnation of new business start-ups, while France-Model_5, Romania-Model_9, and Switzerland-Model_13 will spearhead the development of new mountain businesses in Europe (Figure 2, immediately next).
The indicator Dissolution of enterprises in t - number presents mountain businesses in the downward forecast, the statistical descriptors for the stationary R-square values being -52.134, 189.184, -681.774, .977, -681.774, -409.065; R-square .337, .385, -8.216E-15, .882, -8.216E-15, -4.929E-15; RMSE 3556,697, 5192,923, 48,014, 16347,379, 48,014, 125,964; MAP 5.738, 3.268, .962, 13.575, .962, 1.427; MaxAPE 9.444, 4.940, 2.054, 16.670, 2.054, 2.473; MAE 2645,175, 4074,521, 32,444, 11901,000, 32,444, 74,016; MaxAE 4131,455, 6094,460, 48,667, 19672,500, 48,667, 145,515; Normalized BIC 15.125, 3.007, 8.109, 19.750, 8.109, 9.537.
The predictive model for Romania, Romania-Model_9, refers to the values .659, .739, 1971.804, 1246.079.
The parameters of the Exponential Smoothing Model are for Alpha (Level) .528 and Gamma (Trend) 3.169E-7.
The predictive values of the Romania-Model_9 model is presented as follows: Forecast 28558, 30746, 32935, 35124, 37312, 39501, 41689; UCL 37042, 39398, 41752, 44102, 46450, 48795, 51137; LCL 20074, 22094, 24118, 26145, 28175, 30207, 32242.
European countries such as the Czechia-Model_4, Croatia-Model_3, Poland-Model_7, Portugal-Model_8, and Slovakia-Model_10 show an upward trend for the number of companies dissolved, against the background of the inactivity of some of them.
The effect on the labor market is not felt significantly, since the vast majority of the dissolved enterprises were no longer in the demographic circuit of mountain businesses (Figure 3, immediately next).
The indicator New enterprises established in t-3 that survived to t – number in mountain area shows statistical descriptors with values for stationary R-square .132, .320, -4.619E-14, .985, -4.619E-14, -3.233E -14; R-square .261, .426, -.035, 1.000, -.035, -.021; RMSE 2636.595, 3317.134, .196, 10593.111, .196, 1.249; MAP 6.520, 6.866, .001, 23.625, .001, .120; MaxAPE 12.713, 13.204, .001, 39.434, .001, .124; MAE 1799.913, 2212.814, .132, 6579.604, .132, .879; MaxAE 3832.782, 5069.414, .176, 17096.985, .176, .905; Normalized BIC 12.762, 6.333, -2.910, 18.858, -2.910, -.775.
The predictive model for Romania, Romania-Model_9, shows the values 5.551E-16, 5.551E-16, 4401.574, 3121.280.
The predictive values of the Romania-Model_9 model is presented for all years as Forecast 19195, UCL 31416, LCL 6975.
European countries reflect a balanced mountain business environment, with established businesses lasting more than five years in the European entrepreneurship market.
The Czech Republic -Model_4 and France-Model_5, the most emerging countries of this indicator, show that mountain businesses can represent a way of developing the national and regional economy, while the other countries, except Sweden-Model_12, and Switzerland-Model_13, have linear development trends (Figure 4).
4. Conclusion
According to the studies presented in the specialized literature and the authors' research, the quantitative analyzes give the modeling of the mountain economy a high degree of scientific validation. The indicators analyzed as an example confirm the stability of the European mountain business environment.
The population of active enterprises in t - number in mountain area has grown considerably during the analyzed period, the forecast showing that the mountain economy will develop considerably in the next five years.
In the analyzed period, but also the presented trend period, new enterprises to cover the mountain's economic needs (Establishment of enterprises in t – number in mountain area) will support the mountain's entrepreneurial environment.
In the paper it was shown that the dissolution of inefficient enterprises (Dissolution of enterprises in t – number in mountain area) represents a reality at the level of the mountain business environment in Europe, the beneficial effects being the establishment of new enterprises oriented more towards local and regional mountain needs.
The economic entities that resisted dissolution or inactivity (Enterprises newly established in t-3 that survived until t – number in mountain area) solidified the mountain business environment, ensuring the sustainability of the entire European mountain economy.
References
- Covaci B and Covaci M, Exponential smoothing models, support for analysis of the mountain regions livestock: evidence from Romania, International Journal of Agricultural & Statistical Sciences Vol. 19(2) (2023a), 873-881. [CrossRef]
- Covaci B and Covaci M, Mountain index business model nexus internet of things development and sustainability, Journal of Mountain Research Vol. 18(2) (2023b), 191-205. [CrossRef]
- Dawid P, Wijayatunga P and Pierides DC, Beyond subjective and objective in statistics: Discussion on the paper by Gelman and Hennig, Journal of the Royal Statistical Society: Series A (Statistics in Society) Vol. 180(4) (2017), 997-1033. [CrossRef]
- Diaz-Bone R and Horvath K, Official statistics, big data, and civil society. Introducing the approach of “economics of convention” for understanding the rise of new data worlds and their implications, Statistical Journal of the IAOS Vol. 37(1) (2021), 219-228. [CrossRef]
- Eurostat, Business demography statistics: Territorial typologies manual - mountain regions, 2022. https://ec.europa.eu/eurostat/statistics-explained/index.php?title=Territorial_typologies_manual_-_mountain_regions.
- Hoerl RW and Snee RD, Statistical thinking: Improving business performance. John Wiley & Sons, 2020.
- Kiouvrekis Y, Stefaneas P and Kokkinaki A, An argumentation-based statistical support tool, Proceedings of the International Workshop on Applied Methods of Statistical Analysis Nonparametric Methods in Cybernetics and System Analysis, Krasnoyarsk - The Russian Federation, 2017, 18-22.
- Krutin V and Faltova Leitmanova I, Determinants of economic results of the selected agricultural enterprises in mountain and sub-mountain areas in South Bohemia, Agric. Econ. – Czech Vol. 51(3) (2005), 117–122.
- Liu SJ, Zhu CJ, He NN and Li GQ, Role of mountains and rivers in the formation of logistics enterprises’ spatial pattern in the central urban areas of Chongqing, Journal of Mountain Science Vol. 19(7) (2022), 2060-2074. [CrossRef]
- OECD, Eurostat − OECD Manual on Business Demography Statistics, The Population of Active Enterprises, 2012 (06/15). https://web-archive.oecd.org/2012-06-15/130552-39974515.pdf.
- Solow RM, Technical Change and the Aggregate Production Function. Review of Economics and Statistics Vol. 39(3) (1957), 312– 20. [CrossRef]
- Solow RM, We’d Better Watch Out, New York Times Book Review Vol. July 12 (1987), 36.
- Stettler AL and Mayer H, Social Innovations and the Mountain Economy: The Case of 100% Valposchiavo and Its Influence on Small-and Medium-Sized Enterprises, Mountain Research and Development Vol. 43(1) (2023), R20-R31. [CrossRef]
- Weihs C and Ickstadt K, Data science: the impact of statistics, International Journal of Data Science and Analytics Vol. 6 (2018), 189-194. [CrossRef]
Figure 1.
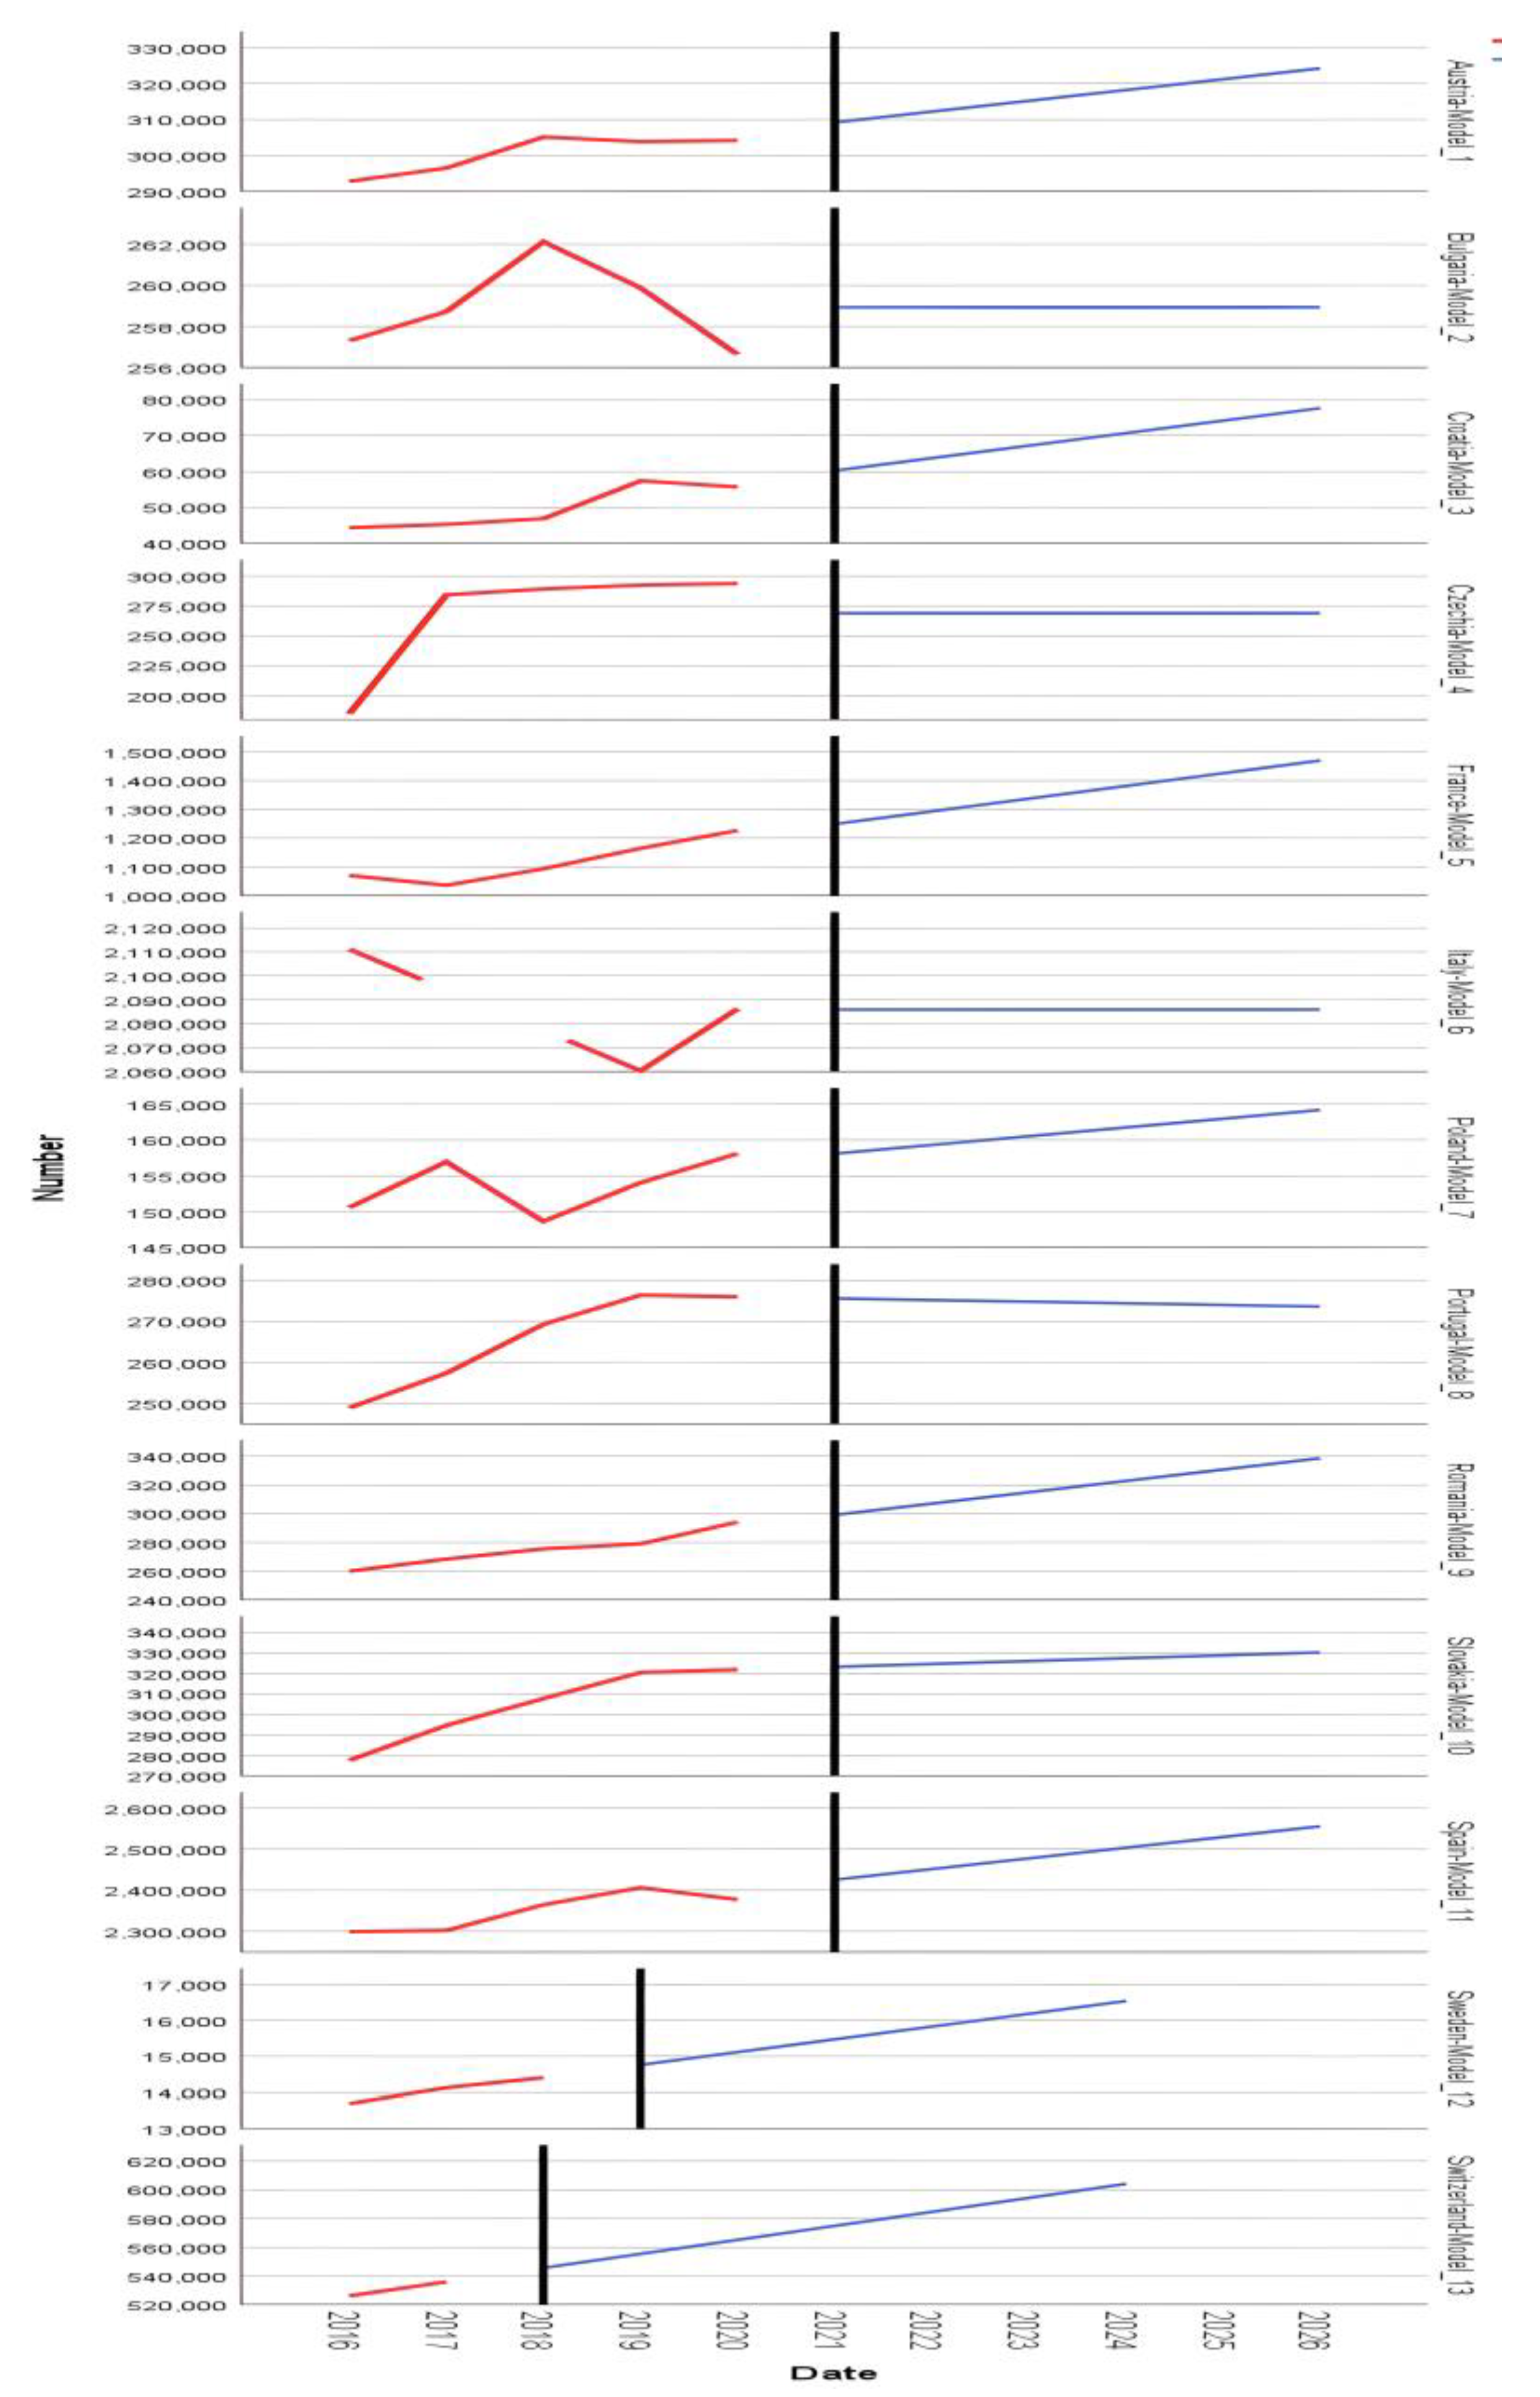
Figure 2.
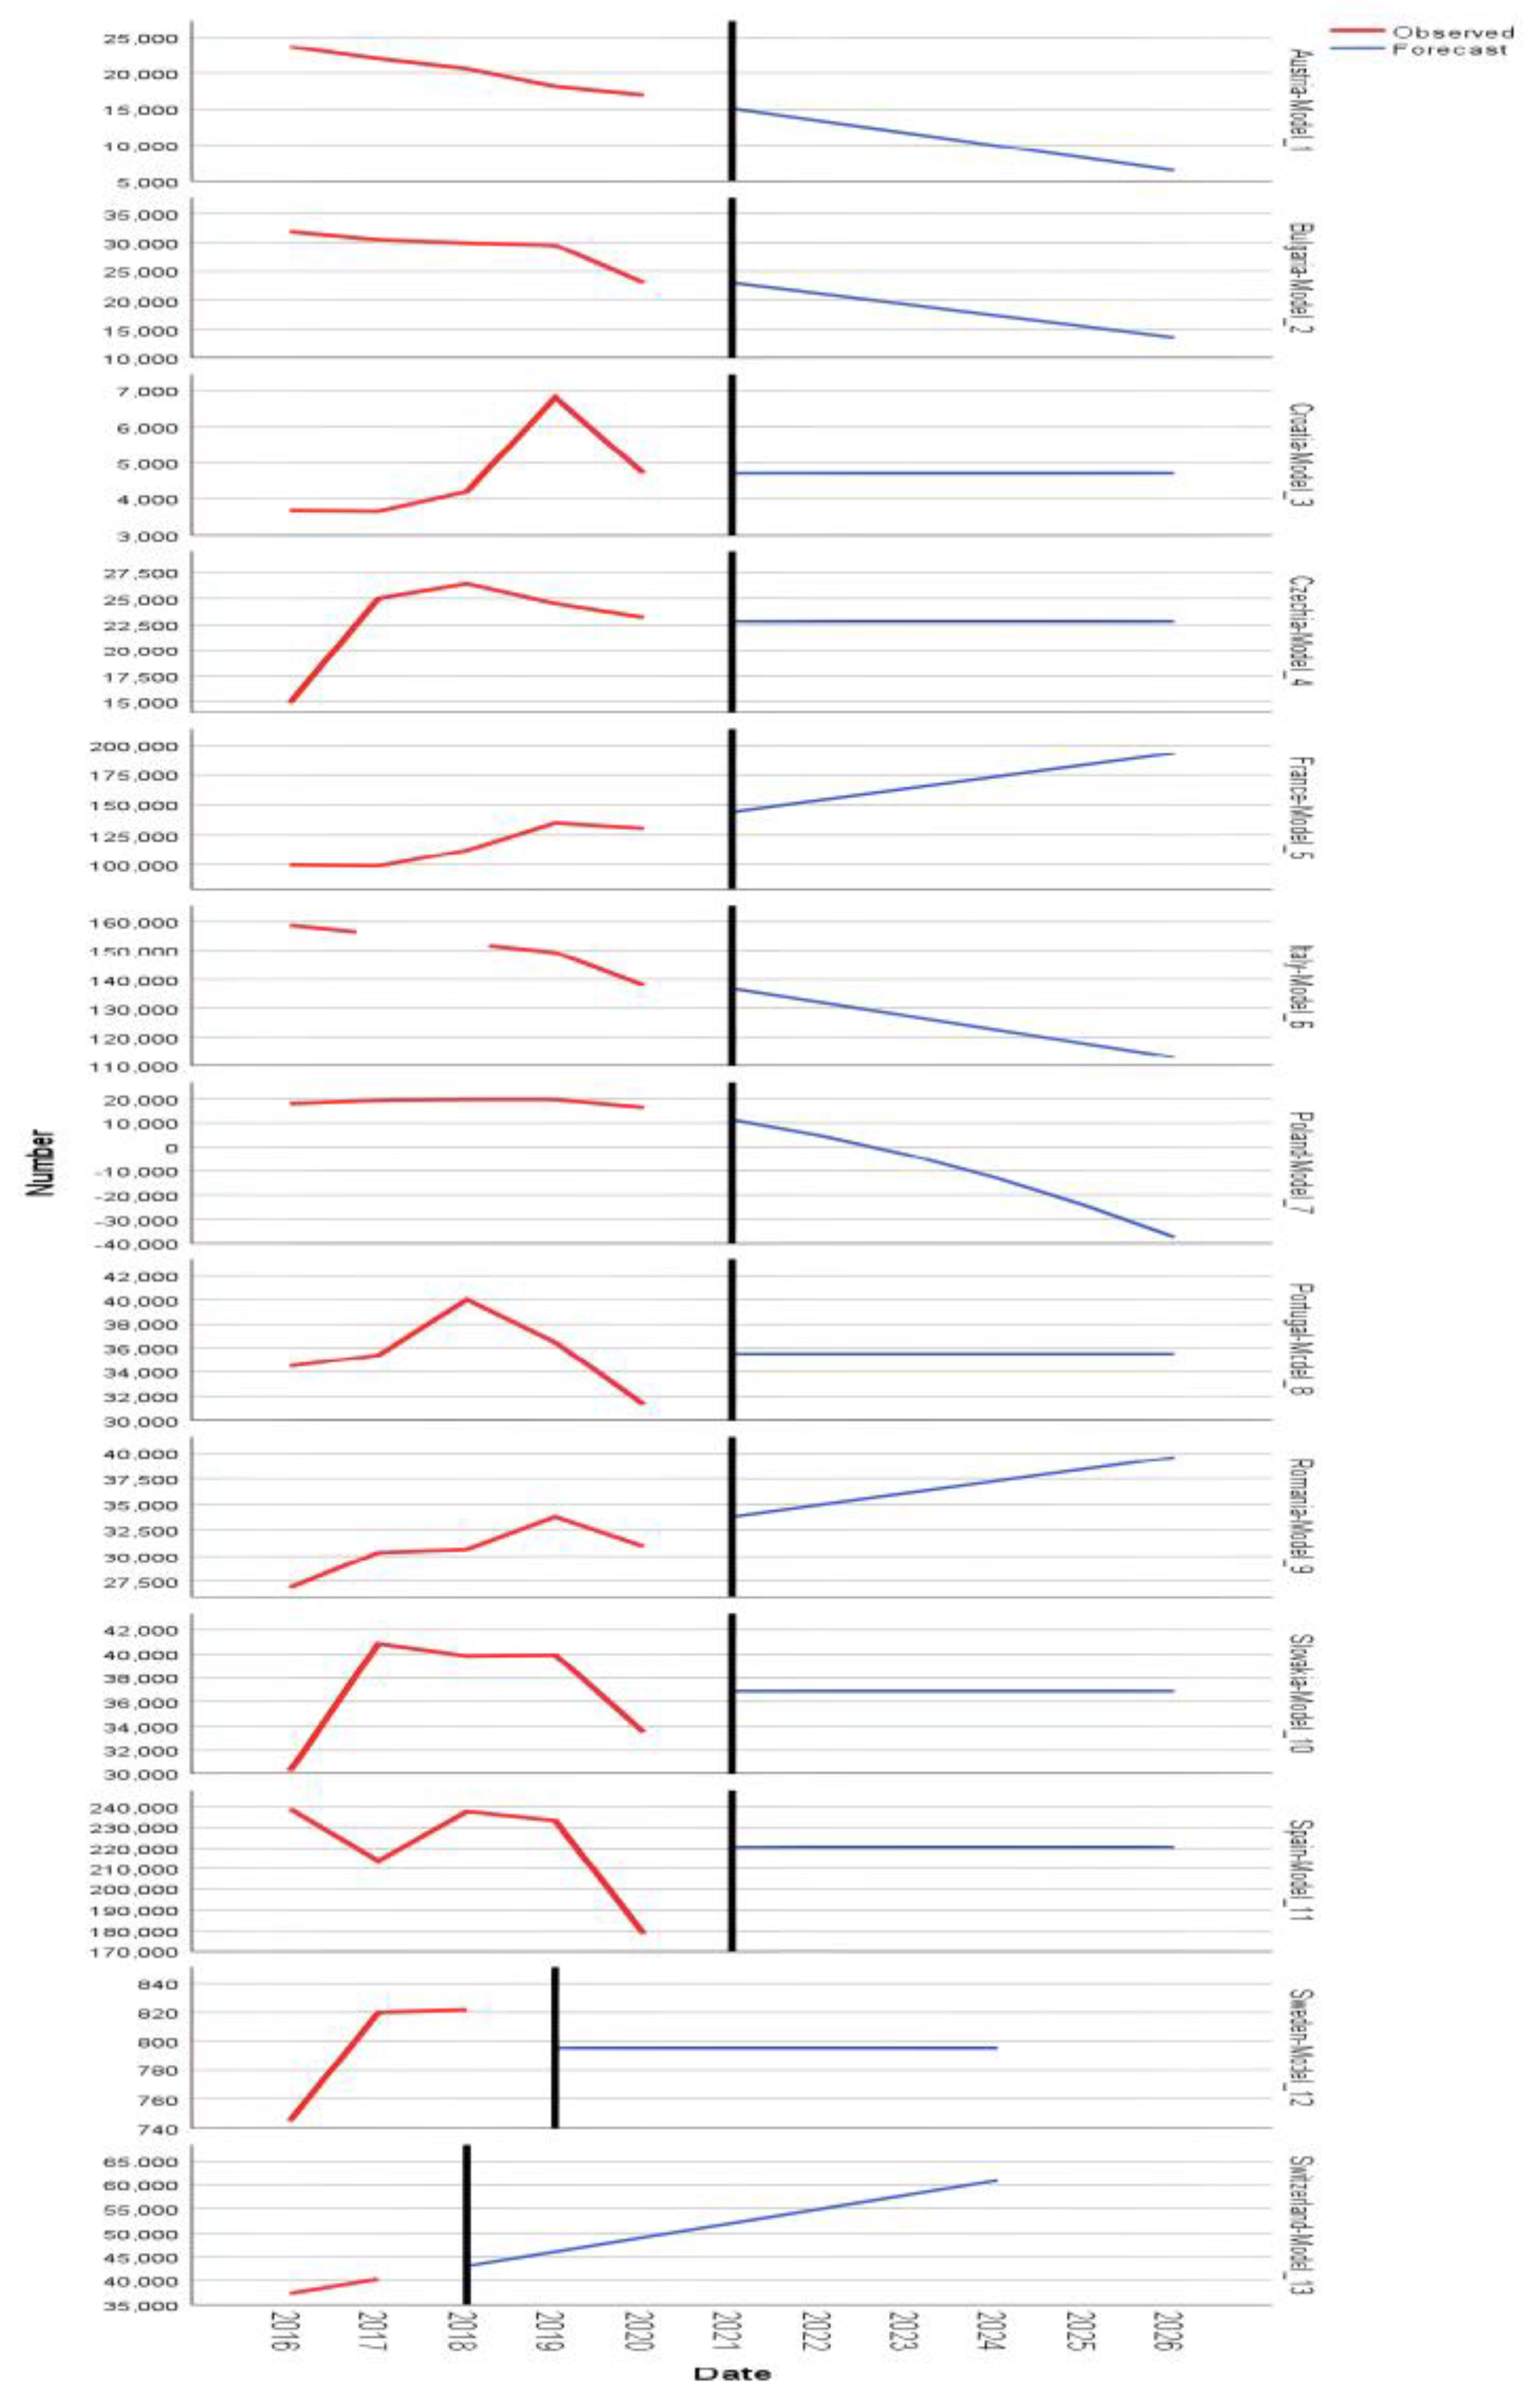
Figure 3.
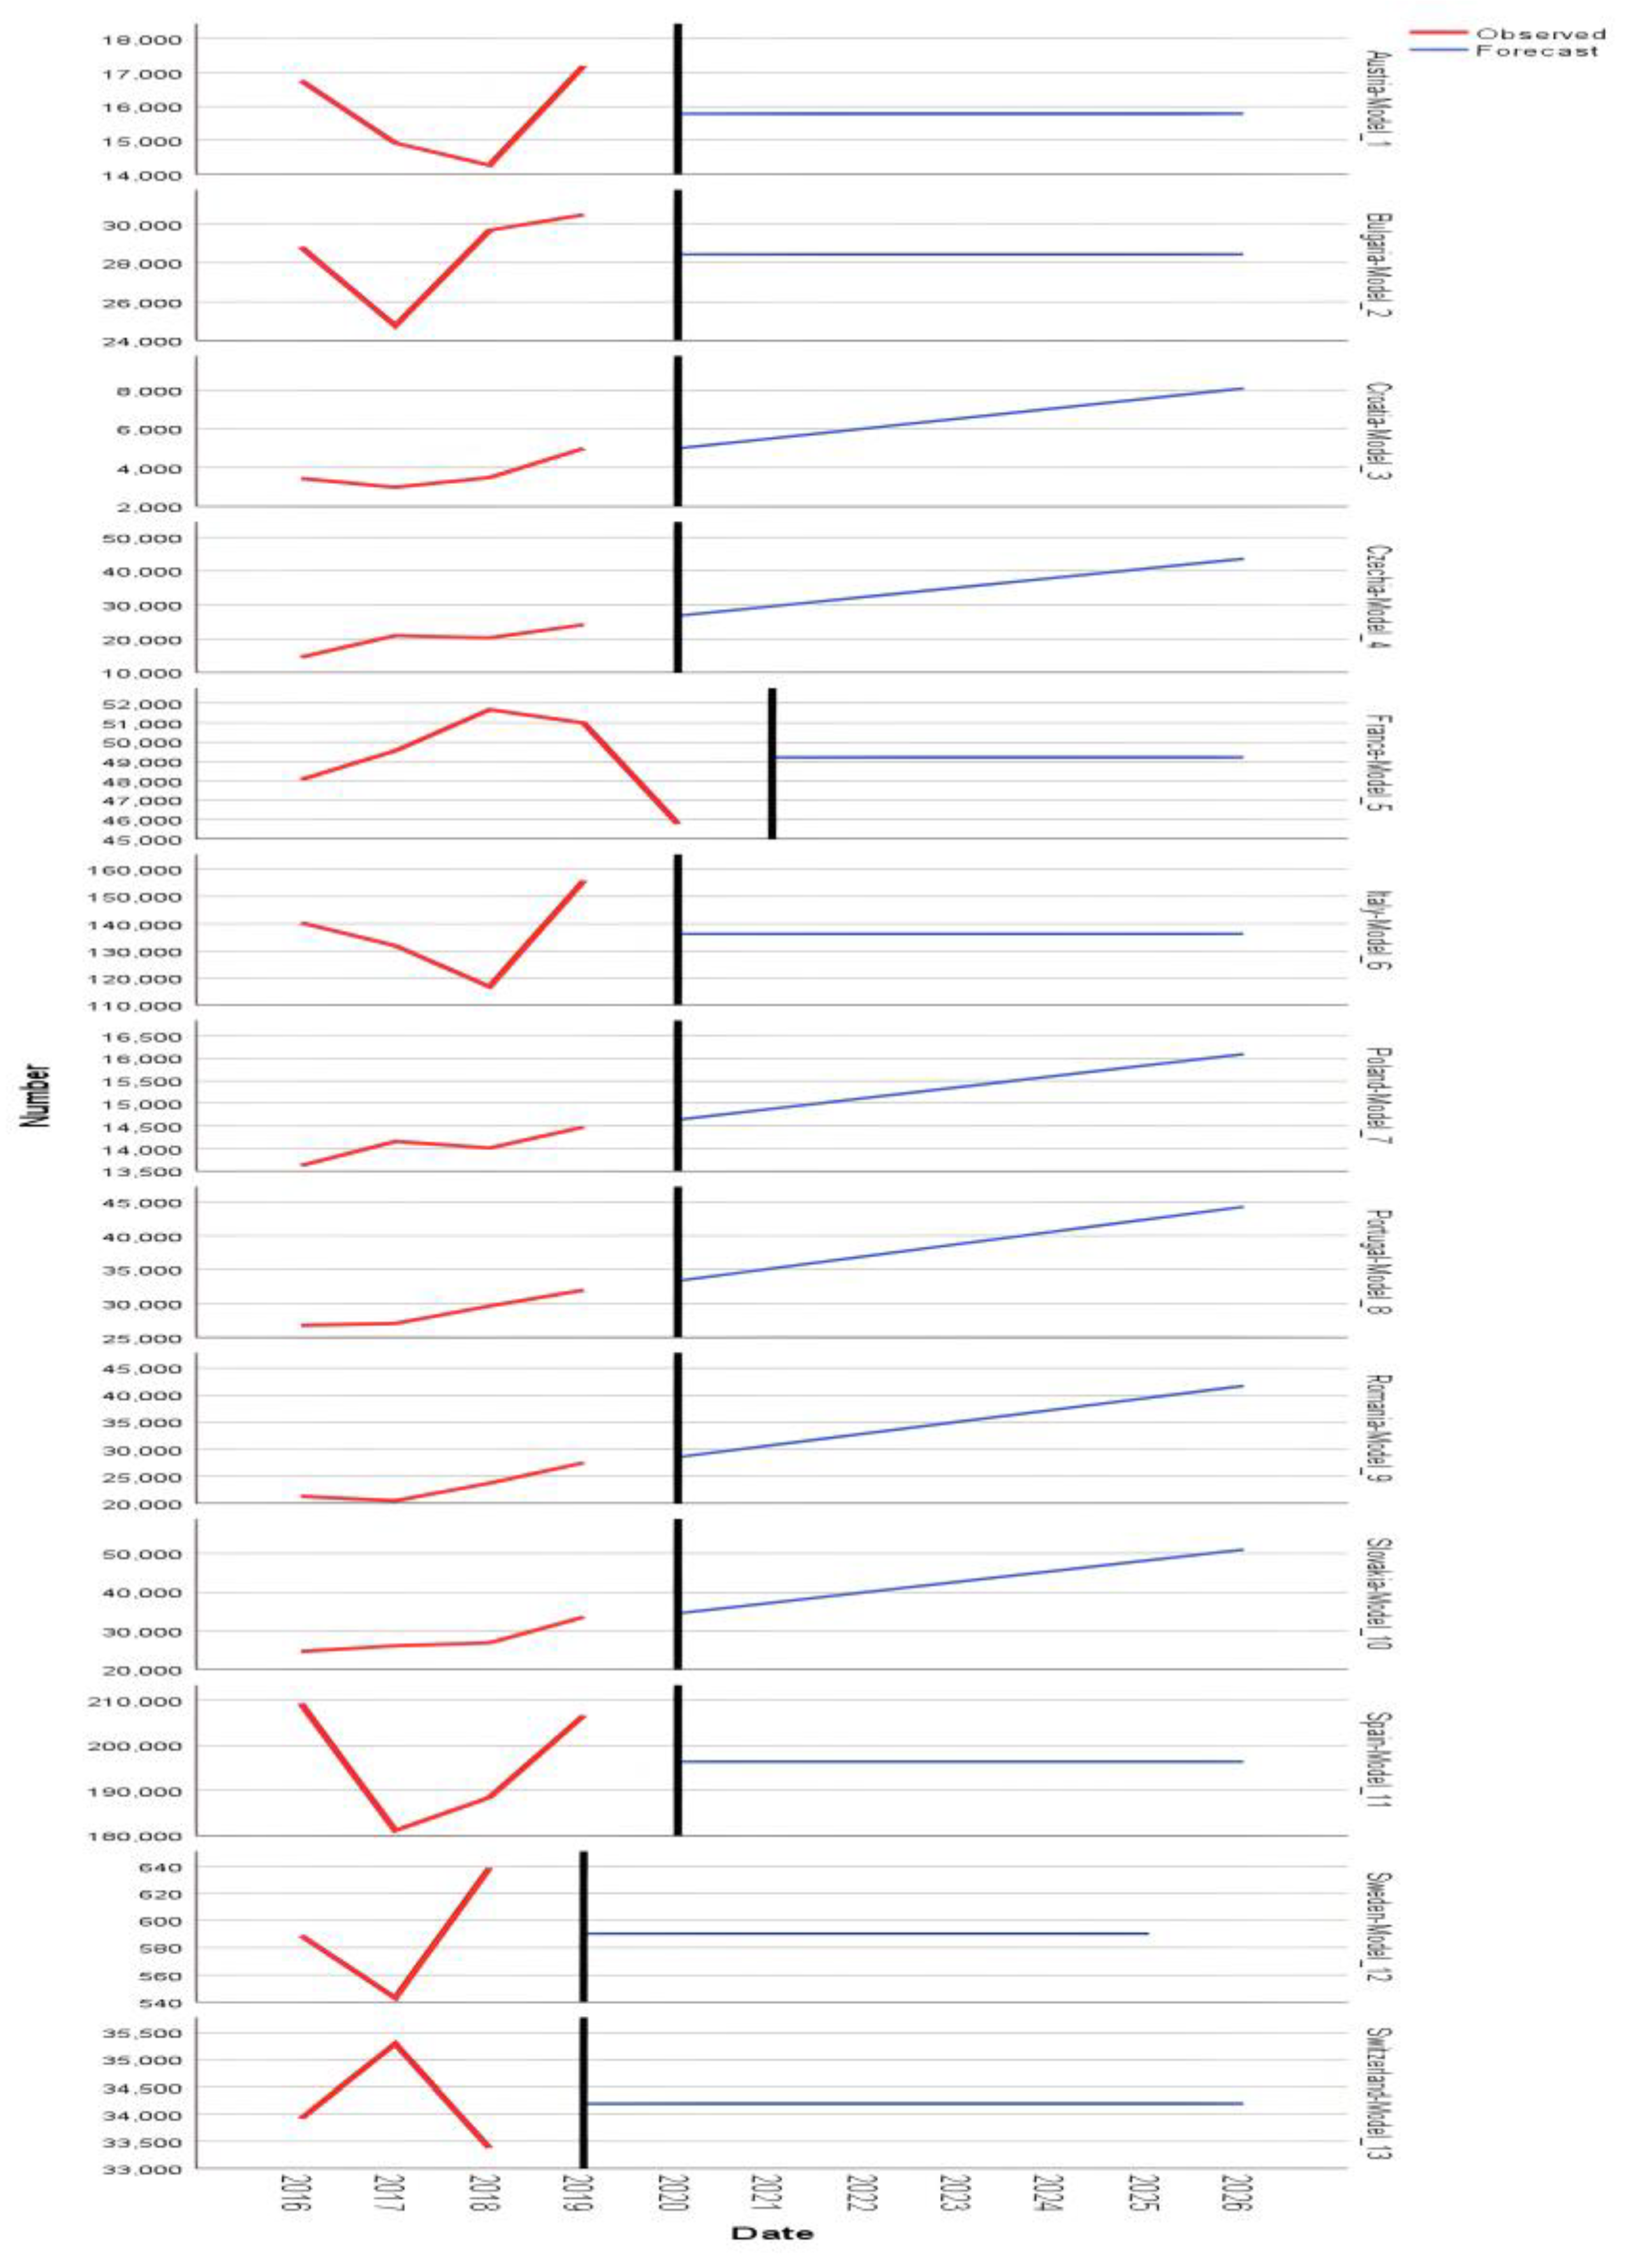
Figure 4.
Disclaimer/Publisher’s Note: The statements, opinions and data contained in all publications are solely those of the individual author(s) and contributor(s) and not of MDPI and/or the editor(s). MDPI and/or the editor(s) disclaim responsibility for any injury to people or property resulting from any ideas, methods, instructions or products referred to in the content. |
© 2025 by the authors. Licensee MDPI, Basel, Switzerland. This article is an open access article distributed under the terms and conditions of the Creative Commons Attribution (CC BY) license (http://creativecommons.org/licenses/by/4.0/).
Copyright: This open access article is published under a Creative Commons CC BY 4.0 license, which permit the free download, distribution, and reuse, provided that the author and preprint are cited in any reuse.


