
Submitted:
13 January 2025
Posted:
14 January 2025
You are already at the latest version
Abstract
The grochemical analysis of the 13 samples has shown the occurrence of bitumen in all smples.This bitumen has different origins: Kermanshah province and Khuzestn , Fars and Busher provinces in Iran
Keywords:
Kuwait
; Failaka Island
; al-Qusur
; monastry
; potsheds
; bitumen
; biomarkers
; steranes
; terpanes
; carbon and hydrogen isotopes
; geochemical analysis
; oil seeps
; Iran
1. Introduction
The al-Qusur monastery, at the Central part of the Failaka island, has been excavated by the French-Kuwaiti Archaeological Mission in Failaka (MAFKF) since 2012. The results of the past campaigns have been published in the four quoted papers [1,2,3,4], proving the monastic nature of the site and dating its main occupation from the second half of the 7th c. CE and the middle of the 9th c. CE. This report concerned 9 samples of bituminous mixtures, isolated from potsherds and dated between the 7th and the 9th c. CE. The purpose of this study was to document the composition of the bituminous mixture and to find the source of the bitumen.
2. Materials and Methods
2.1. Bitumen at Al-Qusur
The samples originated from the site of al-Qusur, located in the middle of Failaka island, c. 19 km from the southern tip of Kuwait Bay. It was first excavated by the Archaeological Mission in the Arabian Gulf in 1975-1976, then the French Mission in Kuwait in 1988-1989 and 2007-2009, the Kuwaiti-Polish Archaeological Mission in 2011 and 2013 and is still being studied today by the French-Kuwaiti Archaeological Mission in Failaka, since 2011, and the Kuwaiti-Slovak Archaeological Mission in 2007. In spite of the number of excavation seasons carried out on the site by many teams, there is always a debate about the interpretation of the whole site. If the center of al-Qusur is clearly a monastery, as evidence by the discovery of a monumental church (building A1), a refectory (building B23) and at least one monk’s cell (building B16), it is still to be determine if the periphery of the site is part of the monastery or not (Figure 1). One of the current hypotheses is that the central part of the monastery (c. 0.78 ha) could be a coenobium surrounded by scattered cells accommodating monks wishing to live more isolated from the community. Following this hypothesis , the monastery would be covering c. 335 ha and be accurate with the rules of Abraham of Kashkar, promoting semi-cenobitic types of monasteries.
In al-Qusur, no bitumen is attested yet in construction. In building B20, a food processing building, it was punctuality used for structures in cooking areas. It mainly appears on pottery jars, as inside coating to waterproof them. One Syriac inscription on a sherd may also have been written with this material. The jars do not appear to have been coated with bitumen on the site, but were probably imported already coated. However, it is worth mentioning that bitumen might be supplied by the nearby and contemporary settlement of al-Qurainiyah, on Failaka’s northern coast, where the Kuwaiti-Italian Archaeological Mission reveals remains that could be a bitumen production workshop [5]. The bitumen might have been delivered there in solid form before being heated and used in the architecture or maintenance of boats [5].
2.2. Archaeological Samples Analyzed
13 bituminous samples, were selected and a total of 15 geochemical analyses (two samples were analysed with two aliquotes) were undertaken. Basic information (date, archaeological reference, context) including the type of potsherd are listed in Table 1. On potsherds, the coating of the interior face may be very thin as in bottom of the torpedo jar No.3539, or more consistent as in samples No.3542 and No.3543 (Figure 2). The bituminous mass may also show some imprints (ropes?) as for sample No.3545 (Figure 2). The quantity of bituminous mixture, collected from a torpedo jar (TORP-C), suggests that it was a bituminous mixture stored in the jar. This sample was studied with several aliquots : No.3546, 3547 and 3547bis (Figure 2).
The ceramic categories that were sampled are part of the same group of sandy buff wares, sharing a similar clay composition with a rather fine calcareous ground mass, fine quartz elements, and small magmatic rocks. There are two categories of amphorae with an internal bitumen coating, known as torpedo jars because of their profiled shape. The samples No.3542, 3544, 3623, and 3624 were collected on sherds of TORP-S amphorae belonging to the Late Sassanian, Early Islamic assemblages (5th-8th c. CE). This type is found in abundance in the region, but is gradually replaced by lighter-paste amphorae (TORP-C) during the 8th century [6]. The samples No.3539, 3546, 3547, 3625, and 3626 are related to the latter type. It is contemporaneaous to large storage jars (SPORC), such as sample No.3545. This type is quite rare in the area and have some parallels with material from the coastal site of Siraf [7]. The main centres of origin for these categories are supposedly located around the urban centres of central and southern Mesopotamia, from Susa (Kermanshah province, Iran) to al-Hira (Najaf district, Iraq) and Basra province (Iraq). A TORP-S production kiln has been identified in Telūl Hamediyāt, north-east of Baghdad (Hamrin basin, Diyala province, Iraq) and dated from the 6th-7th century [8,9]. This workshop was located alongside a wine-production facility and the amphoras were apparently potted on the site. This could seem to support the hypothesis that ceramics were produced close to the agricultural area in the Mesopotamian basin, instead of near the source of bitumen production in south-west Iran [10].
Sample No.3543 was recovered from a sherd of a turquoise alkaline-glazed small jar (TURQ.T). The layer of bitumen covers a large part of the internal and external surfaces and seems to have accumulated particularly on the shoulder and neck of the object. The various traces of dripping and the absence of repair marks suggest that this object was used to contain and handle bitumen in liquid form. Although turquoise ceramics were used over a long period of time, the forms found at the al-Qusur site correspond more closely to the types identified at the Sir Bani Yas site and dated mainly between the mid-7th and mid-8th century [11,12]. Based on the clay and glaze used, the area of origin of these products is probably in southern Mesopotamia, in the Basra region. Further archaeometrical analyses of the composition of the glazes should make it possible to identify even more precisely the regions of production [13].
The samples No.3540 &No.3541 are extracted from a ceramic category that is difficult to identified precisely. In terms of clay and surface treatment, this jar is similar to those made at Siraf on the Iranian coast, known as CREAC, and dated between the late 8th and the 10th century [12]. But it is possibly another sandy buff ware belonging to the same group as TORP, TURQ and SPORC, but with an overfired body, with a large number of magmatic rock inclusions within the clay matrix.
2.3. Analytical Procedures
2.3.1. Bitumen Analysis
All archaeological and geological samples were subjected to the same analytical procedure conducted at GeoMark Research Ltd. The dichloromethane extract was deasphalted using n-hexane. The desasphalted fraction was separated into saturated hydrocarbons, aromatic hydrocarbons, and resins using gravity flow column chromatography employing a 100-200 mesh silica gel support activated at 400 °C prior to use. Hexane was used to elute saturates, dichloromethane to elute the aromatic hydrocarbons, and dichloromethane/methanol (50:50 v/v) to elute the resin (NSO) fraction. Following solvent evaporation, the recovered fractions were quantified gravimetrically. The C15+saturated hydrocarbon fraction was subjected to molecular sieve filtration (silicalite, Union Carbide S-115 powder) after the technique described by West et al. [14]. An aliquot of the total alkane fraction was not fractionated by silicalite in order to preserve access to the n-alkanes.
GC/MS analyses of C15+branched/cyclic and aromatic hydrocarbon fractions (in order to determine sterane and terpane biomarker distributions and quantities) are performed using an Agilent 7890A or 7890B GC interfaced to a 5975C or 5977A mass spectrometer. The J&W HP-5 column (50 m x 0.2 mm; 0.11 µm film thickness) is temperature programme from 150 °C to 325 °C at 2 °C/min for the branched/cyclic fraction and 100 °C at 3 °C/ min for the aromatic fraction. The mass spectrometer is run in the selected ion mode (SIM), monitoring ions m/z 177, 191, 205, 217, 218, 221, 231, and 259 for branched and cyclic alkanes, and m/z 133, 156, 170, 178, 184, 188, 192, 198, 231, 239, 245 and 253 for aromatics. In order to determine absolute concentrations of individual biomarkers, a deuterated internal standard (d4-C29 20R Ethylcholestane, Chiron Laboratories, Norway) is added to the C15+branched/cyclic hydrocarbon fraction and a deuterated anthracene standard (d10) is added to the aromatic hydrocarbon fraction. Response factors (RF) were determined by comparing the mass spectral response at m/z 221 for the deuterated standard to hopane (m/z 191) and sterane (m/z 217) authentic standards. These response factors were found to be approximately 1.4 for terpanes and 1.0 for steranes. Concentrations of individual biomarkers on the branched/cyclic fraction were determined using the equation below:
Conc. (ppm)= [(ht.biomarker)ng standard)]/[(ht.standard) (RF))(mg b/cy fraction)]
RF = response factor, ng = nanograms, for branched and cyclic alkanes (b/cy) peak heights are used, for aromatics the same equation is used with peak areas.
The C15+saturates, C15+aromatics, asphaltenes and resins were analysed for their respective carbon isotope (δ13C in ‰/VPDB) compositions. The asphaltenes and resins were also analyzed for their stable hydrogen isotope compositions. Details for all of the methods for stable isotope analyses are described in Connan et al. [15]
2.3.2. Mineralogical Analysis
All samples were ground prior to the XRD analysis. The mineralogy was determined using a D8 Discover Bruker diffractometer equipped with an X-ray tube emitting Cu-Kα1 radiation (λ = 1.5406 Å) at 40 kV and 40 mA. X-ray diffraction patterns were recorded with a LynxEye detector under ambient conditions and from 2.5° to 65° 2Ɵ, with a step size of 0.035° 2Ɵ, and with a calculation time of 3 seconds per step. Analyses were performed using DIFFRAC.EVA Bruker software and diffraction peaks were identified using the powder diffraction file database.
2.3.3. Complementary Organic Analyses
An aliquot of the sample No.3545 has been extracted by a mixture of CH2Cl2/MeOH 1:1 (v/v) and then acetylated (Ac2O/Pyr) and methylated (CH2N2). The mixture has been subsequently fractionated by silica gel chromatography into two fractions: an apolar one (F1) containing the hydrocarbons and a more polar one (F2) containing the alcohols (as acetates) and the fatty acids (as methyl esters).
GC-FID
GC analyses were carried out on a Hewlett Packard 6890 gas chromatograph equipped with an on-column injector used in the “track-oven” mode, a flame ionization detector and a HP-5 fused silica capillary column (30 m x 0.25 mm; 0.25 μm film thickness). H2 was used as carrier gas (constant flow mode, 2.5 ml/min), and the oven was programmed as follows: 70 °C (5 min), 70–200 °C (4 °C/min), 200–300 °C (10 °C/min), isothermal at 300 °C.
GC/MS
GC/MS analyses were performed on a Thermo GC Trace gas chromatograph equipped with a HP5 MS column (30 m x 0.25 mm x 0.1 µm) and a temperature programmable injector linked to a Thermo TSQ Quantum mass spectrometer. Helium (constant flow, 1.2 ml/min) was used as carrier gas and the oven was programmed as follows: 70 °C (5 min), 70–200 °C (4 °C/min), 200–300 °C (10 °C/min), 40 min isothermal at 300 °C. The mass spectrometer was operating in electron impact (EI) mode at 70 eV with a scan range of m/z 50-700.
3. Results and Discussion
3.1. Gross Composition of Extractable Organic Matter
Gross composition data are listed in Table 2. The plot of % HC (sat + aro) vs. % resins (NSO’s) vs. % asphaltenes (Figure 3b) and % saturates vs. % aromatics vs. % polars (Figure 3a) shows that bituminous mixtures of al-Qusur possess the characteristic composition of archaeological bitumens : high amounts of polars (resins + asphaltenes) and asphaltenes and low quantities of hydrocarbons and resins. One may notice some slight differences among samples in Figure 3b.
3.2. Isotopic Compositions
Isotope data are listed in Table 2. The plot of δ13Csat (‰ / VPDB) vs. δ13Caro (‰ / VPDB) and δ13Casp (‰ / VPDB) vs. δ13CNSO (‰ / VPDB) in Figure 4 reveals at least two main types of bitumen. One may notice a good match in duplicate samples (No.3545 and 3545bis and 3547 and 3547bis, Figure 4).
Comparison of the al-Qusur data with data collected on oil seeps from Iraq (Figure 5) and Iran (Figure 6) shows that the bitumen of al-Qusur matches the oil seeps of Iran, but not those of Iraq.
One group of bitumen is originating from Kermanshah province whereas the second group is likely coming from Khuzestan- Busher-Fars provinces. The plot of δDasp (‰ / SMOW) vs. δDNSO (‰ / SMOW) in Figure 7 shows values (-90 to -70 ‰ / SMOW) for asphaltenes which are currently recorded in archaeological bitumens. No relationship exists between the origin of bitumen and δD values (Figure 7). This situation is usual for δD parameter is not a source parameter but reflects the state of bitumen alteration which is here not very intense [15,16]. Values higher that -100 (‰ / SMOW) in resins of samples No.3547 and No.3547 bis reflect even a well-preserved fraction [17]. One may note the good match between the values for samples No.3547 and No.3547 bis as well as for samples No.3545 and No.3545 bis (Figure 7) which documents the reliability of δD values.
3.3. Biomarker Analysis
Mass fragmentograms of steranes (m/z 217) and terpanes (m/z 191) of two torpedo C potsherds are presented in Figure 8.
Terpanes of sample No.3539 show a high Tm/Ts ratio, a moderate gammacerane content, the complete hopane family and the occurrence of the hexahydrobenzohopane series (C32/6 to C35/6). The tricyclopolyprenanes are missing (water washing ? biodegradation ? origin ?). The steranes are biodegraded with a classical pattern (C27<C28<C29). No selective degradation of C29αααR is seen.
Terpanes of sample No.3546 has also a high Tm/Ts ratio but the outstanding feature is the occurrence of 18(α)H-oleanane, characteristic of oils from Khuzestan, Busher and Fars [18]. In this sample, tricyclopolyprenanes (C23/3 to C29/3) and hexahydrobenzohopanes (C32/6 to C35/6) are present. Steranes are not biodegraded and as expected with this type of chemistry, contain diasteranes (C27S and C27R dia). The occurrence of 18α(H)-oleanane, identified on samples in Figure 4 and Figure 7, confirm the existence of at least two main groups of bitumens as already expected on the basis of δ13C data.
Biomarker data are listed in Table 3.
The plot of Ts/Tm vs. δ13Casp (‰ / VPDB) and 18α(H)-oleanane vs. C30αβHopane (ppm) in Figure 9 confirms the distribution of the samples into two main groups : samples No.3543, 3546, 3547, 3547bis, 3545, 3545bis, 3627, 3623 and 3624 on one side, samples No.3539, 3540+3541, 3542, 3544, 3625 and 3626 on the other side. The sample No.3543 shows extreme values which are due to the high degree of biodegradation of steranes and terpanes as documented by the mass fragmentograms shown in Figure 9. Reference to types of potsherd and amphorae in Figure 9 shows that there is no relationship between the type of bitumen and the type of potsherd.
The plot of % C27αββsteranes vs. % C28αββsteranes vs. % C29αββsteranes in a ternary diagram (Figure 10), used to determine the origin of bitumens, confirm the two main groups of samples already defined : group I with samples No. 3539, 3540+3541, 3542, 3544, 3525 and 3526 originating from the Kermanshah province and group II with samples No.3543, 3545, 3545bis, 3546, 3547, 3547bis, 3623, 3624, and 3627 sourced from the Khuzestan and Fars Provinces. Sample No.3542 which has a particular behaviour, is here falling within group II.
The plot of Diasteranes/Regular steranes vs. Steranes/ Terpanes or vs. C24Tetracyclic terpane/ C23tricyclic terpanes (not shown) confirms the identified two groups of samples.
The plot of Ts/Tm vs. δ13Casp (‰ / VPDB) of al-Qusur data with other data already published [19] on other sites (F5, F6 and B6) from the Failaka island clearly differentiate al-Qusur from other sites (Figure 11). These sites were covering other periods : Hellenistic (B6 and F5), Kassite (F6) and Early Dilmun (F6) and bitumens were coming from Iraq and Kuwait.
3.4. Detailed Geochemical Study of Samples No.3545 and 3545bis
Large bitumen coated basins (SPORC) were identified within room R8 of building B20, in the last occupation layer of this food- processing workshop, dated between the end of the 8th and the beginning of the 9th century (Figure 1). These jars stand out from the rest of the ceramic corpus in terms of their shape and size. A functional study was carried out by combining all the data available prior to the physico-chemical analysis. The presence of numerous ichthyological remains in the adjoining room, engravings in the shape of fish on the body of one of the jars, the presence of bitumen and a base studded with perforations suggesting a filtration system, all point to the manufacture of ‘murri’. This medieval recipe similar to ancient garum, use small, dried fish, wine and various herbs and spices. This hypothesis was based on textual sources linking the consumption of this condiment to Christian communities [3].
The sample that we analyzed in duplicate (No.3545 and 3545 bis) came from the larger basin, which seems to be a kind of juice strainer to filter the « garum-like juice ». The mineralogical analysis carried out by Renaud Gley at the University of Lorraine (France) did not find evidence for any halite (NaCl), but classical mineral additives of archaeological bituminous mixtures [18]: quartz, calcite and dolomite as the dominant minerals and calcium sulfates (gypsum and anhydrite) often present in carbonates lithologies (Figure 12). In addition, clays (illite) and plagioclastes (albite) were also identified.
The sample was analyzed by Philippe Schaeffer, University of Strasbourg, for complementary organic analyses.
The mixture has been subsequently fractionated into two fractions : hydrocarbons and then alcohols and methyl esters. The gas chromatograms of the two fractions are shown in Figure 14. The hydrocarbon fraction F1 shows a distribution typical for a biodegraded bitumen (abundant unresolved complex mixture, lack of n-alkanes and isoprenoids, abundant hopane family). The fraction F2 also shows an unresolved complex mixture associated with biodegraded bitumen. This fraction has also been analyzed by GC-MS in order to try to detect diagnostic compounds : fatty acids, terpenoids, for instance. However no specific compounds could be identified. As a consequence, it seems that the bitumen matrix has not adsorbed any molecules from the presumed ’’garum’’ filtered in the basin.
Although there are many arguments in favour of the production of ‘murri’, the absence of organic markers linked to fish products means that the functional analysis can be redirected towards the manufacture of alcoholic beverages.
4. Conclusions
The geochemical analysis of the 13 samples has shown the occurrence of bitumen in all samples.
This bitumen has different origins : Kermanshah province and Khuzestan, Fars and Busher provinces in Iran.
The coating of the big basin with numerous holes (QSR16-A4/57) is composed mainly of bitumen and minerals, a typical archaeological bituminous mixture. No trace of the ‘’garum’’ has been found within this mixture. It is interesting to notice here that the organic matter analysis can infirm or help to reevaluate archaeological hypotheses, even if they were elaborated and seemed quite possible.
References
- Bonnéric, J. Mission archéologique franco-koweïtienne de Faïlaka : Le monastère sassanido-islamique d’al-Qusur. Dossier « Prix Clio» 2018, 1-19.
- Bonnéric, J. Archaeological evidence of an early Islamic monastery in the centre of al-Qusur (Failaka Island, Kuwait). Arab. Archaeol. Epigr. 2021, 32, 50–61. [Google Scholar] [CrossRef]
- Bonnéric, J. Why islands ? Understanding the insular location of late Sasanian and Early Islamic Christian monasteries in the Arab-Persian Gulf. Durand, C. ; Marchand, J. ; Redon, B. ; Schneider, P. ; Networked spaces. The spatiality of networks in the Red Sea and Western Indian Ocean, 2022, 193-210. https://doi:10.4000/booksmomeditions.16271.
- Perrogon, R.; Bonnéric, J. A consideration on the interest of a pottery typology adapted to the late Sasanian and early Islamic monastery at al-Qusur (Kuwait). Arab. Archaeol. Epigr. 2021, 32, 70–82. [Google Scholar] [CrossRef]
- Di Miceli, A. The site of Al-Qurainiyah: Topography and phases of an early Islamic coastal settlement on Failaka Island. Arab. Archaeol. Epigr. 2021, 32, 62–69. [Google Scholar] [CrossRef]
- Priestman, S. Bushehr, Dashtestan and Siraf: the Transformation of the Maritime Trade Network in the Middle Persian Gulf In Simpson, St-J. (Ed.) Sasanian Archaeology: Settlements, Environment and Material Culture, Oxford: Archaeopress Publishing Ltd, 2022, pp.
- Name:seth, [.C.G.
- Simpson, St-J. Sasanian Pottery: Archaeological Evidence for Production, Circulation and Diachronic Change In Simpson, St-J (Ed.) Sasanian Archaeology: Settlements, Environment and Material Culture, Oxford: Archaeopress Publishing Ltd, 2022, pp.
- Kawamata, M. Telūl Hamediyāt near Tells Gubba and Songor: part III. Al-Rāfidān 12, 1991, pp. 249-260.
- Carter, R. , Connan, J., Priestman, S., Tomber, R., Torpedo jars from Sir Bani Yas, Abu Dhabi. Tribulus, Journal of the Emirates natural History Group 19, 2011, pp.162-163.
- Carter, R. Christianity in the Gulf during the first centuries of Islam. Arab. Archaeol. Epigr. 2008, 19, 71–108. [Google Scholar] [CrossRef]
- Priestman, S. Ceramic exchange and the Indian Ocean economy (AD 400-1275) Volume 1: Analysis, The British Museum, 2021. [CrossRef]
- Carvajal López, J.; Guérin, A. & Georgakopoulou, M. Petrographic analysis of ceramics from Murwab, an early Islamic site in Qatar Proceedings of the Seminar for Arabian Studies 51, 2022, pp. 55-70.
- West, N.; Alexander, R.; Kagi, R.I. The use of silicalite for rapid isolation of branched and cyclic alkane fractions of petroleum. Org. Geochem. 1990, 15, 499–501. [Google Scholar] [CrossRef]
- Connan, J.; Engel, M.H.; Jackson, R.B.; Priestman, S.; Vosmer, T.; Zumberge, A. Geochemical Analysis of Two Samples of Bitumen from Jars Discovered on Muhut and Masirah Islands (Oman). Separations 2021, 8, 182. [Google Scholar] [CrossRef]
- Charrié-Duhaut, A.; Lemoine, S.; Adam, P.; Connan, J.; Albrecht, P. Abiotic oxidation of petroleum bitumens under natural conditions. Org. Geochem. 2000, 31, 977–1003. [Google Scholar] [CrossRef]
- Connan, J.; Borrell, F.; Vardi, J.; Wolff, S.; Ortiz, S.M.; Engel, M.; Gley, R.; Zumberge, A. Geochemical analysis of bituminous samples from the Pre-Pottery Neolithic B site of Nahal Efe (Northern Negev, Israel): Earliest evidence in the region and an example of alteration of the Dead Sea bitumen. Org. Geochem. 2024, 195. [Google Scholar] [CrossRef]
- Connan, J. Le bitume dans l’Antiquité. Errance, Actes Sud, Arles, France, 2012, pp.272.
- Connan, J.; Carter, R. A geochemical study of bituminous mixtures from Failaka and Umm an-Namel (Kuwait), from the Early Dilmun to the Early Islamic period. Arab. Archaeol. Epigr. 2007, 18, 139–181. [Google Scholar] [CrossRef]
Figure 1.
Location of the bitumen samples in al-Qusur monastery (J.Humbert, C.Raad, © MAFKF).
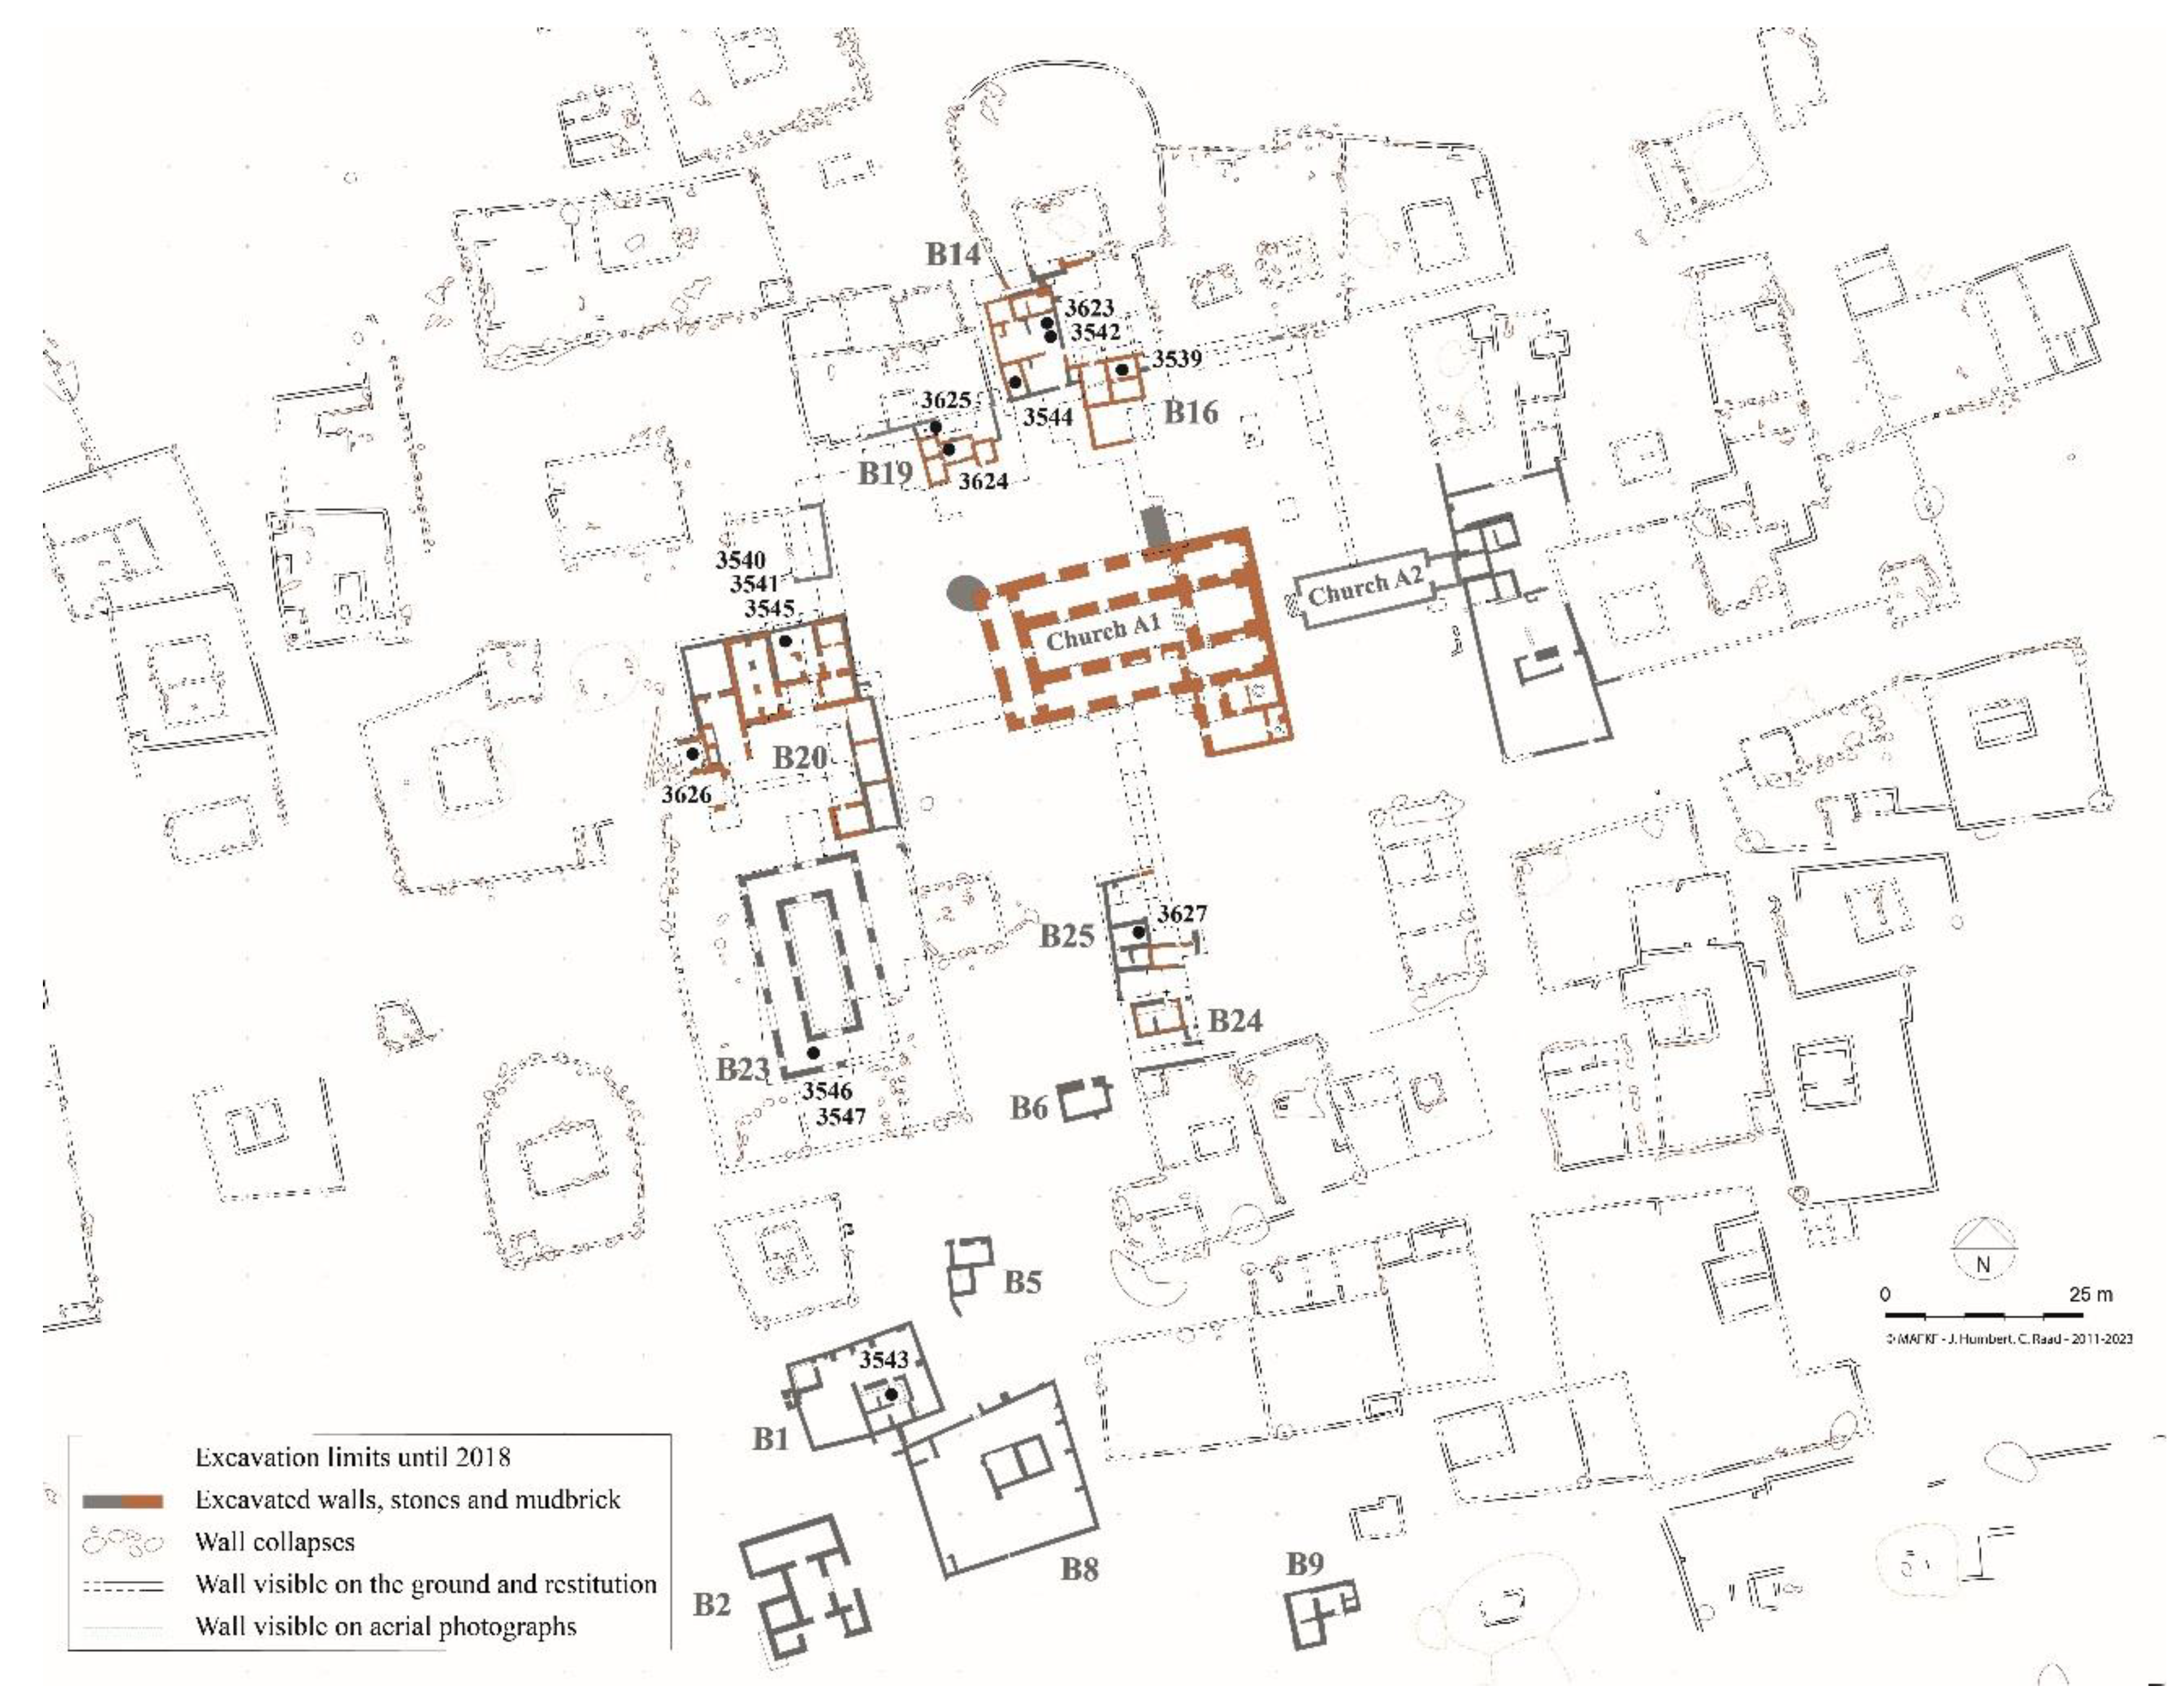
Figure 2.
Picture of eight samples of al-Qusur showing various aspects of the bitumen coating the interior face of potsherds. Some pictures show the situation before and after sampling.
Figure 2.
Picture of eight samples of al-Qusur showing various aspects of the bitumen coating the interior face of potsherds. Some pictures show the situation before and after sampling.
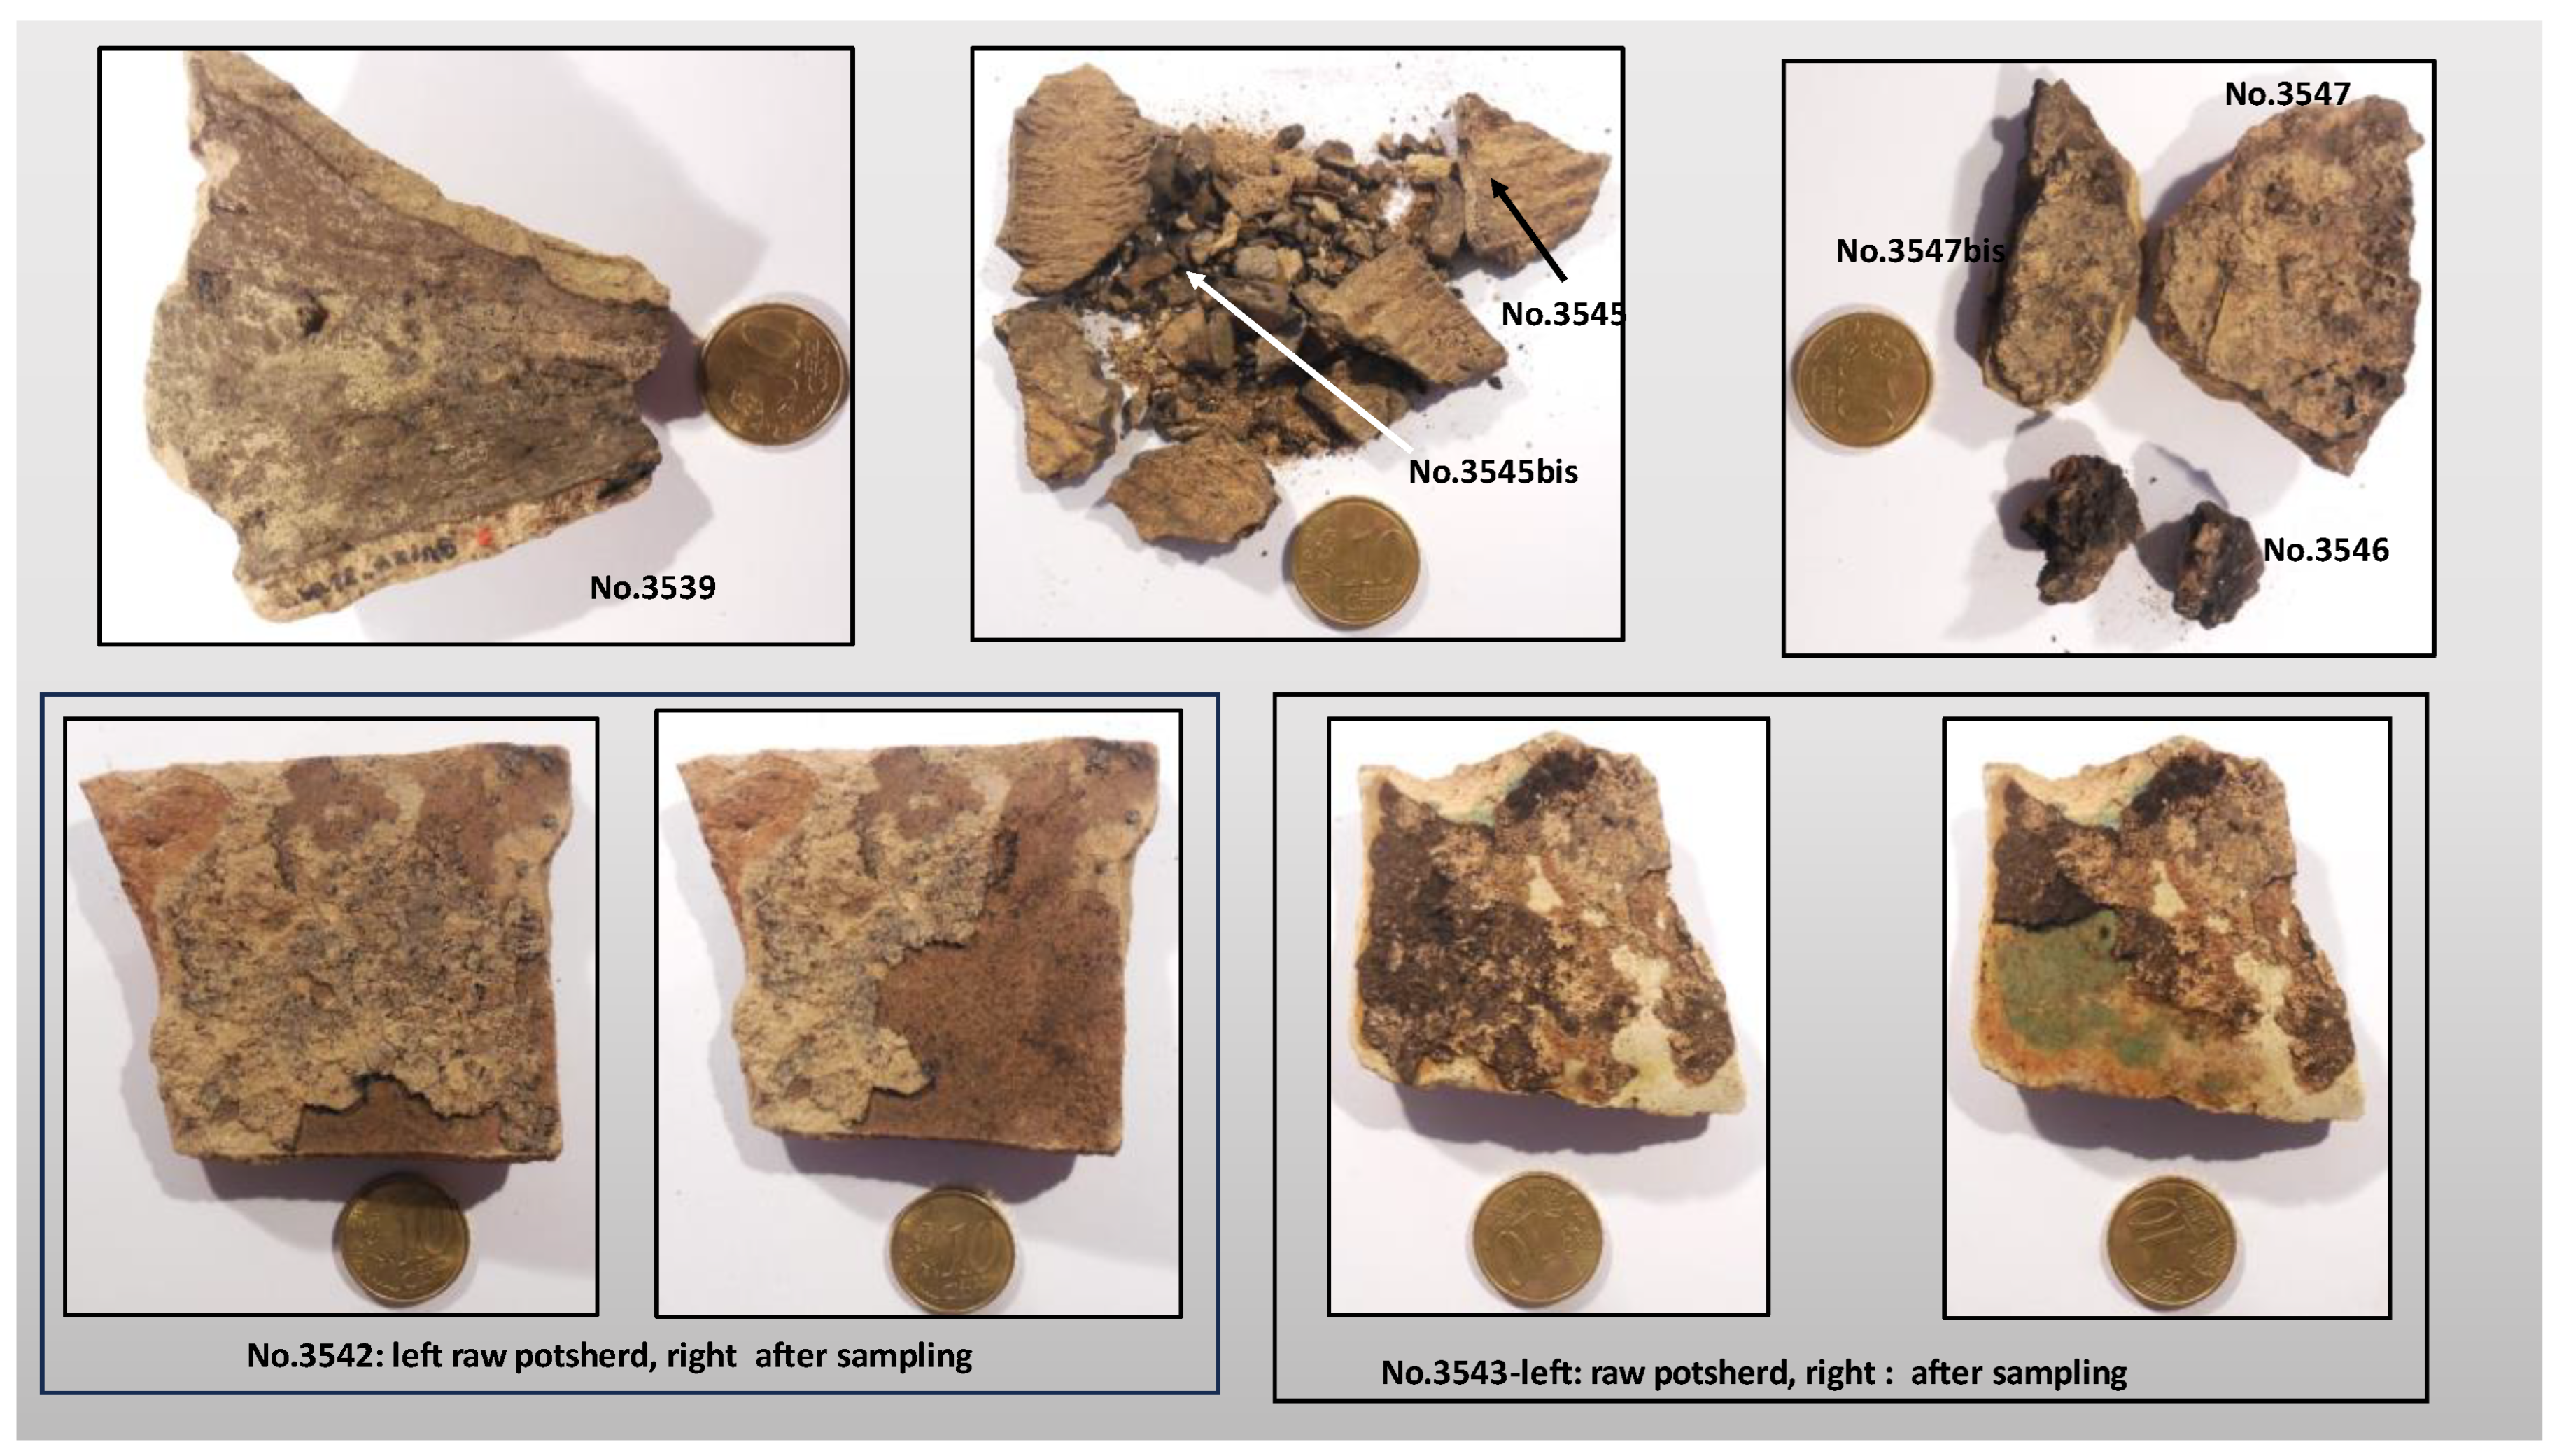
Figure 3.
Gross composition of the dichloromethane extract in two ternary diagrams: % saturates vs. % aromatics vs. % polars and % sat + aro vs. % resins vs. % asphaltenes.
Figure 3.
Gross composition of the dichloromethane extract in two ternary diagrams: % saturates vs. % aromatics vs. % polars and % sat + aro vs. % resins vs. % asphaltenes.
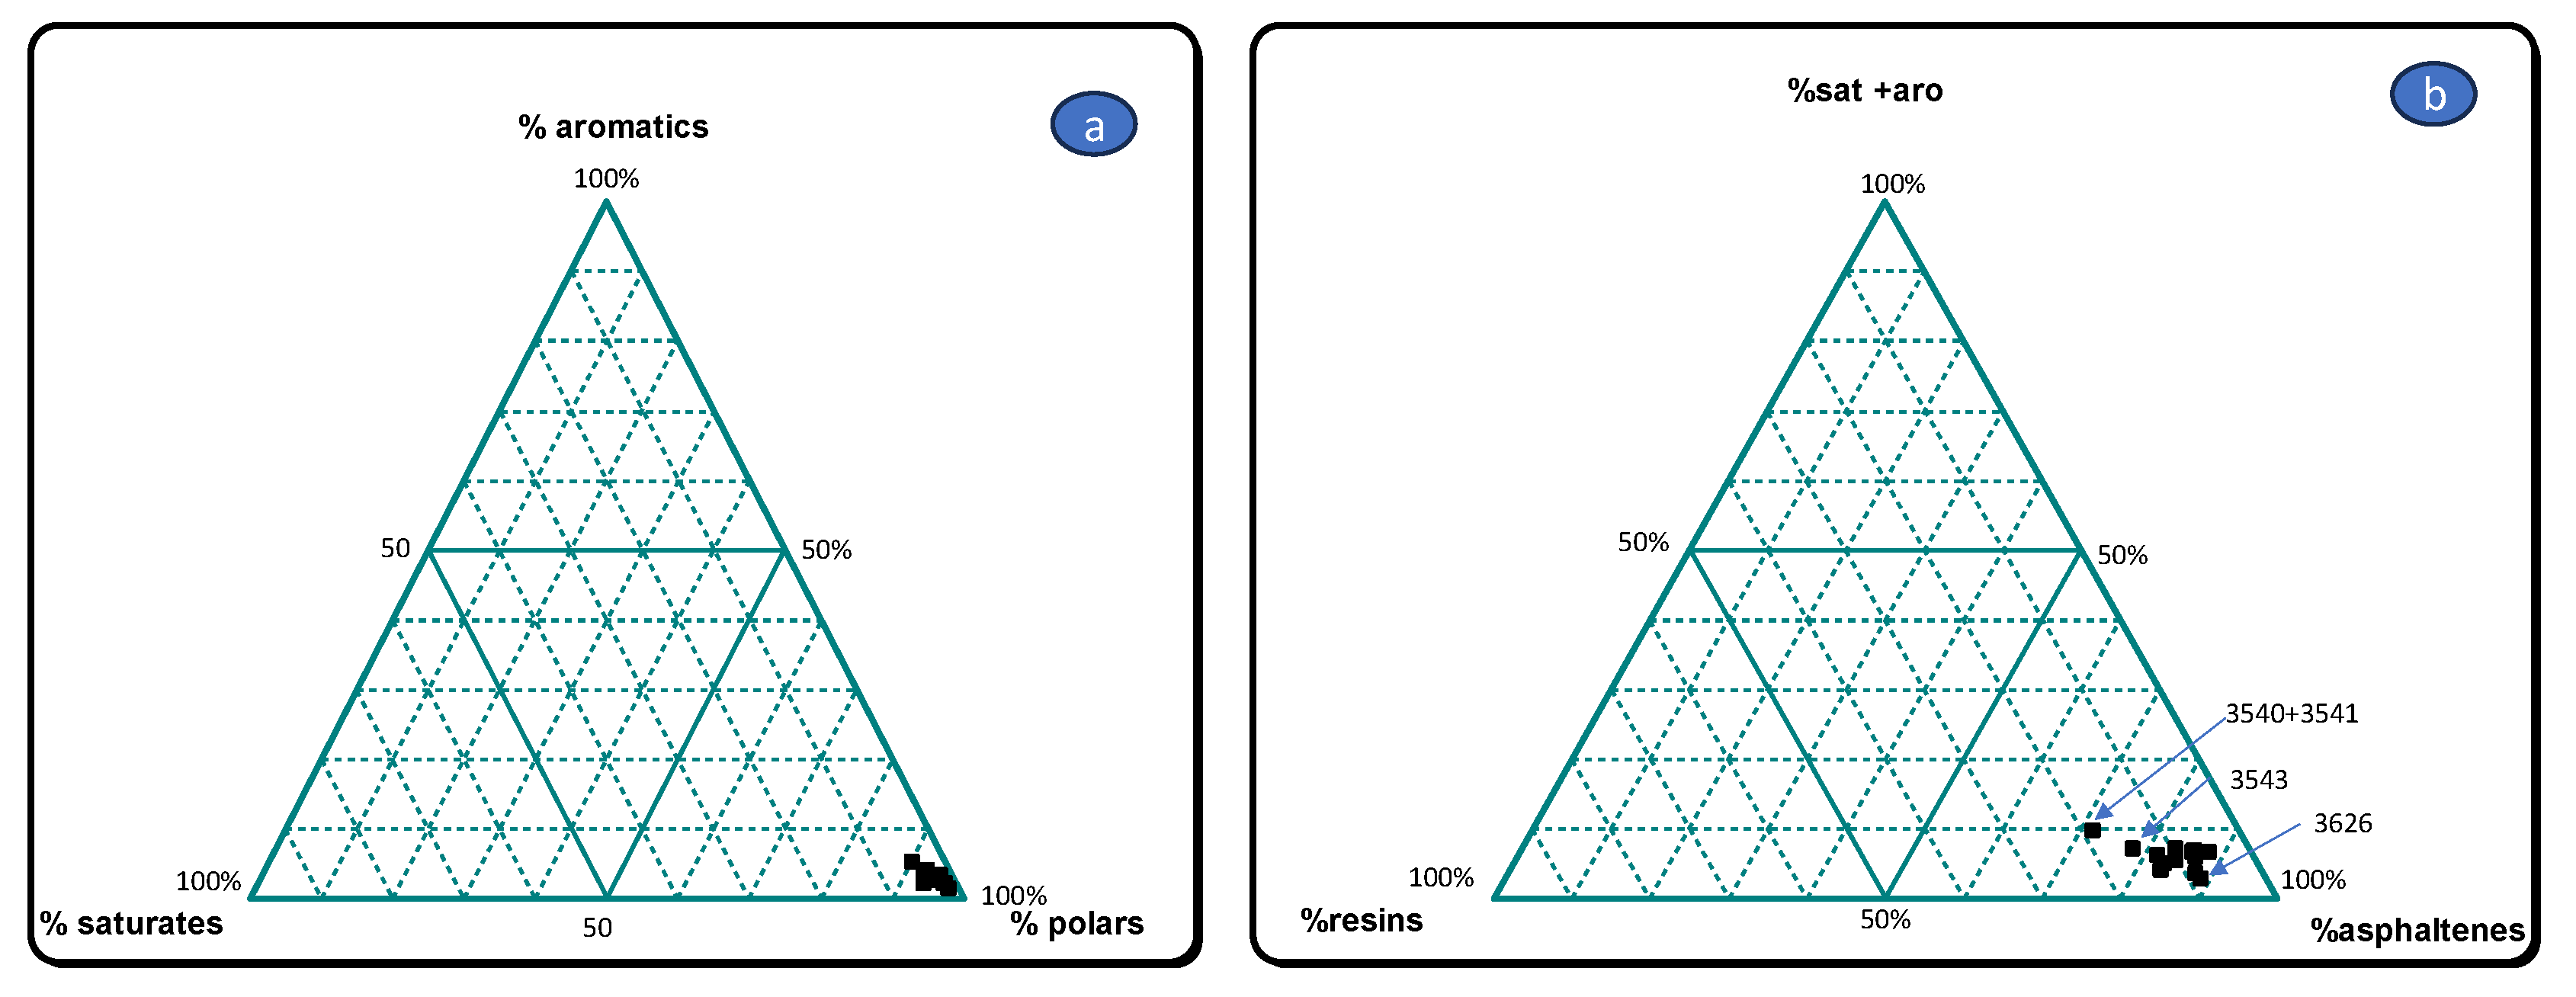
Figure 4.
Plot of δ13C (‰ / VPDB) of aromatics vs. δ13C (‰ / VPDB) of saturates and δ13C (‰ / VPDB) of asphaltenes vs. δ13C (‰ / VPDB) of NSO for the al-Qusur samples.
Figure 4.
Plot of δ13C (‰ / VPDB) of aromatics vs. δ13C (‰ / VPDB) of saturates and δ13C (‰ / VPDB) of asphaltenes vs. δ13C (‰ / VPDB) of NSO for the al-Qusur samples.
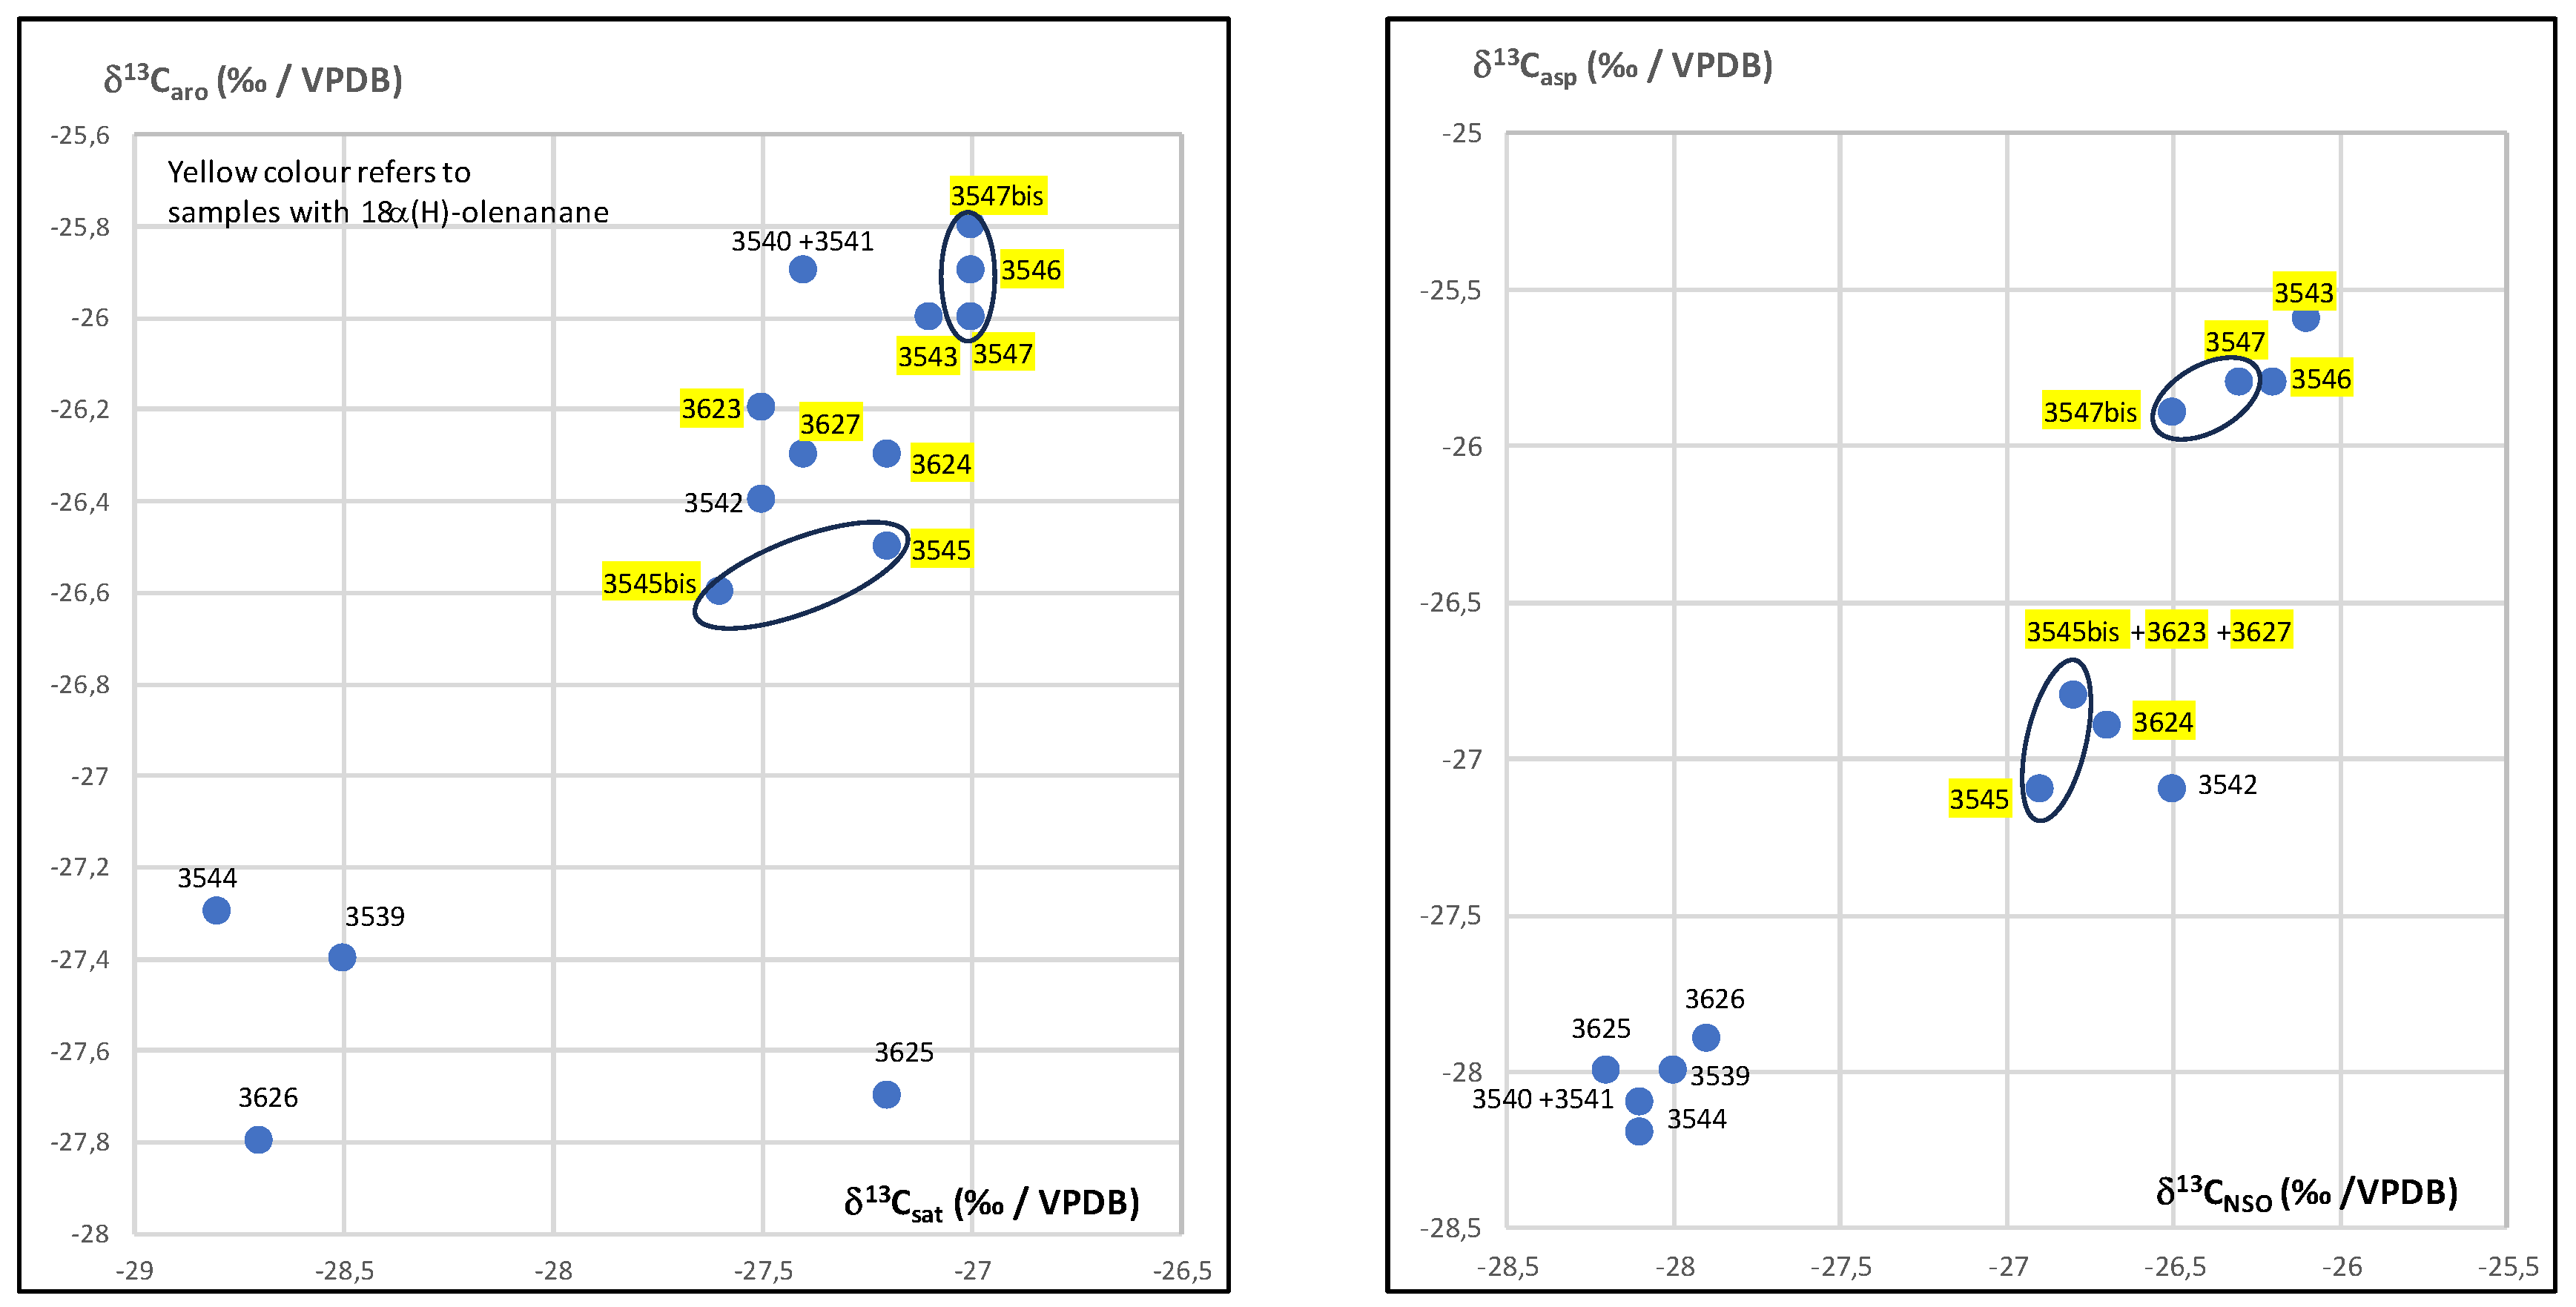
Figure 5.
Plot of δ13C (‰ / VPDB) of aromatics vs. δ13C (‰ / VPDB) of saturates and δ13C (‰ / VPDB) of asphaltenes vs. δ13C of NSO for the 62 and 46 oil seeps of Iraq: Comparison with the al-Qusur’s data.
Figure 5.
Plot of δ13C (‰ / VPDB) of aromatics vs. δ13C (‰ / VPDB) of saturates and δ13C (‰ / VPDB) of asphaltenes vs. δ13C of NSO for the 62 and 46 oil seeps of Iraq: Comparison with the al-Qusur’s data.
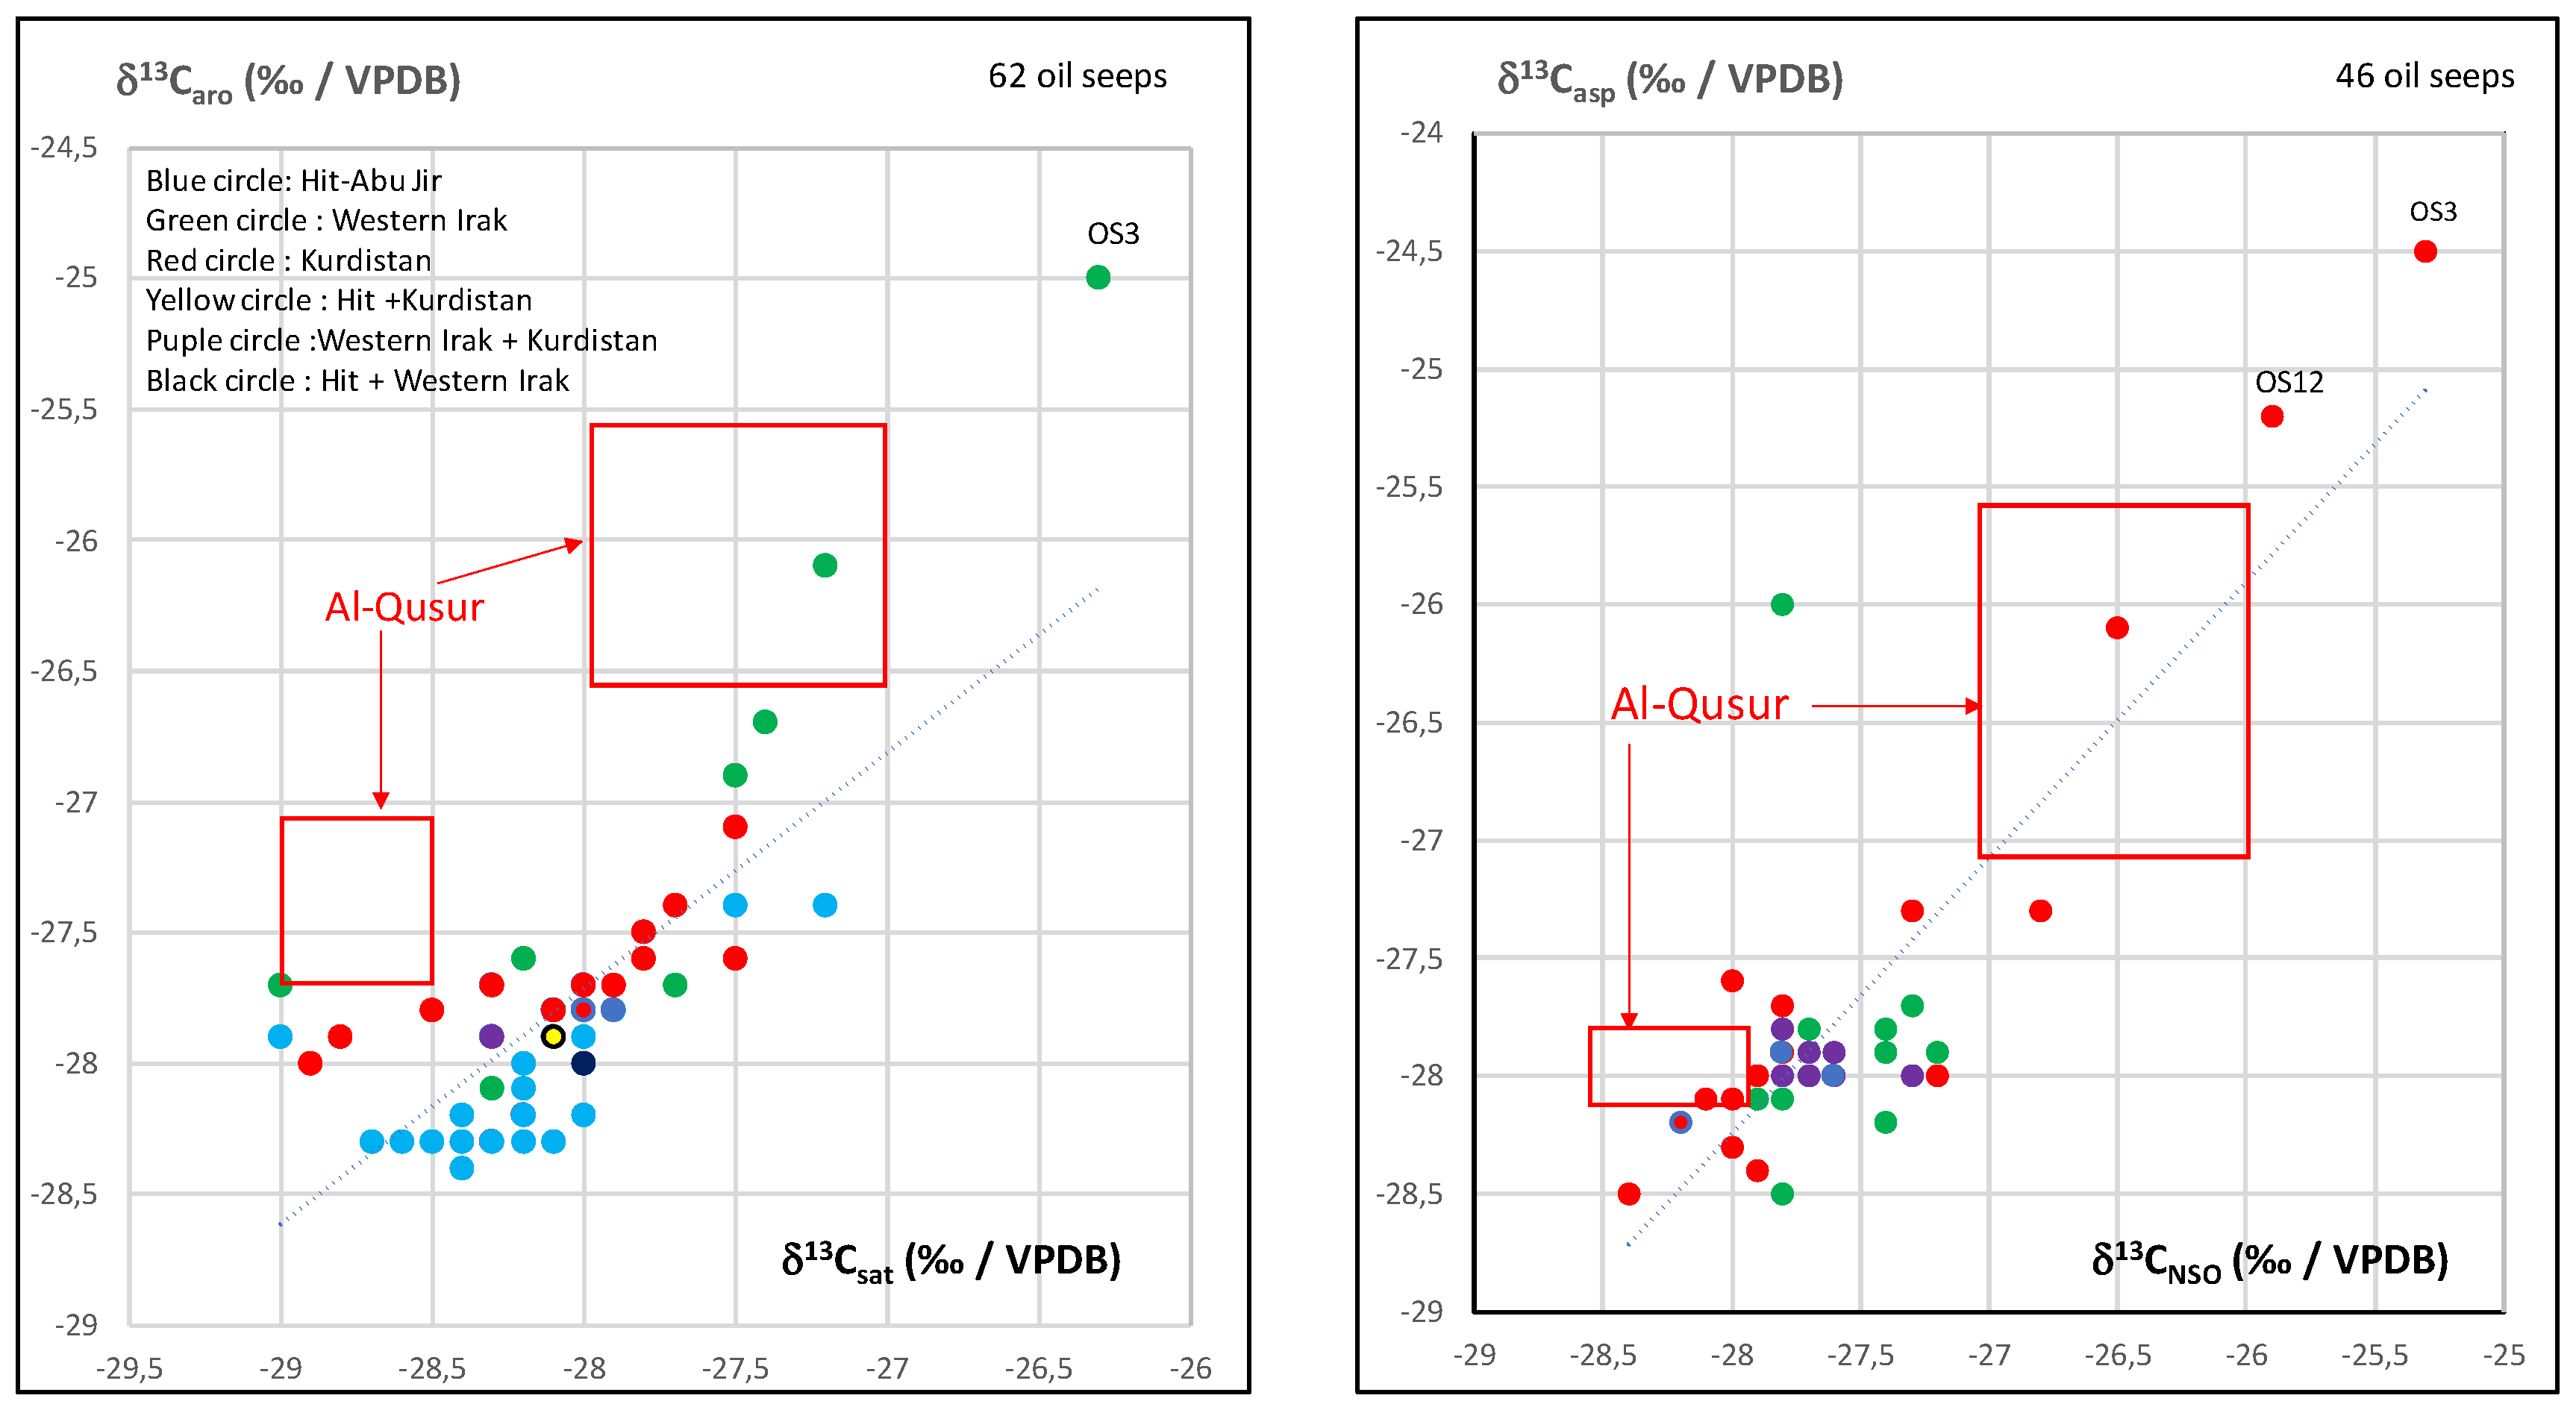
Figure 6.
Plot of δ13C (‰ / VPDB) of aromatics vs. δ13C (‰ / VPDB) of saturates and δ13C (‰ / VPDB) of asphaltenes vs. δ13C of NSO for 52 and 29 oil seeps of Iran: Comparison with the al-Qusur‘s data.
Figure 6.
Plot of δ13C (‰ / VPDB) of aromatics vs. δ13C (‰ / VPDB) of saturates and δ13C (‰ / VPDB) of asphaltenes vs. δ13C of NSO for 52 and 29 oil seeps of Iran: Comparison with the al-Qusur‘s data.
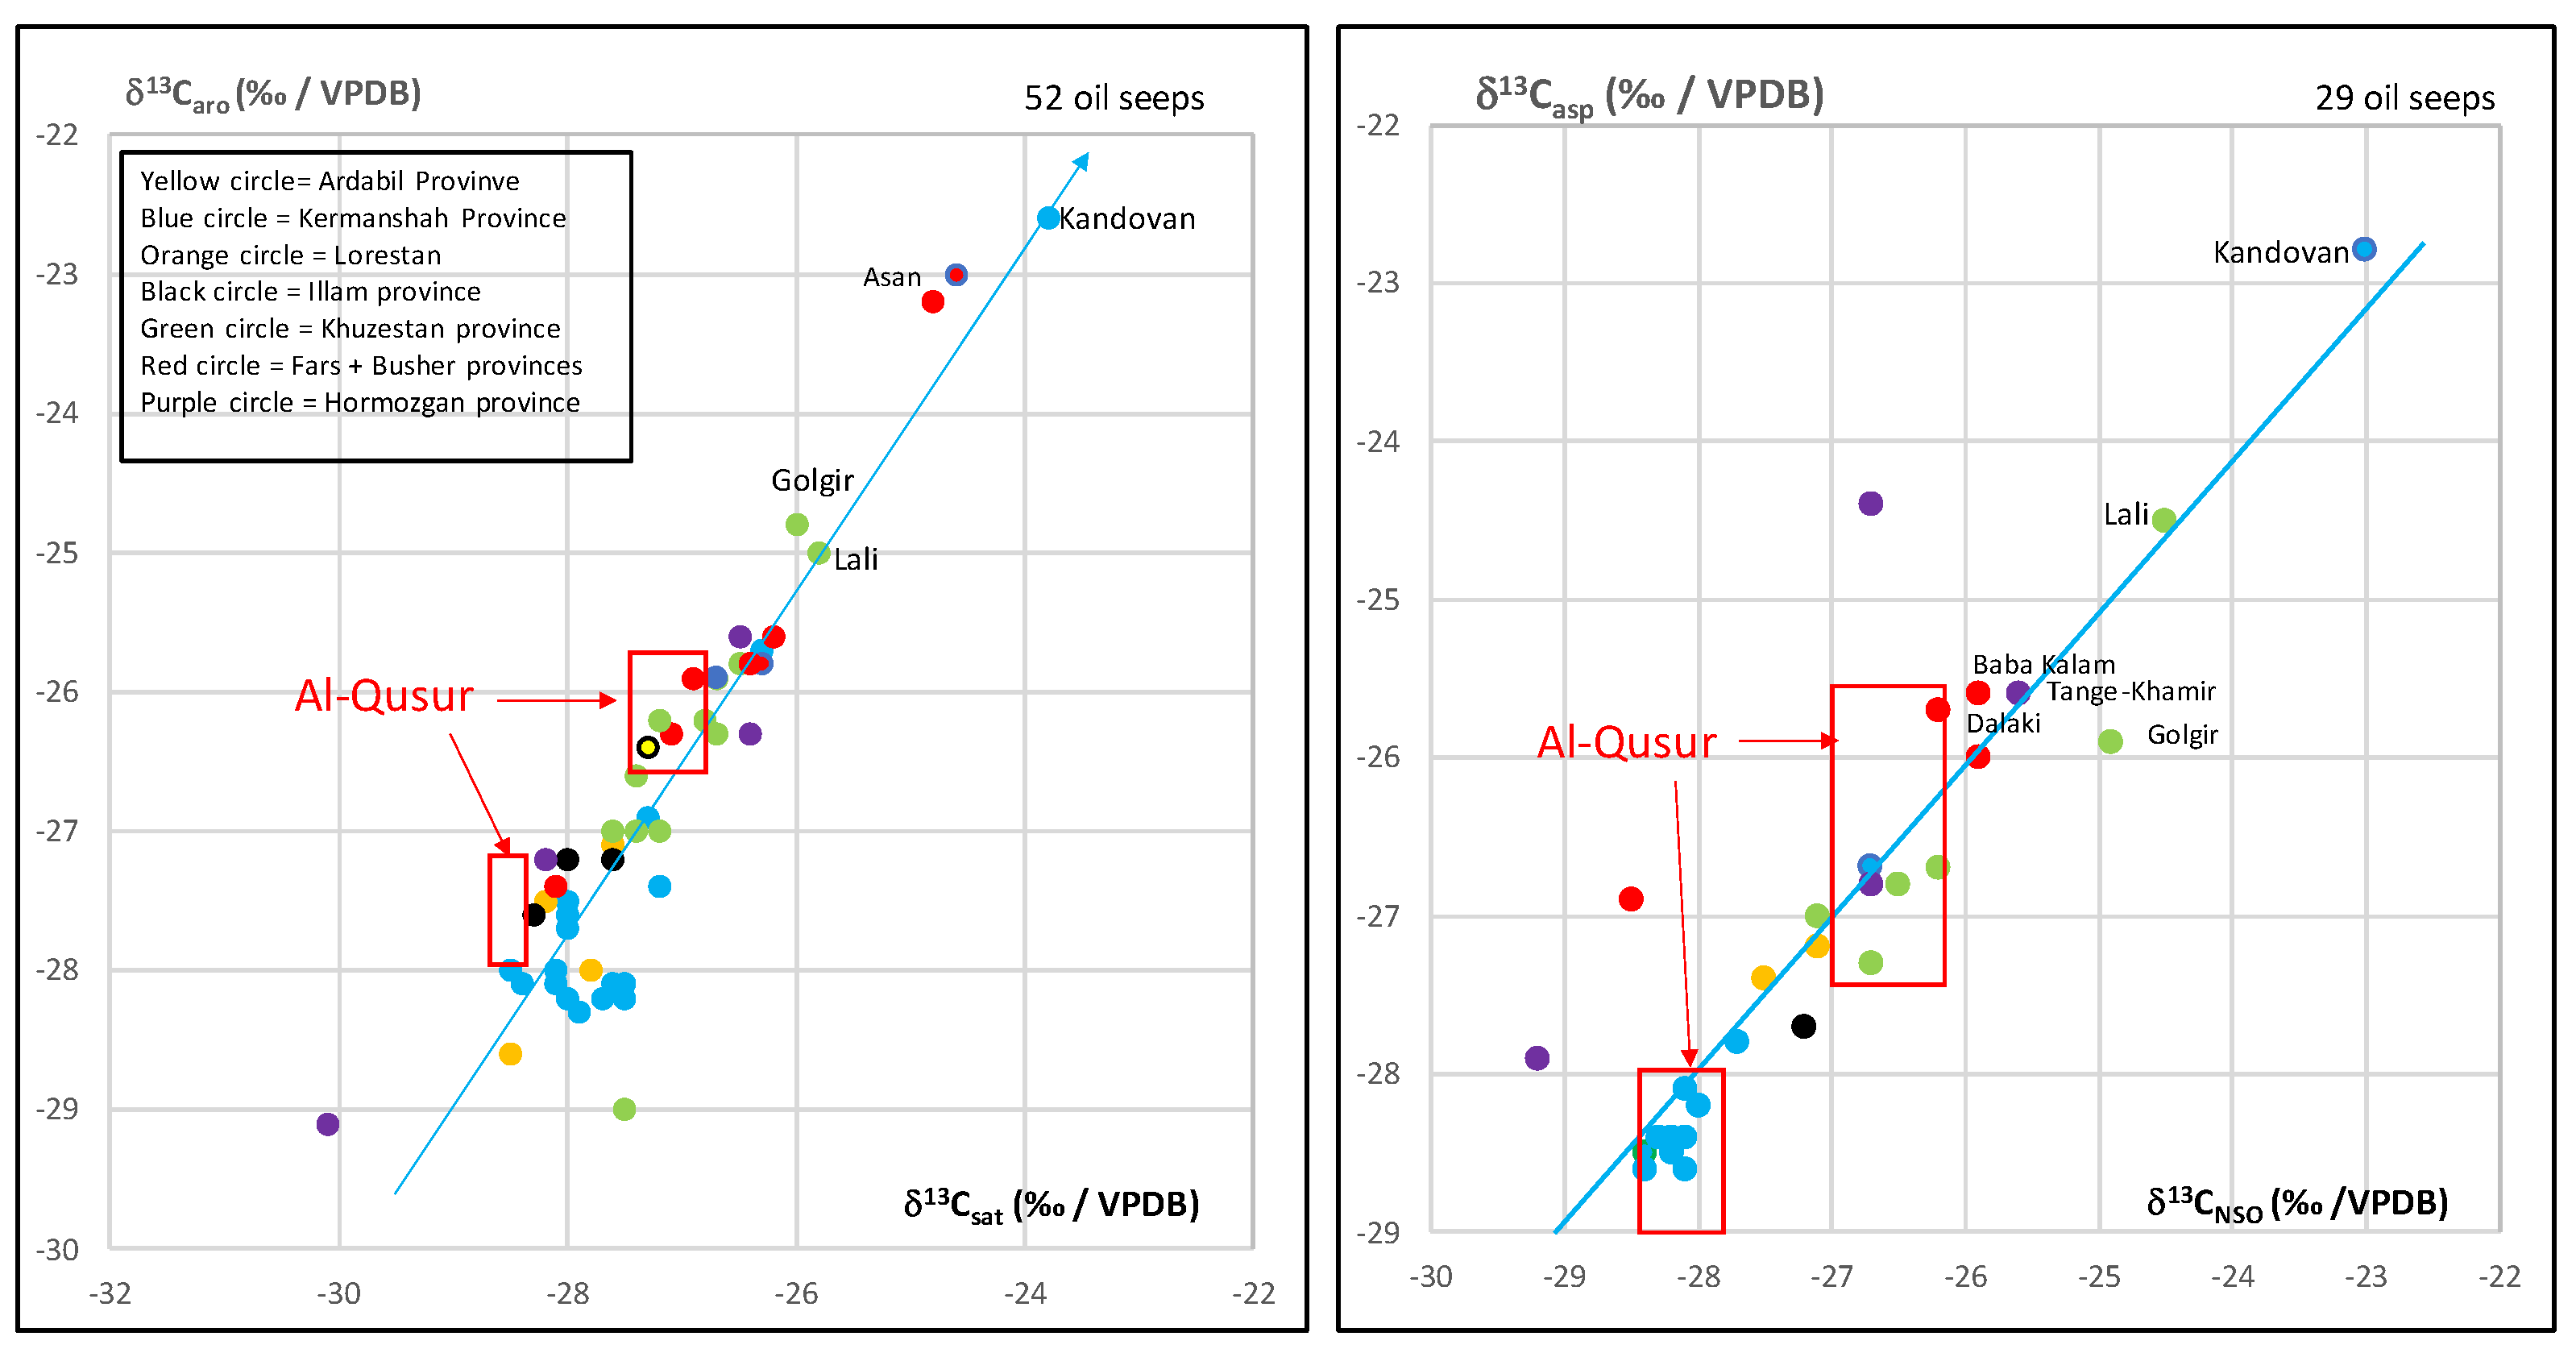
Figure 7.
Plot of the δD (‰ / SMOW) of asphaltenes vs. δD (‰ / SMOW) of resins (NSO) and δD (‰ / SMOW) of asphaltenes vs. δ13C (‰/ VPDB) of asphaltenes with the identification of samples containing 18α(H)-oleanane.
Figure 7.
Plot of the δD (‰ / SMOW) of asphaltenes vs. δD (‰ / SMOW) of resins (NSO) and δD (‰ / SMOW) of asphaltenes vs. δ13C (‰/ VPDB) of asphaltenes with the identification of samples containing 18α(H)-oleanane.
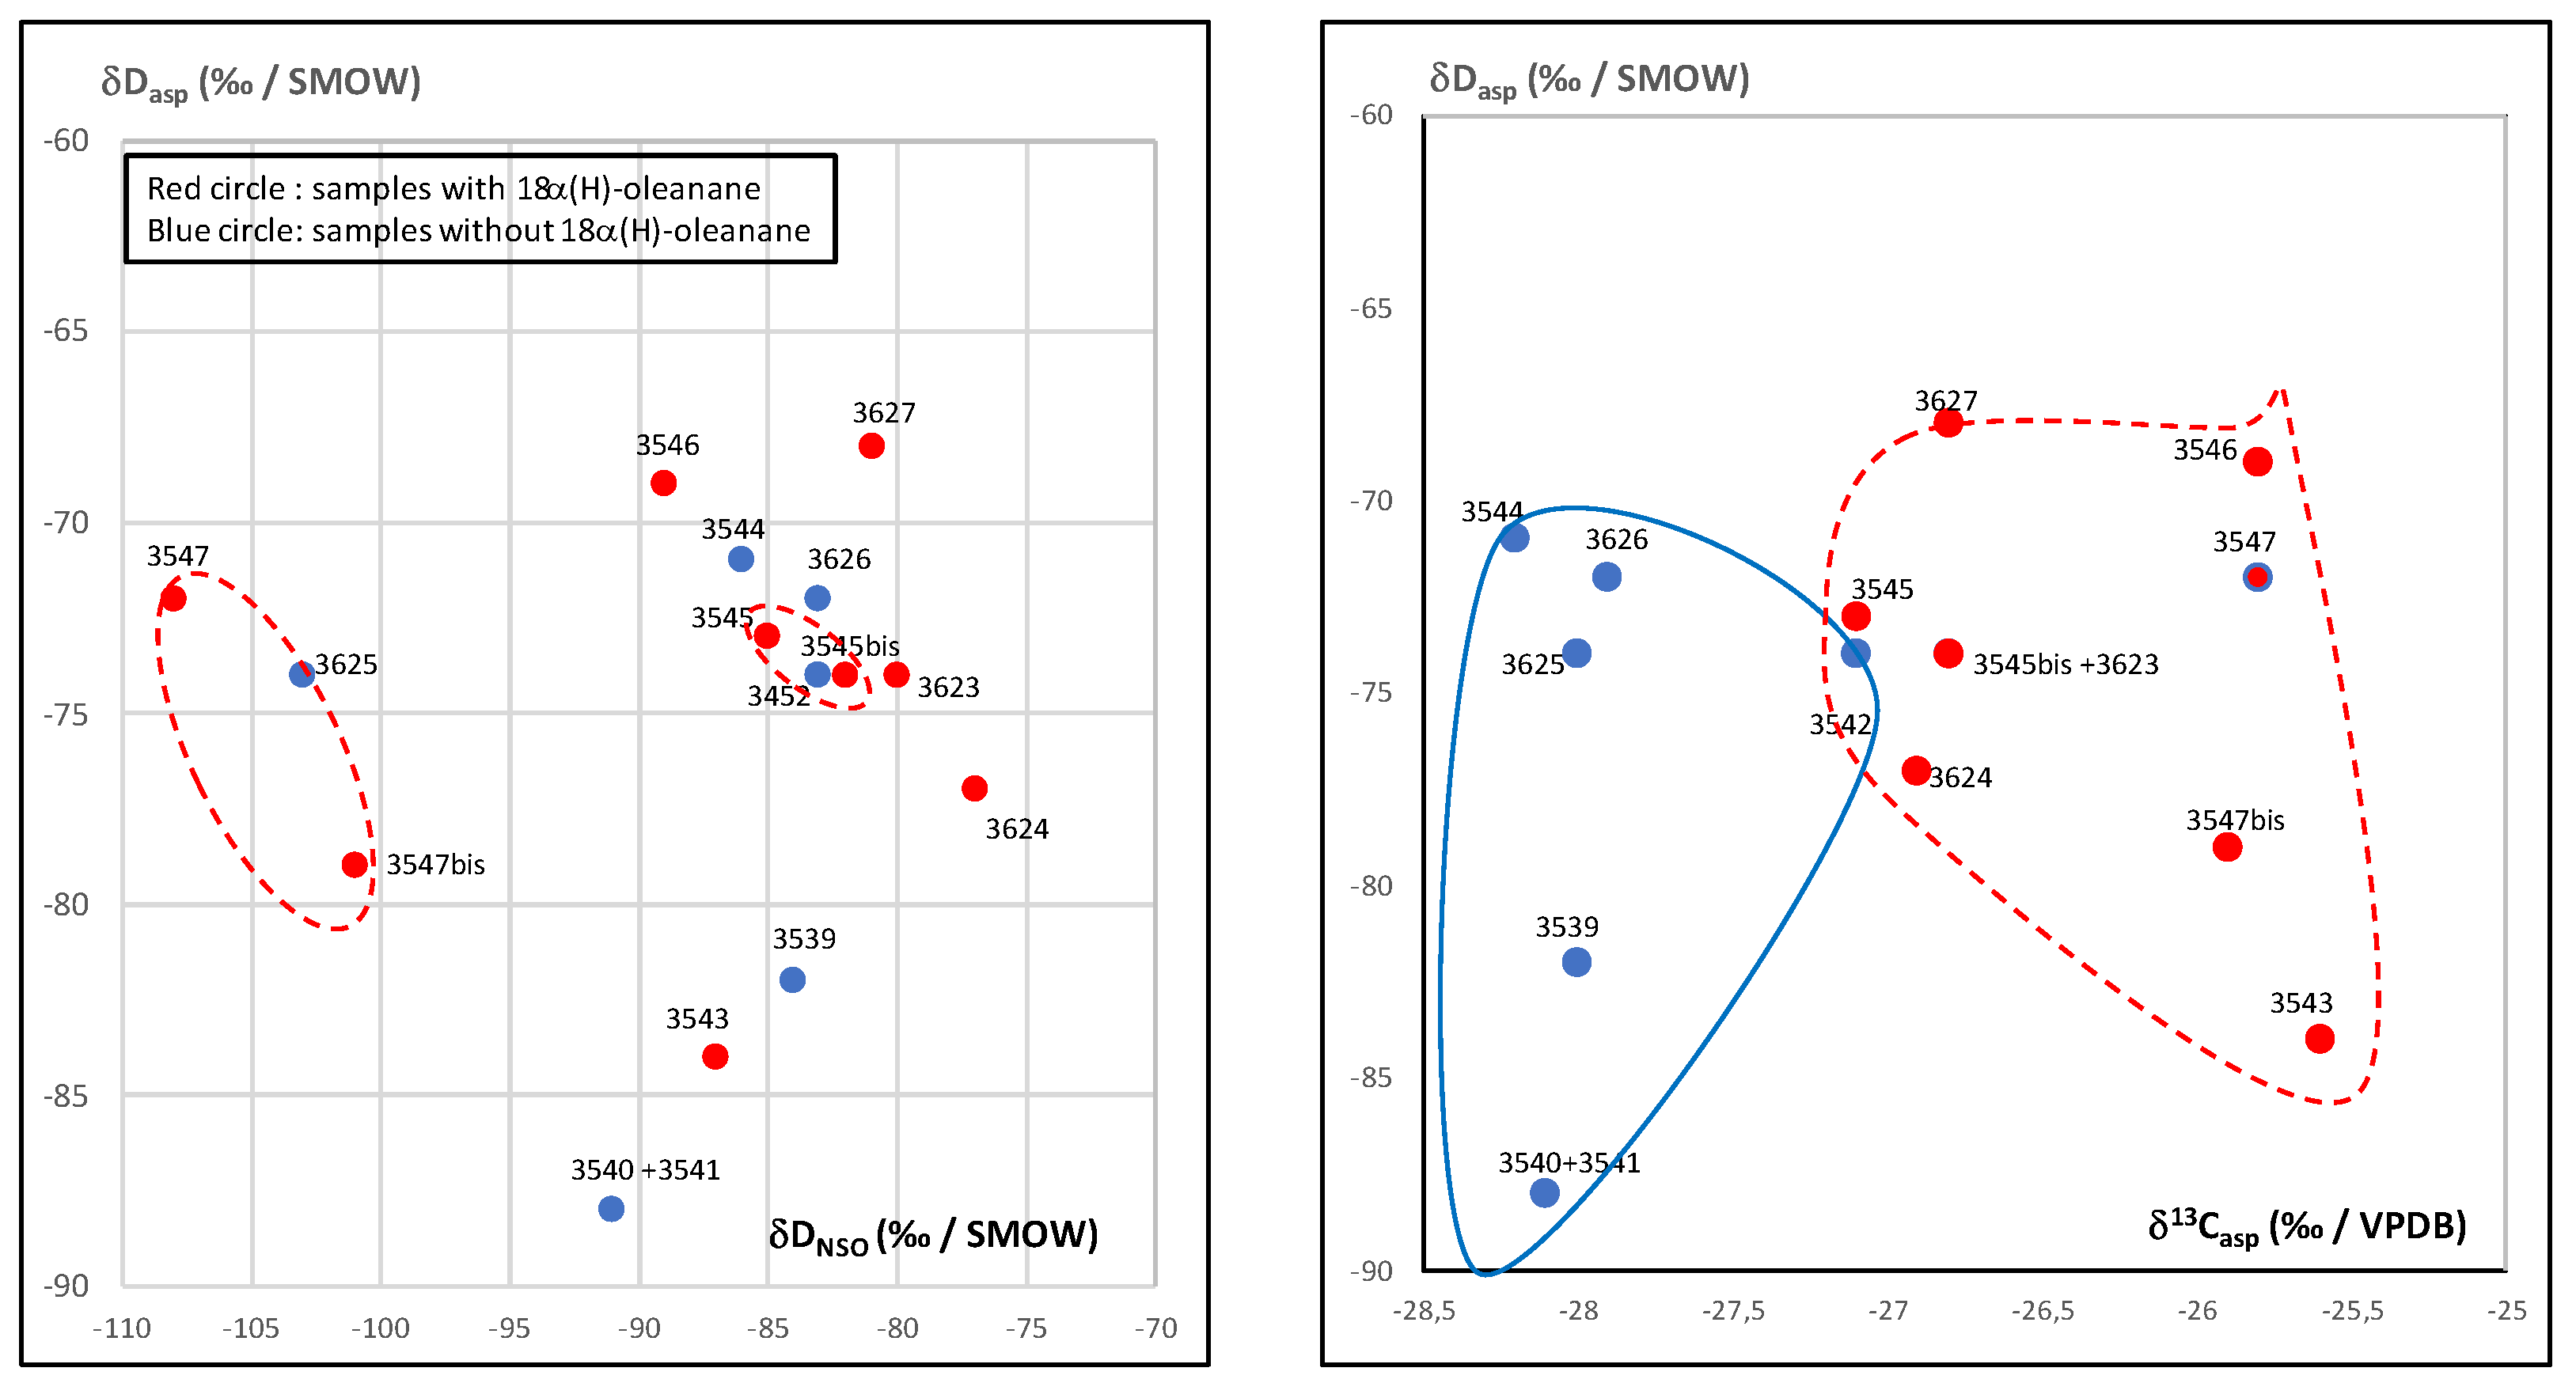
Figure 8.
Mass fragmentograms of steranes (m/z 217) and terpanes (m/z 191) of samples No.3529 without 18α(H)-oleanane and sample No.3546 with 18α(H)-oleanane. Significance of abbreviations: C29αβH= norhopane, C30αβH=17α,21β-hopane, C31αβHR = 17α,21β,22R-30-homohopane, C27αββR+S = 5α,14β,17β-20R+20S-cholestane, C28αββR+S=5α,14β,17β-20R+20S-24methylcholestane, C29αββR+S=5α,14β,17β-20R+20S-24ethylcholestane,C29ααα20S= 5α,14α,17α-20S-24ethylcholestane, Ts=18α-22,29,30-trisnorneohopane, Tm =17α-22,29,30-trisnorhopane, C34αβHS = C34-17α,21β-22S-extended hopane.
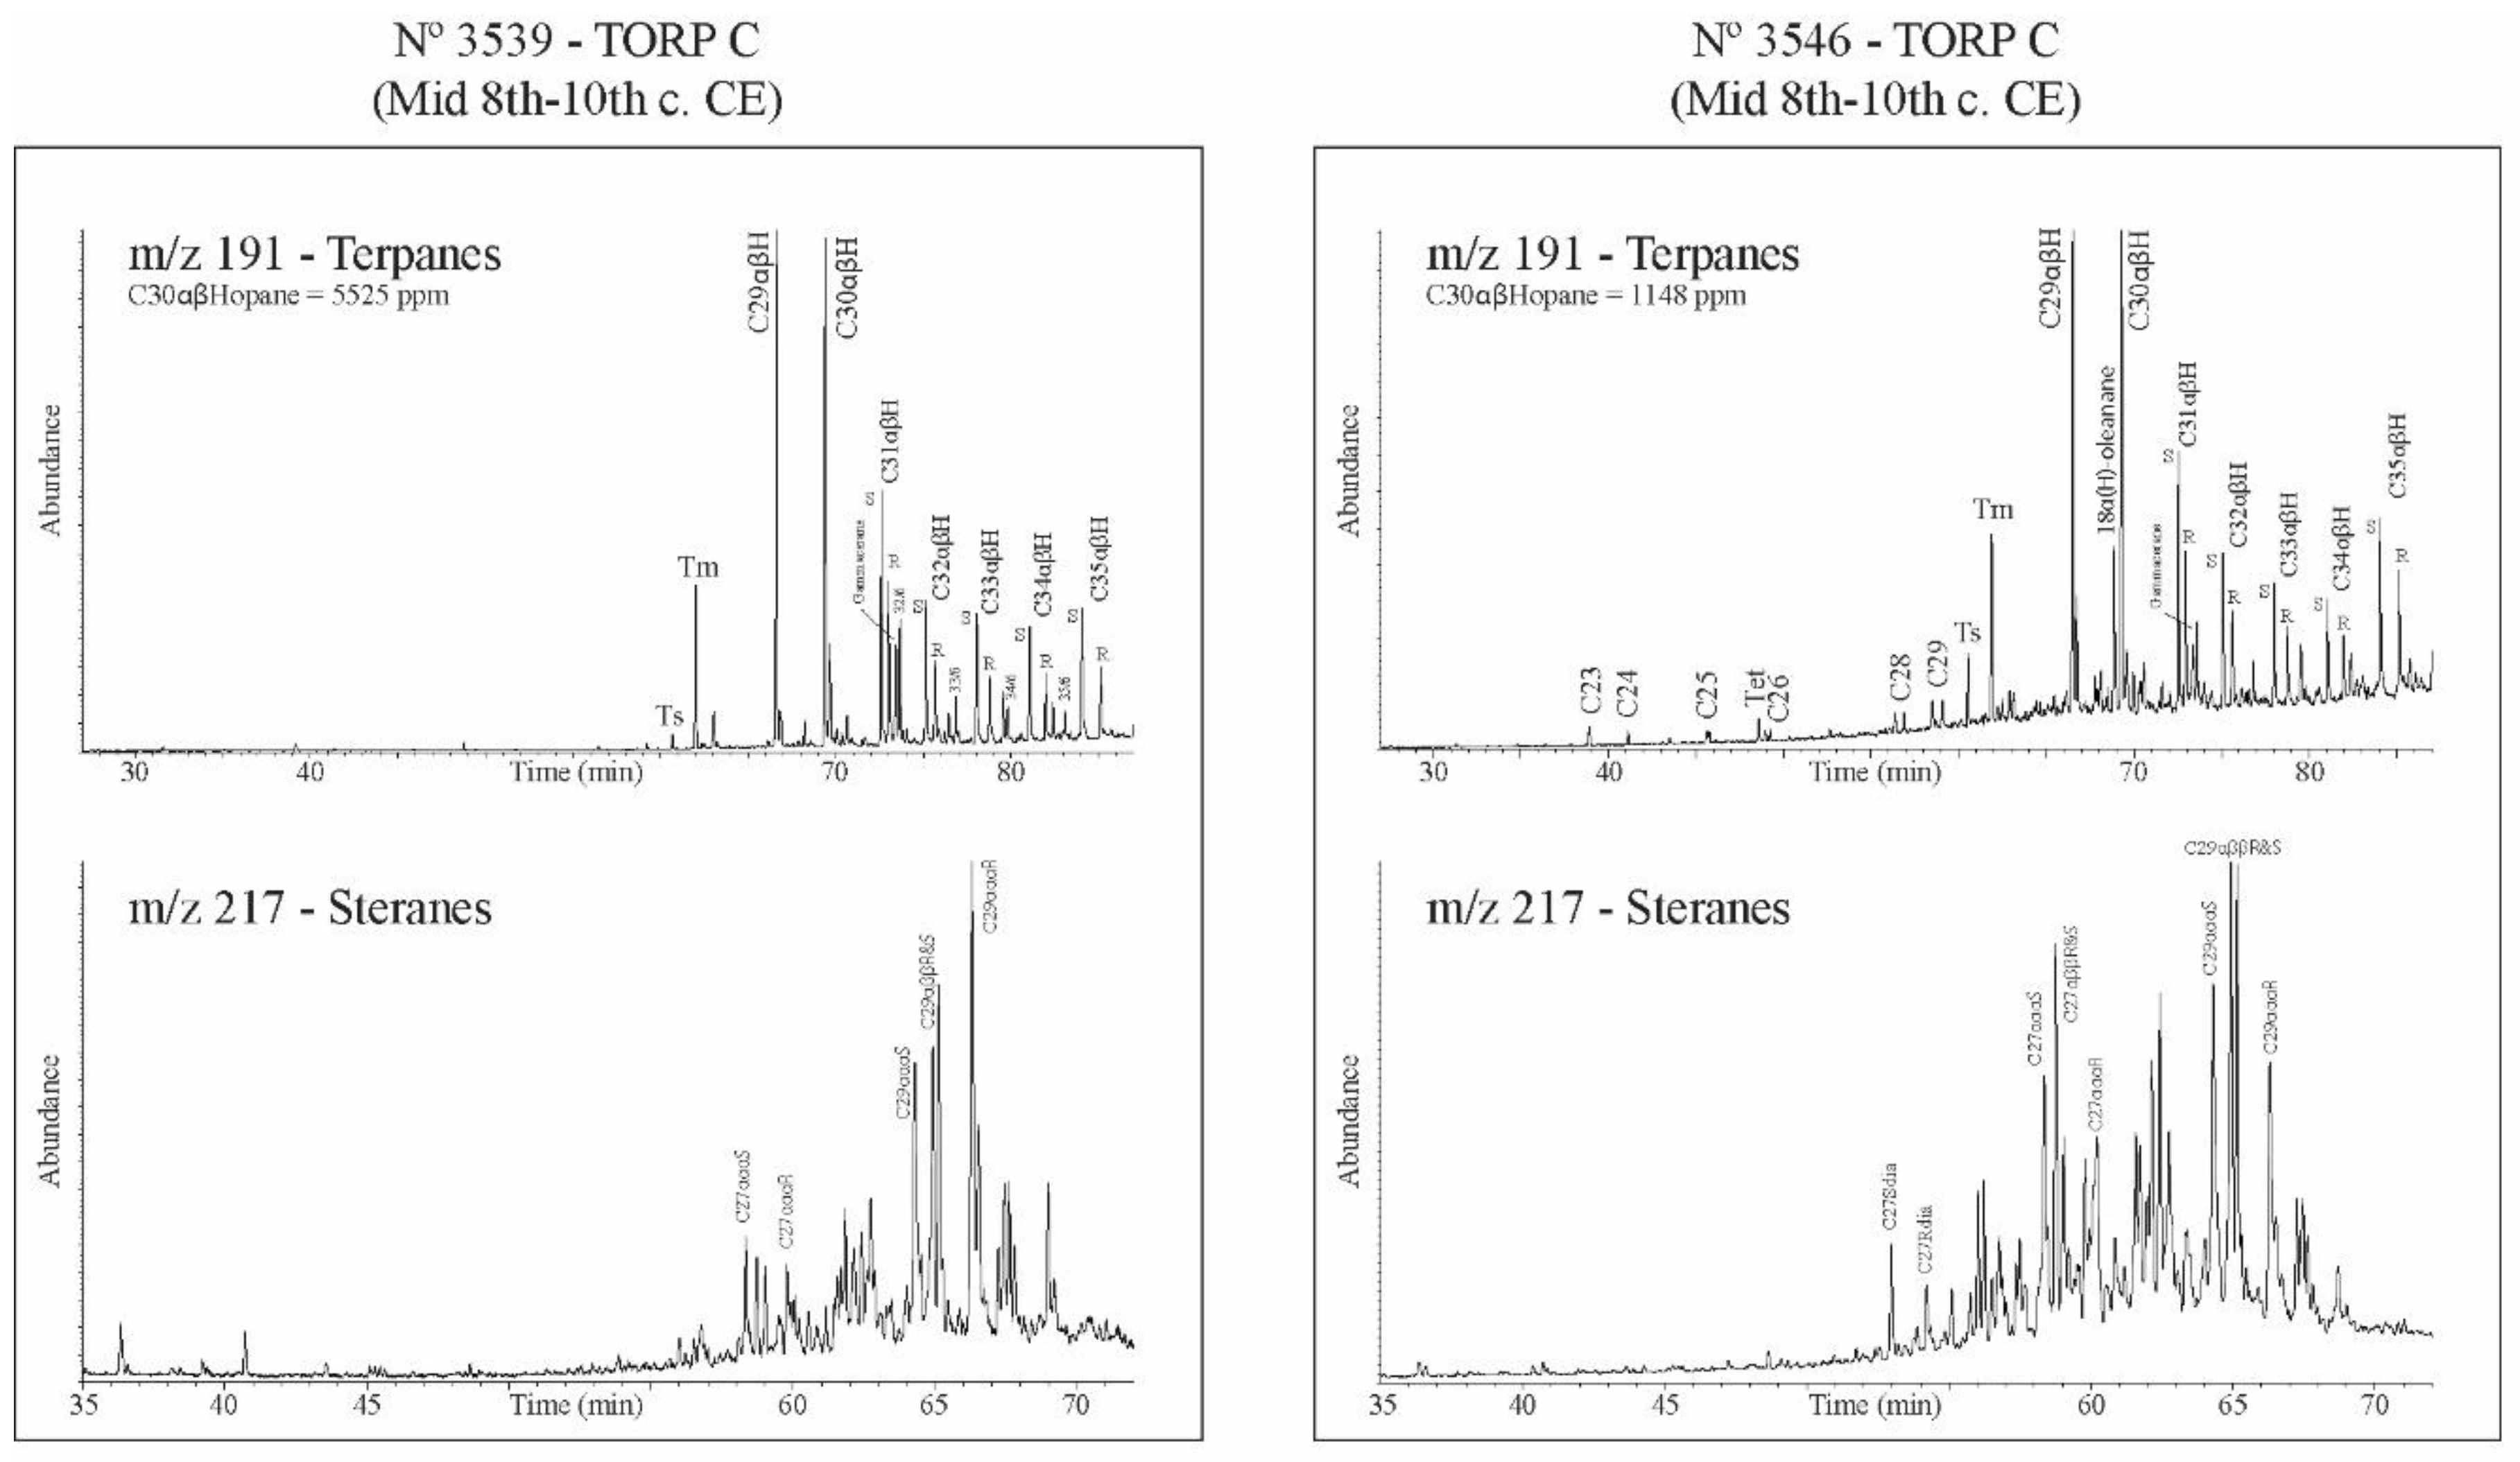
Figure 9.
Plot of 18α(H)-oleanane / C30αβHopane vs. C30αβHopane (ppm) and Ts/Tm vs. δ13Casp (‰ / VPDB) with the al-Qusur samples.
Figure 9.
Plot of 18α(H)-oleanane / C30αβHopane vs. C30αβHopane (ppm) and Ts/Tm vs. δ13Casp (‰ / VPDB) with the al-Qusur samples.
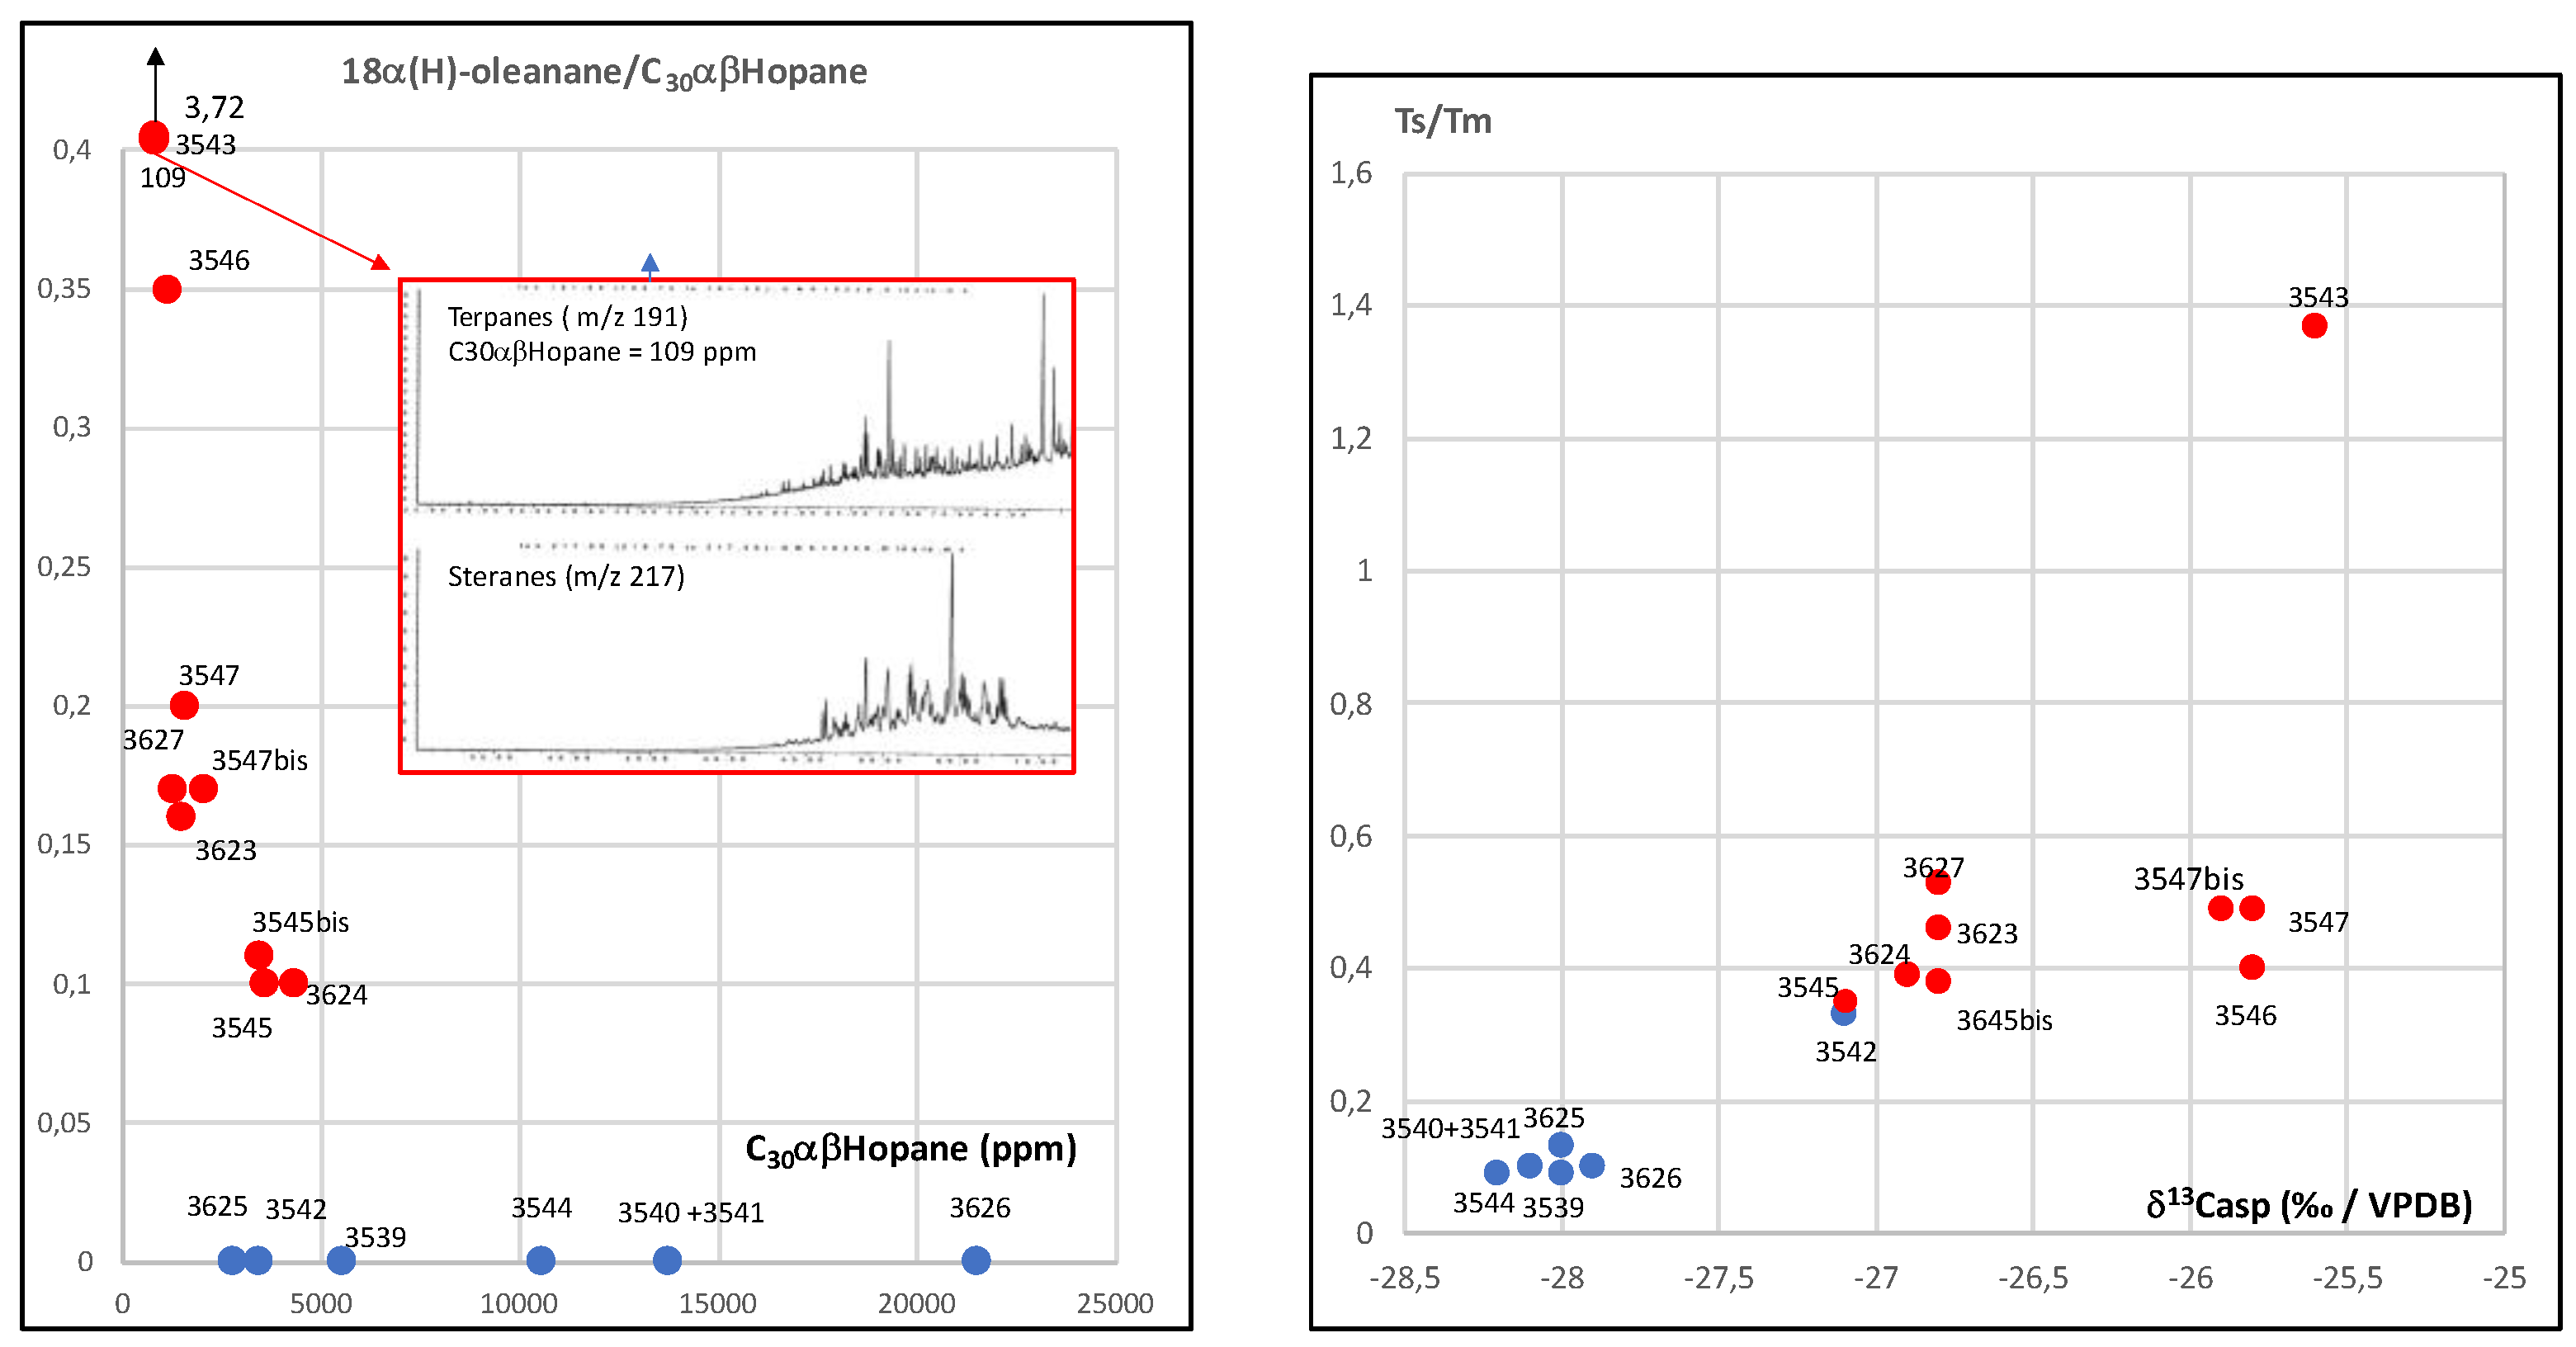
Figure 10.
Plot of 18α(H)-oleanane / C30αβHopane vs. δ13Casp (‰ / VPDB) in samples of al-Qusur with and without the identification of type of potsherds.
Figure 10.
Plot of 18α(H)-oleanane / C30αβHopane vs. δ13Casp (‰ / VPDB) in samples of al-Qusur with and without the identification of type of potsherds.
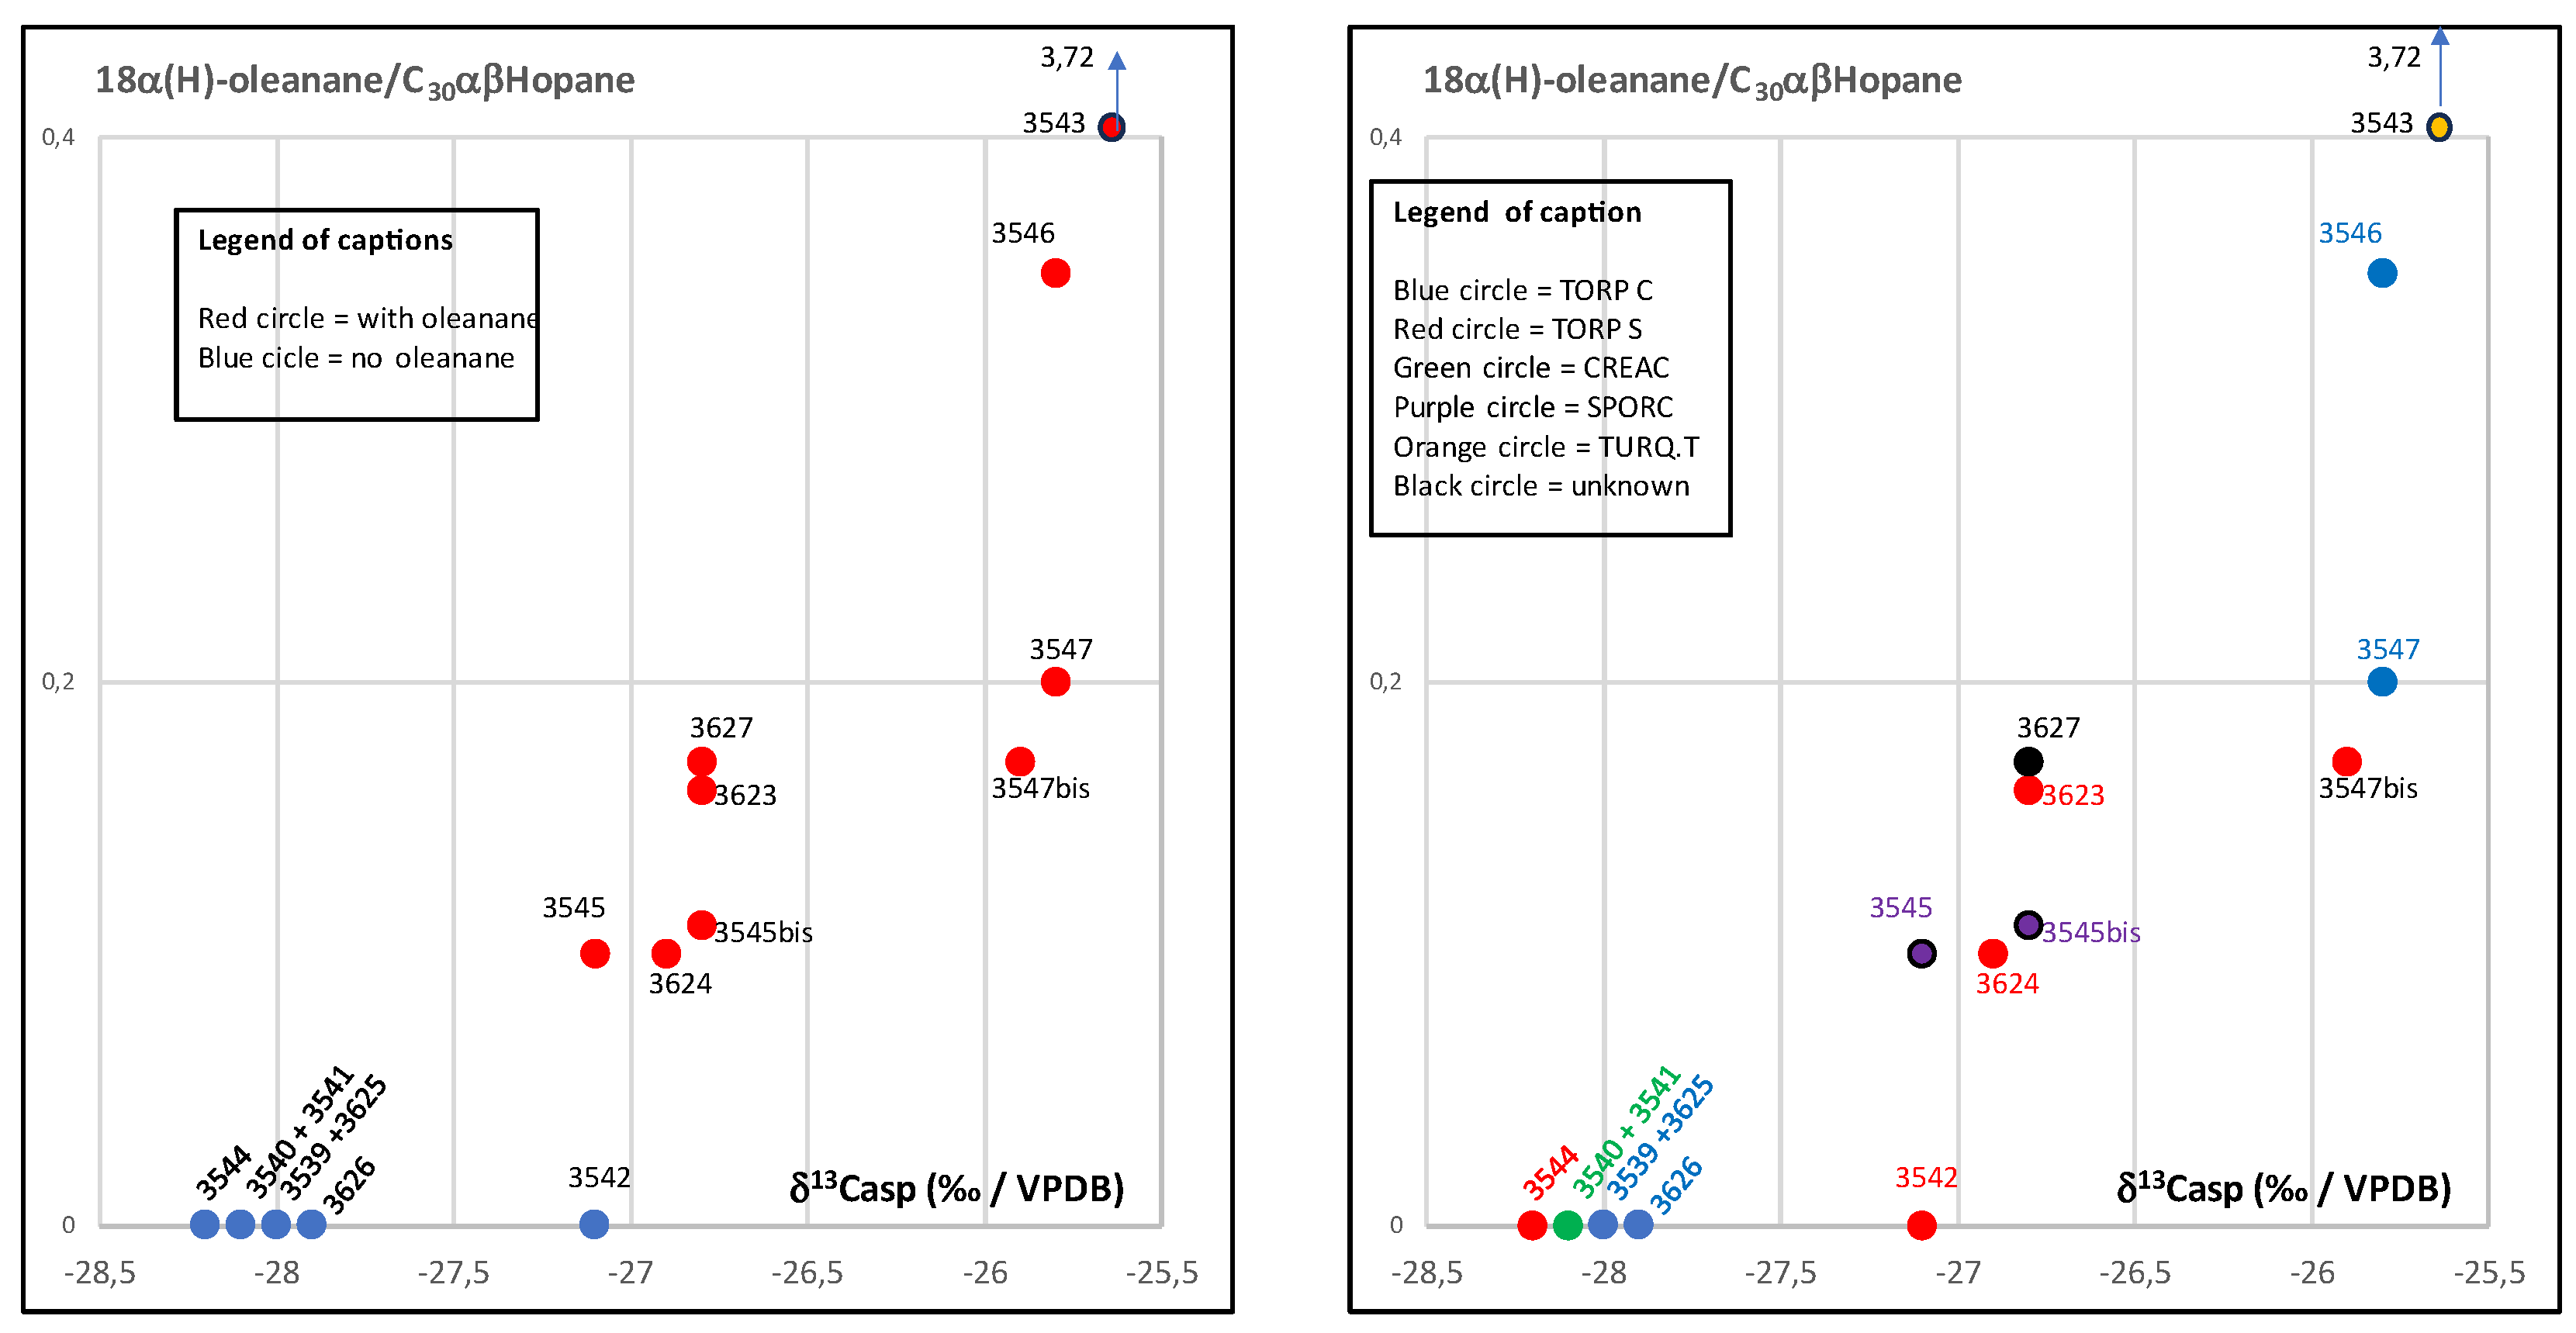
Figure 11.
Plot of αββsteranes in a ternary diagram: %C27 vs. %C28 vs. %C29. A) Group I: samples without 18α(H)-oleanane. B) Group II: samples with 18α(H)-oleanane.
Figure 11.
Plot of αββsteranes in a ternary diagram: %C27 vs. %C28 vs. %C29. A) Group I: samples without 18α(H)-oleanane. B) Group II: samples with 18α(H)-oleanane.
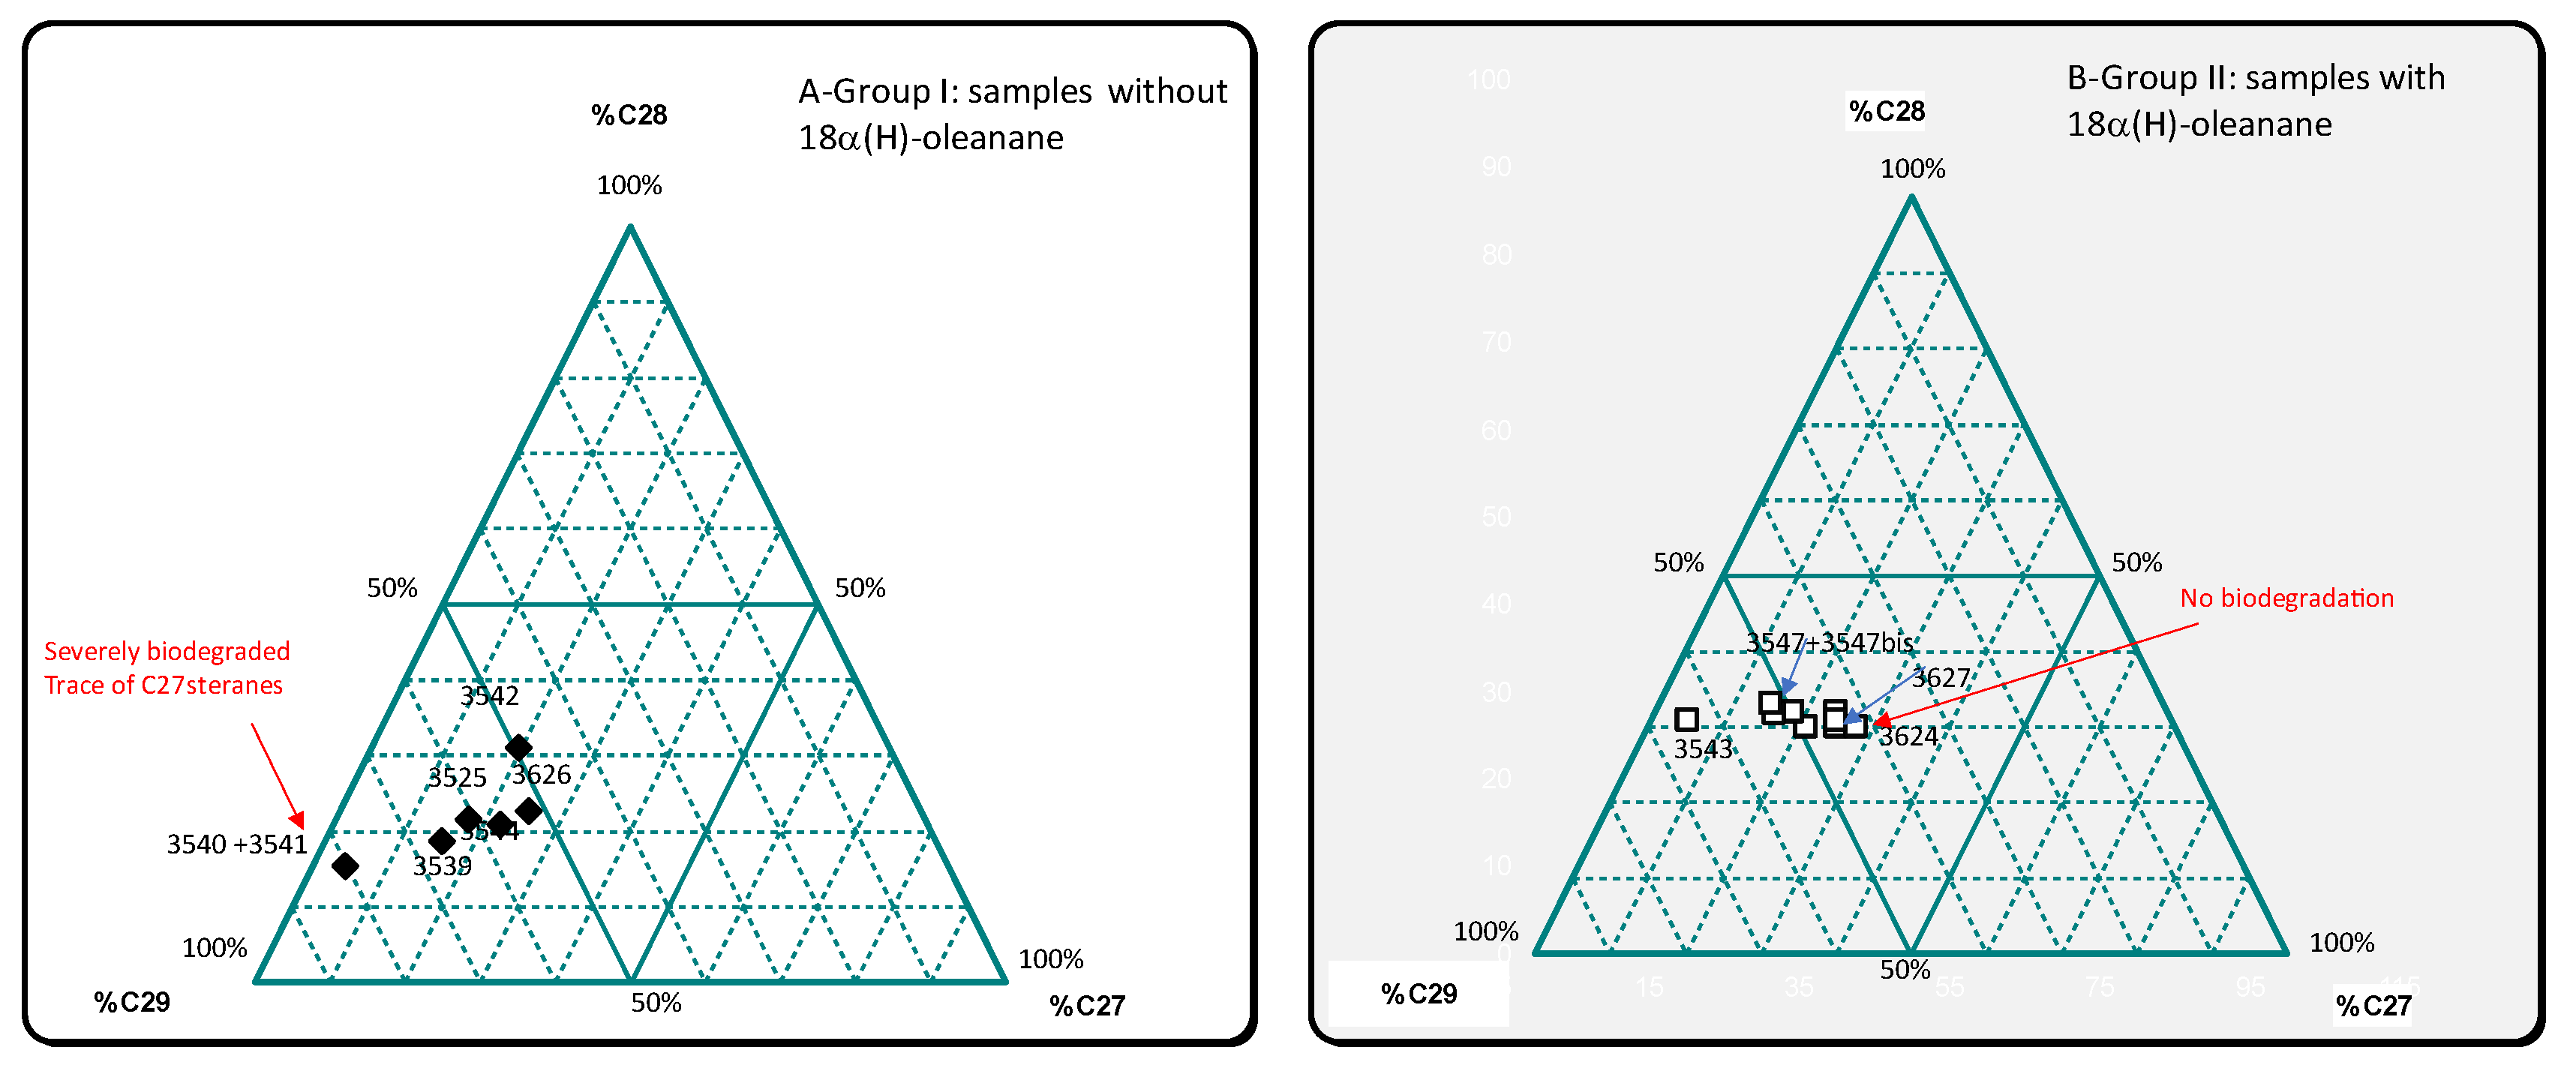
Figure 12.
Plot of Ts/Tm vs. δ13Casp (‰ / VPDB): Comparison of al-Qusur to other sites of the Failaka island.
Figure 12.
Plot of Ts/Tm vs. δ13Casp (‰ / VPDB): Comparison of al-Qusur to other sites of the Failaka island.
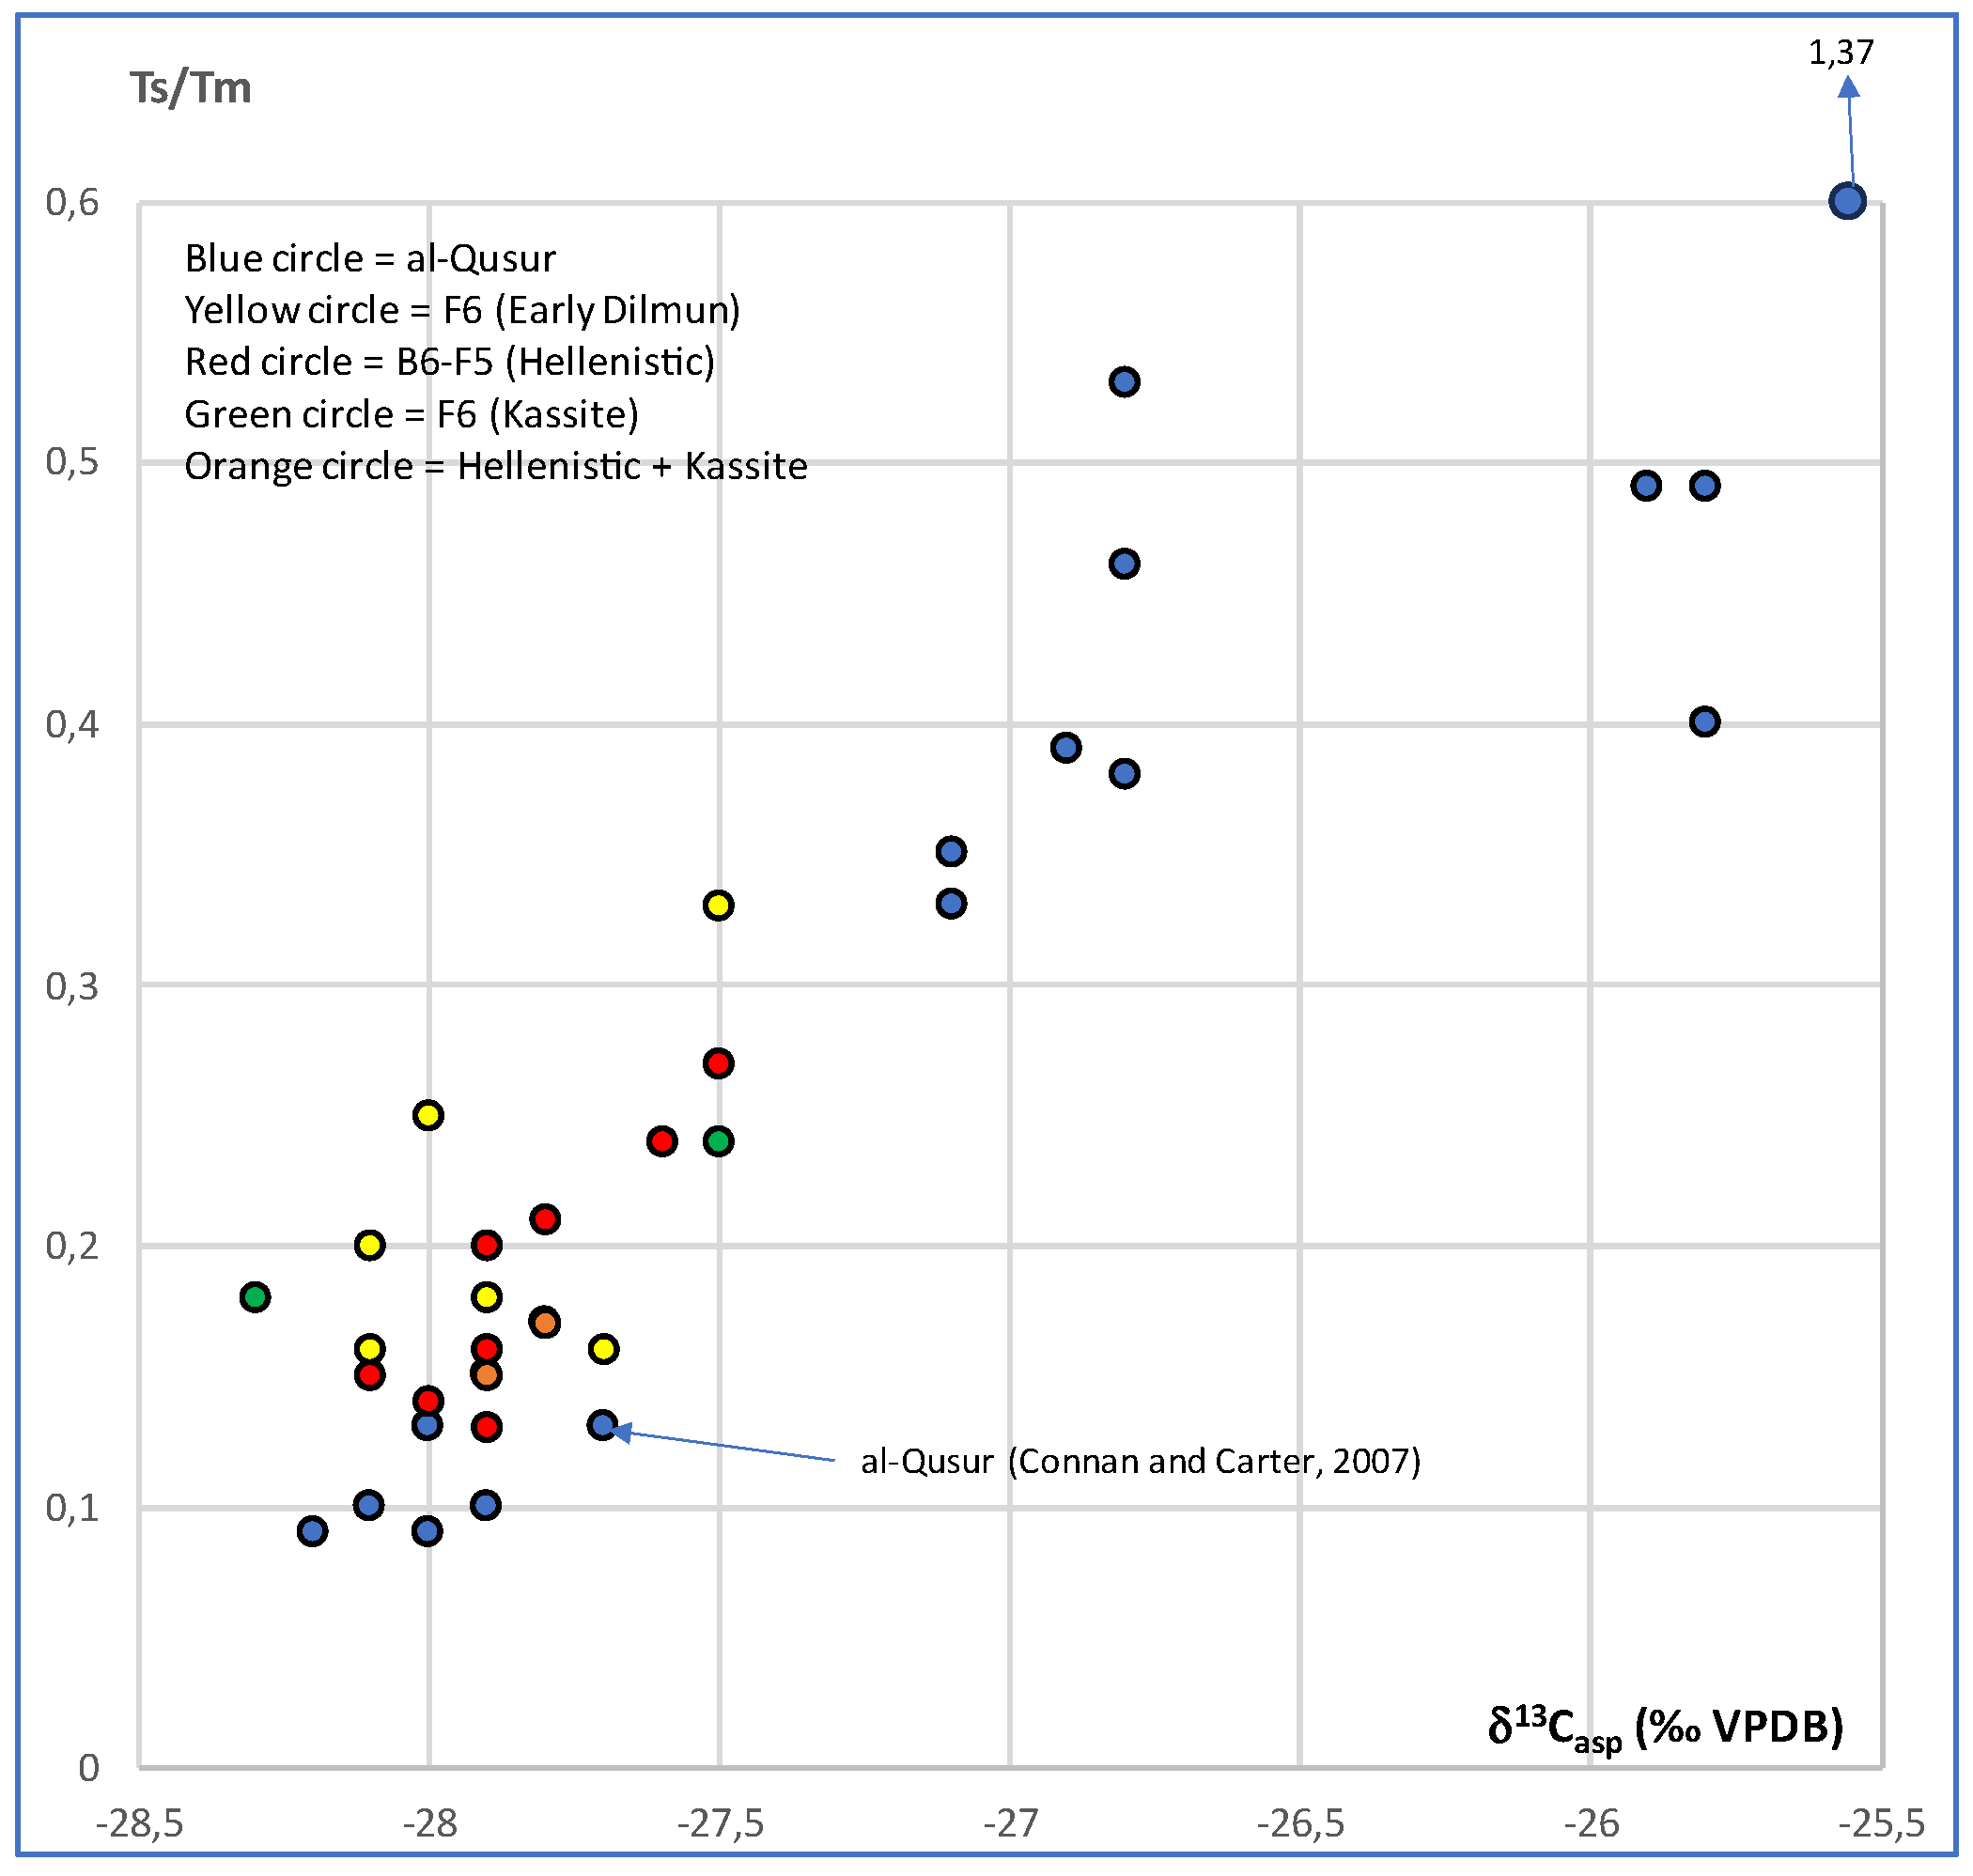
Figure 13.
X-Ray diffraction diagram: identification of minerals in the sample No.3545.
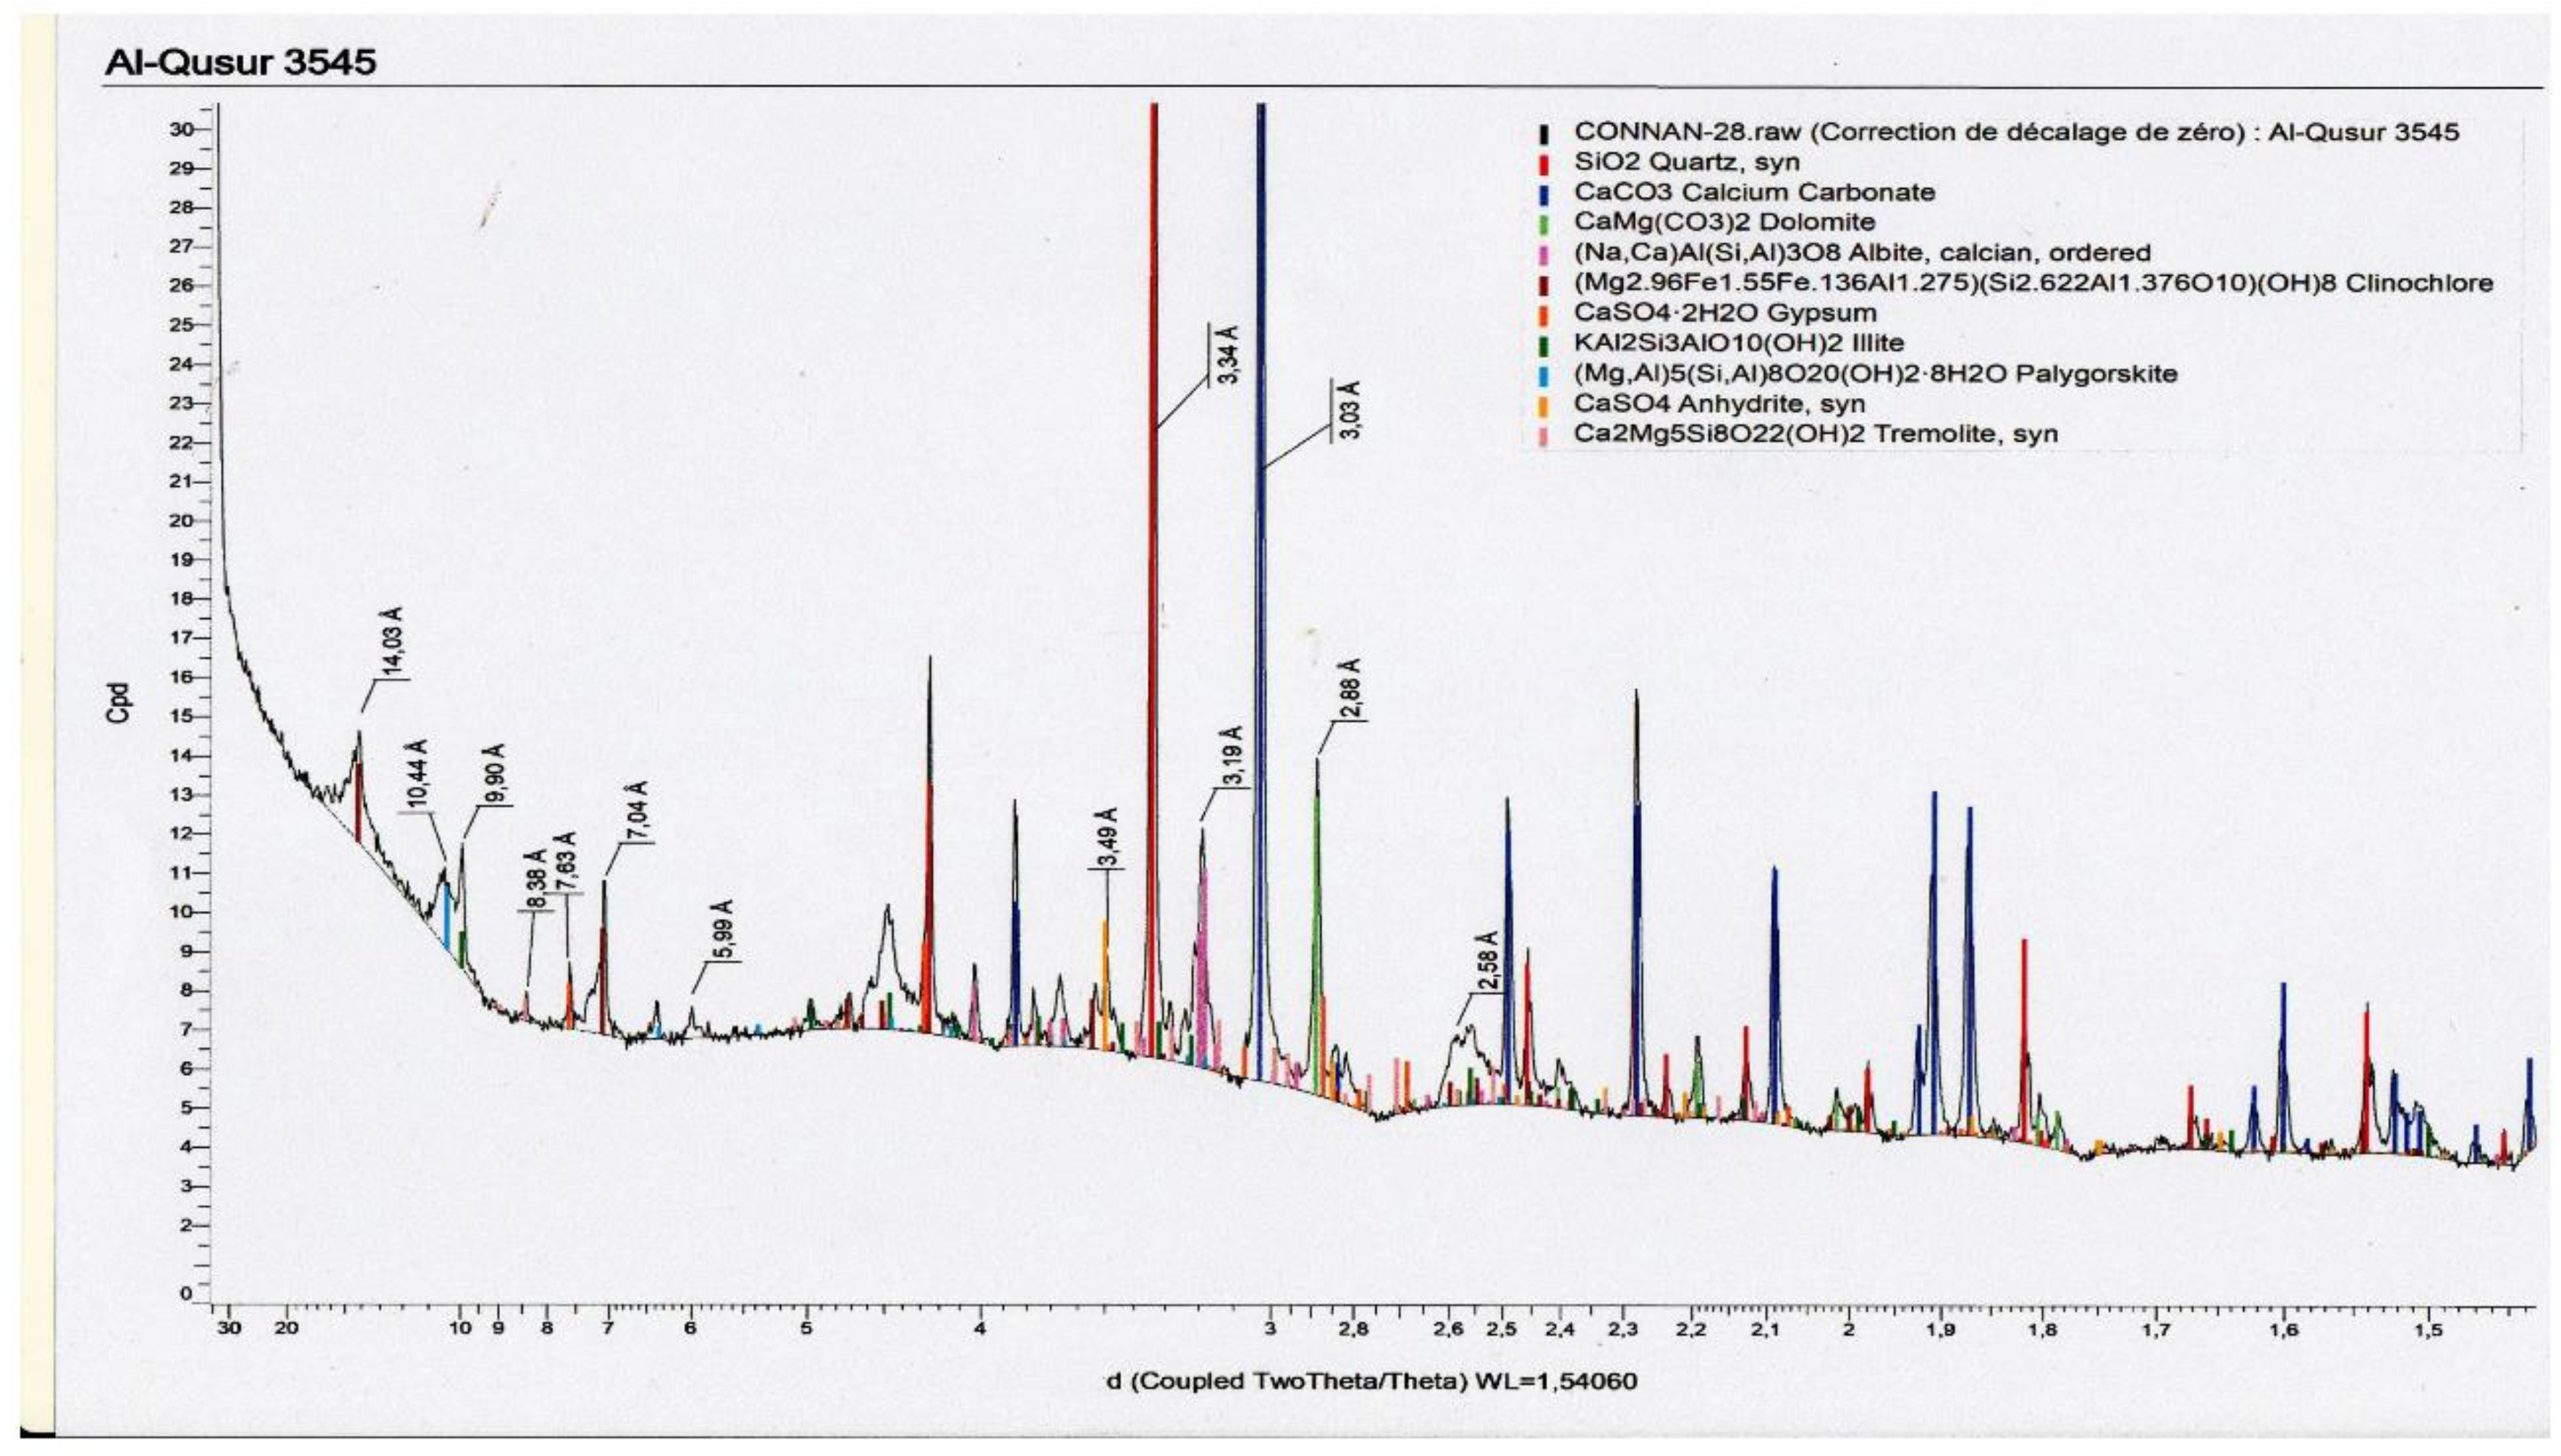
Figure 14.
Gas chromatogram of the chromatographic fractions: F1 (hydrocarbons) and F2 (fatty acids and alcohols, analyzed as acetate and methyl ester derivatives respectively) of the samples No.3545.
Figure 14.
Gas chromatogram of the chromatographic fractions: F1 (hydrocarbons) and F2 (fatty acids and alcohols, analyzed as acetate and methyl ester derivatives respectively) of the samples No.3545.
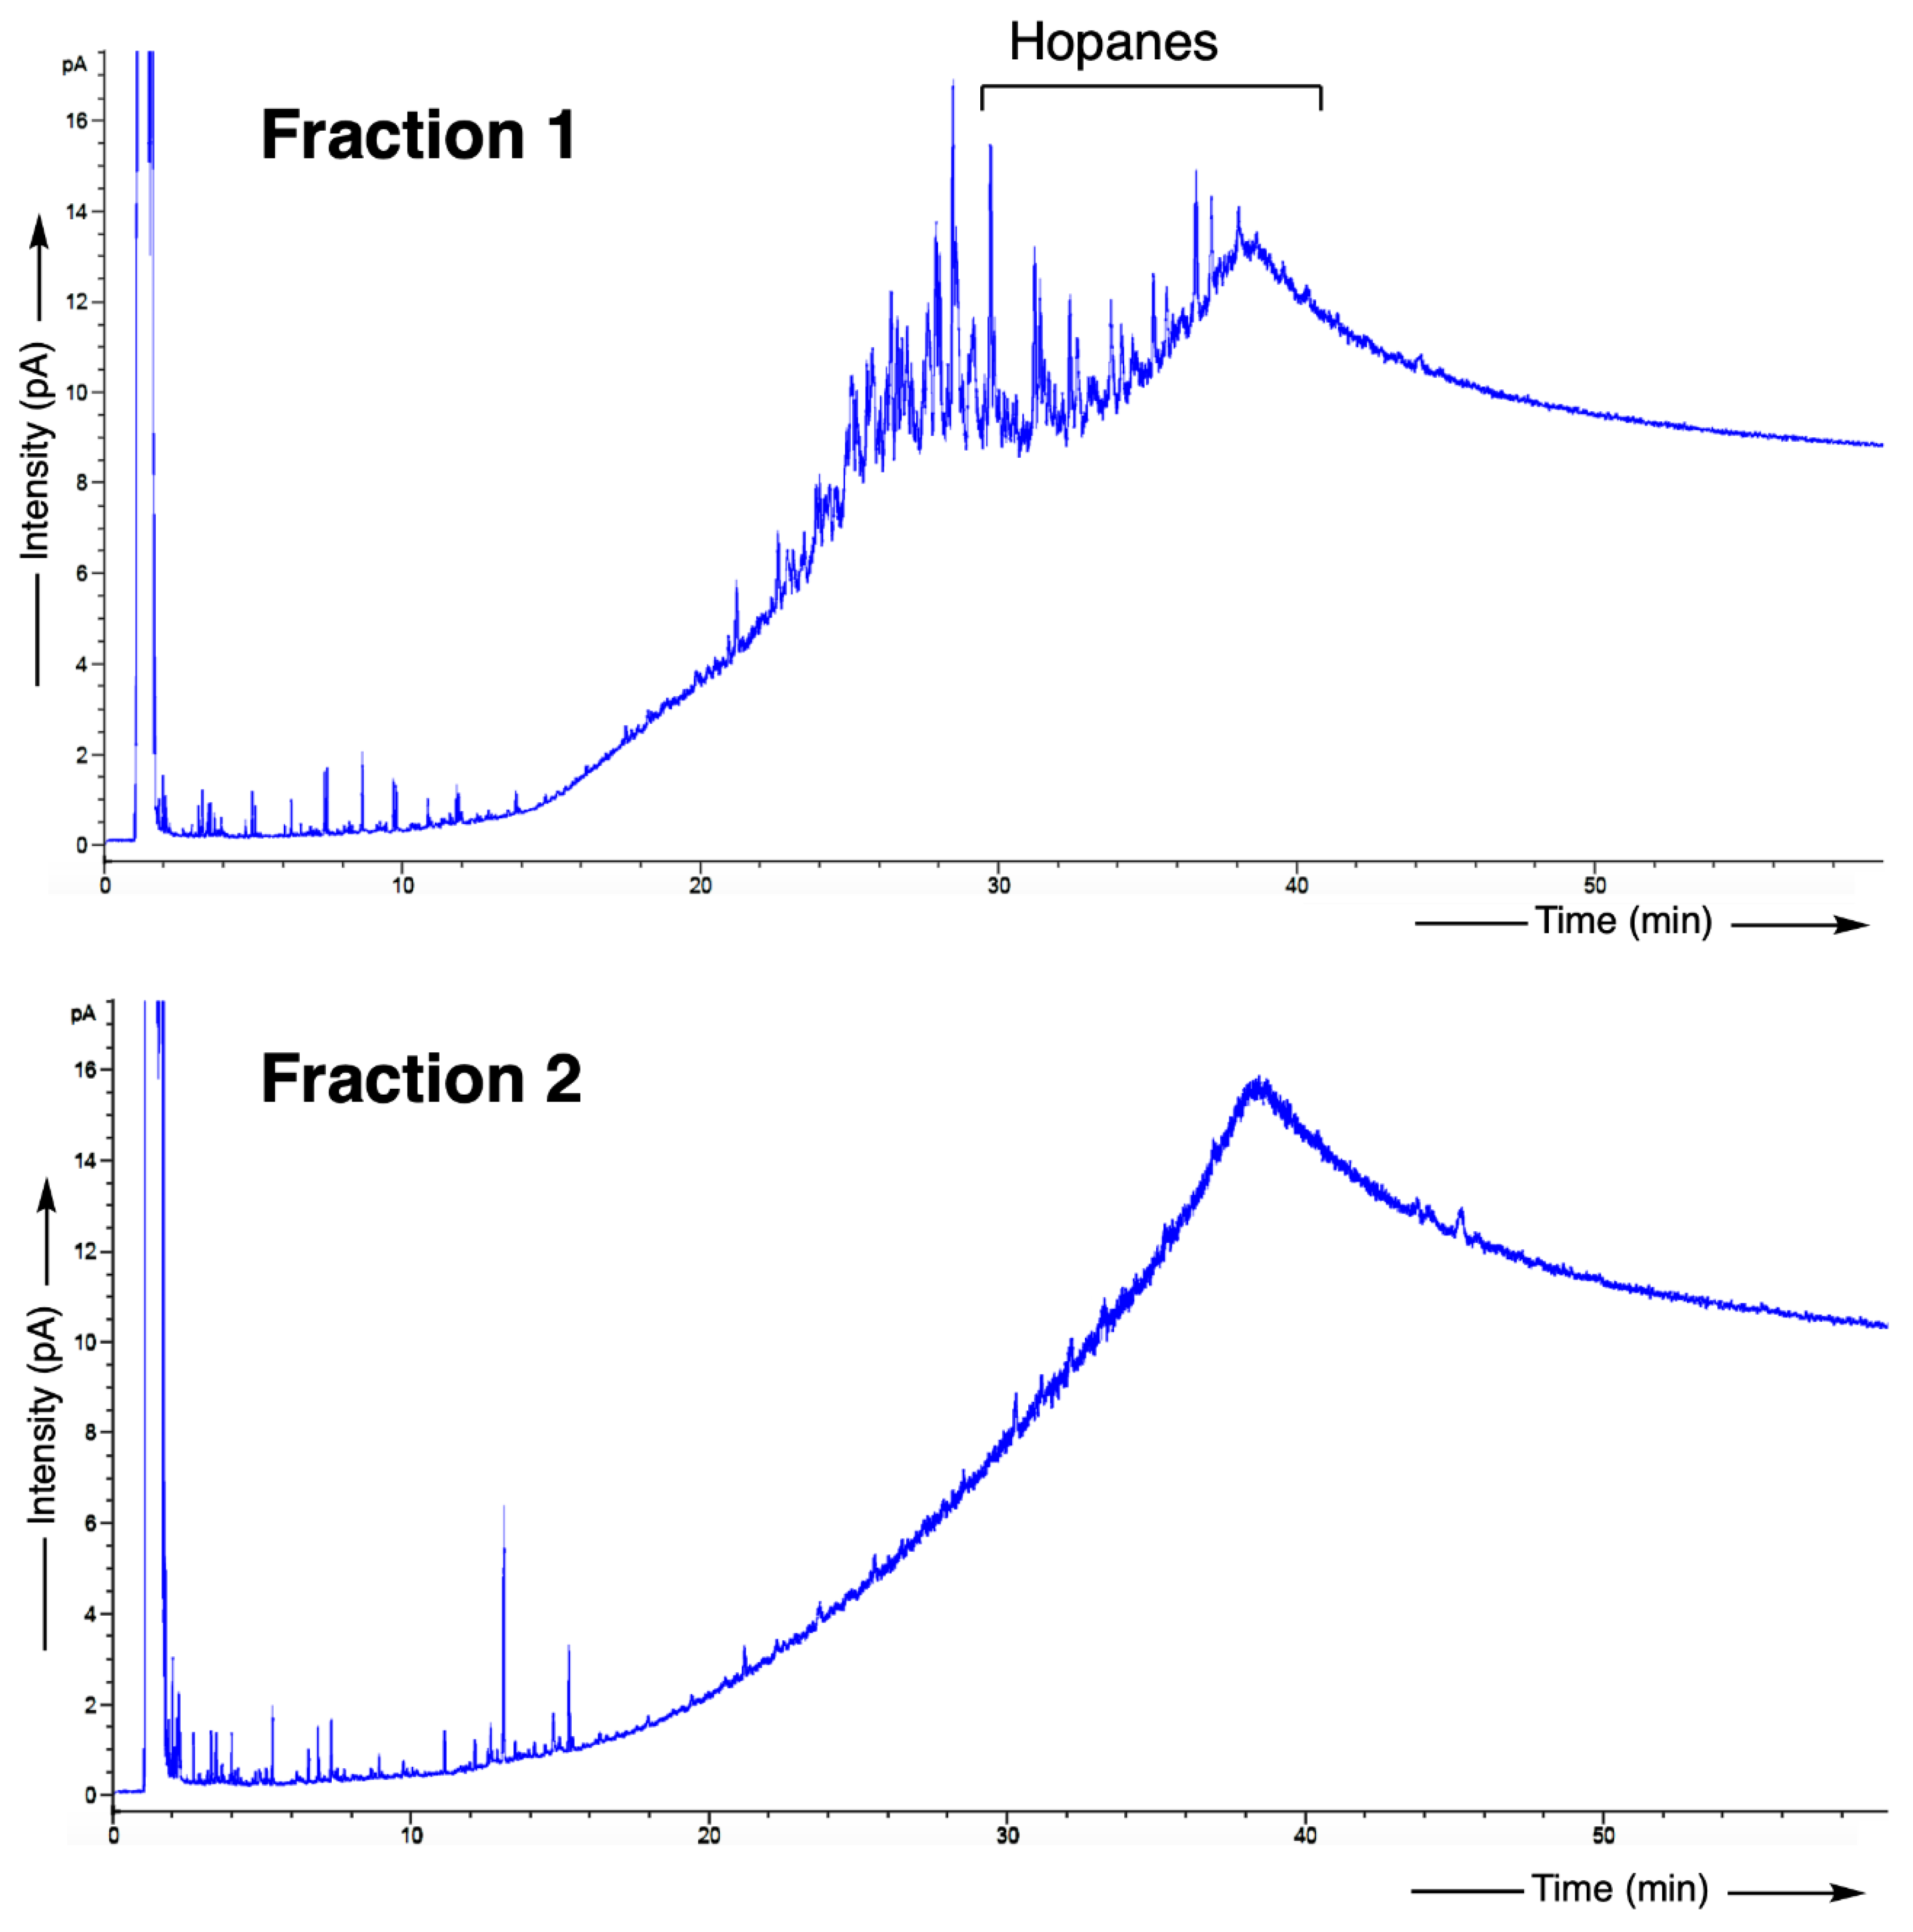

Table 1.
Basic information on samples.
| Sample number | Country | Lab number | Location | Building | Context | Archaeological reference | Latitude | Longitude | Date range | Pottery type |
|---|---|---|---|---|---|---|---|---|---|---|
| 1 | Kuwait | 3539 | al-Qusur | building B16 (monk's cell) | 5313 | QSR-12 A5/18 | 29°26'12"N | 48°20'52"E | Mid. 7th - early 9th CE | TORP-C |
| 2 | 3540 | building B20 (food processing), room R8 | 6067 | QSR-16-A4/25 | Late 8th - 10th c. CE | CREAC (HAR-CR17) ? / BUFF ? | ||||
| 3 | 3541 | building B20, room R8 | 6067 | QSR-16-A4/25 | Late 8th - 10th c. CE | CREAC (HAR-CR17) . / BUFF ? | ||||
| 4 | 3542 | building B14, courtyard | 7103 | QSR22-A5/0002 | Mid. 7th - early 9th c. CE | TORP-S | ||||
| 5 | 3543 | building B1 | 4 | QSR07/2100 | Mid.7th - mid.8th c. CE | TURQ.T (TUR-CR7) | ||||
| 6 | 3544 | building B14, room R1 | 7162 | QRS2022-A5/0001 | Mid. 7th - early 9th c. CE | TORP-S | ||||
| 7 | 3545 | building B20 (food processing), room R8 | 6067 | QRS16-A4/57 | Late 8th - 10th c. CE | SPORC | ||||
| 8 | 3546 | building B23 (refectory) | 5635 | QSR15-A4/243 | Mid. 8th - 10th c. CE | TORP-C | ||||
| 9 | 3547 | building B23 (refectory) | 5635 | QSR15-A4/243 | Mid. 8th - 10th c. CE | TORP-C | ||||
| 26 | 3623 | building B14, courtyard | 7177 | QSR23- A5-B14-7177 | Mid. 7th - early 9th c. CE | TORP-S | ||||
| 27 | 3624 | building B19, room R2 | 6854 | QSR19- A5-U.97-6854 | Mid. 7th - early 9th c. CE | TORP-S | ||||
| 28 | 3625 | building B19, courtyard | 6862 | QSR19-A5-U.21-22-6862 | Mid. 8th - (early) 9th c. CE | TORP-C | ||||
| 29 | 3626 | building B20 (food processing), room R5 | / | QSR23-A4-B20 -U.63 R15 | Mid. 8th - (early) 9th c. CE | TORP-C | ||||
| 30 | 3627 | building B25, room R4 | 7701 | QSR23-A6-B25-u.140-7701 | / | / |
Table 2.
Gross composition of the dichloromethane extract (EO in % by weight /sample) and isotopic data: δ13C (‰ / VPDB) and δD (‰ / VSMO). Significance of abbreviations: sat = saturated hydrocarbons, aro = aromatic hydrocarbons, NSO= resins, asp = asphaltenes, pol = polars = resins + asphaltenes.
Table 2.
Gross composition of the dichloromethane extract (EO in % by weight /sample) and isotopic data: δ13C (‰ / VPDB) and δD (‰ / VSMO). Significance of abbreviations: sat = saturated hydrocarbons, aro = aromatic hydrocarbons, NSO= resins, asp = asphaltenes, pol = polars = resins + asphaltenes.
| sample number | country | lab number | location | %EO | %Sat | %aro | %HC | %NSO | %ASP | %Pol | d13Csat | d13Caro | d13CNSO | d13Casp | dDNSO | dDasp |
|---|---|---|---|---|---|---|---|---|---|---|---|---|---|---|---|---|
| 1 | Kuwait | 3539 | al-Qusur | 13,8 | 1,4 | 2 | 3,4 | 8,7 | 87,9 | 96,6 | -28,5 | -27,4 | -28 | -28 | -84 | -82 |
| 2 | 3540 +3541 | 13,4 | 4,5 | 5,2 | 9,7 | 18,7 | 71,6 | 90,3 | -27,4 | -25,9 | -28,1 | -28,1 | -91 | -88 | ||
| 4 | 3542 | 53,5 | 3 | 4 | 7 | 9,5 | 83,5 | 93 | -27,5 | -26,4 | -26,5 | -27,1 | -83 | -74 | ||
| 5 | 3543 | 21 | 4 | 3,1 | 7,1 | 14,9 | 78 | 92,9 | -27,1 | -26 | -26,1 | -25,6 | -87 | -84 | ||
| 6 | 3544 | 15 | 1,7 | 3,2 | 4,9 | 12 | 83,1 | 95,1 | -28,8 | -27,3 | -28,1 | -28,2 | -86 | -71 | ||
| 7 | 3545 | 34,3 | 3,9 | 2,7 | 6,6 | 7,5 | 85,9 | 93,4 | -27,2 | -26,5 | -26,9 | -27,1 | -85 | -73 | ||
| 3545bis | 36,7 | 3,4 | 2,5 | 5,9 | 7,5 | 86,6 | 94,1 | -27,6 | -26,6 | -26,8 | -26,8 | -82 | -74 | |||
| 8 | 3546 | 22,1 | 3,3 | 3,5 | 6,8 | 7,1 | 86,1 | 93,2 | -27 | -25,9 | -26,2 | -25,8 | -89 | -69 | ||
| 9 | 3547 | 32,4 | 2,7 | 2,7 | 5,4 | 10,2 | 84,4 | 94,6 | -27 | -26 | -26,3 | -25,8 | -108 | -72 | ||
| 3547bis | 28,3 | 3,2 | 3 | 6,2 | 12,2 | 81,6 | 93,8 | -27 | -25,8 | -26,5 | -25,9 | -101 | -79 | |||
| 26 | Kuwait | 3623 | al-Qusur | 42,8 | 4,1 | 2,6 | 6,7 | 7,5 | 85,8 | 93,3 | -27,5 | -26,2 | -26,8 | -26,8 | -80 | -74 |
| 27 | 3624 | 41,5 | 4,5 | 2,2 | 6,7 | 5,3 | 88 | 93,3 | -27,2 | -26,3 | -26,7 | -26,9 | -77 | -77 | ||
| 28 | 3625 | 5,2 | 1,7 | 2,2 | 3,9 | 12,9 | 83,2 | 96,1 | -27,2 | -27,7 | -28,2 | -28 | -103 | -74 | ||
| 29 | 3626 | 1,7 | 1,4 | 1,4 | 2,8 | 8,4 | 88,8 | 97,2 | -28,7 | -27,8 | -27,9 | -27,9 | -83 | -72 | ||
| 30 | 3627 | 32,2 | 4,1 | 2,6 | 6,7 | 5,8 | 87,5 | 93,3 | -27,4 | -26,3 | -26,8 | -26,8 | -81 | -68 |
Table 3.
Molecular data on steranes and terpanes. Significance of abbreviations: C30αβHopane=17α,21β-hopane, OL/H=18α(H)-oleanane/ hopane, GA/C31αβHR =Gammacerane/ 17α,21β,22R-30-homohopane, ster/terp = steranes / terpanes, Dia /reg = diasteranes / regular steranes, %C27αββR+S = 5α,14β,17β-20R+20S-cholestane,%C28αββR+S=5α,14β,17β-20R+20S-24methylcholestane, %C29αββR+S=5α,14β,17β-20R+20S-24ethylcholestane,C29ααα20S/20R= 5α,14α,17α-20S-24ethylcholestane/5α,14α,17α-20R-24ethylcholestane, C29H/C30H = norhopane/ hopane, C27Ts/Tm = 18α-22,29,30-trisnorneohopane / 17α-22,29,30-trisnorhopane, C35S/C34S = C34-17α,21β-22S-extended hopane /C35- 17α,21β-22S-extended hopane.
| Lab number | C30abHopane (ppm) | Tet/C23 | C29/H | Ol/H | C31R/H | GA/C31R | GA/C30H | C35S/C34S | Ster/Terp | Dia/Reg | %C27 | %C28 | %C29 | C2920S/20R | C29abbS/C29aaaR | Ts/Tm | tricyclics | terpanes | steranes | C27diasteranes |
|---|---|---|---|---|---|---|---|---|---|---|---|---|---|---|---|---|---|---|---|---|
| 3539 | 5525 | 1,27 | 1,02 | 0 | 0,32 | 0,59 | 0,19 | 1,14 | 0,04 | 0,12 | 15,5 | 18,8 | 65,7 | 0,55 | 0,68 | 0,09 | almost absent | well preserved | biodegraded -C27<C28<C29 | |
| 3540+3541 | 13768 | 3,41 | 1,19 | 0 | 0,23 | 0,56 | 0,13 | 0,87 | 0,08 | 0,08 | 4,3 | 15,5 | 80,2 | 0,38 | 0,81 | 0,1 | almost absent | preserved? | severely biodegraded-C27 | |
| 3542 | 3428 | 4,15 | 1,35 | 0 | 0,3 | 0,55 | 0,17 | 1,03 | 0,13 | 0,19 | 19,5 | 31,2 | 49,3 | 0,71 | 0,99 | 0,33 | almost absent | preserved? | biodegraded | |
| 3543 | 109 | 0,53 | 1,65 | 3,72 | 0,43 | 1,07 | 0,46 | 3,7 | 0,72 | 0,28 | 4,8 | 30,9 | 64,4 | 11,38 | 2,6 | 1,37 | absent | severely biodegraded | severely biodegraded- | |
| 3544 | 10580 | 3,44 | 0,94 | 0 | 0,27 | 0,58 | 0,16 | 1,08 | 0,09 | 0,04 | 22,3 | 21 | 56,8 | 0,65 | 1,06 | 0,09 | absent | preserved | slightly biodegraded | |
| 3545 | 3563 | 1,15 | 0,98 | 0,1 | 0,31 | 0,36 | 0,11 | 1,15 | 0,36 | 0,69 | 25,1 | 29,9 | 45 | 0,76 | 1,37 | 0,35 | present low | preserved | preserved | present |
| 3545bis | 3426 | 1,79 | 1,01 | 0,11 | 0,33 | 0,35 | 0,12 | 1,25 | 0,33 | 0,86 | 21,1 | 30 | 48,9 | 1,05 | 1,52 | 0,38 | present low | preserved | preserved | present |
| 3546 | 1148 | 1,26 | 1,01 | 0,35 | 0,32 | 0,36 | 0,12 | 1,72 | 0,75 | 0,75 | 18,3 | 32 | 49,7 | 1,18 | 1,71 | 0,4 | present low | preserved | preserved | present |
| 3547 | 1569 | 1,24 | 0,94 | 0,2 | 0,38 | 0,29 | 0,11 | 1,26 | 0,36 | 0,92 | 15,9 | 31,8 | 52,2 | 1,19 | 1,71 | 0,49 | present low | preserved | slightly biodegraded-C29abbR -C27abbR biodegraded | present |
| 3447bis | 2027 | 1,85 | 0,94 | 0,17 | 0,36 | 0,3 | 0,11 | 1,19 | 0,34 | 0,87 | 14,8 | 33,1 | 52,1 | 1,16 | 1,79 | 0,49 | almot absent | preserved | slightly biodegraded-C29abbR -C27abbR biodegraded | present |
| 3623 | 1464 | 1,1 | 1,19 | 0,16 | 0,34 | 0,34 | 0,12 | 1,3 | 0,82 | 1,09 | 24,1 | 32 | 43,9 | 1,28 | 2,05 | 0,46 | almost absent | preserved | slightly biodegraded-C29abbR -C27abbR biodegraded | present |
| 3624 | 4313 | 1,46 | 1,06 | 0,1 | 0,32 | 0,31 | 0,1 | 1,05 | 0,33 | 0,81 | 27,8 | 30 | 42,2 | 0,88 | 1,42 | 0,39 | almost absent | preserved | preserved | abundant |
| 3625 | 2786 | 2,14 | 1,04 | 0 | 0,35 | 0,73 | 0,26 | 1,18 | 0,04 | 0,59 | 17,5 | 21,8 | 60,7 | 0,71 | 0,74 | 0,13 | absent | preserved | biodegraded-C27<C28<C29 | present low |
| 3626 | 21510 | 3,62 | 1,13 | 0 | 0,25 | 0,54 | 0,14 | 0,9 | 0,08 | 0,05 | 24,9 | 22,9 | 52,2 | 0,47 | 0,77 | 0,1 | absent | preserved | biodegraded-C27<C28<C29 | absent |
| 3627 | 1244 | 0,58 | 1,23 | 0,17 | 0,32 | 0,42 | 0,13 | 1,55 | 0,7 | 1,09 | 24,6 | 30,8 | 44,6 | 1,18 | 1,44 | 0,53 | present | preserved? | preserved | abundant |
Disclaimer/Publisher’s Note: The statements, opinions and data contained in all publications are solely those of the individual author(s) and contributor(s) and not of MDPI and/or the editor(s). MDPI and/or the editor(s) disclaim responsibility for any injury to people or property resulting from any ideas, methods, instructions or products referred to in the content. |
© 2025 by the authors. Licensee MDPI, Basel, Switzerland. This article is an open access article distributed under the terms and conditions of the Creative Commons Attribution (CC BY) license (http://creativecommons.org/licenses/by/4.0/).
Copyright: This open access article is published under a Creative Commons CC BY 4.0 license, which permit the free download, distribution, and reuse, provided that the author and preprint are cited in any reuse.


