1. Introduction
Lung cancer (LC) is the leading cause of cancer morbidity and mortality both worldwide and in all European countries. Male-to-female incidence and mortality ratios range from one to five-fold [
1]. Tobacco remains the main risk factor: in developed countries, smoking trends among women hint at LC incidence nearing that in men, while, in lower-income countries, smoking rates are still peaking among men [
1,
2,
3]. Low-dose CT screening has shown to reduce LC mortality, although false positive rates, overdiagnosis and biopsy complications are of concern. Currently, screening in Europe essentially relies on pilot programs [
1,
4,
5].
Non-small-cell LC (NSCLC) comprises 85% of all LCs. Adenocarcinoma (50–60%) and squamous-cell carcinoma (20–30%) are predominant [
6]. Up to 60% of lung adenocarcinomas are reported to harbor a driver mutation, depending on world region and smoking history [
7]. In all patients with advanced NSCLC and unusual lung squamous-cell carcinomas, it is recommended to perform standard genome sequencing including KRAS, EGFR, ALK, ROS1, NTRK, RET, MET, BRAF and HER2. When present, actionable mutations require tailored treatment [
7]. Programmed death-ligand 1 (PD-L1) tumor proportion scoring (TPS) is mandatory given it predicts immunotherapy (IO) efficacy [
8].
Although we navigate in the precision oncology era, body composition information remains neglected regarding treatment decision. Body surface area (BSA) (e.g. DuBois), used in cancer treatment dose scaling, fails to discern body composition. Indeed, skeletal muscle (SM) does not correlate with BSA in cancer patients [
9]. Sarcopenia comprises both the loss of muscle mass and function (i.e. strength) negatively impacting health [
10]. Of note, recent focus on SM depletion, whether rooted in toxicity prediction or prognostic value, has outpaced research focusing on muscle strength as far as clinical oncology is concerned [
9,
11]. Publications from Baracos et al., favoring the exploitation of standard CT-scan imaging for body composition analysis, as well as from Wei Shen et al., demonstrating a high correlation between whole body muscle mass and cross-sectional SM area (SMA) at the third lumbar vertebra (L3), have shaped the current framework for defining sarcopenia in cancer patients – optimal thresholding SMA normalized for stature, i.e. SM Index (SMI) [
12,
13].
Notwithstanding, proposed cut-offs in the literature are heterogeneous [
9,
11]. Caucasian-predominant SMI thresholds for mortality, as published by Prado et al. [
14], later extended by Martin et al. to include non-obese patients [
15], or Fearon et al. [
16], are discrepant to Asian-specific published thresholds [
9,
17,
18,
19]. Such discrepancy not only highlights caveats in how these definitions translate to different ethnicities but foresees shortcomings when applying them to cohorts of mixed cancers or cancer stages.
Sarcopenia has been shown to impact survival in various cancers, including NSCLC [
19,
20]. Most studies thresholding L3SMI for prognosis in NSCLC are Asian and lack homogeneity regarding both cancer stage, cancer treatment and treatment setting [
19]. Noteworthy, evidence on EGFR-mutant NSCLC remains mixed [
19,
21,
22].
Unstandardized sarcopenia definitions preclude timely multimodal interventions for reversing muscle loss and performance status (PS) optimization, enabling standard of care oncological treatment. This study assesses the impact of SMI optimal thresholding on sarcopenia rates and prognosis within a Portuguese metastatic NSCLC (mNSCLC). Also, we discuss the discrepancies within the thresholds presented in the literature.
2. Materials and Methods
2.1. Procedures
This is a retrospective analysis on data collected from patients with mNSCLC treated at the Unidade Local de Saúde São José (ULSSJ), Medical Oncology Department between January 2017 and December 2022. We collected data on patient variables (sex, age at NSCLC diagnosis, smoking status, Eastern Cooperative Oncology Group [ECOG] PS, anthropometric data – height and weight starting systemic treatment in metastatic setting, i.e. first-line [1L]), cancer variables (American Joint Committee on Cancer [AJCC] staging version 8, NSCLC subtype, mutational status, PD-L1 TPS, metastatic sites), and treatment variables (treatment protocols and response assessment imaging). Cross-sectional CT-scan images at L3 level starting 1L treatment in metastatic setting were analyzed using National Institute of Health ImageJ v1.54g software [
23]. Wacom One was used to calculate SMA (
https://www.wacom.com/en-us/products/pen-tablets/one-by-wacom) including psoas major, quadratus lumborum, erector spinae, latissimus dorsi, abdominal oblique muscles, and rectus abdominis. SMA was measured in square centimeters (cm²) using a Hounsfield Unit (HU) range of -29–150 HU. SMI was calculated by dividing the SMA by square height (cm
2/m
2).
The study was done according to the Declaration of Helsinki and was approved by the Ethics Committee for Health of ULSSJ with a waiver for informed consent.
2.2. Patients
The study population was identified through ULSSJ Pathology files’ screening for histological diagnoses coded by Systemized Nomenclature of Medicine – Clinical Terms (SNOMED)/International Classification of Diseases for Oncology (ICDO) as “lung” (T-28000.01/T.C34.9), “adenocarcinoma” (M-81403.01/M.8140.3-G), “squamous-cell” (M-80703.01/M.8070.3-G), “adenosquamous” (M-85603.01/ M.8095.3-G), and “carcinoma, NOS” (M-80103.01/ M.8010.3-G). Duplicates were excluded, and the following exclusion criteria were applied: <18 years old; no records of Medical Oncology outpatient clinic; no primary LC (i.e. SNOMED/ICDO corresponding to secondary LC/lung metastasis of primary tumor with different origin); neuroendocrine LC (large/small-cell); adenoid cystic carcinoma; carcinoid tumor; thymic cancer; AJCC stage III LC without progression after chemoradiotherapy (irrespective of IO consolidation treatment); AJCC stage IV LC not progressing after treatment with radical intent; patients that did not receive oncological treatment (i.e. exclusive Best Supportive Care); patients with synchronous malignancies except for basal cell carcinomas.
2.3. Definitions and Endpoints
The primary endpoint was overall survival (OS), defined as time from mNSCLC diagnosis to death from any cause. The secondary endpoint 1L progression-free survival (PFS) was defined as time from starting 1L treatment in metastatic setting until disease progression or death from any cause. Two sarcopenia definitions – as published by Prado et al. (SMI < 52.4 cm
2/m
2 for men and < 38.5 cm
2/m
2 for women) [
14] and defined using SMI cohort-specific cut-offs) – were to be applied to statistical analysis based on relevance, i.e. both definitions were conditional to accurate survival stratification. Obesity was defined according to the World Health Organization definition (body mass index [BMI] ≥ 30 kg/m
2). Sarcopenic Obesity was defined as simultaneous obesity (i.e. BMI ≥ 30 kg/m
2) and sarcopenia (as published by Prado et al. [
14] or as defined within the study population). Other secondary endpoints included both 1L treatment and BMI subgroup analyses regarding OS. Follow-up data cut-off was 15
th July 2024.
2.4. Statistical Analysis
Statistical analysis was performed using SPSS version 25. A two-tailed p-value of 0.05 was considered statistically significant for all performed tests. Continuous variables were reported as means and their standard deviation. Comparisons between categorical variables were assessed using Chi-square tests. Optimal SMI thresholding was obtained by receiver operating characteristic analyses. Kaplan-Meier method and log-rank tests were used for survival analyses. A multivariate cox regression model was performed including variables showing univariate association with OS. Missing data were handled based on the listwise deletion method.
3. Results
One hundred ninety-seven patients with mNSCLC met the prespecified inclusion criteria. The mean age was 65 years (standard deviation ± 11.31). Most patients were male (n = 135), with reported former/active smoking habits (n = 103). Adenocarcinomas were predominant (n = 165), and most tumors were metastatic at presentation (n = 154). Baseline characteristics of the initial cohort are shown in
Table 1. SMI was evaluable in 184 patients: mean SMI was 48.52 cm
2/m
2 (± 9.31) for men and 37.69 cm
2/m
2 (± 6.14) for women. Nutritional data collection and endpoint testing analysis were limited to this cohort. Body composition data of SMI-assessed cohort are shown in
Table 2. Optimal sex-specific SMI thresholds were <49.96 cm
2/m
2 for men and <34.02 cm
2/m
2 for women. One hundred twenty-two patients (66.30%), corresponding to 89/125 men (71.20%) and 33/59 women (55.93%) were sarcopenic as defined per Prado et al., whereas 86 patients (46.74%), corresponding to 73/125 men (58.40%) and 13/59 women (22.03%) were sarcopenic as defined per optimal SMI thresholding: 36 patients (19.57%) were reclassified as not sarcopenic. After reclassification, 14/86 sarcopenic patients were underweight (BMI <18.5 kg/m
2), 17 were overweight but not obese (BMI ≥ 25 and <30 kg/m
2), 5 had sarcopenic obesity (BMI ≥30 kg/m
2) while the remnant 50 had normal weight (BMI ≥ 18.5 kg/m
2 and < 25 kg/m
2).
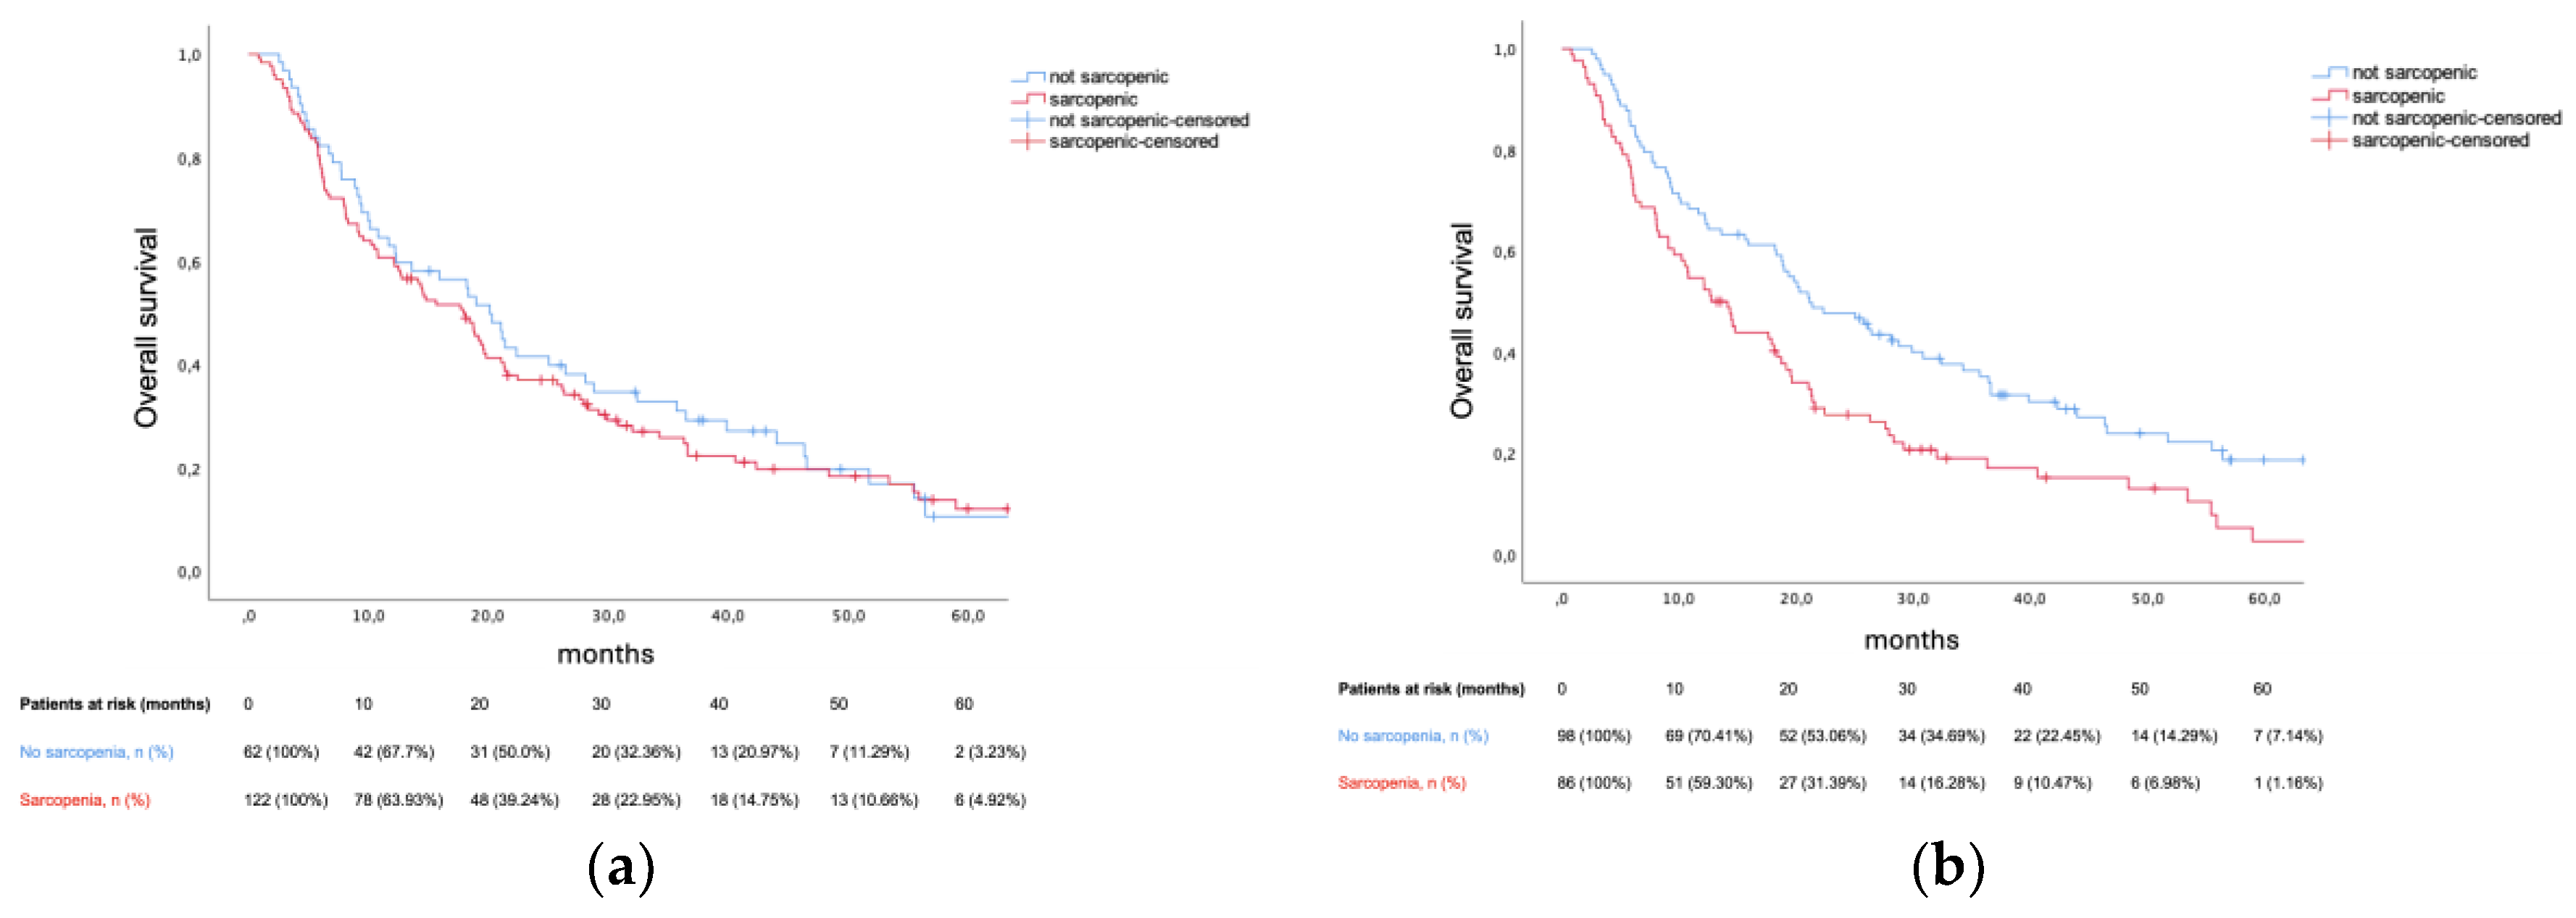
At data cut-off, 18 out of 184 patients remained alive without progression, while 34 out of 184 patients remained alive. Median PFS was 8.91 months (95% confidence interval [CI] 7.46–10.35). Prado et al. definition for sarcopenia did not predict PFS in our cohort (8.87 months vs 8.91 months, p = 0.392), contrary to cohort-specific thresholds – 7.92 months vs 9.56 months (hazard ratio [HR] 1.503, 95% CI 1.1–2.05, p = 0.01). Median OS was 18.4 months (95% CI 14.79–22.01). Prado et al. definition did not predict OS (17.9 months vs 20.11 months, p = 0.588). Conversely, cohort-specific sarcopenia thresholds were prognostic – 12.75 months vs 21.13 months, HR 1.654 (95% CI 1.20–2.29) p = 0.002. Amid sarcopenia, patients presenting a BMI ≥ 25 kg/m
2 were at a lesser risk of death (HR 1.084, 95% CI 0.069–1.927) when compared to patients with a BMI < 25 kg/m
2 (HR 1.904, 95CI% 1.231–2.944). Sarcopenia’s survival impact was consistent across 1L treatment subgroups. Kaplan-Meier plots for OS, as well as the between-group difference in OS (HR for death) for sarcopenic patients (defined per cohort-specific thresholds) are illustrated in
Figure 1 and
Figure 2, respectively.
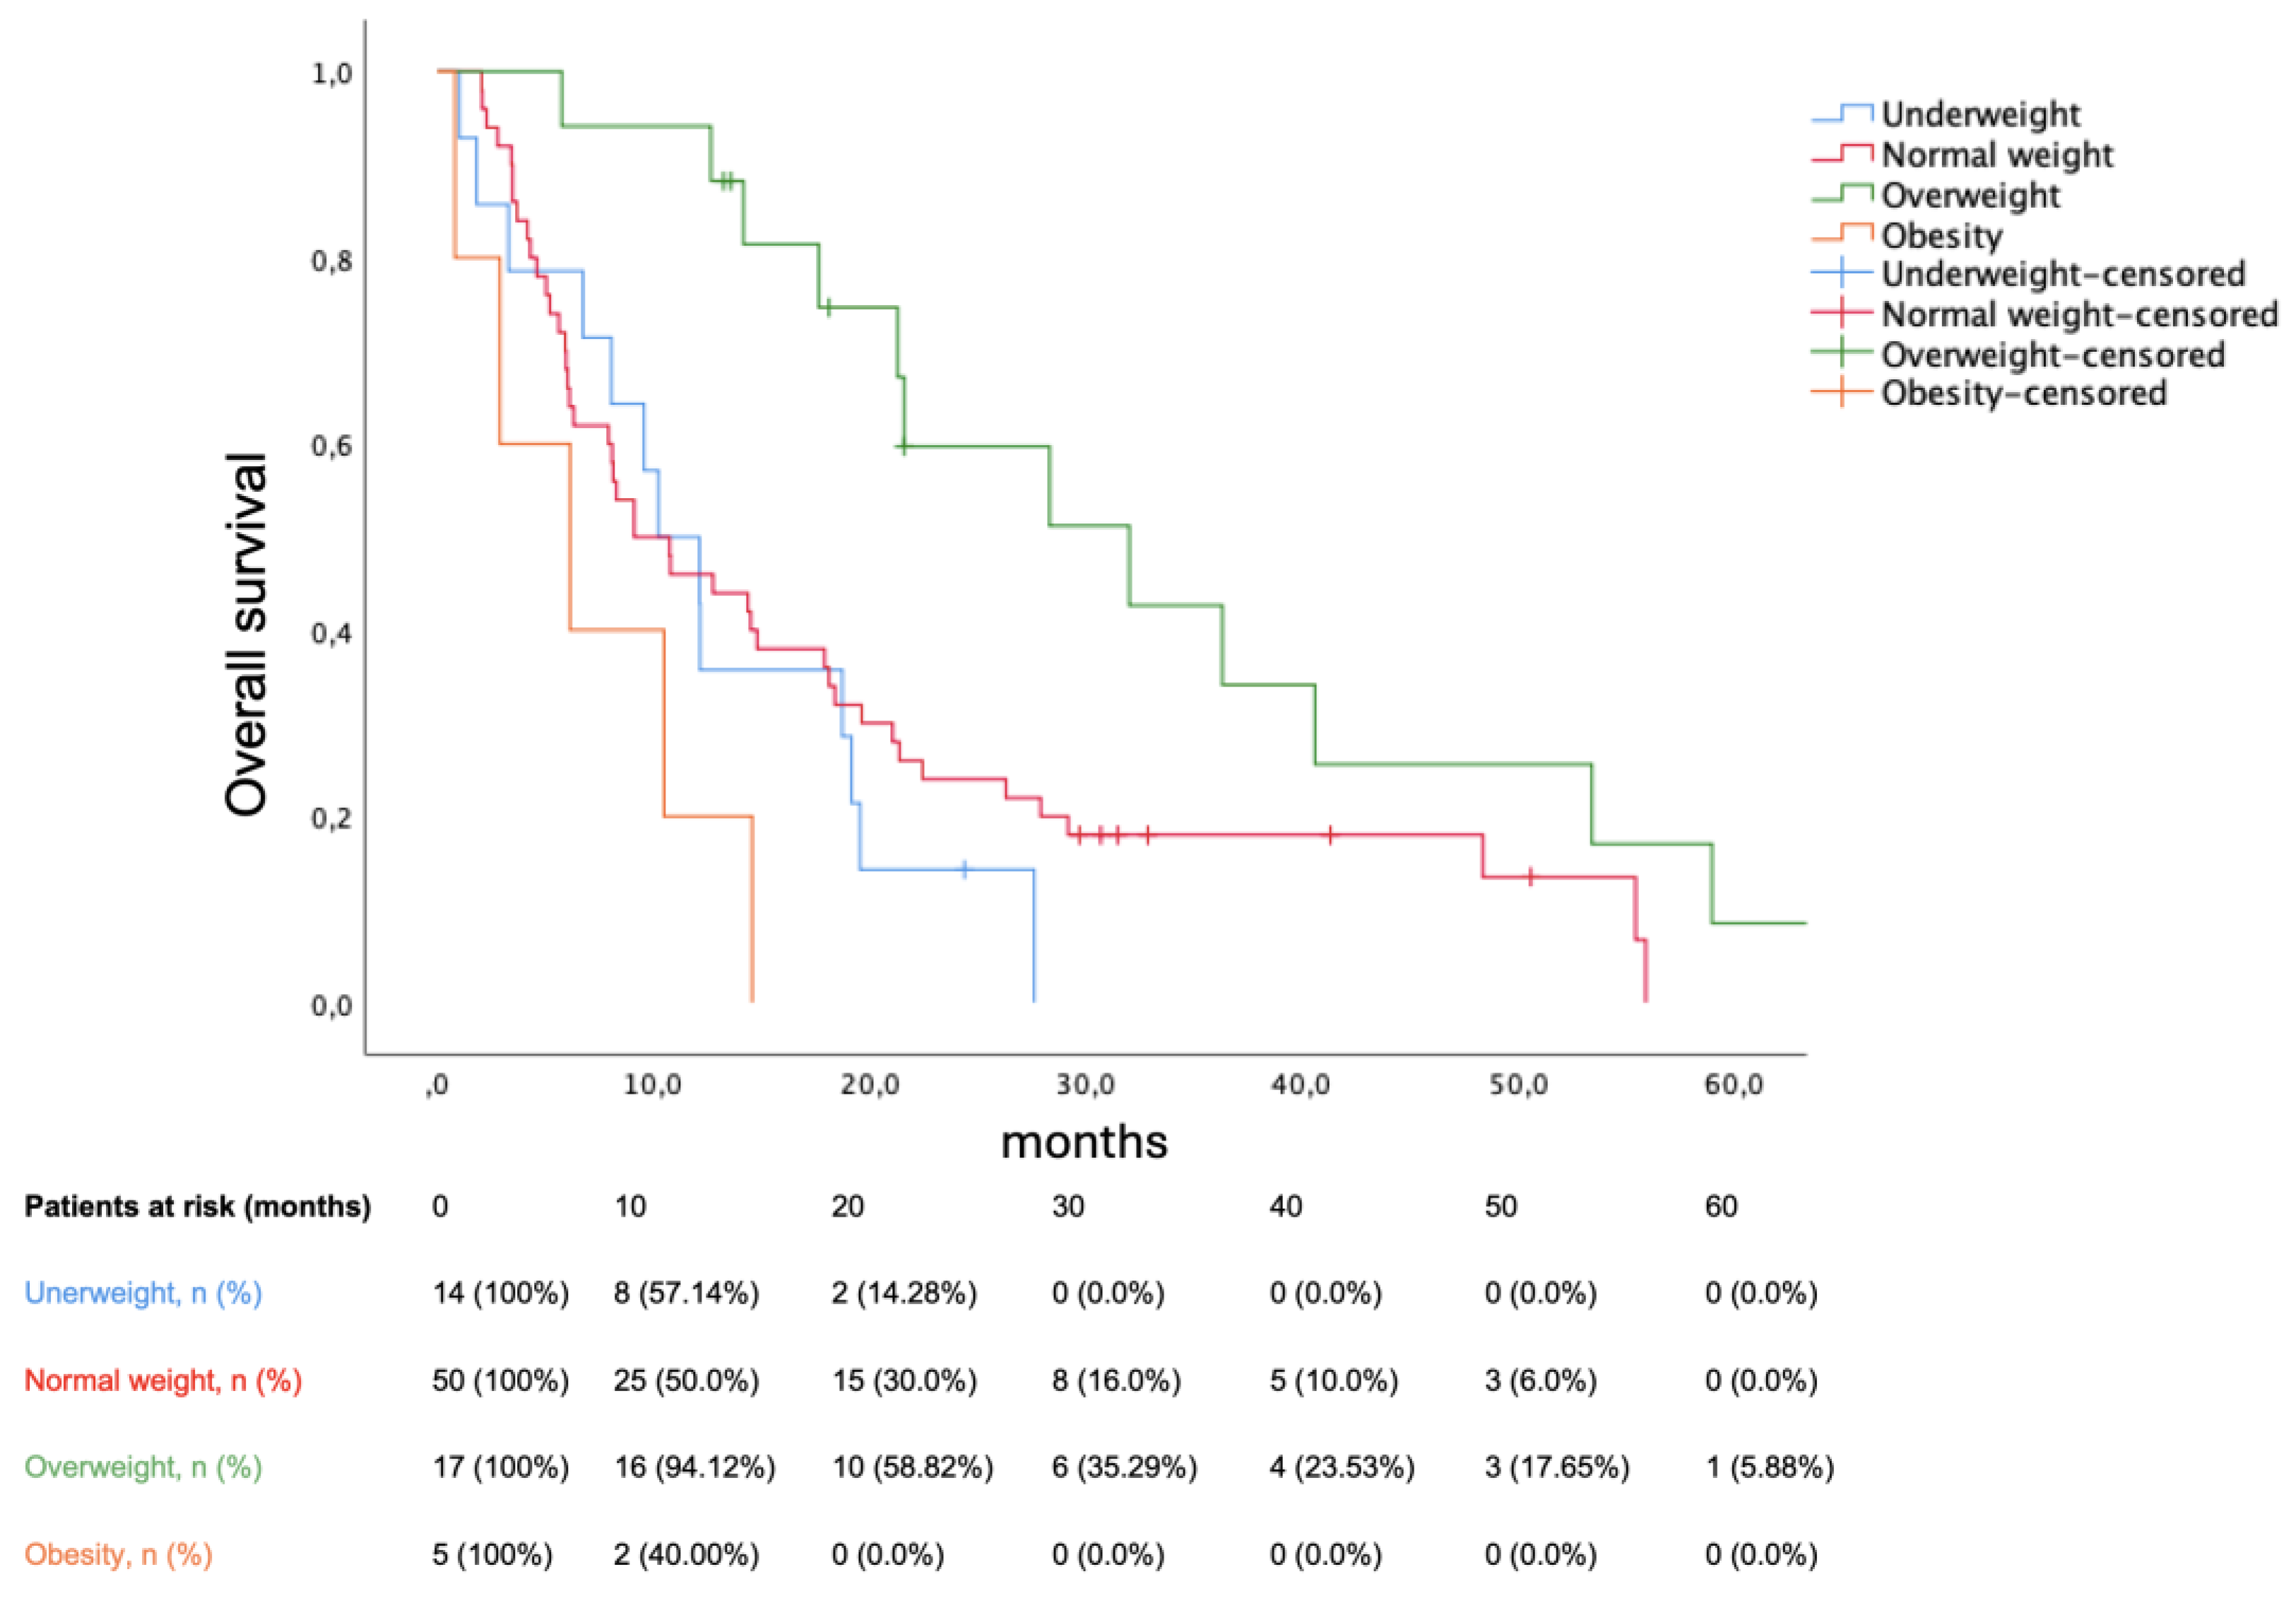
BMI significantly stratified survival among sarcopenic patients (p = 0.002). Median OS were as follows: underweight (10.22 months, 95% CI 5.526–14.914), normal weight (9.1 months, 95% CI 3.753–14.447), overweight (32 months, 95% CI 15.552–48.448), obese (6.14 months 95% CI 0.0–13.118). Bearing normal weight as reference group, being underweight was not prognostic (HR 1.378, p = 0.321), being overweight decreased mortality (HR 0.417, p = 0.01), while obesity increased mortality (HR 2.723, p = 0.039). The Kaplan-Meier plot for OS in sarcopenic patients according to BMI is shown in
Figure 3. Obesity reduced the risk for sarcopenia (odds ratio 0.34, p = 0.039). In multivariate analysis, sarcopenia, underweight and ECOG PS (0 vs ≥1) remained prognostic (shown in
Table 3).
4. Discussion
Mounting literature linking sarcopenia with survival among various cancer types, stages and treatment settings cement it as an emergent key prognostic biomarker in cancer patients. Regulatory functions concerning insulin-dependent glucose uptake or interactions between myokines and organs such as the liver or brain provide a rationale for this association [
24].
Delving into NSCLC, namely studies thresholding L3SMI for prognosis, literature on the topic is vast. Kimura et al. reported an SMI <41 cm
2/m
2 for men and <38 cm
2/m
2 for women as prognostic in a Japanese advanced NSCLC cohort (88.1% stage IV) receiving chemotherapy or EGFR-tyrosine kinase inhibitors (TKI), yielding 38.3% sarcopenic patients [
25]. Two Japanese studies thresholding L3SMI at <43.75 cm
2/m
2 for men and <41.1 cm
2/m
2 for women were also prognostic among stage I NSCLC patients, with sarcopenia rates ranging between 38.8 and 42.2% [
26,
27]. In another study, Kim et al. reported a 22.4% sarcopenia rate among a Korean NSCLC cohort in pre-operative setting, albeit sarcopenia, as defined per Fearon et al. (i.e. SMI at <55 cm
2/m
2 for men and <39 cm
2/m
2 for women) was not prognostic [
28]. Likewise, a Croatian study thresholding SMI as per Fearon et al. in advanced NSCLC cohorts, which reported 47% sarcopenic patients, could not predict mortality in patients treated with chemotherapy [
29]. Lastly, Stene et al. did not find sarcopenia as defined per Prado et al. to be prognostic within a Norwegian advanced NSCLC cohort treated with chemotherapy and with a sarcopenia rate of 74% [
30].
More recently, similar design studies delved into NSCLC treated with immunotherapy. In two Chinese studies thresholding L3SMI as per Martin et al. (i.e. SMI <43 cm
2/m
2 in men with BMI <25 kg/m
2 or <53 cm
2/m
2 if BMI >25 kg/m
2 and SMI <41 cm
2/m
2 for women irrespective of BMI) [
15], in advanced NSCLC cohorts treated with first and second-line immunotherapy, sarcopenia was prognostic regarding overall and progression-free survival, respectively [
31,
32]. Conversely, sarcopenia as defined per Fearon et al. could not predict mortality in an Italian cohort [
33]. Noteworthy, Bolte et al. were successful analyzing a 92-patient cohort treated with 1L chemoimmunotherapy defining sarcopenia based on the psoas muscle index 25
th percentile [
34]. Sarcopenia rates among these studies ranged between 26–68.9% [
31,
32,
33,
34].
Regarding oncogene-addicted NSCLC, two studies focusing on EGFR mutant cohorts found sarcopenia defined as per Fearon et al. prognostic, with sarcopenia ranging between 54–60.6% [
35,
36]. Contrariwise, Wu et al. evaluated 176 advanced NSCLC patients treated with 1L afatinib: yielding 53.41% sarcopenic patients, L3SMI as per Prado et al. was not prognostic [
37].
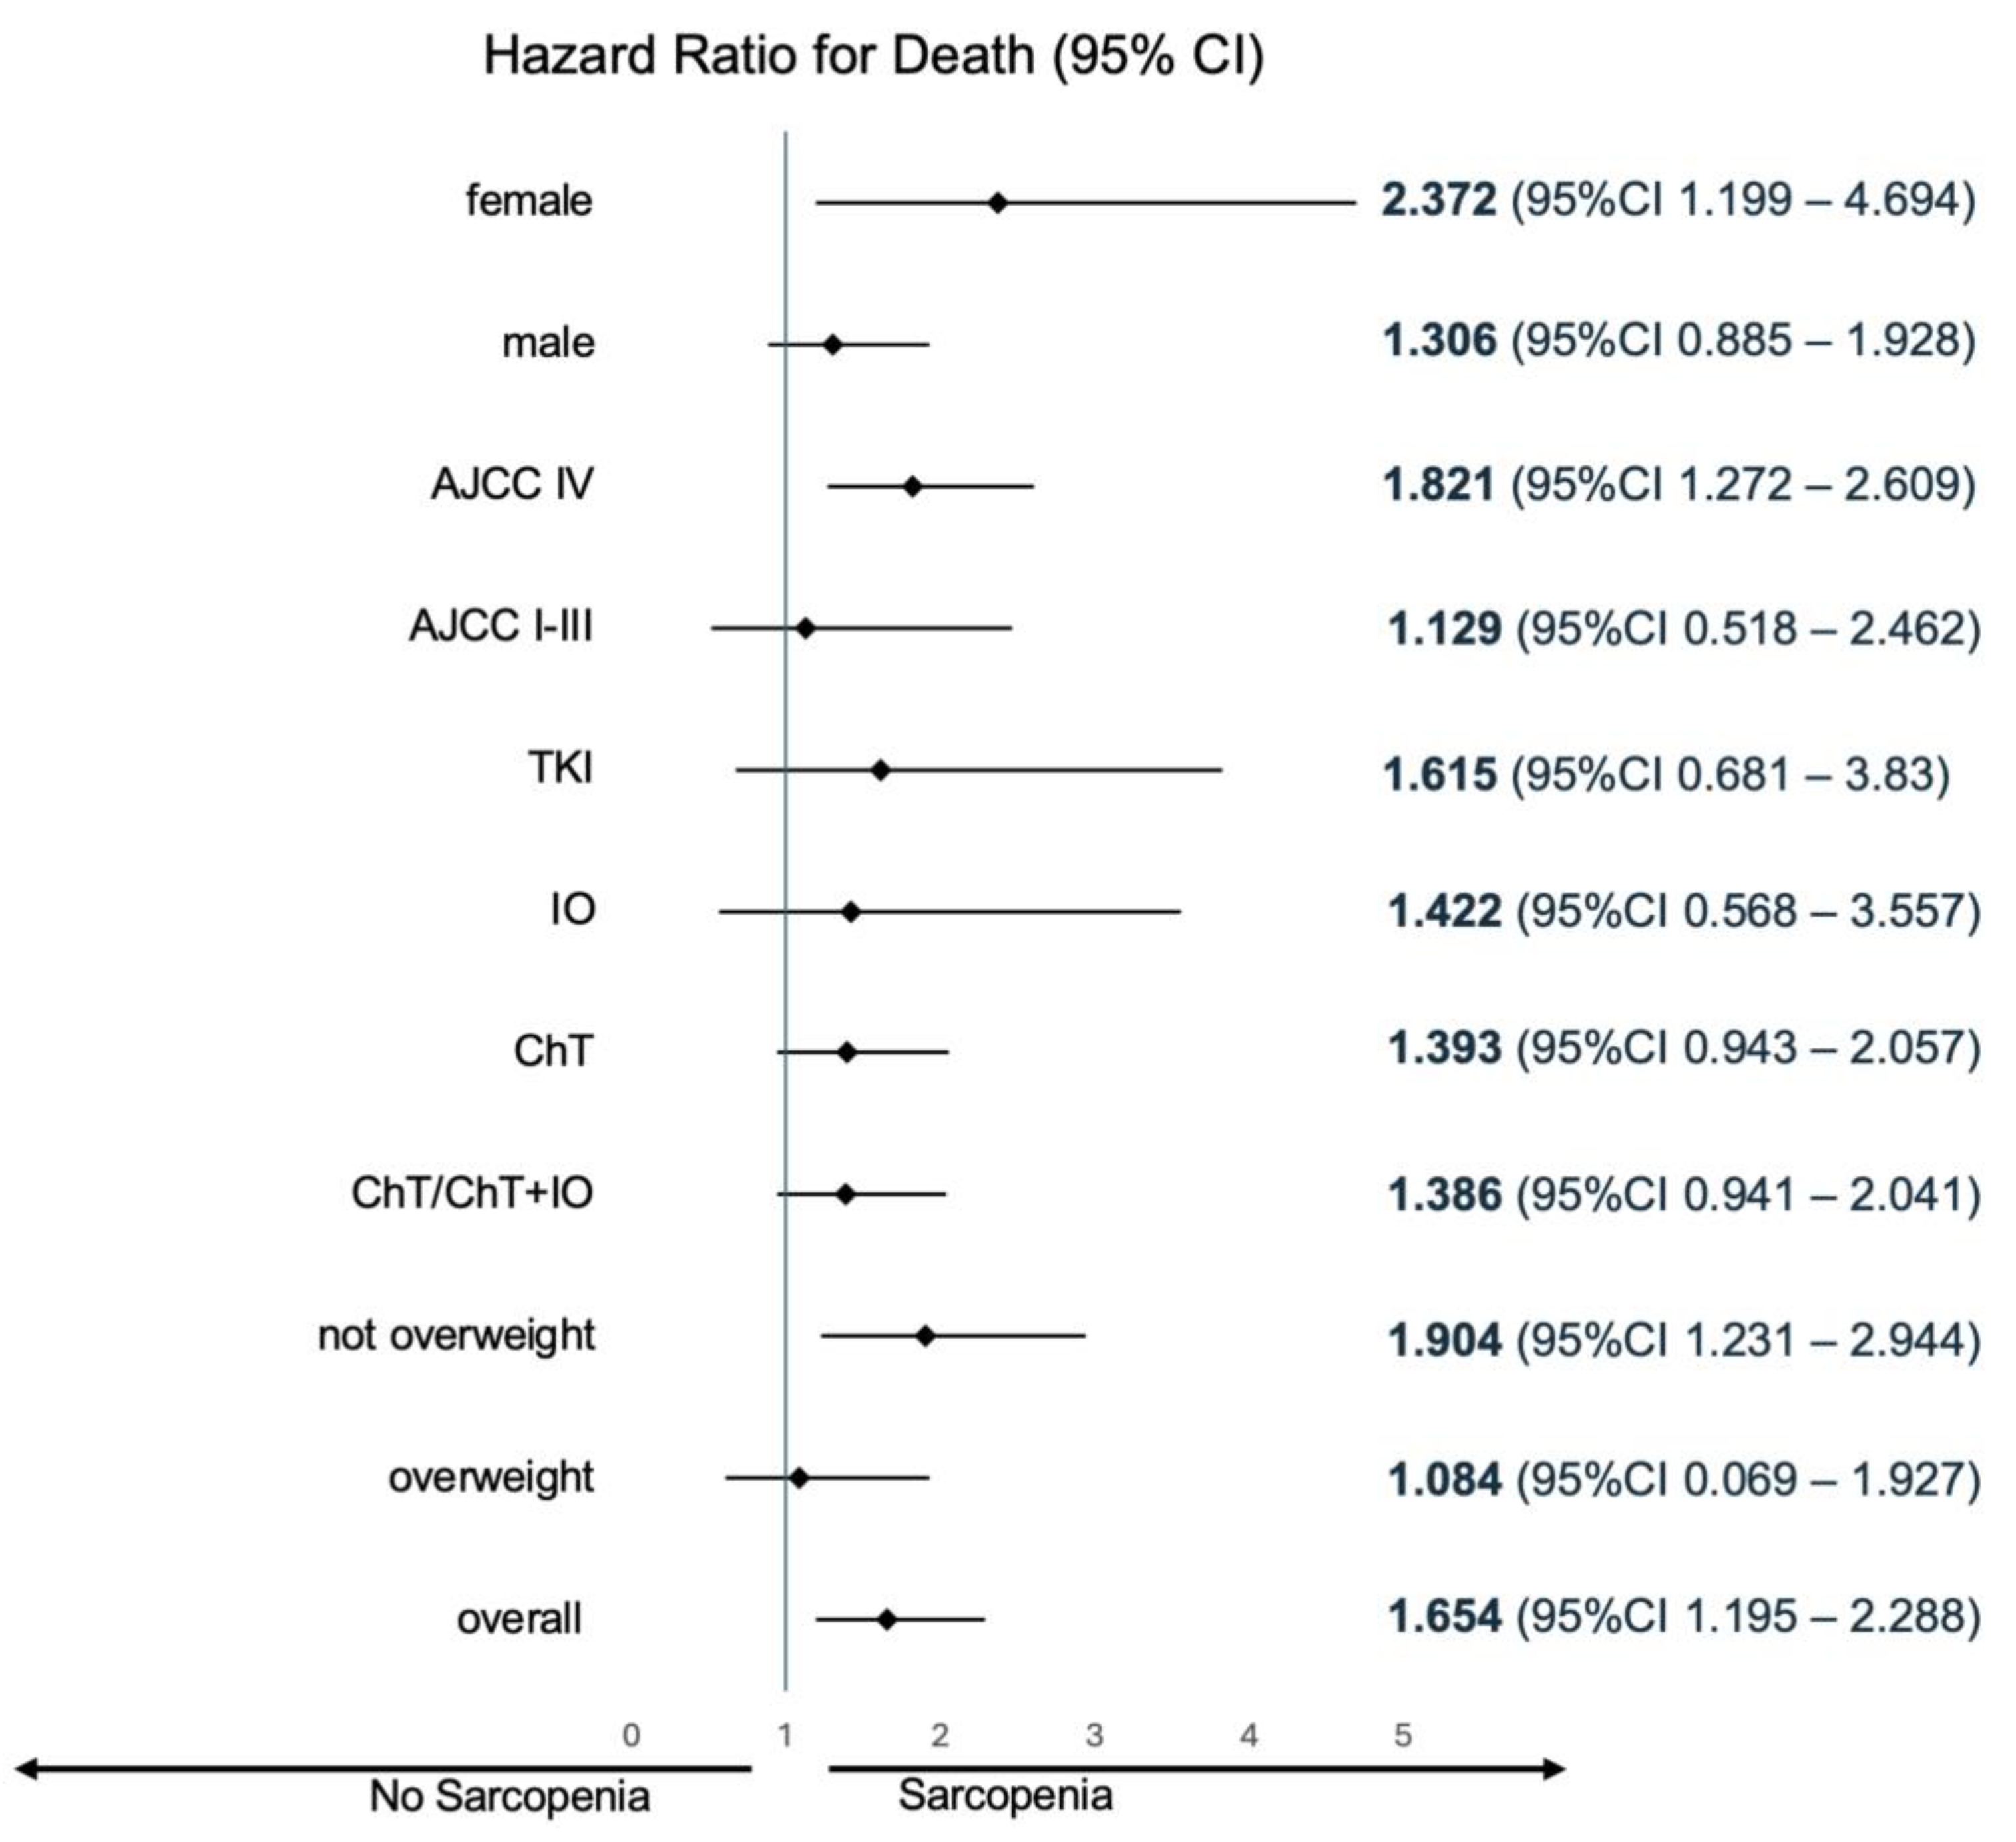
Ultimately, the reported studies, consistent regarding cancer type (NSCLC), highlight limitations inherent to broadly applying L3SMI literature definitions. Of note, available literature does not suggest that sarcopenia could hold a heterogeneous prognostic value depending on the chosen systemic treatment. Our study, although unbalanced concerning treatment subgroups, aligns with the same proposition (HR for death 1.615, 1.422 and 1.393 for TKI, immunotherapy and chemotherapy subgroups, respectively; shown in
Figure 2). Our study is less informative with regards to chemoimmunotherapy, since less than 5% (n = 9) of these patients comprised the SMI-analyzed cohort. Notwithstanding, nor did immunotherapy-treated patients were discrepant to chemotherapy-treated patients within subgroup analysis, nor did including chemoimmunotherapy-treated patients in the chemotherapy cohort meaningfully changed HR for death or the respective confidence interval (HR for death 1.393, 95% CI 0.943–2.057 and 1.386, 95% CI 0.941–2.041 for chemotherapy and chemotherapy/chemoimmunotherapy, respectively; shown in
Figure 2).
BMI stratified OS among sarcopenic patients. Remarkably, HR for mortality resembled the ‘U-shape’ curve described in the context of the obesity paradox [
38]. Sarcopenic obesity represented a particularly poor prognostic subgroup: well-known theses on this issue include a greater risk for both cardiovascular disease and mortality, as well as conventional BSA-adjusted dose scaling possibly disproportioning the absolute treatment dose to distribution volume ratio, hence increasing iatrogenesis and mortality. Conversely, being overweight without progressing to obesity may offer metabolic advantages facing a consumptive syndrome [
8,
39].
To the best of our knowledge, this is the first Portuguese study thresholding L3SMI for prognosis in mNSCLC. In a similar fashion, sex-specific L3SMI cut-off at <49.12 cm
2/m
2 and <35.85 cm
2/m
2 for men and women, respectively, predicted both mortality and dose-limiting toxicities in a Portuguese metastatic colorectal cancer cohort [
40]. The proximity between such cut-offs and those reported herein favors the hypothesis that ethnicity/world-region and treatment setting can be pivotal to define L3SMI-based sarcopenia in cancer patients.
Our study has several limitations. Firstly, its retrospective, single-center design, as well as exploiting imaging not primarily intended for research. Concerning treatment subgroups, 1L chemoimmunotherapy, current standard of care for most mNSCLC patients without contraindications [
7,
8], was not reimbursed by the Portuguese national health system until May 2022, resulting in less patients receiving this treatment. Also, providing the hypothesis that sarcopenia could hold different prognostic values dependent on given systemic treatment, this study disregards the impact of second and subsequent treatment lines on prognosis. Importantly, the study lacks an independent validation cohort. Rather than broadly define L3SMI thresholds for sarcopenia, the study aims to shed light on critical challenges which hinder sarcopenia definition in clinical practice, while providing a foundation for prospective investigation.
5. Conclusions
Within a Portuguese mNSCLC cohort, sarcopenia was an independent prognostic factor as defined per L3SMI cohort-specific thresholds. Reclassification of nearly 20% of our patients, compared to the prespecified literature definition, highlights that homogeneity regarding both treatment setting and ethnicity could be key to defining sarcopenia based on SMI. Analyzing body composition is feasible in routine clinical practice without additional costs.
Author Contributions
Conceptualization, J.L.M.; methodology, J.L.M., J.V.B. and Y.C.R.; software, J.L.M. and I.M.; validation, J.L.M. and D.S.S.; formal analysis, J.L.M. and R.Q.F.; investigation, J.L.M. and R.Q.F.; resources, J.L.M., R.Q.F. and I.M.; data curation, J.L.M., R.Q.F. and J.V.B.; writing—original draft preparation, J.L.M.; writing—review and editing, J.V.B., Y.C.R., D.S.S., A.M. and I.G.; visualization, J.L.M., J.V.B., Y.C.R., D.S.S.; supervision, A.M., M.C., I.G., N.P. and P.R.; project administration, J.L.M., N.P. and P.R.; funding acquisition, M.C., N.P. and P.R. All authors have read and agreed to the published version of the manuscript.
Funding
This research received no external funding.
Institutional Review Board Statement
The study was conducted in accordance with the Declaration of Helsinki, and approved by the Institutional Ethics Committee of UNIDADE LOCAL DE SAÚDE SÃO JOSÉ (protocol 535, approved on the 4th September 2024).
Informed Consent Statement
Patient consent was waived due to the retrospective, observational design of the study.
Data Availability Statement
The original contributions presented in this study are included in the article. Further inquiries can be directed to the corresponding author.
Conflicts of Interest
The authors declare no conflicts of interest.
Abbreviations
The following abbreviations are used in this manuscript:
| 1L |
First-line |
| 95%CI |
Ninety-five percent confidence interval |
| AJCC |
American Joint Committee on Cancer |
| BMI |
Body Mass Index |
| ECOG |
Eastern Cooperative Oncology Group |
| EGFR |
Epidermal Growth Factor Receptor |
| HR |
Hazard Ratio |
| HU |
Hounsfield Unit |
| ICDO |
International Classification of Diseases for Oncology |
| IO |
Immunotherapy |
| L3 |
Third lumbar vertebrae |
| (m)NSCLC |
(metastatic) non-small-cell lung cancer |
| OS |
Overall Survival |
| PFS |
Progression-free Survival |
| PS |
Performance Status |
| SMA |
Skeletal Muscle Area |
| SMI |
Skeletal Muscle Index |
| SNOMED |
Systemized Nomenclature of Medicine |
| TKI |
Tyrosine Kinase Inhibitor |
| ULSSJ |
Unidade Local de Saúde São José |
References
- Bray F, Laversanne M, Sung H, et al. Global cancer statistics 2022: GLOBOCAN estimates of incidence and mortality worldwide for 36 cancers in 185 countries. CA Cancer J Clin. 2024;74(3):229-263. [CrossRef]
- Jemal A, Schafer EJ, Sung H, et al. The Burden of Lung Cancer in Women Compared With Men in the US. JAMA Oncol. 2023;9(12):1727-1728. [CrossRef]
- Jha P. Avoidable global cancer deaths and total deaths from smoking. Nat Rev Cancer. 2009;9(9):655-664. [CrossRef]
- Adams SJ, Stone E, Baldwin DR, Vliegenthart R, Lee P, Fintelmann FJ. Lung cancer screening. Lancet. 2023;401(10374):390-408. [CrossRef]
- van Meerbeeck JP, Franck C. Lung cancer screening in Europe: where are we in 2021? Transl Lung Cancer Res. 2021;10(5):2407-2417. [CrossRef]
- Thai AA, Solomon BJ, Sequist LV, Gainor JF, Heist RS. Lung cancer. Lancet. 2021;398(10299):535-554. [CrossRef]
- Hendriks LE, Kerr KM, Menis J, et al. Oncogene-addicted metastatic non-small-cell lung cancer: ESMO Clinical Practice Guideline for diagnosis, treatment and follow-up. Ann Oncol. 2023;34(4):339-357. [CrossRef]
- Hendriks LE, Kerr KM, Menis J, et al. Non-oncogene-addicted metastatic non-small-cell lung cancer: ESMO Clinical Practice Guideline for diagnosis, treatment and follow-up. Ann Oncol. 2023;34(4):358-376. [CrossRef]
- Baracos VE, Arribas L. Sarcopenic obesity: hidden muscle wasting and its impact for survival and complications of cancer therapy. Ann Oncol. 2018;29 Suppl 2:ii1-ii9. [CrossRef]
- Cruz-Jentoft AJ, Bahat G, Bauer J, et al. Sarcopenia: revised European consensus on definition and diagnosis [published correction appears in Age Ageing. 2019 Jul 1;48(4):601. doi: 10.1093/ageing/afz046]. Age Ageing. 2019;48(1):16-31. [CrossRef]
- Walowski CO, Braun W, Maisch MJ, et al. Reference Values for Skeletal Muscle Mass - Current Concepts and Methodological Considerations. Nutrients. 2020;12(3):755. Published 2020 Mar 12. [CrossRef]
- MacDonald AJ, Greig CA, Baracos V. The advantages and limitations of cross-sectional body composition analysis. Curr Opin Support Palliat Care. 2011;5(4):342-349. [CrossRef]
- Shen W, Punyanitya M, Wang Z, et al. Total body skeletal muscle and adipose tissue volumes: estimation from a single abdominal cross-sectional image. J Appl Physiol (1985). 2004;97(6):2333-2338. [CrossRef]
- Prado CM, Lieffers JR, McCargar LJ, et al. Prevalence and clinical implications of sarcopenic obesity in patients with solid tumours of the respiratory and gastrointestinal tracts: a population-based study. Lancet Oncol. 2008;9(7):629-635. [CrossRef]
- Martin L, Birdsell L, Macdonald N, et al. Cancer cachexia in the age of obesity: skeletal muscle depletion is a powerful prognostic factor, independent of body mass index. J Clin Oncol. 2013;31(12):1539-1547. [CrossRef]
- Fearon K, Strasser F, Anker SD, et al. Definition and classification of cancer cachexia: an international consensus. Lancet Oncol. 2011;12(5):489-495. [CrossRef]
- Zhuang CL, Huang DD, Pang WY, et al. Sarcopenia is an Independent Predictor of Severe Postoperative Complications and Long-Term Survival After Radical Gastrectomy for Gastric Cancer: Analysis from a Large-Scale Cohort. Medicine (Baltimore). 2016;95(13):e3164. [CrossRef]
- Itoh S, Yoshizumi T, Kimura K, et al. Effect of Sarcopenic Obesity on Outcomes of Living-Donor Liver Transplantation for Hepatocellular Carcinoma. Anticancer Res. 2016;36(6):3029-3034. PMID: 27272822.
- Yang M, Shen Y, Tan L, Li W. Prognostic Value of Sarcopenia in Lung Cancer: A Systematic Review and Meta-analysis. Chest. 2019;156(1):101-111. [CrossRef]
- Baldessari C, Guaitoli G, Valoriani F, et al. Impact of body composition, nutritional and inflammatory status on outcome of non-small cell lung cancer patients treated with immunotherapy. Clin Nutr ESPEN. 2021;43:64-75. [CrossRef]
- Wu CT, Hsu PC, Chang JW, et al. Comprehensive assessment of pretreatment sarcopenia impacts on patients with EGFR-mutated NSCLC treated with afatinib. Thorac Cancer. 2023;14(25):2548-2557. [CrossRef]
- Topcu A, Ozturk A, Yurtsever I, et al. The effect of sarcopenia on erlotinib therapy in patients with metastatic lung adenocarcinoma. Bosn J Basic Med Sci. 2022;22(6):982-991. Published 2022 Oct 23. [CrossRef]
- Irving BA, Weltman JY, Brock DW, Davis CK, Gaesser GA, Weltman A. NIH ImageJ and Slice-O-Matic computed tomography imaging software to quantify soft tissue. Obesity (Silver Spring). 2007;15(2):370-376. [CrossRef]
- Balakrishnan R, Thurmond DC. Mechanisms by Which Skeletal Muscle Myokines Ameliorate Insulin Resistance. Int J Mol Sci. 2022;23(9):4636. Published 2022 Apr 22. [CrossRef]
- Kimura M, Naito T, Kenmotsu H, et al. Prognostic impact of cancer cachexia in patients with advanced non-small cell lung cancer. Support Care Cancer. 2015;23(6):1699-1708. [CrossRef]
- Shoji F, Matsubara T, Kozuma Y, et al. Relationship Between Preoperative Sarcopenia Status and Immuno-nutritional Parameters in Patients with Early-stage Non-small Cell Lung Cancer. Anticancer Res. 2017;37(12):6997-7003. [CrossRef]
- Suzuki Y, Okamoto T, Fujishita T, et al. Clinical implications of sarcopenia in patients undergoing complete resection for early non-small cell lung cancer. Lung Cancer. 2016;101:92-97. [CrossRef]
- Kim EY, Lee HY, Kim KW, et al. Preoperative Computed Tomography-Determined Sarcopenia and Postoperative Outcome After Surgery for Non-Small Cell Lung Cancer. Scand J Surg. 2018;107(3):244-251. [CrossRef]
- Srdic D, Plestina S, Sverko-Peternac A, Nikolac N, Simundic AM, Samarzija M. Cancer cachexia, sarcopenia and biochemical markers in patients with advanced non-small cell lung cancer-chemotherapy toxicity and prognostic value. Support Care Cancer. 2016;24(11):4495-4502. [CrossRef]
- Stene GB, Helbostad JL, Amundsen T, et al. Changes in skeletal muscle mass during palliative chemotherapy in patients with advanced lung cancer. Acta Oncol. 2015;54(3):340-348. [CrossRef]
- Wang Y, Chen P, Huang J, et al. Assessment of sarcopenia as a predictor of poor overall survival for advanced non-small-cell lung cancer patients receiving salvage anti-PD-1 immunotherapy. Ann Transl Med. 2021;9(24):1801. [CrossRef]
- Feng Y, Wang L, Guo F, et al. Predictive impact of sarcopenia in advanced non-small cell lung cancer patients treated with immune checkpoint inhibitors: A retrospective study. Heliyon. 2024;10(5):e27282. Published 2024 Mar 3. [CrossRef]
- Madeddu C, Busquets S, Donisi C, et al. Effect of Cancer-Related Cachexia and Associated Changes in Nutritional Status, Inflammatory Status, and Muscle Mass on Immunotherapy Efficacy and Survival in Patients with Advanced Non-Small Cell Lung Cancer. Cancers (Basel). 2023;15(4):1076. Published 2023 Feb 8. [CrossRef]
- Bolte FJ, McTavish S, Wakefield N, et al. Association of sarcopenia with survival in advanced NSCLC patients receiving concurrent immunotherapy and chemotherapy. Front Oncol. 2022;12:986236. Published 2022 Sep 23. [CrossRef]
- Rossi S, Di Noia V, Tonetti L, et al. Does sarcopenia affect outcome in patients with non-small-cell lung cancer harboring EGFR mutations?. Future Oncol. 2018;14(10):919-926. [CrossRef]
- Topcu A, Ozturk A, Yurtsever I, et al. The effect of sarcopenia on erlotinib therapy in patients with metastatic lung adenocarcinoma. Bosn J Basic Med Sci. 2022;22(6):982-991. Published 2022 Oct 23. [CrossRef]
- Wu CT, Hsu PC, Chang JW, et al. Comprehensive assessment of pretreatment sarcopenia impacts on patients with EGFR-mutated NSCLC treated with afatinib. Thorac Cancer. 2023;14(25):2548-2557. [CrossRef]
- Atkins JL, Wannamathee SG. Sarcopenic obesity in ageing: cardiovascular outcomes and mortality. Br J Nutr. 2020;124(10):1102-1113. [CrossRef]
- Kroenke CH, Neugebauer R, Meyerhardt J, et al. Analysis of Body Mass Index and Mortality in Patients With Colorectal Cancer Using Causal Diagrams. JAMA Oncol. 2016;2(9):1137-1145. [CrossRef]
- da Silva Dias D, Machado M, Trabulo C, Gosálbez B, Ravasco P. Impact of Body Composition on Prognosis and Dose-Limiting Toxicities on Metastatic Colorectal Cancer. Front Nutr. 2022;8:671547. Published 2022 Jan 27. [CrossRef]
|
Disclaimer/Publisher’s Note: The statements, opinions and data contained in all publications are solely those of the individual author(s) and contributor(s) and not of MDPI and/or the editor(s). MDPI and/or the editor(s) disclaim responsibility for any injury to people or property resulting from any ideas, methods, instructions or products referred to in the content. |
© 2025 by the authors. Licensee MDPI, Basel, Switzerland. This article is an open access article distributed under the terms and conditions of the Creative Commons Attribution (CC BY) license (http://creativecommons.org/licenses/by/4.0/).