Submitted:
12 January 2025
Posted:
13 January 2025
You are already at the latest version
Abstract
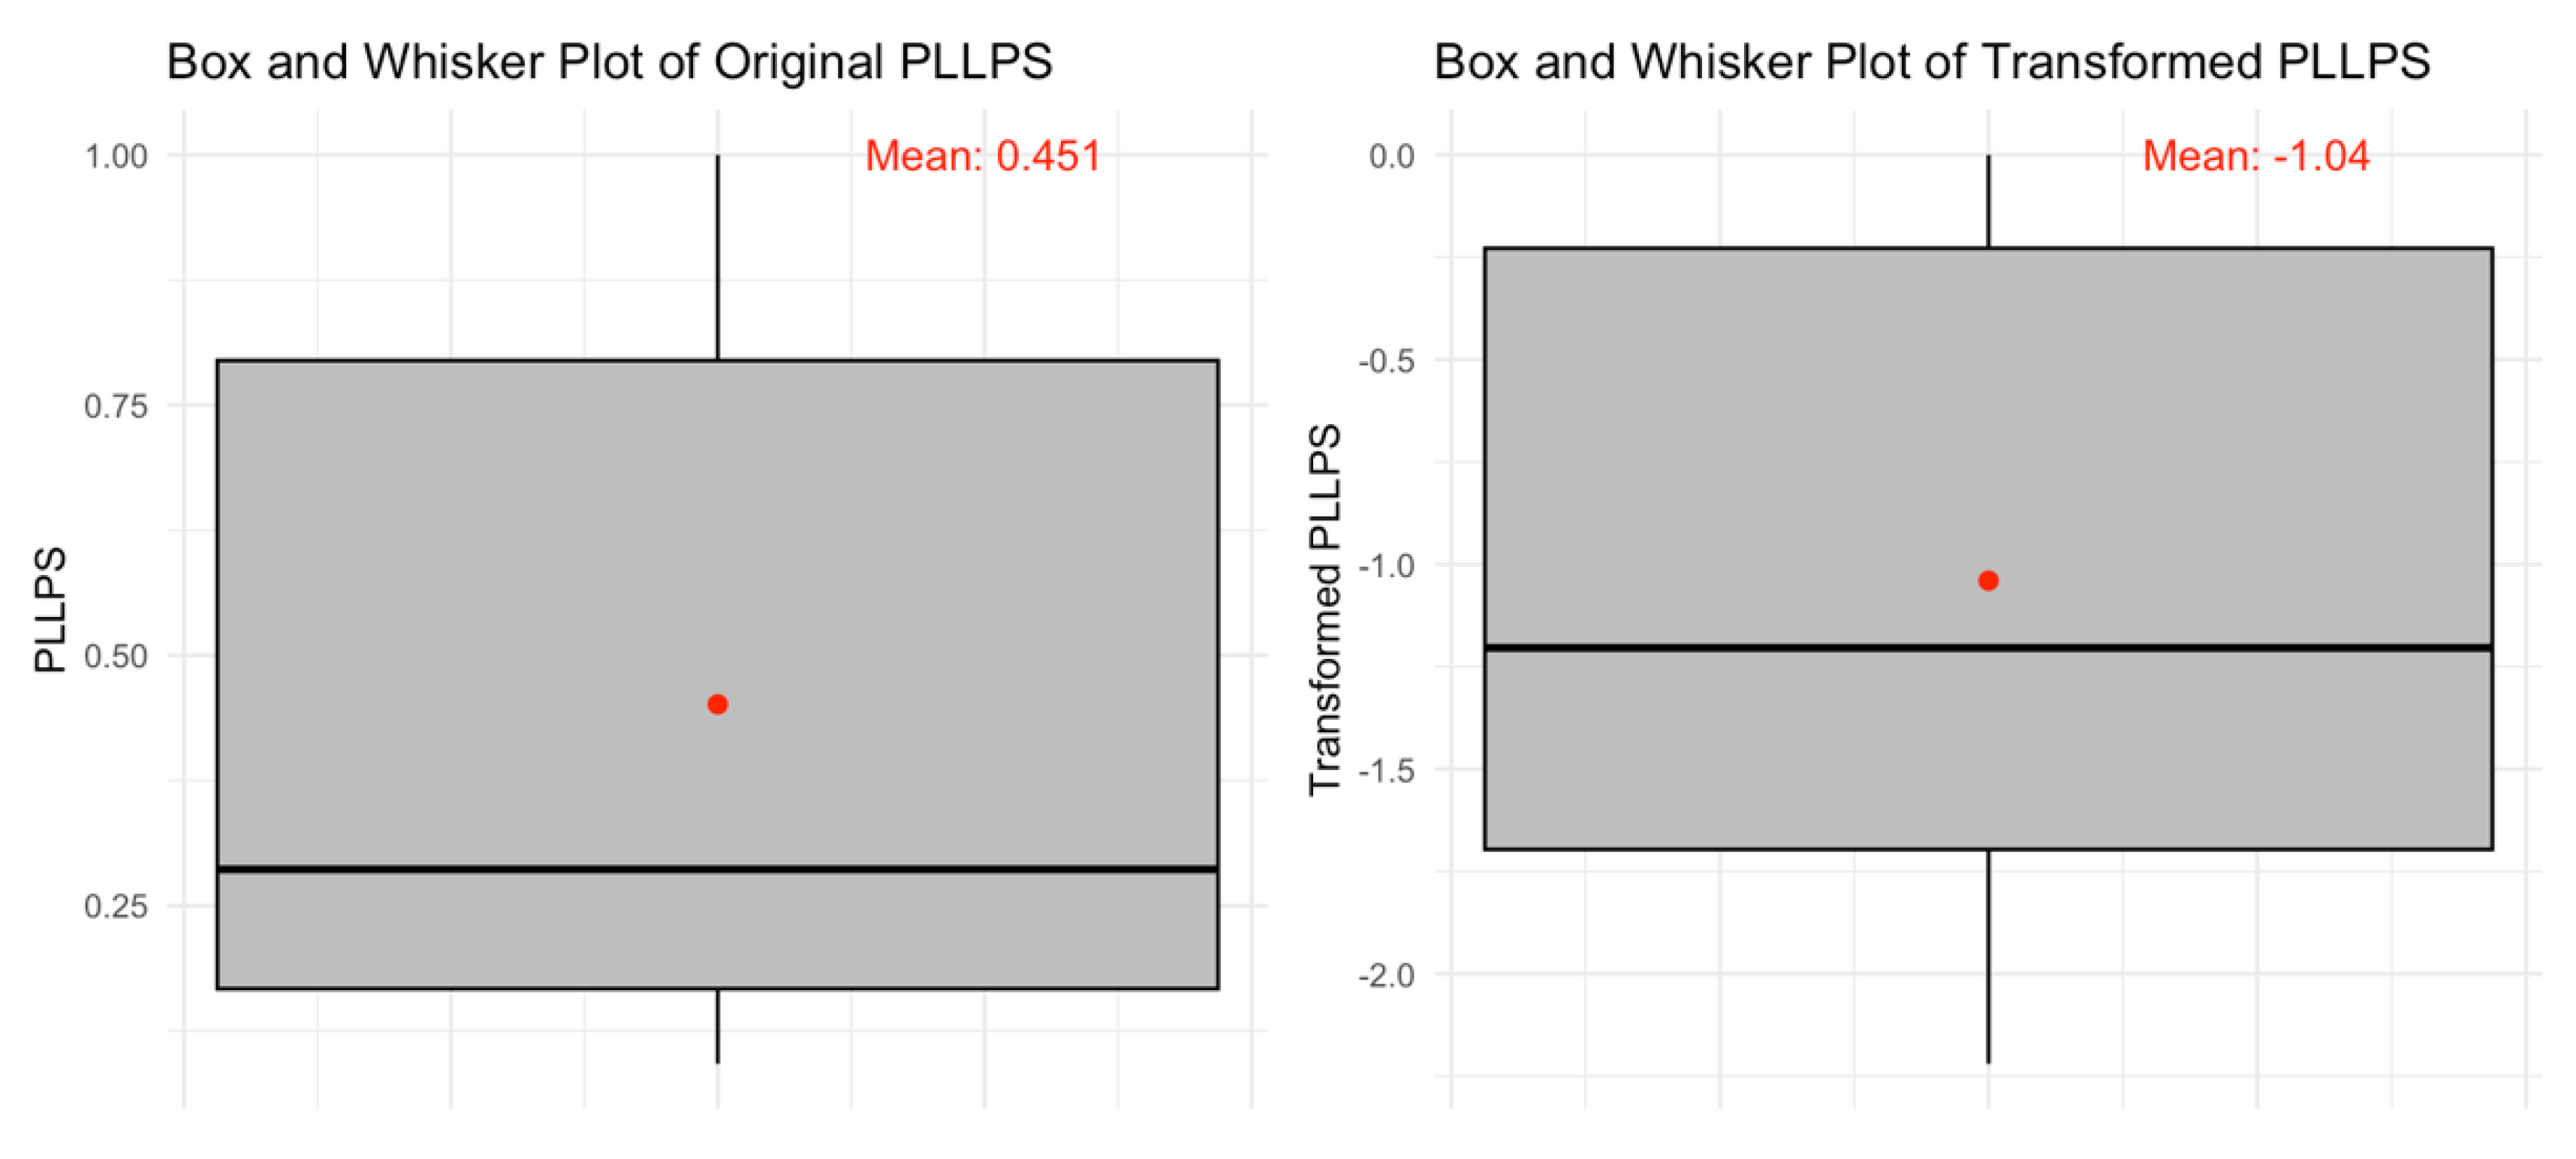
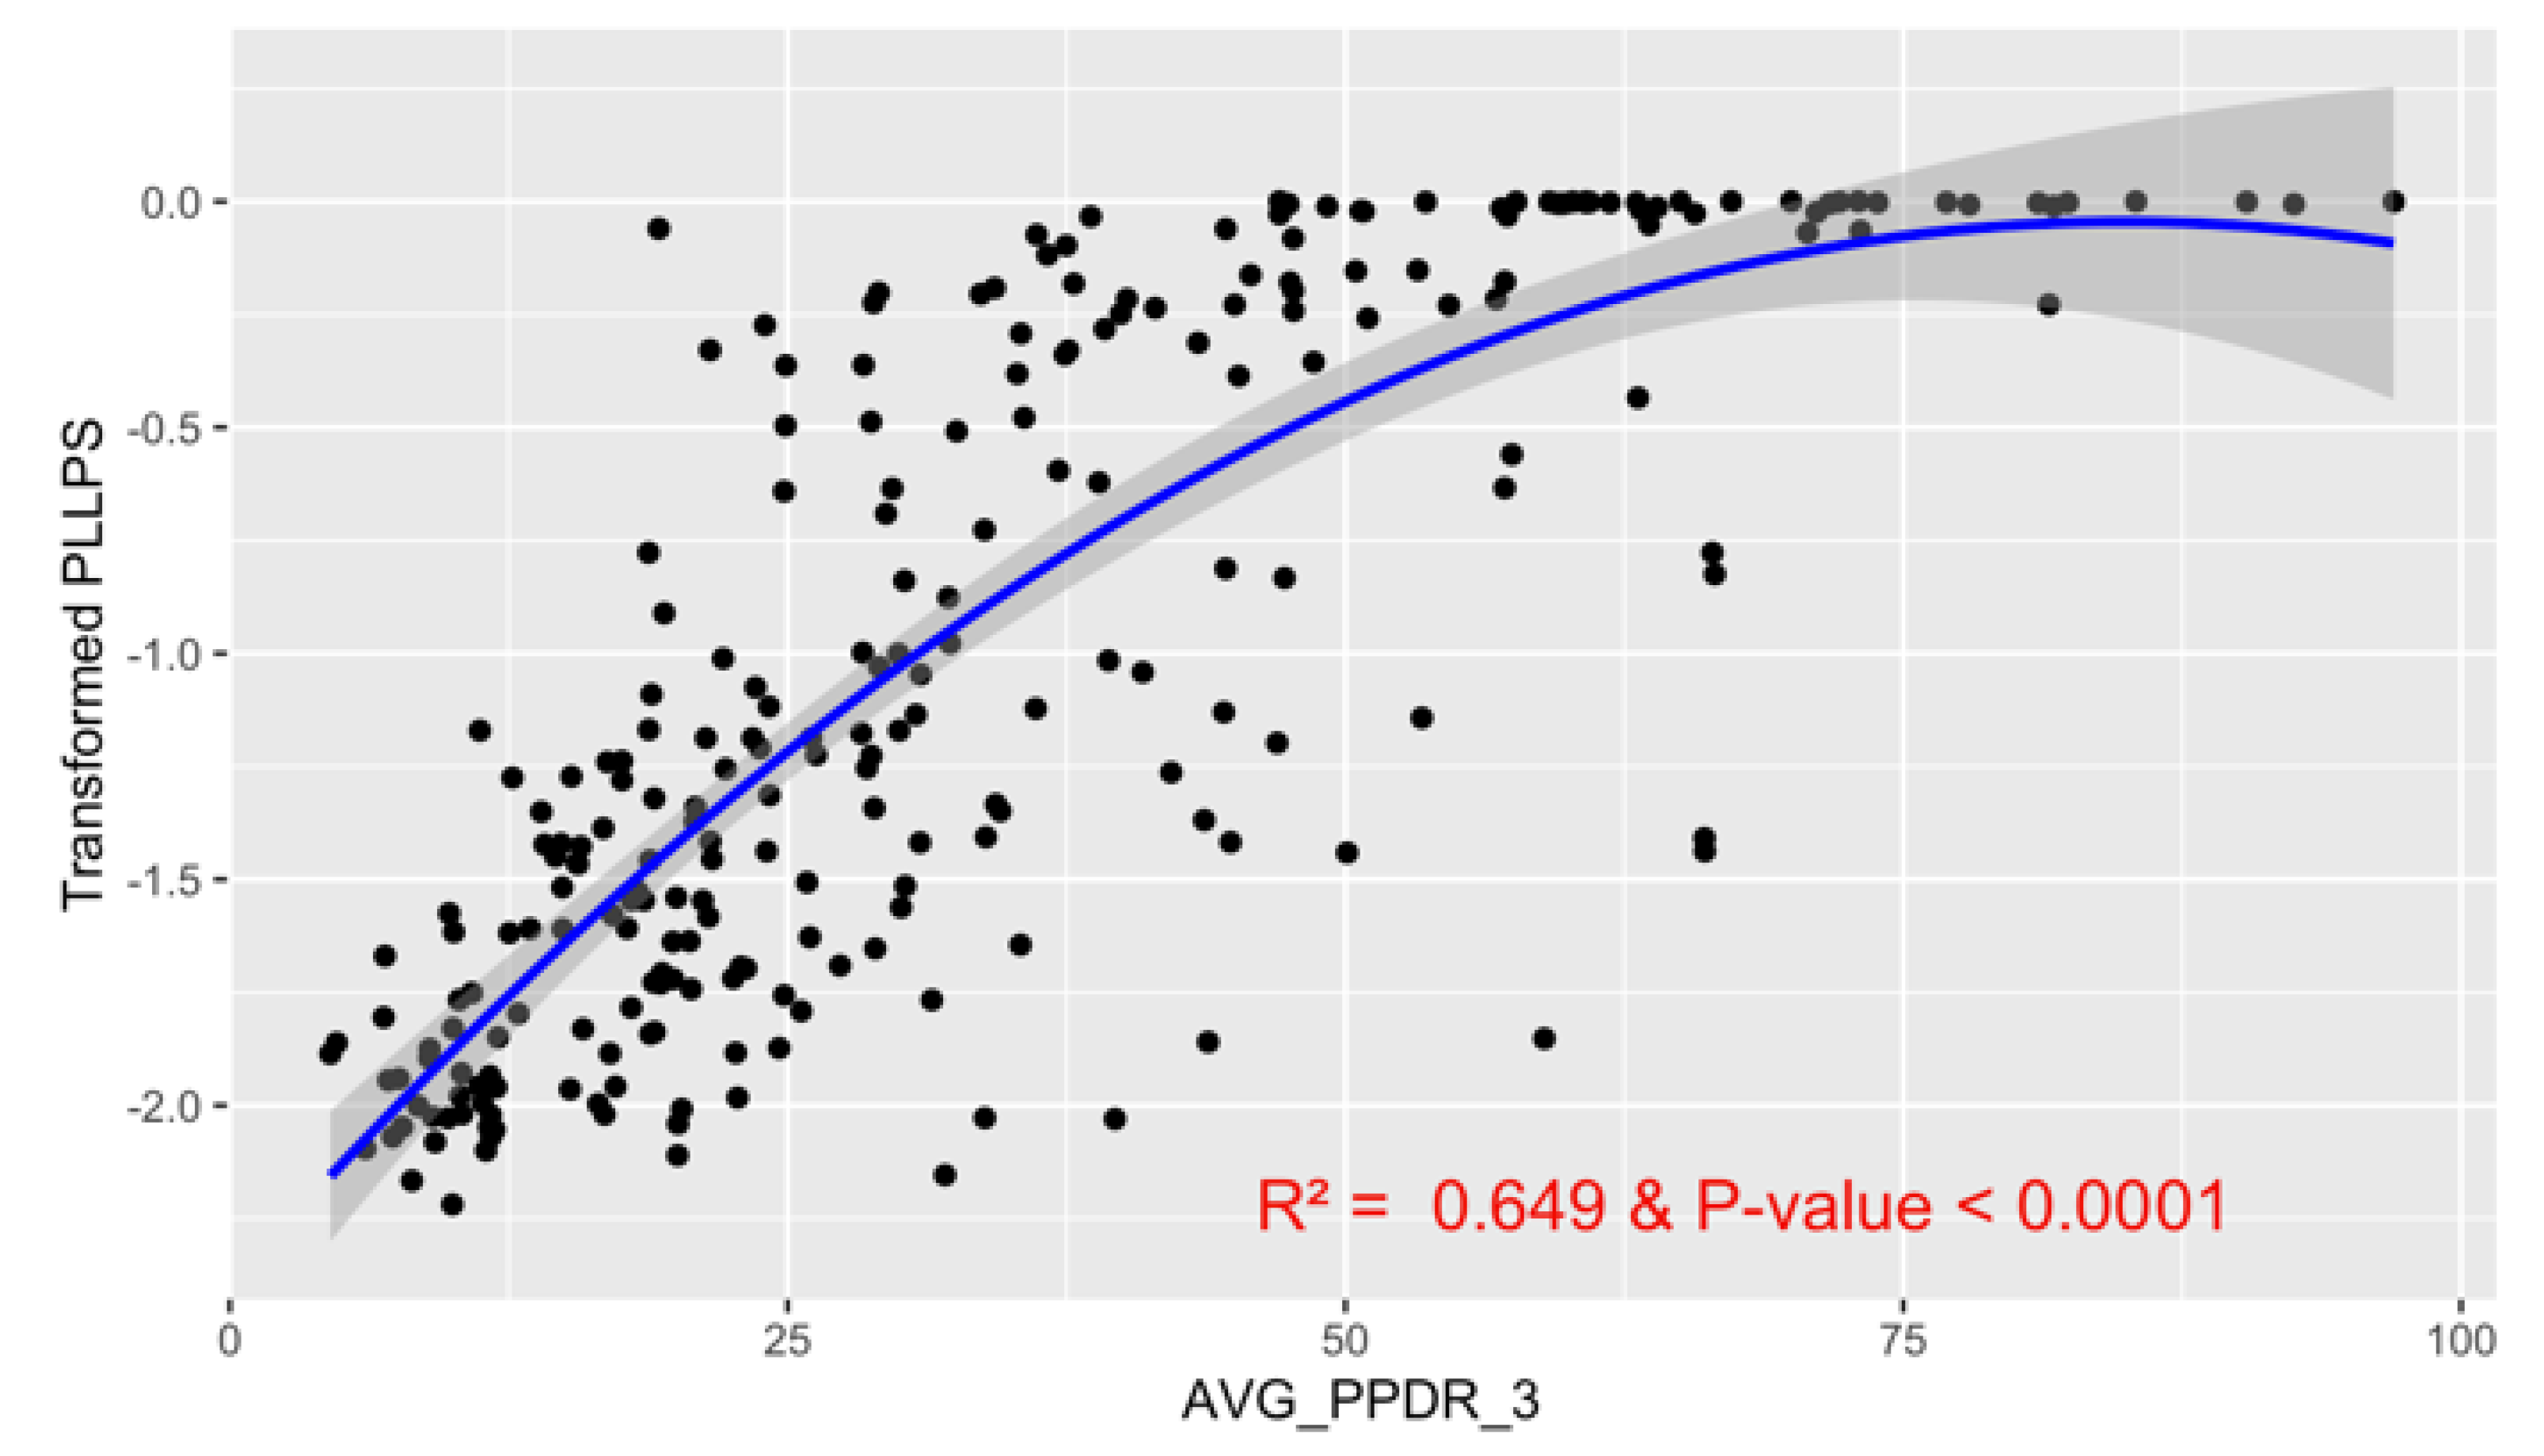
Intrinsic disorder is attributed to protein regions that lack a fixed three-dimensional structure under physiological conditions, enabling conformational plasticity. This flexibility allows for diverse functions, including transient interactions, signaling, and phase separation via disorder-to-order transitions upon binding. The acrosome, a sperm-specific organelle essential for fertilization, has a number of proteins whose functions may rely on intrinsic disorder. We analyzed 250 human acrosomal proteins to understand the roles of intrinsic disorder and liquid-liquid phase separation (LLPS) in their functional diversity. Intrinsic disorder was predicted using multiple computational models, which yielded 97 proteins that exhibited high disorder levels (>30%). Functional enrichment analysis then identified associations between disordered regions overlapping with SCOP domains and critical acrosomal processes, including vesicle trafficking, membrane fusion, and enzymatic activation. Examples of disordered SCOP domains include the PLC-like phosphodiesterase domain, the t-SNARE domain, and P-domain of calnexin/calreticulin. Next, protein-protein interaction networks revealed acrosomal proteins as hubs in tightly interconnected systems, emphasizing their functional importance. The acrosomal proteome was also analyzed for phase separation propensity, revealing that over 30% of these proteins are high-probability LLPS drivers (>60%), underscoring their role in dynamic compartmentalization. Proteins such as myristoylated alanine-rich C-kinase substrate (MARCKS) and nuclear transition protein 2 (TNP2) exhibited both high LLPS propensities and high levels of structural disorder. A significant relationship (p < 0.0001, R² = 0.649) was observed between level of intrinsic disorder and LLPS propensity, showing the role of disorder in facilitating phase separation. Overall, these findings provide insights into how intrinsic disorder and LLPS contribute to the structural adaptability and functional precision required for fertilization, with implications for understanding disorders associated with the human acrosome reaction.
Keywords:
1. Introduction
1.1. Structure, Formation, and Function of the Acrosome
1.2. Intrinsic Disorder in Human Proteins
1.3. Spontaneous Liquid-Liquid Phase Separation
2. Materials and Methods
2.1. Compilation of Human Acrosomal Proteins and Visualization
2.2. Computational Prediction of Intrinsic Disorder in Human Acrosomal Proteins
2.3. Impact of Intrinsic Disorder on Function in Human Acrosomal Proteins
2.4. Gene Ontology Enrichment Analysis of Acrosomal Proteins
2.5. Intractability Analysis of Human Acrosomal Proteins
2.6. Liquid-Liquid Phase Separation Propensity in Human Acrosomal Proteins
2.7. Data Analysis via R
3. Results
3.1. Compilation of Human Acrosomal Proteins and Visualization
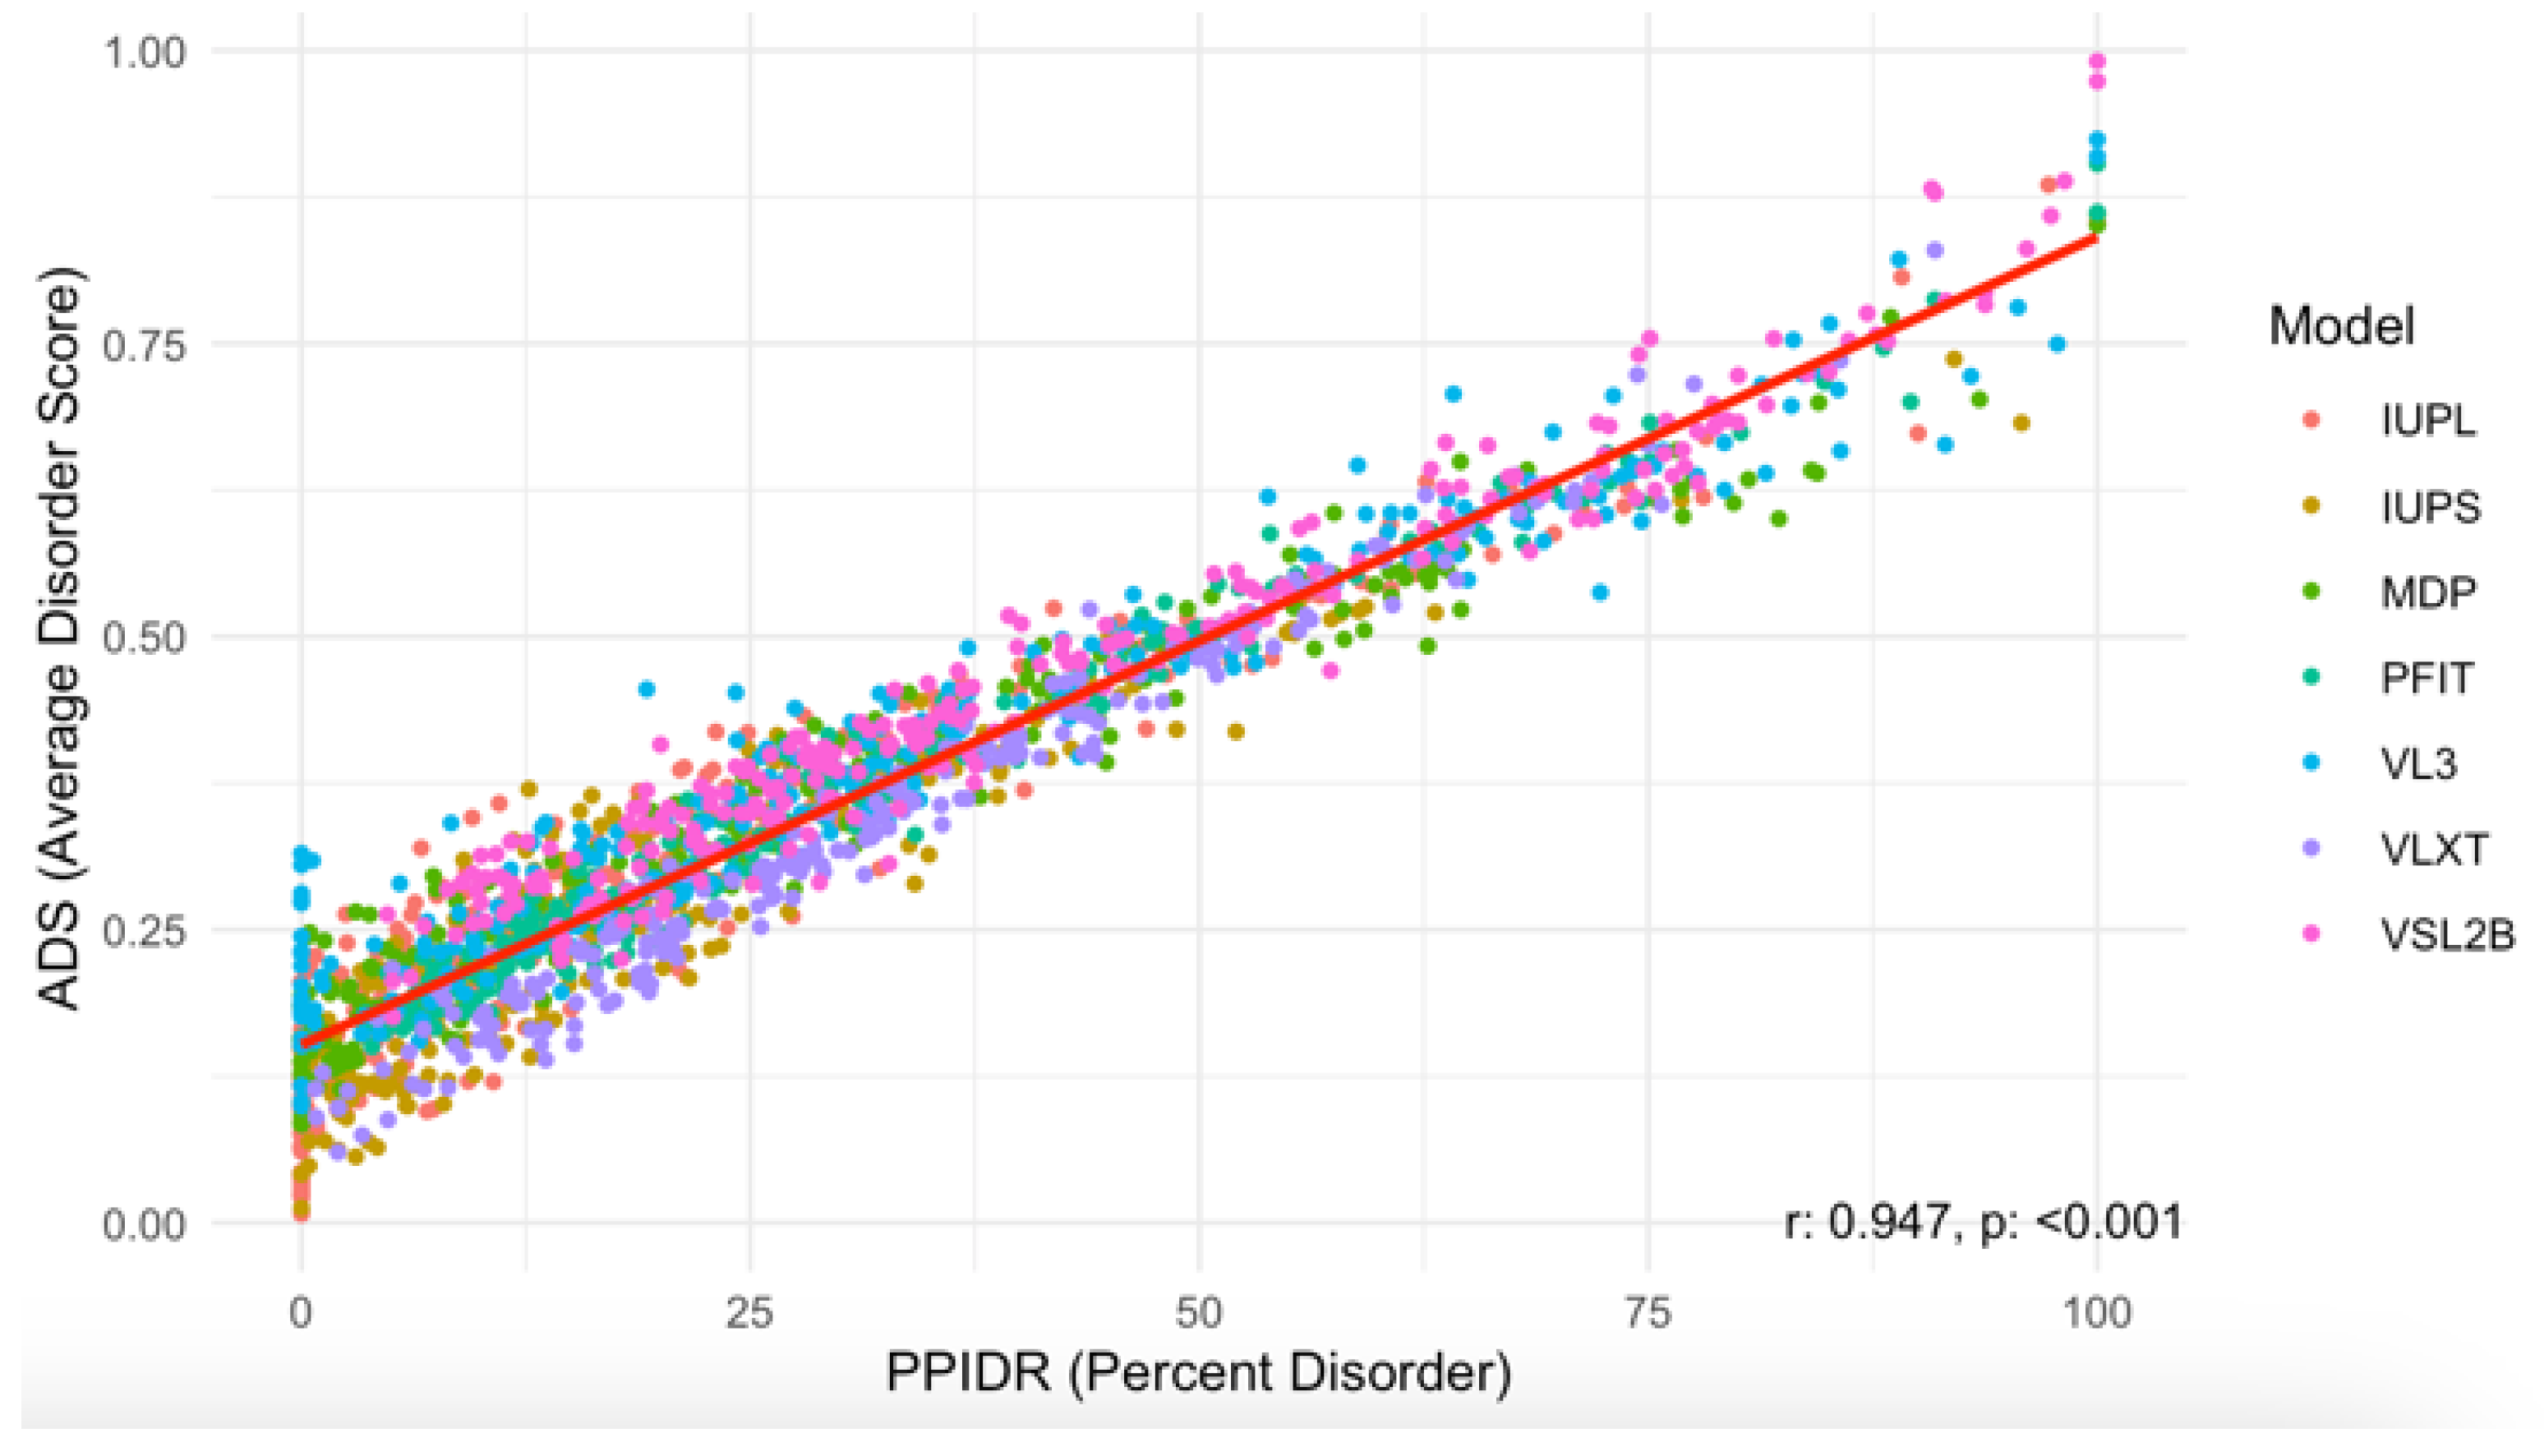
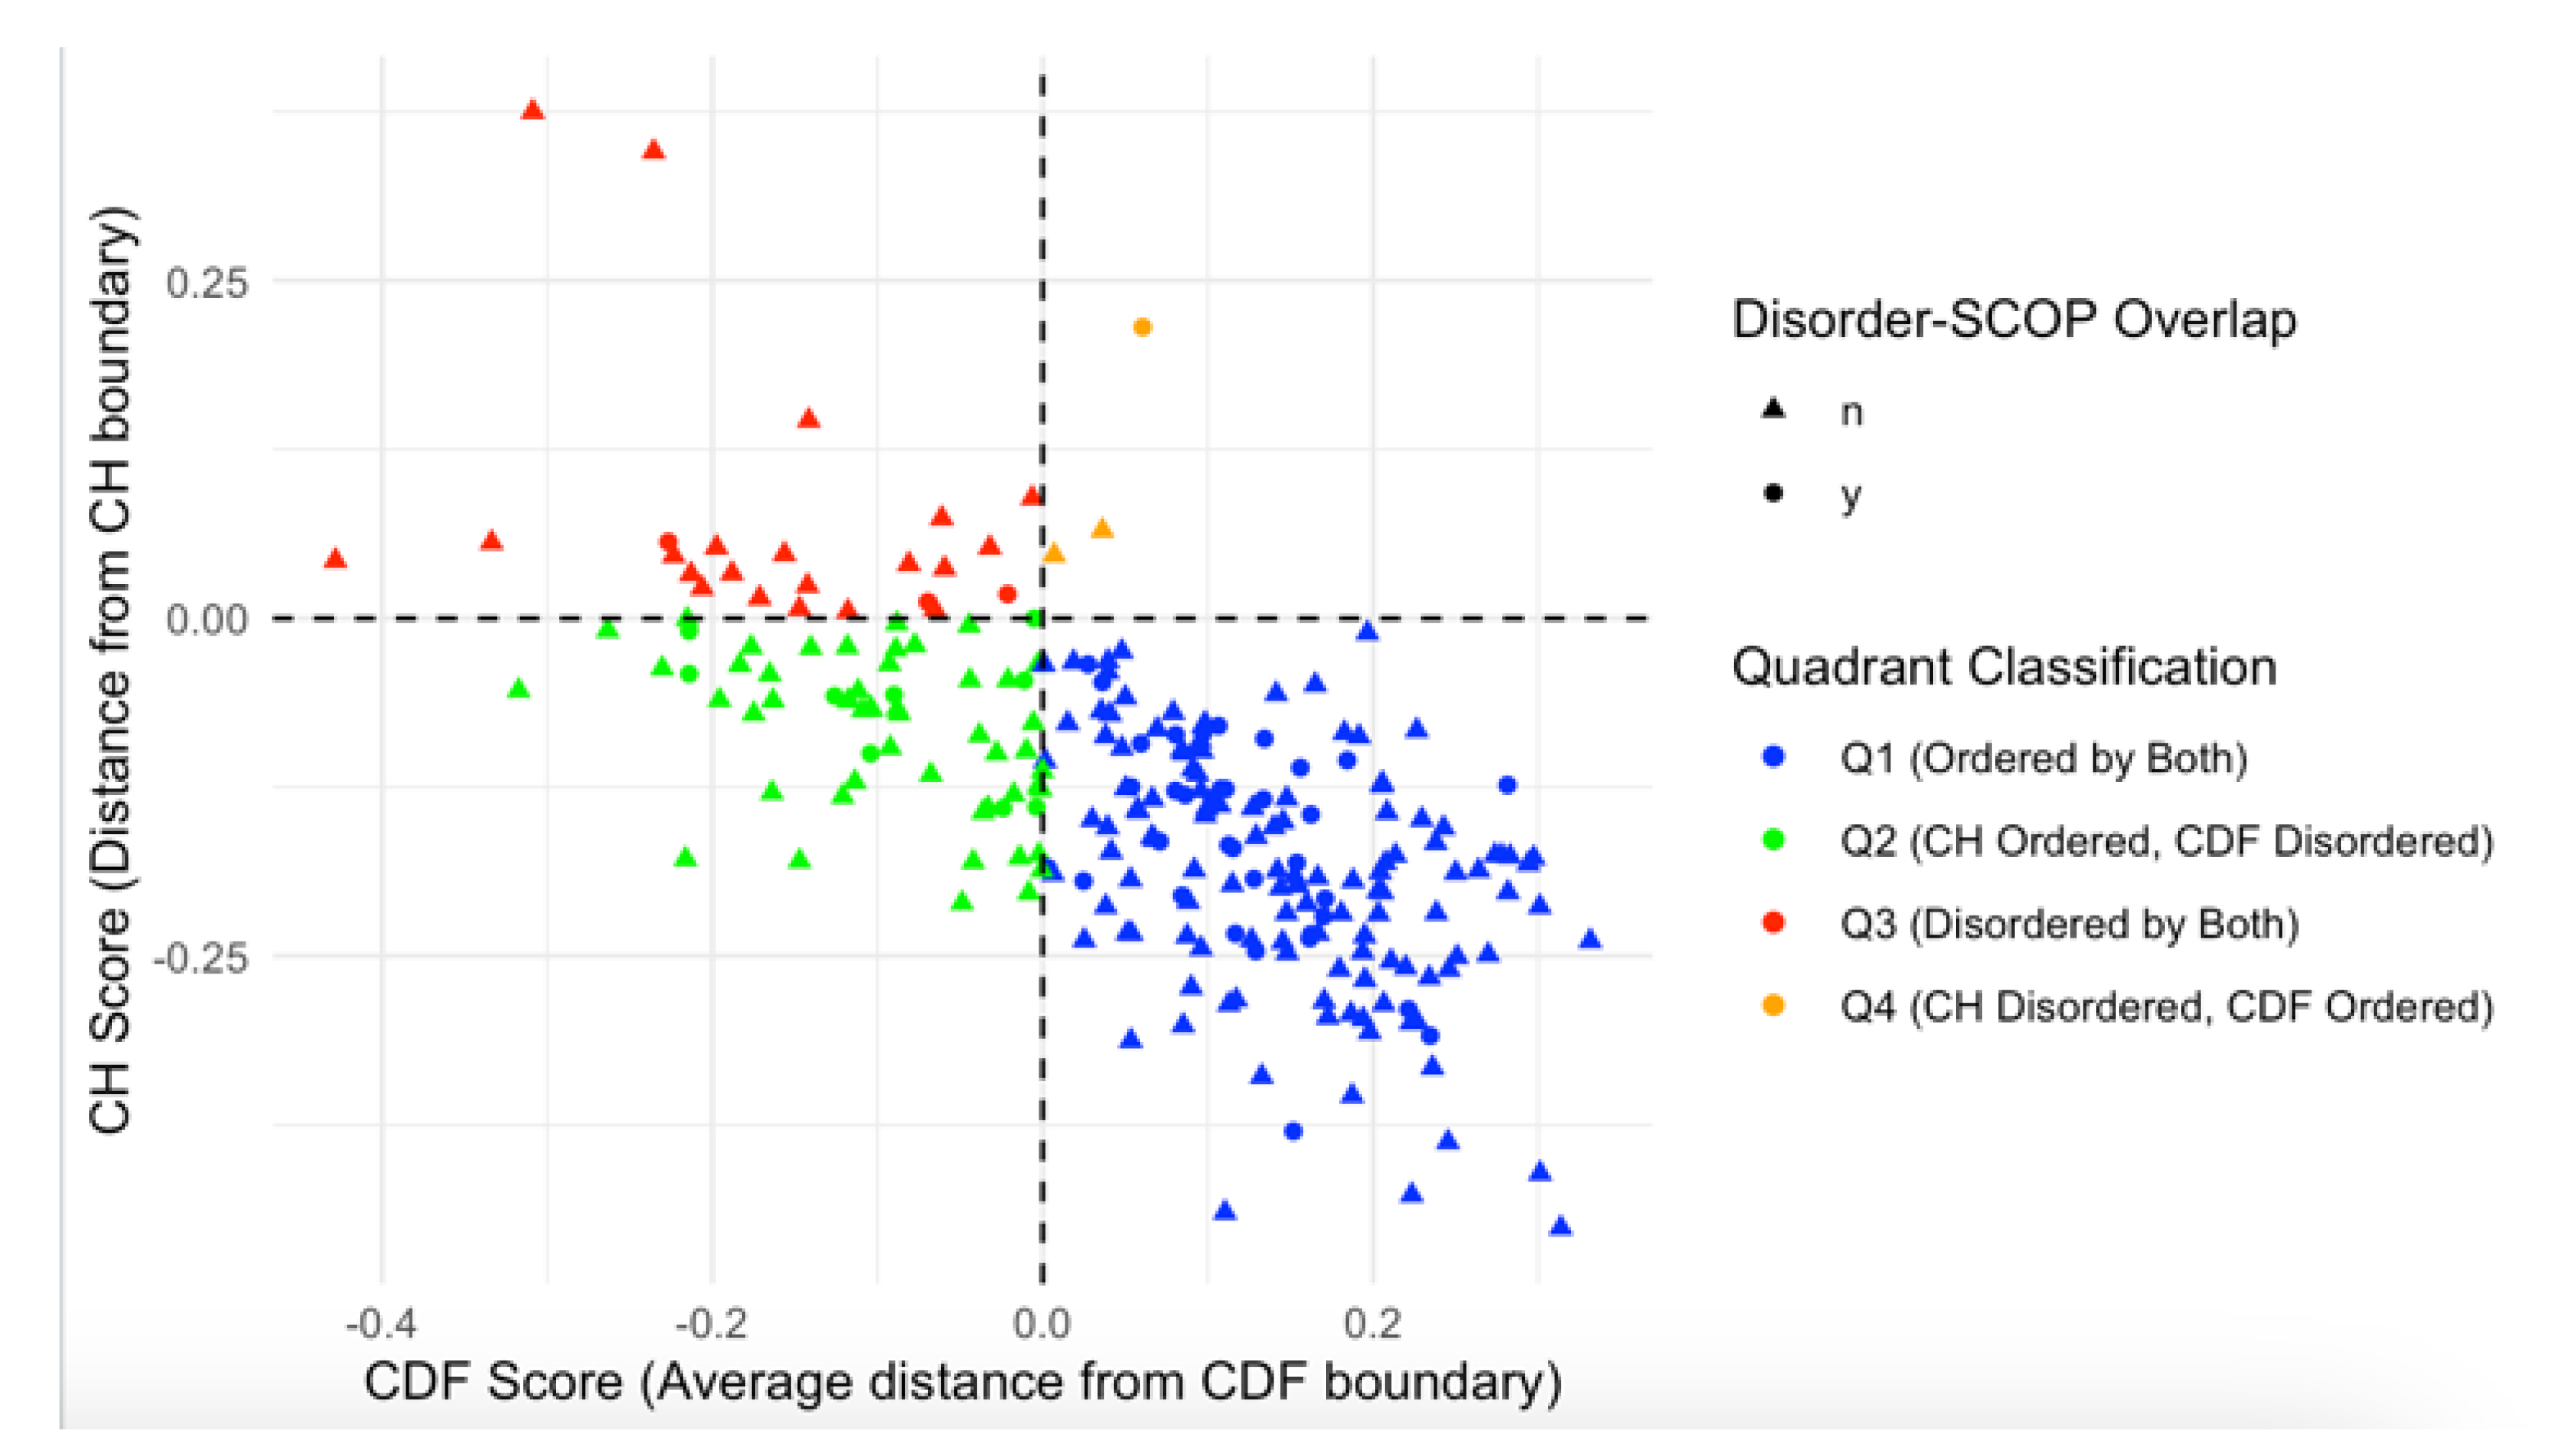
3.2. Computational Prediction of Intrinsic Disorder in Human Acrosomal Proteins
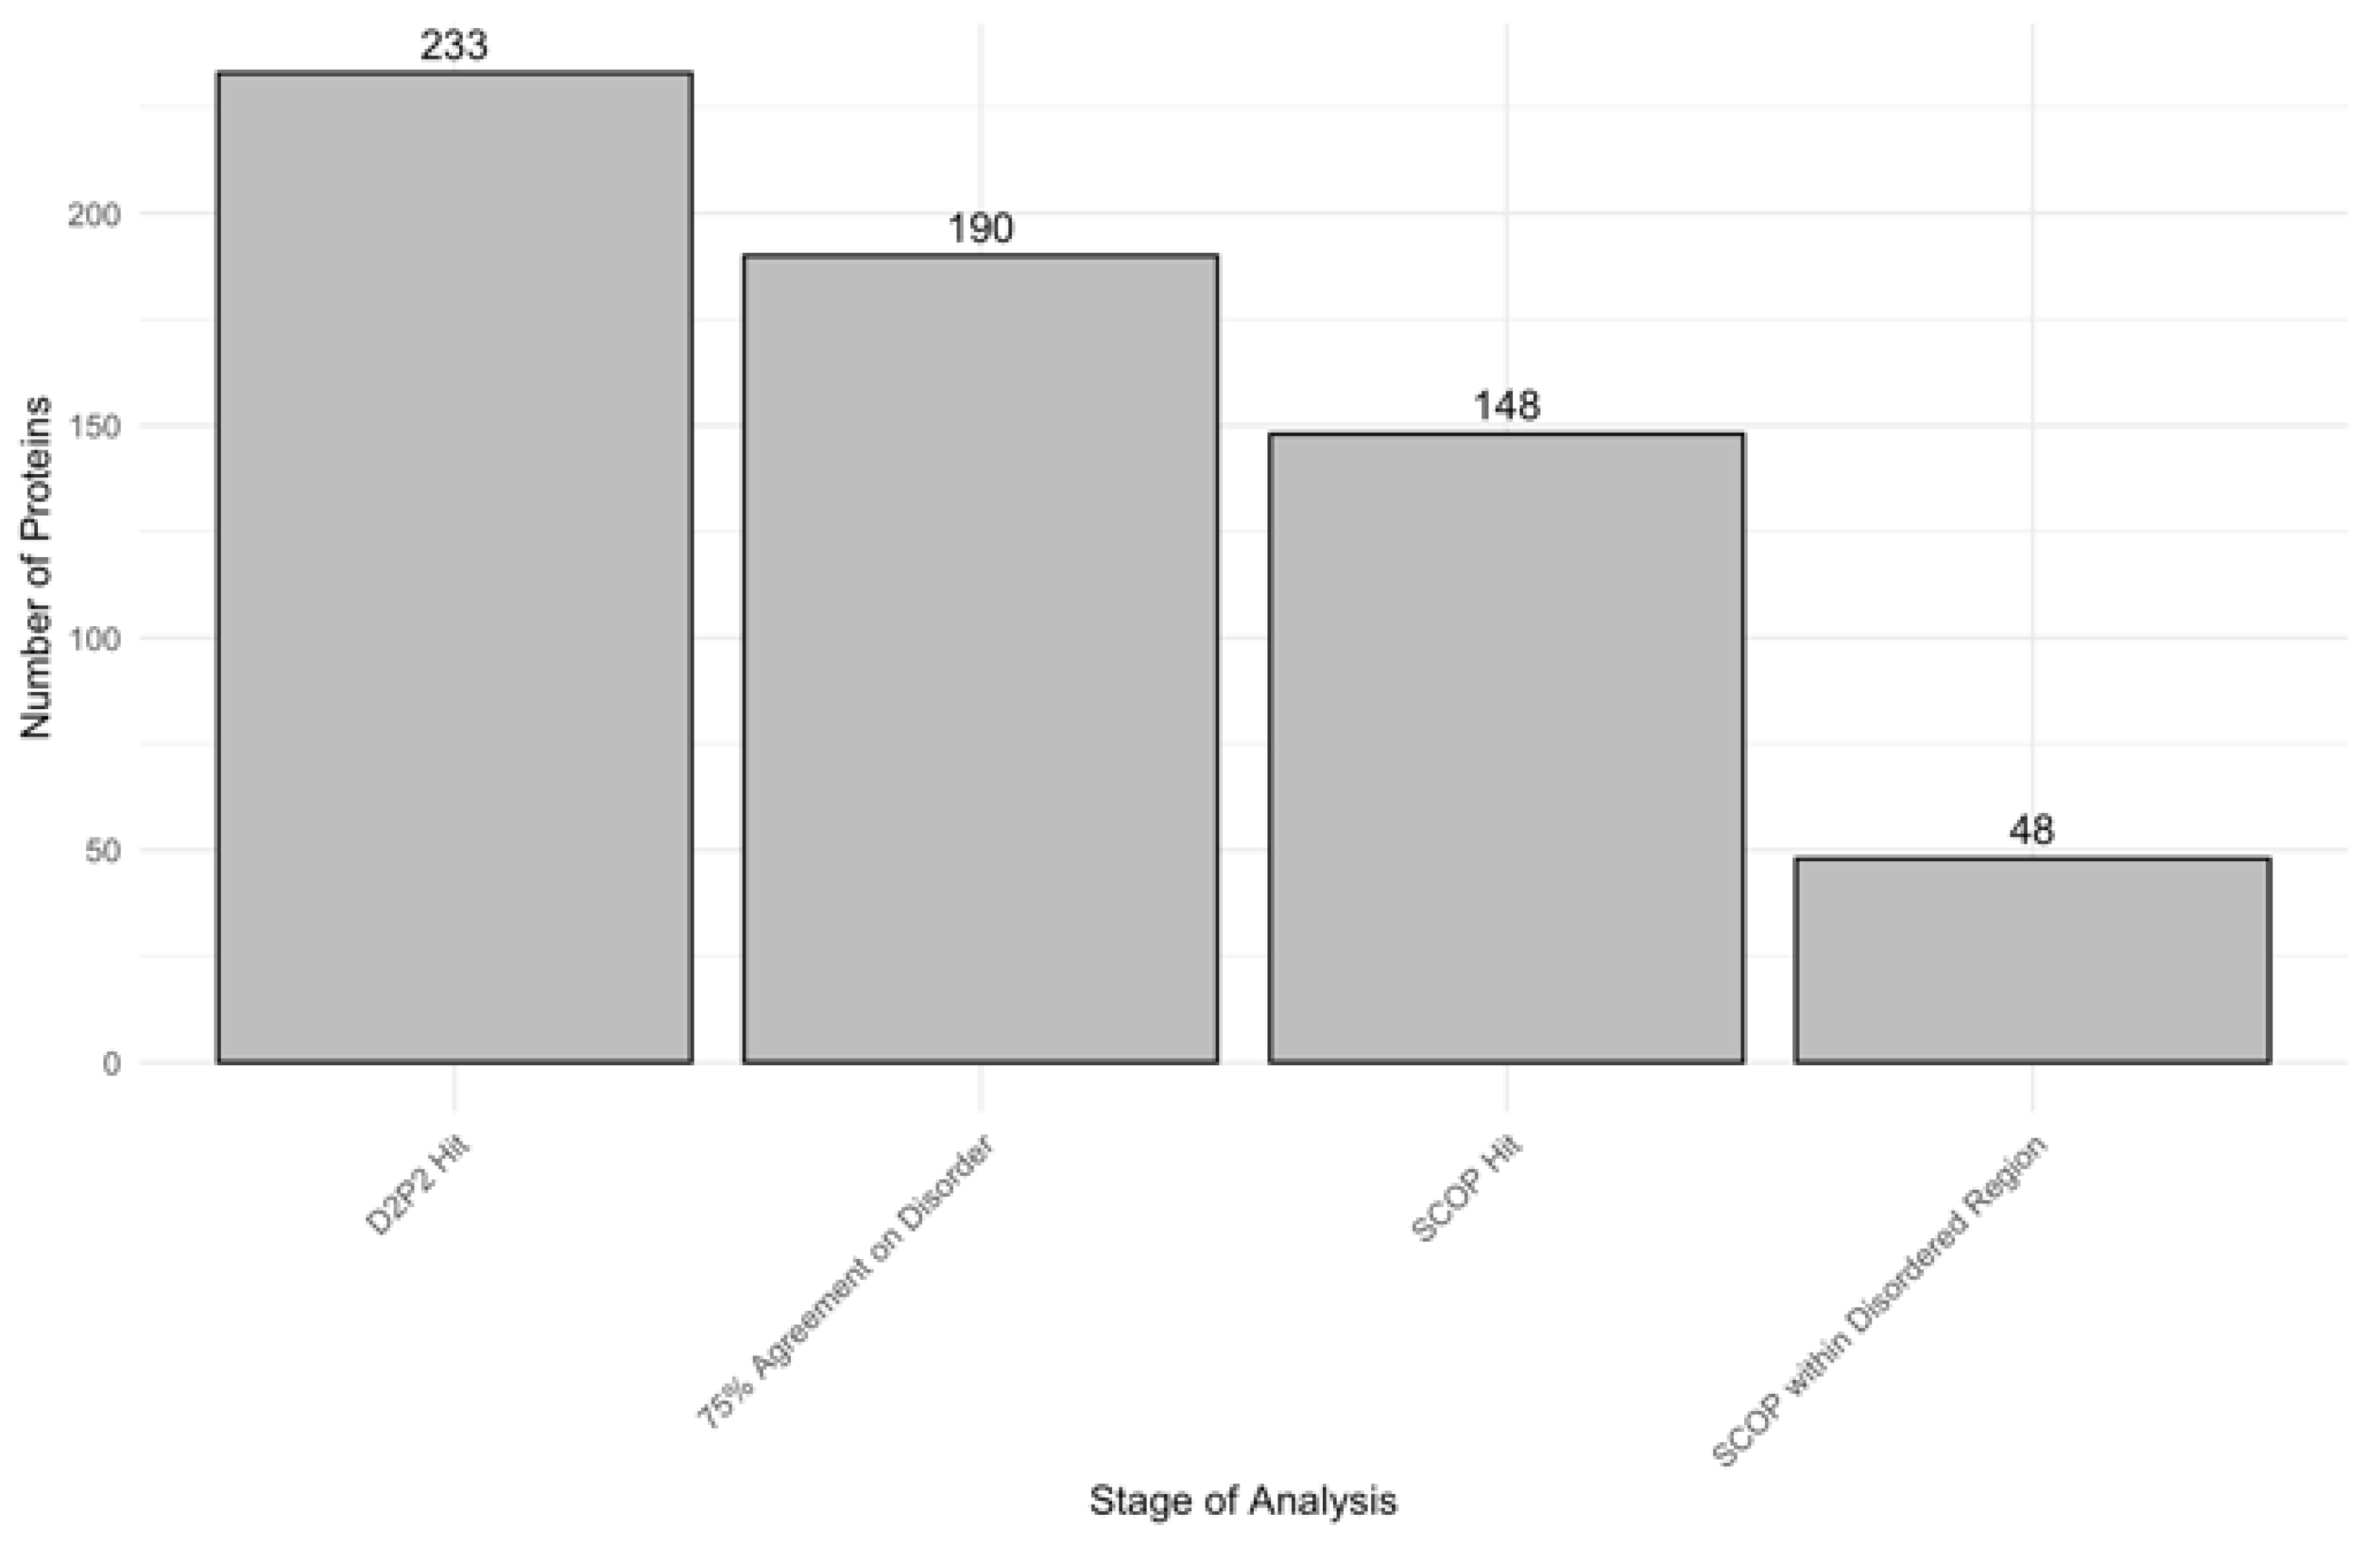
3.3. Impact of Disorder on Function in Human Acrosomal Proteins
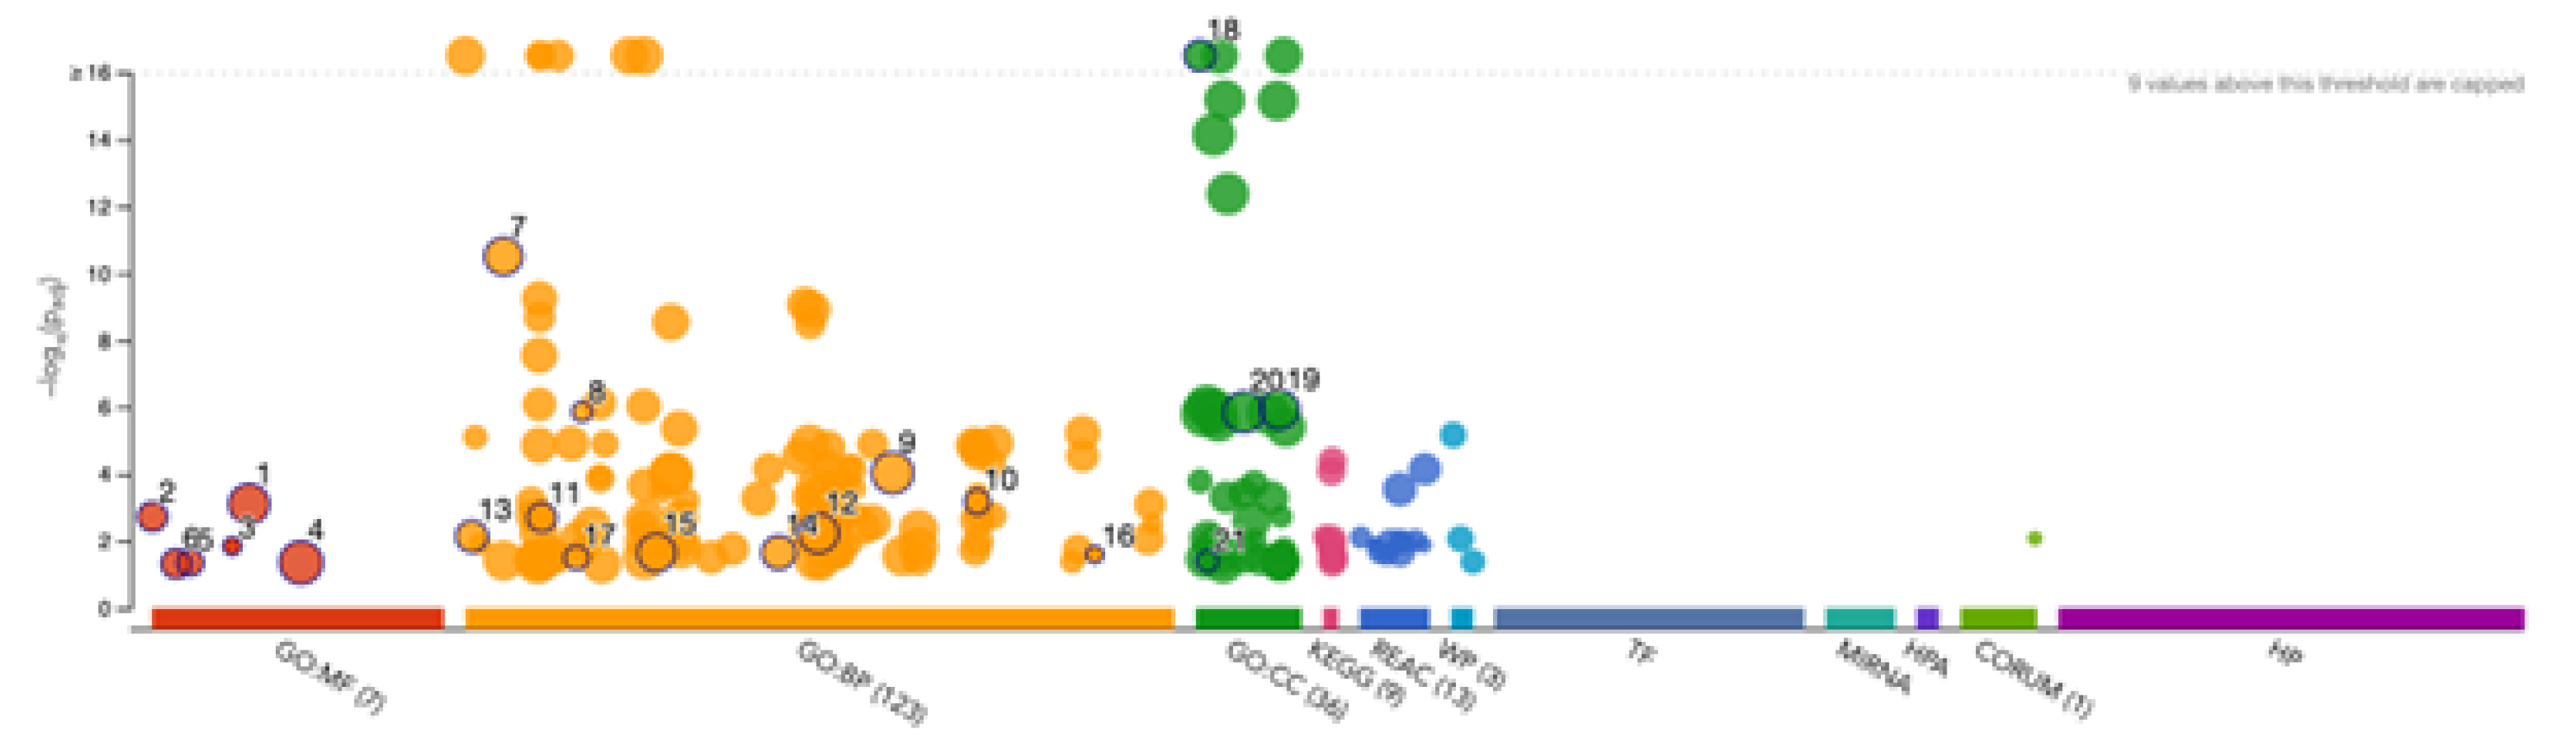
3.4. Gene Ontology Enrichment Analysis of Acrosomal Proteins
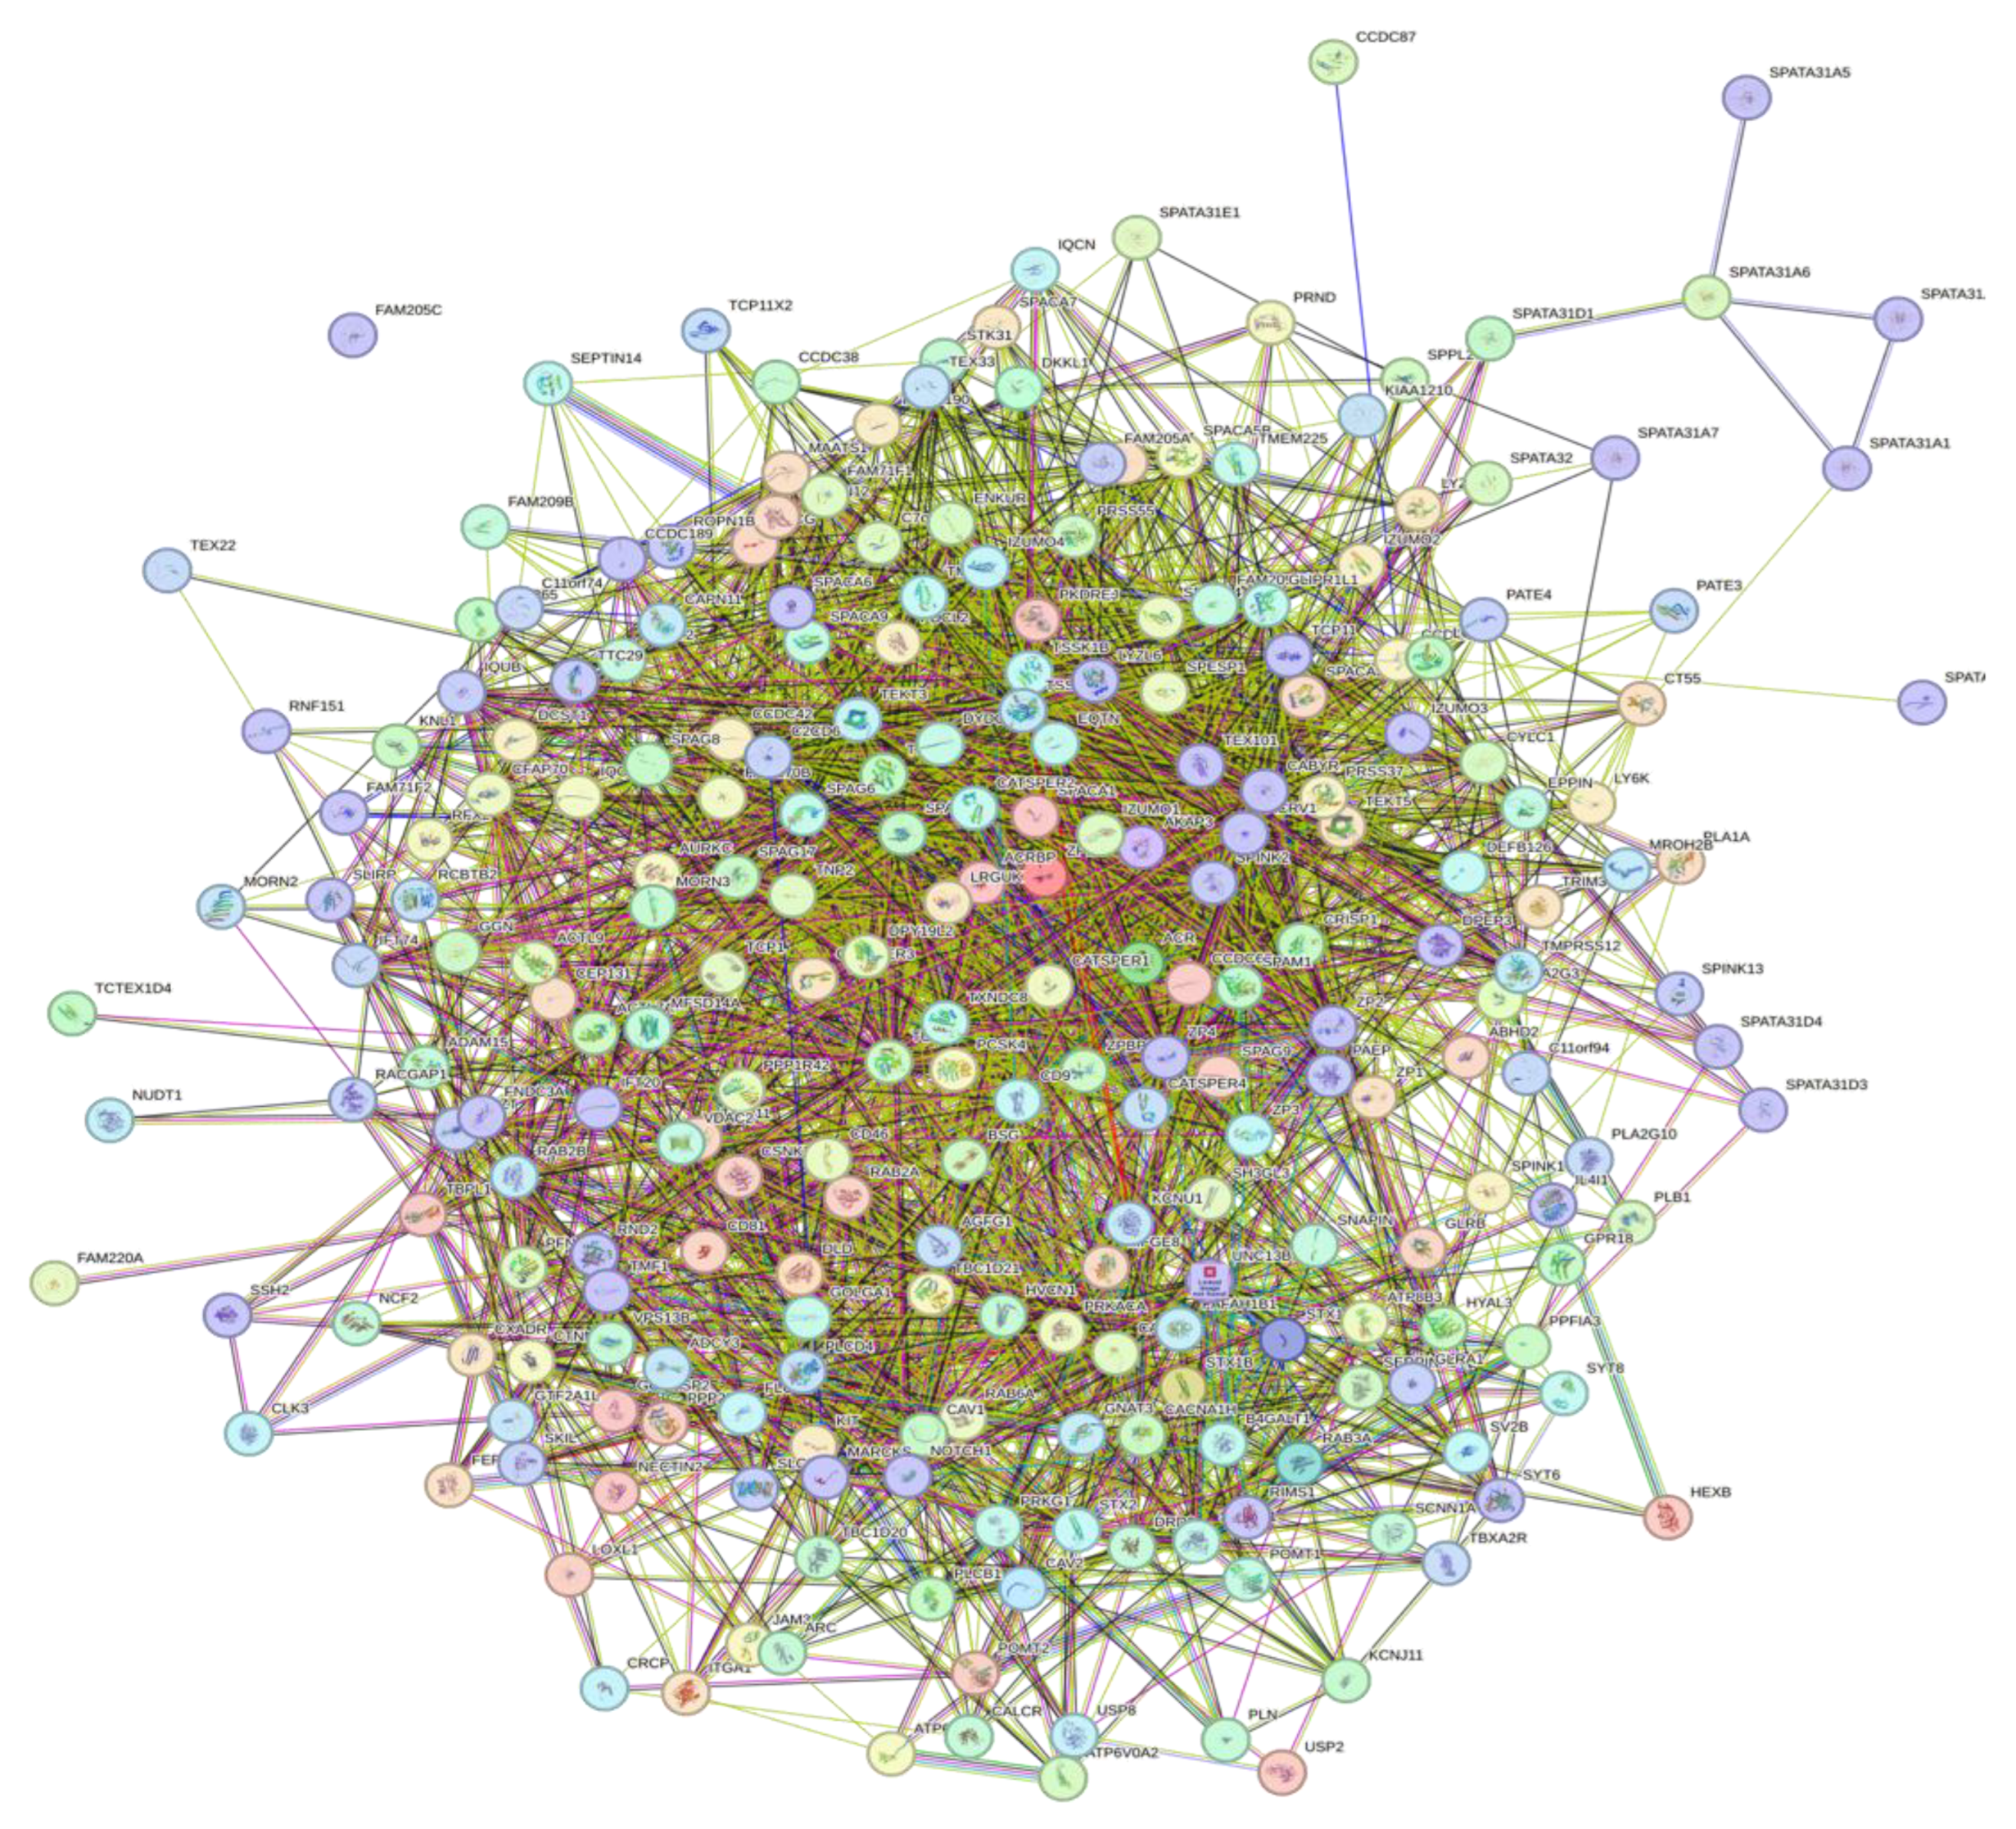
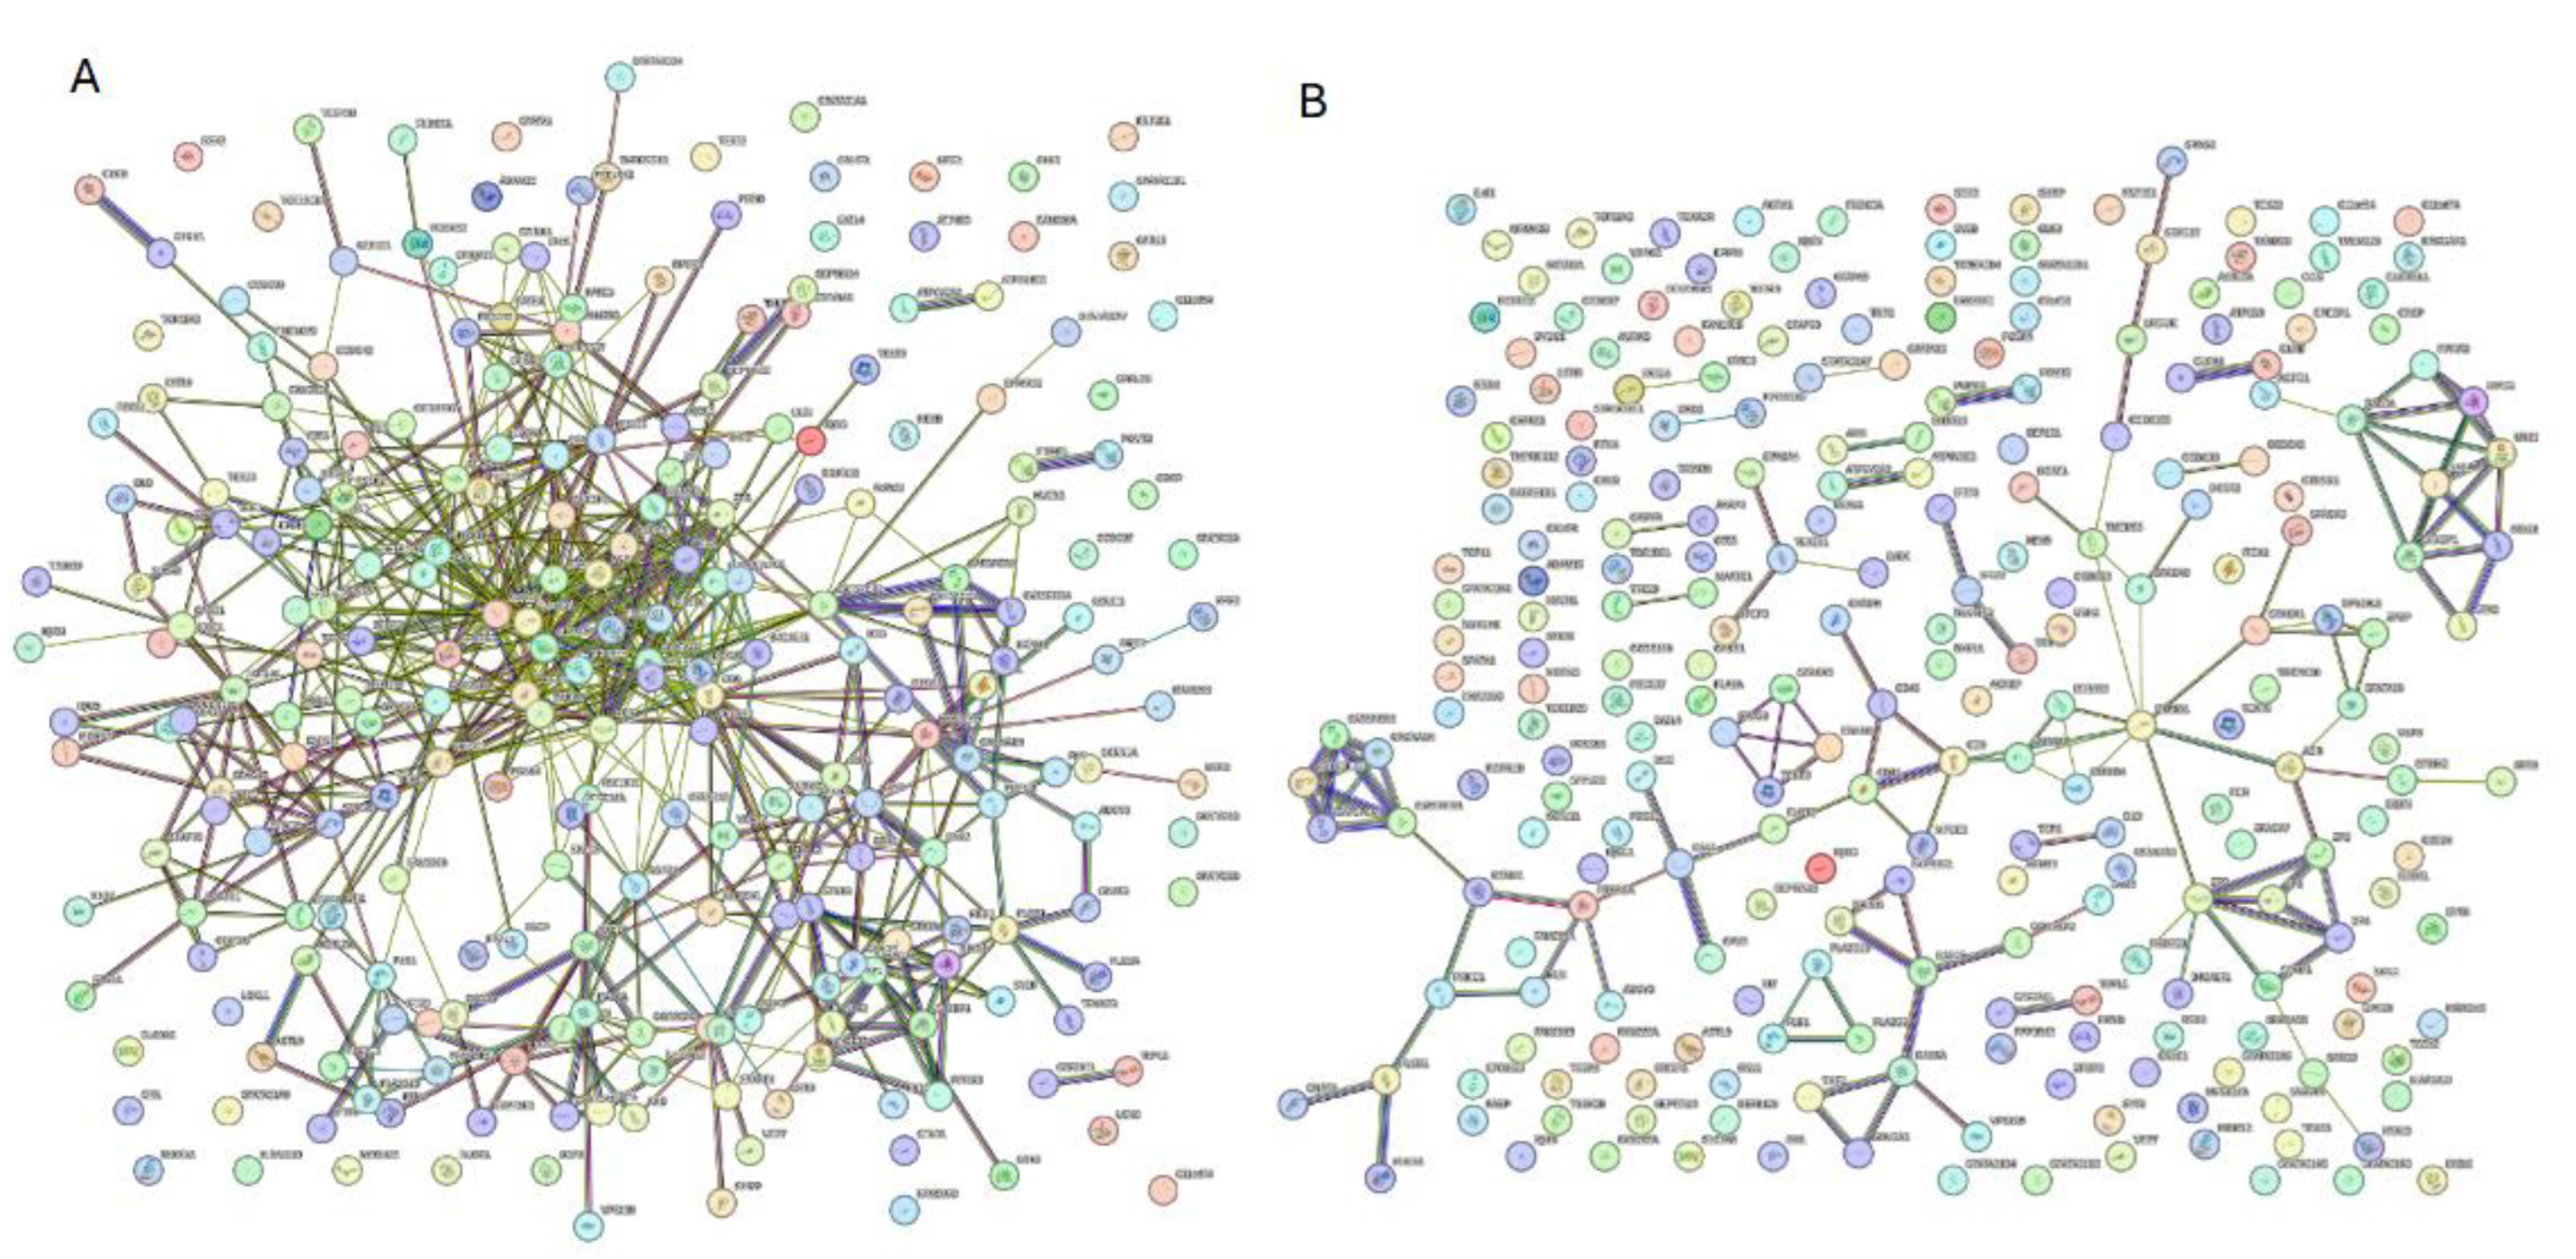
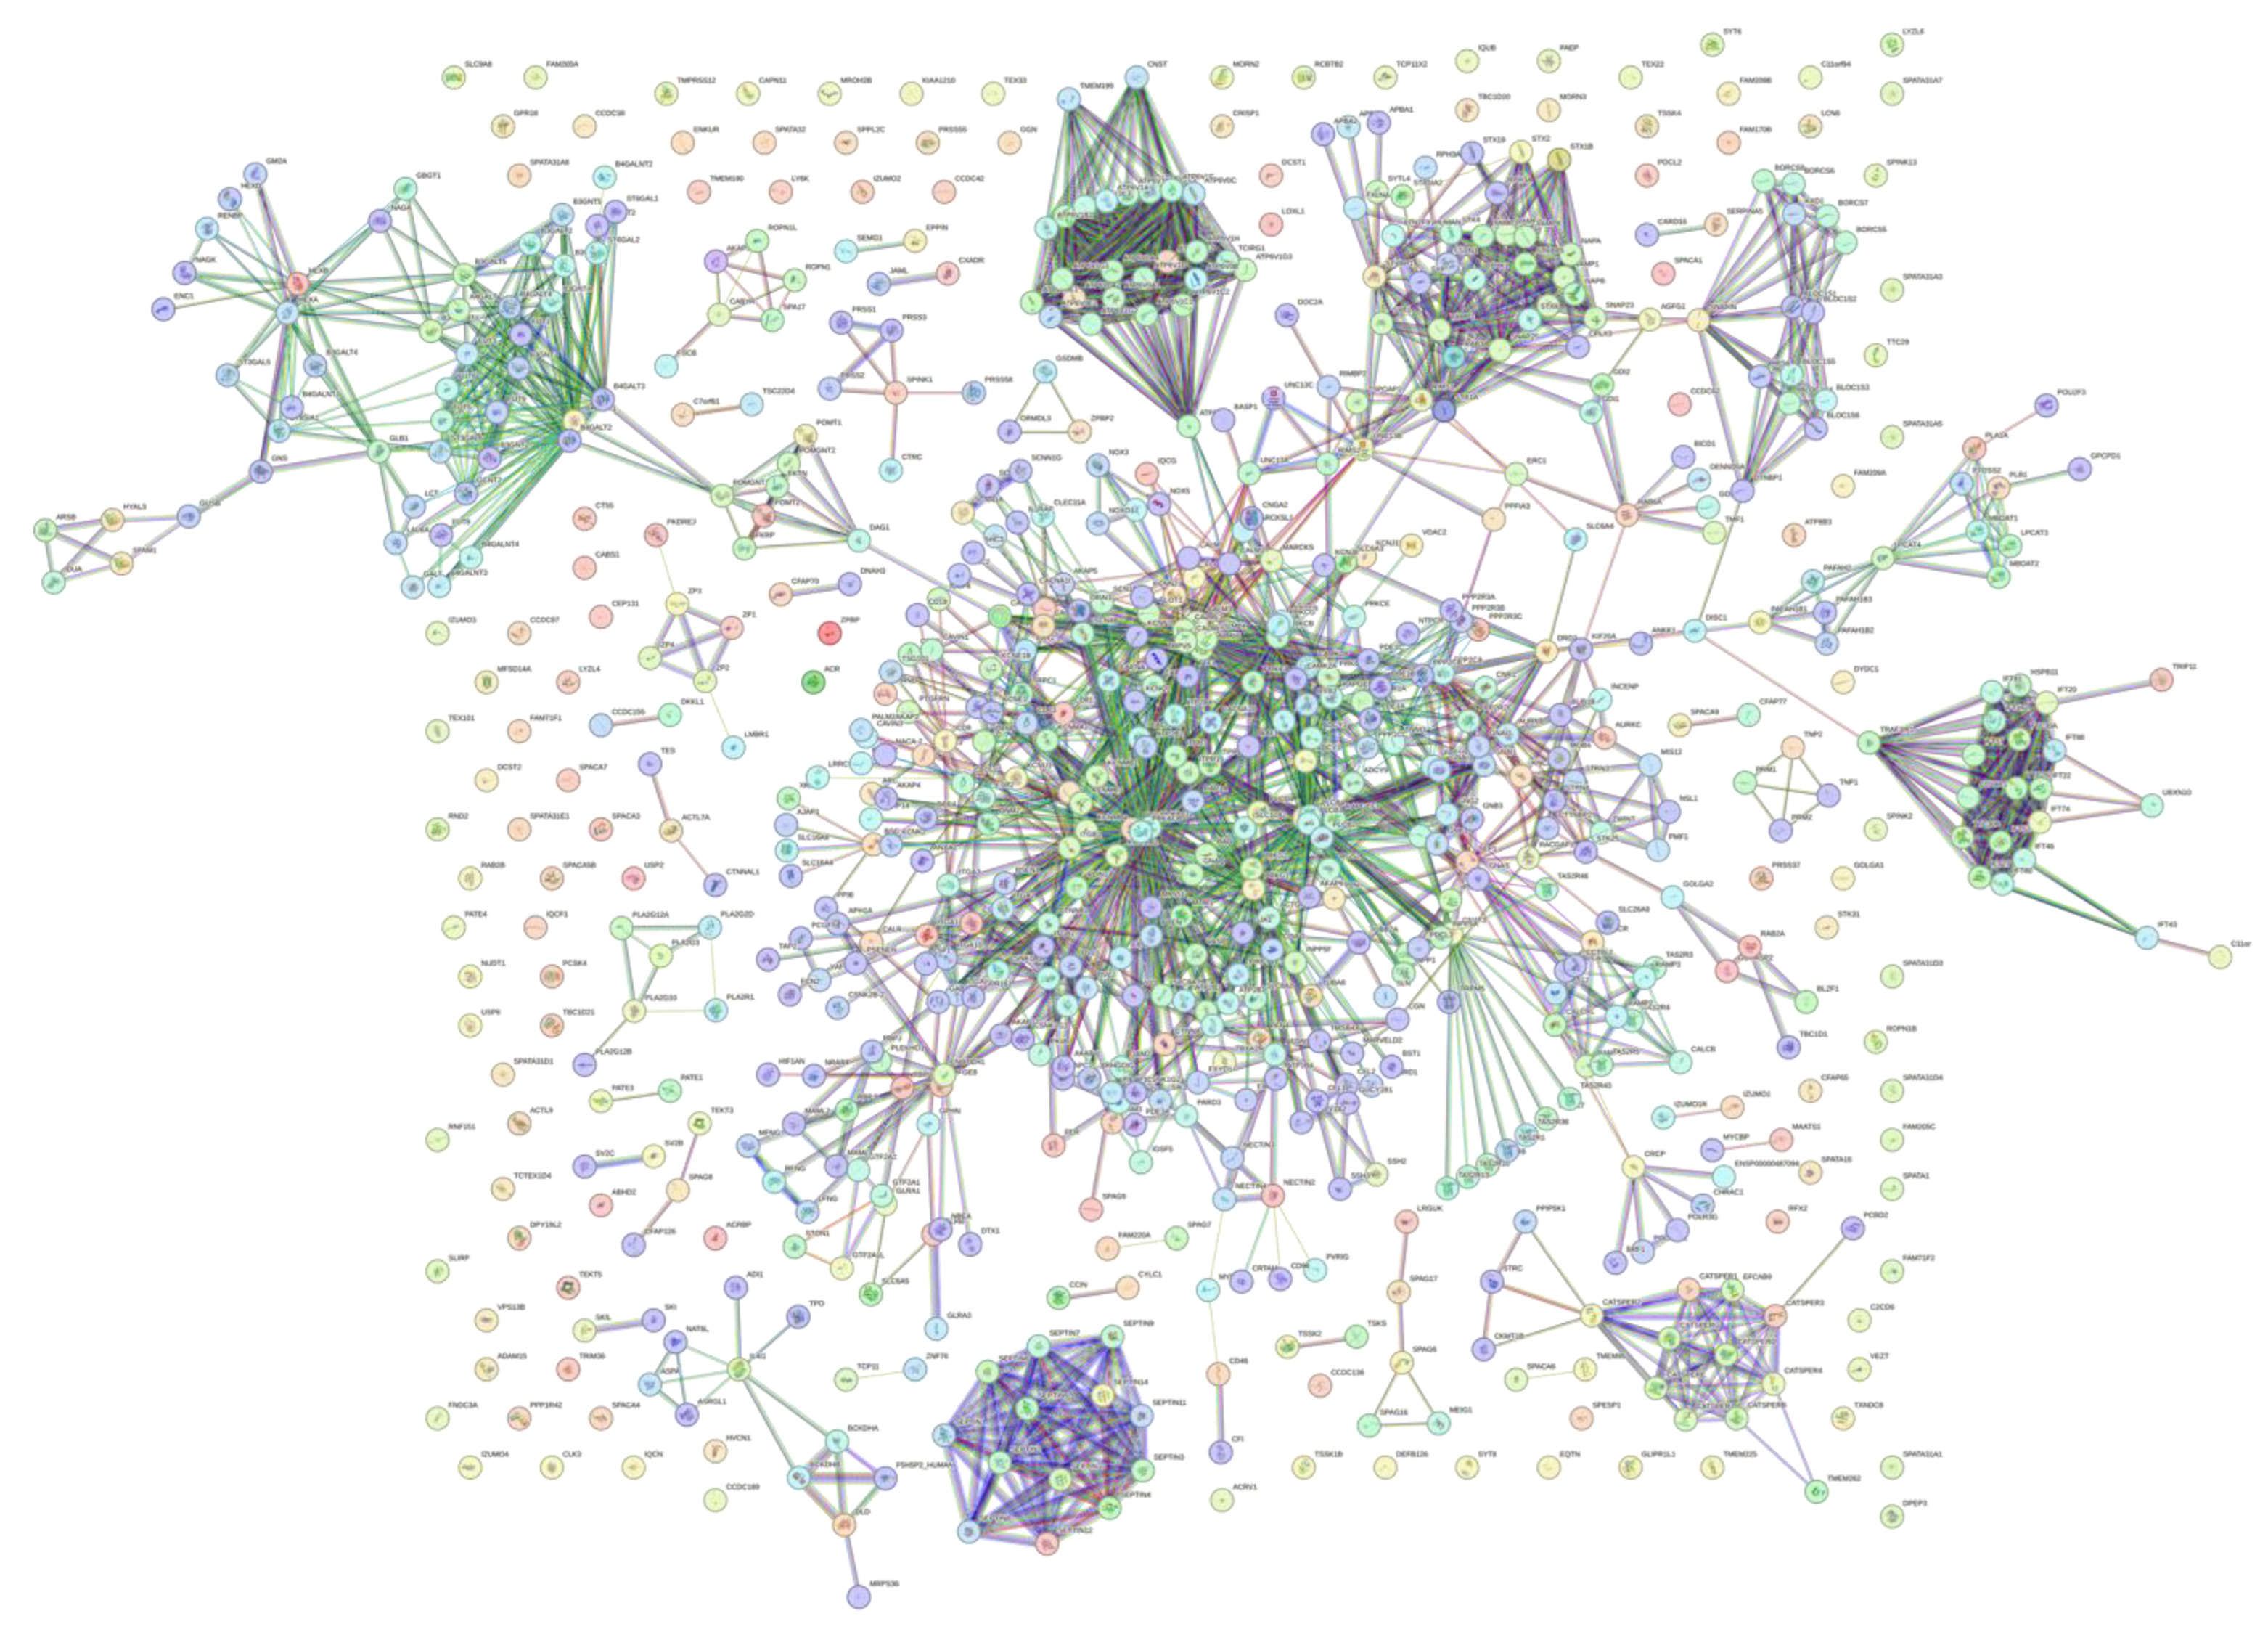
3.5. Interactivity Analysis of Human Acrosomal Proteins
3.6. Liquid-Liquid Phase Separation Propensity in Human Acrosomal Proteins
3.7. Impact of Disorder and Liquid-Liquid Phase Separation in the Five Most Disordered Acrosomal Proteins
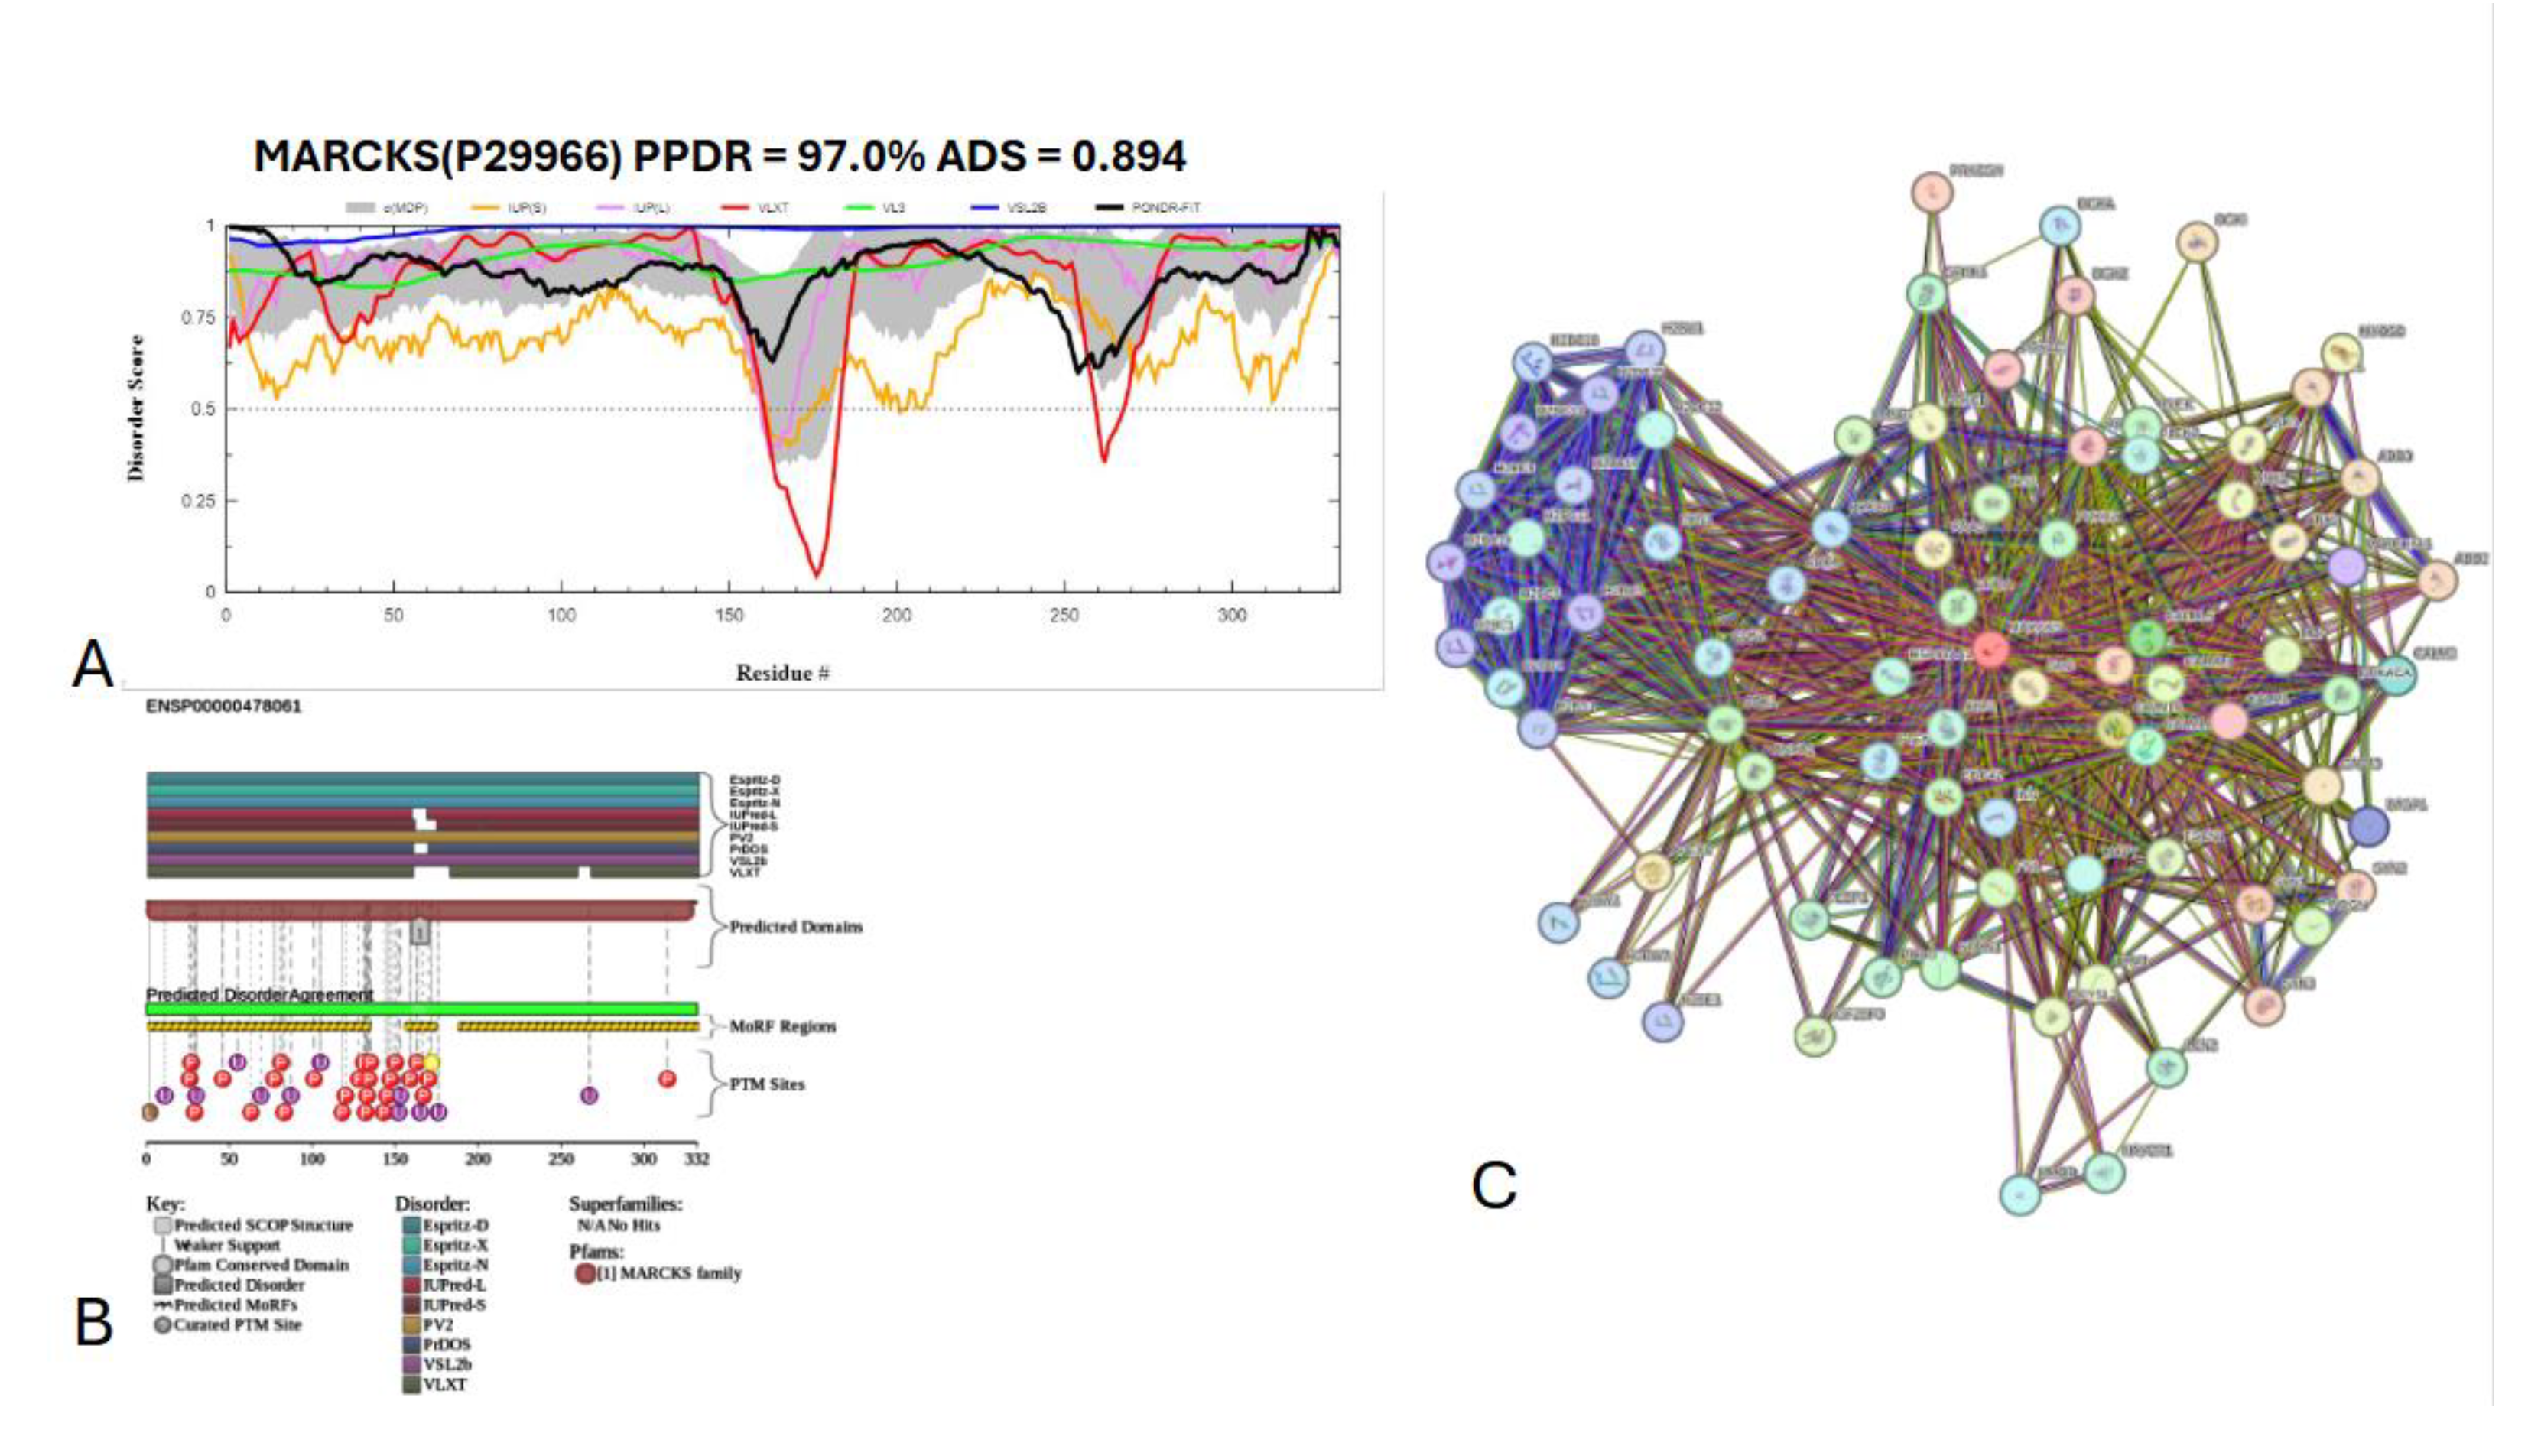
3.7.1. Myristoylated alanine-rich C-kinase substrate protein (UniProt ID: P29966)
3.7.2. Nuclear transition protein 2 (UniProt ID: Q05952)
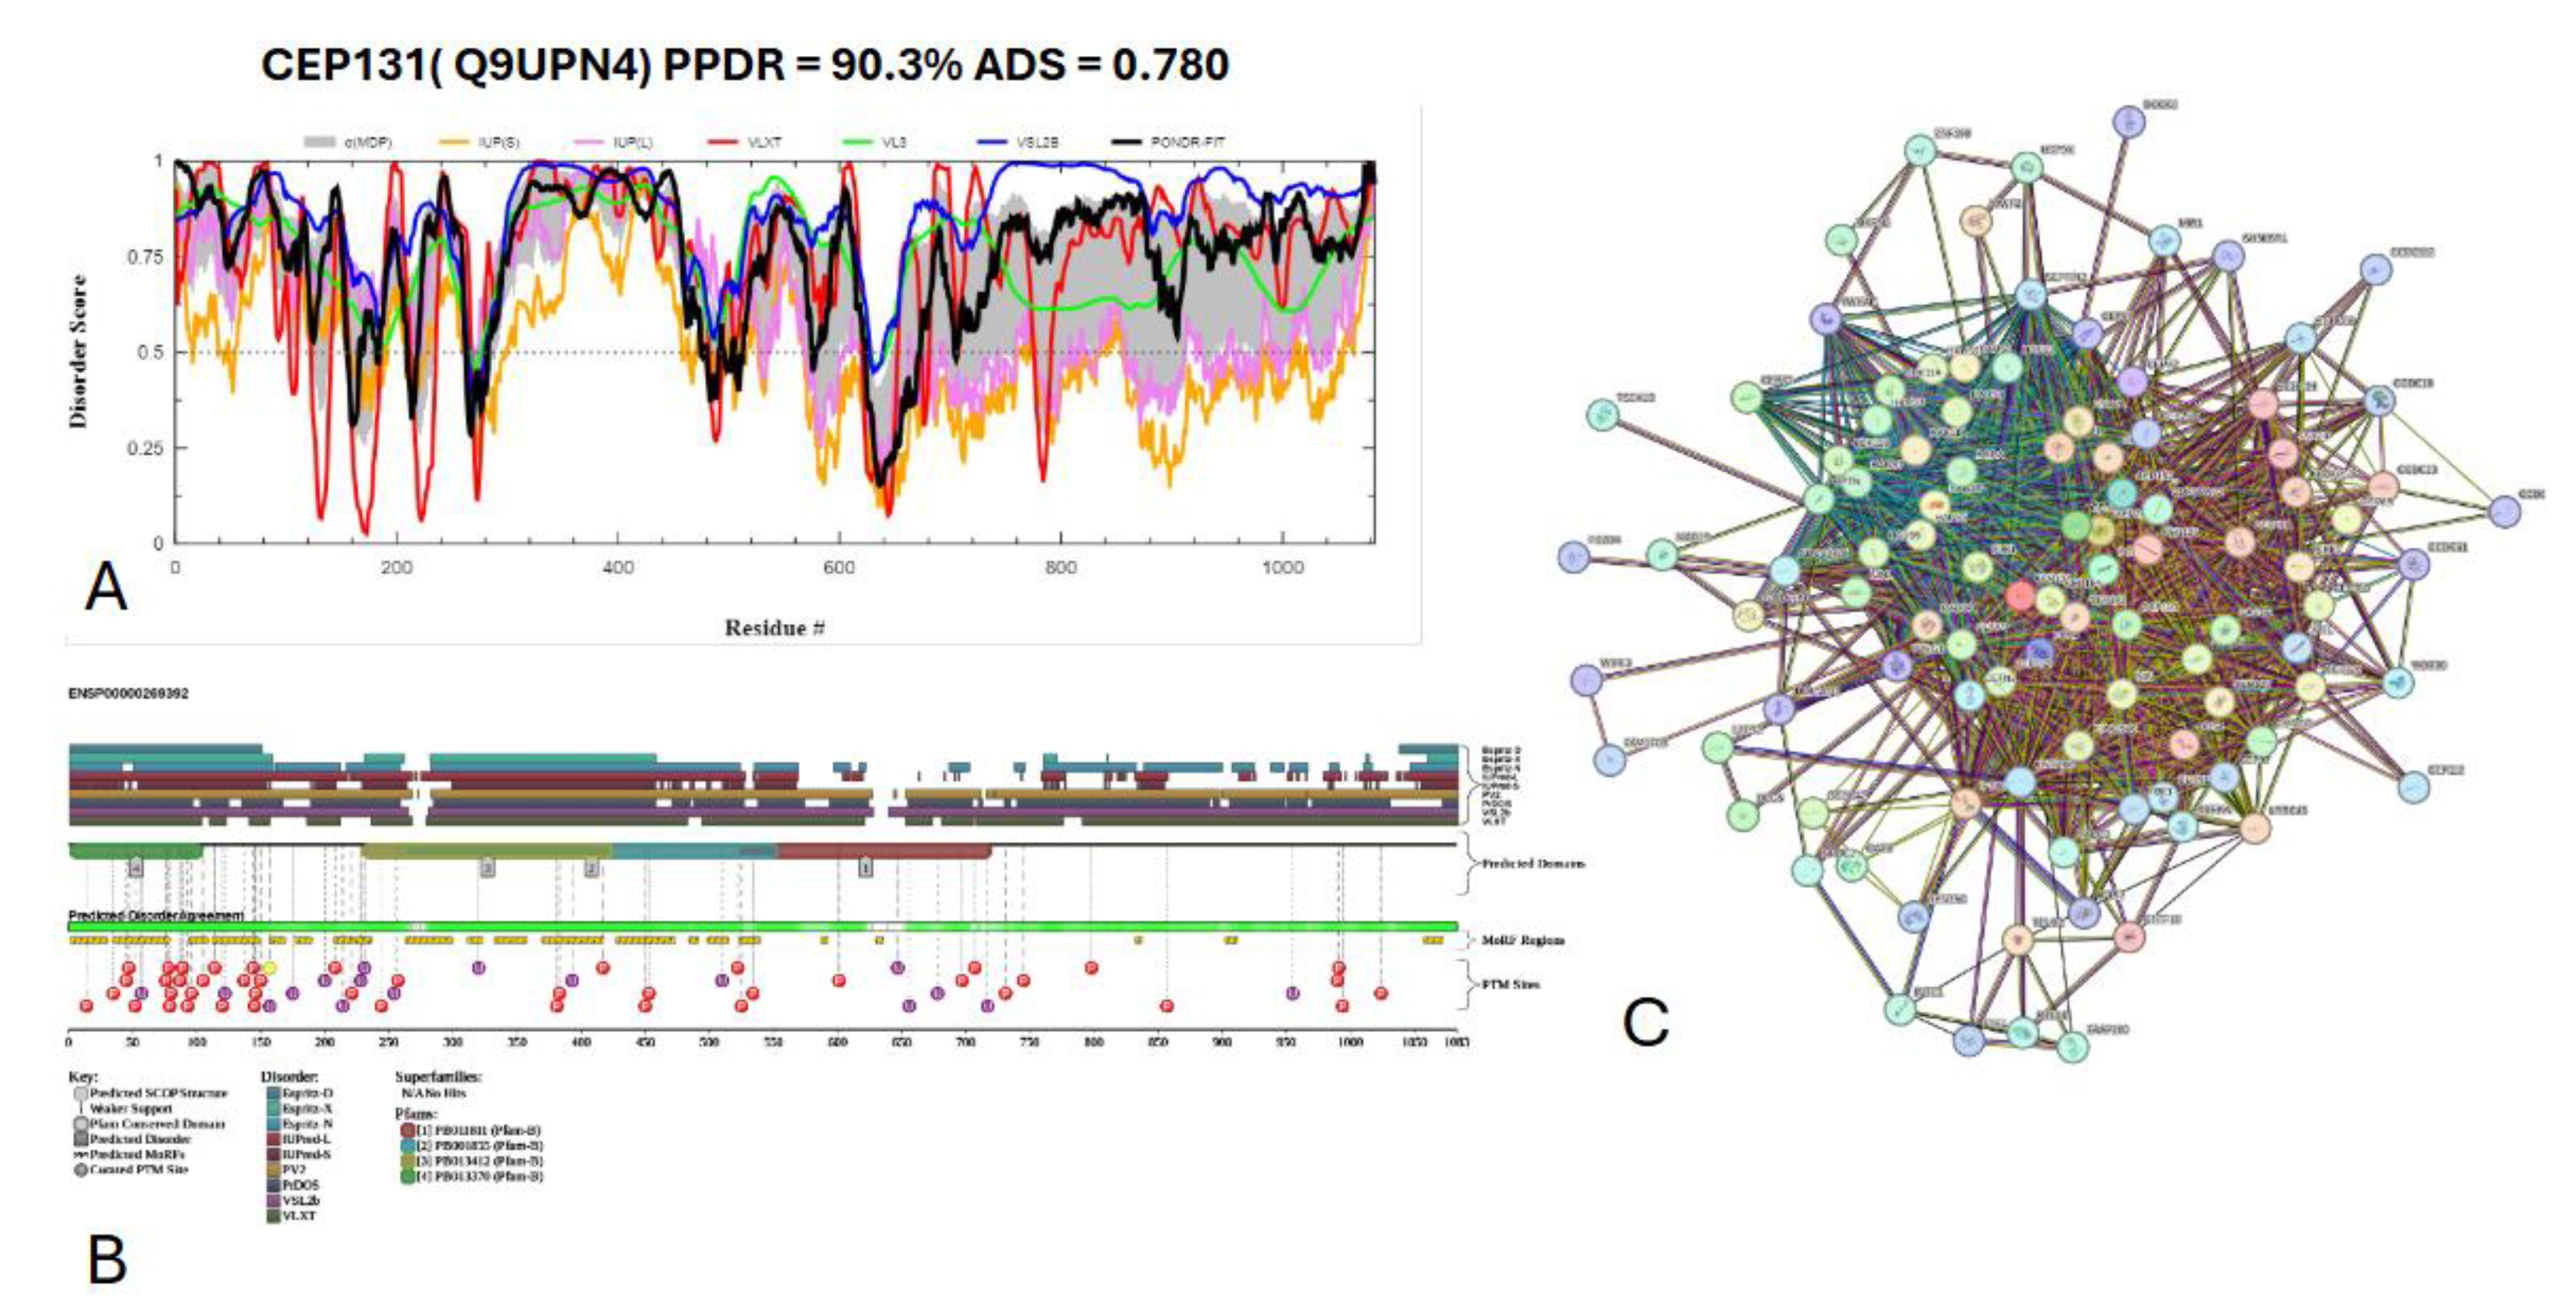
3.7.3. Centrosomal protein of 131 kDa (UniProt ID: Q9UPN4)
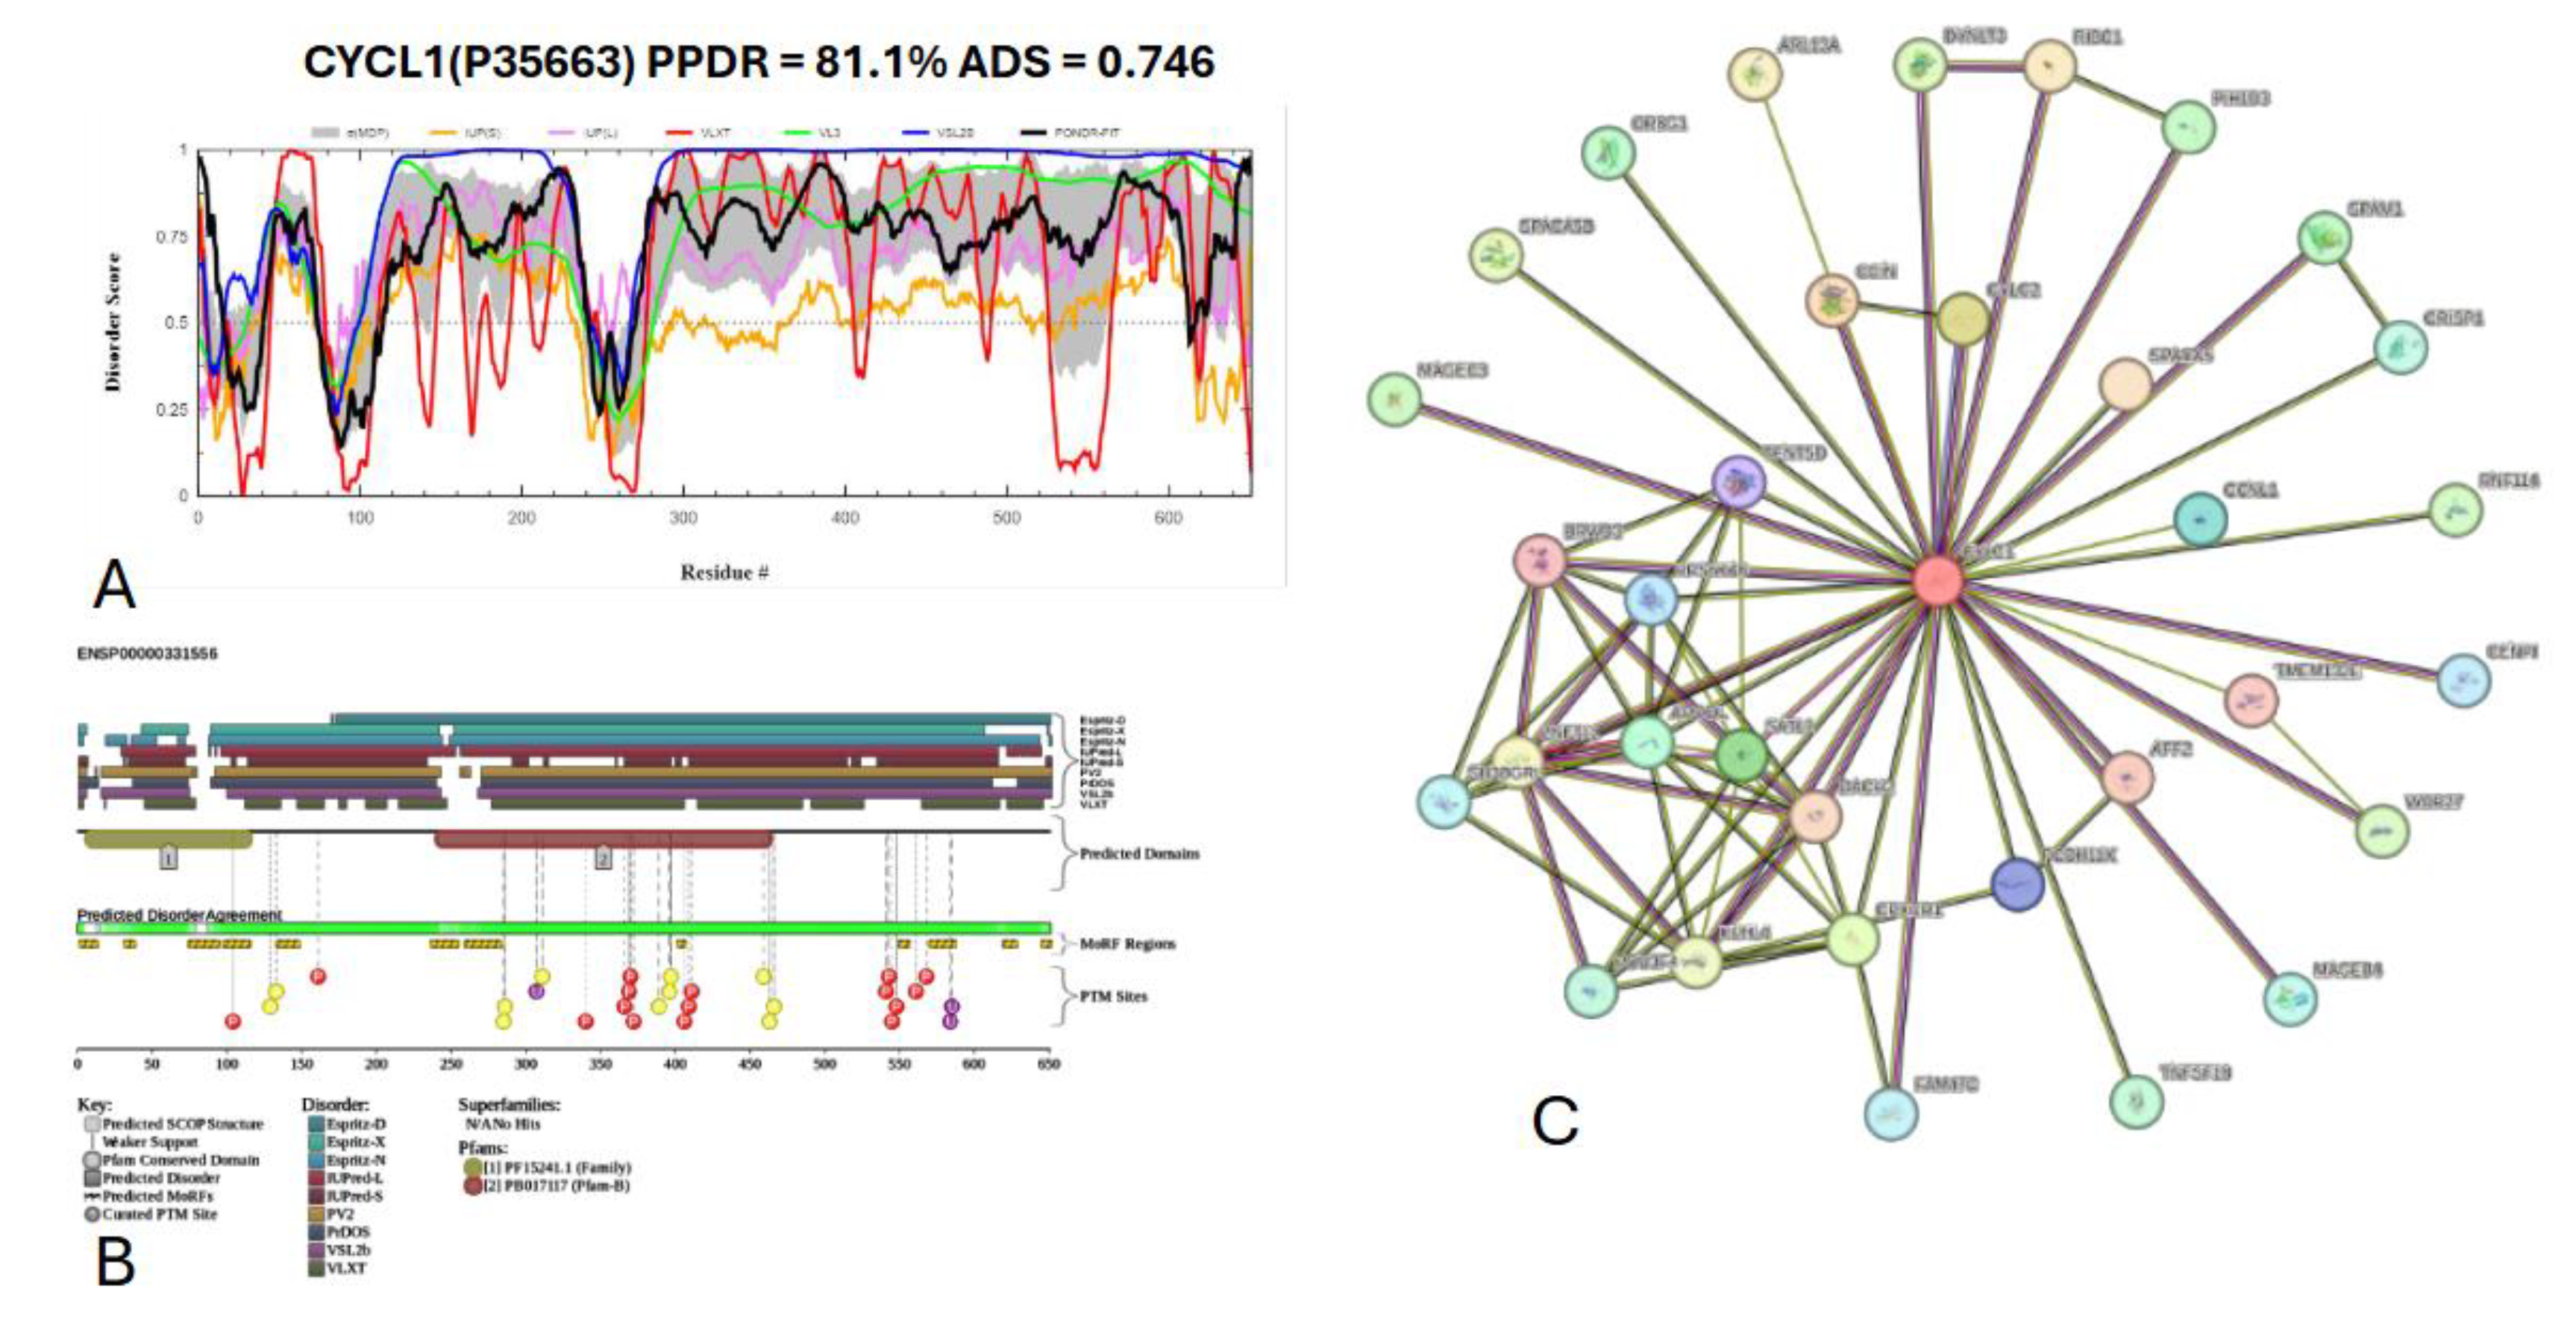
3.7.4. Cylicin-1 (Uniprot ID: P35663)
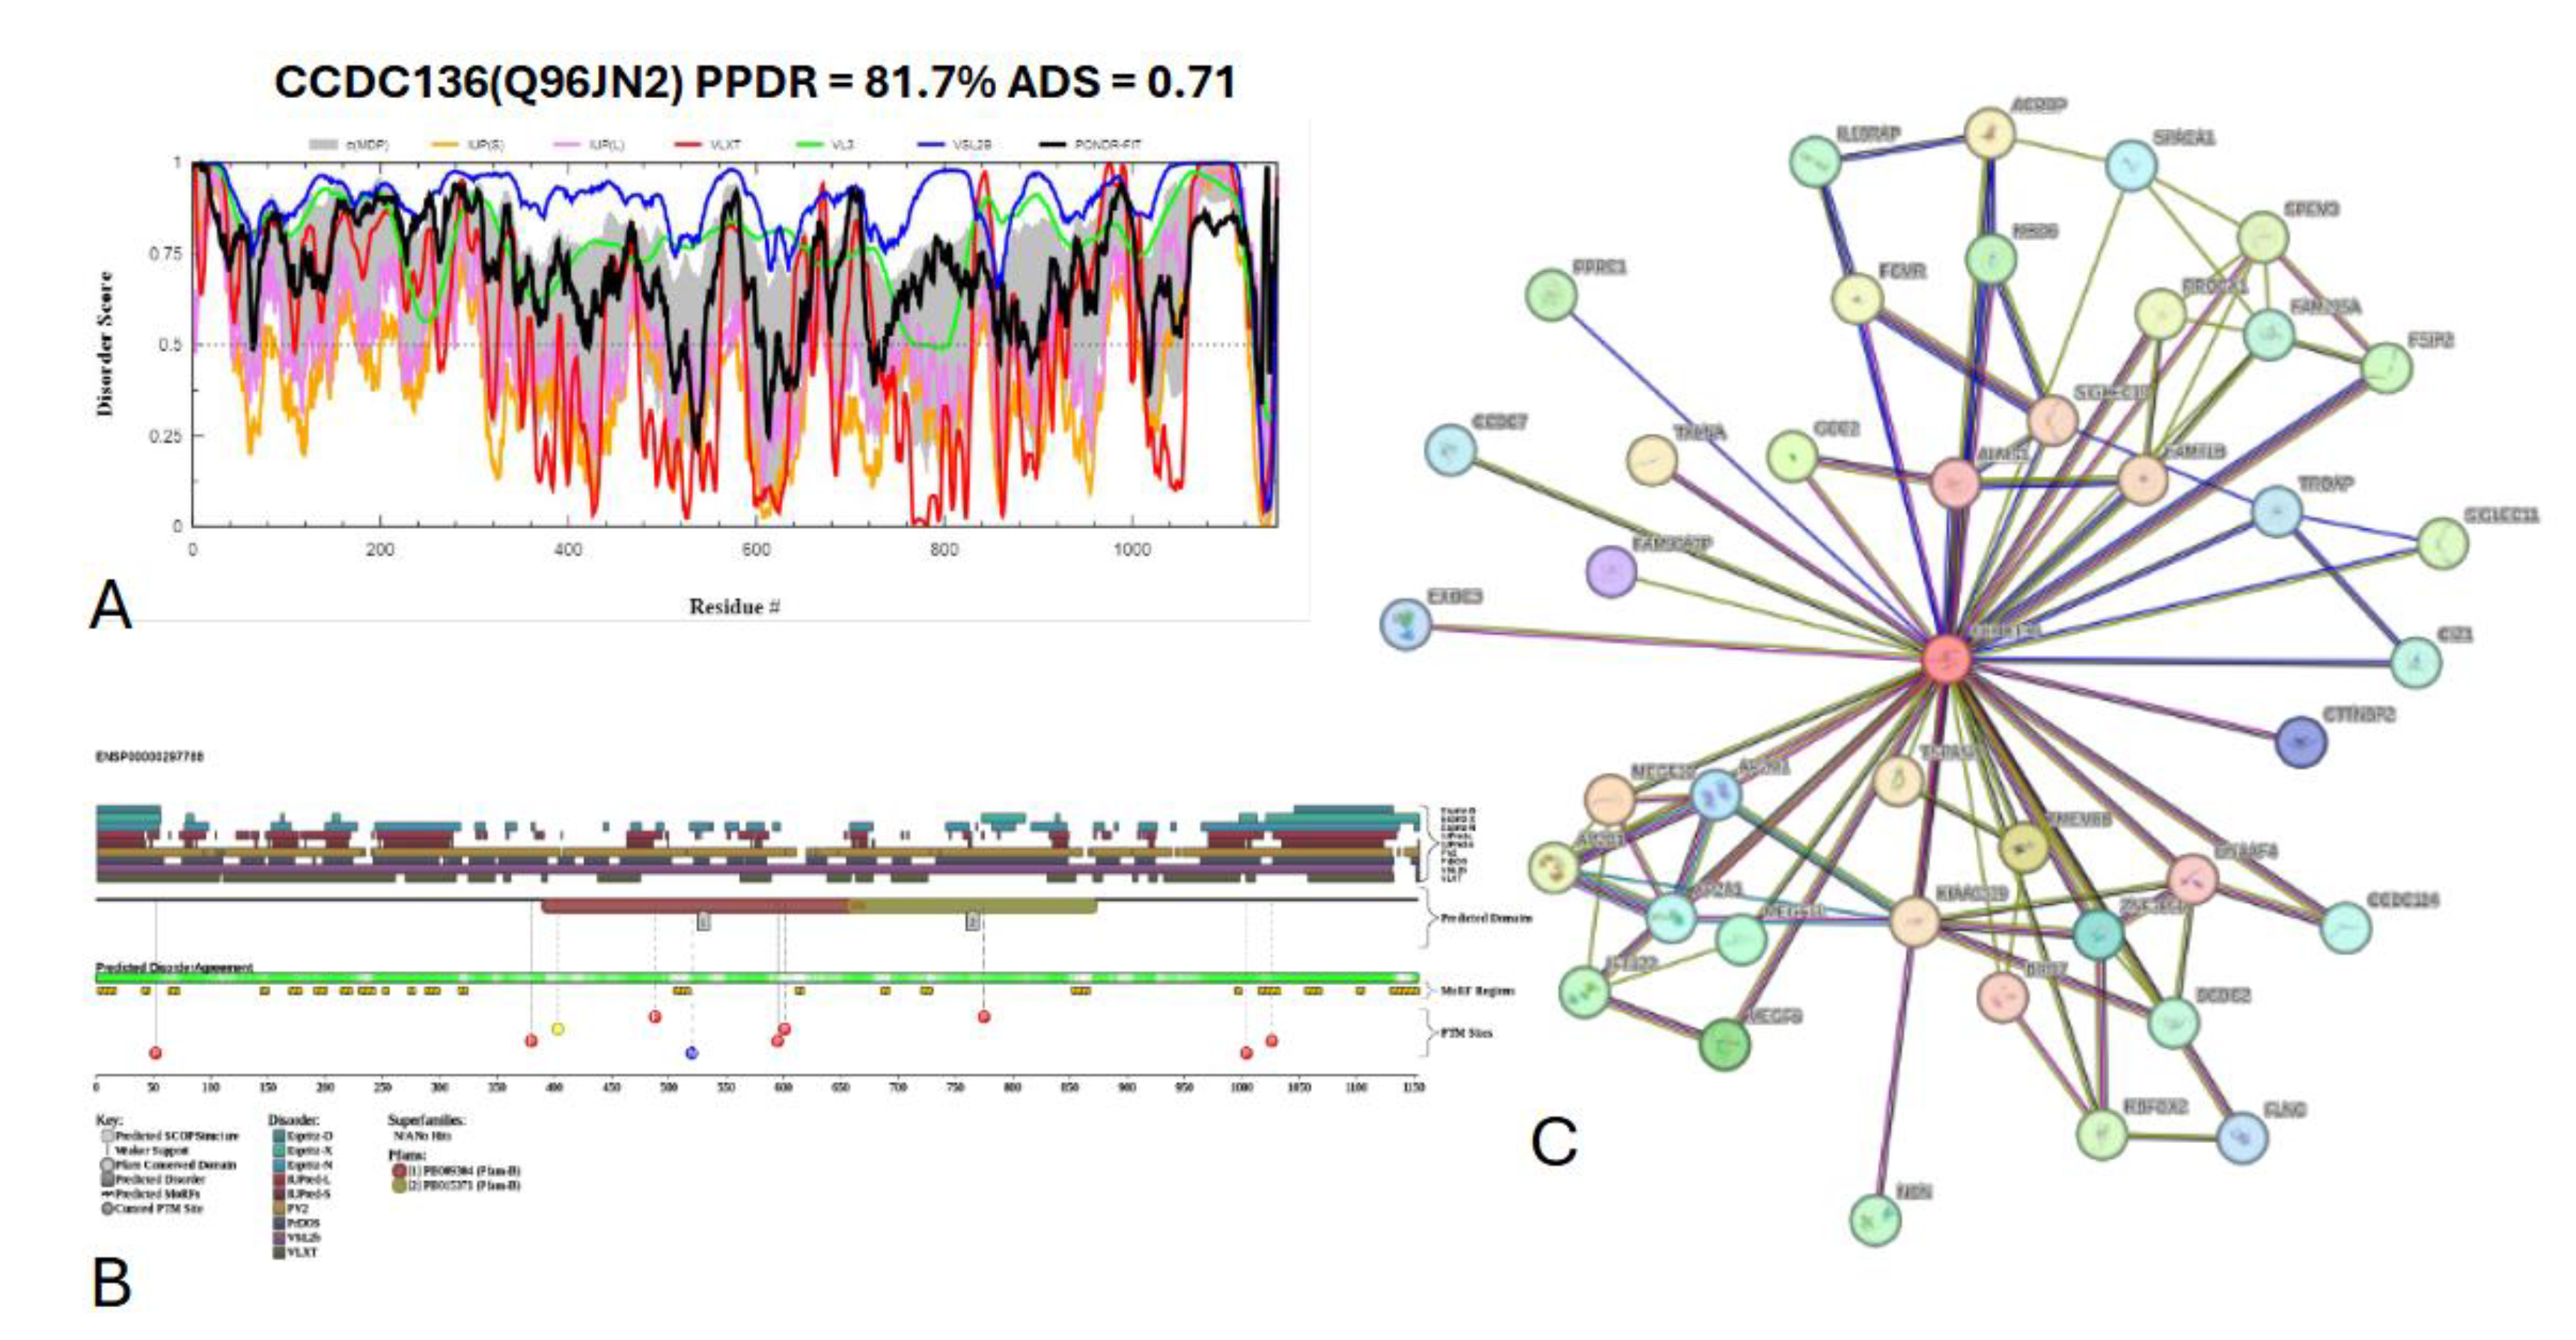
3.7.5. Coiled-coil domain-containing protein 136 (CCDC136) (UniProt ID: Q96JN2)
4. Conclusions
Author Contributions
Funding
Institutional Review Board Statement
Informed Consent Statement
Data Availability Statement
Conflicts of Interest
Abbreviations
| LLPS | Liquid-Liquid Phase Separation |
| OAM | Outer Acrosomal Membrane |
| IAM | Inner Acrosomal Membrane |
| IDP | Intrinsically Disordered Protein |
| IDR | Intrinsically Disordered Region |
| ADS | Average Disorder Score |
| PPIDR | Percentage of Predicted Intrinsically Disordered Residues |
| CH | Charge-Hydropathy |
| CDF | Cumulative Distribution Function |
| SCOP | Structural Classification of Proteins |
| GO | Gene Ontology |
| KEGG | Kyoto Encyclopedia of Genes and Genomes |
| PPI | Protein-Protein Interaction |
| FDR | False Discovery Rate |
| PTM | Post-Translational Modification |
| MARCKS | Myristoylated Alanine-Rich C-Kinase Substrate |
| PLC | Phospholipase C |
| PIP2 | Phosphatidylinositol 4,5-Bisphosphate |
| IP3 | Inositol Trisphosphate |
| DAG | Diacylglycerol |
| PKC | Protein Kinase C |
| TNP2 | Nuclear Transition Protein 2 |
| CEP | Centrosomal Protein |
| RIDAO | Rapid Intrinsic Disorder Analysis Online |
| PONDR | Predictor of Natural Disordered Regions |
| SVM | Support Vector Machine |
| ANN | Artificial Neural Network |
| D2P2 | Database of Disordered Protein Predictions |
| MoRF | Molecular Recognition Feature |
| ZP | Zona Pellucida |
| SNARE | Soluble N-ethylmaleimide-Sensitive Factor Attachment Protein Receptor |
| ATP | Adenosine Triphosphate |
| NMR | Nuclear Magnetic Resonance |
| Cryo-EM | Cryo-Electron Microscopy |
| pLDDT | Predicted Local Distance Difference Test |
| SBIND | Sequence-Based Interaction Mode Divergence |
| Q-Q | Quantile-Quantile |
References
- Ito, C.; Toshimori, K. Acrosome markers of human sperm. Anat Sci Int 2016, 91, 128–142. [Google Scholar] [CrossRef] [PubMed]
- Abou-Haila, A.; Tulsiani, D.R. Mammalian sperm acrosome: formation, contents, and function. Arch Biochem Biophys 2000, 379, 173–182. [Google Scholar] [CrossRef] [PubMed]
- Florman, H.M.; Jungnickel, M.K.; Sutton, K.A. Regulating the acrosome reaction. Int J Dev Biol 2008, 52, 503–510. [Google Scholar] [CrossRef]
- Wright, P.E.; Dyson, H.J. Intrinsically unstructured proteins: re-assessing the protein structure-function paradigm. J Mol Biol 1999, 293, 321–331. [Google Scholar] [CrossRef]
- Uversky, V.N.; Gillespie, J.R.; Fink, A.L. Why are "natively unfolded" proteins unstructured under physiologic conditions? Proteins 2000, 41, 415–427. [Google Scholar] [CrossRef]
- Dunker, A.K.; Lawson, J.D.; Brown, C.J.; Williams, R.M.; Romero, P.; Oh, J.S.; Oldfield, C.J.; Campen, A.M.; Ratliff, C.M.; Hipps, K.W.; et al. Intrinsically disordered protein. J Mol Graph Model 2001, 19, 26–59. [Google Scholar]
- Dunker, A.K.; Obradovic, Z. The protein trinity--linking function and disorder. Nat Biotechnol 2001, 19, 805–806. [Google Scholar]
- Tompa, P. Intrinsically unstructured proteins. Trends Biochem Sci 2002, 27, 527–533. [Google Scholar] [CrossRef]
- Uversky, V.N. Natively unfolded proteins: a point where biology waits for physics. Protein Sci 2002, 11, 739–756. [Google Scholar] [CrossRef]
- Uversky, V.N. What does it mean to be natively unfolded? Eur J Biochem 2002, 269, 2–12. [Google Scholar] [CrossRef]
- Dyson, H.J.; Wright, P.E. Intrinsically unstructured proteins and their functions. Nat Rev Mol Cell Biol 2005, 6, 197–208. [Google Scholar] [CrossRef] [PubMed]
- Uversky, V.N.; Dunker, A.K. Understanding protein non-folding. Biochim Biophys Acta 2010, 1804, 1231–1264. [Google Scholar] [CrossRef] [PubMed]
- Uversky, V.N. The mysterious unfoldome: structureless, underappreciated, yet vital part of any given proteome. J Biomed Biotechnol 2010, 2010, 568068. [Google Scholar] [CrossRef]
- Dunker, A.K.; Oldfield, C.J.; Meng, J.; Romero, P.; Yang, J.Y.; Chen, J.W.; Vacic, V.; Obradovic, Z.; Uversky, V.N. The unfoldomics decade: an update on intrinsically disordered proteins. BMC Genomics 2008, 9 Suppl 2, S1. [Google Scholar] [CrossRef]
- Dunker, A.K.; Silman, I.; Uversky, V.N.; Sussman, J.L. Function and structure of inherently disordered proteins. Curr Opin Struct Biol 2008, 18, 756–764. [Google Scholar] [CrossRef]
- Uversky, V.N. Protein folding revisited. A polypeptide chain at the folding-misfolding-nonfolding cross-roads: which way to go? Cell Mol Life Sci 2003, 60, 1852–1871. [Google Scholar]
- Uversky, V.N. A decade and a half of protein intrinsic disorder: biology still waits for physics. Protein Sci 2013, 22, 693–724. [Google Scholar] [CrossRef]
- Uversky, V.N. Unusual biophysics of intrinsically disordered proteins. Biochim Biophys Acta 2013, 1834, 932–951. [Google Scholar] [CrossRef]
- Uversky, V.N. Intrinsic disorder-based protein interactions and their modulators. Curr Pharm Des 2013, 19, 4191–4213. [Google Scholar]
- Jakob, U.; Kriwacki, R.; Uversky, V.N. Conditionally and transiently disordered proteins: awakening cryptic disorder to regulate protein function. Chem Rev 2014, 114, 6779–6805. [Google Scholar] [CrossRef]
- Uversky, V.N. Functional roles of transiently and intrinsically disordered regions within proteins. FEBS J 2015, 282, 1182–1189. [Google Scholar] [CrossRef] [PubMed]
- Maity, H.; Maity, M.; Englander, S.W. How cytochrome c folds, and why: submolecular foldon units and their stepwise sequential stabilization. J Mol Biol 2004, 343, 223–233. [Google Scholar] [CrossRef]
- Maity, H.; Maity, M.; Krishna, M.M.; Mayne, L.; Englander, S.W. Protein folding: the stepwise assembly of foldon units. Proc Natl Acad Sci U S A 2005, 102, 4741–4746. [Google Scholar] [CrossRef] [PubMed]
- Maity, H.; Rumbley, J.N.; Englander, S.W. Functional role of a protein foldon--an Omega-loop foldon controls the alkaline transition in ferricytochrome c. Proteins 2006, 63, 349–355. [Google Scholar] [CrossRef]
- Uversky, V.N. Intrinsically disordered proteins from A to Z. Int J Biochem Cell Biol 2011, 43, 1090–1103. [Google Scholar] [CrossRef]
- Wright, P.E.; Dyson, H.J. Intrinsically disordered proteins in cellular signalling and regulation. Nat Rev Mol Cell Biol 2015, 16, 18–29. [Google Scholar] [CrossRef]
- Dunker, A.K.; Brown, C.J.; Obradovic, Z. Identification and functions of usefully disordered proteins. Adv Protein Chem 2002, 62, 25–49. [Google Scholar]
- Tompa, P.; Csermely, P. The role of structural disorder in the function of RNA and protein chaperones. Faseb J 2004, 18, 1169–1175. [Google Scholar] [CrossRef]
- Bondos, S.E.; Dunker, A.K.; Uversky, V.N. On the roles of intrinsically disordered proteins and regions in cell communication and signaling. Cell Commun Signal 2021, 19, 88. [Google Scholar] [CrossRef]
- Bondos, S.E.; Dunker, A.K.; Uversky, V.N. Intrinsically disordered proteins play diverse roles in cell signaling. Cell Commun Signal 2022, 20, 20. [Google Scholar] [CrossRef]
- Kulkarni, P.; Bhattacharya, S.; Achuthan, S.; Behal, A.; Jolly, M.K.; Kotnala, S.; Mohanty, A.; Rangarajan, G.; Salgia, R.; Uversky, V. Intrinsically Disordered Proteins: Critical Components of the Wetware. Chem Rev 2022, 122, 6614–6633. [Google Scholar] [CrossRef] [PubMed]
- Kulkarni, P.; Leite, V.B.P.; Roy, S.; Bhattacharyya, S.; Mohanty, A.; Achuthan, S.; Singh, D.; Appadurai, R.; Rangarajan, G.; Weninger, K.; et al. Intrinsically disordered proteins: Ensembles at the limits of Anfinsen's dogma. Biophys Rev (Melville) 2022, 3, 011306. [Google Scholar] [CrossRef]
- Oldfield, C.J.; Dunker, A.K. Intrinsically disordered proteins and intrinsically disordered protein regions. Annu Rev Biochem 2014, 83, 553–584. [Google Scholar] [CrossRef]
- Uversky, V.N. p53 Proteoforms and Intrinsic Disorder: An Illustration of the Protein Structure-Function Continuum Concept. Int J Mol Sci 2016, 17, 1874. [Google Scholar] [CrossRef]
- Dunker, A.K.; Brown, C.J.; Lawson, J.D.; Iakoucheva, L.M.; Obradovic, Z. Intrinsic disorder and protein function. Biochemistry 2002, 41, 6573–6582. [Google Scholar]
- Dunker, A.K.; Lawson, J.D.; Brown, C.J.; Williams, R.M.; Romero, P.; Oh, J.S.; Oldfield, C.J.; Campen, A.M.; Ratliff, C.M.; Hipps, K.W.; et al. Intrinsically disordered protein. J. Mol. Graph. Model. 2001, 19, 26–59. [Google Scholar]
- Daughdrill, G.W.; Pielak, G.J.; Uversky, V.N.; Cortese, M.S.; Dunker, A.K. Natively disordered proteins. In Handbook of Protein Folding, Buchner, J., Kiefhaber, T., Eds. Wiley-VCH, Verlag GmbH & Co. KGaA: Weinheim, Germany, 2005; pp. 271-353.
- Oldfield, C.J.; Cheng, Y.; Cortese, M.S.; Romero, P.; Uversky, V.N.; Dunker, A.K. Coupled folding and binding with alpha-helix-forming molecular recognition elements. Biochemistry 2005, 44, 12454–12470. [Google Scholar] [CrossRef]
- Radivojac, P.; Iakoucheva, L.M.; Oldfield, C.J.; Obradovic, Z.; Uversky, V.N.; Dunker, A.K. Intrinsic disorder and functional proteomics. Biophys J 2007, 92, 1439–1456. [Google Scholar] [CrossRef]
- Dunker, A.K.; Uversky, V.N. Signal transduction via unstructured protein conduits. Nat Chem Biol 2008, 4, 229–230. [Google Scholar]
- Uversky, V.N. Multitude of binding modes attainable by intrinsically disordered proteins: a portrait gallery of disorder-based complexes. Chem Soc Rev 2011, 40, 1623–1634. [Google Scholar] [CrossRef]
- Uversky, V.N. Disordered competitive recruiter: fast and foldable. J Mol Biol 2012, 418, 267–268. [Google Scholar] [CrossRef] [PubMed]
- Uversky, V.N.; Dunker, A.K. The case for intrinsically disordered proteins playing contributory roles in molecular recognition without a stable 3D structure. F1000 biology reports 2013, 5, 1. [Google Scholar] [CrossRef]
- Dyson, H.J.; Wright, P.E. Coupling of folding and binding for unstructured proteins. Curr Opin Struct Biol 2002, 12, 54–60. [Google Scholar]
- Mohan, A.; Oldfield, C.J.; Radivojac, P.; Vacic, V.; Cortese, M.S.; Dunker, A.K.; Uversky, V.N. Analysis of molecular recognition features (MoRFs). J Mol Biol 2006, 362, 1043–1059. [Google Scholar] [CrossRef]
- Vacic, V.; Oldfield, C.J.; Mohan, A.; Radivojac, P.; Cortese, M.S.; Uversky, V.N.; Dunker, A.K. Characterization of molecular recognition features, MoRFs, and their binding partners. J Proteome Res 2007, 6, 2351–2366. [Google Scholar] [CrossRef]
- Hsu, W.L.; Oldfield, C.; Meng, J.; Huang, F.; Xue, B.; Uversky, V.N.; Romero, P.; Dunker, A.K. Intrinsic protein disorder and protein-protein interactions. Pac. Symp. Biocomput. 2012, 2012, 116–127. [Google Scholar] [CrossRef]
- Oldfield, C.J.; Meng, J.; Yang, J.Y.; Yang, M.Q.; Uversky, V.N.; Dunker, A.K. Flexible nets: disorder and induced fit in the associations of p53 and 14-3-3 with their partners. BMC Genomics 2008, 9 Suppl 1, S1. [Google Scholar]
- Hsu, W.L.; Oldfield, C.J.; Xue, B.; Meng, J.; Huang, F.; Romero, P.; Uversky, V.N.; Dunker, A.K. Exploring the binding diversity of intrinsically disordered proteins involved in one-to-many binding. Protein Sci 2013, 22, 258–273. [Google Scholar] [CrossRef]
- van der Lee, R.; Buljan, M.; Lang, B.; Weatheritt, R.J.; Daughdrill, G.W.; Dunker, A.K.; Fuxreiter, M.; Gough, J.; Gsponer, J.; Jones, D.T.; et al. Classification of intrinsically disordered regions and proteins. Chem Rev 2014, 114, 6589–6631. [Google Scholar] [CrossRef]
- Dosztanyi, Z.; Chen, J.; Dunker, A.K.; Simon, I.; Tompa, P. Disorder and sequence repeats in hub proteins and their implications for network evolution. J Proteome Res 2006, 5, 2985–2995. [Google Scholar] [CrossRef]
- Dunker, A.K.; Cortese, M.S.; Romero, P.; Iakoucheva, L.M.; Uversky, V.N. Flexible nets. The roles of intrinsic disorder in protein interaction networks. FEBS J 2005, 272, 5129–5148. [Google Scholar] [CrossRef] [PubMed]
- Haynes, C.; Oldfield, C.J.; Ji, F.; Klitgord, N.; Cusick, M.E.; Radivojac, P.; Uversky, V.N.; Vidal, M.; Iakoucheva, L.M. Intrinsic disorder is a common feature of hub proteins from four eukaryotic interactomes. PLoS Comput Biol 2006, 2, e100. [Google Scholar] [CrossRef] [PubMed]
- Hu, G.; Wu, Z.; Uversky, V.N.; Kurgan, L. Functional Analysis of Human Hub Proteins and Their Interactors Involved in the Intrinsic Disorder-Enriched Interactions. Int J Mol Sci 2017, 18. [Google Scholar] [CrossRef] [PubMed]
- Habchi, J.; Tompa, P.; Longhi, S.; Uversky, V.N. Introducing protein intrinsic disorder. Chem Rev 2014, 114, 6561–6588. [Google Scholar] [CrossRef]
- Iakoucheva, L.M.; Radivojac, P.; Brown, C.J.; O'Connor, T.R.; Sikes, J.G.; Obradovic, Z.; Dunker, A.K. The importance of intrinsic disorder for protein phosphorylation. Nucleic Acids Res 2004, 32, 1037–1049. [Google Scholar] [CrossRef]
- Pejaver, V.; Hsu, W.L.; Xin, F.; Dunker, A.K.; Uversky, V.N.; Radivojac, P. The structural and functional signatures of proteins that undergo multiple events of post-translational modification. Protein Sci 2014, 23, 1077–1093. [Google Scholar] [CrossRef]
- Dunker, A.K.; Obradovic, Z.; Romero, P.; Garner, E.C.; Brown, C.J. Intrinsic protein disorder in complete genomes. Genome Inform Ser Workshop Genome Inform 2000, 11, 161–171. [Google Scholar]
- Ward, J.J.; Sodhi, J.S.; McGuffin, L.J.; Buxton, B.F.; Jones, D.T. Prediction and functional analysis of native disorder in proteins from the three kingdoms of life. J Mol Biol 2004, 337, 635–645. [Google Scholar] [CrossRef]
- Oldfield, C.J.; Cheng, Y.; Cortese, M.S.; Brown, C.J.; Uversky, V.N.; Dunker, A.K. Comparing and combining predictors of mostly disordered proteins. Biochemistry 2005, 44, 1989–2000. [Google Scholar] [CrossRef]
- Xue, B.; Dunker, A.K.; Uversky, V.N. Orderly order in protein intrinsic disorder distribution: disorder in 3500 proteomes from viruses and the three domains of life. Journal of biomolecular structure & dynamics 2012, 30, 137–149. [Google Scholar] [CrossRef]
- Peng, Z.; Yan, J.; Fan, X.; Mizianty, M.J.; Xue, B.; Wang, K.; Hu, G.; Uversky, V.N.; Kurgan, L. Exceptionally abundant exceptions: comprehensive characterization of intrinsic disorder in all domains of life. Cell Mol Life Sci 2014. [Google Scholar] [CrossRef] [PubMed]
- Peng, Z.; Yan, J.; Fan, X.; Mizianty, M.J.; Xue, B.; Wang, K.; Hu, G.; Uversky, V.N.; Kurgan, L. Exceptionally abundant exceptions: comprehensive characterization of intrinsic disorder in all domains of life. Cell Mol Life Sci 2015, 72, 137–151. [Google Scholar] [CrossRef] [PubMed]
- Tompa, P. Intrinsically disordered proteins: a 10-year recap. Trends Biochem Sci 2012, 37, 509–516. [Google Scholar] [CrossRef] [PubMed]
- Darling, A.L.; Uversky, V.N. Intrinsic Disorder and Posttranslational Modifications: The Darker Side of the Biological Dark Matter. Front Genet 2018, 9, 158. [Google Scholar] [CrossRef]
- Uversky, V.N.; Dave, V.; Iakoucheva, L.M.; Malaney, P.; Metallo, S.J.; Pathak, R.R.; Joerger, A.C. Pathological unfoldomics of uncontrolled chaos: intrinsically disordered proteins and human diseases. Chem Rev 2014, 114, 6844–6879. [Google Scholar] [CrossRef]
- Uversky, V.N.; Oldfield, C.J.; Dunker, A.K. Intrinsically disordered proteins in human diseases: introducing the D2 concept. Annu Rev Biophys 2008, 37, 215–246. [Google Scholar] [CrossRef]
- Gadhave, K.; Gehi, B.R.; Kumar, P.; Xue, B.; Uversky, V.N.; Giri, R. The dark side of Alzheimer's disease: unstructured biology of proteins from the amyloid cascade signaling pathway. Cell Mol Life Sci 2020, 77, 4163–4208. [Google Scholar] [CrossRef]
- Uversky, V.N. Wrecked regulation of intrinsically disordered proteins in diseases: pathogenicity of deregulated regulators. Front Mol Biosci 2014, 1, 6. [Google Scholar] [CrossRef]
- Uversky, V.N. Rebellion of the deregulated regulators: What is the clinical relevance of studying intrinsically disordered proteins? Expert Rev Proteomics 2022, 19, 279–282. [Google Scholar] [CrossRef]
- Chiti, F.; Dobson, C.M. Protein misfolding, functional amyloid, and human disease. Annu Rev Biochem 2006, 75, 333–366. [Google Scholar] [CrossRef]
- Dobson, C.M. Protein folding and misfolding. Nature 2003, 426, 884–890. [Google Scholar] [CrossRef] [PubMed]
- Van Bibber, N.W.; Haerle, C.; Khalife, R.; Xue, B.; Uversky, V.N. Intrinsic Disorder in Tetratricopeptide Repeat Proteins. Int J Mol Sci 2020, 21. [Google Scholar] [CrossRef]
- Meng, F.; Na, I.; Kurgan, L.; Uversky, V.N. Compartmentalization and Functionality of Nuclear Disorder: Intrinsic Disorder and Protein-Protein Interactions in Intra-Nuclear Compartments. Int J Mol Sci 2015, 17. [Google Scholar] [CrossRef]
- Darling, A.L.; Liu, Y.; Oldfield, C.J.; Uversky, V.N. Intrinsically Disordered Proteome of Human Membrane-Less Organelles. Proteomics 2018, 18, e1700193–1700112. [Google Scholar] [CrossRef]
- Uversky, V.N. The roles of intrinsic disorder-based liquid-liquid phase transitions in the "Dr. Jekyll-Mr. Hyde" behavior of proteins involved in amyotrophic lateral sclerosis and frontotemporal lobar degeneration. Autophagy 2017, 13, 2115–2162. [Google Scholar] [CrossRef]
- Uversky, V.N. Intrinsically disordered proteins in overcrowded milieu: Membrane-less organelles, phase separation, and intrinsic disorder. Curr Opin Struct Biol 2017, 44, 18–30. [Google Scholar] [CrossRef]
- Uversky, V.N. Protein intrinsic disorder-based liquid-liquid phase transitions in biological systems: Complex coacervates and membrane-less organelles. Adv Colloid Interface Sci 2017, 239, 97–114. [Google Scholar] [CrossRef]
- Antifeeva, I.A.; Fonin, A.V.; Fefilova, A.S.; Stepanenko, O.V.; Povarova, O.I.; Silonov, S.A.; Kuznetsova, I.M.; Uversky, V.N.; Turoverov, K.K. Liquid-liquid phase separation as an organizing principle of intracellular space: overview of the evolution of the cell compartmentalization concept. Cell Mol Life Sci 2022, 79, 251. [Google Scholar] [CrossRef]
- Fonin, A.V.; Antifeeva, I.A.; Kuznetsova, I.M.; Turoverov, K.K.; Zaslavsky, B.Y.; Kulkarni, P.; Uversky, V.N. Biological soft matter: intrinsically disordered proteins in liquid-liquid phase separation and biomolecular condensates. Essays Biochem 2022, 66, 831–847. [Google Scholar] [CrossRef]
- Fonin, A.V.; Darling, A.L.; Kuznetsova, I.M.; Turoverov, K.K.; Uversky, V.N. Intrinsically disordered proteins in crowded milieu: when chaos prevails within the cellular gumbo. Cell Mol Life Sci 2018, 75, 3907–3929. [Google Scholar] [CrossRef]
- Turoverov, K.K.; Kuznetsova, I.M.; Fonin, A.V.; Darling, A.L.; Zaslavsky, B.Y.; Uversky, V.N. Stochasticity of Biological Soft Matter: Emerging Concepts in Intrinsically Disordered Proteins and Biological Phase Separation. Trends Biochem Sci 2019, 44, 716–728. [Google Scholar] [CrossRef] [PubMed]
- Uversky, V.N.; Kuznetsova, I.M.; Turoverov, K.K.; Zaslavsky, B. Intrinsically disordered proteins as crucial constituents of cellular aqueous two phase systems and coacervates. FEBS Lett 2015, 589, 15–22. [Google Scholar] [CrossRef] [PubMed]
- Alberti, S.; Gladfelter, A.; Mittag, T. Considerations and Challenges in Studying Liquid-Liquid Phase Separation and Biomolecular Condensates. Cell 2019, 176, 419–434. [Google Scholar] [CrossRef] [PubMed]
- Patel, A.; Malinovska, L.; Saha, S.; Wang, J.; Alberti, S.; Krishnan, Y.; Hyman, A.A. ATP as a biological hydrotrope. Science 2017, 356, 753–756. [Google Scholar] [CrossRef]
- Das, R.K.; Pappu, R.V. Conformations of intrinsically disordered proteins are influenced by linear sequence distributions of oppositely charged residues. Proc Natl Acad Sci U S A 2013, 110, 13392–13397. [Google Scholar] [CrossRef]
- McCarty, J.; Delaney, K.T.; Danielsen, S.P.O.; Fredrickson, G.H.; Shea, J.E. Complete Phase Diagram for Liquid-Liquid Phase Separation of Intrinsically Disordered Proteins. J Phys Chem Lett 2019, 10, 1644–1652. [Google Scholar] [CrossRef]
- Banani, S.F.; Lee, H.O.; Hyman, A.A.; Rosen, M.K. Biomolecular condensates: organizers of cellular biochemistry. Nat Rev Mol Cell Biol 2017, 18, 285–298. [Google Scholar] [CrossRef]
- Shin, Y.; Brangwynne, C.P. Liquid phase condensation in cell physiology and disease. Science 2017, 357. [Google Scholar] [CrossRef]
- Lin, Y.; Protter, D.S.; Rosen, M.K.; Parker, R. Formation and Maturation of Phase-Separated Liquid Droplets by RNA-Binding Proteins. Mol Cell 2015, 60, 208–219. [Google Scholar] [CrossRef]
- Dayhoff, G.W., 2nd; Uversky, V.N. Rapid prediction and analysis of protein intrinsic disorder. Protein Sci 2022, 31, e4496. [Google Scholar] [CrossRef]
- Li, X.; Romero, P.; Rani, M.; Dunker, A.K.; Obradovic, Z. Predicting Protein Disorder for N-, C-, and Internal Regions. Genome Inform Ser Workshop Genome Inform 1999, 10, 30–40. [Google Scholar] [PubMed]
- Radivojac, P.; Obradovic, Z.; Brown, C.J.; Dunker, A.K. Prediction of boundaries between intrinsically ordered and disordered protein regions. Pac Symp Biocomput 2003, 216–227. [Google Scholar]
- Peng, K.; Radivojac, P.; Vucetic, S.; Dunker, A.K.; Obradovic, Z. Length-dependent prediction of protein intrinsic disorder. BMC Bioinformatics 2006, 7, 208. [Google Scholar] [CrossRef] [PubMed]
- Dosztanyi, Z.; Csizmok, V.; Tompa, P.; Simon, I. The pairwise energy content estimated from amino acid composition discriminates between folded and intrinsically unstructured proteins. J Mol Biol 2005, 347, 827–839. [Google Scholar] [CrossRef]
- Meszaros, B.; Erdos, G.; Dosztanyi, Z. IUPred2A: context-dependent prediction of protein disorder as a function of redox state and protein binding. Nucleic Acids Res 2018, 46, W329–W337. [Google Scholar] [CrossRef]
- Xue, B.; Dunbrack, R.L.; Williams, R.W.; Dunker, A.K.; Uversky, V.N. PONDR-FIT: a meta-predictor of intrinsically disordered amino acids. Biochim Biophys Acta 2010, 1804, 996–1010. [Google Scholar] [CrossRef]
- Mohan, A.; Sullivan, W.J., Jr.; Radivojac, P.; Dunker, A.K.; Uversky, V.N. Intrinsic disorder in pathogenic and non-pathogenic microbes: discovering and analyzing the unfoldomes of early-branching eukaryotes. Mol Biosyst 2008, 4, 328–340. [Google Scholar] [CrossRef]
- Huang, F.; Oldfield, C.; Meng, J.; Hsu, W.L.; Xue, B.; Uversky, V.N.; Romero, P.; Dunker, A.K. Subclassifying disordered proteins by the CH-CDF plot method. Pac Symp Biocomput 2012, 128–139. [Google Scholar]
- Huang, F.; Oldfield, C.J.; Xue, B.; Hsu, W.L.; Meng, J.; Liu, X.; Shen, L.; Romero, P.; Uversky, V.N.; Dunker, A. Improving protein order-disorder classification using charge-hydropathy plots. BMC Bioinformatics 2014, 15 Suppl 17, S4. [Google Scholar] [CrossRef]
- Oates, M.E.; Romero, P.; Ishida, T.; Ghalwash, M.; Mizianty, M.J.; Xue, B.; Dosztanyi, Z.; Uversky, V.N.; Obradovic, Z.; Kurgan, L.; et al. D(2)P(2): database of disordered protein predictions. Nucleic Acids Res 2013, 41, D508–516. [Google Scholar] [CrossRef]
- Ishida, T.; Kinoshita, K. PrDOS: prediction of disordered protein regions from amino acid sequence. Nucleic Acids Res 2007, 35, W460–464. [Google Scholar] [CrossRef] [PubMed]
- Walsh, I.; Martin, A.J.; Di Domenico, T.; Tosatto, S.C. ESpritz: accurate and fast prediction of protein disorder. Bioinformatics 2012, 28, 503–509. [Google Scholar] [CrossRef] [PubMed]
- Andreeva, A.; Howorth, D.; Brenner, S.E.; Hubbard, T.J.; Chothia, C.; Murzin, A.G. SCOP database in 2004: refinements integrate structure and sequence family data. Nucleic Acids Res 2004, 32, D226–229. [Google Scholar] [CrossRef]
- Murzin, A.G.; Brenner, S.E.; Hubbard, T.; Chothia, C. SCOP: a structural classification of proteins database for the investigation of sequences and structures. J Mol Biol 1995, 247, 536–540. [Google Scholar] [CrossRef]
- de Lima Morais, D.A.; Fang, H.; Rackham, O.J.; Wilson, D.; Pethica, R.; Chothia, C.; Gough, J. SUPERFAMILY 1.75 including a domain-centric gene ontology method. Nucleic Acids Res 2011, 39, D427–434. [Google Scholar] [CrossRef]
- Hornbeck, P.V.; Kornhauser, J.M.; Tkachev, S.; Zhang, B.; Skrzypek, E.; Murray, B.; Latham, V.; Sullivan, M. PhosphoSitePlus: a comprehensive resource for investigating the structure and function of experimentally determined post-translational modifications in man and mouse. Nucleic Acids Res 2012, 40, D261–270. [Google Scholar] [CrossRef]
- Dosztanyi, Z.; Meszaros, B.; Simon, I. ANCHOR: web server for predicting protein binding regions in disordered proteins. Bioinformatics 2009, 25, 2745–2746. [Google Scholar] [CrossRef]
- Meszaros, B.; Simon, I.; Dosztanyi, Z. Prediction of protein binding regions in disordered proteins. PLoS Comput Biol 2009, 5, e1000376. [Google Scholar] [CrossRef]
- Szklarczyk, D.; Franceschini, A.; Kuhn, M.; Simonovic, M.; Roth, A.; Minguez, P.; Doerks, T.; Stark, M.; Muller, J.; Bork, P.; et al. The STRING database in 2011: functional interaction networks of proteins, globally integrated and scored. Nucleic Acids Res 2011, 39, D561–568. [Google Scholar] [CrossRef]
- Van Bibber, N.W.; Haerle, C.; Khalife, R.; Dayhoff, G.W., 2nd; Uversky, V.N. Intrinsic Disorder in Human Proteins Encoded by Core Duplicon Gene Families. J Phys Chem B 2020, 124, 8050–8070. [Google Scholar] [CrossRef]
- Hardenberg, M.; Horvath, A.; Ambrus, V.; Fuxreiter, M.; Vendruscolo, M. Widespread occurrence of the droplet state of proteins in the human proteome. Proc Natl Acad Sci U S A 2020, 117, 33254–33262. [Google Scholar] [CrossRef] [PubMed]
- Hatos, A.; Tosatto, S.C.E.; Vendruscolo, M.; Fuxreiter, M. FuzDrop on AlphaFold: visualizing the sequence-dependent propensity of liquid-liquid phase separation and aggregation of proteins. Nucleic Acids Res 2022, 50, W337–W344. [Google Scholar] [CrossRef] [PubMed]
- Vance, T.D.R.; Yip, P.; Jimenez, E.; Li, S.; Gawol, D.; Byrnes, J.; Uson, I.; Ziyyat, A.; Lee, J.E. SPACA6 ectodomain structure reveals a conserved superfamily of gamete fusion-associated proteins. Commun Biol 2022, 5, 984. [Google Scholar] [CrossRef]
- He, L.; Yu, Z.; Geng, Z.; Huang, Z.; Zhang, C.; Dong, Y.; Gao, Y.; Wang, Y.; Chen, Q.; Sun, L.; et al. Structure, gating, and pharmacology of human Ca(V)3.3 channel. Nat Commun 2022, 13, 2084. [Google Scholar] [CrossRef]
- Lavering, E.D.; Gandhamaneni, M.; Weeks, D.L. Intrinsically disordered regions are not sufficient to direct the compartmental localization of nucleolar proteins in the nucleus. PLoS Biol 2023, 21, e3002378. [Google Scholar] [CrossRef]
- Snead, D.; Eliezer, D. Intrinsically disordered proteins in synaptic vesicle trafficking and release. J Biol Chem 2019, 294, 3325–3342. [Google Scholar] [CrossRef]
- Breitbart, H. Intracellular calcium regulation in sperm capacitation and acrosomal reaction. Mol Cell Endocrinol 2002, 187, 139–144. [Google Scholar] [CrossRef]
- Rodriguez Pena, M.J.; Castillo Bennett, J.V.; Soler, O.M.; Mayorga, L.S.; Michaut, M.A. MARCKS protein is phosphorylated and regulates calcium mobilization during human acrosomal exocytosis. PLoS One 2013, 8, e64551. [Google Scholar] [CrossRef]
- Arbuzova, A.; Schmitz, A.A.; Vergeres, G. Cross-talk unfolded: MARCKS proteins. Biochem J 2002, 362, 1–12. [Google Scholar] [CrossRef]
- Barral, S.; Morozumi, Y.; Tanaka, H.; Montellier, E.; Govin, J.; de Dieuleveult, M.; Charbonnier, G.; Coute, Y.; Puthier, D.; Buchou, T.; et al. Histone Variant H2A.L.2 Guides Transition Protein-Dependent Protamine Assembly in Male Germ Cells. Mol Cell 2017, 66, 89–101. [Google Scholar] [CrossRef]
- Zhao, M.; Shirley, C.R.; Hayashi, S.; Marcon, L.; Mohapatra, B.; Suganuma, R.; Behringer, R.R.; Boissonneault, G.; Yanagimachi, R.; Meistrich, M.L. Transition nuclear proteins are required for normal chromatin condensation and functional sperm development. Genesis 2004, 38, 200–213. [Google Scholar] [CrossRef] [PubMed]
- Shakya, A.; Park, S.; Rana, N.; King, J.T. Liquid-Liquid Phase Separation of Histone Proteins in Cells: Role in Chromatin Organization. Biophys J 2020, 118, 753–764. [Google Scholar] [CrossRef] [PubMed]
- Hall, E.A.; Keighren, M.; Ford, M.J.; Davey, T.; Jarman, A.P.; Smith, L.B.; Jackson, I.J.; Mill, P. Acute versus chronic loss of mammalian Azi1/Cep131 results in distinct ciliary phenotypes. PLoS Genet 2013, 9, e1003928. [Google Scholar] [CrossRef] [PubMed]
- Wilkinson, C.J.; Carl, M.; Harris, W.A. Cep70 and Cep131 contribute to ciliogenesis in zebrafish embryos. BMC Cell Biol 2009, 10, 17. [Google Scholar] [CrossRef]
- Staples, C.J.; Myers, K.N.; Beveridge, R.D.; Patil, A.A.; Lee, A.J.; Swanton, C.; Howell, M.; Boulton, S.J.; Collis, S.J. The centriolar satellite protein Cep131 is important for genome stability. J Cell Sci 2012, 125, 4770–4779. [Google Scholar] [CrossRef]
- Liu, Q.; Guo, Q.; Guo, W.; Song, S.; Wang, N.; Chen, X.; Sun, A.; Yan, L.; Qiao, J. Loss of CEP70 function affects acrosome biogenesis and flagella formation during spermiogenesis. Cell Death Dis 2021, 12, 478. [Google Scholar] [CrossRef]
- Kim, D.H.; Ahn, J.S.; Han, H.J.; Kim, H.M.; Hwang, J.; Lee, K.H.; Cha-Molstad, H.; Ryoo, I.J.; Jang, J.H.; Ko, S.K.; et al. Cep131 overexpression promotes centrosome amplification and colon cancer progression by regulating Plk4 stability. Cell Death Dis 2019, 10, 570. [Google Scholar] [CrossRef]
- Liu, X.H.; Yang, Y.F.; Fang, H.Y.; Wang, X.H.; Zhang, M.F.; Wu, D.C. CEP131 indicates poor prognosis and promotes cell proliferation and migration in hepatocellular carcinoma. Int J Biochem Cell Biol 2017, 90, 1–8. [Google Scholar] [CrossRef]
- Shen, M.; Li, S.; Zhao, Y.; Liu, Y.; Liu, Z.; Huan, L.; Qiao, Y.; Wang, L.; Han, L.; Chen, Z.; et al. Hepatic ARID3A facilitates liver cancer malignancy by cooperating with CEP131 to regulate an embryonic stem cell-like gene signature. Cell Death Dis 2022, 13, 732. [Google Scholar] [CrossRef]
- Jin, H.J.; Fan, Y.; Yang, X.; Dong, Y.; Zhang, X.Z.; Geng, X.Y.; Yan, Z.; Wu, L.; Ma, M.; Li, B.; et al. Disruption in CYLC1 leads to acrosome detachment, sperm head deformity, and male in/subfertility in humans and mice. Elife 2024, 13. [Google Scholar] [CrossRef]
- Geng, Q.; Ni, L.; Ouyang, B.; Hu, Y.; Zhao, Y.; Guo, J. A Novel Testis-Specific Gene, Ccdc136, Is Required for Acrosome Formation and Fertilization in Mice. Reprod Sci 2016, 23, 1387–1396. [Google Scholar] [CrossRef] [PubMed]


| PONDR® VXLT | PONDR® VSL2B | PONDR® VL3 | ||||
| ADS | PPIDR | ADS | PPIDR | ADS | PPIDR | |
| Minimum | 0.0602 | 0.79 | 0.1755 | 4.79 | 0.0995 | 0 |
| Mean | 0.3435 | 32.09 | 0.4582 | 40.83 | 0.3999 | 33.37 |
| Median | 0.3177 | 28.88 | 0.4141 | 34.04 | 0.3693 | 27.14 |
| Maximum | 0.8295 | 90.96 | 0.9907 | 100 | 0.9240 | 100 |
| Superfamily | Disordered Residues (n) | Proteins Affected (UniProt IDs) |
| ARM repeat | 17 | Q7Z745 |
| Actin-like ATPase domain | 2 | Q9Y615 |
| Ankyrin repeat | 23 | P46531 |
| C-terminal domain of PLC-beta | 40 | Q9NQ66 |
| C2 domain (Calcium/lipid-binding domain, CaLB) | 14 | O14795 |
| CAD & PB1 domains | 15 | P19878 |
| CATH | 1 | P17612 |
| Calpain large subunit, middle domain (domain III) | 3 | Q9UMQ6 |
| Concanavalin A-like lectins/glucanases | 40 | P27797, Q9NQ86 |
| Cysteine proteinases | 13 | O75604 |
| Cysteine-rich domain | 4 | Q9H0H5 |
| Dimerization-anchoring domain of cAMP-dependent PK regulatory subunit | 4 | Q9BZX4 |
| EF-hand | 1 | Q9NQ66 |
| FAD-linked reductases, C-terminal domain | 1 | Q96RQ9 |
| FAD/NAD(P)-binding domain | 3 | Q96RQ9 |
| FYVE/PHD zinc finger | 36 | Q86UR5 |
| Family A G protein-coupled receptor-like | 5 | P14416, P21731 |
| Fibronectin type III | 23 | Q9Y2H6 |
| Growth factor receptor domain | 6 | Q6UW60 |
| HRDC-like | 17 | O75575 |
| Immunoglobulin | 3 | P35613, Q92692 |
| Integrin domains | 4 | P56199 |
| MIR domain | 5 | Q9UKY4, Q9Y6A1 |
| Neurotransmitter-gated ion-channel transmembrane pore | 40 | P23415, P48167 |
| Nucleotide cyclase | 10 | O60266 |
| Nucleotide-diphospho-sugar transferases | 12 | P15291 |
| P-domain of calnexin/calreticulin | 70 | P27797 |
| P-loop containing nucleoside triphosphate hydrolases | 9 | P20340 |
| PDZ domain-like | 10 | Q86UR5 |
| PLC-like phosphodiesterases | 111 | Q9BRC7, Q9NQ66 |
| Phospholipase A2, PLA2 | 15 | Q9NZ20 |
| Protein kinase-like (PK-like) | 31 | Q13976, Q9UQB9 |
| Rhodanese/Cell cycle control phosphatase | 7 | P40818 |
| SGNH hydrolase | 6 | Q6P1J6 |
| SH3-domain | 24 | P19878 |
| Sec1/munc18-like (SM) proteins | 17 | P61764 |
| Serpins | 5 | P05154 |
| Subtilisin-like | 11 | Q6UW60 |
| Thioredoxin-like | 4 | Q8N4E4 |
| Transcription factor IIA (TFIIA), beta-barrel domain | 6 | Q9UNN4 |
| Trypsin-like serine proteases | 11 | Q6UWB4 |
| Tubulin C-terminal domain-like | 5 | Q9NY65 |
| USP8 N-terminal domain-like | 20 | P40818 |
| WD40 repeat-like | 10 | P43034 |
| Ypt/Rab-GAP domain of gyp1p | 8 | Q96BZ9 |
| alpha-catenin/vinculin-like | 10 | P35221 |
| t-snare proteins | 73 | P32856, P61266, Q16623 |
| Source | Term ID | Term Name | p_adj (query) |
| GO:MF | GO:0019899 | enzyme binding | 7.900×10⁻⁴ |
| GO:0000149 | SNARE binding | 1.876×10⁻³ | |
| GO:0016934 | extracellularly glycine-gated chloride channel ... | 1.430×10⁻² | |
| GO:0043169 | cation binding | 4.442×10⁻² | |
| GO:0005484 | SNAP receptor activity | 4.490×10⁻² | |
| GO:0004620 | phospholipase activity | 4.815×10⁻² | |
| GO:BP | GO:0003006 | developmental process involved in reproduction | 3.127×10⁻¹¹ |
| GO:0010807 | regulation of synaptic vesicle priming | 1.386×10⁻⁶ | |
| GO:0065008 | regulation of biological quality | 9.343×10⁻⁶ | |
| GO:0099170 | postsynaptic modulation of chemical synaptic t... | 6.720×10⁻⁴ | |
| GO:0007405 | neuroblast proliferation | 1.993×10⁻³ | |
| GO:0048870 | cell motility | 5.806×10⁻³ | |
| GO:0000910 | cytokinesis | 7.271×10⁻³ | |
| GO:0045787 | positive regulation of cell cycle | 2.231×10⁻² | |
| GO:0031175 | neuron projection development | 2.257×10⁻² | |
| GO:1904100 | positive regulation of protein O-linked glycosyl... | 2.547×10⁻² | |
| GO:0010560 | positive regulation of glycoprotein biosynthet... | 3.189×10⁻² | |
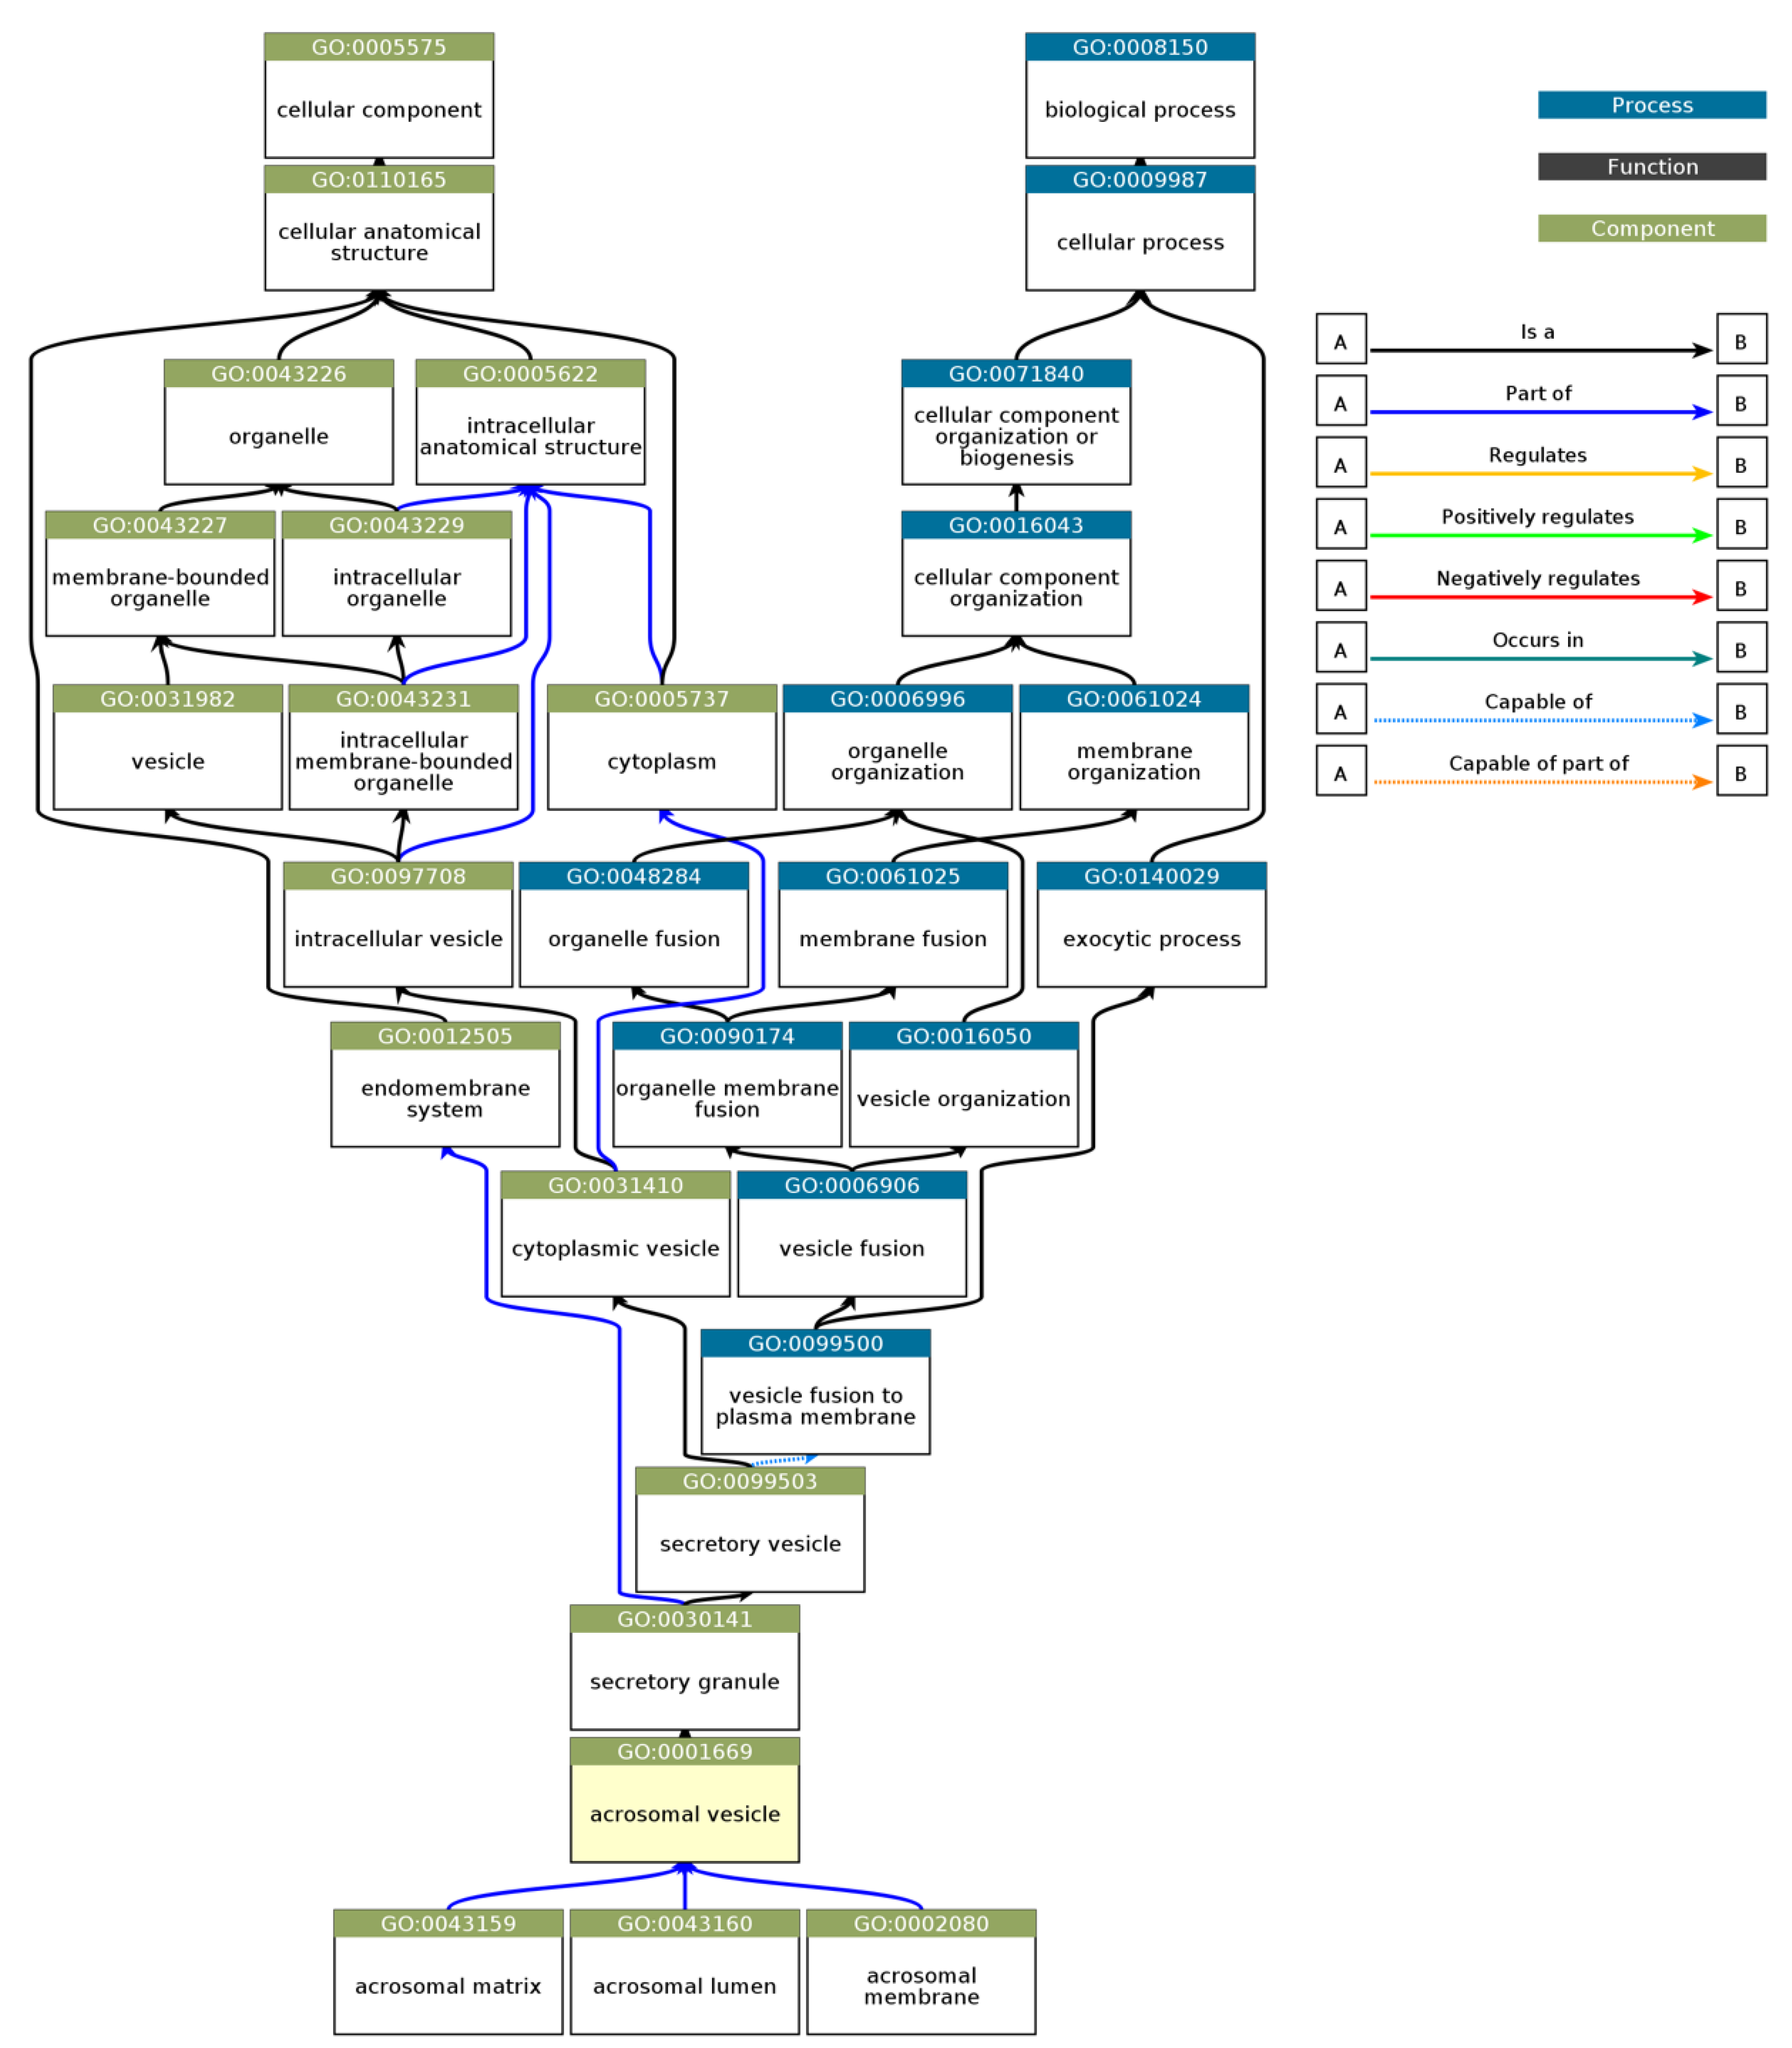
| GO:CC | GO:0001669 | acrosomal vesicle | 5.395×10-38 |
| GO:0098590 | plasma membrane region | 1.175×10⁻⁶ | |
| GO:0042995 | cell projection | 1.406×10⁻⁶ | |
| GO:0005915 | zonula adherens | 3.998×10⁻² |
| Statistic | LLPS Propensity Statistics |
| Count (N) | 250 |
| Mean (x̄) | 0.451146 |
| Std. Deviation (σ) | 0.33337186 |
| Minimum (xmin) | 0.0922 |
| First Quartile (Q1)) | 0.166975 |
| Median (Q2) | 0.28645 |
| Third Quartile (Q3) | 0.7946 |
| Maximum (xmax) | 1 |
Disclaimer/Publisher’s Note: The statements, opinions and data contained in all publications are solely those of the individual author(s) and contributor(s) and not of MDPI and/or the editor(s). MDPI and/or the editor(s) disclaim responsibility for any injury to people or property resulting from any ideas, methods, instructions or products referred to in the content. |
© 2025 by the authors. Licensee MDPI, Basel, Switzerland. This article is an open access article distributed under the terms and conditions of the Creative Commons Attribution (CC BY) license (http://creativecommons.org/licenses/by/4.0/).


