
Submitted:
30 April 2023
Posted:
30 April 2023
You are already at the latest version
Abstract
Radical changes in the idea of the organization of the intracellular space that occurred in the early 2010-s made it possible to consider the formation and functioning of the so-called membrane-less organelles (MLOs) based on a single physical principle: the liquid-liquid phase separation (LLPS) of biopolymers. Weak nonspecific inter- and intramolecular interactions of disordered polymers, primarily of intrinsically disordered proteins and RNA, play a central role in the initiation and regulation of these processes. On the other hand, in some cases, the "maturation" of MLOs can be accompanied by the "liquid-gel” phase transition, where other types of interactions can play a significant role in reorganization of their structure. In this work, we conducted a bioinformatics analysis of the propensity of the proteomes of two membrane-less organelles formed in response to stress in the same compartment, nucleolus, for spontaneous phase separation and looked at their intrinsic disorder predispositions. These nucleolar MLOs, amyloid bodies (A-bodies) formed in the response to acidosis and heat shock and nuclear stress bodies (nSBs), are characterized by the partially overlapping composition, but show different functional activities and morphologies. We show that the proteomes of these nucleolar biocondensates are differently enriched in proteins, many of with high potential for spontaneous LLPS that correlates with different morphology and function of these organelles. The results of these analyses allowed us to evaluate the role of weak interactions in the formation and functioning of these important organelles.
Keywords:
amyloid bodies
; intrinsically disordered protein
; liquid-liquid phase separation
; membrane-less organelle
; nuclear stress bodies
; nucleolar biomolecular condensates
1. Introduction
In the 21st century, there have been at least two revolutionary changes in the understanding of the structural and functional organization of proteins [1]. At the turn of the century, several groups almost simultaneously came to the conclusion that there are functionally active proteins that do not have an ordered structure. The existence of such functional intrinsically disordered proteins (IDRs) and hybrid proteins containing ordered domains and intrinsically disordered protein regions (IDPRs) that do not have a stable 3D structure has led to the new view at the paradigm about the relationship between unique protein structure and its function that has prevailed for more than 100 years [2]. In fact, the structure of a IDPs/IDPRs can be described as a highly dynamic conformational ensemble representing a dynamic equilibrium between different conformers separated by negligible energy barriers. As a result, any slight change in external conditions (e.g., temperature, ionic strength of the solution, interaction with a partner, post-translational modifications, etc.) can lead to a significant change in the energy surface of the protein. This ensures the multifunctionality of IDPs/IDPRs. The degree and penetrance of disorder in a protein can be different, where the proteins can be disordered to different degree. Some proteins are disordered as a whole, whereas others are known as hybrid proteins, as they contain ordered regions/domains and IDPRs that also can be differently disordered [3].
IDPs are commonly multifunctional, often acting as primarily regulatory and signaling proteins; i.e., proteins that are involved in a large number of low affinity – high specificity interactions and which require more structural flexibility to perform their multiple function. As the proteomes become more complex, their proportions of proteins with functional IDPRs increase. Thus, if for the bacteria and archaea the share of IDPs and IDPRs does not typically exceed 30%, then in the eukaryotic proteome more than half of the proteins are disordered to some extent. The sequences of IDPs are of low complexity and often contains numerous charged and polar residues, being depleted in hydrophobic residues [2].
Low energy barriers between different conformers make it possible for the same polypeptide chain to have a different structure at different times. This provides a mosaic heterogeneity of the spatial-temporal organization of IDPs, the structure of which is a complex combination of foldons (independently folding structural units), inducible foldons (disordered regions that (partially) fold upon interaction with a partner), inducible morphing foldons (disordered regions that acquire a different structure when interacting with various partners), non-foldons (non-folding sections of the protein), semifoldons (protein segments that are always in a semifolded state), unfoldons (ordered regions that need to (at least partially) unfold into a disordered state in order to carry out functional activity [4]. An ensemble of IDPs is a set of protein molecules containing dynamic collection of variously folded/disordered functional elements. This determines the multifunctionality of IDPs/IDPRs, a wide range of their partners, as well as a significant dependence of the characteristics of the ensemble of IDPs molecules on external conditions. This makes it possible to consider IDPs/IDPRs as systems operating "on the edge of chaos" – the region between an ordered and a disordered state characterized by largest a minimal impact on such systems can significantly change their properties and evolution over time [5]. The stochasticity of IDPs determines the probabilistic nature of their interaction with partners. Thus, according to the new model of transcription activation proposed by Alexander Erkine, the interaction of disordered transcription activation domains with promoters, which causes chromatin rearrangement, has a pronounced stochastic character [6].
Revolutionary changes in understanding of the complex relationships between the structure and function of proteins were followed by the revolutionary changes in understanding of the spatiotemporal organization of intracellular space [1]. The paradigm of rigid compartmentalization of the intracellular space into a series of well-recognized membrane-embedded organelles was replaced by the understanding that a significant part of cellular processes is determined by the functioning of liquid-droplet-like condensates – membrane-less organelles (MLOs) [7]. The formation of MLOs is linked to the property of polymers to separate into phases under the conditions of macromolecular crowding, and this process can be controlled by various external factors and environmental changes (changes in temperature, pH, ionic strength of the solution, and a number of other factors) [8]. These structures can be considered as a metastable condensed state of the intracellular matter.
IDPs and IDPRs play a decisive role in liquid–liquid phase separation (LLPS) leading to the formation of MLOs. As a rule, IDPs/IDPRs contain blocks of the same type of amino acid residues, multiple weak interactions between which (electrostatic, π-π, cation-π, etc.) under conditions of macromolecular crowding often initiate the transition of IDPs to the liquid-droplet phase [4,8]. The absence of a membrane determines the dynamics of MLOs and their composition; however, under certain conditions, MLOs are able to form stable hydrogels and even insoluble aggregates. In particular, a number of neurodegenerative diseases are associated with the formation of stress granules by mutant proteins and the formation of amyloid fibrils in them [9].
Weak non-specific inter- and intramolecular interactions of disordered polymers, primarily IDPs and RNA, play a central role in initiating the formation of MLOs and in the regulation of their composition and functional activity. In some cases, the "maturation" process of MLOs is accompanied by "liquid-gel” transition of their structure, where other types of interactions can play a significant role [10,11].
In this work, we analyzed the propensity for spontaneous phase separation of the proteomes of two MLOs formed in response to stress in the nucleolus, which have a partially overlapping composition, but different functional activity and morphology: A-bodies (amyloid bodies) and nuclear stress bodies [12,13].
In response to various types of stress, the formation of RNA-protein condensates containing non-coding RNA (rIGSRNA) from the intergenic spacer region (IGS) of the rDNA cassette is induced in the cells of some eukaryotes [14]. Initially, these condensates have liquid droplet characteristics, but subsequently transform into amyloid-like structures, the so-called A-bodies, containing a number of proteins in the fibrillar state [15,16,17]. The marker proteins of these structures are von Hippel-Lindau tumor suppressor protein (VHL) and Cell division cycle 73 (CDC 73) [18].
It is assumed that rIGSRNAs (rIGSRNA16, rIGSRNA22 - heat shock, rIGSRNA28 - acidosis) expressed in response to a specific stress interact with positively charged regions of some proteins, in particular, VHL, resulting in the formation of condensates, which eventually turn into aggregates of amyloid fibrils [17,18,19]. rIGSRNAs are formed by repeating [TC]n or [GA]n sequences and probably do not have a pronounced secondary structure. In this regard, rIGSRNAs are probably capable of spontaneous phase separation with subsequent recruitment of proteins to the already pre-formed condensate [20,21].
Although A-bodies have a fibrillar structure, they are physiological and perform important biological functions. A-bodies include biogenesis and RNA processing factors, transcription factors, as well as proteins involved in the regulation of metabolism and cell cycle, for example, CDK1, POLD1, DNMT1 [19]. A-bodies are also involved in the local synthesis of nuclear proteins [22]. The A-bodies proteome is quite variable and significantly depends on the type of stress. It has been shown that only ~20% of proteins in the proteomes of A-body formed in response to heat shock and acidosis overlap [18].
In response to various types of stress, in the nucleoli of primate cells, according to a principle similar to A-bodies, another type of membrane-less organelles is formed: nuclear stress bodies (nSBs) [23]. Assembly of nSBs is initiated by activation of pericentric heterochromatin at the 9q12 locus under the control of heat shock transcription factor 1 (HSF1) and leads to transcription of long non-coding RNA (lncRNA) from pericentromeric repeat arrays of HSATIII chromosome 9. It is believed that such transcripts are foci of nSBs formation [24,25,26]. These organelles play an important role in the regulation of gene expression on a genome-wide scale due to the massive recruitment of histone acetylases (HATs) and transcription factors to nSBs [27], in the restoration of metabolic processes after stress exposure by promoting the repression of pre-mRNA splicing [28,29,30]. nSBs are dynamic liquid-droplet condensates; however, with an increase in the duration of stress exposure, these organelles gradually harden and can even form insoluble structures [23]. It is known that a large number of proteins are involved in the formation and functioning of nSBs. Approximately 140 proteins included to nSBs have been identified, many of which are RBPs and are involved in mRNA splicing, processing, and export [28].
Therefore, A-bodies and nSBs are largely similar organelles with an initially liquid droplet structure, formed in response to the same stimulus with the participation of noncoding RNA and having overlapping functions (RNA processing). It is believed that the initial stage of formation of both organelles is the accumulation of non-coding transcripts. However, the VHL A-body marker protein translocates into the nucleus in response to stress without interacting with RNA [31], and the HSF1 nSBs marker protein is capable of RNA-free LLPS under stress conditions. In this work, we performed a comparative analysis of the proteomes of these organelles for the propensity of their constituent proteins to spontaneous and phase separation that induced by interactions with partners, as well as to aggregation. This made it possible to obtain indirect data on the mechanisms of formation of these organelles.
2. Results
2.1. Global Disorder Analysis of Proteomes of A-Bodies and nSBs
First, we assembled proteomes of three nucleolar MLOs, such as A-bodies formed in response to heat shock or acidosis, and heat-induced nuclear stress bodies (nSBs). Then, proteomes of these MLOs were subjected to the global disorder analysis, were a set of commonly utilized disorder predictors was used to evaluate intrinsic disorder predispositions of these organelles. Results of these analyses are shown in Figure 1.
Overall, this analysis reveal high level of disorder in the proteomes of these MLOs. In fact, Figure 1A shows the results of the classification of the disorder status of these proteins based on the outputs of the per-residue disorder predictor PONDR® VSL2. This classification is based the accepted in the field practice to group proteins based on their PPDR values (where the percent of the predicted disordered residues (PPDR) reflects the content of residues with the disorder scores exceeding the 0.5 threshold) [32]. In this classification, proteins with PPDR < 10% are considered as ordered or mostly ordered; proteins with 10% ≤ PPDR < 30% are considered as moderately disordered; whereas proteins with the PPDR ≥ 30% are considered as highly disordered [32]. While conducting analysis of intrinsic disorder predisposition of query proteins, in addition to checking their PPDR levels, one should also look at the mean disorder scores (MDS) of the query proteins. This is because for a given protein, the MDS value does not always represent a direct reflection of its PPDR value. In fact, one can imagine a situation, were a protein with the PPDR of 100% might have the MDS ranging from 0.5 to 1.0, whereas a protein with the PPDR of 0% might have any MDS < 0.5. Taking MDS into account, proteins can be classified as highly ordered (MDS < 0.15), moderately disordered or flexible (MDS between 0.15 and 0.5) and highly disordered (MDS ≥ 0.5). Based on these classification criteria, none of the proteins analyzed in this study was predicted as ordered by both MDS and PPDR. In the proteomes of the acidosis- and heat-induced A-bodies, there were only 1.1% and 1.83% proteins predicted as mostly ordered based on their MDS values, whereas nSBs did not contain such proteins. Therefore, vast majority of proteins in A-bodies and all proteins in nSBs can be classified as either moderately or highly disordered. In fact, Figure 1A shows that the proteomes of the heat-induced A-bodies, acidosis-induced A-bodies, and NsBs contained 21.1%, 26.22% and 7.5% moderately disordered/flexible proteins (or proteins containing noticeable intrinsically disordered regions (IDRs) based on both their MDS and PPDR values (these are proteins located within the dark pink segment). Additional 17.8%, 20.73, and 13.5% of these proteomes were expected to be moderately disordered based on their MDS values (light pink segment), whereas 60.0%, 51.22%, and 78.9% of proteins in the proteomes of acidosis-induced A-bodies, heat-induced A-bodies, and nSBs, respectively, are expected to be highly disordered, being located within the red segment (see Figure 1A).
At the next stage, we utilized the ΔCH-ΔCDF plot (a tool that combines the outputs of two binary predictors (i.e., tools classifying proteins as mostly ordered or mostly disordered), charge-hydropathy (CH) plot and cumulative distribution function (CDF) plot, see Materials and Methods section) to gain further information on the global disorder status of query proteins. Based on their position within the ΔCH-ΔCDF phase space, proteins can be classified as mostly ordered, molten globule-like or hybrid, or highly. Figure 1B shows that 35.1%, 37.2%, and 22.6% of proteins in the in the proteomes of the acidosis-induced A-bodies, heat-induced A-bodies, and nSBs, respectively, are located within the bottom right corner that I expected to contain proteins predicted as ordered by both predictors. On the other hand, 30.3% (25.6%, and 19.5%) of these proteins are positioned within the bottom left corner, where one can find either compact but disordered molten globular proteins, or hybrid proteins containing high levels of ordered and disordered residues (i.e., proteins predicted to be ordered/compact by the CH-plot and disordered by the CDF analysis). In the top left corner, there are 32.4%, 32.9%, and 53.4% proteins that expected to be highly disordered and behave as native coils or native pre-molten globules in their unbound states, being predicted as disordered by both predictors. Finally, 2.2%, 4.3%, and 4.5% of proteins in the in the proteomes of the acidosis-induced A-bodies, heat-induced A-bodies, and nSBs are predicted as disordered by CH-plot and ordered by CDF analysis (these are located within the top right corner. Taken together, data shown in Figure 1 indicate that more than two-thirds of proteins from the three nucleolar MLOs analyzed in this study are expected to contain high disorder levels. Importantly, based on the numbers shown in Figure 1, these MLOs are expected to be significantly more disordered than human proteome [33]. In fact, similar PPDR-MDS analysis previously conducted for 20,317 manually curated human proteins revealed higher levels of mostly ordered proteins (5.5%) and noticeably lower levels of highly disordered proteins (39.8%). Similarly, based on the results of CH-CDF analysis, human proteome was shown to contain significantly higher number of ordered proteins (59.1%) and significantly smaller number of disordered proteins (12.3%), as compared to the 35.1%/37.2%/22.6% ordered and 32.4%/32.9%/53.4% of disordered proteins in the proteomes of the acidosis-induced A-bodies, heat-induced A-bodies, and nSBs, respectively.
2.2. Global Analysis of LLPS Predisposion of Proteomes of A-Bodies and nSBs
Next, we analyzed the global LLPS predisposition of proteins in three MLOs of interest. To this end, we evaluated their predispositions to undergo spontaneous LLPS by FuzDrop platform (https://fuzdrop.bio.unipd.it/predictor) [34,35,36] and compared them to the global disorder status of these proteins. Figure 2 represents results of this analysis and shows that very significant parts of the analyzed proteomes are expected to be present by the disordered proteins capable to drive LLPS. In fact, 54.5%, 40.2%, and 75.2% of proteins in the acidosis-induced A-bodies, heat-induced A-bodies, and nSBs are expected to have the probability of spontaneous liquid-liquid phase separation, pLLPS, exceeding the threshold of 0.6. Most of these proteins capable of spontaneous LLPS (85.0%, 81.8%, and 81.0%, respectively) were predicted to have PPDR values exceeding 50%, with almost all of these LLPS-prone proteins possessing PPDR values of at least 30%. Curiously, all three MLOs analyzed here contained noticeably more LLPS promoting proteins than the human proteome, where 37.2% proteins were previously reported as proteins, which can spontaneously phase separate [34]. Therefore, proteomes of the acidosis-induced A-bodies, heat-induced A-bodies, and nSBs contained 1.46-, 1.08- and 2.02-times more “droplet-driving” proteins than human proteome. Figure 2 also shows that although none of the mostly ordered (PPDR<10%) or moderately disordered (10% ≤ PPDR < 30%) in three MLOs is predicted to promote LLPS, not all highly disordered proteins are expected to serve as droplet drivers. In fact, of 144, 118, and 123 proteins with the PPDR ≥ 30% in the acidosis-induced A-bodies, heat-induced A-bodies, and nSBs, 46 (31.9%), 53 (44.9%), and 23 (18.7%) were not predicted as “droplet-driving” proteins. Even among the 103, 67, and 99 proteins with the PPDR ≥ 50%, 18 (17.5%), 14 (20.9%), and 8 (8.1%) were not identified as droplet promoters. These observations suggest that although all (or at least most) of the “droplet-driving” proteins are expected to be moderately or highly disordered, not all proteins with high levels of disorder can undergo spontaneous LLPS.
2.3. Heat Shock-Induced A-Bodies
In their 2019 paper, the authors identified at least 164 proteins that make up A-bodies formed in the nuclei of MCF-7 cells in response to the heat shock. The performed analysis showed that the share of extremely disordered proteins (PPDR ≥ 85%; marked here as IDPs) and proteins with high content of IDPRs (PPDR ≥ 50%; marked here as IDPRs) in the proteome of heat-induced A-bodies is about 41% (Figure 3A). Since remaining proteins are characterized by PPDR < 50%, they are defined here as ordered. Clearly, this classification is simpler than that used in the previous sections, but still it provides a reasonable low estimate of the penetrance of intrinsic disorder in the analyzed proteomes. This analysis indicates that the structure of only 7 proteins out of the entire studied proteome of the heat-induced A-bodies is more than 80% disordered. This is consistent with the data that only about 20% of the proteome (33 proteins) of such bodies can be attributed to proteins with an extremely high probability of spontaneous phase separation that exceeds 0.9 (Figure 3B).
These are mainly RNA-binding proteins involved in RNA processing, nuclear matrix proteins, components of the nuclear nucleoprotein complex (see Figure 4 and Figure 5).
Furthermore, approximately 50% of the proteins of the studied proteome are assigned by the FuzDrop predictor to the so-called droplet-client proteins; i.e., proteins that can be included into the already pre-formed condensates, or proteins that are potentially capable of the induced or assisted (but not spontaneous) liquid-liquid phase separation (Figure 6).
In addition, 17 proteins from the proteome of the heat shock-induced A-bodies are prone for aggregation. Basically, these are globular proteins with an ordered structure (Figure 6). According to the current model of A-bodies formation, the formation of these structures can be initiated by the complex coacervation of positively charged proteins and negatively charged rIGSRNAs. Indeed, about 65% of the proteins in the studied proteome of the heat shock-induced A-bodies are positively charged (Figure 6). However, the total charge of the proteins that make up the proteome of the heat shock-induced A-bodies is close to zero, and the most positively charged proteins are globular, hardly capable of LLPS.
2.4. Acidosis-Induced A-bodies
The work revealed 185 proteins that are part of A-bodies formed under hypoxic conditions (1% O2, pH 6.0) in human MCF-7 cells. It is known that the proteome of acidosis-induced A-bodies and heat-induced A-bodies overlaps only by 20%.
We have shown that the proportion of IDP and IDPRs in the proteome of acidosis-induced A-bodies is about 56%, which is 10% higher than the content of such proteins in heat-induced A-bodies (Figure 7A). At the same time, 25 proteins of the acidosis-induced A-bodies proteome are more than 80% disordered. 66 proteins (35.7%) that make up the studied proteome are highly likely to be predisposed to spontaneous LLPS (Figure 7B). As with heat-shock induced A-bodies, most of the LLPS-prone proteins that make up acidosis-induced A-bodies are RNA-binding proteins involved in RNA processing and splicing (Figure 8 and Figure 9).
According to the FuzDrop analysis, the number of driver proteins that make up the proteome of the acidosis-induced A-bodies is more than 1.5 times greater than the number of client proteins capable of only induced interactions with LLPS partners (Figure 10).
The proportion of the proteins predisposed for aggregation in the acidosis-induced A-bodies proteome (7.5%) is even lower than that found in the heat-induced A-bodies (Figure 10). At the same time, it seems that the proportion of positively charged proteins in the A-body proteome does not depend on the type of stress effect on the cell.
2.5. Heat-Induced Nuclear Stress Bodies (nSBs)
In the work, 133 proteins that are part of nSBs, which are formed under heat shock conditions in human HeLa cells, were identified. According to our analysis, almost 69% of the proteins that make up the nSBs proteome are disordered to some extent (Figure 11A). 25% of the nSBs proteome is represented by proteins whose degree of disorder exceeds 80%. 66% of the nSBs proteome is formed by proteins with a high probability of prone LLPS.
These are mainly RNA-binding proteins involved in mRNA processing, RNA splicing, and RNA export from the nucleus (Figure 12 and Figure 13).
According to the FuzDrop predictor, more than 70% of proteins prone to LLPS are represented by “driver” proteins; i.e., proteins capable of forming the framework of membrane-less organelles and initiating the formation of biomolecular condensates (Figure 14). More than 70% of the proteins that make up nSBs are positively charged. Less than 4% of the proteins that make up the nSBs proteome are prone to aggregation.
3. Discussion
A comparative analysis of the proteomes of A bodies formed in response to heat shock, acidosis, and nuclear stress bodies showed that the morphology of A bodies and nSBs correlates with the protein composition of these organelles. A-bodies - bodies that transform into fibrillar structures during their biogenesis, contain significantly fewer proteins prone to LLPS and have a disordered structure compared to nSBs, which normally have liquid droplet characteristics (Table 1).
The significant content of LLPS “client” proteins in the A-bodies proteome is consistent with the existing model for the formation of these organelles, according to which the formation of these organelles is initiated by the complex coacervation of rIGSRNAs with proteins. Apparently, it is rIGSRNAs molecules that play the role of LLPS “drivers” in the formation of A bodies. While the characteristics of the protein composition of nSBs suggest that the LLPS of the scaffold proteins of these organelles may be the initial stage in the formation of these bodies. It is known that HSF1, which initiates HSATIII transcription, is capable of reversible LLPS under heat shock conditions.
At the same time, according to our analysis, acidosis-induced A-bodies have more "liquid-droplet" properties compared to the heat shock-induced A-bodies and occupy an intermediate position between the nSBs and heat shock-induced A-bodies in almost all analyzed characteristics. It should be noted that even the number of proteins in common with nBs is higher in acidosis-induced A-bodies (Figure 15). We also identified 10 proteins that are simultaneously included in all three studied proteomes.
These are mainly RNA-binding proteins with a high degree of disorder and a tendency to LLPS, acting as phase separation drivers, not prone to amyloid formation (Table 2).
These proteins are components of heterogeneous ribonucleoprotein complexes that control pre-mRNA processing (HNRNPH1, HNRNPA0, HNRNPM, and HNRNPK), participate in splicing (CGI-74, RBM39, and DDX39), transcription, and ribosome biogenesis (DDX 39 and nucleolin). Hsc70 and PPIA are chaperones required for correct protein folding.
Although providing in-depth characterization of these proteins is outside the scopes of this study, some illustrative details of their structure, functional disorder and LLPS predisposition are summarized in Figure 16, Figure 17, and Figure 18, respectively.
Figure 16 represents 3D models generated for these 10 shared proteins by AlphaFold [37,38]. In line with the intrinsic disorder predisposition analysis (see Table 2), seven of these proteins are predicted to have very high levels of disorder as evidenced by the presence of yellow and orange “noodles” and cyan regions with low per-residue confidence scores.
Figure 17 provides further support to the highly disordered status of most of these shared proteins and shows that in addition to high levels of disorder, they contain multiple disorder-based protein-protein interaction sites known as molecular recognition features (MoRFs); i.e., disordered regions capable of at least partial folding as a result of interaction with specific binding partners.
Furthermore, all these proteins are heavily decorated by various posttranslational modifications (PTMs). Therefore, 10 proteins shared by the acidosis-induced A-bodies, heat-induced A-bodies, and nSBs are typical IDPs or hybrid proteins containing functionally important IDPRs. It is likely that these disorder-based features define multifunctionality of these proteins.
Figure 18 shows distribution of the residue-based droplet promoting probabilities within the sequences of these 10 proteins. According to this analysis, nine of these proteins are capable either of spontaneous LLPS or can act as droplet clients. The only exception is given by PPIA, which is not predicted to contain DPRs and shows low pLLPS value (see Table 2).
Curiously, according to the STRING database, these 10 proteins shared by the three nucleolar MLOs analyzed in this study (i.e., acidosis-induced A-bodies, heat-induced A-bodies, and nSBs) are expected to have both functional and physical associations, creating a rather dense network with the average local clustering coefficient of 0.772 and an average node degree of 5.6, a network, where 10 query proteins are connected by 28 interactions/associations (Figure 19).
We also used STRING platform to evaluate the global interactability of the resulting internal network; i.e., to create an external network that include proteins associated with these 10 proteins. The corresponding network was generated using custom confidence of 0.790 for minimal required interaction, which was selected to include the maximal amount of interactors (note that the number of interactors in STRING is limited to 500). The resulting interactome includes 494 nodes connected by 6907 edges. Therefore, this interactome is characterized by an average node degree of 28 and it shows an average local clustering coefficient of 0.653. The expected number of interactions for the set of proteins of its size is 2,531, indicating this PPI network centered at 10 proteins shared by acidosis-induced A-bodies, heat-induced A-bodies, and nSBs has significantly more interactions than expected (PPI enrichment p-value is < 10-16). Among the most significant biological processes ascribed to this interactome are Gene expression (GO:0010467; p-value = 4.63×10-116), RNA processing (GO:0006396; p-value = 8.30×10-115); RNA metabolic process (GO:0016070; p-value = 5.13×10-86); mRNA processing (GO:0006397; p-value = 1.35×10-85) and RNA splicing (GO:0008380; p-value = 1.58×10-84). Five most significant molecular functions of this interactome are RNA binding (GO:0003723; p-value = 5.32×10-132); Nucleic acid binding (GO:0003676; p-value = 9.42×10-78); Heterocyclic compound binding (GO:1901363; p-value = 2.14×10-66); Organic cyclic compound binding (GO:0097159; p-value = 1.52×10-65) and mRNA binding (GO:0003729; p-value = 8.74×10-56), whereas its five most significant cellular components are Protein-containing complex (GO:0032991; p-value = 3.23×10-97); Ribonucleoprotein complex (GO:1990904; p-value = 1.90×10-89); Nucleoplasm (GO:0005654; p-value = 1.54×10-87); Nucleus (GO:0005634; p-value = 4.86×10-83), and Nuclear lumen (GO:0031981; p-value = 2.13×10-81).
Furthermore, this interactome can be divided into three well-separated clusters (Figure 20). 227 proteins included into red cluster are linked by 2,207 edges. This cluster has an average node degree of 19.4 and is characterized by an average clustering coefficient of 0.744. Its proteins are involved in the following biological processes: Regulation of cellular response to heat (GO:1900034; p-value = 1.83×10-68); Protein folding (GO:0006457; p-value = 3.33×10-55); Transport of virus (GO:0046794; p-value = 9.02×10-54); Intracellular transport of virus (GO:0075733; p-value = 2.30×10-53) and Establishment of localization in cell (GO:0051649; p-value = 6.47×10-53).
Their most significant molecular functions are Heat shock protein binding (GO:0031072; p-value = 1.55×10-37); Unfolded protein binding (GO:0051082; p-value = 1.28×10⁻³³); Chaperone binding (GO:0051087; p-value = 9.58×10⁻³³); Protein binding (GO:0005515; p-value = 1.22×10⁻²⁹); and Structural constituent of nuclear pore (GO:0017056; p-value = 3.19×10⁻²⁴). The most significant cellular components of proteins from this cluster are Cytosol (GO:0005829; p-value = 4.51×10-41); Host cell (GO:0043657; p-value = 4.21×10-39); Protein-containing complex (GO:0032991; p-value = 2.12×10-37); Endomembrane system (GO:0012505; p-value = 4.72×10⁻³²), and Nuclear pore (GO:0005643; p-value = 2.26×10⁻³⁰).
Green cluster has 140 proteins connected by 1,904 edges. This cluster is characterized by the average node degree of 27.2 and average local clustering coefficient of 0.704. The most significant biological processes here are mRNA processing (GO:0006397; p-value = 1.39×10-135); RNA splicing (GO:0008380; p-value = 1.80×10-128); RNA processing (GO:0006396; p-value = 5.56×10-116); RNA splicing, via transesterification reactions (GO:0000375; p-value = 5.52×10-108), and mRNA splicing, via spliceosome (GO:0000398; p-value = 1.68×10-106). The most significant molecular functions of proteins in green cluster are RNA binding (GO:0003723; p-value = 2.04×10-114); Nucleic acid binding (GO:0003676; p-value = 1.60×10-80); mRNA binding (GO:0003729; p-value = 1.63×10-68); Binding (GO:0005488; p-value = 3.86×10⁻²³), and pre-mRNA binding (GO:0036002; p-value = 1.92×10⁻²¹). The most significant cellular components are Nucleoplasm (GO:0005654; p-value = 2.29×10-71); Spliceosomal complex (GO:0005681; p-value = 2.04×10-69); Ribonucleoprotein complex (GO:1990904; p-value = 4.14×10-66); Nuclear lumen (GO:0031981; p-value = 4.21×10-64), and Nuclear speck (GO:0016607; p-value = 9.89×10-57).
Finally, 127 proteins assembled into the blue cluster are linked by 1,494 edges. This cluster has an average node degree of 23.5 and is characterized by the average local clustering coefficient of 0.778. The most significant biological processes, in which these proteins take part are rRNA processing (GO:0006364; p-value = 1.77×10-60); Ribosome biogenesis (GO:0042254; p-value = 9.60×10-58); Ribonucleoprotein complex biogenesis (GO:0022613; p-value = 5.17×10-56); ncRNA processing (GO:0034470; p-value = 2.15×10-55), and RNA processing (GO:0006396; p-value = 2.03×10-46). Their most significant biological functions are RNA binding (GO:0003723; p-value = 2.75×10-50); Nucleic acid binding (GO:0003676; p-value = 3.47×10⁻³³); Heterocyclic compound binding (GO:1901363; p-value = 9.10×10⁻²⁶); Organic cyclic compound binding (GO:0097159; p-value = 2.38×10⁻²⁵); and snoRNA binding (GO:0030515; p-value = 6.51×10⁻¹⁸). These proteins are cellular components of Small-subunit processome (GO:0032040; p-value = 1.16×10-49); Nucleolus (GO:0005730; p-value = 1.16×10-49); Preribosome (GO:0030684; p-value = 1.40×10-49); Ribonucleoprotein complex (GO:1990904; p-value = 2.15×10-47); and Nuclear lumen (GO:0031981; p-value = 2.01×10-37).
Based on the results of our analysis, it follows that the machinery of A-bodies and nSBs aimed at mRNA processing, preservation of cell protein material, transcription, and, possibly, nuclear translation, at least partially overlaps. At the same time, the regulation of these processes is clearly organelle-specific. Perhaps this is due to the launch of specific stress response programs in specific stressful conditions.
4. Materials and Methods
4.1. Assmbly of the Datasets for the Analysis
4.2. Intrinsic Disorder Analysis
The disorder analysis of the studied proteins was carried out using the RIDAO online service [44] to predict disordered regions in proteins based on their amino acid sequences. This package combines the forecasts of several well-known disorder predictors, such as PONDR® VLXT [45], PONDR® VL3 [46], PONDR® VLS2B [47], PONDR® FIT [48], IUPred2 (Short) and IUPred2 (Long) [49,50]. In the case of a significant discrepancy between the results obtained by different predictors, the correctness of the protein structure disorder prediction was determined by the protein structure prediction using the AlphaFold2 algorithm [38].
The most consistent predictions of disorder for a large data set were generated by the PONDR® VSL2B algorithm. As a measure of the disorder of the protein structure, we used the percentage of predicted disordered residues (PPDRVSL2); i.e., the percentage of residues in the protein amino acid sequence, for which the predicted disorder score is higher than the threshold of 0.5. Such regions are defined by the algorithm as "probably disordered"
Next, we carried out a classification of proteins according to their degree of disorder. Proteins with a PPDRVSL2 value < 50% were classified as "Ordered". Proteins with 50 ≤ PPDRVSL2 < 85% were classified as Partially Disordered (IDRs), whereas proteins with the PPDRVSL2 ≥ 85% were classified as Disordered (IDPs). Note that this is a more conservative classification in comparison with accepted in the field criteria, where proteins with PPDR < 10% are considered as ordered or mostly ordered; proteins with 10% ≤ PPDR < 30% are considered as moderately disordered; whereas proteins with the PPDR ≥ 30% are considered as highly disordered [32]. Furthermore, proteins can be also classified based on their mean disorder scores (MDS) as highly ordered (MDS < 0.15), moderately disordered or flexible (MDS between 0.15 and 0.5) and highly disordered (MDS ≥ 0.5).
Next, the outputs of two binary predictors, the charge-hydropathy (CH) plot [51,52] and the cumulative distribution function (CDF) plot [52,53,54] were combined to conduct a CH-CDF analysis [54,55,56,57] that allows classification of proteins based on their position within the CH-CDF phase space as ordered (proteins predicted to be ordered by both binary predictors), putative native “molten globules” or hybrid proteins (proteins determined to be ordered/compact by CH, but disordered by CDF), putative native coils and native pre-molten globules (proteins predicted to be disordered by both methods), and proteins predicted to be disordered by CH-plot, but ordered by CDF.
Complementary disorder evaluations together with important disorder-related functional information were retrieved from the D2P2 database (http://d2p2.pro/) [58], which is a database of predicted disorder for a large library of proteins from completely sequenced genomes [58]. D2P2 database uses outputs of IUPred [49], PONDR® VLXT [45], PrDOS [59], PONDR® VSL2B [46,60], PV2 [58], and ESpritz [61]. The visual console of D2P2 displays 9 colored bars representing the location of disordered regions as predicted by these different disorder predictors. In the middle of the D2P2 plots, the blue-green-white bar shows the predicted disorder agreement between nine disorder predictors (IUPred, PONDR® VLXT, PONDR® VSL2, PrDOS, PV2, and ESpritz), with blue and green parts corresponding to disordered regions by consensus. Above the disorder consensus bar are two lines with colored and numbered bars that show the positions of the predicted (mostly structured) SCOP domains [39,40] using the SUPERFAMILY predictor [41]. Yellow zigzagged bar shows the location of the predicted disorder-based binding sites (MoRF regions) identified by the ANCHOR algorithm [42], whereas differently colored circles at the bottom of the plot show location of various PTMs assigned using the outputs of the PhosphoSitePlus platform [43], which is a comprehensive resource of the experimentally determined post-translational modifications.
4.3. Analysis of the Interctability of Proteins
Information on the interactability of 10mhuman proteins shared by the three nucleolar MLOs was retrieved by Search Tool for the Retrieval of Interacting Genes; STRING, http://string-db.org/. STRING generates a network of protein-protein interactions based on predicted and experimentally-validated information on the interaction partners [62]. In the corresponding network, the nodes correspond to proteins, whereas the edges show predicted or known functional associations. Seven types of evidence are used to build the corresponding network, where they are indicated by the differently colored lines: a green line represents neighborhood evidence; a red line – the presence of fusion evidence; a purple line – experimental evidence; a blue line – co-occurrence evidence; a light blue line – database evidence; a yellow line – text mining evidence; and a black line – co-expression evidence [62].
In this study, STRING was utilized in two different modes: to generate the inter-network protein-protein interactions (PPIs) between the 10 query proteins and to produce the global PPI network centered at these 10 proteins. Resulting PPI networks were further analyzed using STRING-embedded routines in order to retrieve the network-related statistics, such as: the number of nodes (proteins); the number of edges (interactions); average node degree (average number of interactions per protein); average local clustering coefficient (which defines how close the neighbors are to being a complete clique – if a local clustering coefficient is equal to 1, then every neighbor connected to a given node Ni is also connected to every other node within the neighborhood, and if it is equal to 0, then no node that is connected to a given node Ni connects to any other node that is connected to Ni); expected number of edges (which is a number of interactions among the proteins in a random set of proteins of similar size); and a PPI enrichment p-value (which is a reflection of the fact that query proteins in the analyzed PPI network have more interactions among themselves than what would be expected for a random set of proteins of similar size, drawn from the genome. It was pointed out that such an enrichment indicates that the proteins are at least partially biologically connected, as a group).
4.4. LLPS Prediction
The studied datasets were further analyzed for the propensity of their proteins to undergo liquid–liquid phase separation (LLPS) using FuzDrop [34] and PSPredictor [63] predictors. The propensity of the analyzed protein to LLPS was determined based on PSPredcitor score > 0.5 and FuzDrop score > 0.6. In the event of a discrepancy between the results of predicting the propensity to phase separation obtained using both predictors, the analyzed proteins were assigned to the “controversial LLPS” group.
The FuzDrop predictor also predicts the ability of a query protein to undergo LLPS spontaneously (droplet-driving proteins) or requiring additional interactions with LLPS partners to form droplets (droplet-clients). Proteins with the pLLPS ≥ 0.60 likely drive liquid-liquid phase separation. Proteins with the propensity for liquid-liquid phase separation (pLLPS) below the threshold of 0.6 but containing the droplet-promoting regions (DPRs), defined as consecutive residues with pDP ≥ 0.60, will likely serve as drop-let-clients.
4.5. Aggregation Propensity Prediction
Analysis of the propensity of the studied proteins to aggregation and the formation of amyloid fibrils was performed using the AggreScan package [64], which makes it possible to determine the so-called aggregation hot spots; i.e., areas of the protein that promote its aggregation. After preliminary analysis, it turned out that each protein in the studied datasets contained at least one such region. In this regard, the results of the performed analysis were supplemented using Normalized a4v Sequence Sum for 100 residues (Na4vSS) values, which reflect the average protein aggregation propensities of the sequences (Na4vSS>0) once corrected for their size.
In addition, the ability of the analyzed proteins to form amyloid fibrils was verified by searching the CPAD database, composed of experimentally confirmed proteins prone to aggregation [65].
4.6. Calculation of Protein Charge and Hydrophobicity
The charge of the studied proteins was determined at pH = 7 according to [51] as the average protein charge over the sequence, taking into account the charge of amino acids: R = 1, K = 1, H = 0.5, D = -1, E = -1. The hydrophobicity of the studied proteins was calculated and normalized according to the Kite and Doolittle scale.
5. Conclusions
Comparative analysis of the proteomes of heat shock-induced and acidosis-induced A-bodies and nuclear stress-bodies made it possible to correlate the propensity of their proteins to phase separation with the morphological and functional properties of these organelles. It was shown that in the series heat shock-induced A-bodies, acidosis-induced A-bodies, heat shock-induced nuclear stress bodies in the proteome of these organelles, the content of intrinsically disordered proteins and proteins that serves as LLPS drivers increases, whereas the content of the prone to aggregation proteins decreases. The performed analysis allows us to conclude that mRNA processing and maintenance of the native structure of sequestered proteins in these organelles is provided by the same cellular machinery.
Author Contributions
Conceptualization, V.N.U and A.V.F.; methodology, V.N.U.; validation, Y.I.M., A.A.G, A.S.F., I.M.K., K.K.T., V.N.U., and A.V.F.; formal analysis, Y.I.M., A.A.G, A.S.F., I.M.K., K.K.T., V.N.U., and A.V.F.; investigation, Y.I.M., A.A.G, A.S.F., I.M.K., K.K.T., V.N.U., and A.V.F.; data curation, Y.I.M., A.A.G, A.S.F., I.M.K., K.K.T., V.N.U., and A.V.F.; writing—original draft preparation, Y.I.M., V.N.U., and A.V.F.; writing—review and editing, Y.I.M., A.A.G, A.S.F., I.M.K., K.K.T., V.N.U., and A.V.F.; visualization, Y.I.M., V.N.U., and A.V.F.; supervision, V.N.U and A.V.F.; project administration, A.V.F.; funding acquisition, A.V.F. All authors have read and agreed to the published version of the manuscript.
Funding
This research was funded by Russian Science Foundation, grant number 21-75-10166 (A.V.F.).
Institutional Review Board Statement
Not applicable.
Informed Consent Statement
Not applicable.
Data Availability Statement
We encourage all authors of articles published in MDPI journals to share their research data. In this section, please provide details regarding where data supporting reported results can be found, including links to publicly archived datasets analyzed or generated during the study. Where no new data were created, or where data is unavailable due to privacy or ethical restrictions, a statement is still required. Suggested Data Availability Statements are available in section “MDPI Research Data Policies” at https://www.mdpi.com/ethics.
Conflicts of Interest
The authors declare no conflict of interest. The funders had no role in the design of the study; in the collection, analyses, or interpretation of data; in the writing of the manuscript; or in the decision to publish the results.
References
- Antifeeva, I.A.; Fonin, A.V.; Fefilova, A.S.; Stepanenko, O.V.; Povarova, O.I.; Silonov, S.A.; Kuznetsova, I.M.; Uversky, V.N.; Turoverov, K.K. Liquid–liquid phase separation as an organizing principle of intracellular space: overview of the evolution of the cell compartmentalization concept. Cellular and Molecular Life Sciences 2022, 79. [Google Scholar] [CrossRef] [PubMed]
- Uversky, V.N. Intrinsically Disordered Proteins and Their “Mysterious” (Meta)Physics. Front Physics 2019, 7. [Google Scholar] [CrossRef]
- Uversky, V.N. Functional roles of transiently and intrinsically disordered regions within proteins. The FEBS journal 2015, 282, 1182–1189. [Google Scholar] [CrossRef] [PubMed]
- Uversky, V.N. Intrinsically disordered proteins in overcrowded milieu: Membrane-less organelles, phase separation, and intrinsic disorder. Current opinion in structural biology 2016, 44, 18–30. [Google Scholar] [CrossRef]
- Turoverov, K.K.; Kuznetsova, I.M.; Fonin, A.V.; Darling, A.L.; Zaslavsky, B.Y.; Uversky, V.N. Stochasticity of Biological Soft Matter: Emerging Concepts in Intrinsically Disordered Proteins and Biological Phase Separation. Trends Biochem Sci 2019, 44, 716–728. [Google Scholar] [CrossRef]
- Erkine, A.M. ’Nonlinear’ Biochemistry of Nucleosome Detergents. Trends Biochem Sci 2018, 43, 951–959. [Google Scholar] [CrossRef]
- Shin, Y.; Brangwynne, C.P. Liquid phase condensation in cell physiology and disease. Science 2017, 357. [Google Scholar] [CrossRef]
- Brangwynne Clifford, P.; Tompa, P.; Pappu, Rohit V. Polymer physics of intracellular phase transitions. Nat Phys 2015, 11, 899–904. [Google Scholar] [CrossRef]
- Wolozin, B.; Ivanov, P. Stress granules and neurodegeneration. Nature reviews. Neuroscience 2019, 20, 649–666. [Google Scholar] [CrossRef]
- Fonin, A.V.; Silonov, S.A.; Fefilova, A.S.; Stepanenko, O.V.; Gavrilova, A.A.; Petukhov, A.V.; Romanovich, A.E.; Modina, A.L.; Zueva, T.S.; Nedelyaev, E.M. , et al. New Evidence of the Importance of Weak Interactions in the Formation of PML-Bodies. International Journal of Molecular Sciences 2022, 23. [Google Scholar] [CrossRef]
- Fonin, A.V.; Silonov, S.A.; Shpironok, O.G.; Antifeeva, I.A.; Petukhov, A.V.; Romanovich, A.E.; Kuznetsova, I.M.; Uversky, V.N.; Turoverov, K.K. The role of non-specific interactions in canonical and ALT-associated PML-bodies formation and dynamics. International Journal of Molecular Sciences 2021, 22. [Google Scholar] [CrossRef] [PubMed]
- Fefilova, A.S.; Fonin, A.V.; Vishnyakov, I.E.; Kuznetsova, I.M.; Turoverov, K.K. Stress-Induced Membraneless Organelles in Eukaryotes and Prokaryotes: Bird’s-Eye View. International Journal of Molecular Sciences 2022, 23. [Google Scholar] [CrossRef] [PubMed]
- Fefilova, A.S.; Antifeeva, I.A.; Gavrilova, A.A.; Turoverov, K.K.; Kuznetsova, I.M.; Fonin, A.V. Reorganization of Cell Compartmentalization Induced by Stress. Biomolecules 2022, 12. [Google Scholar] [CrossRef] [PubMed]
- Audas, T.E.; Jacob, M.D.; Lee, S. Immobilization of proteins in the nucleolus by ribosomal intergenic spacer noncoding RNA. Molecular cell 2012, 45, 147–157. [Google Scholar] [CrossRef] [PubMed]
- Gonzalez, I.L.; Sylvester, J.E. Complete sequence of the 43-kb human ribosomal DNA repeat: analysis of the intergenic spacer. Genomics 1995, 27, 320–328. [Google Scholar] [CrossRef] [PubMed]
- Kellermayer, M.S.; Karsai, A.; Benke, M.; Soós, K.; Penke, B. Stepwise dynamics of epitaxially growing single amyloid fibrils. Proc Natl Acad Sci U S A 2008, 105, 141–144. [Google Scholar] [CrossRef] [PubMed]
- Rambaran, R.N.; Serpell, L.C. Amyloid fibrils: abnormal protein assembly. Prion 2008, 2, 112–117. [Google Scholar] [CrossRef]
- Marijan, D.; Tse, R.; Elliott, K.; Chandhok, S.; Luo, M.; Lacroix, E.; Audas, T.E. Stress-specific aggregation of proteins in the amyloid bodies. FEBS letters 2019, 593, 3162–3172. [Google Scholar] [CrossRef]
- Audas, T.E.; Audas, D.E.; Jacob, M.D.; Ho, J.J.D.; Khacho, M.; Wang, M.; Perera, J.K.; Gardiner, C.; Bennett, C.A.; Head, T. , et al. Adaptation to Stressors by Systemic Protein Amyloidogenesis. Dev Cell 2016, 39, 155–168. [Google Scholar] [CrossRef]
- Wang, M.; Bokros, M.; Theodoridis, P.R.; Lee, S. Nucleolar Sequestration: Remodeling Nucleoli Into Amyloid Bodies. Frontiers in genetics 2019, 10, 1179. [Google Scholar] [CrossRef]
- Wang, M.; Tao, X.; Jacob, M.D.; Bennett, C.A.; Ho, J.J.D.; Gonzalgo, M.L.; Audas, T.E.; Lee, S. Stress-Induced Low Complexity RNA Activates Physiological Amyloidogenesis. Cell reports 2018, 24, 1713–1721. [Google Scholar] [CrossRef] [PubMed]
- Theodoridis, P.R.; Bokros, M.; Marijan, D.; Balukoff, N.C.; Wang, D.; Kirk, C.C.; Budine, T.D.; Goldsmith, H.D.; Wang, M.; Audas, T.E. , et al. Local translation in nuclear condensate amyloid bodies. Proc Natl Acad Sci U S A 2021, 118. [Google Scholar] [CrossRef] [PubMed]
- Biamonti, G.; Vourc’h, C. Nuclear stress bodies. Cold Spring Harbor perspectives in biology 2010, 2, a000695. [Google Scholar] [CrossRef] [PubMed]
- Akerfelt, M.; Morimoto, R.I.; Sistonen, L. Heat shock factors: integrators of cell stress, development and lifespan. Nature reviews. Molecular cell biology 2010, 11, 545–555. [Google Scholar] [CrossRef] [PubMed]
- Alastalo, T.P.; Hellesuo, M.; Sandqvist, A.; Hietakangas, V.; Kallio, M.; Sistonen, L. Formation of nuclear stress granules involves HSF2 and coincides with the nucleolar localization of Hsp70. Journal of cell science 2003, 116, 3557–3570. [Google Scholar] [CrossRef] [PubMed]
- Valgardsdottir, R.; Chiodi, I.; Giordano, M.; Rossi, A.; Bazzini, S.; Ghigna, C.; Riva, S.; Biamonti, G. Transcription of Satellite III non-coding RNAs is a general stress response in human cells. Nucleic Acids Res 2008, 36, 423–434. [Google Scholar] [CrossRef] [PubMed]
- Col, E.; Hoghoughi, N.; Dufour, S.; Penin, J.; Koskas, S.; Faure, V.; Ouzounova, M.; Hernandez-Vargash, H.; Reynoird, N.; Daujat, S. , et al. Bromodomain factors of BET family are new essential actors of pericentric heterochromatin transcriptional activation in response to heat shock. Scientific reports 2017, 7, 5418. [Google Scholar] [CrossRef]
- Ninomiya, K.; Adachi, S. LncRNA-dependent nuclear stress bodies promote intron retention through SR protein phosphorylation. Embo j 2020, 39, e102729. [Google Scholar] [CrossRef]
- Ninomiya, K.; Iwakiri, J.; Aly, M.K.; Sakaguchi, Y.; Adachi, S.; Natsume, T.; Terai, G.; Asai, K.; Suzuki, T.; Hirose, T. m(6) A modification of HSATIII lncRNAs regulates temperature-dependent splicing. EMBO J 2021, 40, e107976. [Google Scholar] [CrossRef]
- Sandqvist, A.; Björk, J.K.; Akerfelt, M.; Chitikova, Z.; Grichine, A.; Vourc’h, C.; Jolly, C.; Salminen, T.A.; Nymalm, Y.; Sistonen, L. Heterotrimerization of heat-shock factors 1 and 2 provides a transcriptional switch in response to distinct stimuli. Mol Biol Cell 2009, 20, 1340–1347. [Google Scholar] [CrossRef]
- Mekhail, K.; Khacho, M.; Carrigan, A.; Hache, R.R.; Gunaratnam, L.; Lee, S. Regulation of ubiquitin ligase dynamics by the nucleolus. The Journal of cell biology 2005, 170, 733–744. [Google Scholar] [CrossRef] [PubMed]
- Rajagopalan, K.; Mooney, S.M.; Parekh, N.; Getzenberg, R.H.; Kulkarni, P. A majority of the cancer/testis antigens are intrinsically disordered proteins. J Cell Biochem 2011, 112, 3256–3267. [Google Scholar] [CrossRef] [PubMed]
- Mohammed, A.S.; Uversky, V.N. Intrinsic Disorder as a Natural Preservative: High Levels of Intrinsic Disorder in Proteins Found in the 2600-Year-Old Human Brain. Biology (Basel) 2022, 11. [Google Scholar] [CrossRef] [PubMed]
- Hardenberg, M.; Horvath, A.; Ambrus, V.; Fuxreiter, M.; Vendruscolo, M. Widespread occurrence of the droplet state of proteins in the human proteome. Proc Natl Acad Sci U S A 2020, 117, 33254–33262. [Google Scholar] [CrossRef] [PubMed]
- Hatos, A.; Tosatto, S.C.E.; Vendruscolo, M.; Fuxreiter, M. FuzDrop on AlphaFold: visualizing the sequence-dependent propensity of liquid-liquid phase separation and aggregation of proteins. Nucleic Acids Res 2022, 50, W337–W344. [Google Scholar] [CrossRef]
- Vendruscolo, M.; Fuxreiter, M. Sequence Determinants of the Aggregation of Proteins Within Condensates Generated by Liquid-liquid Phase Separation. J Mol Biol 2022, 434, 167201. [Google Scholar] [CrossRef] [PubMed]
- Varadi, M.; Anyango, S.; Deshpande, M.; Nair, S.; Natassia, C.; Yordanova, G.; Yuan, D.; Stroe, O.; Wood, G.; Laydon, A. , et al. AlphaFold Protein Structure Database: massively expanding the structural coverage of protein-sequence space with high-accuracy models. Nucleic Acids Res 2022, 50, D439–D444. [Google Scholar] [CrossRef] [PubMed]
- Jumper, J.; Evans, R.; Pritzel, A.; Green, T.; Figurnov, M.; Ronneberger, O.; Tunyasuvunakool, K.; Bates, R.; Žídek, A.; Potapenko, A. , et al. Highly accurate protein structure prediction with AlphaFold. Nature 2021, 596, 583–589. [Google Scholar] [CrossRef]
- Andreeva, A.; Howorth, D.; Brenner, S.E.; Hubbard, T.J.; Chothia, C.; Murzin, A.G. SCOP database in 2004: refinements integrate structure and sequence family data. Nucleic Acids Res 2004, 32, D226–229. [Google Scholar] [CrossRef]
- Murzin, A.G.; Brenner, S.E.; Hubbard, T.; Chothia, C. SCOP: a structural classification of proteins database for the investigation of sequences and structures. J Mol Biol 1995, 247, 536–540. [Google Scholar] [CrossRef]
- de Lima Morais, D.A.; Fang, H.; Rackham, O.J.; Wilson, D.; Pethica, R.; Chothia, C.; Gough, J. SUPERFAMILY 1.75 including a domain-centric gene ontology method. Nucleic Acids Res 2011, 39, D427–434. [Google Scholar] [CrossRef] [PubMed]
- Meszaros, B.; Simon, I.; Dosztanyi, Z. Prediction of protein binding regions in disordered proteins. PLoS Comput Biol 2009, 5, e1000376. [Google Scholar] [CrossRef] [PubMed]
- Hornbeck, P.V.; Kornhauser, J.M.; Tkachev, S.; Zhang, B.; Skrzypek, E.; Murray, B.; Latham, V.; Sullivan, M. PhosphoSitePlus: a comprehensive resource for investigating the structure and function of experimentally determined post-translational modifications in man and mouse. Nucleic Acids Res 2012, 40, D261–270. [Google Scholar] [CrossRef] [PubMed]
- Dayhoff, G.W., 2nd; Uversky, V.N. Rapid prediction and analysis of protein intrinsic disorder. Protein science : a publication of the Protein Society 2022, 31, e4496. [Google Scholar] [CrossRef] [PubMed]
- Romero, P.; Obradovic, Z.; Li, X.; Garner, E.C.; Brown, C.J.; Dunker, A.K. Sequence complexity of disordered protein. Proteins 2001, 42, 38–48. [Google Scholar] [CrossRef] [PubMed]
- Peng, K.; Radivojac, P.; Vucetic, S.; Dunker, A.K.; Obradovic, Z. Length-dependent prediction of protein intrinsic disorder. BMC bioinformatics 2006, 7, 208. [Google Scholar] [CrossRef]
- Peng, K.; Vucetic, S.; Radivojac, P.; Brown, C.J.; Dunker, A.K.; Obradovic, Z. Optimizing long intrinsic disorder predictors with protein evolutionary information. Journal of bioinformatics and computational biology 2005, 3, 35–60. [Google Scholar] [CrossRef]
- Xue, B.; Dunbrack, R.L.; Williams, R.W.; Dunker, A.K.; Uversky, V.N. PONDR-FIT: a meta-predictor of intrinsically disordered amino acids. Biochim Biophys Acta 2010, 1804, 996–1010. [Google Scholar] [CrossRef]
- Dosztányi, Z.; Csizmok, V.; Tompa, P.; Simon, I. IUPred: web server for the prediction of intrinsically unstructured regions of proteins based on estimated energy content. Bioinformatics 2005, 21, 3433–3434. [Google Scholar] [CrossRef]
- Dosztanyi, Z.; Csizmok, V.; Tompa, P.; Simon, I. The pairwise energy content estimated from amino acid composition discriminates between folded and intrinsically unstructured proteins. J Mol Biol 2005, 347, 827–839. [Google Scholar] [CrossRef]
- Uversky, V.N.; Gillespie, J.R.; Fink, A.L. Why are "natively unfolded" proteins unstructured under physiologic conditions? Proteins 2000, 41, 415–427. [Google Scholar] [CrossRef] [PubMed]
- Oldfield, C.J.; Cheng, Y.; Cortese, M.S.; Brown, C.J.; Uversky, V.N.; Dunker, A.K. Comparing and combining predictors of mostly disordered proteins. Biochemistry 2005, 44, 1989–2000. [Google Scholar] [CrossRef] [PubMed]
- He, B.; Wang, K.; Liu, Y.; Xue, B.; Uversky, V.N.; Dunker, A.K. Predicting intrinsic disorder in proteins: an overview. 19, 929–949. [CrossRef] [PubMed]
- Xue, B.; Oldfield, C.J.; Dunker, A.K.; Uversky, V.N. CDF it all: consensus prediction of intrinsically disordered proteins based on various cumulative distribution functions. FEBS letters 2009, 583, 1469–1474. [Google Scholar] [CrossRef] [PubMed]
- Huang, F.; Oldfield, C.; Meng, J.; Hsu, W.L.; Xue, B.; Uversky, V.N.; Romero, P.; Dunker, A.K. Subclassifying disordered proteins by the CH-CDF plot method. Pac Symp Biocomput 2012, 128–139. [Google Scholar]
- Mohan, A.; Sullivan, W.J., Jr.; Radivojac, P.; Dunker, A.K.; Uversky, V.N. Intrinsic disorder in pathogenic and non-pathogenic microbes: discovering and analyzing the unfoldomes of early-branching eukaryotes. Mol Biosyst 2008, 4, 328–340. [Google Scholar] [CrossRef]
- Huang, F.; Oldfield, C.J.; Xue, B.; Hsu, W.L.; Meng, J.; Liu, X.; Shen, L.; Romero, P.; Uversky, V.N.; Dunker, A. Improving protein order-disorder classification using charge-hydropathy plots. BMC bioinformatics 2014, 15 Suppl 17, S4. [Google Scholar] [CrossRef]
- Oates, M.E.; Romero, P.; Ishida, T.; Ghalwash, M.; Mizianty, M.J.; Xue, B.; Dosztanyi, Z.; Uversky, V.N.; Obradovic, Z.; Kurgan, L. , et al. D(2)P(2): database of disordered protein predictions. Nucleic Acids Res 2013, 41, D508–516. [Google Scholar] [CrossRef]
- Ishida, T.; Kinoshita, K. PrDOS: prediction of disordered protein regions from amino acid sequence. Nucleic Acids Res 2007, 35, W460–464. [Google Scholar] [CrossRef]
- Obradovic, Z.; Peng, K.; Vucetic, S.; Radivojac, P.; Dunker, A.K. Exploiting heterogeneous sequence properties improves prediction of protein disorder. Proteins: Structure, Function, and Bioinformatics 2005, 61, 176–182. [Google Scholar] [CrossRef]
- Walsh, I.; Martin, A.J.; Di Domenico, T.; Tosatto, S.C. ESpritz: accurate and fast prediction of protein disorder. Bioinformatics 2012, 28, 503–509. [Google Scholar] [CrossRef] [PubMed]
- Szklarczyk, D.; Franceschini, A.; Kuhn, M.; Simonovic, M.; Roth, A.; Minguez, P.; Doerks, T.; Stark, M.; Muller, J.; Bork, P. , et al. The STRING database in 2011: functional interaction networks of proteins, globally integrated and scored. Nucleic Acids Res 2011, 39, D561–568. [Google Scholar] [CrossRef] [PubMed]
- Chu, X.; Sun, T.; Li, Q.; Xu, Y.; Zhang, Z.; Lai, L.; Pei, J. Prediction of liquid-liquid phase separating proteins using machine learning. BMC bioinformatics 2022, 23, 72. [Google Scholar] [CrossRef] [PubMed]
- Conchillo-Solé, O.; de Groot, N.S.; Avilés, F.X.; Vendrell, J.; Daura, X.; Ventura, S. AGGRESCAN: a server for the prediction and evaluation of "hot spots" of aggregation in polypeptides. BMC bioinformatics 2007, 8, 65. [Google Scholar] [CrossRef]
- Thangakani, A.M.; Nagarajan, R.; Kumar, S.; Sakthivel, R.; Velmurugan, D.; Gromiha, M.M. CPAD, Curated Protein Aggregation Database: A Repository of Manually Curated Experimental Data on Protein and Peptide Aggregation. PloS one 2016, 11, e0152949. [Google Scholar] [CrossRef]
Figure 1.
Evaluation of the global disorder predisposition of proteins in acidosis-induced A-bodies (yellow circles), heat shock-induced A-bodies (green circels), and nSBs (cyan circles). A. PONDR® VSL2 output. PONDR® VSL2 score is the mean disorder score (MDS) for a query protein. PONDR® VSL2 (%) is a percent of the predicted disordered residues (PPDR) in a query protein; i.e., the percent of residues with the disorder scores above 0.5. Color blocks indicate regions in which proteins are mostly ordered (blue and light blue), moderately disordered (pink and light pink), or mostly disordered (red), as per accepted classification (see the text). If the two parameters agree, the corresponding part of background is dark (blue or pink), whereas light blue and light pink reflect areas in which only one of these criteria applies. B. Charge-hydropathy and cumulative distribution function (CH-CDF) plot. The Y-coordinate is calculated as the distance of the corresponding protein from the boundary in the CH plot, whereas the X-coordinate is calculated as the average distance of the corresponding protein’s CDF curve from the CDF boundary. The quadrant that the protein is located determines its classification. Q1, protein predicted to be ordered by CH-plot and CDF. Q2, protein predicted to be ordered to by CH-plot and disordered by CDF-plot. Q3, protein predicted to be disordered by CH-plot and CDF. Q4, protein predicted to be disordered by CH-plot and ordered by CDF.
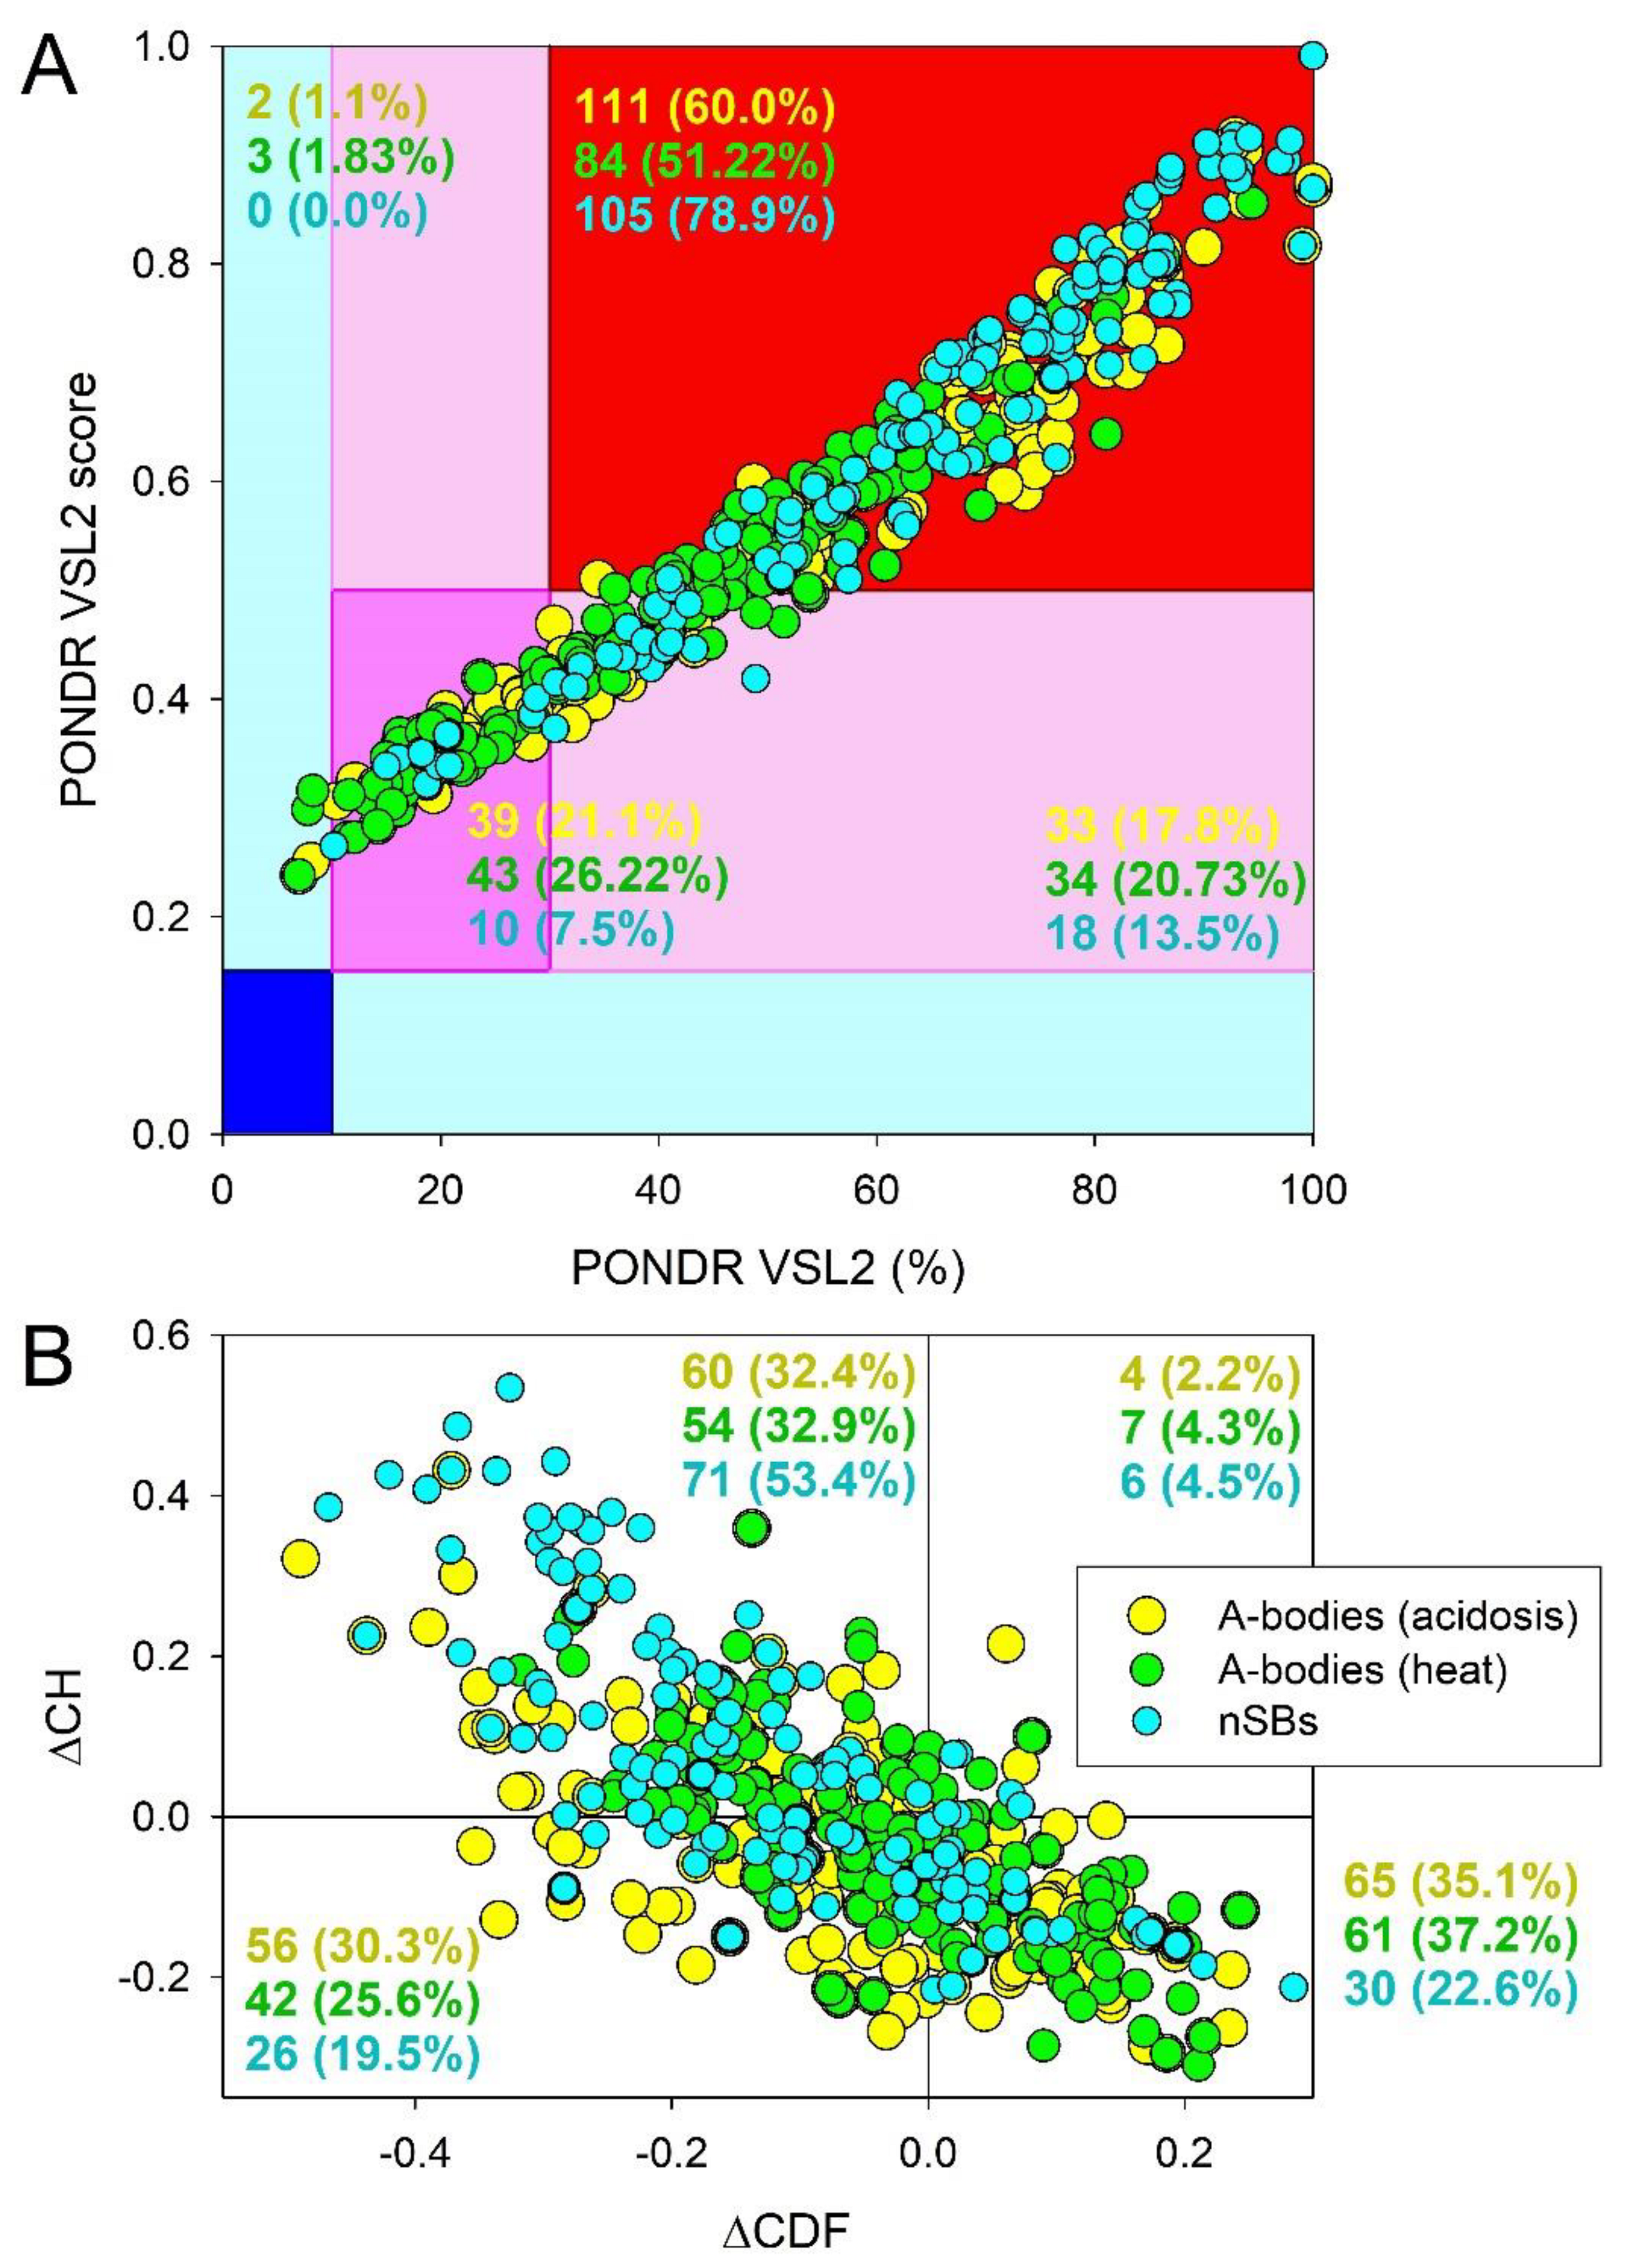
Figure 2.
Comparison of spontaneous LLPS predisposition as evaluated by FuzDrop and propensity for intrinsic disorder as predicted by PONDR® VSL2 of proteins in the proteomes of the acidosis-induced A-bodies, heat-induced A-bodies, and nSBs.
Figure 2.
Comparison of spontaneous LLPS predisposition as evaluated by FuzDrop and propensity for intrinsic disorder as predicted by PONDR® VSL2 of proteins in the proteomes of the acidosis-induced A-bodies, heat-induced A-bodies, and nSBs.
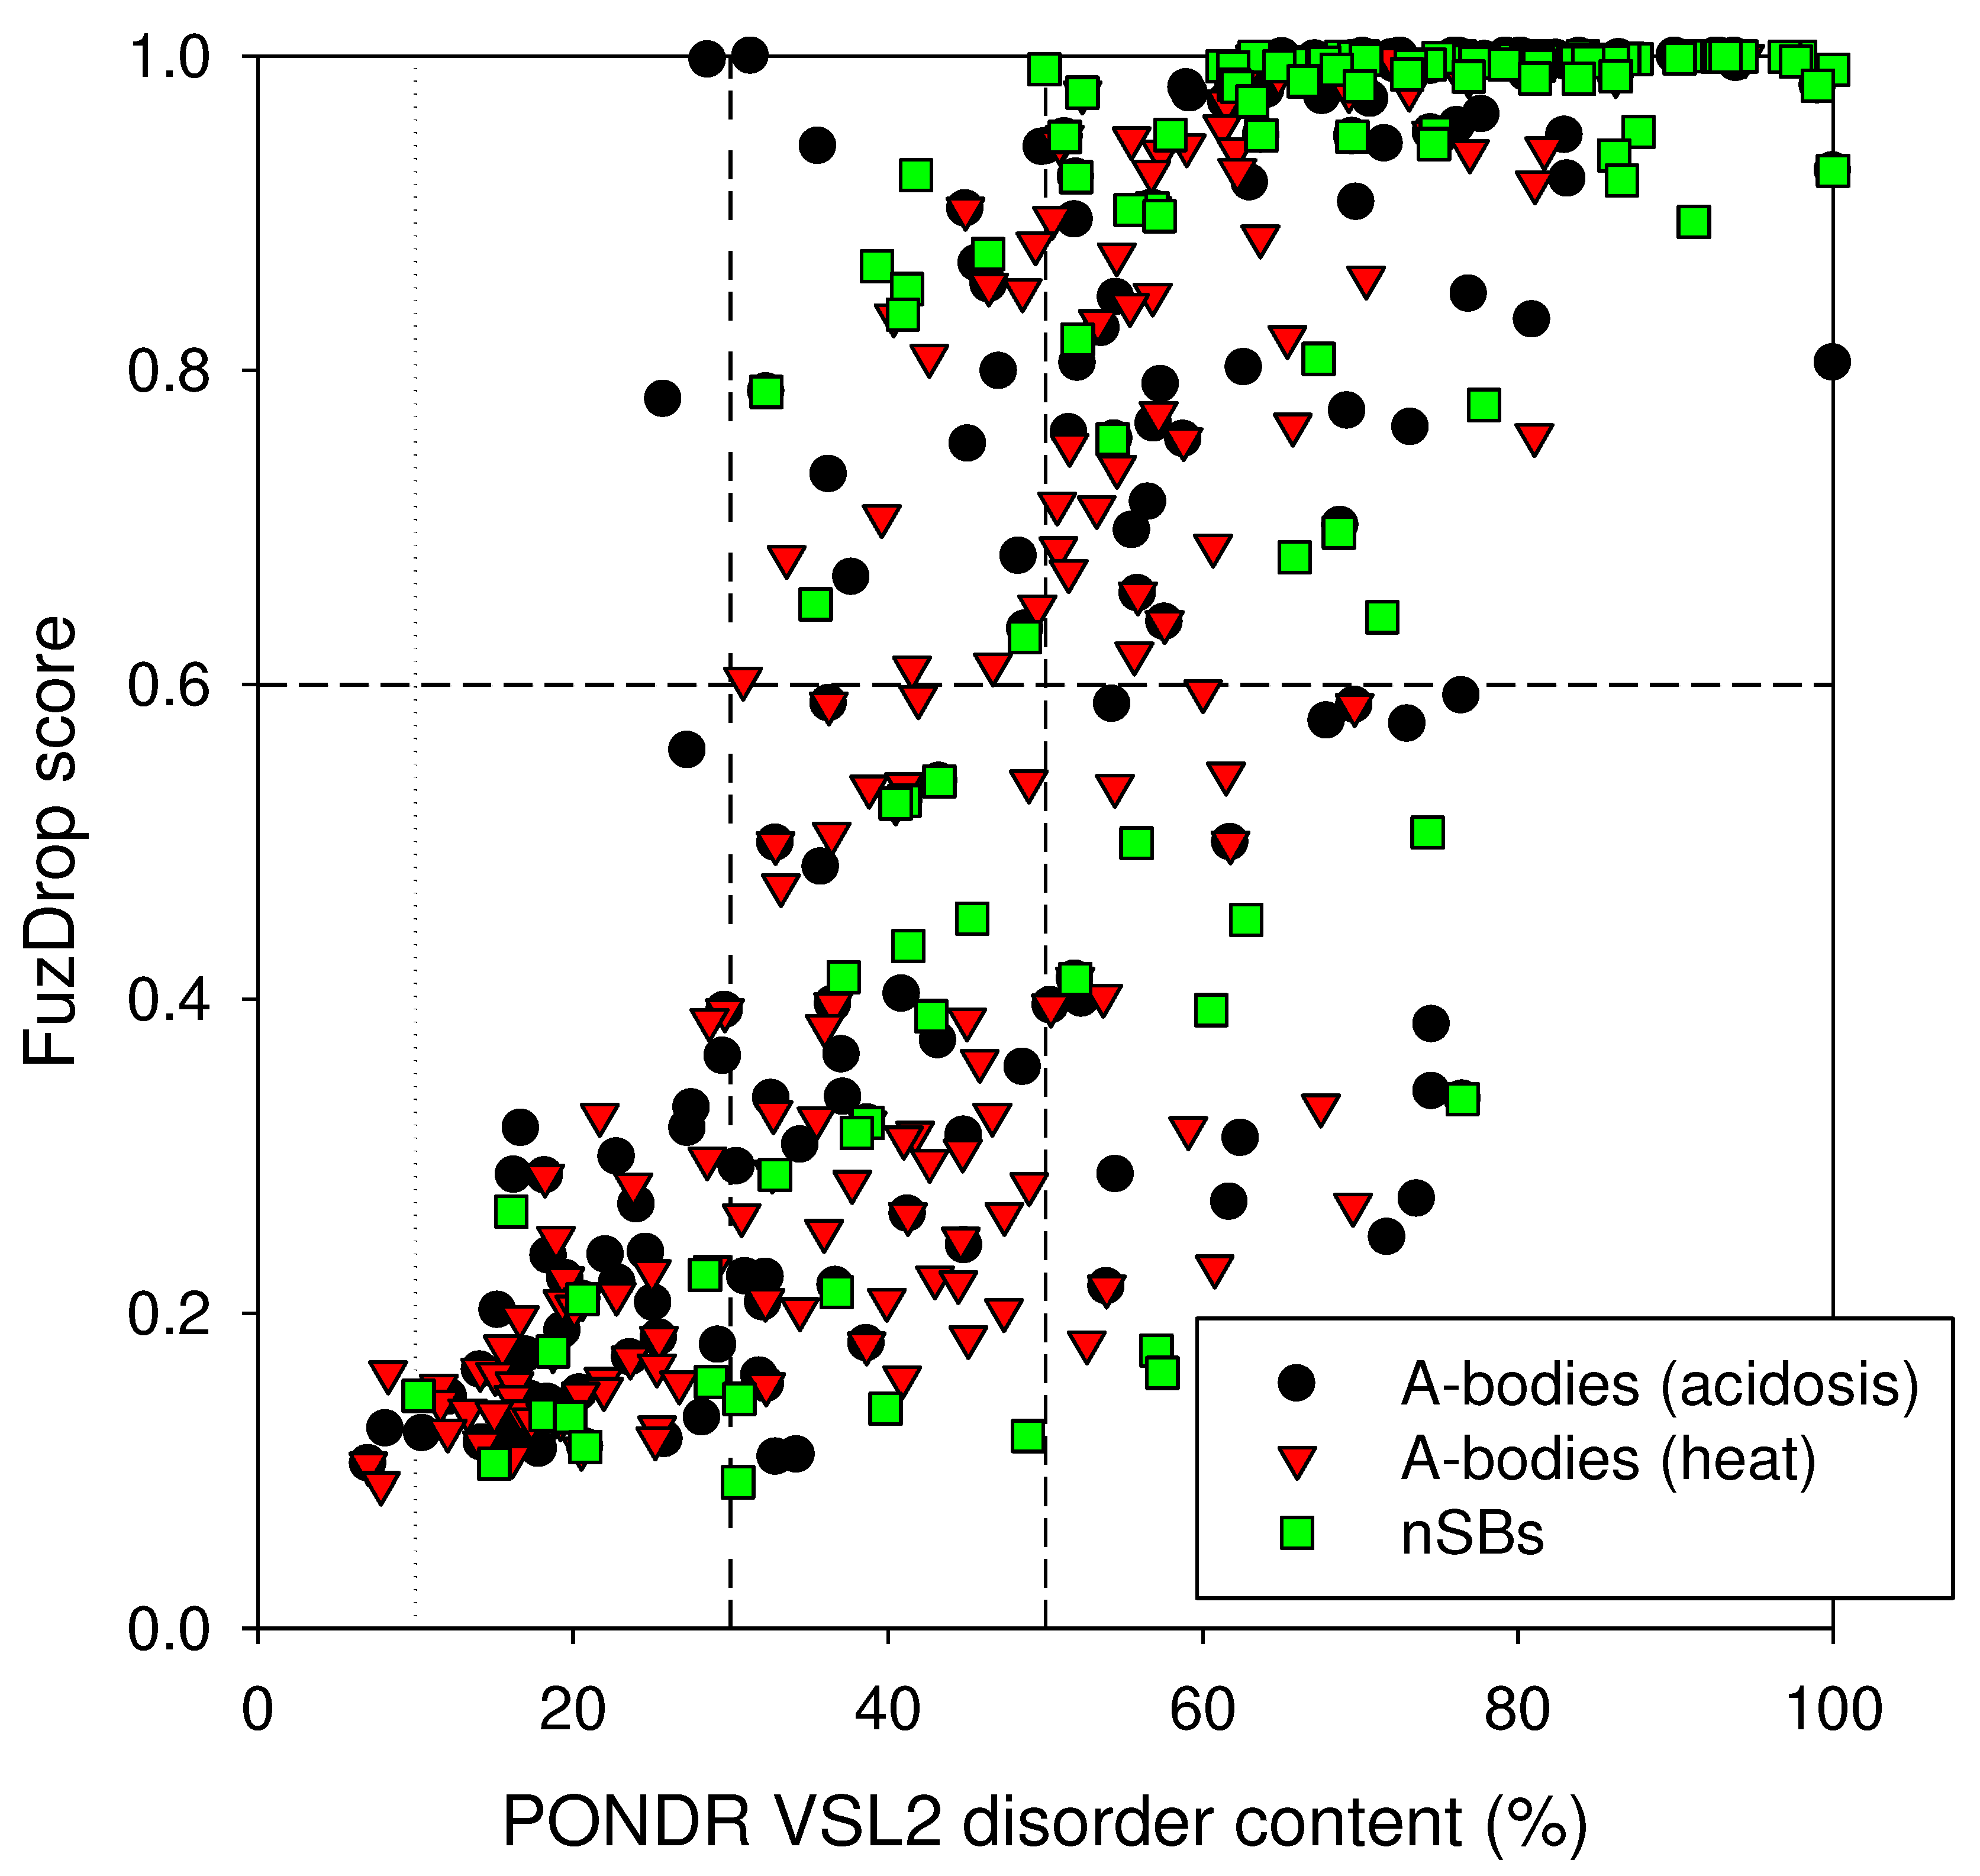
Figure 3.
Pie chart presenting identified the proportion of IDPs (Panel A) and LLPS-related proteins (Panel B) in the proteome of heat shock-induced A-bodies according to the PONDR® VSL2b and FuzDrop/PSP predictor analysis.
Figure 3.
Pie chart presenting identified the proportion of IDPs (Panel A) and LLPS-related proteins (Panel B) in the proteome of heat shock-induced A-bodies according to the PONDR® VSL2b and FuzDrop/PSP predictor analysis.
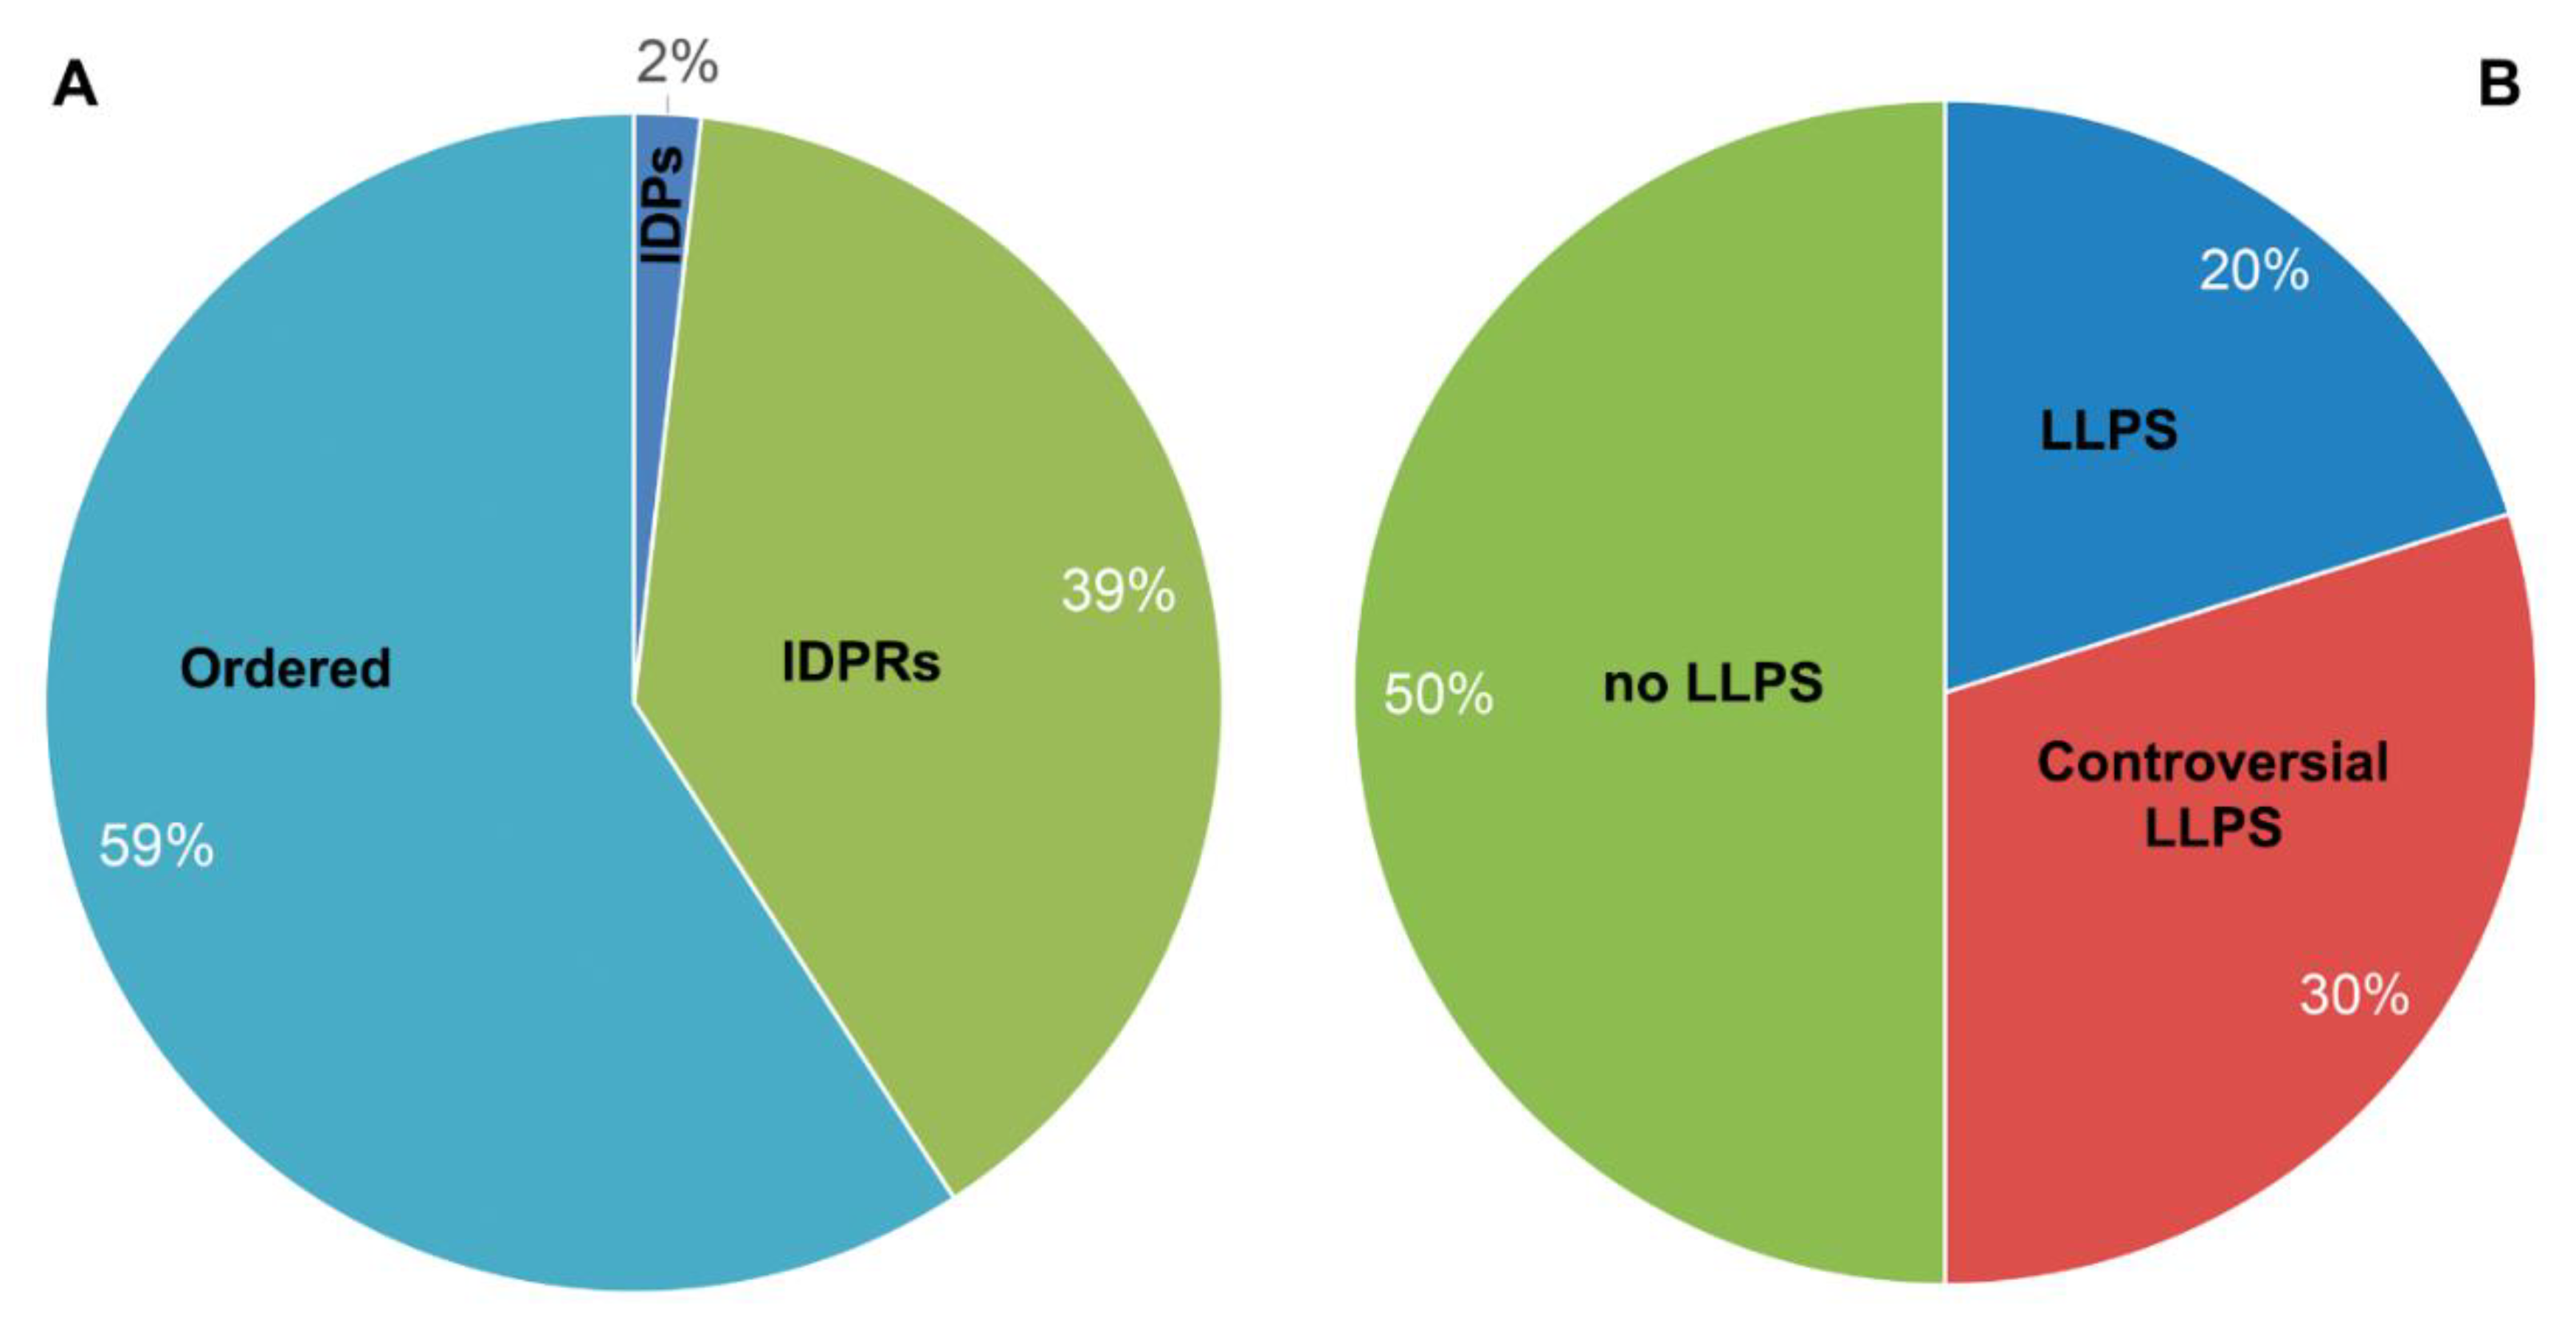
Figure 4.
Diagram presenting identified the molecular functions of LLPS-related proteins in heat shock-induced A-bodies proteome.
Figure 4.
Diagram presenting identified the molecular functions of LLPS-related proteins in heat shock-induced A-bodies proteome.
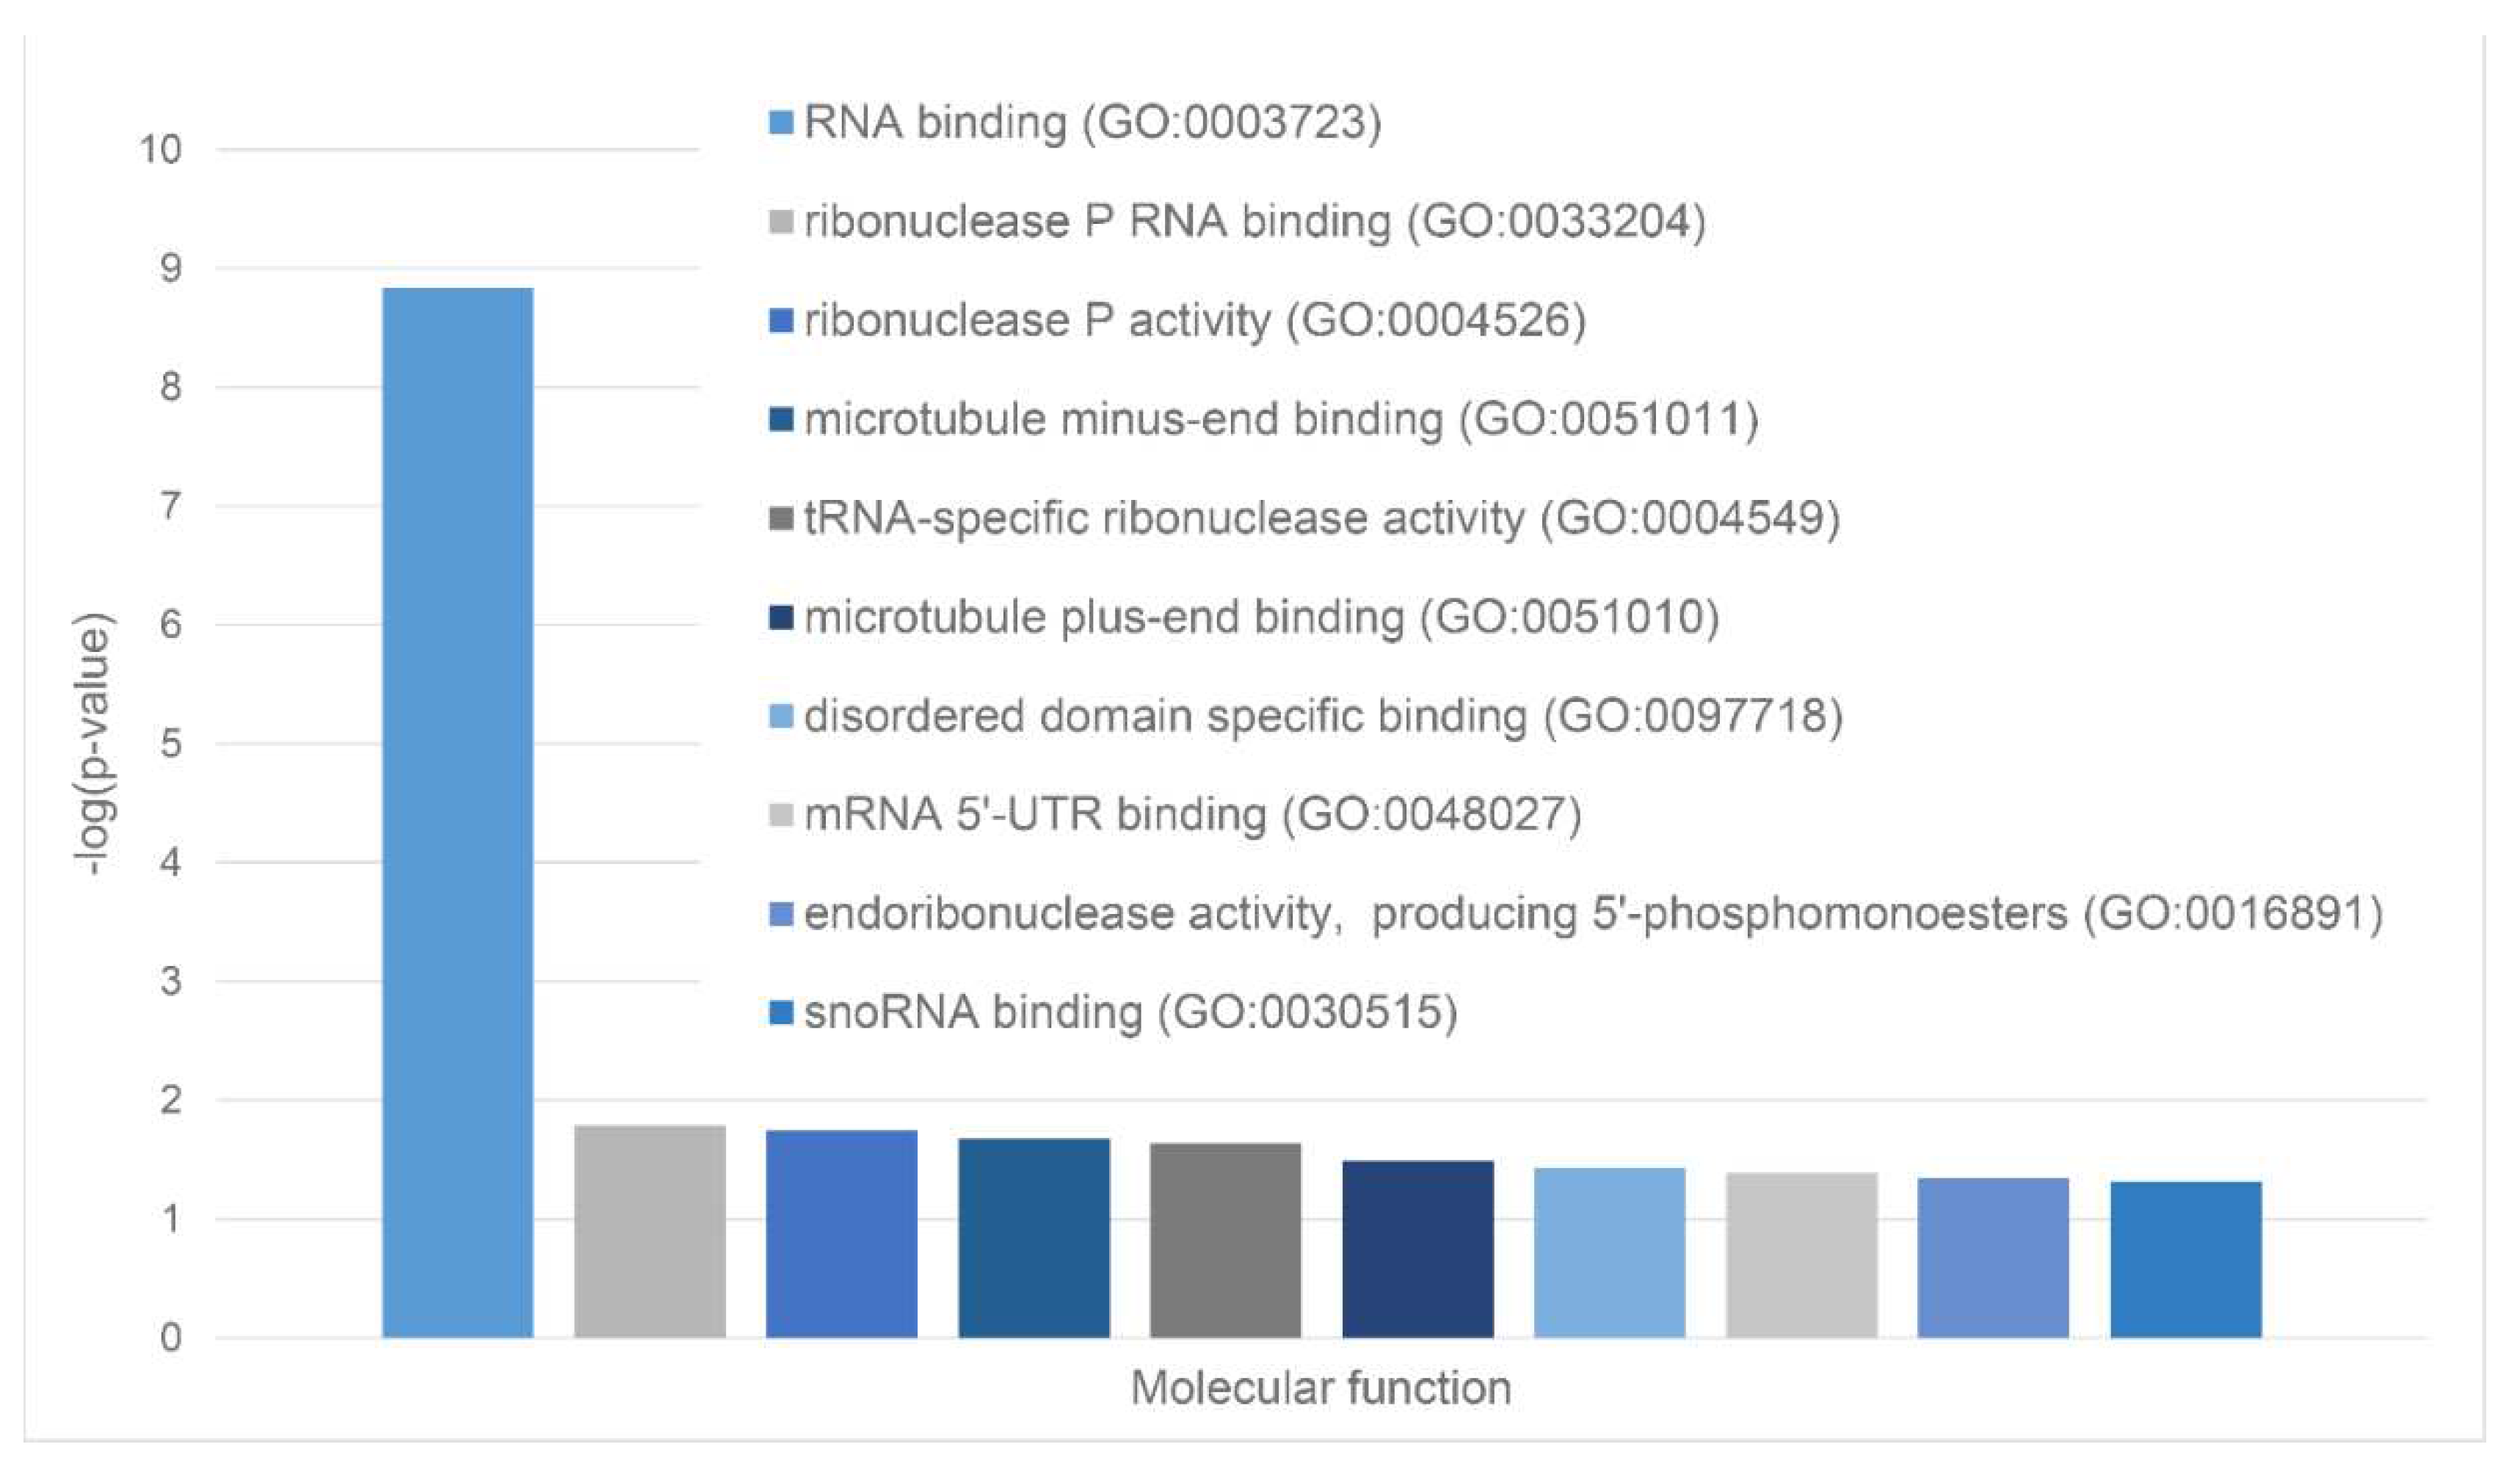
Figure 5.
Diagram presenting identified the biological processes that involve the LLPS-related proteins in heat shock-induced A-bodies proteome.
Figure 5.
Diagram presenting identified the biological processes that involve the LLPS-related proteins in heat shock-induced A-bodies proteome.
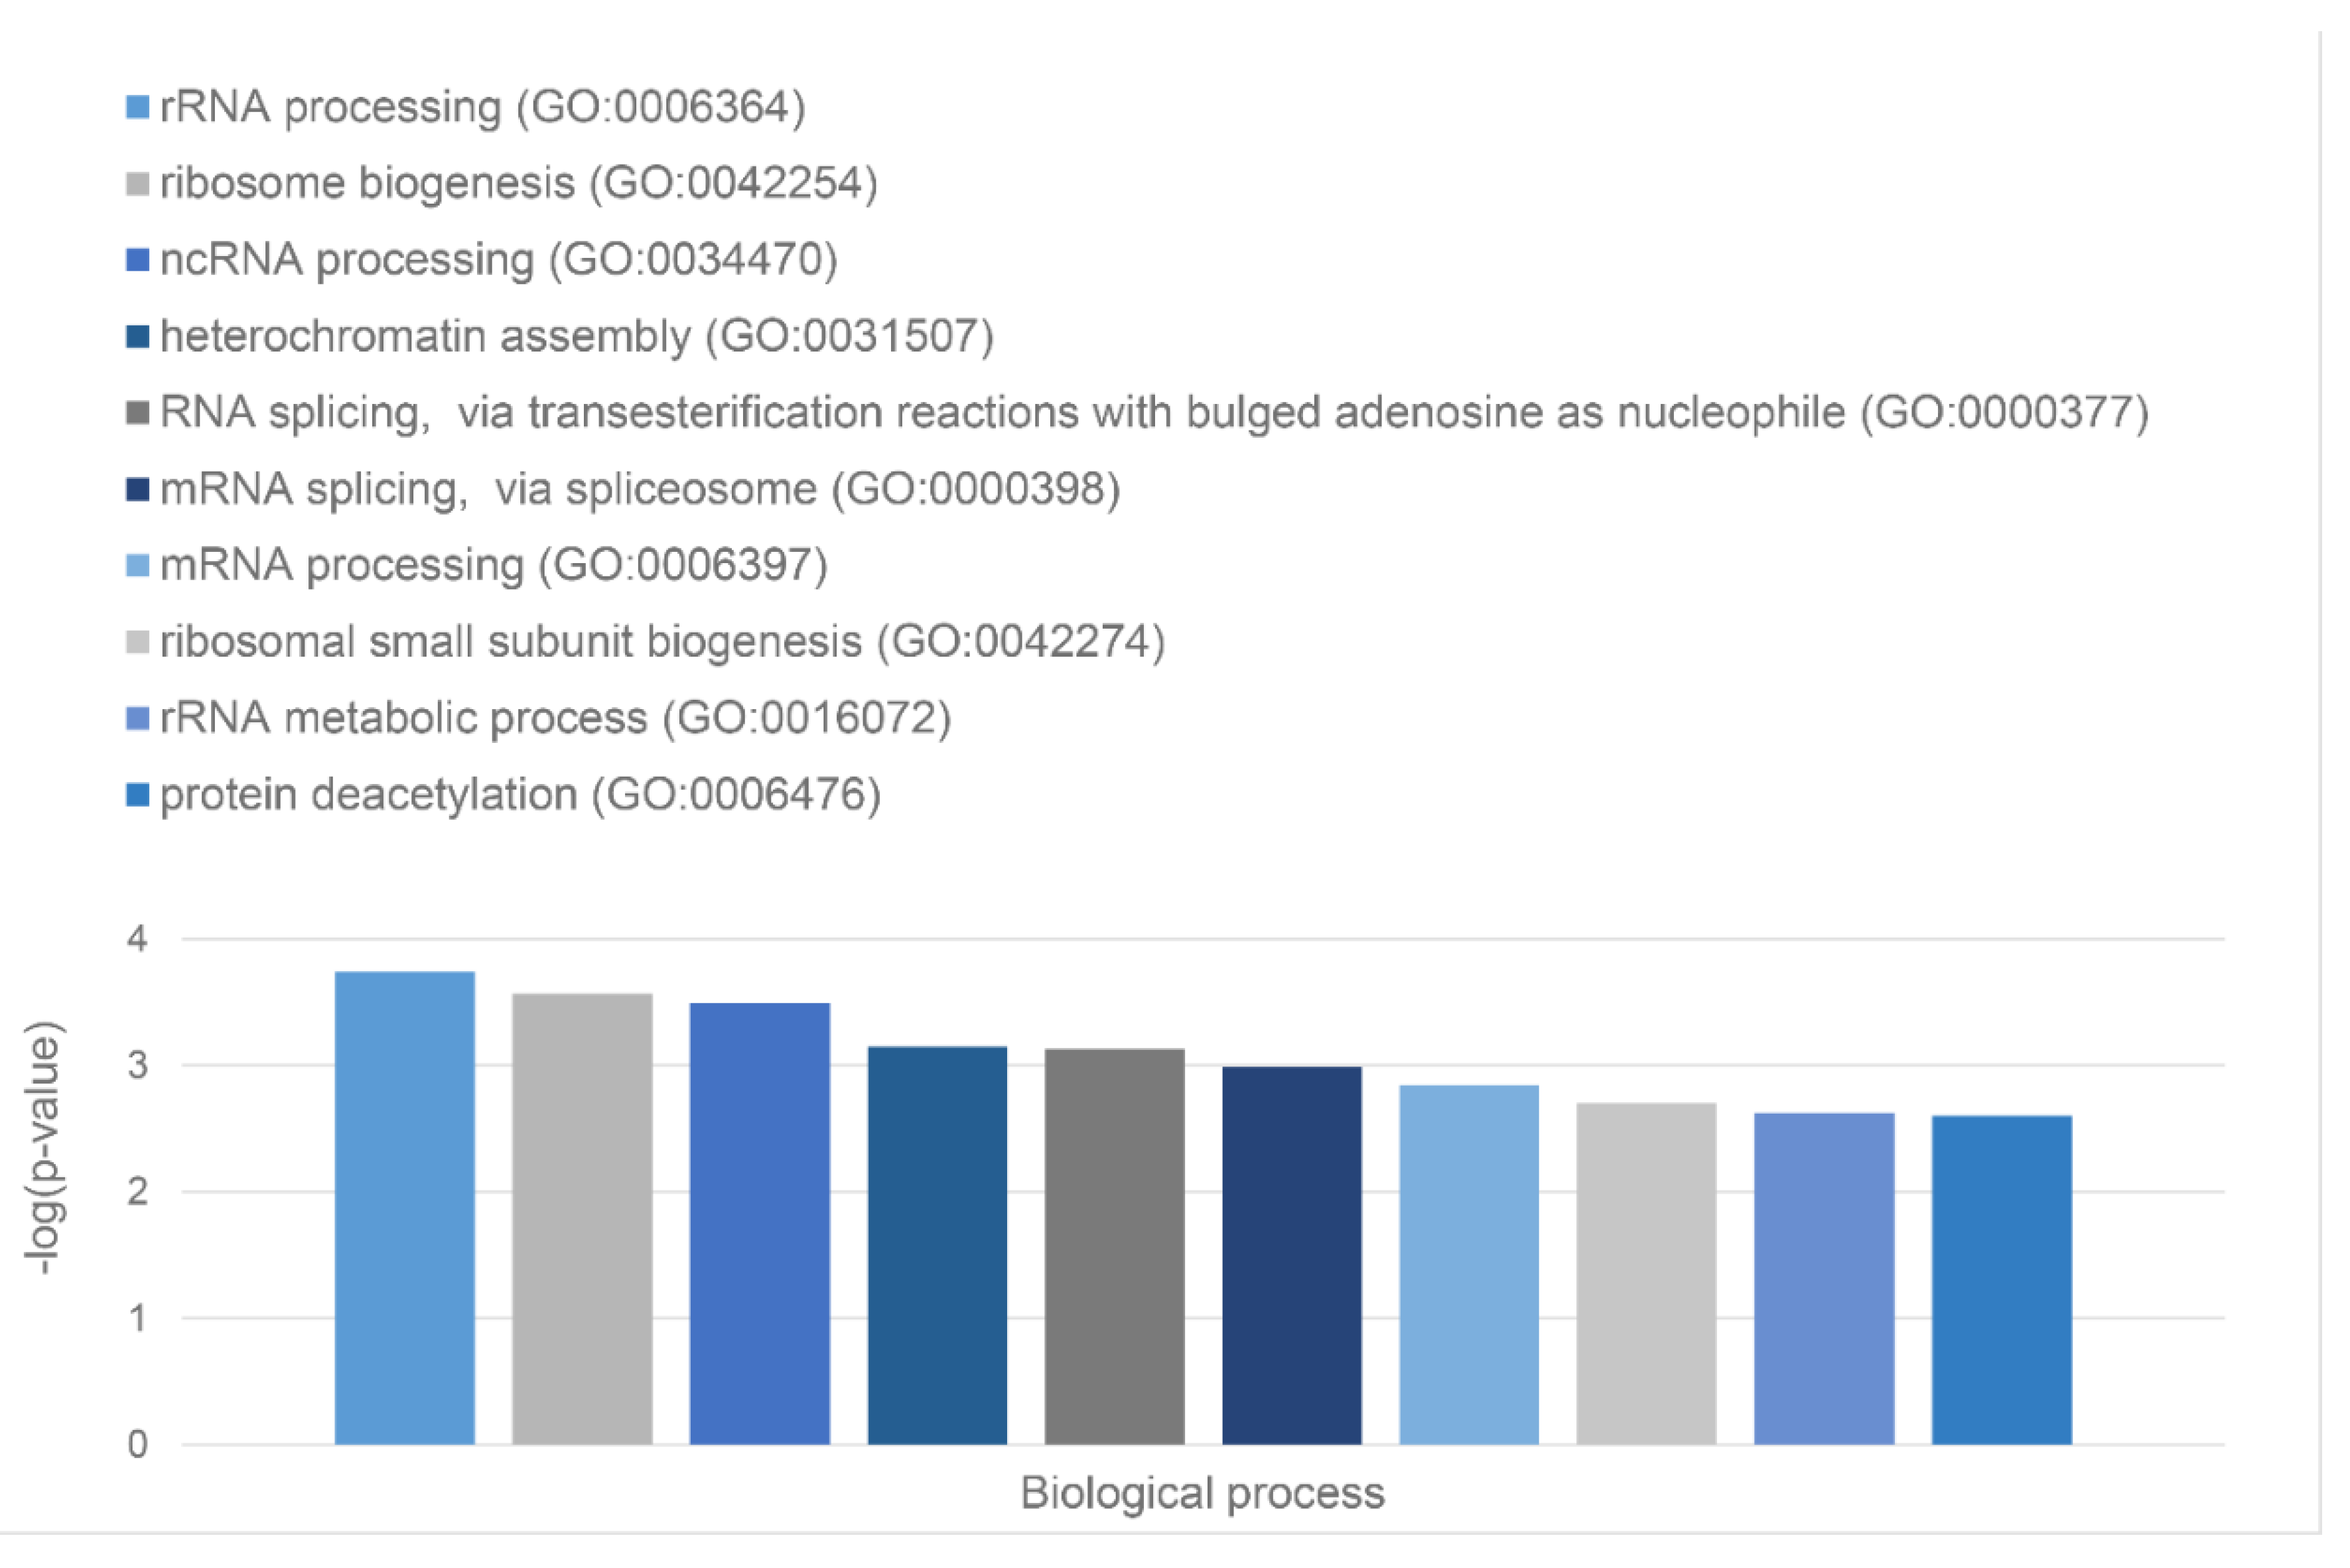
Figure 6.
Distribution of the proteins from the heat shock-induced A-bodies proteome based on protein disorder propensity, tendency to LLPS, roles in MLOs according to FuzDrop, and protein charge.
Figure 6.
Distribution of the proteins from the heat shock-induced A-bodies proteome based on protein disorder propensity, tendency to LLPS, roles in MLOs according to FuzDrop, and protein charge.
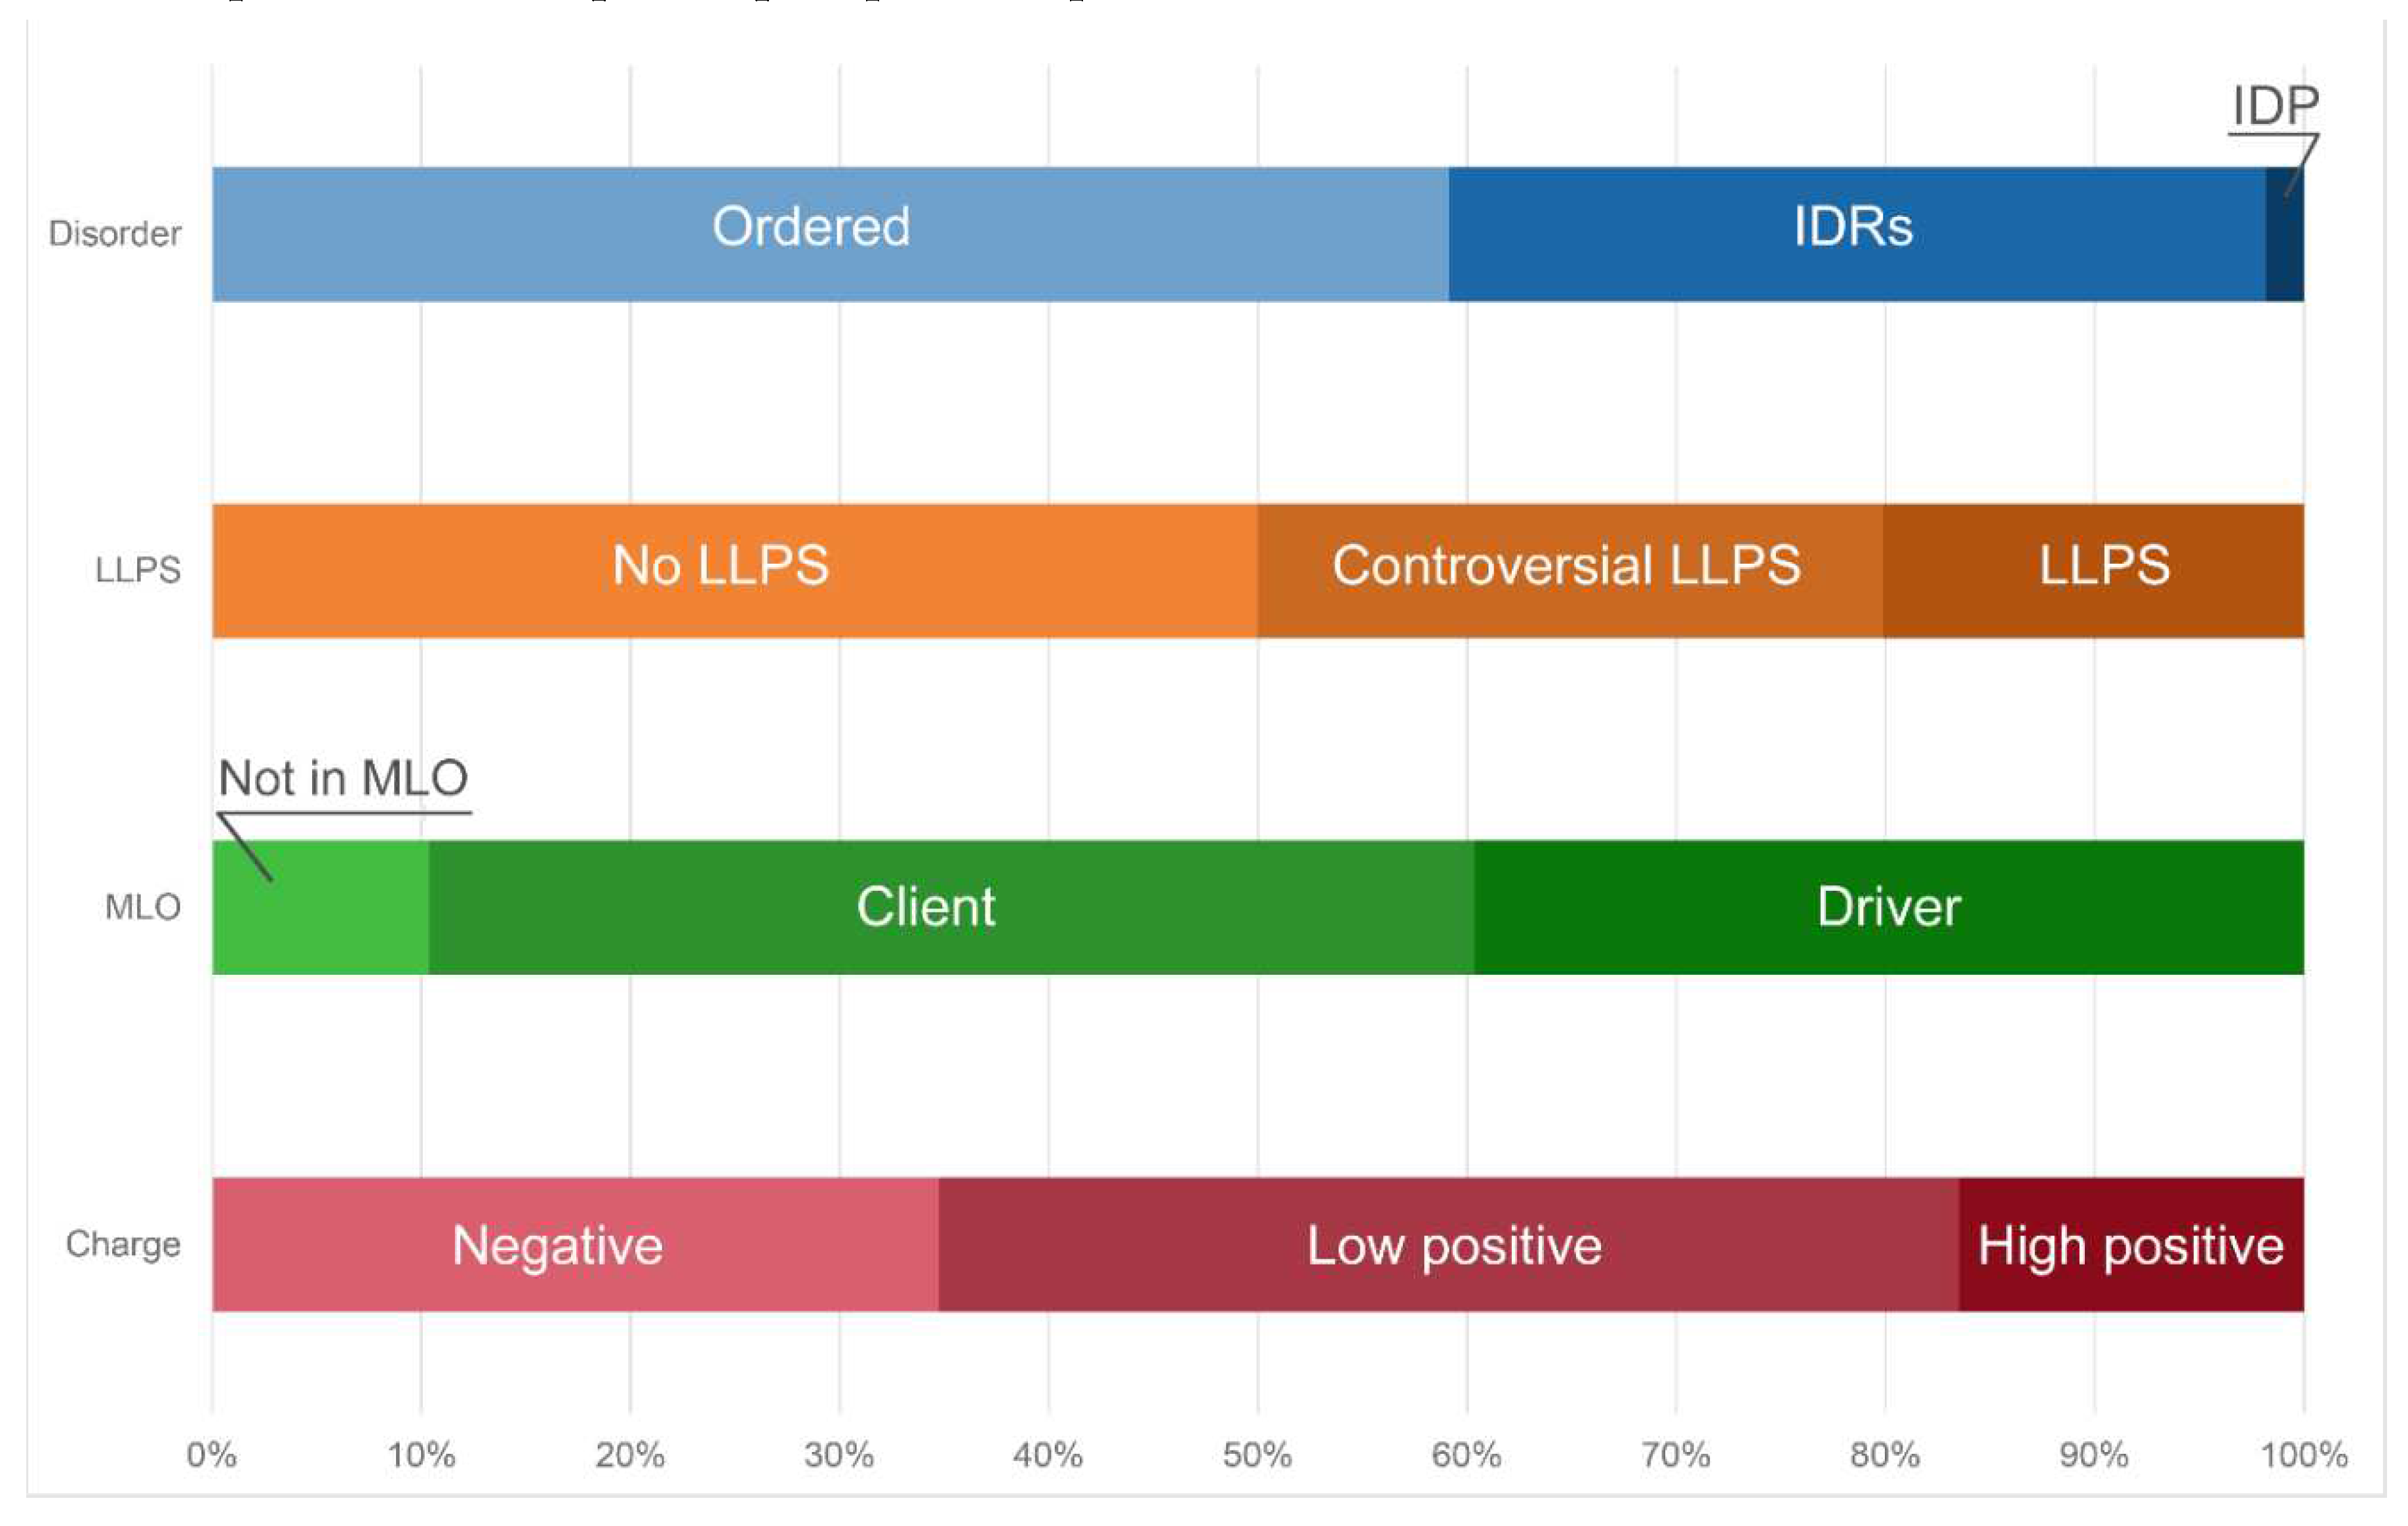
Figure 7.
Pie chart presenting identified proportion of IDPs (Panel A) and LLPS-related proteins (Panel B) in the proteome of the acidosis-induced A-bodies according to the PONDR® VSL2b and FuzDrop/PSP predictor analysis, respectively.
Figure 7.
Pie chart presenting identified proportion of IDPs (Panel A) and LLPS-related proteins (Panel B) in the proteome of the acidosis-induced A-bodies according to the PONDR® VSL2b and FuzDrop/PSP predictor analysis, respectively.
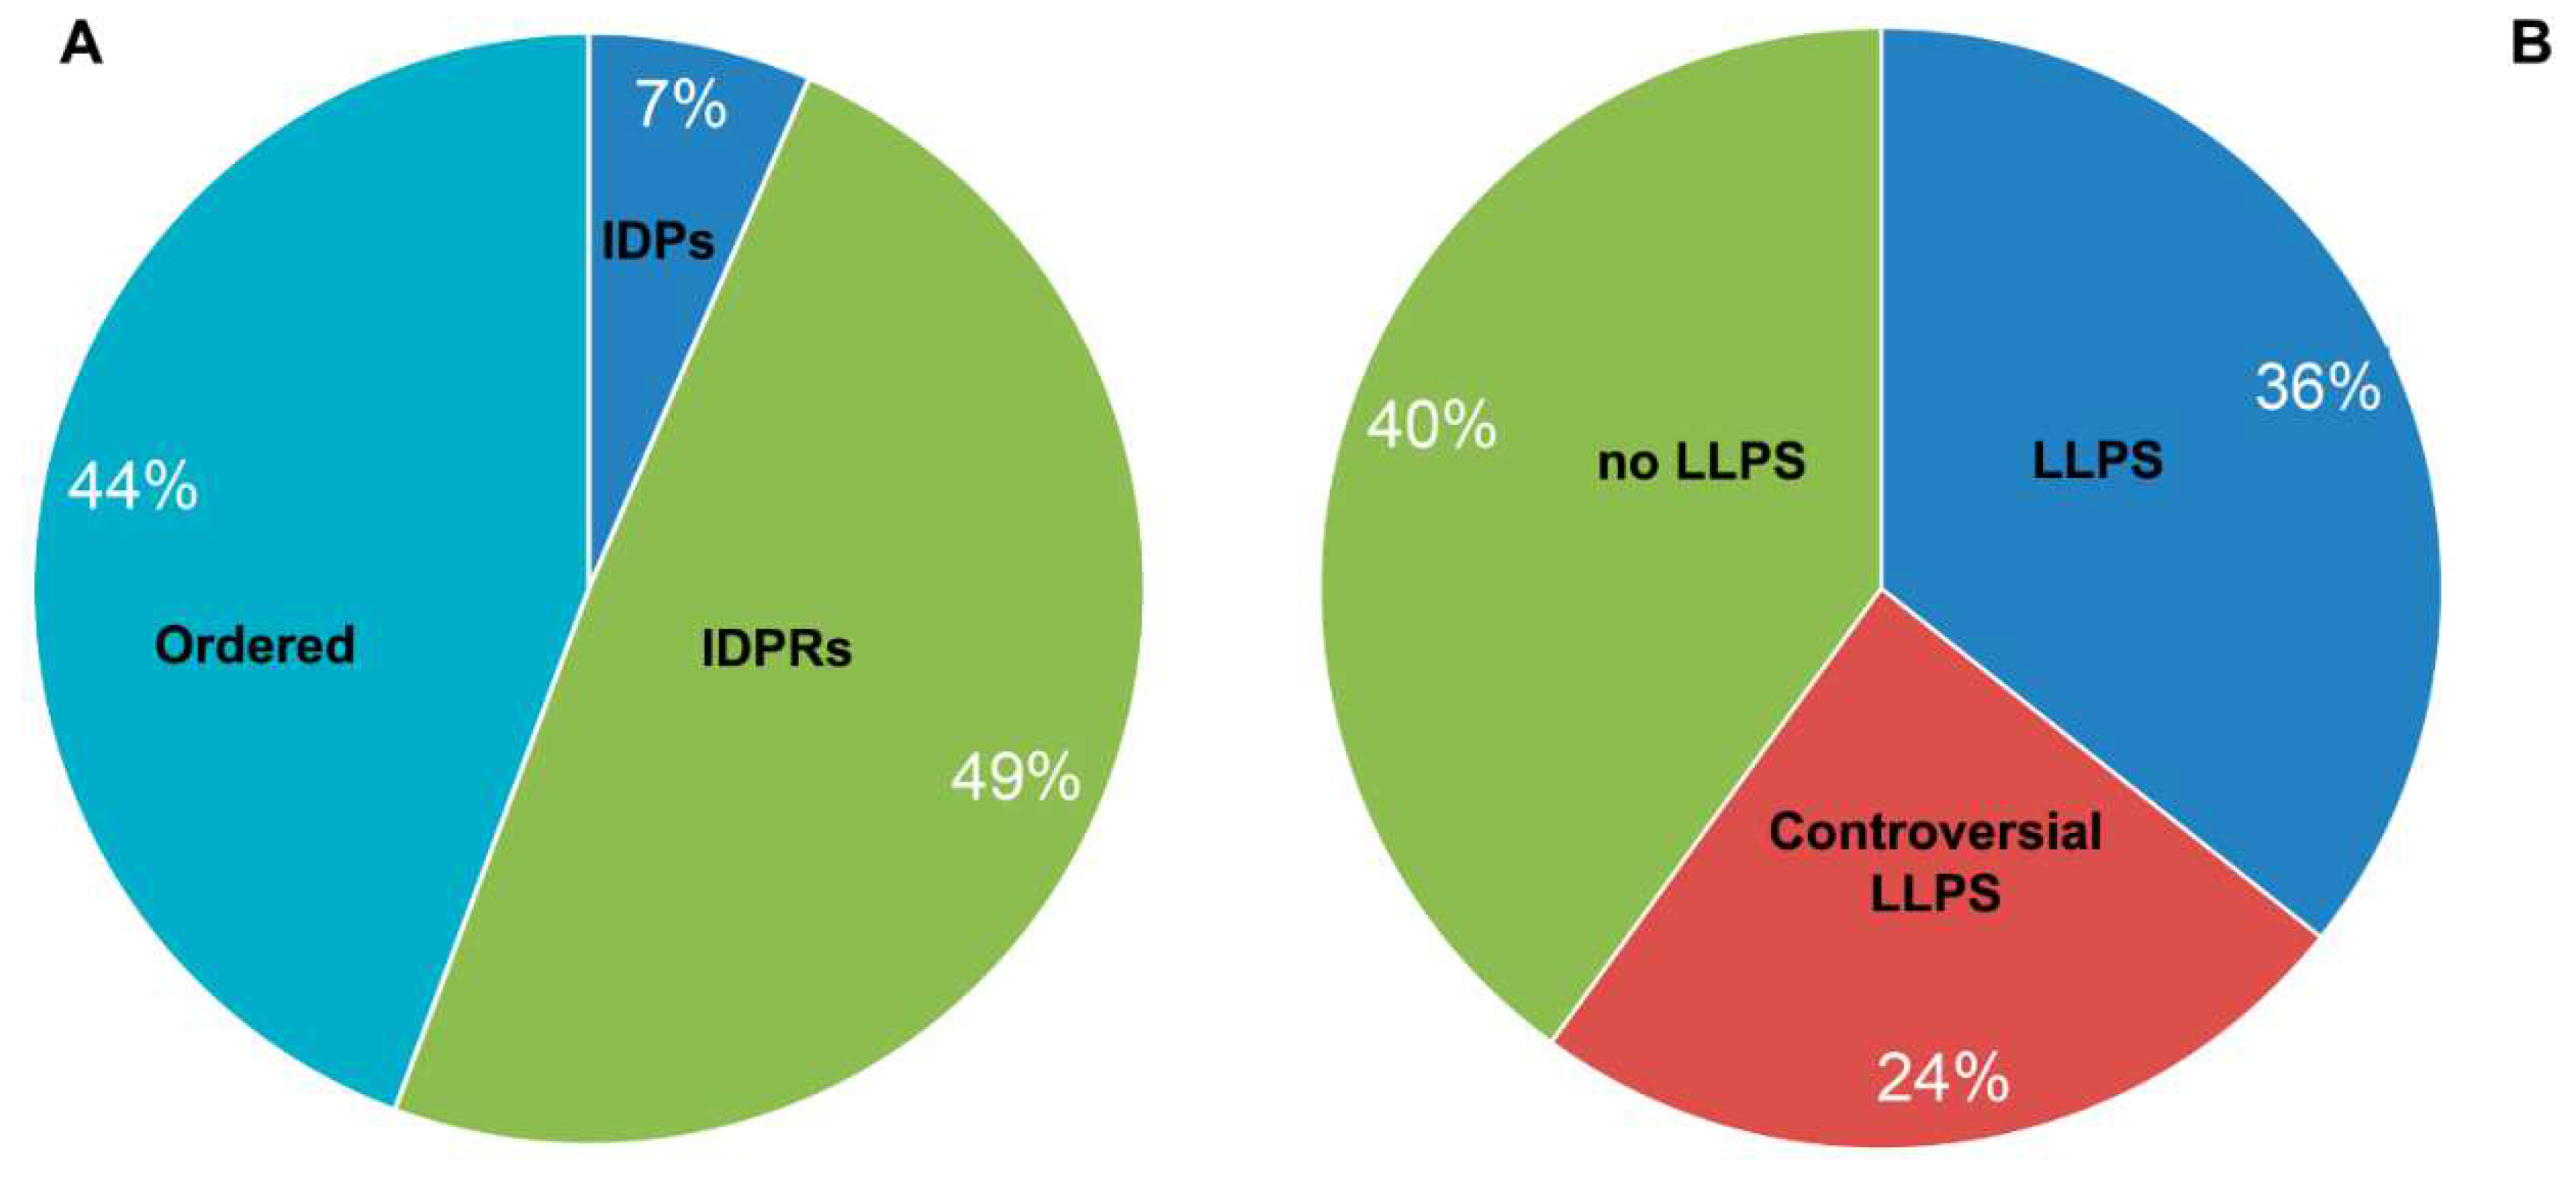
Figure 8.
Diagram presenting identified the molecular functions of LLPS-related proteins in acidosis-induced A-bodies proteome.
Figure 8.
Diagram presenting identified the molecular functions of LLPS-related proteins in acidosis-induced A-bodies proteome.
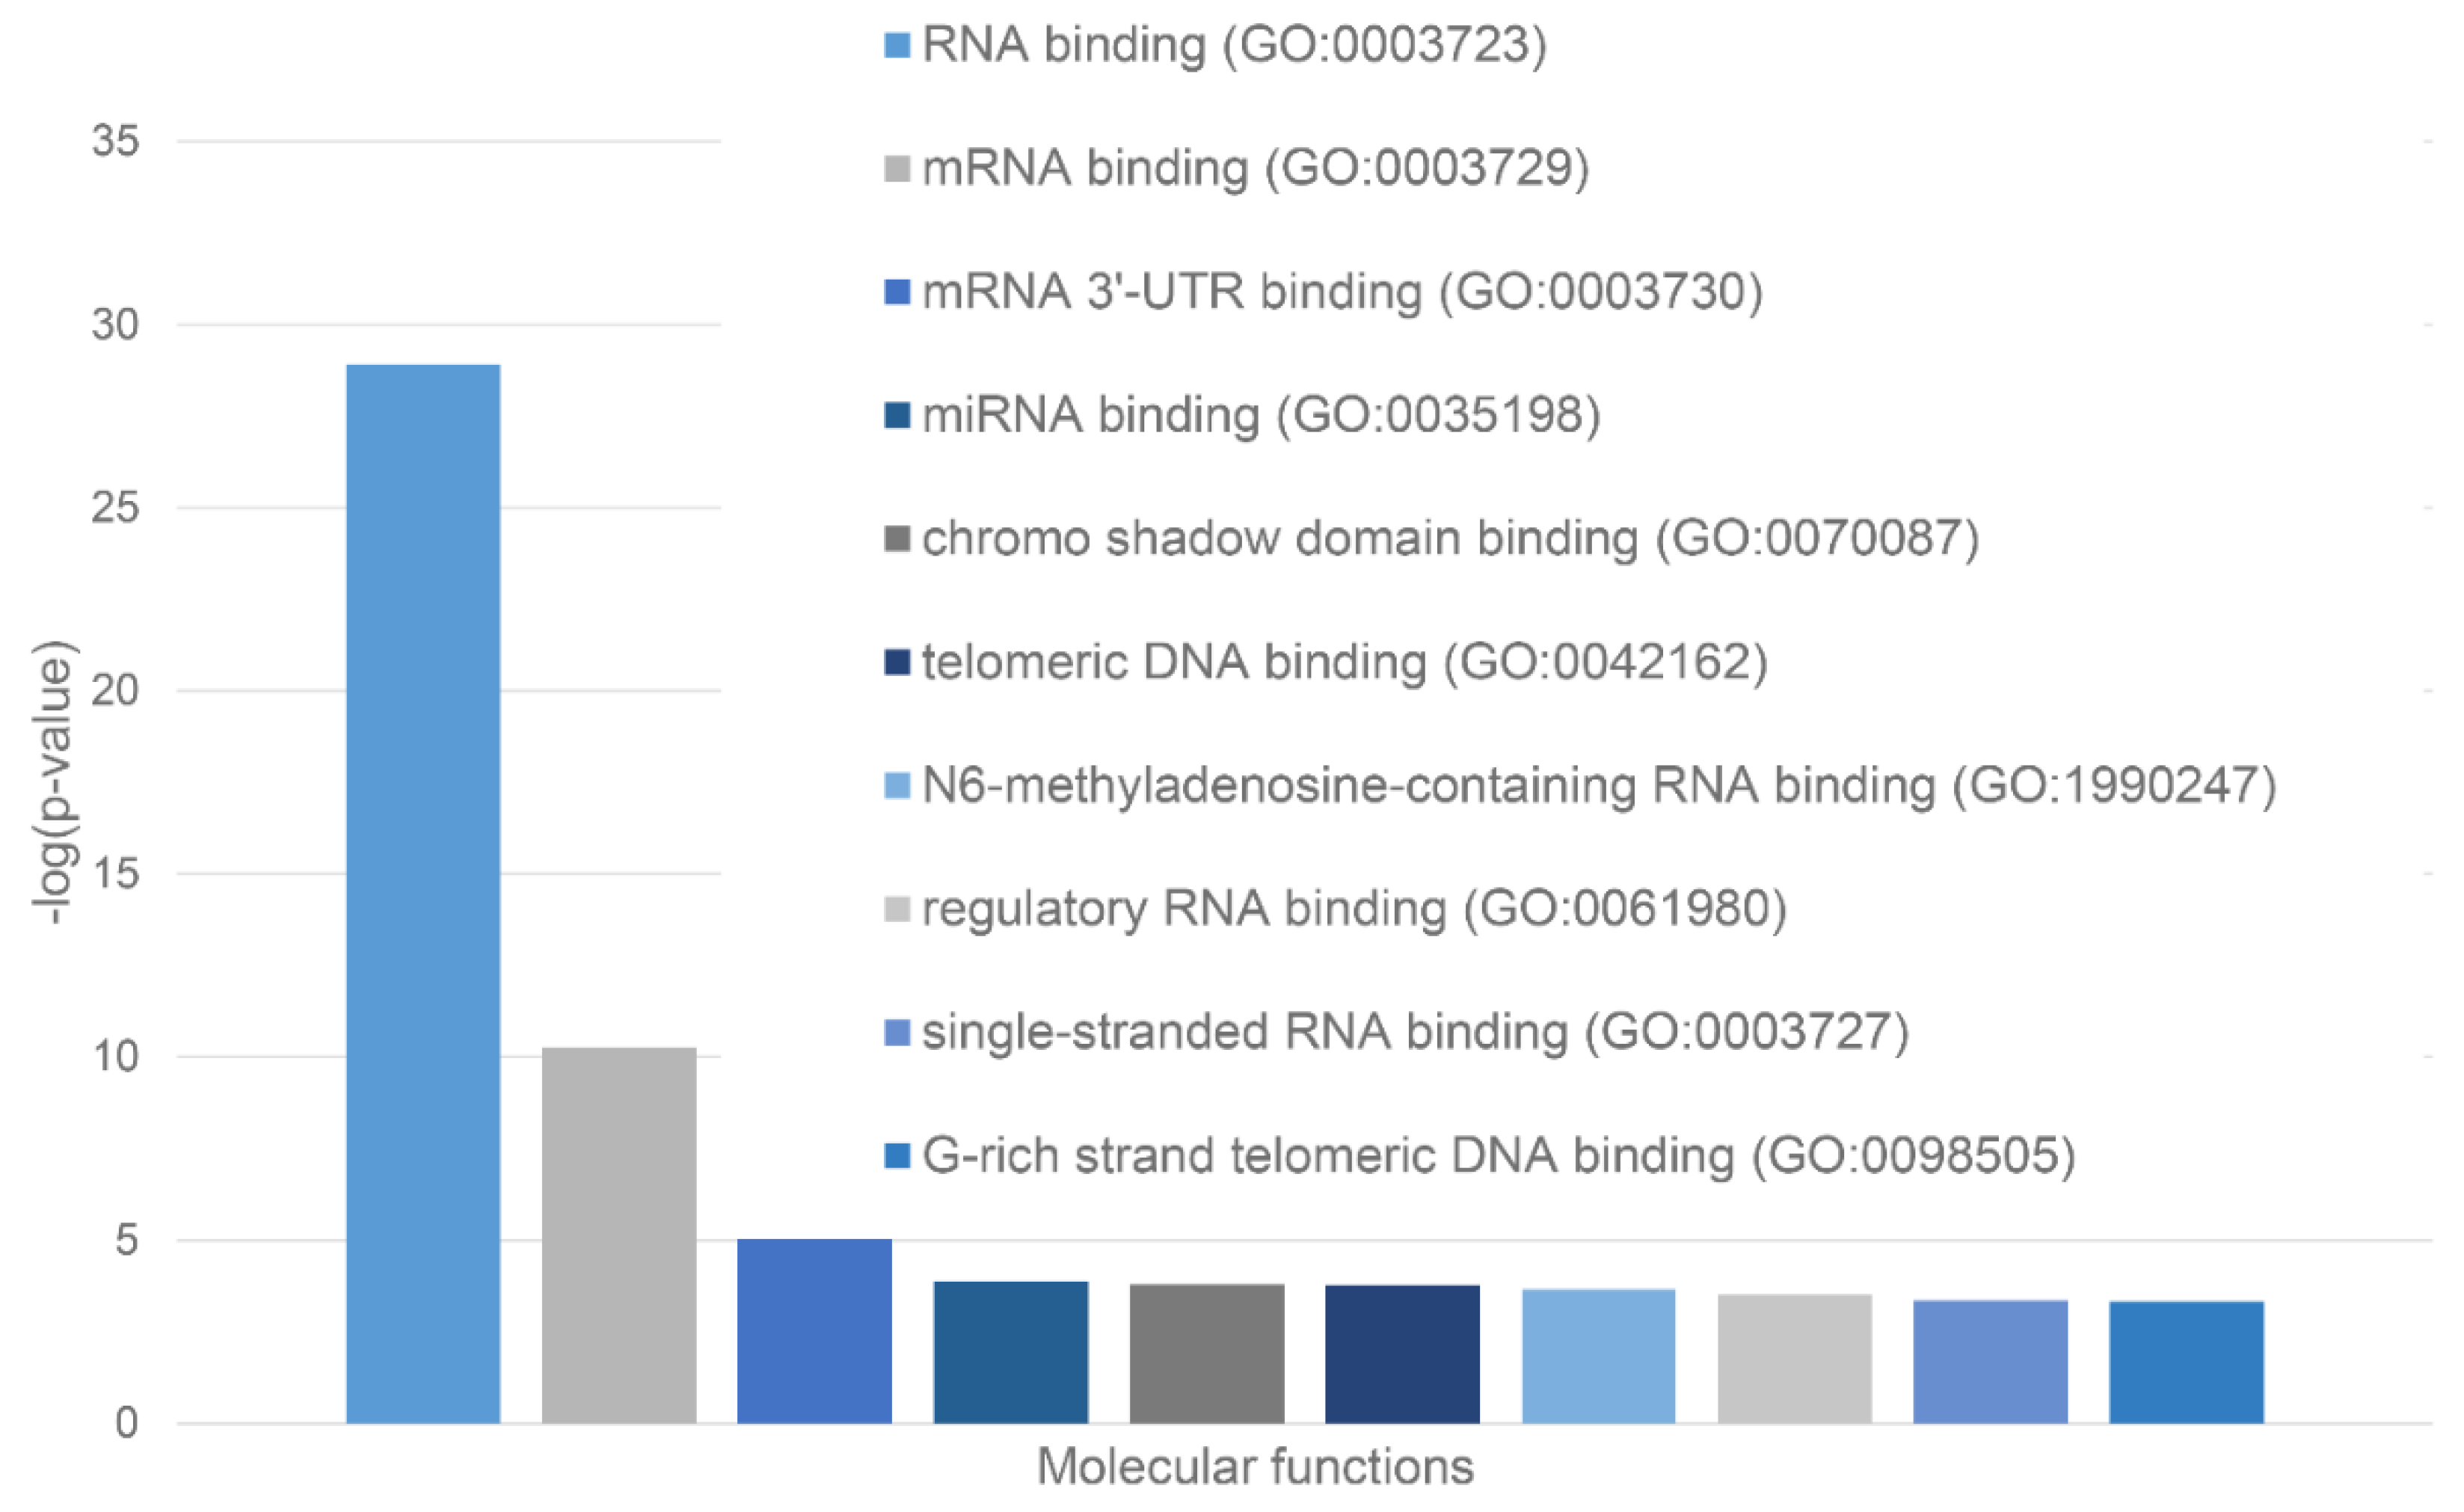
Figure 9.
Diagram presenting identified the biological processes that involve the LLPS-related proteins in acidosis-induced A-bodies proteome.
Figure 9.
Diagram presenting identified the biological processes that involve the LLPS-related proteins in acidosis-induced A-bodies proteome.
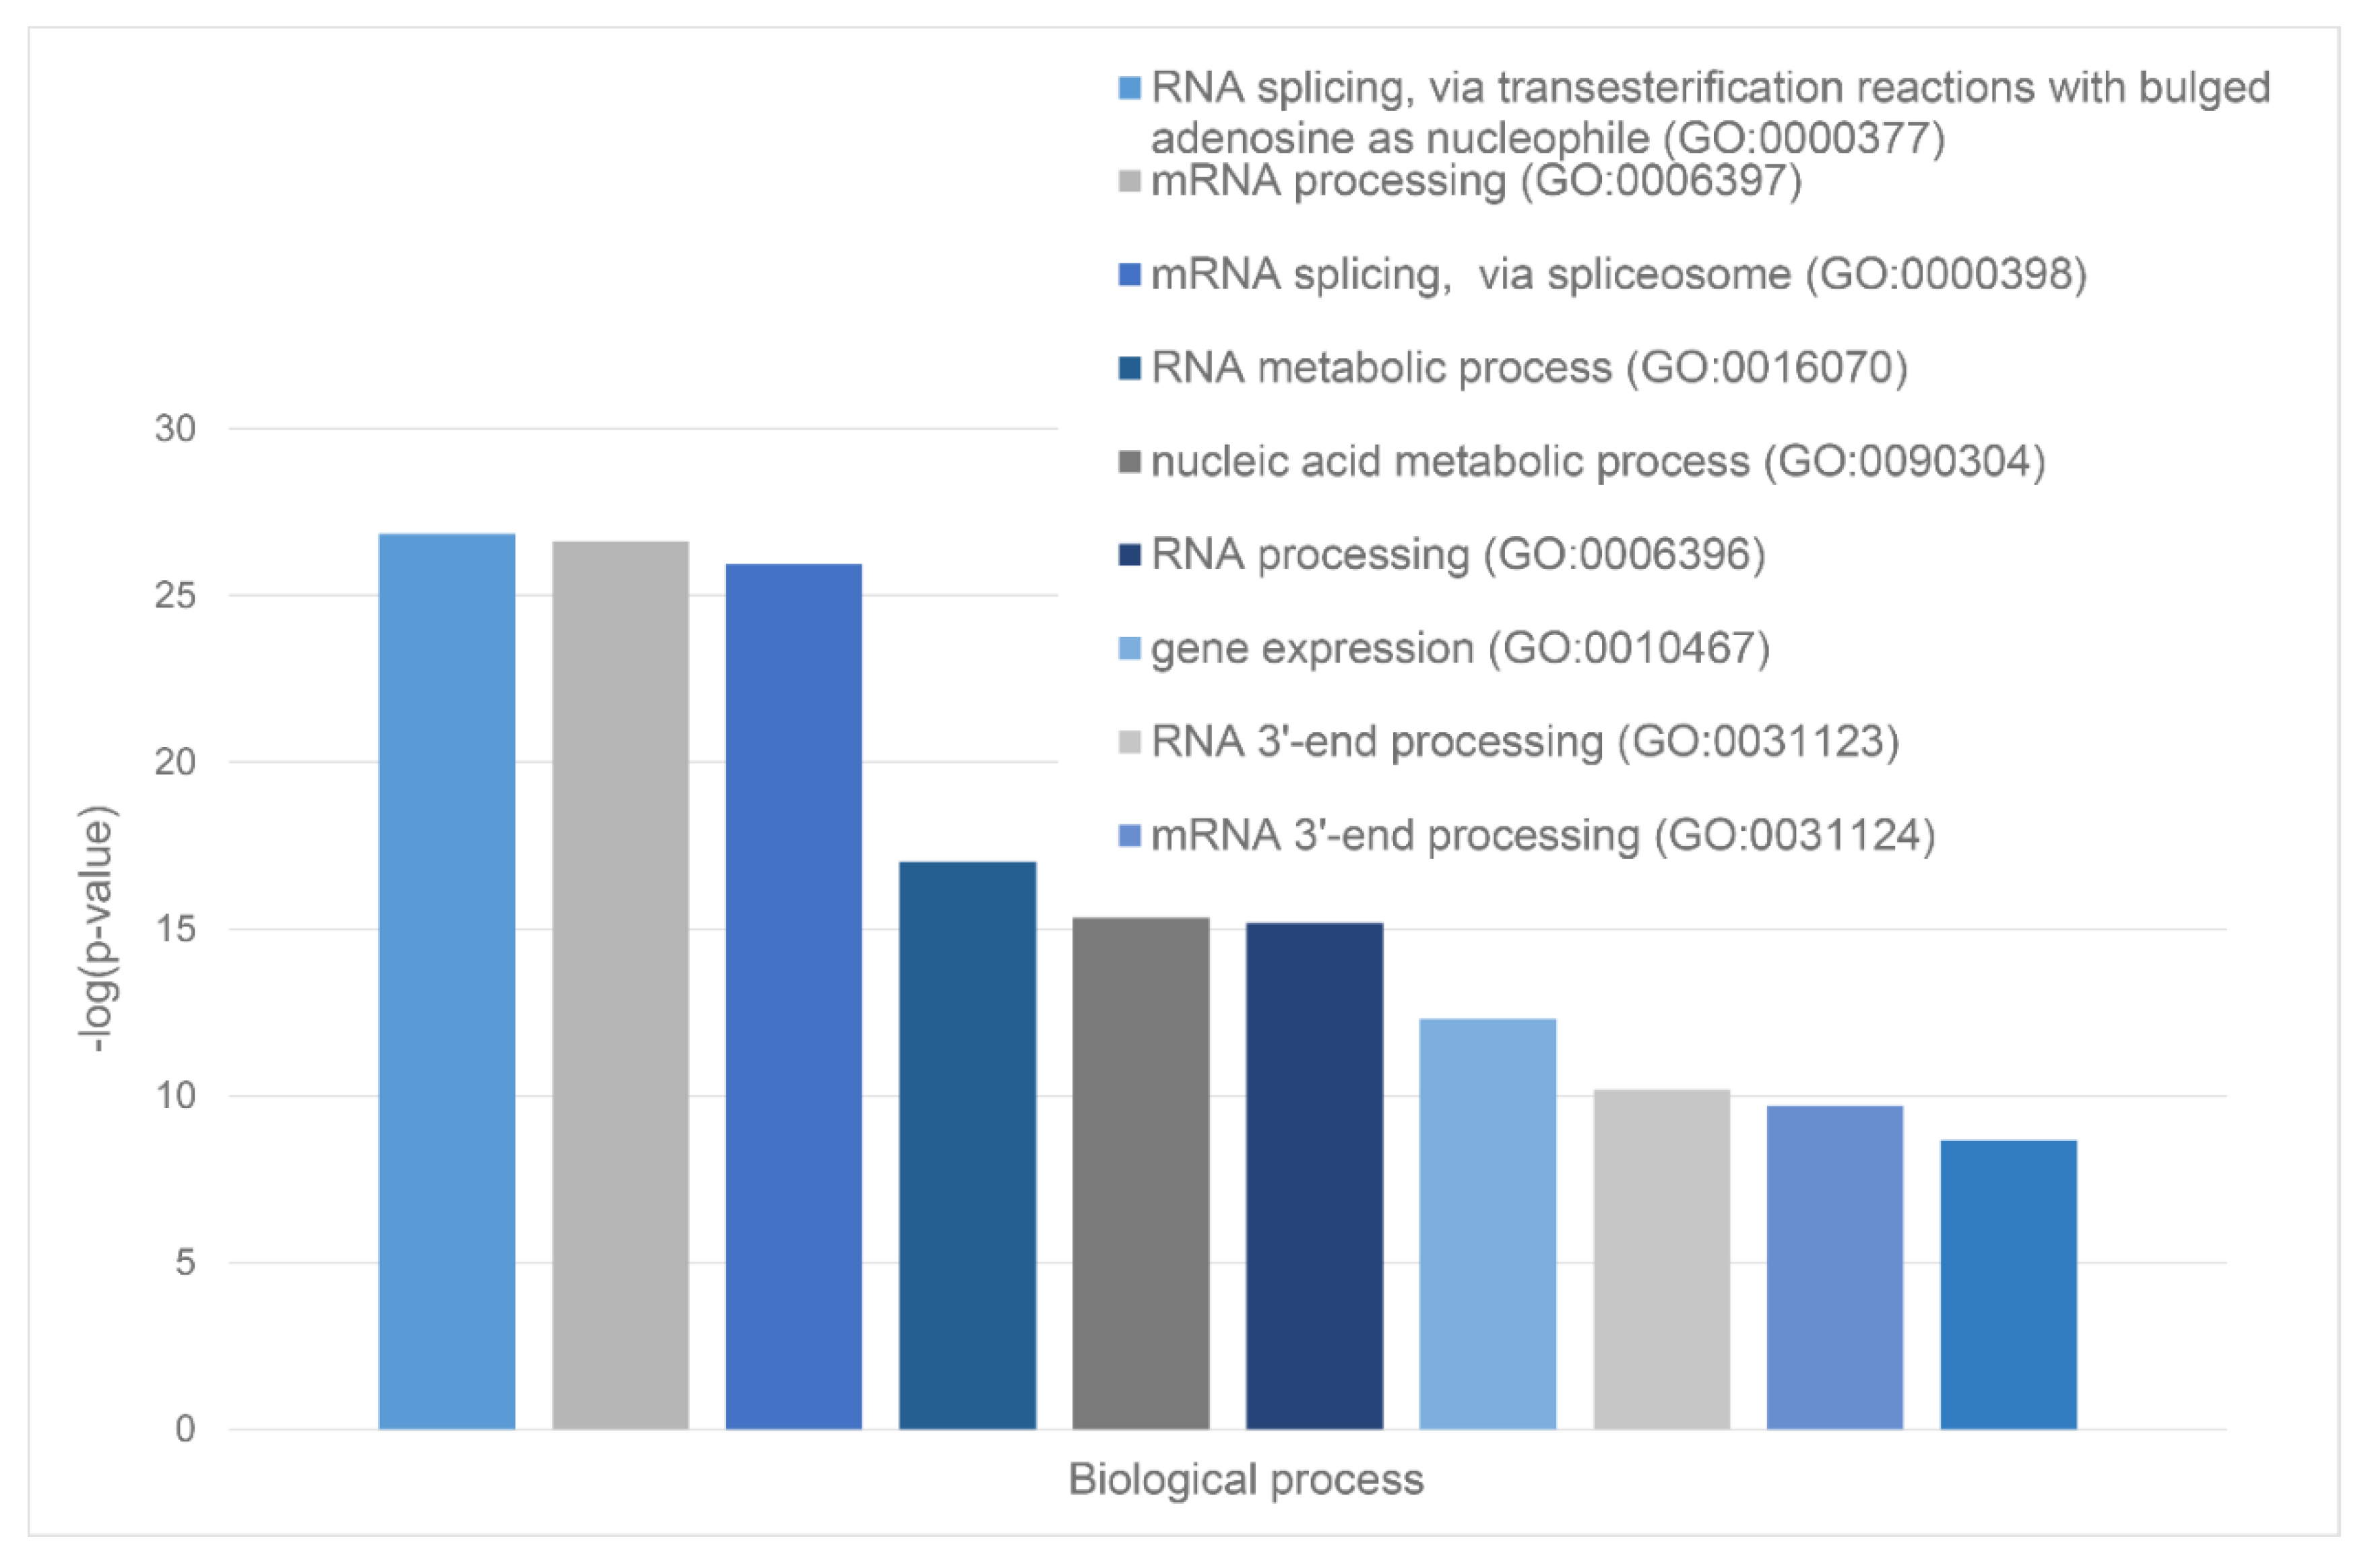
Figure 10.
Distribution of acidosis-induced A-bodies proteome on protein disorder, tendency to LLPS, roles in MLOs according to FuzDrop, protein charge.
Figure 10.
Distribution of acidosis-induced A-bodies proteome on protein disorder, tendency to LLPS, roles in MLOs according to FuzDrop, protein charge.
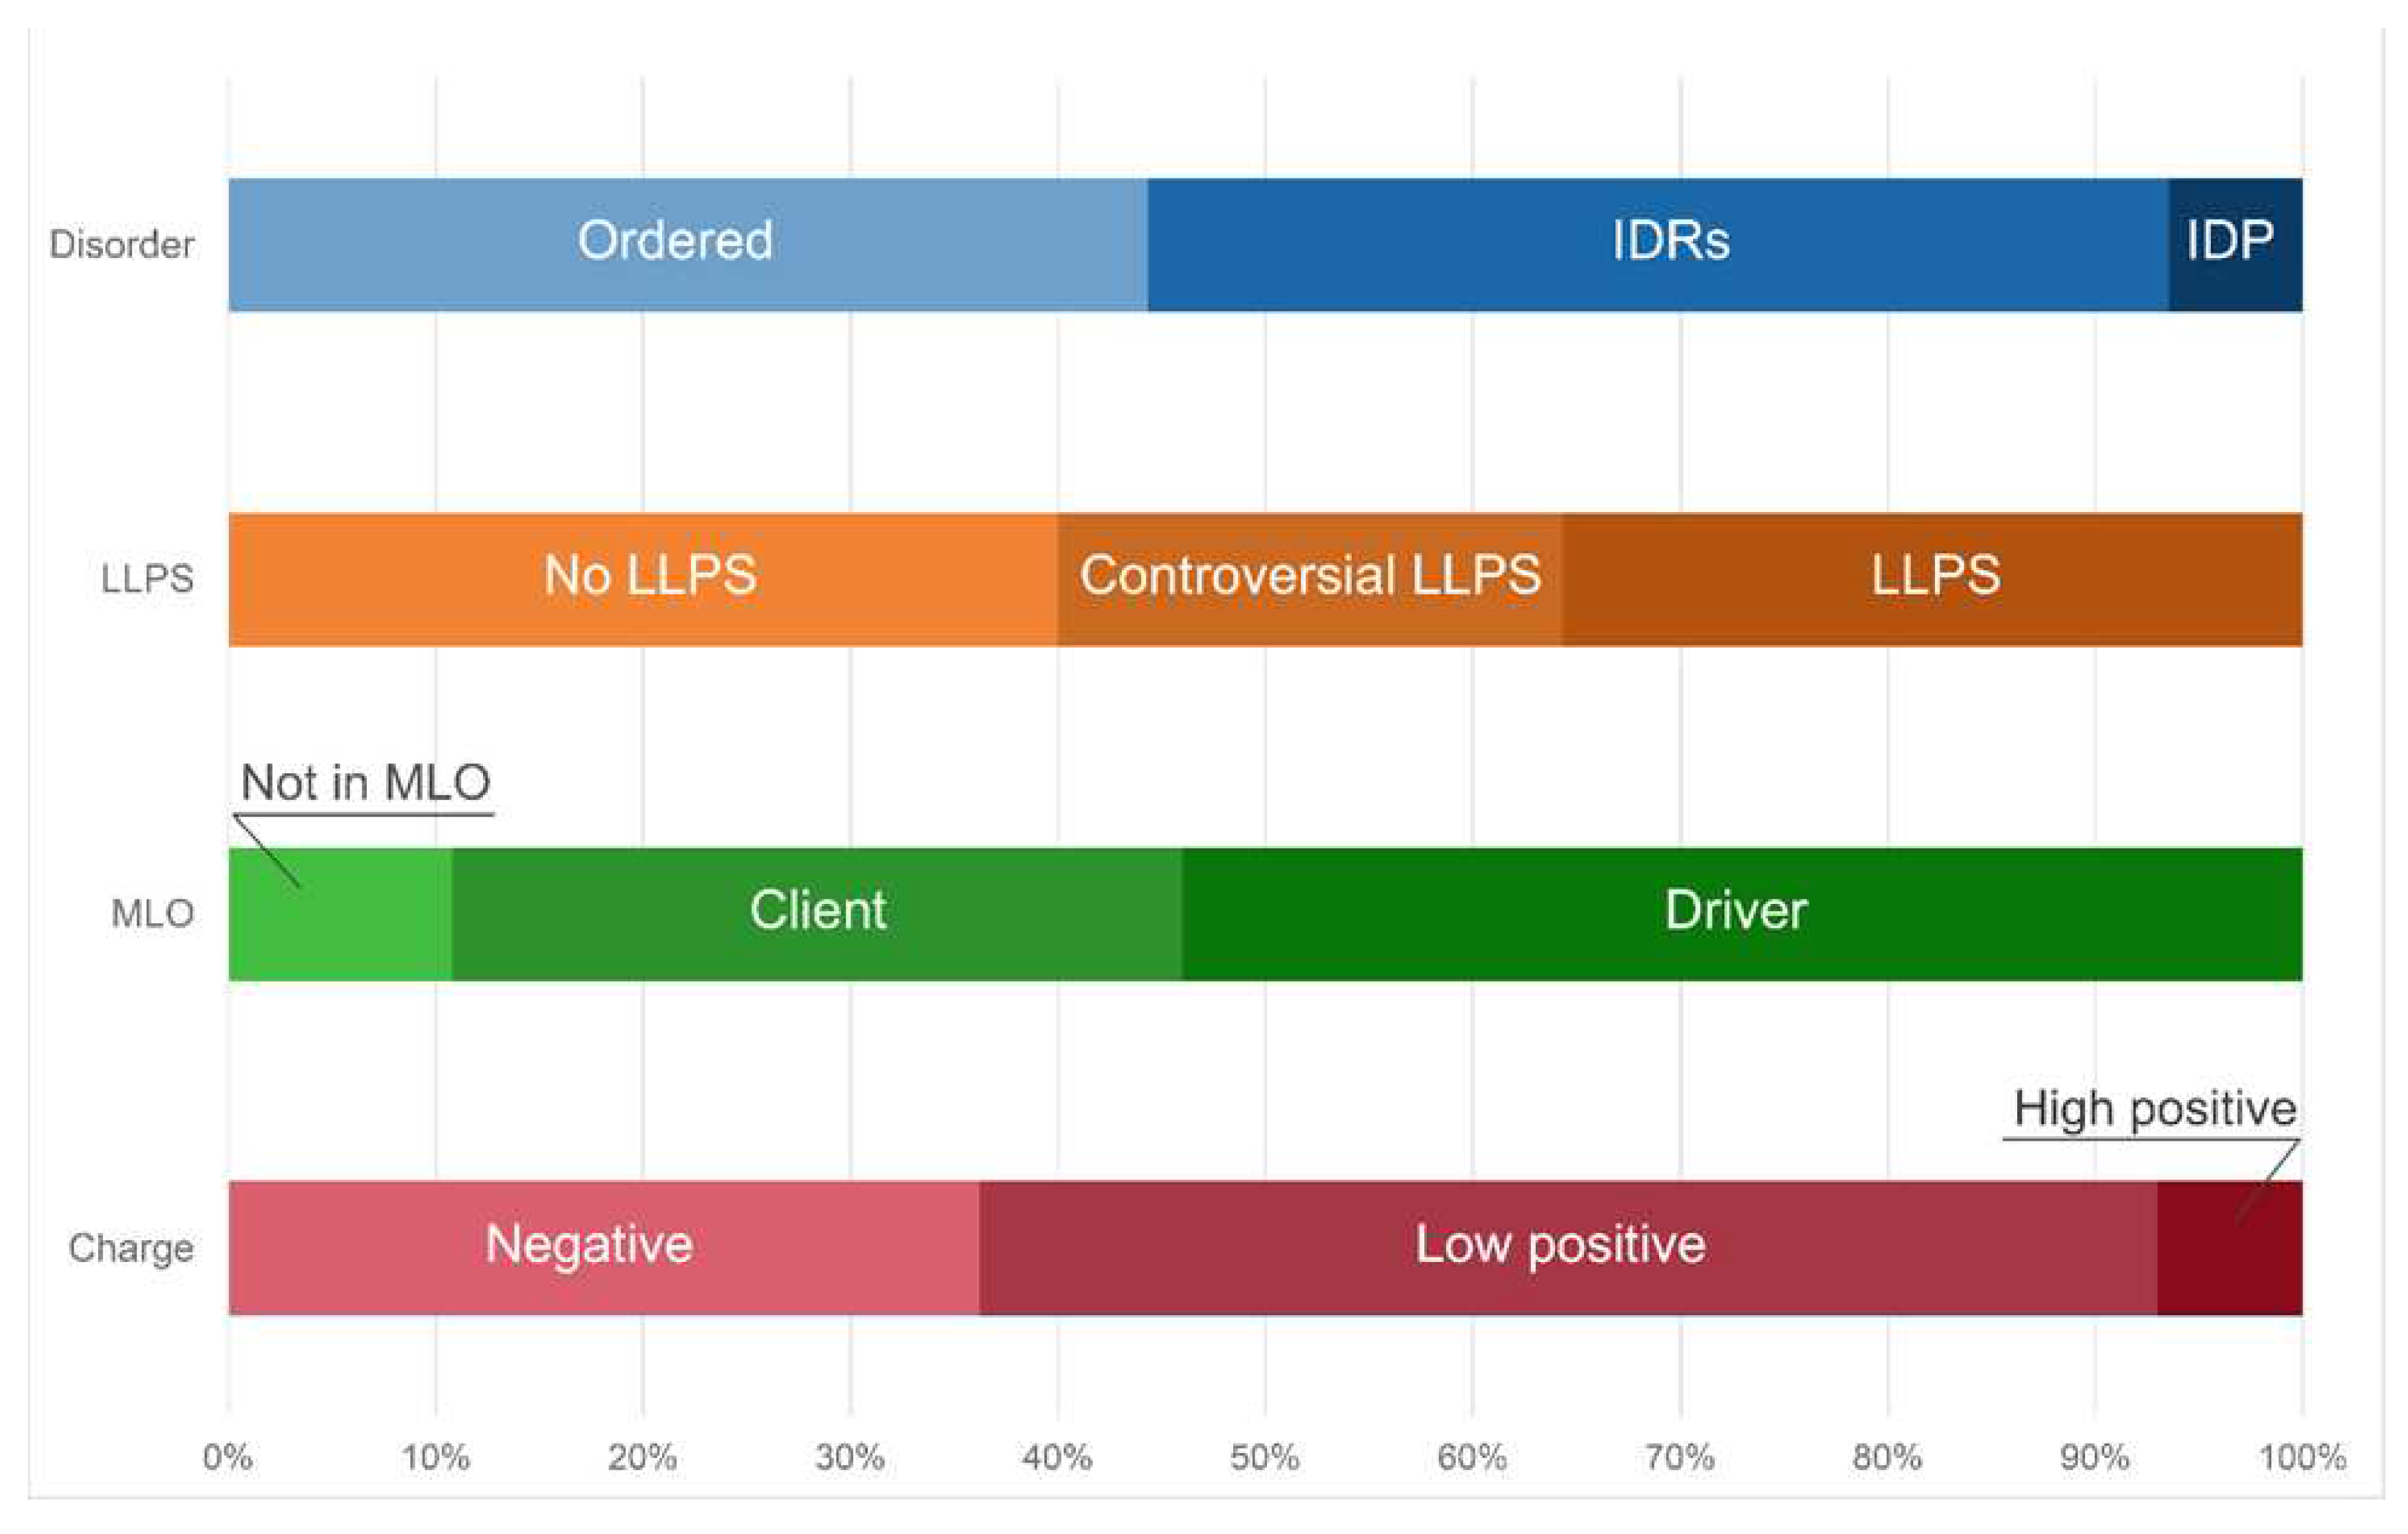
Figure 11.
Pie chart presenting identified the proportion of IDPs (Panel A) and LLPS-related proteins (Panel B) in the proteome of the nuclear stress bodies according to the PONDR® VSL2b and FuzDrop/PSP predictor analysis, respectively.
Figure 11.
Pie chart presenting identified the proportion of IDPs (Panel A) and LLPS-related proteins (Panel B) in the proteome of the nuclear stress bodies according to the PONDR® VSL2b and FuzDrop/PSP predictor analysis, respectively.
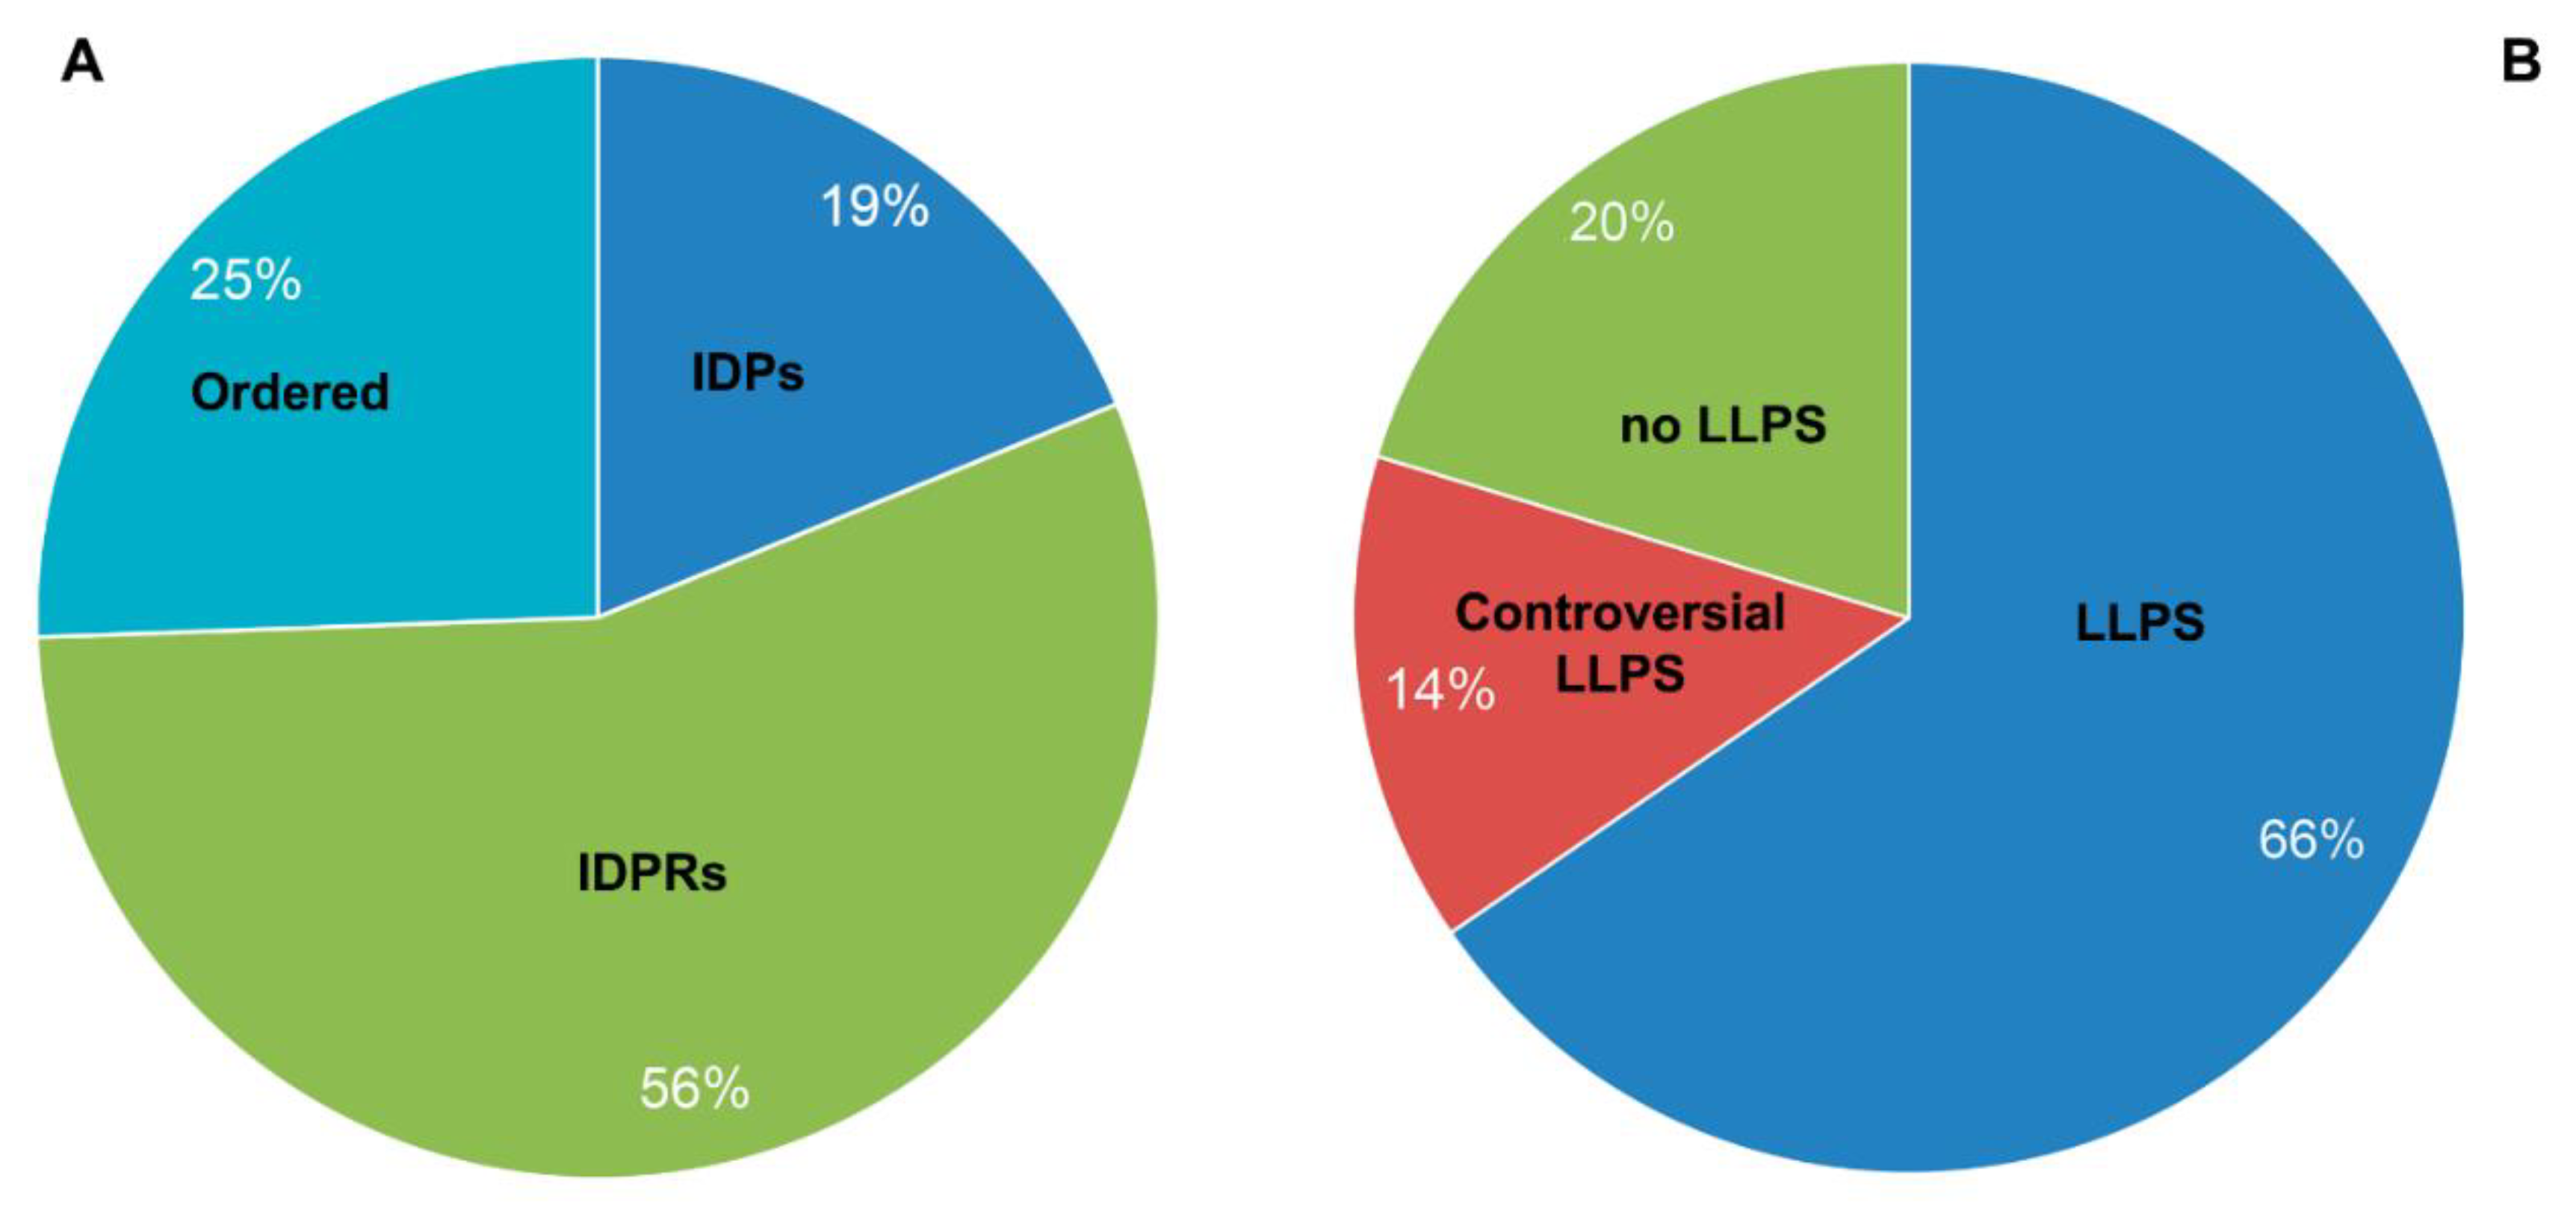
Figure 12.
Diagram presenting identified the molecular functions of LLPS-related proteins in nuclear stress Bodies proteome.
Figure 12.
Diagram presenting identified the molecular functions of LLPS-related proteins in nuclear stress Bodies proteome.
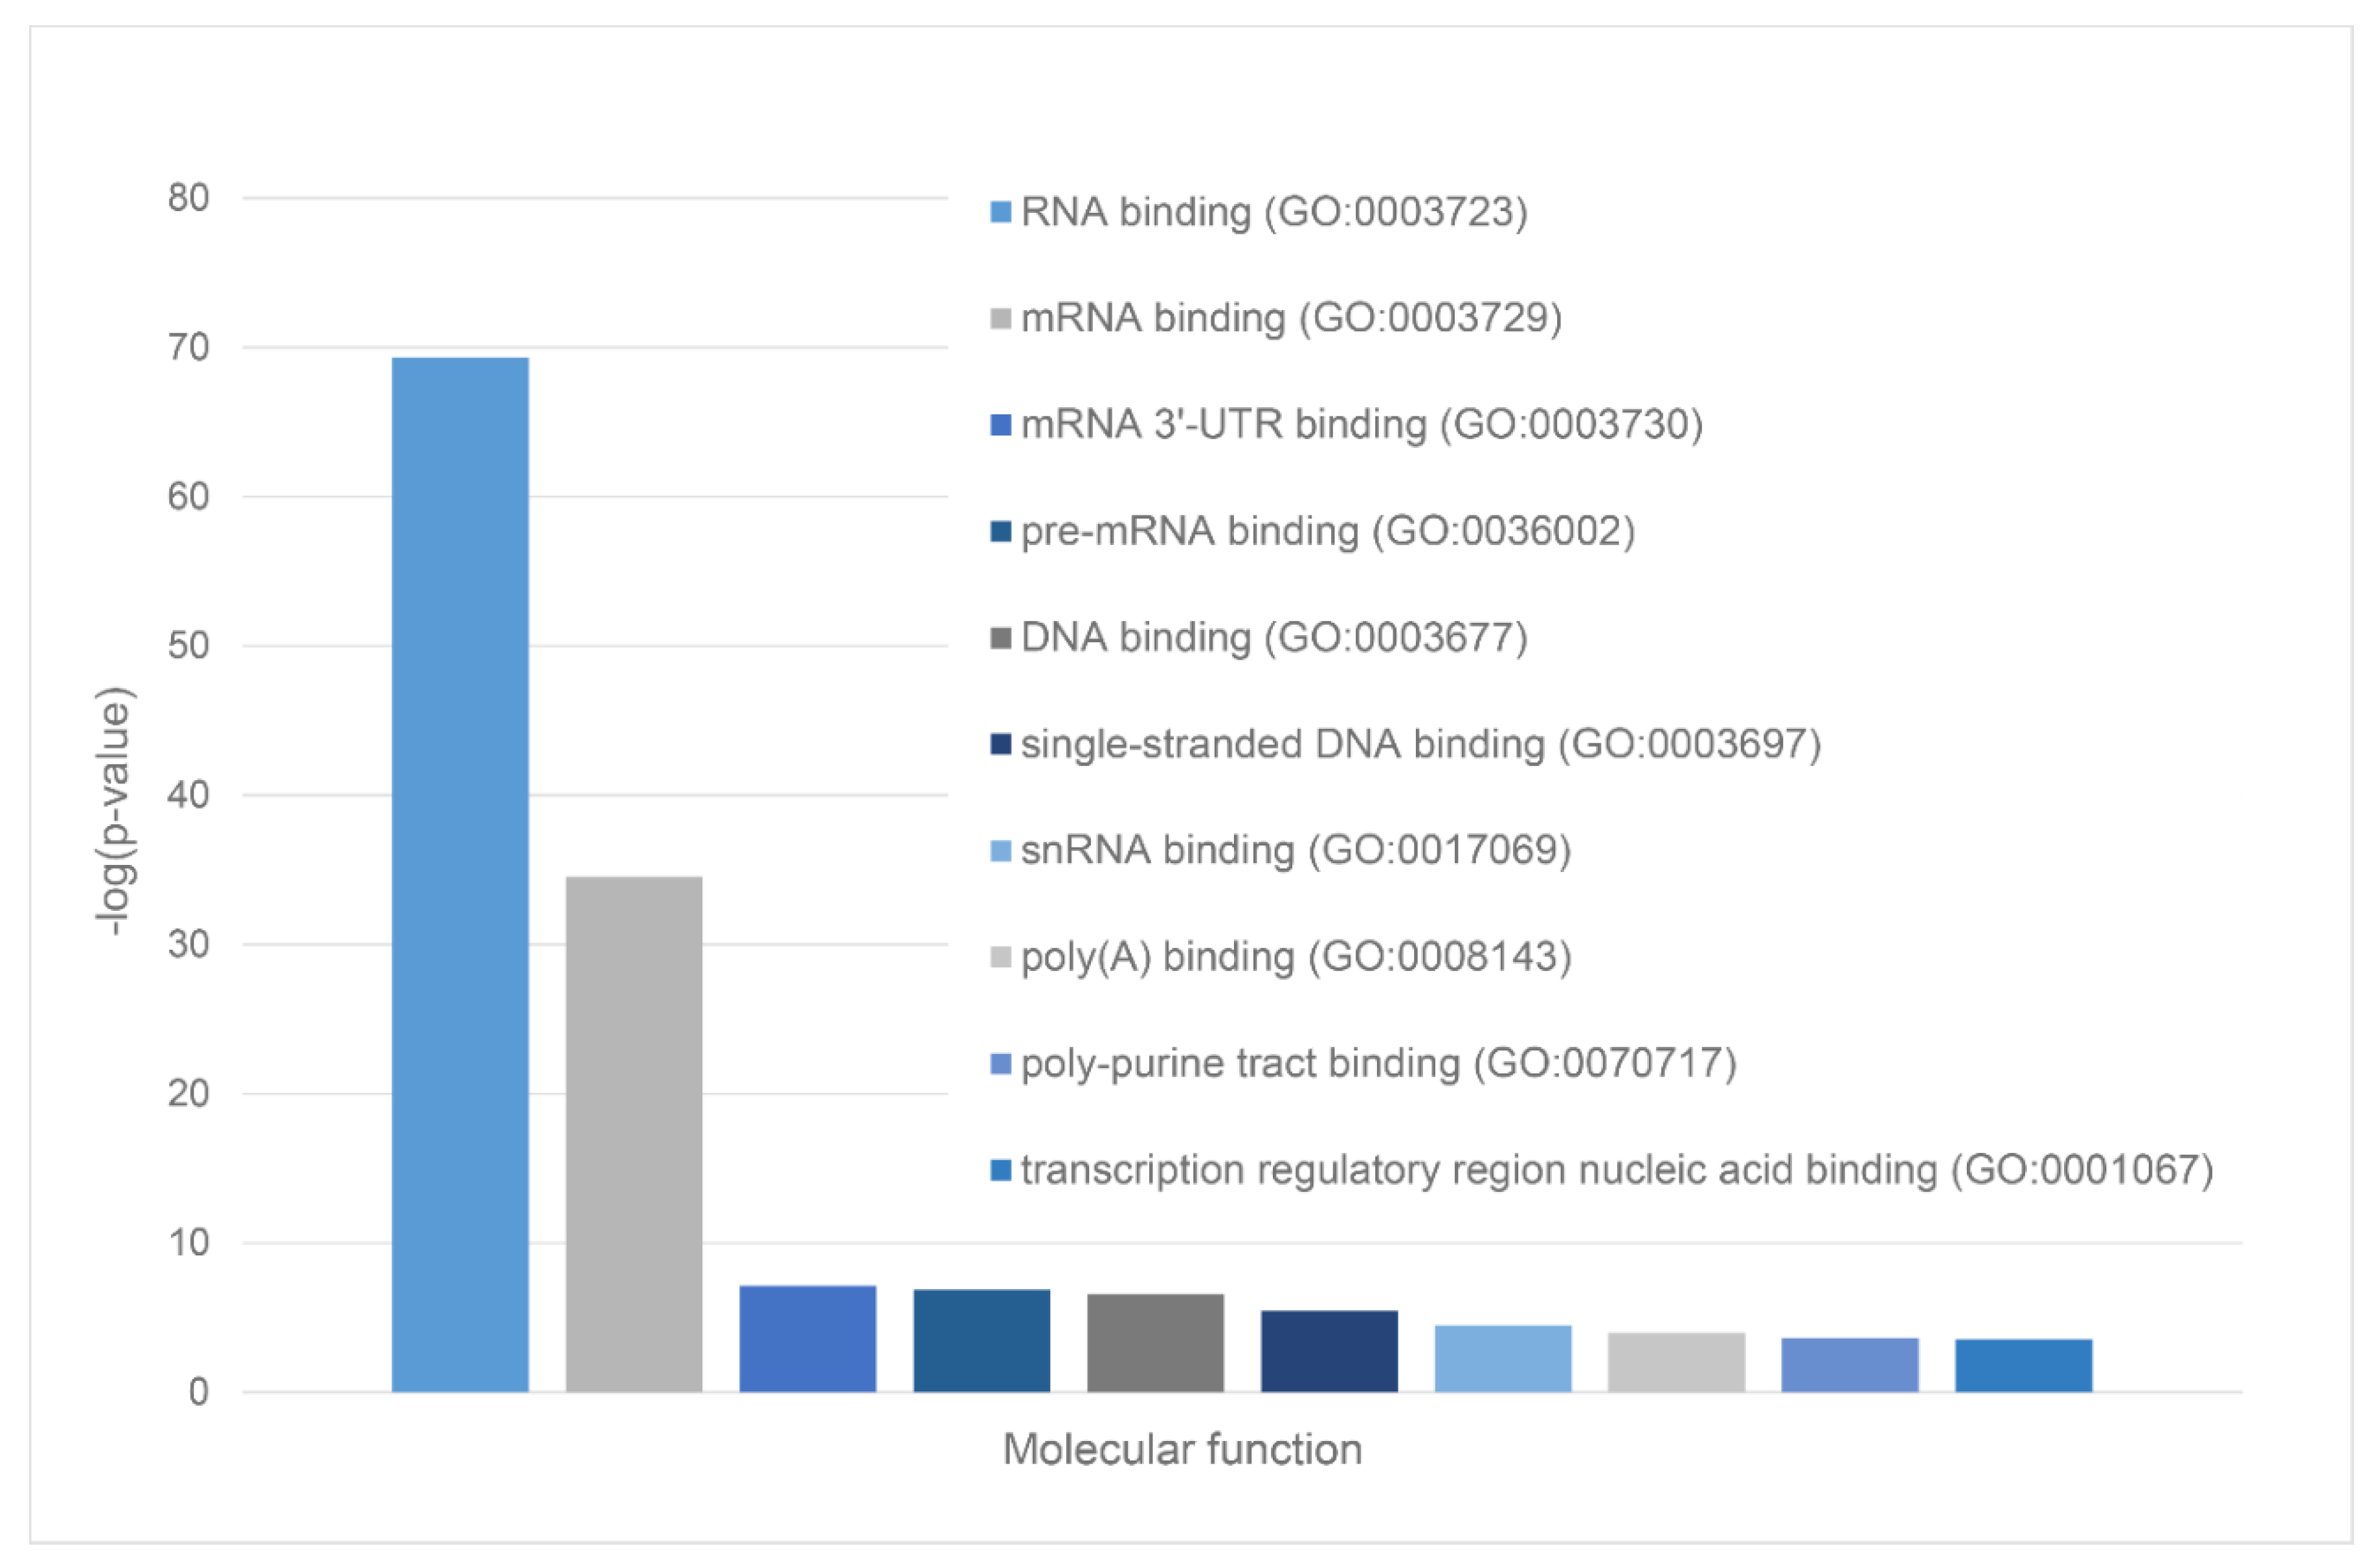
Figure 13.
Diagram presenting identified the biological processes that involve the LLPS-related proteins in the proteome of the nuclear stress bodies.
Figure 13.
Diagram presenting identified the biological processes that involve the LLPS-related proteins in the proteome of the nuclear stress bodies.
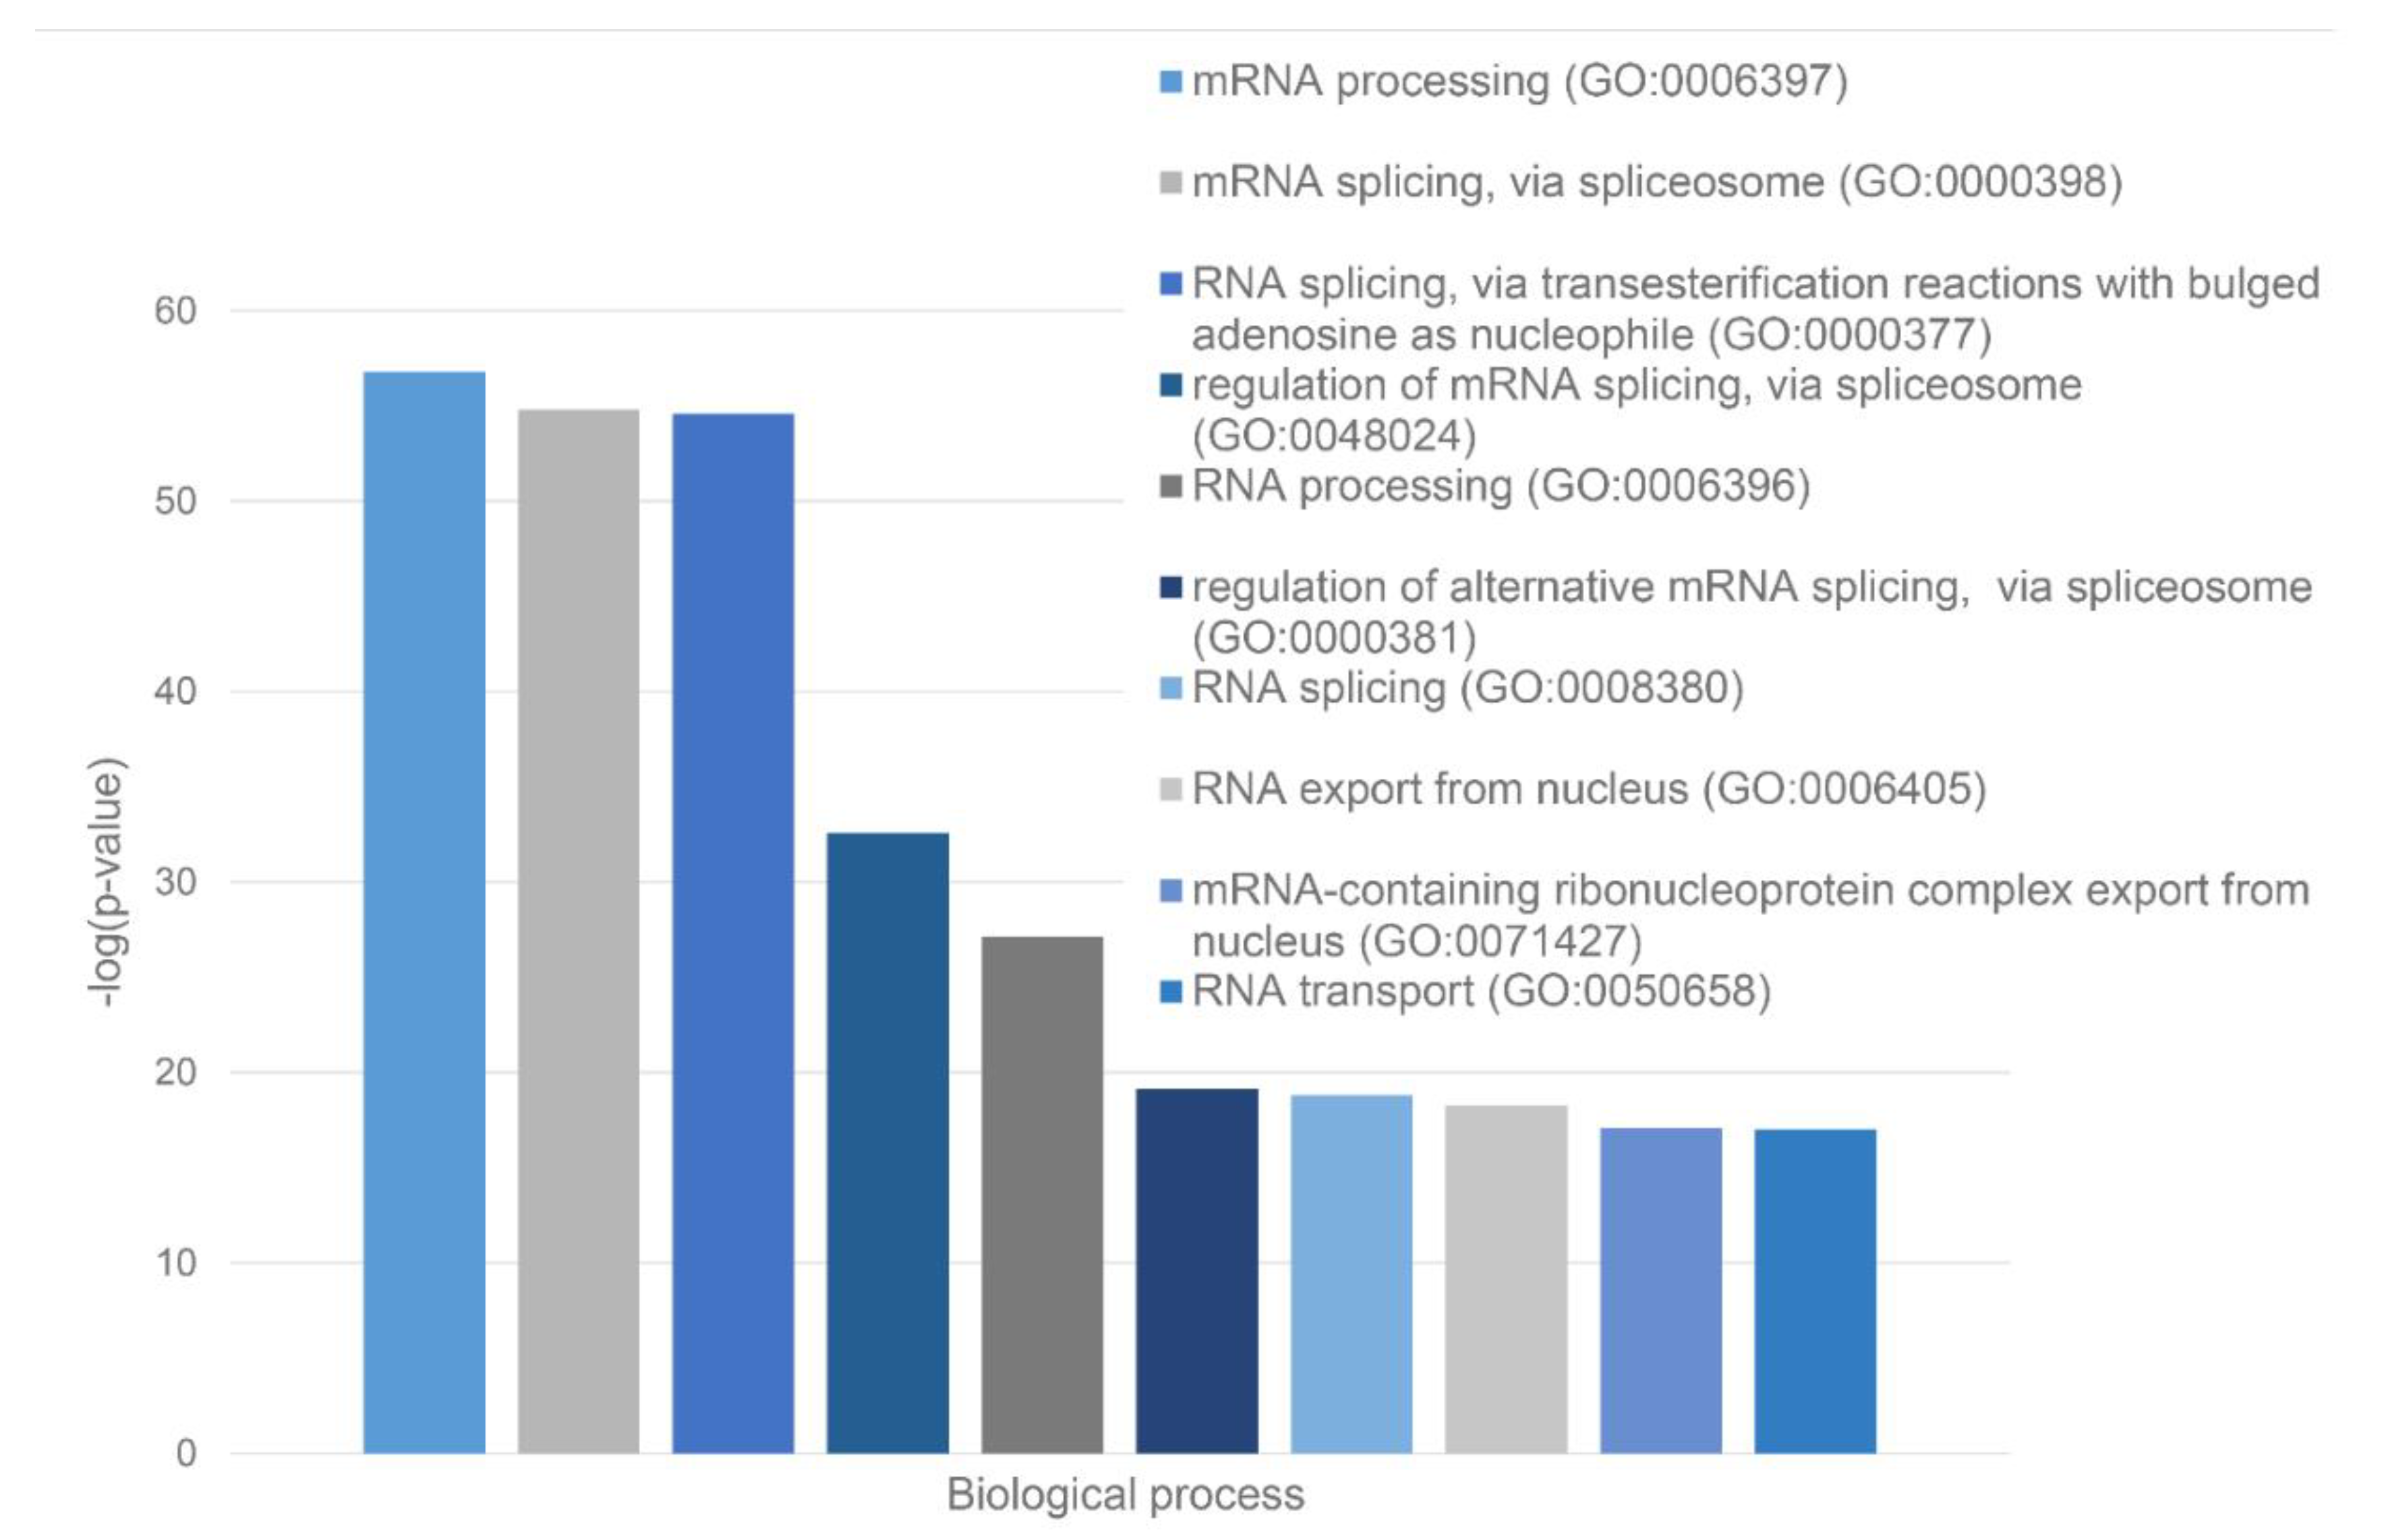
Figure 14.
Distribution of nuclear stress Bodies proteome on protein disorder, tendency to LLPS, roles in MLOs according to FuzDrop, protein charge.
Figure 14.
Distribution of nuclear stress Bodies proteome on protein disorder, tendency to LLPS, roles in MLOs according to FuzDrop, protein charge.
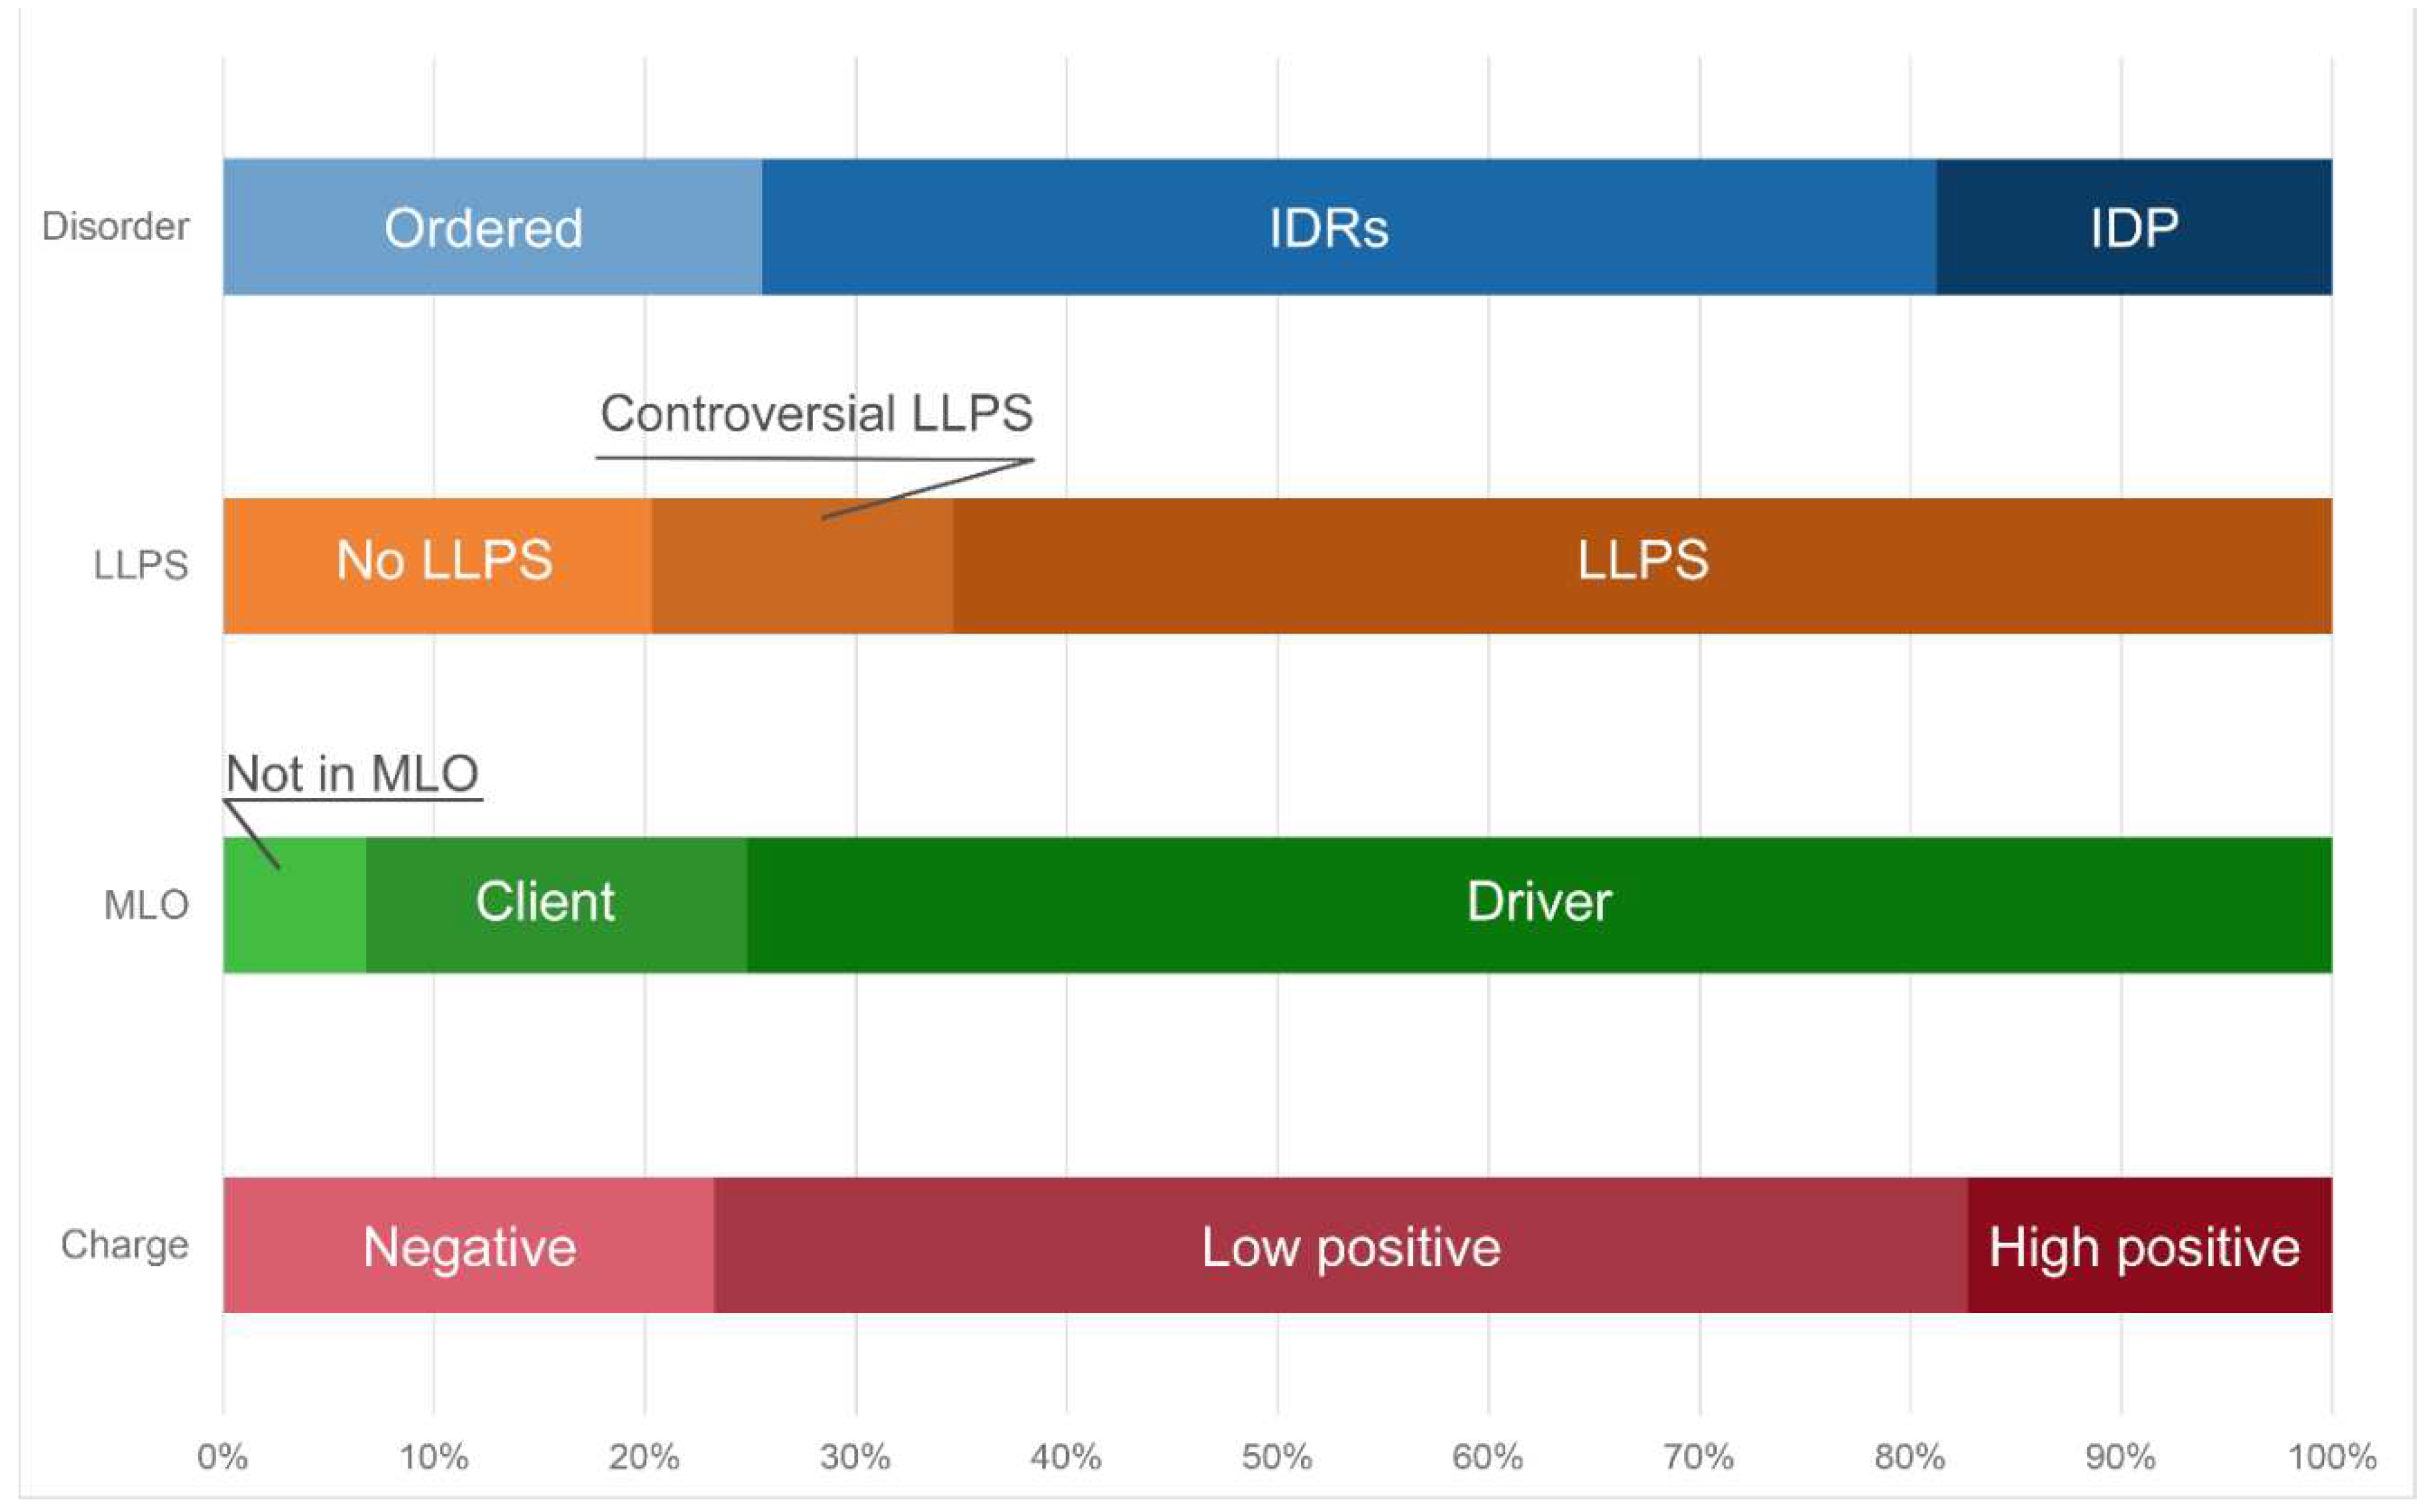
Figure 15.
Venn diagrams depicting the number of intersecting proteins between A-bodies and nSBs.
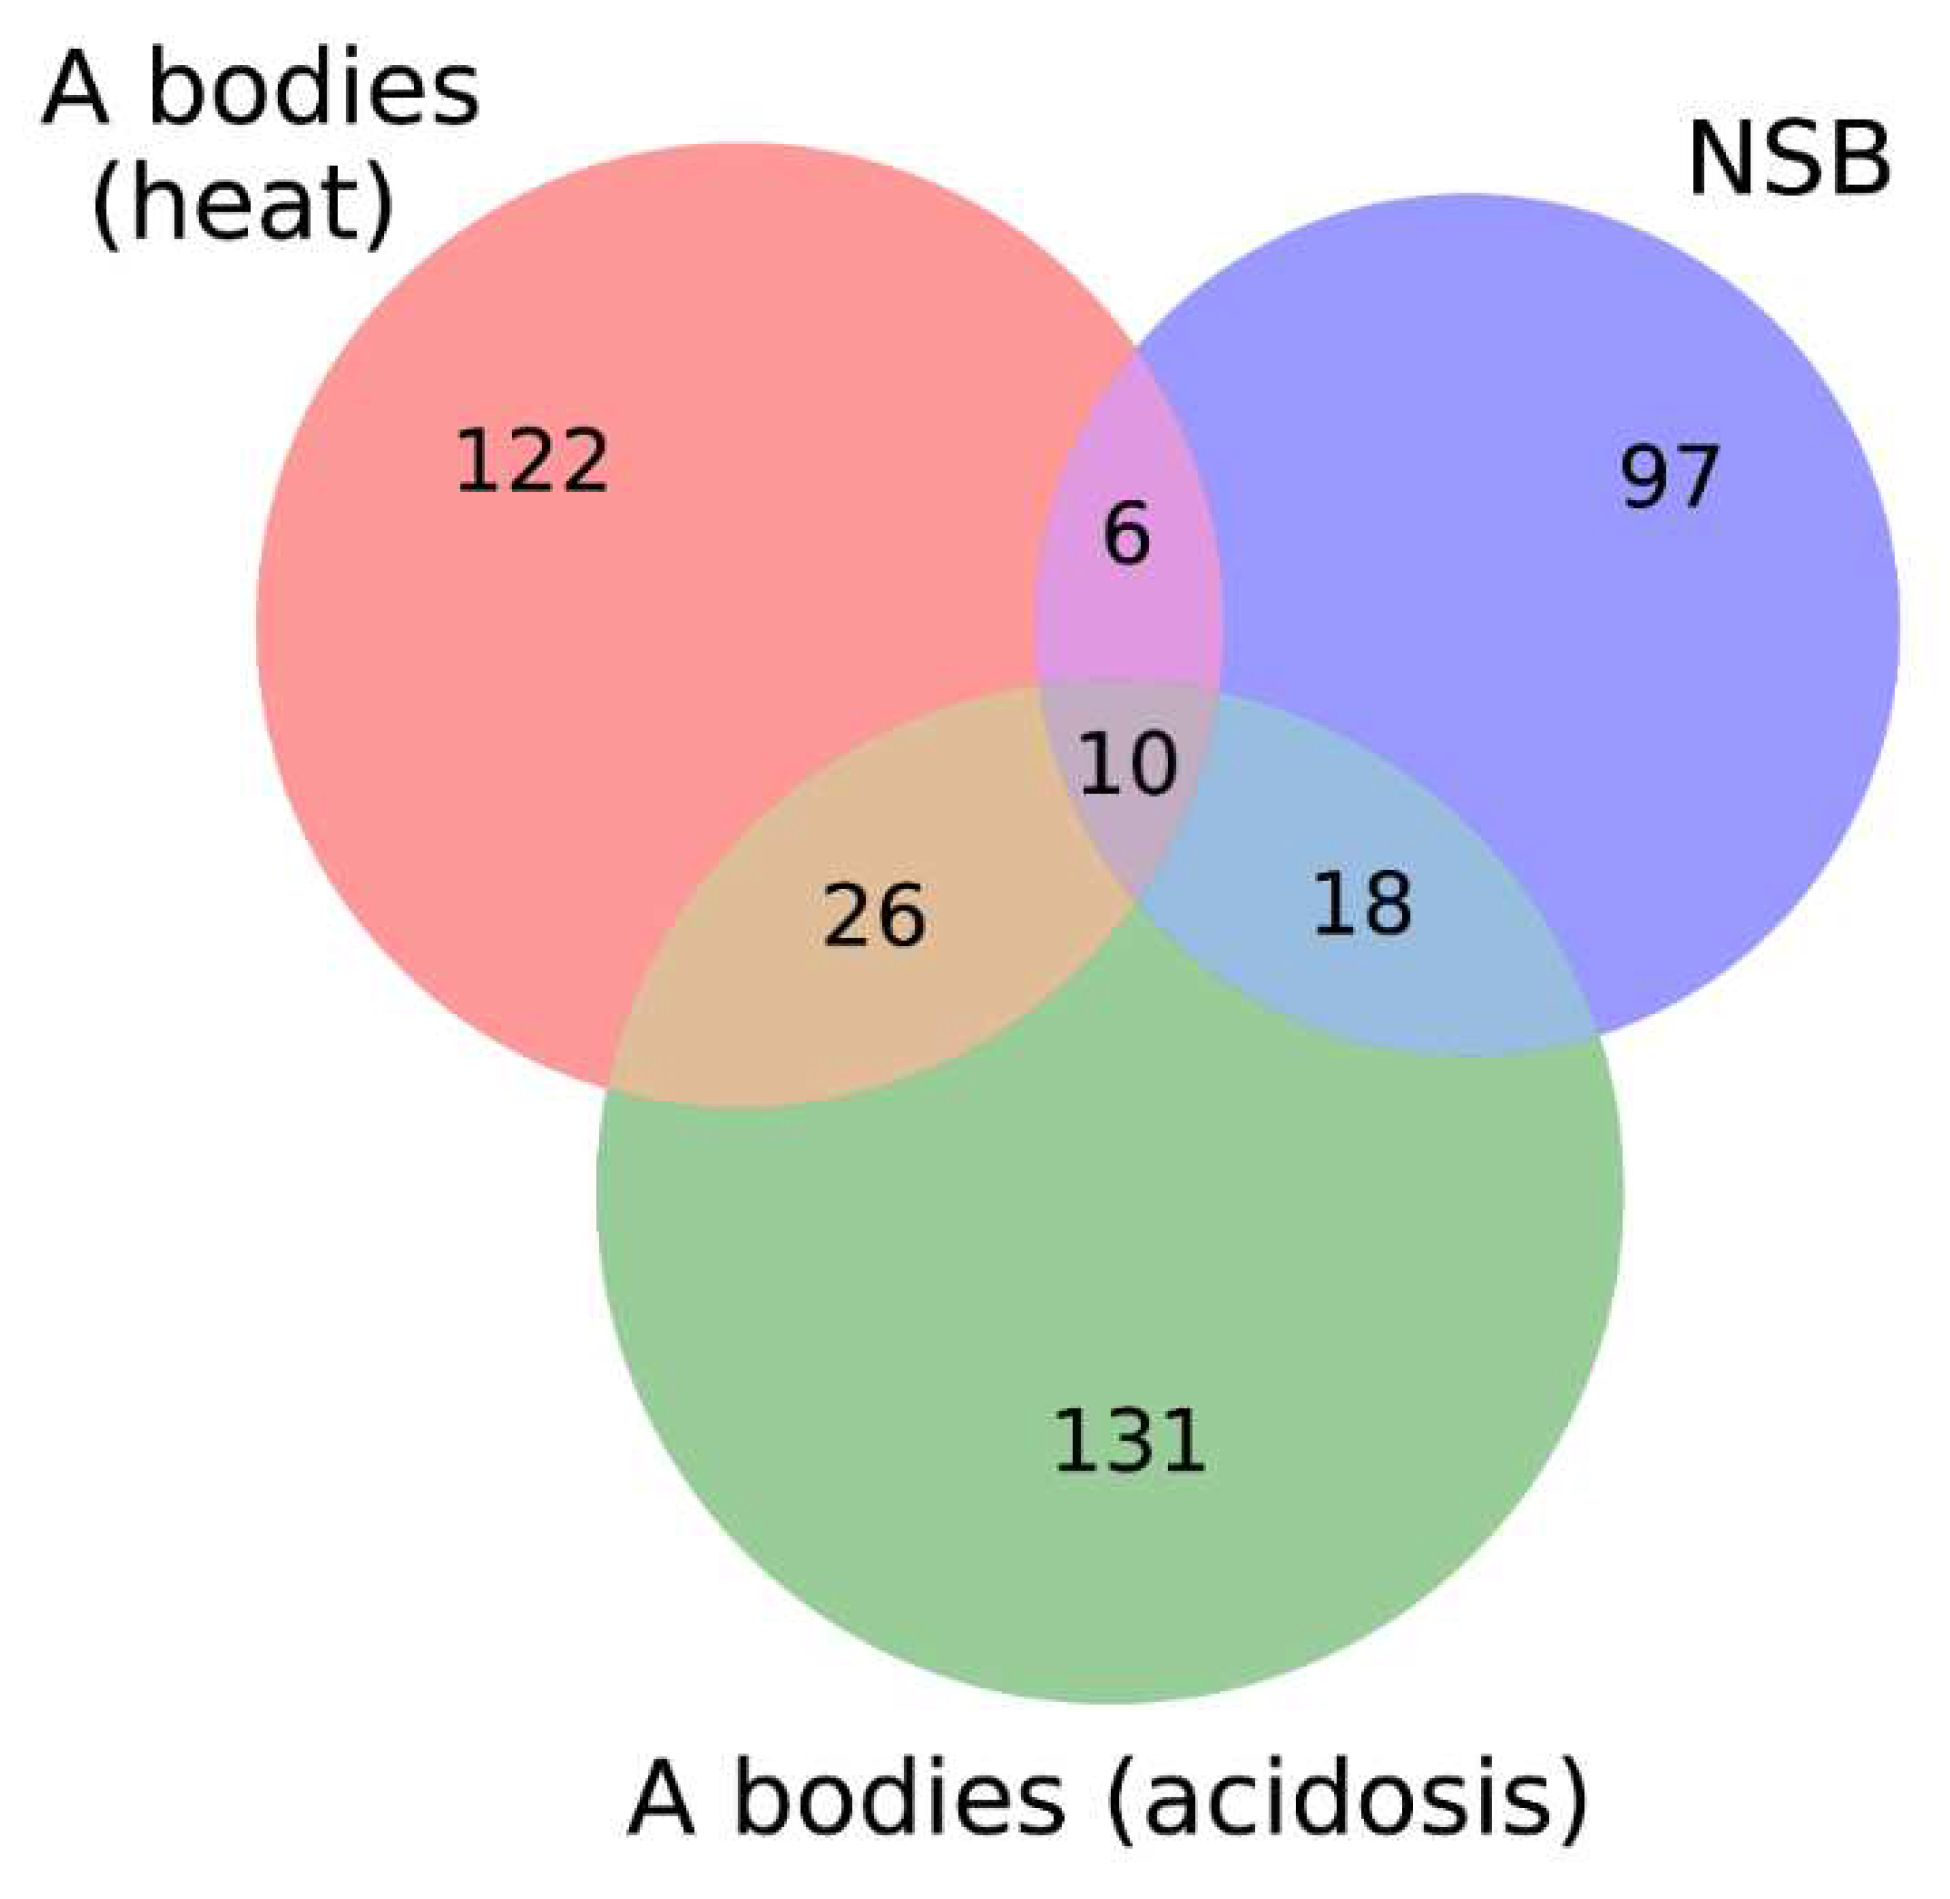
Figure 16.
AlphaFold-generated 3D models of 10 proteins shared by the acidosis-induced A-bodies, heat-induced A-bodies, and nSBs. A. NCL (P19338); B. HNRNPM (P52272); C. CGI-74 (Q9Y383); D. HNRNPA0 (Q13151); E. HNRNPK (P61978); F. RBM39 (Q14498); G. HNRNPH1 (P31943); H. HSPA8 (P11142); I. PPIA (P62937); J. DDX39A (O00148). Proteins are ordered based on their intrinsic disorder propensity as evaluated by PONDR® VSL2.
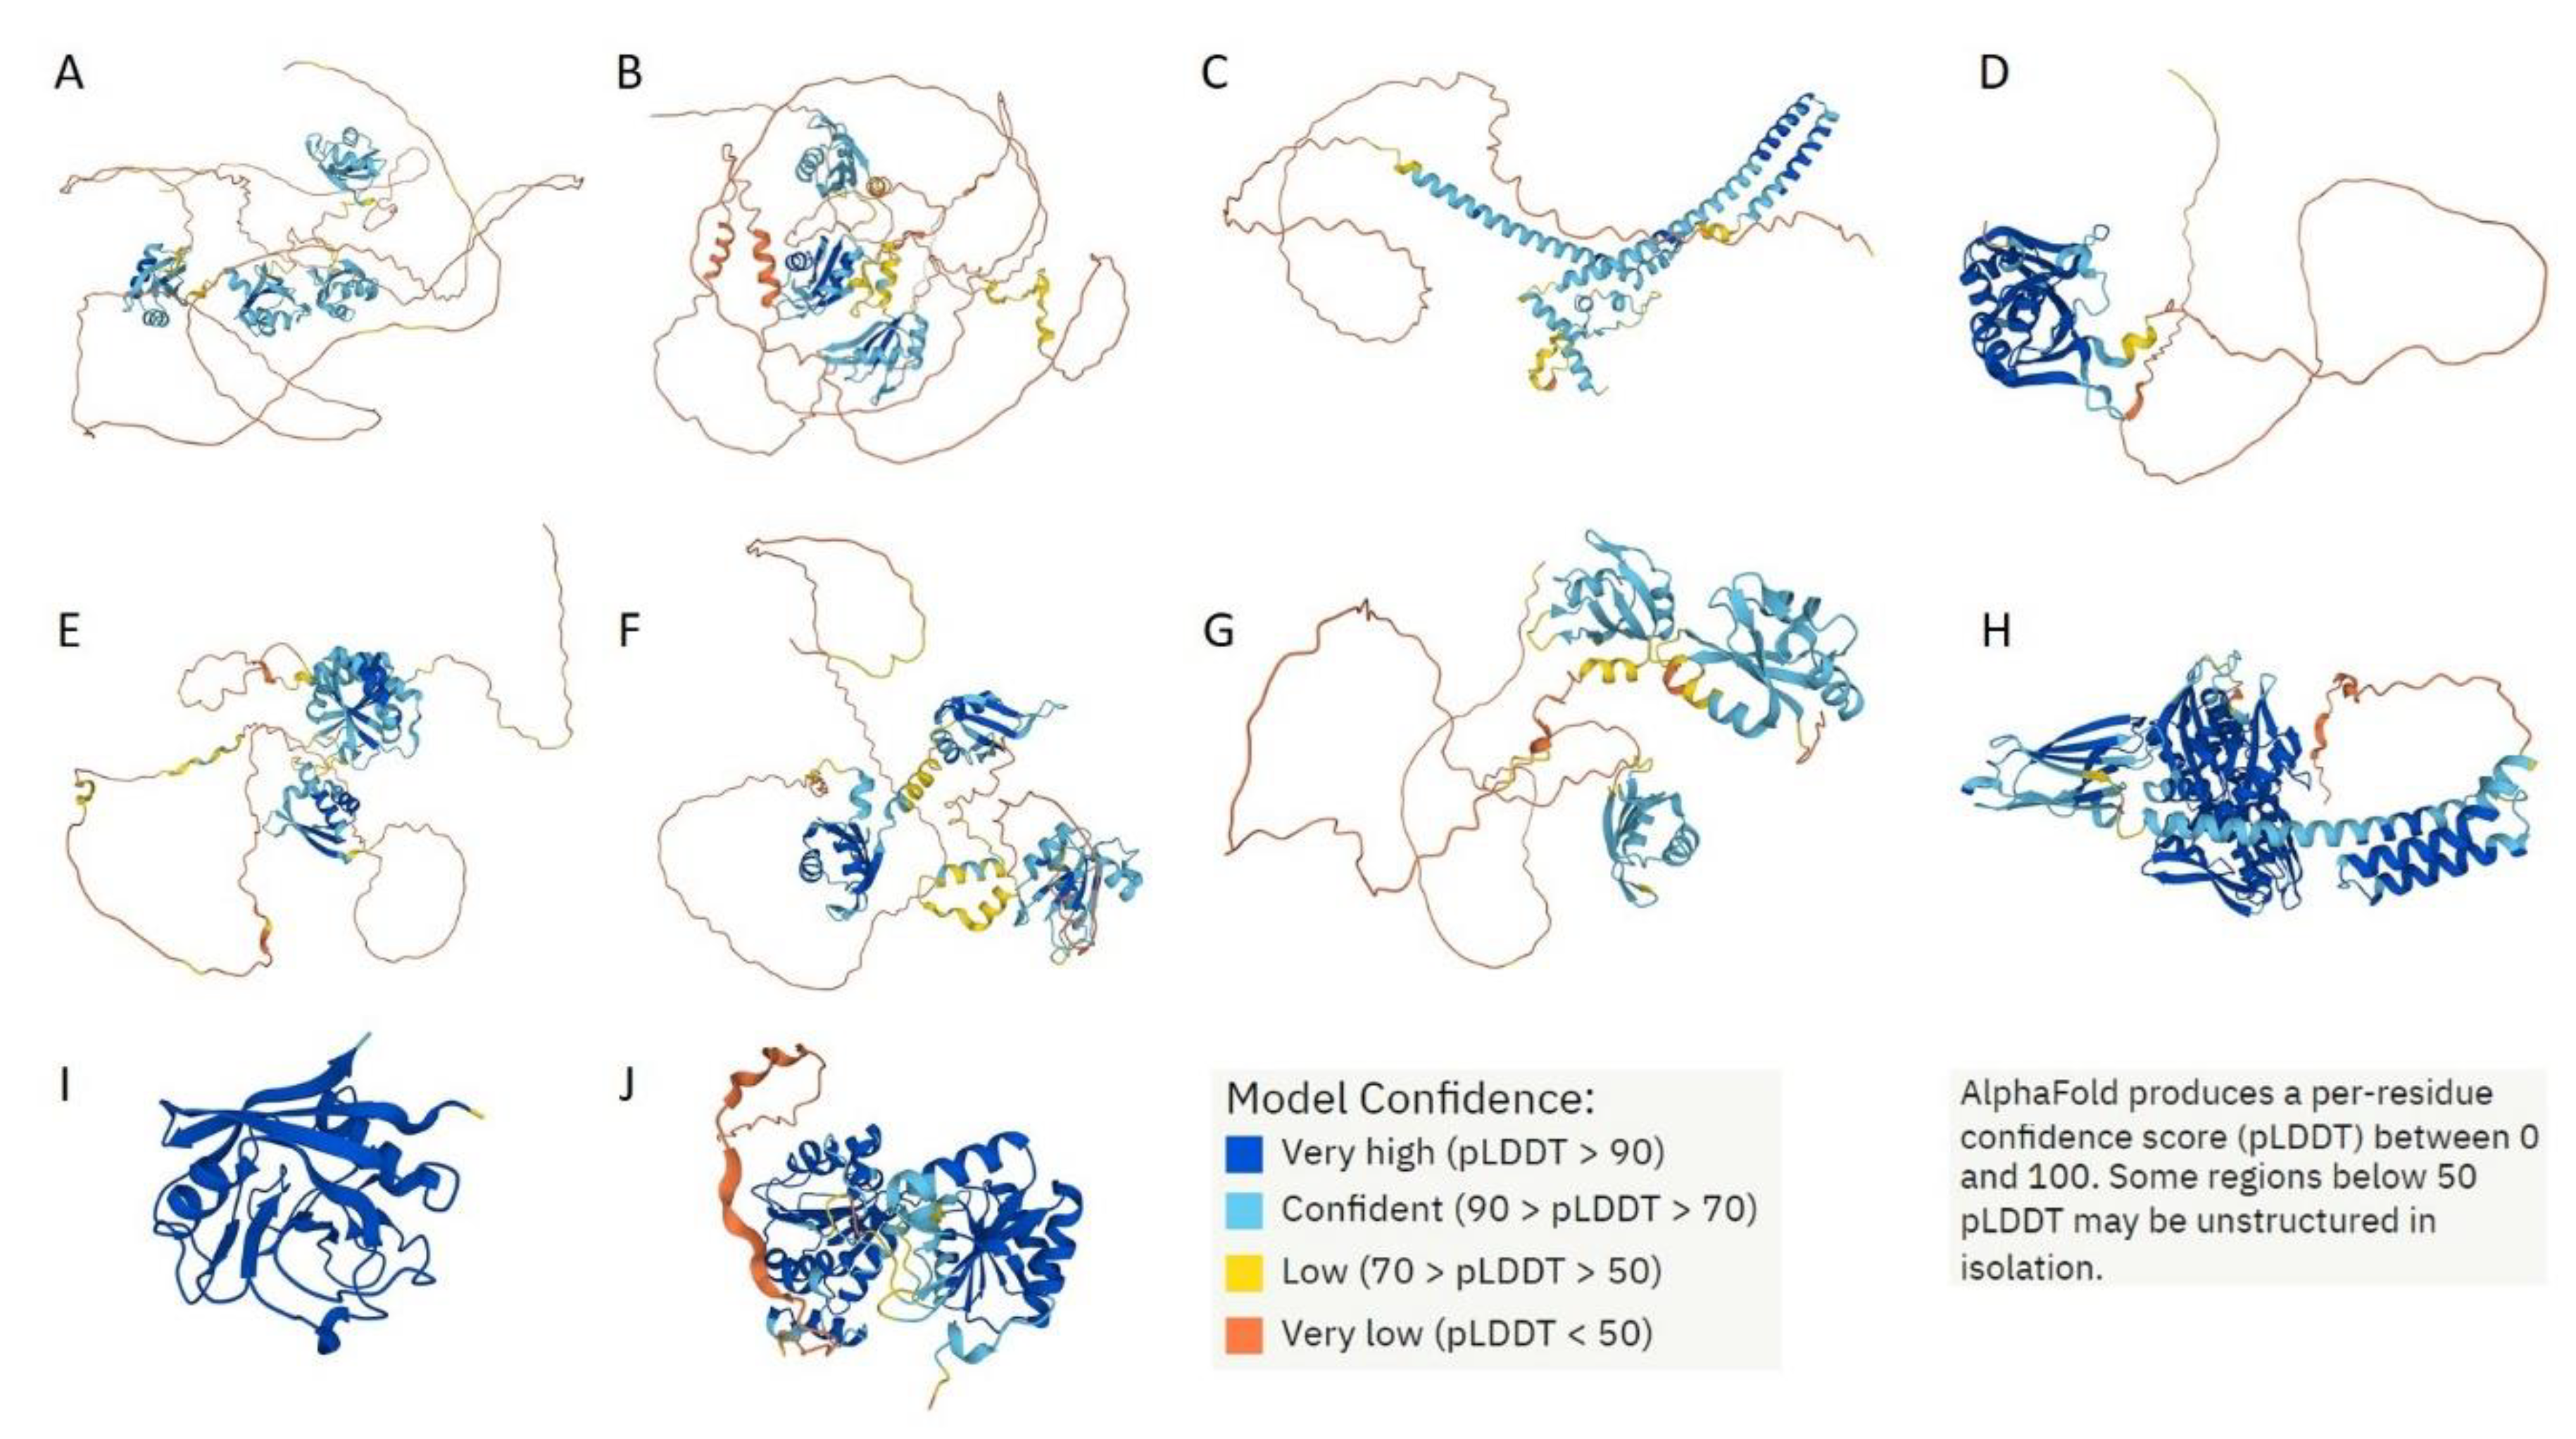
Figure 17.
Functional disorder profiles of A. NCL (P19338); B. HNRNPM (P52272); C. CGI-74 (Q9Y383); D. HNRNPA0 (Q13151); E. HNRNPK (P61978); F. RBM39 (Q14498); G. HNRNPH1 (P31943); H. HSPA8 (P11142); I. PPIA (P62937); and J. DDX39A (O00148) generatewd by the D2P2 platform. Here, the IDPR localization predicted by IUPred, PONDR® VLXT, PONDR® VSL2, PrDOS, PV2, and ESpritz are shown by 9 differently colored bars on the top of the plot, whereas the blue-green-white bar in the middle of the plots shows the agreement between the outputs of these disorder predictors, with disordered regions by consensus being shown by blue and green. The two lines with colored and numbered bars above the disorder consensus bar show the positions of functional SCOP domains [39,40] predicted using the SUPERFAMILY predictor [41]. Positions of the predicted disorder-based binding sites (molecular recognition feature (MoRFs) identified by the ANCHOR algorithm are shown by yellow zigzagged bars [42]. Locations of the sites of different posttranslational modifications (PTMs) identified by the PhosphoSitePlus platform [43] are shown at the bottom of the plots by the differently colored circles.
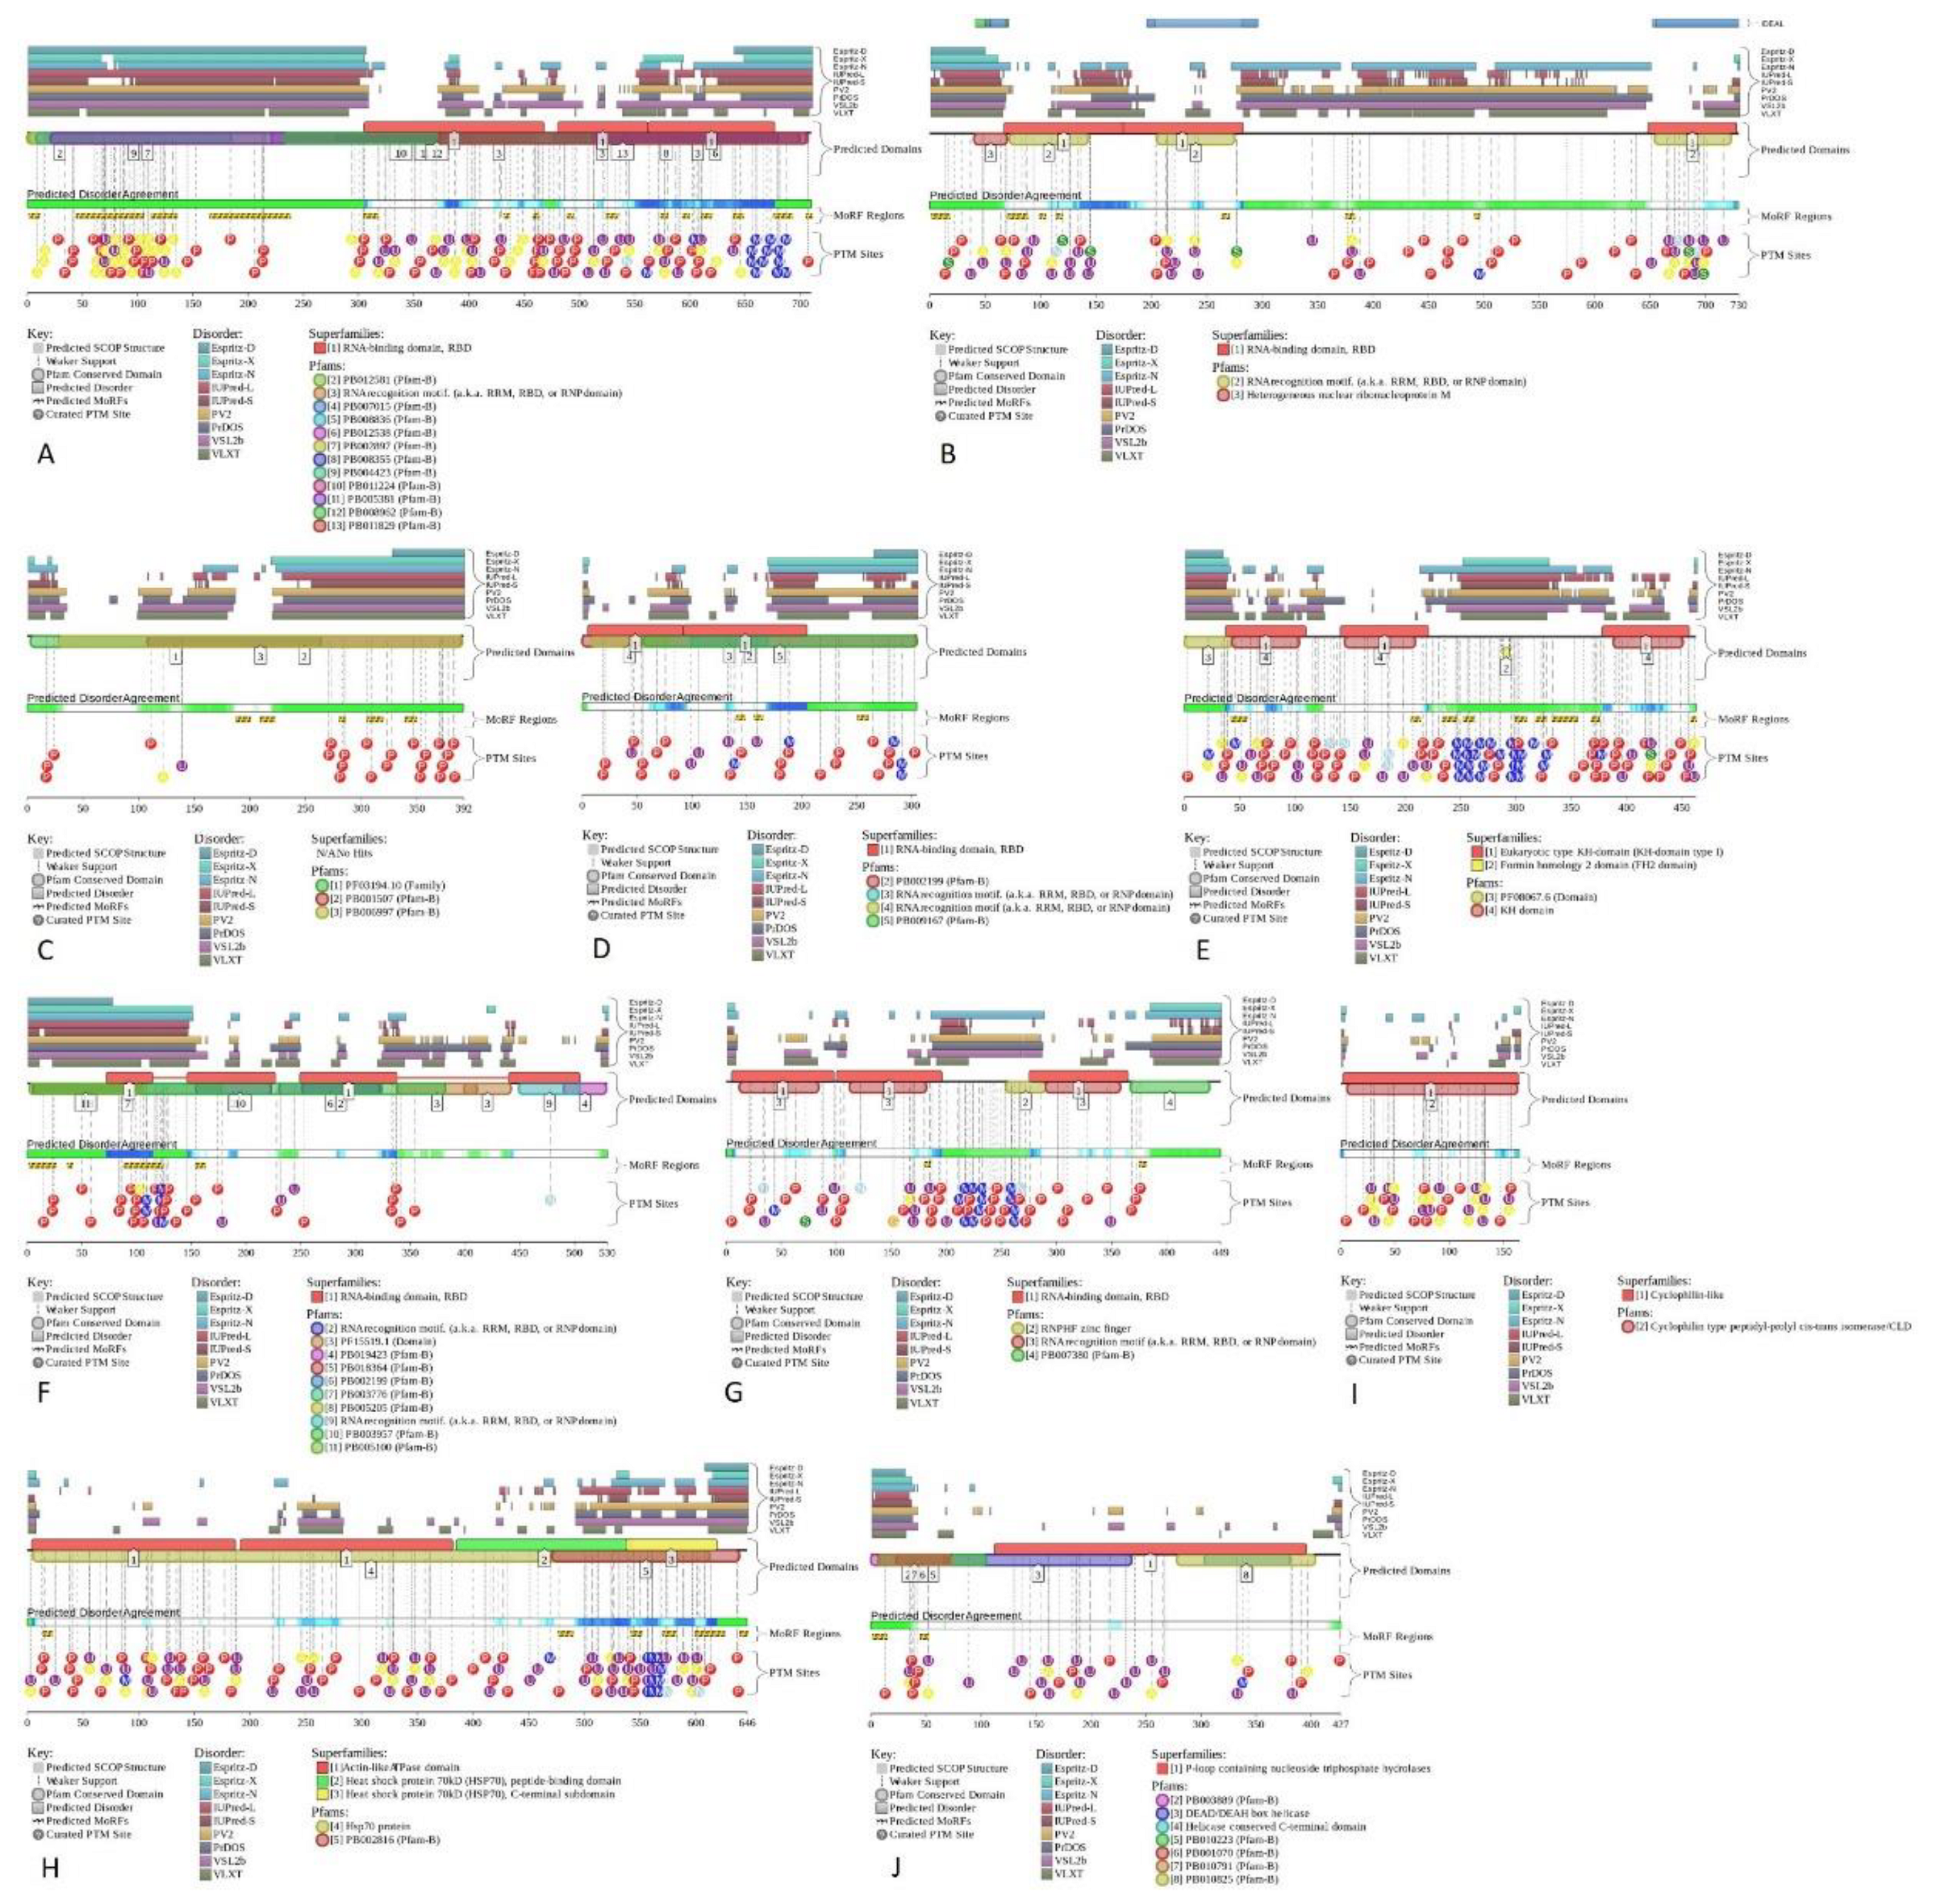
Figure 18.
FuzDrop profiles of A. NCL (P19338); B. HNRNPM (P52272); C. CGI-74 (Q9Y383); D. HNRNPA0 (Q13151); E. HNRNPK (P61978); F. RBM39 (Q14498); G. HNRNPH1 (P31943); H. HSPA8 (P11142); I. PPIA (P62937); and J. DDX39A (O00148).
Figure 18.
FuzDrop profiles of A. NCL (P19338); B. HNRNPM (P52272); C. CGI-74 (Q9Y383); D. HNRNPA0 (Q13151); E. HNRNPK (P61978); F. RBM39 (Q14498); G. HNRNPH1 (P31943); H. HSPA8 (P11142); I. PPIA (P62937); and J. DDX39A (O00148).
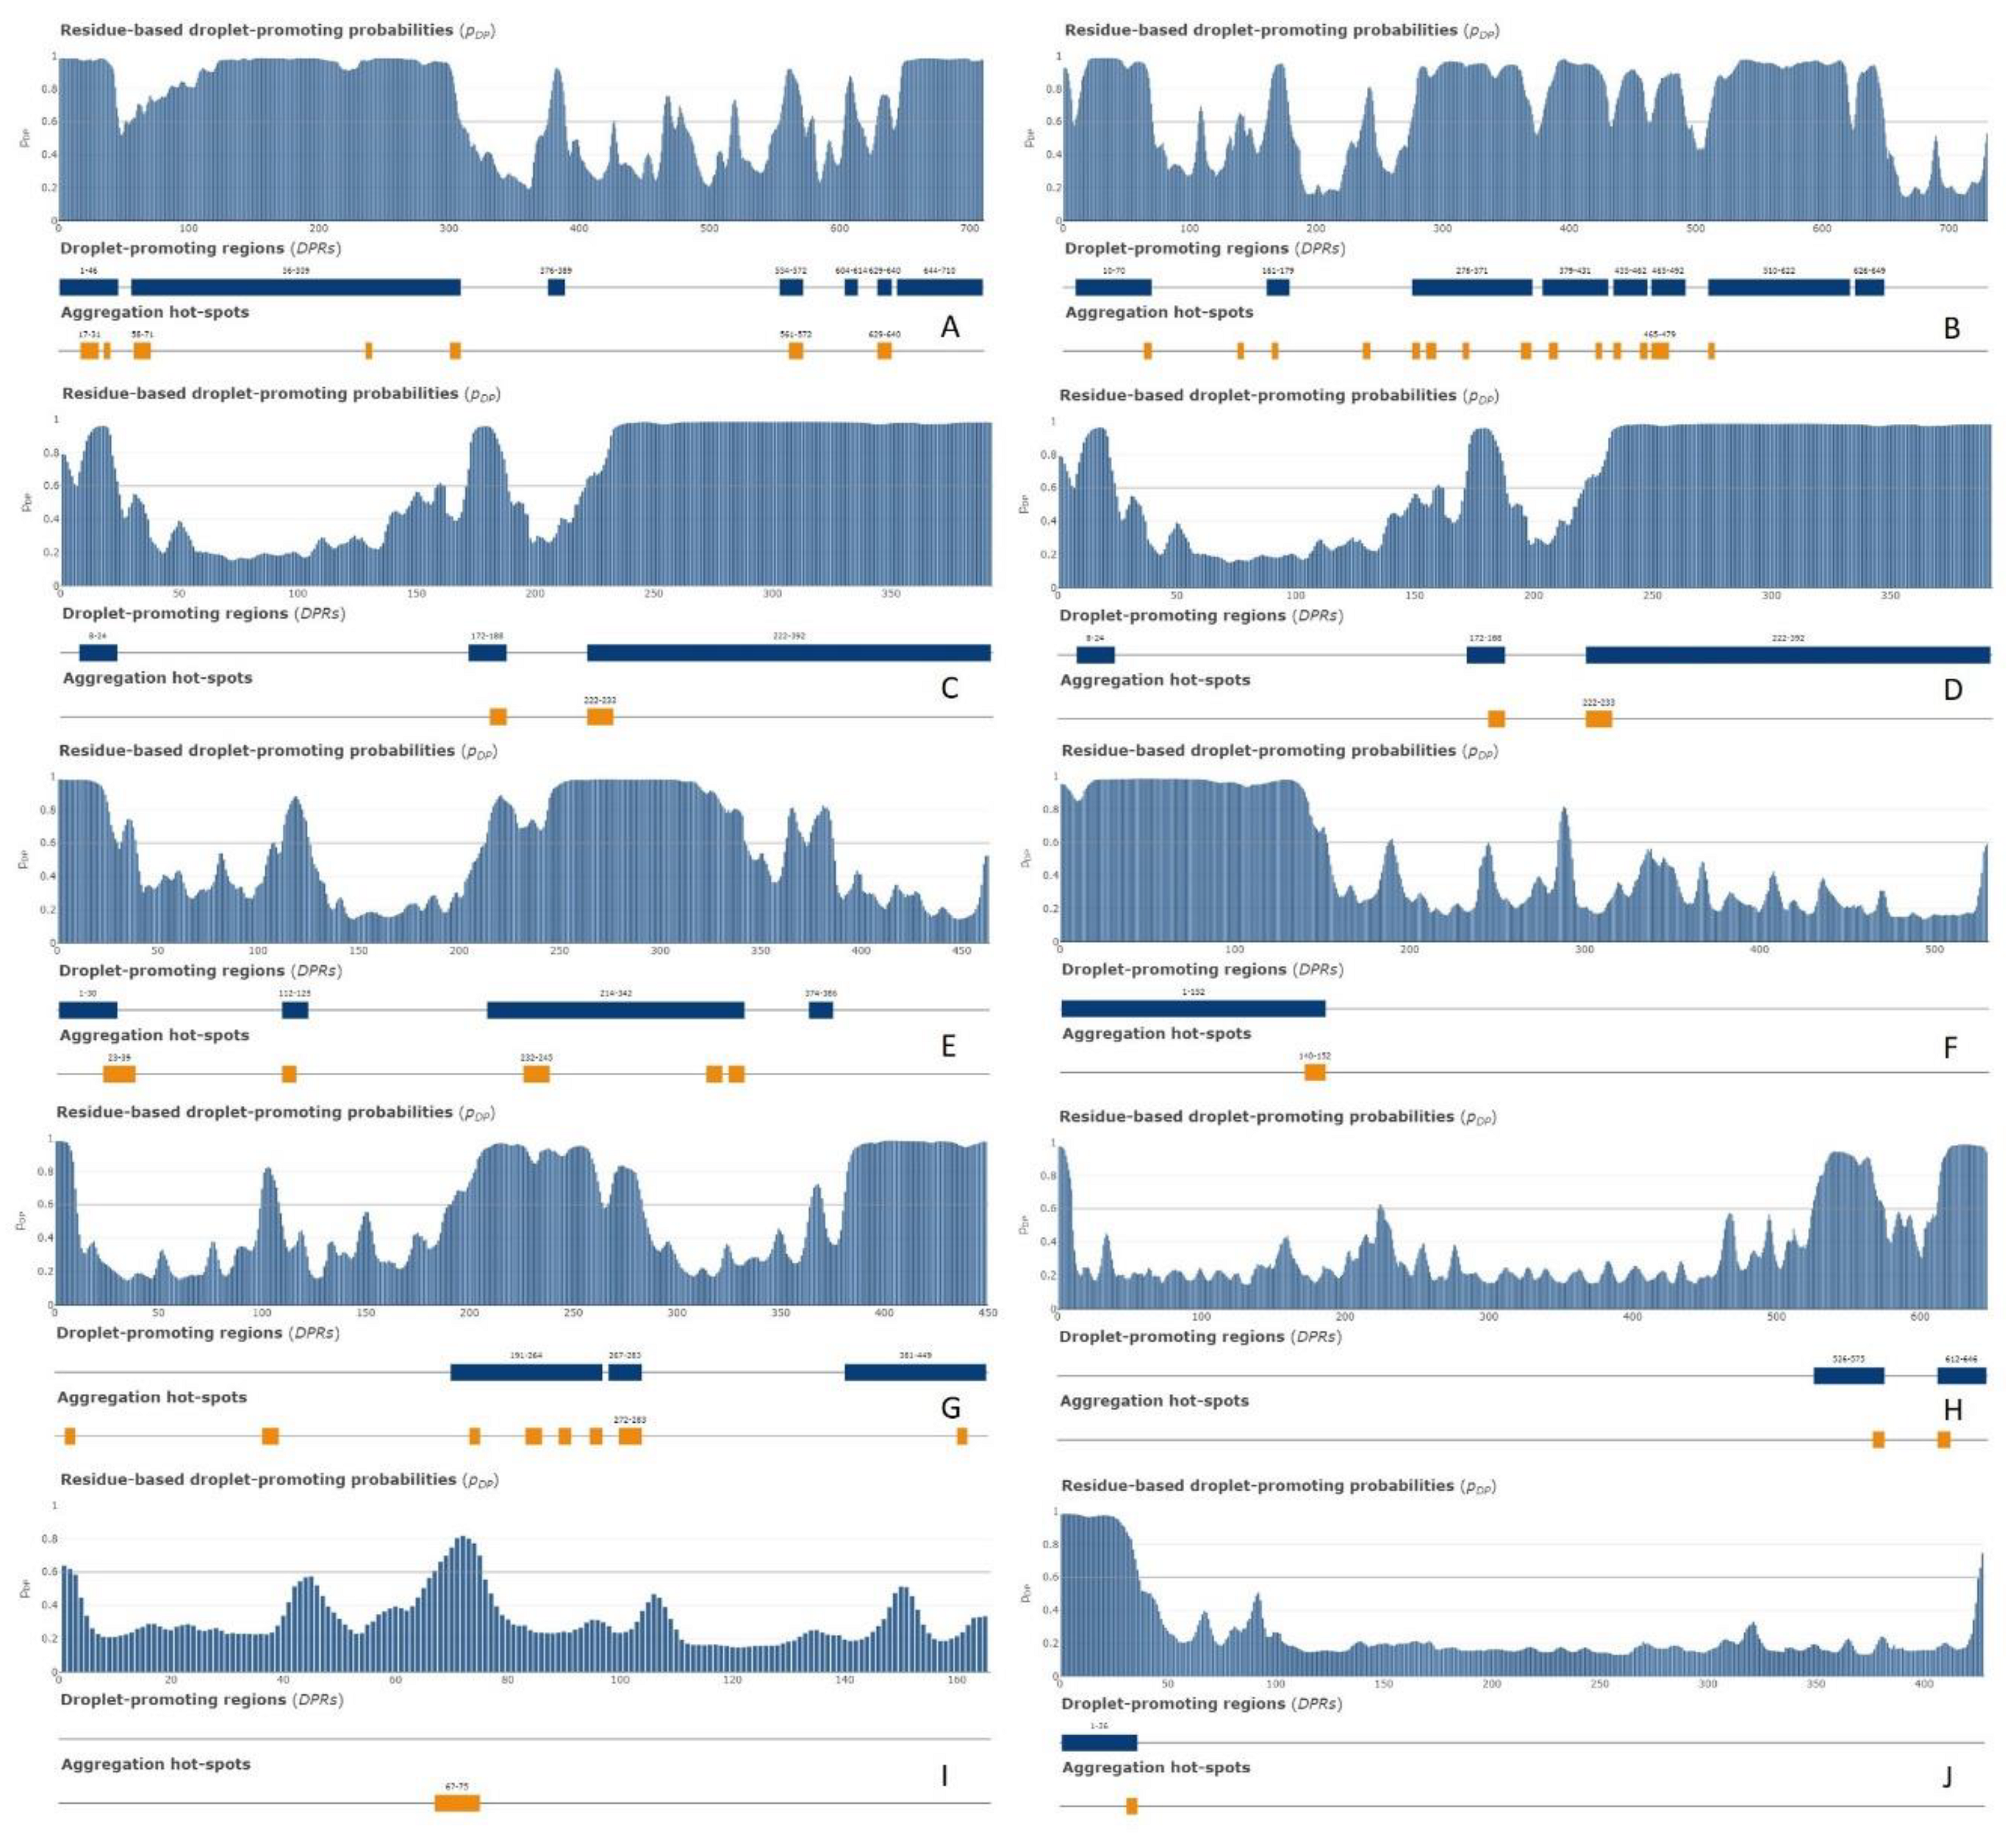
Figure 19.
Network of intersecting proteins between A-bodies and nSBs according to STRING. Network was generated using medium confidence of 0.400 for minimal required interactions. Here, edges represent protein-protein associations that indicate that proteins jointly contribute to a shared function. However, the presence of such associations does not necessarily mean that these proteins are involved in physical interactions with each other. Edges are colored based on the evidence, where known interactions from curated databases and experimentally determined interactions are shown by cyan and pink lines, correspondingly. Predicted interactions based on the gene neighborhood, gene fusions, and gene co-occurrence are shown by green, red and blue lines. Other types of evidence extracted based on text-mining, co-expression, and protein homology are shown by dark yellow, black, and violet lines, respectively.
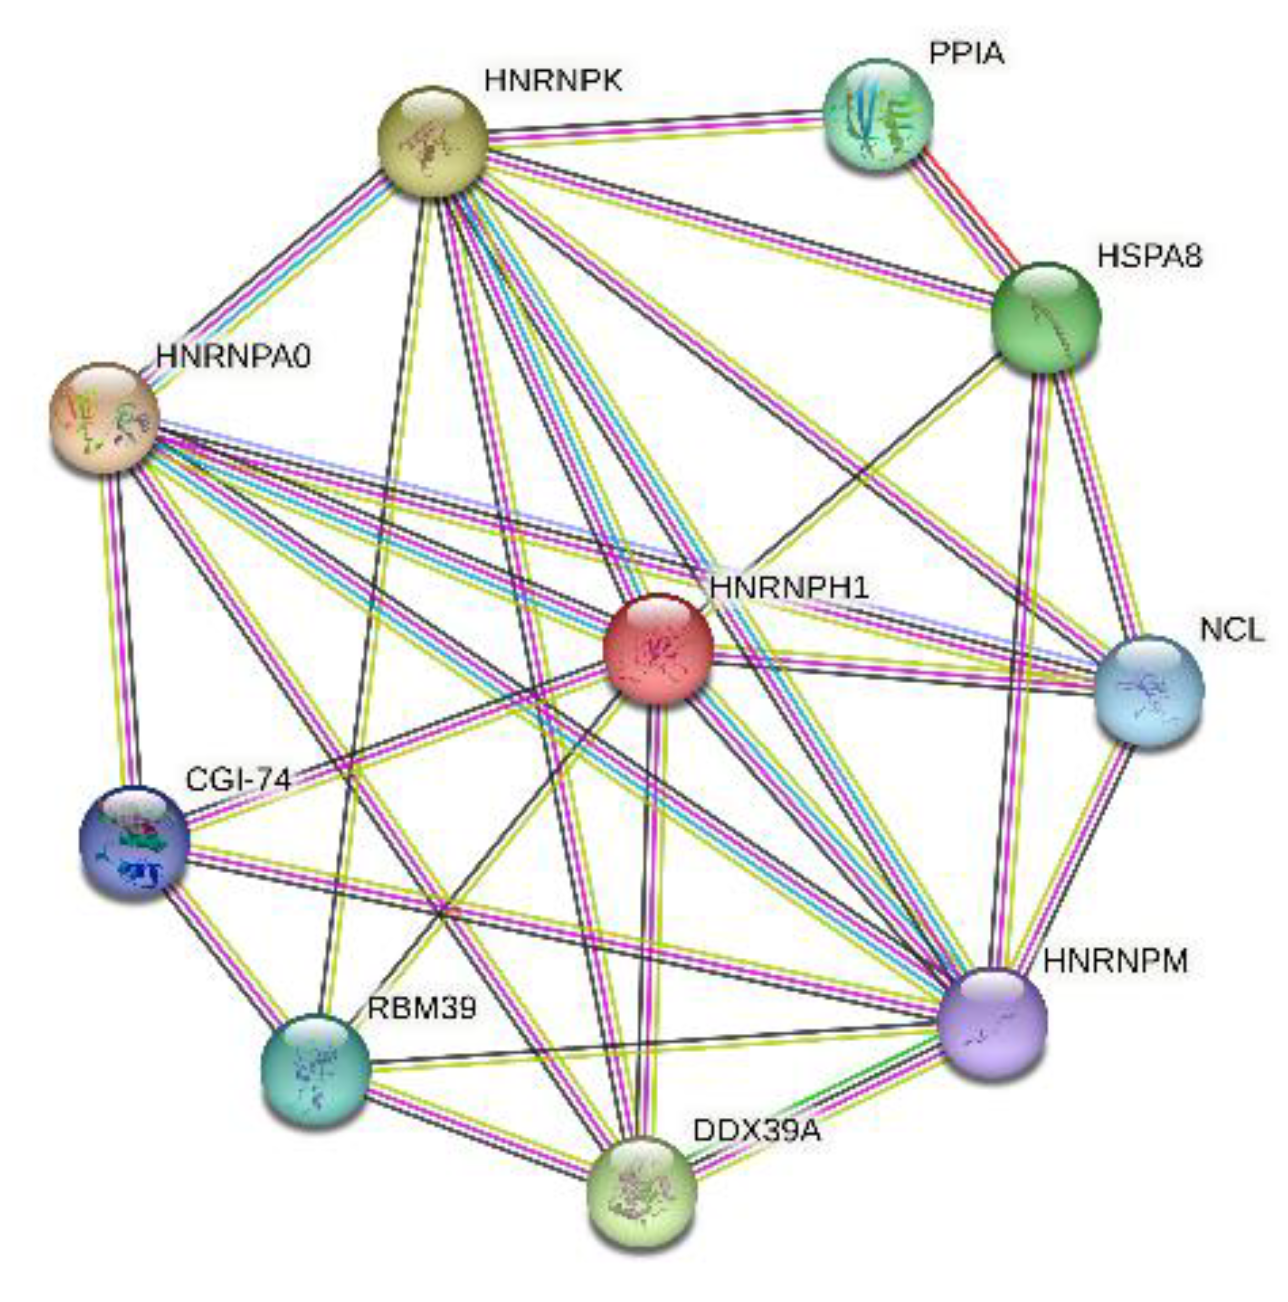
Figure 20.
Interactome of intersecting proteins between A-bodies and nSBs according to STRING. Colors presenting proteins clusters. Thereare 227, 140, and 127 proteins in red, green, and blue clusters, respectively.
Figure 20.
Interactome of intersecting proteins between A-bodies and nSBs according to STRING. Colors presenting proteins clusters. Thereare 227, 140, and 127 proteins in red, green, and blue clusters, respectively.
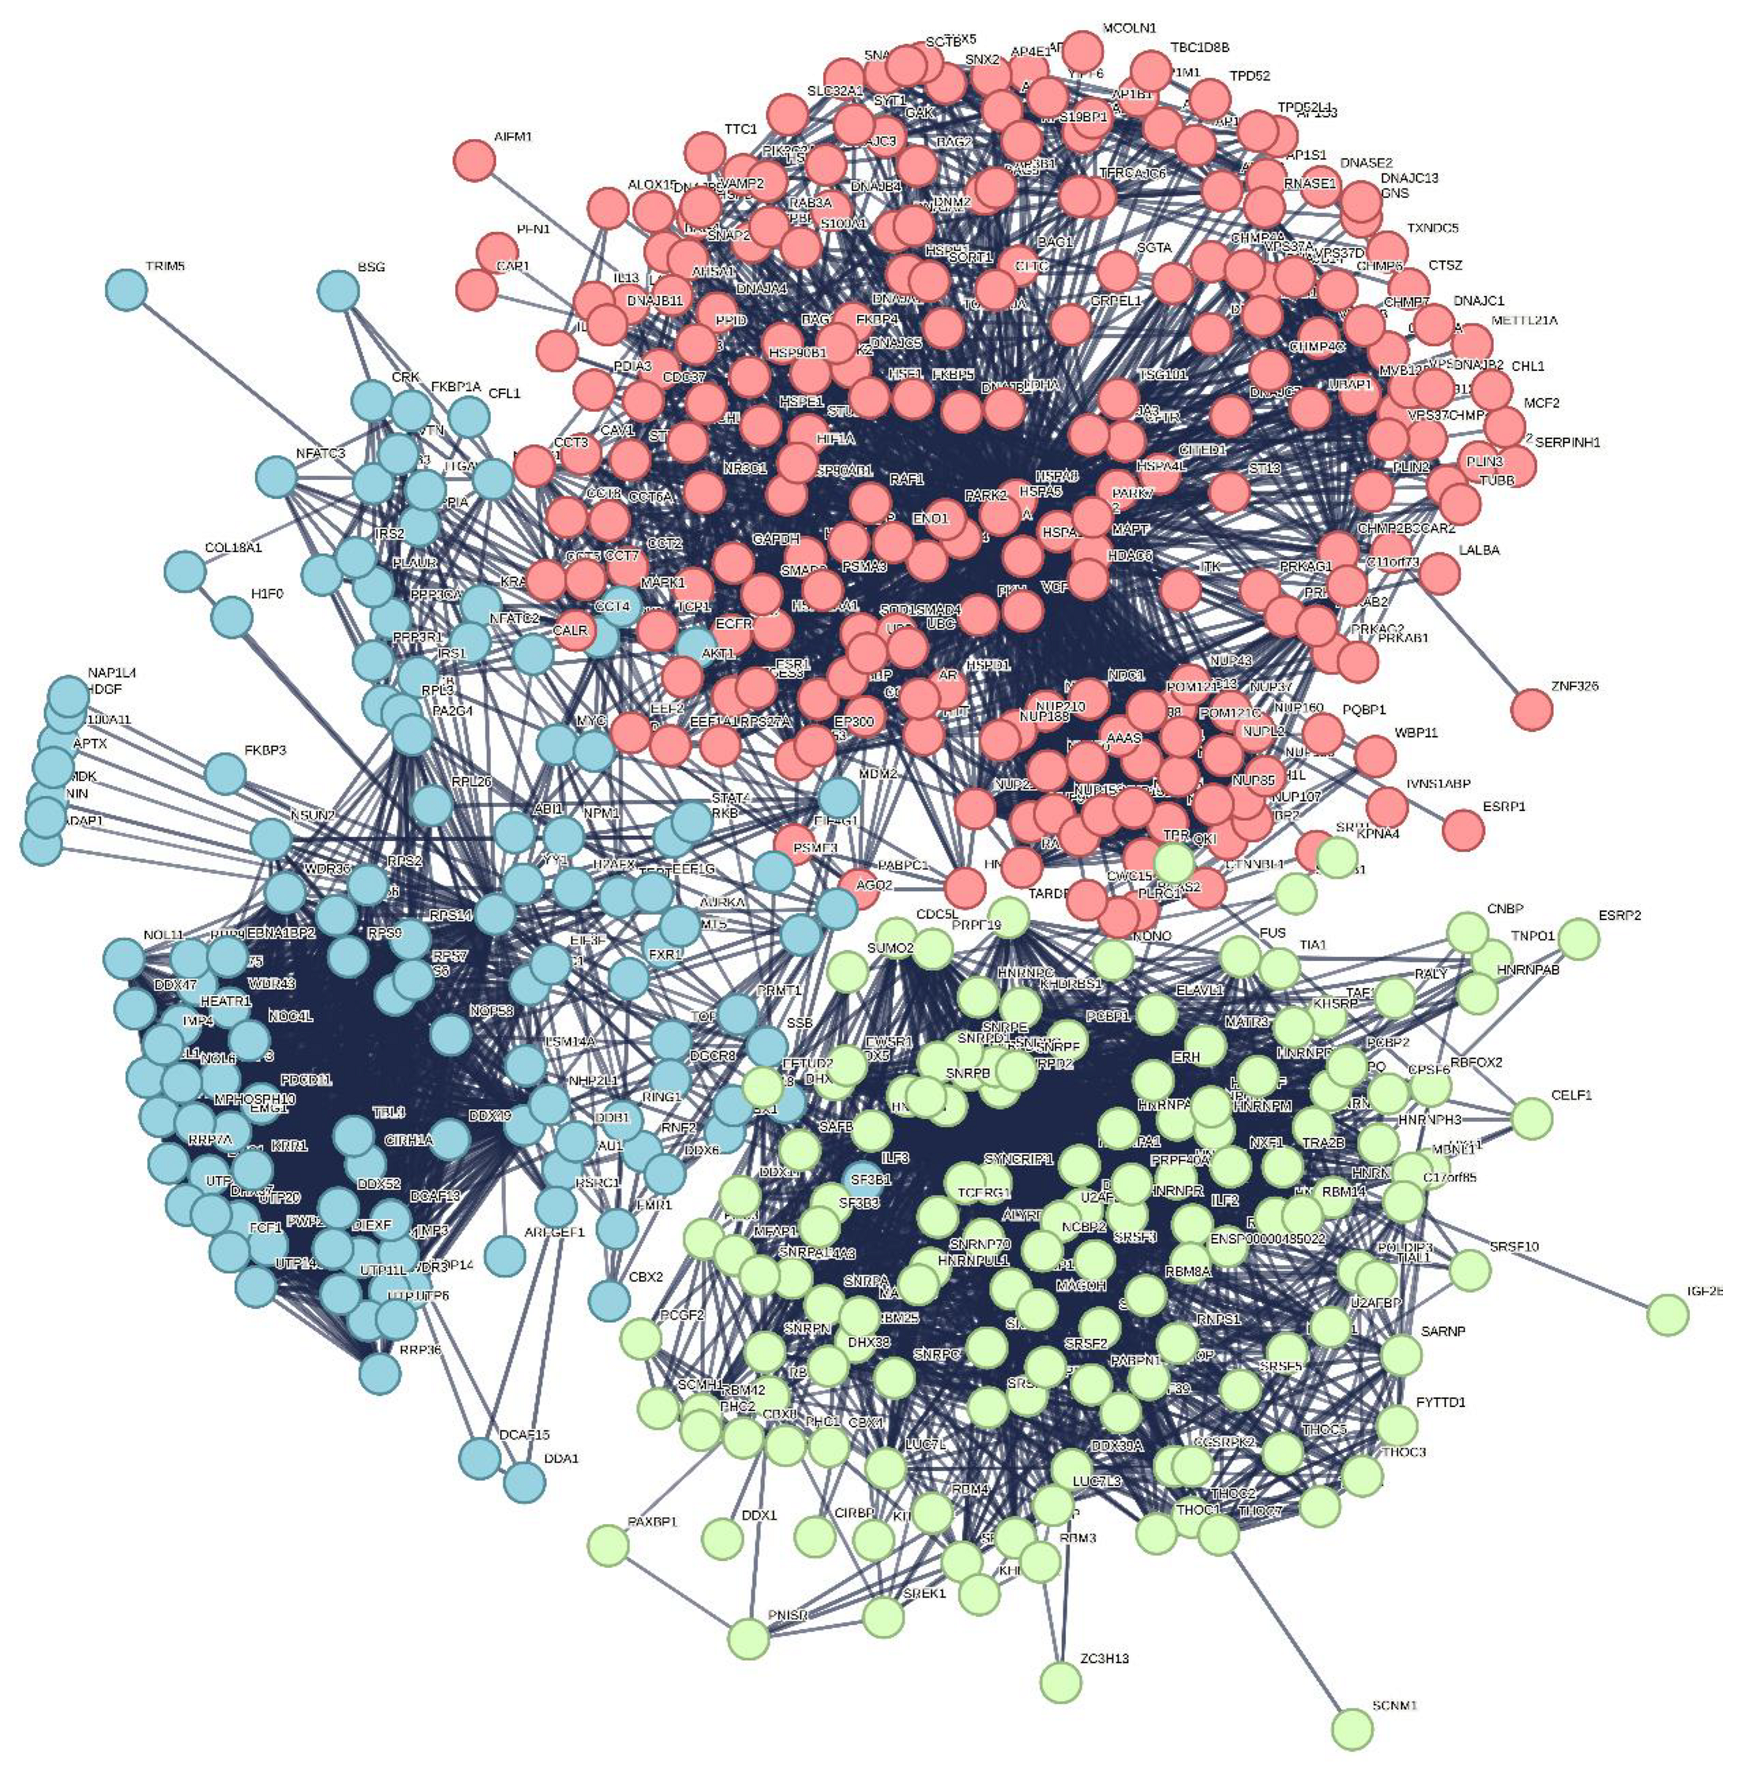

Table 1.
Comparative characteristics of the proteomes of the heat shock-induced and acidosis-induced A-bodies and nSBs.
Table 1.
Comparative characteristics of the proteomes of the heat shock-induced and acidosis-induced A-bodies and nSBs.
| A-Bodies (Heat Shock) | A-Bodies (Acidosis) | nSBs (Heat Shock) | |
|---|---|---|---|
| Proteome size | 164 | 185 | 133 |
| IDP and IDPRs, % | 41 | 56 | 75 |
| LLPS-related proteins | 33 (20.1 %) | 66 (35.7 %) | 89 (66.9 %) |
| Drivers (FuzDrop) | 65 (39.6 %) | 100 (54.1 %) | 102 (76.9 %) |
| Clients (FuzDrop) | 82 (50 %) | 65 (35.1 %) | 24 (18 %) |
| Aggregation-related proteins | 17 (10.3 %) | 14 (7.5 %) | 5 (3.8 %) |
| Average proteome charge | 0.02 | 0.01 | 0.03 |
Table 2.
Comparative characteristics of the intersecting proteins between the A-bodies and nSBs. Green color represents characteristics according to which analyzed protein has high tendency for spontaneously LLPS.
Table 2.
Comparative characteristics of the intersecting proteins between the A-bodies and nSBs. Green color represents characteristics according to which analyzed protein has high tendency for spontaneously LLPS.
| Gene name (UniProt ID) | PER(VSL2b) | FuzDrop Score | PSPredictor Score | FuzDrop and PSP LLPS | DPRs | Role in MLOs | nHS | Na4vSS | Molecular Function |
|
NCL (P19338) |
86.2 | 0.9872 | 0.941 | + | 7 | driver | 17 | -45.4 | RNA binding |
|
HNRNPM (P52272) |
76.3 | 0.9997 | 0.8675 | + | 8 | driver | 18 | -14 | RNA binding |
|
CGI-74 (Q9Y383) |
74.49 | 0.9512 | 0.0666 | +/- | 3 | driver | 2 | -50.2 | RNA binding |
|
HNRNPA0 (Q13151) |
61.97 | 0.9818 | 0.9959 | + | 1 | driver | 5 | -20.5 | RNA binding |
|
HNRNPK (P61978) |
56.8 | 0.9031 | 0.2392 | +/- | 4 | driver | 9 | -19.7 | RNA binding |
|
RBM39 (Q14498) |
51.89 | 0.4127 | 0.5286 | +/- | 1 | client | 17 | -18.5 | RNA binding |
|
HNRNPH1 (P31943) |
51.22 | 0.9486 | 0.9727 | + | 3 | driver | 9 | -16 | RNA binding |
|
HSPA8 (P11142) |
38.7 | 0.3211 | 0.5824 | +/- | 2 | client | 17 | -13.8 | RNA binding |
|
PPIA (P62937) |
20.61 | 0.2089 | 0.0057 | - | 0 | no | 7 | -6.7 | RNA binding |
|
DDX39A (O00148) |
18.27 | 0.1354 | 0.0079 | - | 1 | client | 16 | -4 | RNA binding |
Disclaimer/Publisher’s Note: The statements, opinions and data contained in all publications are solely those of the individual author(s) and contributor(s) and not of MDPI and/or the editor(s). MDPI and/or the editor(s) disclaim responsibility for any injury to people or property resulting from any ideas, methods, instructions or products referred to in the content. |
© 2023 by the authors. Licensee MDPI, Basel, Switzerland. This article is an open access article distributed under the terms and conditions of the Creative Commons Attribution (CC BY) license (https://creativecommons.org/licenses/by/4.0/).
Copyright: This open access article is published under a Creative Commons CC BY 4.0 license, which permit the free download, distribution, and reuse, provided that the author and preprint are cited in any reuse.


