
Submitted:
10 January 2025
Posted:
13 January 2025
You are already at the latest version
Abstract
With the increasing attention paid to user oriented design and services, the term Co-design, a form of user participatory design, is increasingly mentioned. Previous studies have shown that Co-design could better satisfy user needs in process and results, but there are few studies that have been empirically validated through neuroscience methods. Therefore, this study used fNIRS (functional near-infrared spectroscopy) to measure the brain blood oxygen data (HbO2 & Hb) of both "designer" and "user" participants from design and non-design majors during Traditional and Co-design tasks. The IBS (inter-brain synchronization) between participants were calculated using wavelet coherence packet in Matlab. Research has found Significant activation of DLPFC (dorsolateral prefrontal cortex) and BROCA (pas triangularis Broca's area) was observed in both tasks, with more significant activation observed in Co-design tasks, and IBS activation was significantly positively correlated with needs satisfaction rate. The results showed that Co-design could better activate DLPFC and BROCA brain regions compared to Traditional design, which further supports previous research and expands the possibility of collaborative task paradigms. The increase in Co-design IBS compared to Traditional design also represents better collaborative performance, and could provide empirical evidence for participatory design based on neuroimaging.
Keywords:
Co-design
; fNIRS
; Hyperscanning
; IBS
; Wavelet coherence
1. Introduction
The predecessors of Co-design include Action Research and Socio technical Design, which emerged alongside the development of participatory design [1]. It can be traced back to Scandinavia in the 1970s and is also considered the earliest form of participatory design [2], also known as cooperative design. Since then, the advantages and importance of interdisciplinary collaboration have gradually emerged, and designers are increasingly eager to approach the future users their designs are aimed at [3]. Therefore, a method called action research has developed and evolved in the field of design practice. This method emphasizes the need for active collaboration between researchers and workers, by providing feedback to researchers based on their practical experience, in order to optimize and improve the actual work situation of staff [4].At the same time, the participatory design movement has been widely spread around the world. In September 1971, the British Manchester Design Research Association held a conference called "Design Participation". In the preface of the conference, Cross pointed out the responsibility of designers in predicting the adverse effects of projects and emphasized the need for new design methods to address the constantly upgrading problems of the artificial world. He believed that involving people in decision-making may be of certain importance, and since then, users and consumers have gradually been given more initiative and influence [5]. To this day, user centered design methods are unable to address the scale and complexity of challenges faced by the design industry. Therefore, instead of simply designing products centered around users, we are beginning to explore Co-design services between designers and stakeholders such as users, which is a practice of involving users in the innovation process.
The trend in design applications is to leverage the characteristics of collaborative design to meet user needs. As a design methodology, it involves involving users throughout the design process to jointly complete activities such as requirement analysis and creative generation [6], in order to ensure that the final product or service better meets users' needs, expectations, and preferences. Czyzewski [7] first defined it as a system design carried out jointly with users as an expert; Kuhn [8] believes that it is a role exchange that involves designers in the user world and allows users to directly participate in the design; Gregory [9] views this design as a process in which users and designers become partners and collaborate to create knowledge; Kanstrup [10] takes the exploration of user driven innovation by end-users as the perspective and approach for such designs.The summary of various viewpoints makes it clear that collaborative design is a method that emphasizes the use of strong participatory approaches such as collaboration, respect, participation, and co construction, with both users and designers as the main body. It is hoped that users can be deeply involved in the design process to drive innovation. Collaborative design effectively implements the design concept of "people-oriented". Compared with the user centered design concept, users are no longer passive choices, ensuring the scientific nature of the design. Collaborative design is also an important direction for product design reform, providing a good design method to better meet users' emotional needs and reflect personalization. Collaborative design from multiple parties has been widely applied in fields such as education, politics [11], and healthcare [12], and has produced services and systems that better meet the needs of the public.
Empirical research on neurobehavior is an effective path for objectively observing team collaboration tasks. The complexity and implicit nature of cooperation level in the collaborative process of multi-party team tasks make it impossible to meet current observation needs solely through subjective evaluation methods. Neuroscience is a discipline that studies the impact of the nervous system on behavior and cognition, using methods such as functional near-infrared spectroscopy brain imaging fNIRS [13], EEG (electroencephalography) [14], fMRI (functional magnetic resonance imaging) [15], and MEG (magnetoencephalography) [16] to help understand brain functioning. Among them, super scanning technology is widely used as the main method in research on different types of team activities. The concept of superscan was first proposed by Montague in 2002 [17]. This is a technique that can simultaneously collect changes in brain activity from two or more individuals [18]. Dumas [19] found that it can not only observe the activity of individual brain regions, but also pay attention to the synchronicity of brain activity among multiple individuals. IBS is considered a consistent response observed through neuroscience, meaning that when two or more experimental participants complete a specified task, the correlation between activity signals recorded in relevant brain regions can be considered as similarity or synchronicity of brain activity.In the context of teamwork, the rise of IBS can be seen as a coordination and synchronization of neural activity among team members. This synchronicity may help team members better understand and share each other's ideas, thereby promoting team creativity. This technology provides support for observing how people receive ideas from others and think about feedback in team tasks. Among them, fNIRS has better tolerance to head movements and non invasiveness [20], and has been successfully applied in fields such as sports [21] and face-to-face communication [22]. In addition, the research results of fNIRS have laid a theoretical foundation for the psychological theory of team tasks [23], and provided technical support for their psychological cognitive assessment and psychological state observation. Therefore, this technology is considered to have practical value and prospects in the field of team collaboration research.
The working principle of fNIRS imaging relies on the absorption law of light in different media, that is, the wavelength of light and the type of medium have an impact on the absorption coefficient of light in the medium. Among them, HbO and Hb are sensitive to near-infrared light with wavelengths of around 760nm and 850nm, respectively. Therefore, in the near-infrared ultra scanning experiment, the instrument uses 760mm and 850mm types of light as the emitting light sources. Light passes through the scalp, skull, and is ultimately absorbed by HbO and Hb in the cerebral cortex capillary blood. Calculate the changes in local HbO and Hb concentrations using BLL (Beer-Lambert Law). The basic theory of fNIRS imaging is the neurovascular coupling mechanism [24], which states that there is a relationship between local neural activation and changes in cerebral blood flow, and the cerebral blood flow supply responds locally to changes in functional activity. After stimulation, the cerebral cortex consumes HbO, leading to an increase in Hb concentration. Subsequently, the compensatory effect of cerebral blood flow causes capillaries to dilate and flow into fresh blood, resulting in an increase in HbO concentration and a decrease in Hb concentration. This process is consistent with the HRF (hemodynamic response function) [25]. When the brain is induced by specific tasks, relevant brain regions are functionally activated, and due to the existence of neurovascular coupling mechanisms, the changes in brain oxygen levels in these regions have significant characteristics during this process. When fNIRS imaging is performed in the region of interest of the brain, activated dynamic contours can be observed, providing rich spatial information.
WTC (Wavelet Transform Coherence) is a technique for examining the correlation between two time series at particular frequencies and time intervals. In neuroscience, it is frequently employed to assess the synchronization of neural activity across various brain areas or among different individuals [26]. This approach allows scientists to uncover interaction patterns at the neural level and subsequently investigate the possible associations between tasks and brain regions within these patterns.
2. Materials and Methods
2.1. Participants
A total of 60 adult university students (30 pairs, 30 males and 30 females)participated in this study, aged from 18 to 25 years old. Each pair comprises a design and a non-design professional participant, assuming the roles of "designer" and "user" respectively. Due to partial data loss, one pair of subjects was not used as a reference, while the remaining 29 groups were used. The experimental setup was configured as illustrated in Figure 1. Prior to commencing the study, all participants were provided with and signed informed consent documents, and the research protocol received formal approval. Upon completion, each individual was compensated for their participation.
2.2. Experimental Procedures
The study includes two types of task rounds: Traditional and Co-design. Each round consists of five blocks, namely a 5-minute Experience for prototype design, a 10 minute Communicate between users and designers, a 15 minute Draw for Co-design guided by designers, a 5-minute Explanation of improved design, and a 5-minute Evaluation of improved design by users. The order of Traditional and Co-design for each round is random. In the formal experiment, one round lasts for 45 minutes, totaling approximately one and a half hours. All groups have participated in both Traditional and Co-design tasks, as follows, as shown in Figure 2.
2.2.1. Traditional Design Tasks
Traditional design tasks are based on the realistic traditional design patterns for situational reconstruction. In traditional design patterns, creative sources usually come from user research, which has the characteristics of low user participation, untimely feedback, few iterations, invisible processes, and late user verification. Its flexibility is low and it is difficult to adapt to changes in user needs in a timely manner.
Therefore, in the communication process after the initial design experience, it is necessary to pay attention to the form of question and answer in conjunction with the questionnaire board to explore the psychological needs of users. When designers start to make targeted improvements and drawings, partitions will need to be placed to restore the invisibility in traditional design process.
2.2.2. Co-Design Tasks
The Co-design pattern is based on the commonly used participatory design design workshops and generative toolkits in existing research. In reality, Co-design users can participate in the design team to collaborate on design, with high user participation, rapid prototyping, joint improvement, continuous feedback to guide decision-making, real-time iterative verification, and high flexibility. It can better adjust according to user feedback needs.
Therefore, in the communication and drawing process after the initial design experience, real-time dialogue can be used to express one's own needs and provide suggestions and iterations for improvement points using a simple generative toolkit.
2.3. Data Collection
2.3.1. Blood Oxygen Data
Data acquisition was performed utilizing two Artinis Brite 24 fNIRS systems to monitor oxyhemoglobin and deoxyhemoglobin concentration variations in participants' frontal lobes during both Traditional and Co-design activities. A standardized swimming cap was equipped with two "3×3" measurement arrays, which were securely positioned on each subject's head to enable frontal cortex monitoring. The optode arrays were symmetrically aligned across the forehead region of all participants, with the precise configuration illustrated in Figure 3.
The central emitters and detectors were precisely aligned along the cranial midline, following the anatomical arc from the nasion through Cz to the inion. To ensure proper vertical alignment, the caps were positioned low on the forehead with their base resting along the eyebrow line, thereby providing adequate forehead coverage and maintaining consistent vertical placement across participants. For each dyad, the cap positioning was carefully examined and adjusted to ensure equivalent placement. Each measurement array contained an alternating configuration of 10 emitters (denoted in red) and 8 detectors (marked in blue), totaling 18 probes that formed 2×12 measurement channels, as illustrated in Figure 4.
The sampling frequency was 10 Hz.The spatial positioning of the 24-channel configuration was determined using the Polhemus Patriot system, while the NIRS-SPM toolkit was employed for optical probe registration and spatial normalization. This process enabled the generation of a standardized brain localization map, which was subsequently visualized using MATLAB 2013b software, as presented in Figure 5.
2.3.2. Behavioral Data
The design performance of Traditional and Co-design tasks is evaluated by each user participant through questionnaire filling after experiencing and improving the product. The questionnaire questions are designed based on four dimensions: "user experience", "user importance", "user needs satisfaction", and "user stickiness". The reliability coefficient of a is 0.878, which is higher than 0.8, and the total correlation of the calibration phase is much higher than 0.3, indicating high reliability of the questionnaire content. The KMO value of 0.896 is higher than 0.8, and the correspondence between the items and factors is basically consistent with the research psychological expectations, indicating good validity. This indicates that the research data is very suitable for extracting information.
2.4. Data Analysis
2.4.1. Blood Oxygen Data
Each pair of participants in the experiment can use WTC to calculate the inter brain synchrony (IBS) of two interactive blocks, Com and Draw, in each channel containing two oxygenated hemoglobin time series, "designer" and "user", and subtract the independent resting state IBS from each block. In addition, Exp, Com, and Draw, three thought-provoking blocks, can be assembled to generate a 2-D coherence map, and frequency band data with a period of 12.8 to 51.2s can be extracted to calculate their average value. Subsequently, Fisher Z-transform [27] was applied to the inter brain synchronicity values related to specific tasks, and single-sample t-test was conducted to assess inter-brain synchronization across all channels for both experimental conditions. The resulting t-values from each channel were subsequently transformed into a comprehensive topographic representation. To address multiple comparisons, all channel-specific p-values were subjected to False Discovery Rate (FDR) correction.
2.4.2. Behavioral Data
Collect questionnaire data on users' performance in Traditional and Co-design tasks, and divide the total score by the total score to obtain the user psychological needs satisfaction rate. Further analyze and discuss its correlation with IBS under the Com and Draw blocks..
3. Results
3.1. IBS Increased in DLPFC and BROCA During Co-Design
By integrating the 24-channel map localized by the Polhemus Patriot system with the WTC analysis results, significant activation in the DLPFC and BROCA area-related channels under Co-design conditions can be observed as shown in below Table 1.
After conducting WTC analysis in MATLAB, it was found that users and designers exhibited a higher level of synchronization during co-design sessions. Within this dataset ,we observed an increase in consistency was also observed in other channels covering DLPFC and BROCA (CH2, 3, 4, 11, 24).Taking the CH4 pair as an example which was consisting of DLPFC and BROCA ( CH4 : 45 pas triangularis Broca's area, 0.11594, 46 Dorsolateral prefrontal cortex, 0.88406), as shown in Figure 6.
During the aggregated data collected from the overall experiment, encompassing the Exp, Com, and Draw blocks, Significantly higher coherence levels were identified within the temporal frequency range of 12.8 to 51.2 seconds (visually represented in red), suggesting that the enhanced neural synchronization observed within this specific time window is functionally associated with task-related variables.
Firstly, it can be observed that even within the same group performing the same design task, there are differences in coherence between blocks conducted at different times. Specifically, the later blocks exhibit higher coherence compared to the earlier ones, indicating an improved level of collaboration.
Secondly, when comparing the two task modes, it is evident that co-design exhibits a higher and more significant level of coherence than traditional design, as previously mentioned. Furthermore, Fisher Z-transform was performed on the difference in IBS between the Traditional and Co-designs of the same group of subjects, and single sample t-test was performed. It was found that channels 2 and 3 showed a significant increase in IBS compared to the Traditional during Co-design (CH2: t=2.309, p=0.029, Cohen's d=0.429; CH3: t=2.333, p=0.010, Cohen's d=0.433).
Finally, To quantify the changes in coherence among all participants and investigate the levels of collaboration and synchronization across different contextual phases of various design modes for subsequent correlation analysis and discussion, the t-values for interactive blocks under both traditional design and co-design tasks were further calculated. These blocks included "Traditional Com," "Co-design Com," "Traditional Draw," and "Co-design Draw." The t-values obtained from all channels after testing were used to generate the topographic map of t-values as shown in Figure 7.
It can be clearly seen that the t-value topology map of the Co-design group on the same horizontal round is warmer in color, with larger values and more significant activation effects compared to the Traditional group; The t-value topology diagram of Draw on the same column Block is warmer in color and has larger values compared to the Traditional group, resulting in a more significant activation effect.
3.2. The Gradual Development of Cooperation Has Improved Participants' IBS
Due to the fact that each round experiment has two interactive blocks, Com and Draw, and the order of the two cannot be changed in order to reproduce the real design context, that is, all participants experience Com first and then Draw, which are two different but communicative and cooperative tests, it is necessary to analyze the impact between the two. Based on the analysis above, it can be concluded that Draw exhibits more significant activation than Com under the same experimental conditions. Therefore, further Fisher Z-transform was performed on the IBS difference between Draw and Com in the same group of subjects under Traditional and Co-design, and single sample t-test was performed. After testing, the t-values obtained from all channels generated the t-value topology as shown in Figure 8. It can be clearly seen that 9 channels in the Traditional group (CH1, 8, 13, 16, 21, 22, 23, 24) and 8 channels in the Co-design group (CH2, 3, 4, 11, 12, 13, 19, 24) have a certain degree of activation due to warm colors. After FDR correction, it was found that they still have significance.
Subsequently, by further visualizing the IBS data in the Com and Draw Blocks with significant channels and drawing line graphs, it can be found that the IBS of the above channels show a significant upward trend gradually from Com to Draw, which may be related to the consensus generated,as shown in Figure 9.
3.3. IBS Is Related to Psychological Needs Satisfaction Rate
Further analysis will be conducted on the correlation between brain synchronicity IBS in both brains and the users' psychological needs satisfaction rate, exploring the significant relationship between brain synchronicity and psychological needs satisfaction rate discovered in Traditional and Co-designs. Firstly, the total score in the questionnaire data above is divided by the total score to obtain the psychological needs satisfaction rate. Secondly correlation analysis is conducted between the IBS and the psychological needs satisfaction rate of Com and Draw blocks in Traditional and Co-designs for CH2 and CH3.Finally, a scatter diagram was constructed, highlighting the linear trend to visualize the association.
The correlation between IBS and psychological needs satisfaction rate of CH2 and CH3 under Traditional and Co-design tasks in Com Block as shown in Figure 10. The results showed that there was neither a significant correlation between IBS and psychological needs satisfaction rate in CH2 nor CH3 under Traditional, with negative values for r (T2C: r=-0.248, p=0.194, T3C: r=-0.153, p=0.429). There was also no significant correlation between IBS and psychological needs satisfaction rate in CH2 and CH3 under Co-design, with positive values for r (C2C: r=0.257, p=0.179, C3C: r=0.113, p=0.558) .
The correlation between IBS and psychological needs satisfaction rate of CH2 and CH3 under Traditional and Co-design tasks in Draw Block is shown as shown in Figure 11. The results showed that there was neither a significant correlation between IBS and psychological needs satisfaction rate in CH2 nor CH3 under Traditional, with negative values for r (T2D: r=-0.087, p=0.653, T3D: r=-0.015, p=0.939). However, under Co-design, there was a significant positive correlation between IBS and psychological needs satisfaction rate in CH2 and CH3, with positive values for r (C2D: r=0.393, p=0.035, C3D: r=0.435, p=0.018).
4. Discussion
4.1. Co-Design Could Significantly Enhance User Engagement
Firstly, the research findings indicate that in Co-design teams, the IBS of any block is significantly higher than that of Traditional designs. This indicates that compared to Traditional design, Co-design demonstrates better synchronization consistency throughout the entire experimental process and promotes deeper user participation. This discovery is consistent with the fundamental theories of most participatory design studies.
4.2. IBS of DLPFC and BROCA Be Related to Semantic Processing and Problem-Solving Ability
Secondly, the study found that the channels covered by the DLPFC and BROCA brain regions increased in both Traditional and Co-design, and the increase in IBS was more significant during Co-design, indicating better activation of DLPFC and BROCA for cognitive response under Co-design tasks. According to previous research, DLPFC is a subregion of the brain PFC located in the anterior part of the brain, primarily responsible for advanced cognitive functions such as executive control, working memory, and attention regulation [28,29,30,31,32]. Xue et al [33]. found that compared with the high creativity group, the low creativity group had larger IBS in the right prefrontal lobe DLPFC, indicating that DLPFC is considered to be related to creativity and problem-solving ability, and is an important research object in the fields of neuroscience and cognitive science [34].
In addition, BROCA is a specific area of the brain located in the posterior part of the inferior frontal gyrus (IFG), responsible for language movement. It is mainly known for its close connection with aphasia, especially motor aphasia. Motor aphasia is a language disorder in which patients are able to understand others' speech but have difficulty expressing their own thoughts, exhibiting characteristics of non fluent oral communication. Previous studies have found significant activation of BROCA in both public speaking [35] and walking while speaking [36] task detections. In the Stroop task conducted by Huang et al. targeting the elderly, significant activation of DLPFC and BROCA was also observed under word recognition stimulation [37], further indicating that the activation of these two brain regions is related to semantic processing and problem-solving abilities. In this study, design itself is a creative problem-solving task regardless of the type of task. The results showed that both task conditions were effective in activating DLPFC and BROCA, and under Co-design tasks, the IBS of related brain channel increased more significantly, further supporting the aforementioned research and expanding the possibility of collaborative task paradigms.
4.3. Gradually Promotion of Block Will Enhance the Level of Cooperation
Thirdly, among the blocks conducted successively in the study, the Draw Block performed later showed higher consistency than the Com Block performed first, that is, regardless of the design task, the Block performed later showed higher consistency than the Block performed first. The gradual process promoted the improvement of the cooperation level between the roles of users and designers. Based on previous research, collaboration, consensus, and empathy among different stakeholders are related. Previously, Lu et al [38]. compared the task performance of interdisciplinary and non interdisciplinary teams on Alternative Uses Tasks (AUT) and found that interdisciplinary teams performed poorly, which they believed was due to a lack of empathy and cooperation among members. In addition, other studies have also found that empathetic behavior is an important factor affecting the innovation performance of teams with different levels of creativity [39]. Therefore, it can be inferred that the Com Block experienced first exchanged the summation ideas of both parties, preparing for the subsequent Draw Block to reach consensus and co create, resulting in a phenomenon where the level of cooperation increases with the progress of each stage.
4.4. Co-Design Has Significant Correlation with Psychological Needs Satisfaction Rate
Finally, this experiment also found that the higher level of collaboration in Co-design can be directly reflected in the satisfaction of psychological needs in the design results. During the collaboration process, the increase in collaboration level was reflected in the brain blood oxygen data, where more significant IBS increases were observed in the brain region channels, which is consistent with the experimental situation under the Co-design mode. In the correlation analysis between psychological needs satisfaction data and activation channel IBS in the previous text, it can be seen that all Traditional tasks have r<0, while Co-design tasks have r>0. This indicates that Co-design not only improves the level of cooperation, but also has a positive feedback on the psychological needs satisfaction rate of the design results, which is significantly positively correlated in the Draw block. This discovery indirectly validates Mayseless' viewpoint [40], demonstrating the correlation between collaboration and positive creative outcomes.
5. Conclusions
This research employed dual functional near-infrared spectroscopy systems to monitor and compare neural activation patterns between design professionals and non-design specialists during various design task modalities. The study found that overall, participants will activate DLPFC and BROCA brain region related channels in both Traditional and Co-design tasks, and the increase in IBS is more significant in Co-design tasks. It was also found that regardless of the design task mode, the Draw block performed later showed higher consistency than the Com block performed first, and it was inferred that this was due to the consensus reached by different role parties after the gradual promotion of the stage. In addition, this experiment found that a higher level of collaboration in Co-design can be directly reflected in the satisfaction of psychological needs in the design results, demonstrating the correlation between collaboration and positive creative outcomes. From the perspective of applied science, this study observed the collaboration process and outcomes of two design patterns, analyzed the relationship between the two, and obtained the correlation between collaboration and outcomes. It emphasized the activation of IBS brain regions behind this process, providing empirical evidence for the characteristics of Co-design. The sample data created in this experiment is relatively small, and in further research, the number of subjects can be increased to further improve the accuracy of the data. The experimental paradigm is based on the situational reconstruction of existing design patterns, lacking separate analysis of the elements in the generative toolkit during Co-design processes. Further research can focus on this and provide empirical evidence related to collaboration.
Author Contributions
Y.L. designed the experiment; J.C. and W.S. used the fNRIS instruments to record the physiological data and behavioral data; J.C. and W.S. analyzed and processed the experimental data; J.C. edited the first draft of the paper; J.C. and Y.L. revised the paper. All authors have read and agreed to the published version of the manuscript.
Funding
This research was funded by Humanities and Social Science Research Project of Ministry of Education. (No. 20YJA760067); Cooperative Research Project between CRRC Zhuzhou Locomotive and Huaqiao University (2021-0015);2019 Natural Science Foundation Program, Fujian Province, China (2019J01061);2024 Ministry of Education Humanities and Social Sciences Research Art Studies Planning Fund Project: Neurobehavioral Empirical Research on Participatory Design Targeting Users’ Implicit Aesthetic Needs(24YJA760065).
Institutional Review Board Statement
This project has been approved by the ethics review body of Huaqiao University School of Medicine.
Data Availability Statement
The datasets supporting the results of this article are included within the article.
Acknowledgments
We would like to thank all participants of this study.
Conflicts of Interest
The authors declare no conflict of interest.
References
- Hoyer, W.D.; Chandy, R.; Dorotic, M.; Krafft, M.; Singh, S.S. Consumer Cocreation in New Product Development. Journal of Service Research 2010, 13, 283–296. [Google Scholar] [CrossRef]
- Participatory Design: Principles and Practices; Participatory design: Principles and practices; Lawrence Erlbaum Associates, Inc: Hillsdale, NJ, US, 1993; pp. xiii, 319; ISBN 978-0-8058-0951-0.
- Kankainen, A.; Vaajakallio, K.; Kantola, V.; Mattelmäki, T. Storytelling Group – a Co-Design Method for Service Design. Behaviour & Information Technology 2012, 31, 221–230. [Google Scholar] [CrossRef]
- Bødker, S. Creating Conditions for Participation: Conflicts and Resources in Systems Design. PDC 1994, 13–20. [Google Scholar] [CrossRef]
- Cross, N.; Society, D.R. Design Participation: Proceedings of the Design Research Society’s Conference, Manchester, September 1971; Academy Editions, 1972;pp. ii-iii.
- Spinuzzi, C. The Methodology of Participatory Design. Technical Communication 2005, 52, 163–174. [Google Scholar]
- Czyzewski, P.; Johnson, J.; Roberts, E. Introduction: Purpose of pdc-90. In Proceedings of the Proc. PDC Conf. Participatory Design, 1990; pp. ii-iii.
- Kuhn, D. Science as Argument: Implications for Teaching and Learning Scientific Thinking. Science Education 1993, 77, 319–337. [Google Scholar] [CrossRef]
- Gregory, R.; Fischhoff, B.; McDaniels, T. Acceptable Input: Using Decision Analysis to Guide Public Policy Deliberations. Decision Analysis 2005, 2, 4–16. [Google Scholar] [CrossRef]
- Kanstrup, A.M. A Small Matter of Design: An Analysis of End Users as Designers. In Proceedings of the Proceedings of the 12th Participatory Design Conference: Research Papers - Volume 1; ACM: Roskilde Denmark, August 12 2012; pp. 109–118.
- Simonofski, A.; Hertoghe, E.; Steegmans, M.; Snoeck, M.; Wautelet, Y. Engaging Citizens in the Smart City through Participation Platforms: A Framework for Public Servants and Developers. Computers in Human Behavior 2021, 124, 106901. [Google Scholar] [CrossRef]
- Matsangidou, M.; Frangoudes, F.; Schiza, E.; Neokleous, K.C.; Papayianni, E.; Xenari, K.; Avraamides, M.; Pattichis, C.S. Participatory Design and Evaluation of Virtual Reality Physical Rehabilitation for People Living with Dementia. Virtual Reality 2023, 27, 421–438. [Google Scholar] [CrossRef]
- Funane, T.; Kiguchi, M.; Atsumori, H.; Sato, H.; Kubota, K.; Koizumi, H. Synchronous Activity of Two People’s Prefrontal Cortices during a Cooperative Task Measured by Simultaneous near-Infrared Spectroscopy. JBO 2011, 16, 077011. [Google Scholar] [CrossRef]
- Hari, R.; Henriksson, L.; Malinen, S.; Parkkonen, L. Centrality of Social Interaction in Human Brain Function. Neuron 2015, 88, 181–193. [Google Scholar] [CrossRef]
- Liu, T.; Pelowski, M. A New Research Trend in Social Neuroscience: Towards an Interactive-brain Neuroscience. PsyCh Journal 2014, 3, 177–188. [Google Scholar] [CrossRef] [PubMed]
- Hari, R.; Salmelin, R. Magnetoencephalography: From SQUIDs to Neuroscience: Neuroimage 20th Anniversary Special Edition. NeuroImage 2012, 61, 386–396. [Google Scholar] [CrossRef] [PubMed]
- Montague, P. Hyperscanning: Simultaneous fMRI during Linked Social Interactions. NeuroImage 2002, 16, 1159–1164. [Google Scholar] [CrossRef]
- Koike, T.; Tanabe, H.C.; Sadato, N. Hyperscanning Neuroimaging Technique to Reveal the “Two-in-One” System in Social Interactions. Neuroscience Research 2015, 90, 25–32. [Google Scholar] [CrossRef] [PubMed]
- Dumas, G.; Lachat, F.; Martinerie, J.; Nadel, J.; George, N. From Social Behaviour to Brain Synchronization: Review and Perspectives in Hyperscanning. IRBM 2011, 32, 48–53. [Google Scholar] [CrossRef]
- Rolfe, P. In Vivo Near-Infrared Spectroscopy. Annu. Rev. Biomed. Eng. 2000, 2, 715–754. [Google Scholar] [CrossRef]
- Ekkekakis, P. Illuminating the Black Box: Investigating Prefrontal Cortical Hemodynamics during Exercise with Near-Infrared Spectroscopy. 2009. [CrossRef]
- Suda, M.; Takei, Y.; Aoyama, Y.; Narita, K.; Sato, T.; Fukuda, M.; Mikuni, M. Frontopolar Activation during Face-to-Face Conversation: An in Situ Study Using near-Infrared Spectroscopy. Neuropsychologia 2010, 48, 441–447. [Google Scholar] [CrossRef] [PubMed]
- Gallagher, H.L.; Frith, C.D. Functional Imaging of ‘Theory of Mind. ’ Trends in Cognitive Sciences 2003, 7, 77–83. [Google Scholar] [CrossRef] [PubMed]
- Roy, C.S.; Sherrington, C.S. On the Regulation of the Blood-Supply of the Brain. J Physiol 1890, 11, 85–158.17. [Google Scholar] [CrossRef]
- Scholkmann, F.; Kleiser, S.; Metz, A.J.; Zimmermann, R.; Mata Pavia, J.; Wolf, U.; Wolf, M. A Review on Continuous Wave Functional Near-Infrared Spectroscopy and Imaging Instrumentation and Methodology. NeuroImage 2014, 85, 6–27. [Google Scholar] [CrossRef]
- Torrence, C.; Compo, G.P. A Practical Guide to Wavelet Analysis. 1998.
- Chang, C.; Glover, G.H. Time–Frequency Dynamics of Resting-State Brain Connectivity Measured with fMRI. NeuroImage 2010, 50, 81–98. [Google Scholar] [CrossRef] [PubMed]
- Fishburn, F.A.; Murty, V.P.; Hlutkowsky, C.O.; MacGillivray, C.E.; Bemis, L.M.; Murphy, M.E.; Huppert, T.J.; Perlman, S.B. Putting Our Heads Together: Interpersonal Neural Synchronization as a Biological Mechanism for Shared Intentionality. Social Cognitive and Affective Neuroscience 2018, 13, 841–849. [Google Scholar] [CrossRef] [PubMed]
- Lu, K.; Hao, N. When Do We Fall in Neural Synchrony with Others? Social Cognitive and Affective Neuroscience 2019, 14, 253–261. [Google Scholar] [CrossRef]
- Lu, K.; Qiao, X.; Hao, N. Praising or Keeping Silent on Partner’s Ideas: Leading Brainstorming in Particular Ways. Neuropsychologia 2019, 124, 19–30. [Google Scholar] [CrossRef]
- Lu, K.; Xue, H.; Nozawa, T.; Hao, N. Cooperation Makes a Group Be More Creative. Cerebral Cortex 2019, 29, 3457–3470. [Google Scholar] [CrossRef]
- Lu, K.; Teng, J.; Hao, N. Gender of Partner Affects the Interaction Pattern during Group Creative Idea Generation. Exp Brain Res 2020, 238, 1157–1168. [Google Scholar] [CrossRef] [PubMed]
- Xue, H.; Lu, K.; Hao, N. Cooperation Makes Two Less-Creative Individuals Turn into a Highly-Creative Pair. NeuroImage 2018, 172, 527–537. [Google Scholar] [CrossRef]
- Kelsen, B.A.; Sumich, A.; Kasabov, N.; Liang, S.H.Y.; Wang, G.Y. What Has Social Neuroscience Learned from Hyperscanning Studies of Spoken Communication? A Systematic Review. Neuroscience & Biobehavioral Reviews 2022, 132, 1249–1262. [Google Scholar] [CrossRef]
- Zhang, X.; Noah, J.A.; Dravida, S.; Hirsch, J. Signal Processing of Functional NIRS Data Acquired during Overt Speaking. NPh 2017, 4, 041409. [Google Scholar] [CrossRef] [PubMed]
- Huang, W.; Li, X.; Xie, H.; Qiao, T.; Zheng, Y.; Su, L.; Tang, Z.-M.; Dou, Z. Different Cortex Activation and Functional Connectivity in Executive Function Between Young and Elder People During Stroop Test: An fNIRS Study. Front. Aging Neurosci. 2022, 14. [Google Scholar] [CrossRef]
- Metzger, F.G.; Ehlis, A.-C.; Haeussinger, F.B.; Schneeweiss, P.; Hudak, J.; Fallgatter, A.J.; Schneider, S. Functional Brain Imaging of Walking While Talking – An fNIRS Study. Neuroscience 2017, 343, 85–93. [Google Scholar] [CrossRef] [PubMed]
- Lu, K.; Qiao, X.; Yun, Q.; Hao, N. Educational Diversity and Group Creativity: Evidence from fNIRS Hyperscanning. NeuroImage 2021, 243, 118564. [Google Scholar] [CrossRef] [PubMed]
- Lu, K.; Gao, Z.; Wang, X.; Qiao, X.; He, Y.; Zhang, Y.; Hao, N. The Hyper-Brain Neural Couplings Distinguishing High-Creative Group Dynamics: An fNIRS Hyperscanning Study. Cerebral Cortex 2023, 33, 1630–1642. [Google Scholar] [CrossRef] [PubMed]
- Mayseless, N.; Hawthorne, G.; Reiss, A.L. Real-Life Creative Problem Solving in Teams: fNIRS Based Hyperscanning Study. NeuroImage 2019, 203, 116161. [Google Scholar] [CrossRef] [PubMed]
Figure 1.
Participant experimental setup demonstration.
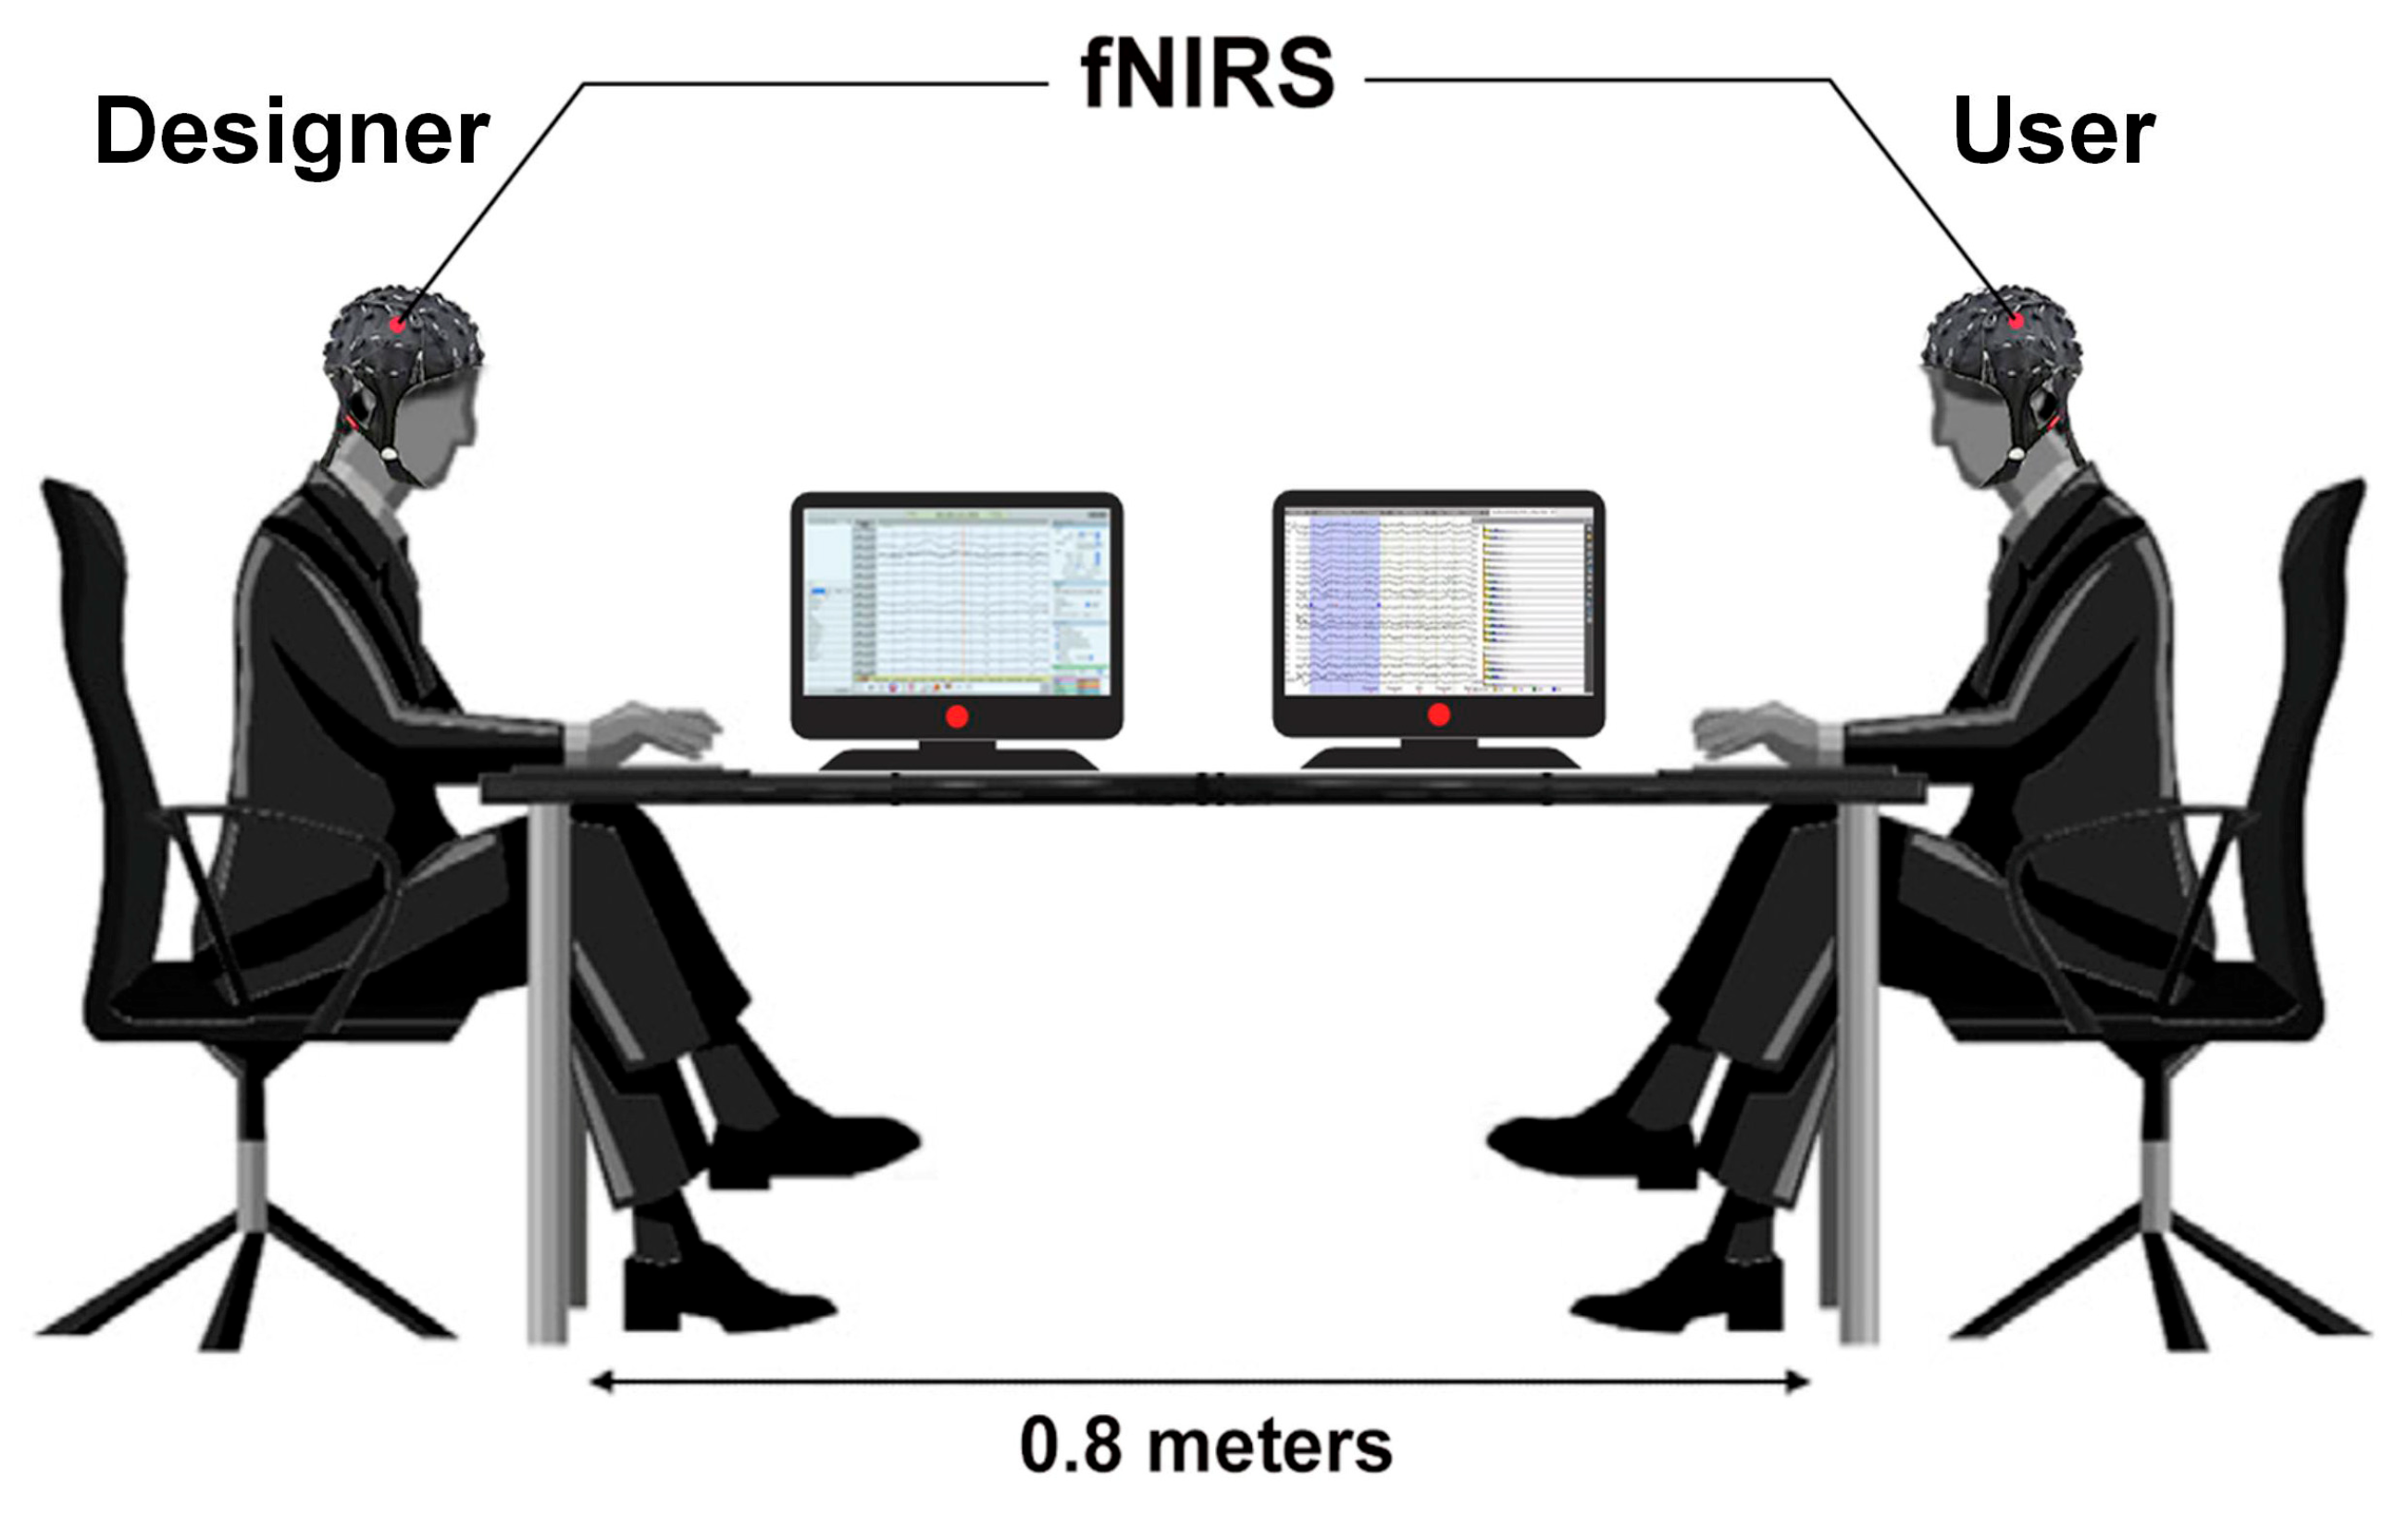
Figure 2.
Experimental procedures, showing two round trials. The entire task consisted of Five task blocks :Experience,Communicate,Draw,Explanatory,Evaluate.
Figure 2.
Experimental procedures, showing two round trials. The entire task consisted of Five task blocks :Experience,Communicate,Draw,Explanatory,Evaluate.
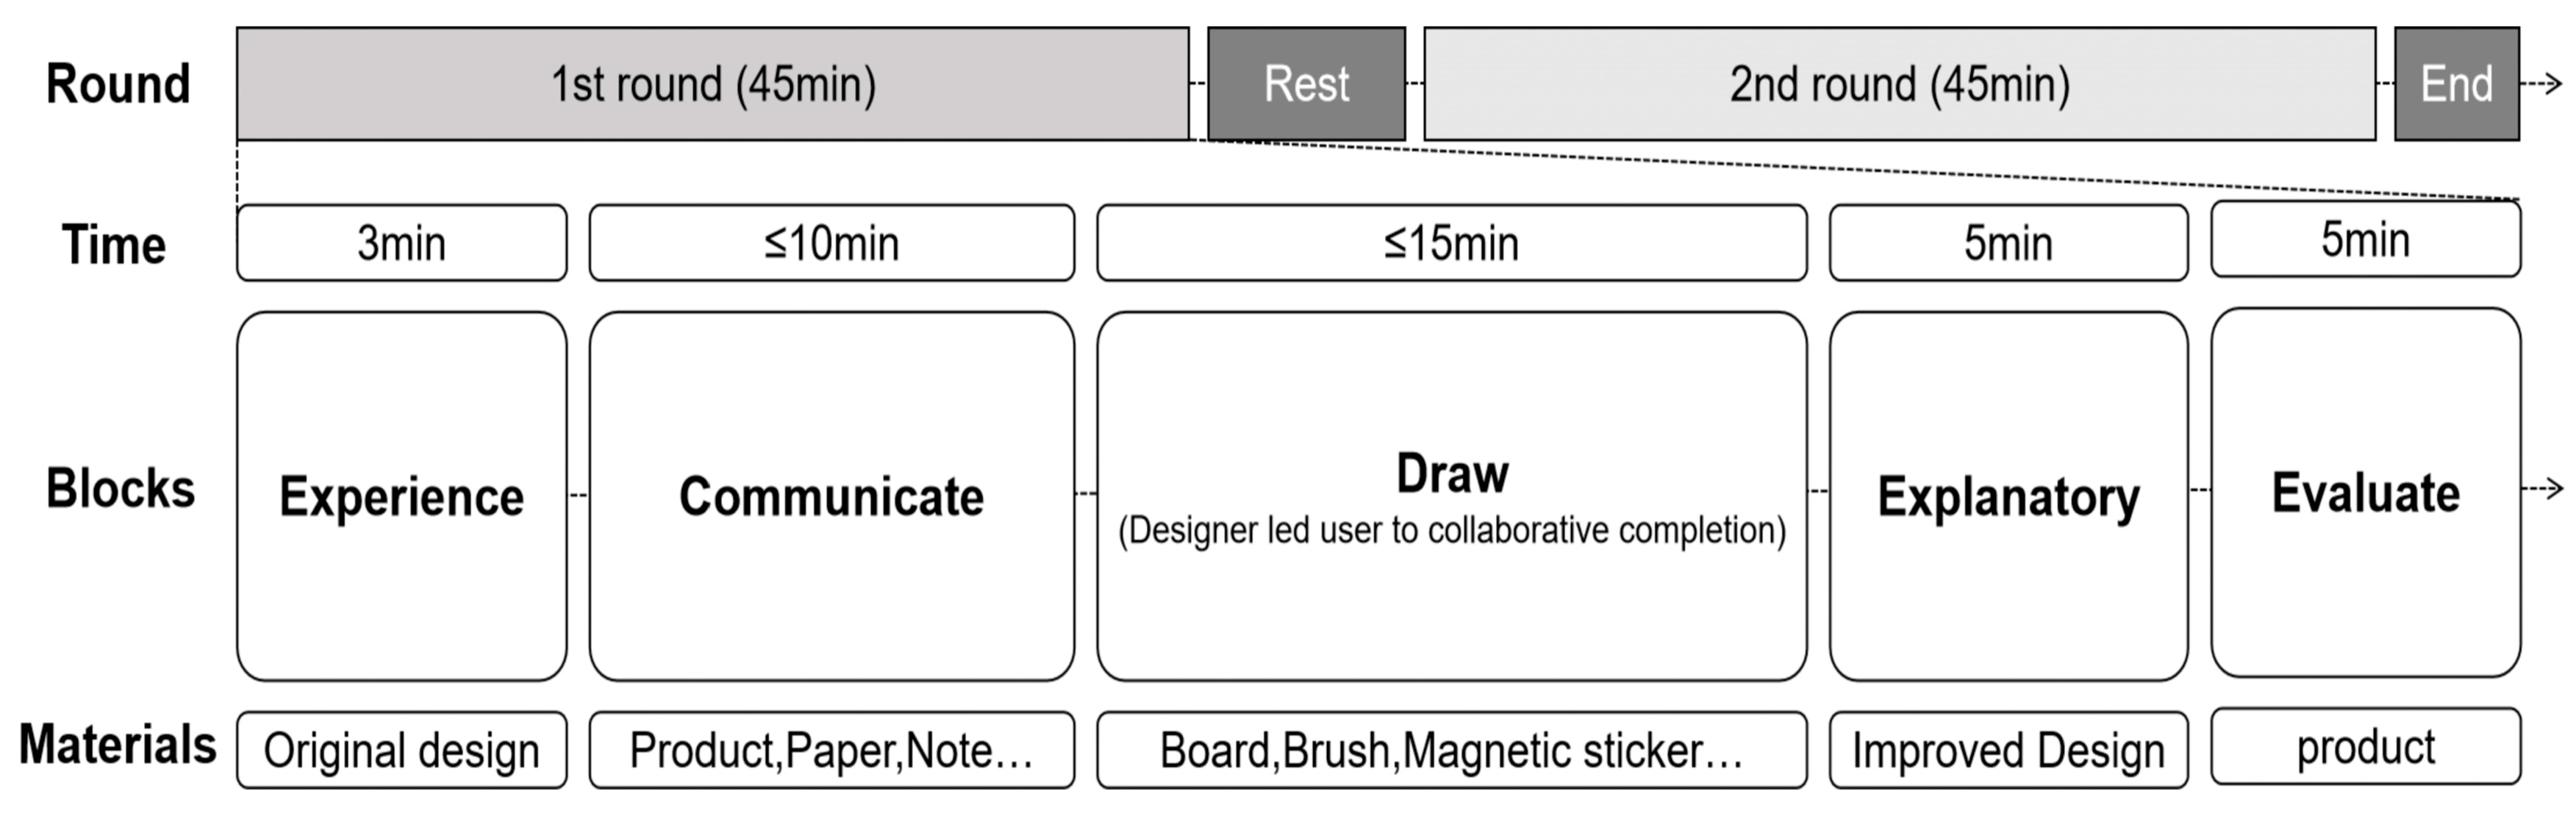
Figure 3.
A pair of Artinis Brite 24 fNIRS devices for restoring experimental channel settings.
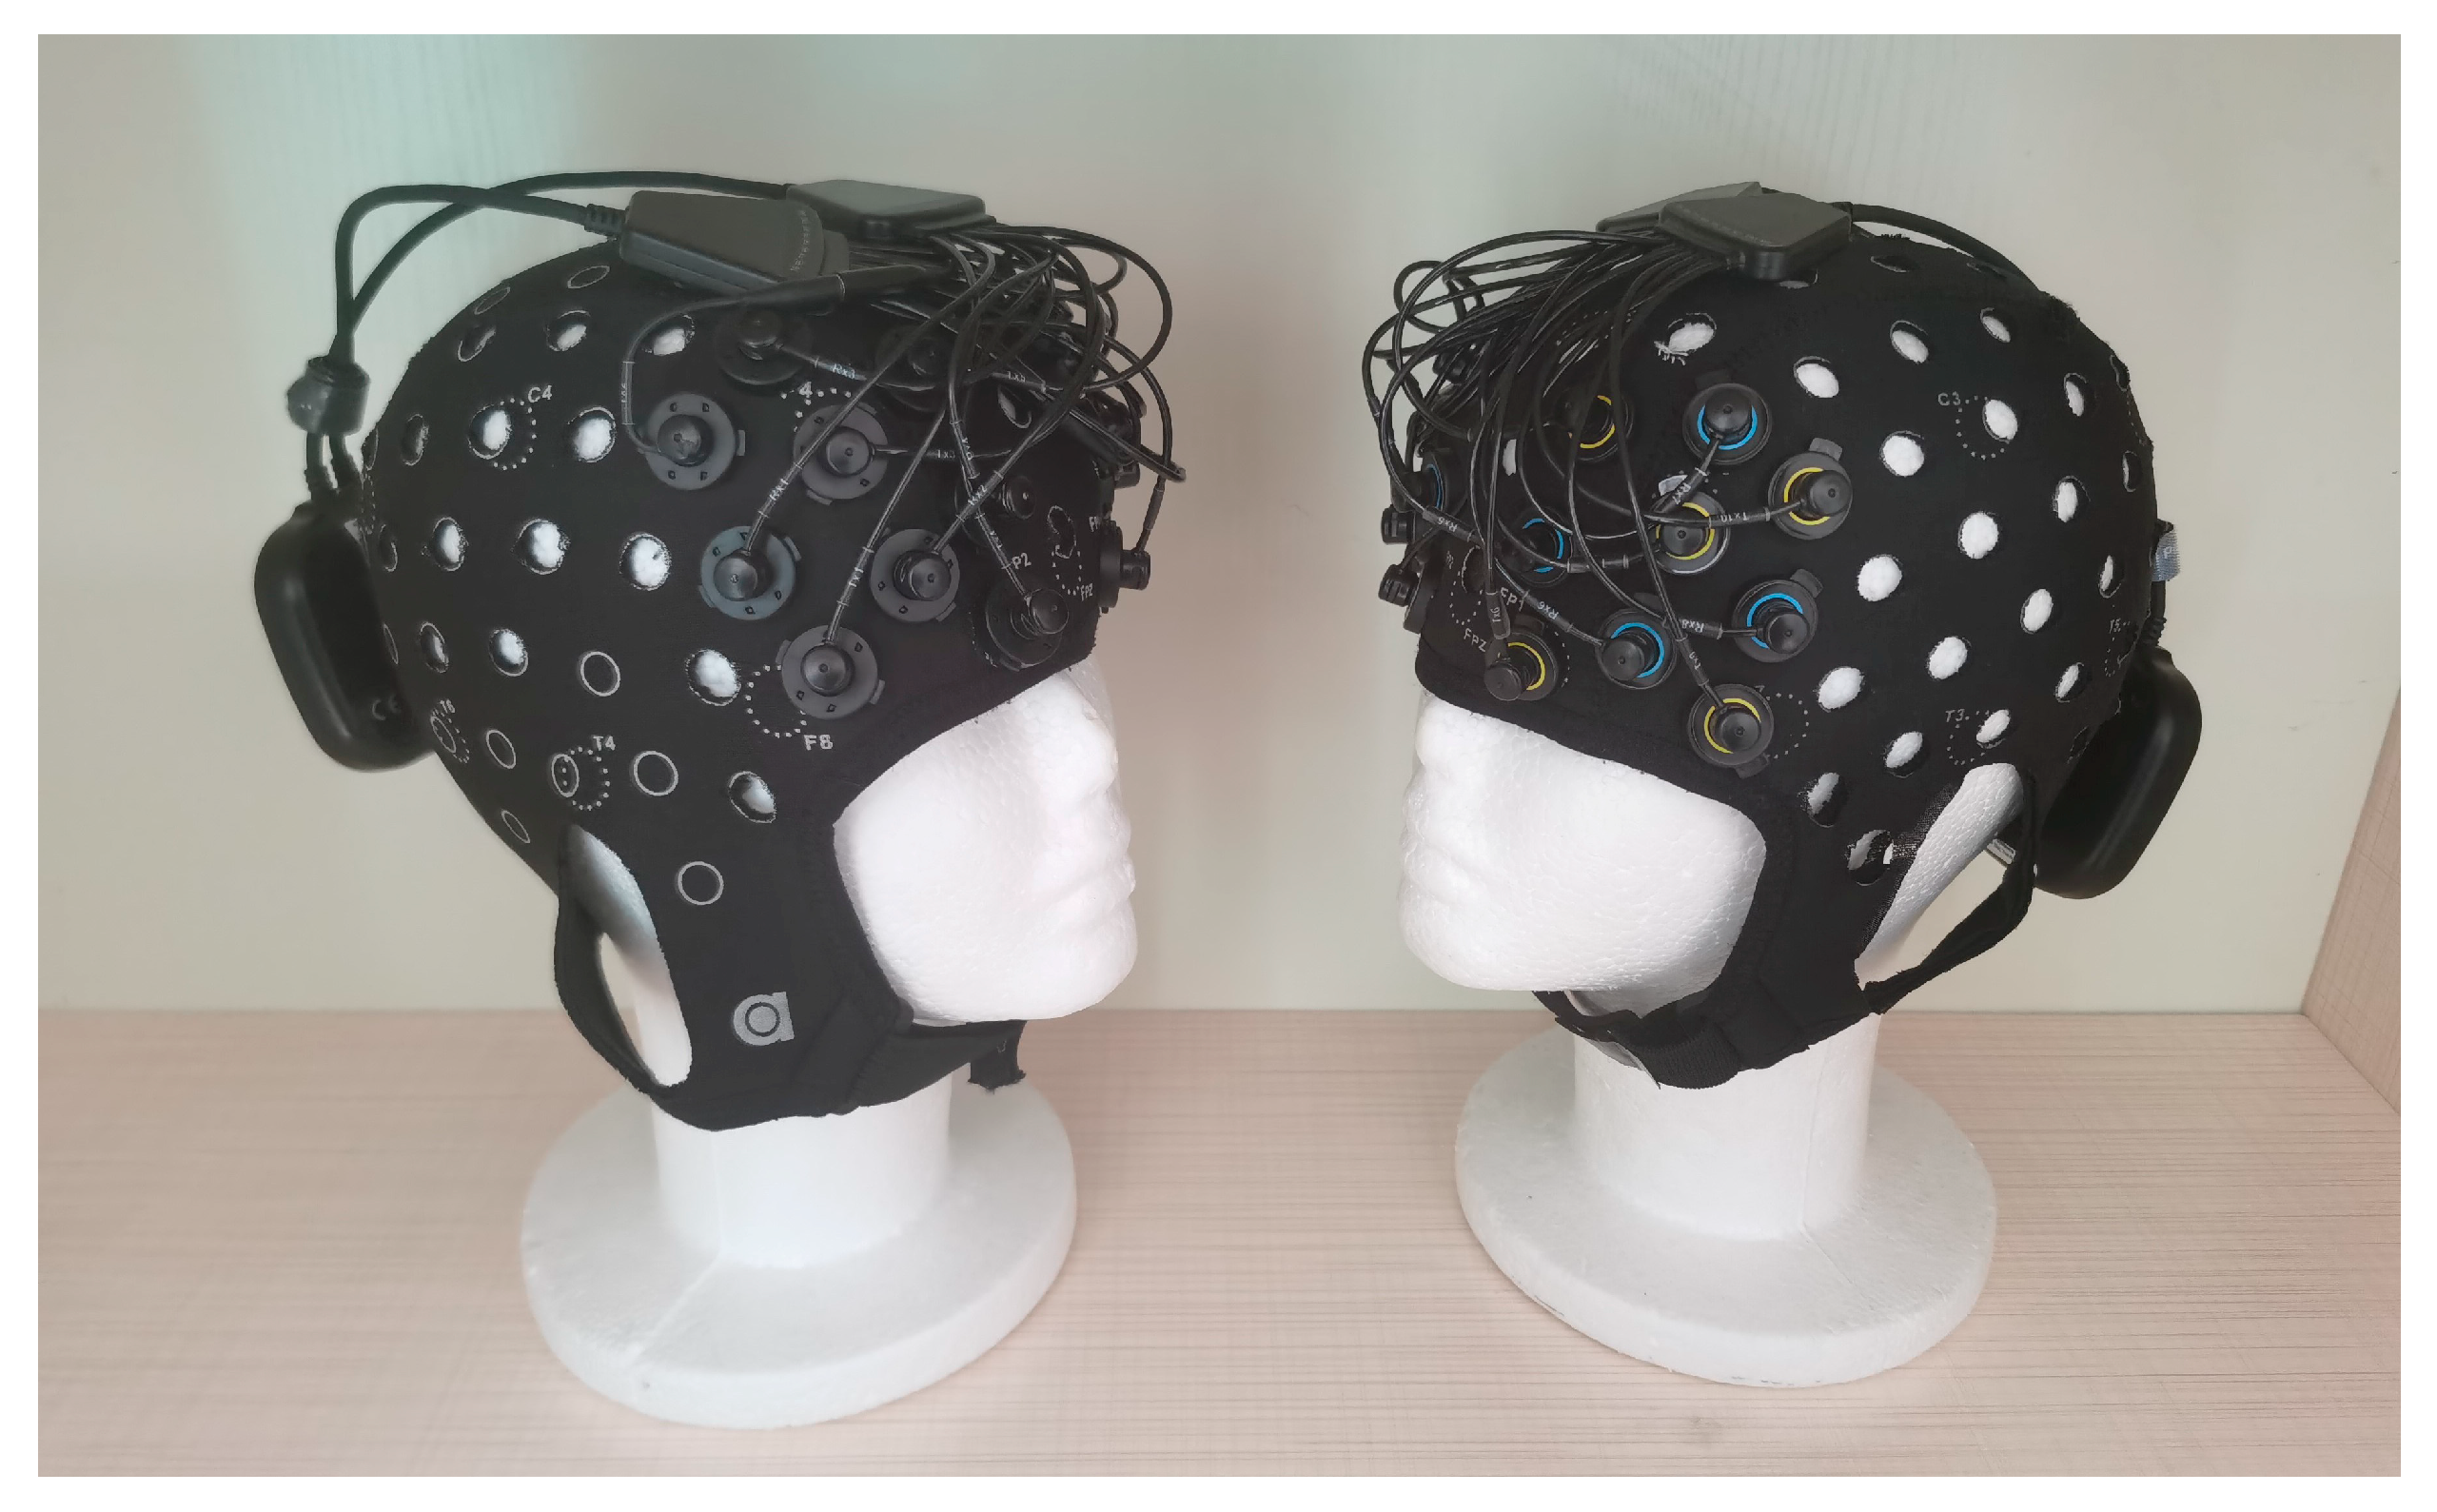
Figure 4.
Cap configuration. (a)Red circles indicate emitters; blue circles indicate detectors. Green squares indicate measurement channels between emitters and detectors;(b)The positioning of acquisition points in the Oxysoft software.
Figure 4.
Cap configuration. (a)Red circles indicate emitters; blue circles indicate detectors. Green squares indicate measurement channels between emitters and detectors;(b)The positioning of acquisition points in the Oxysoft software.
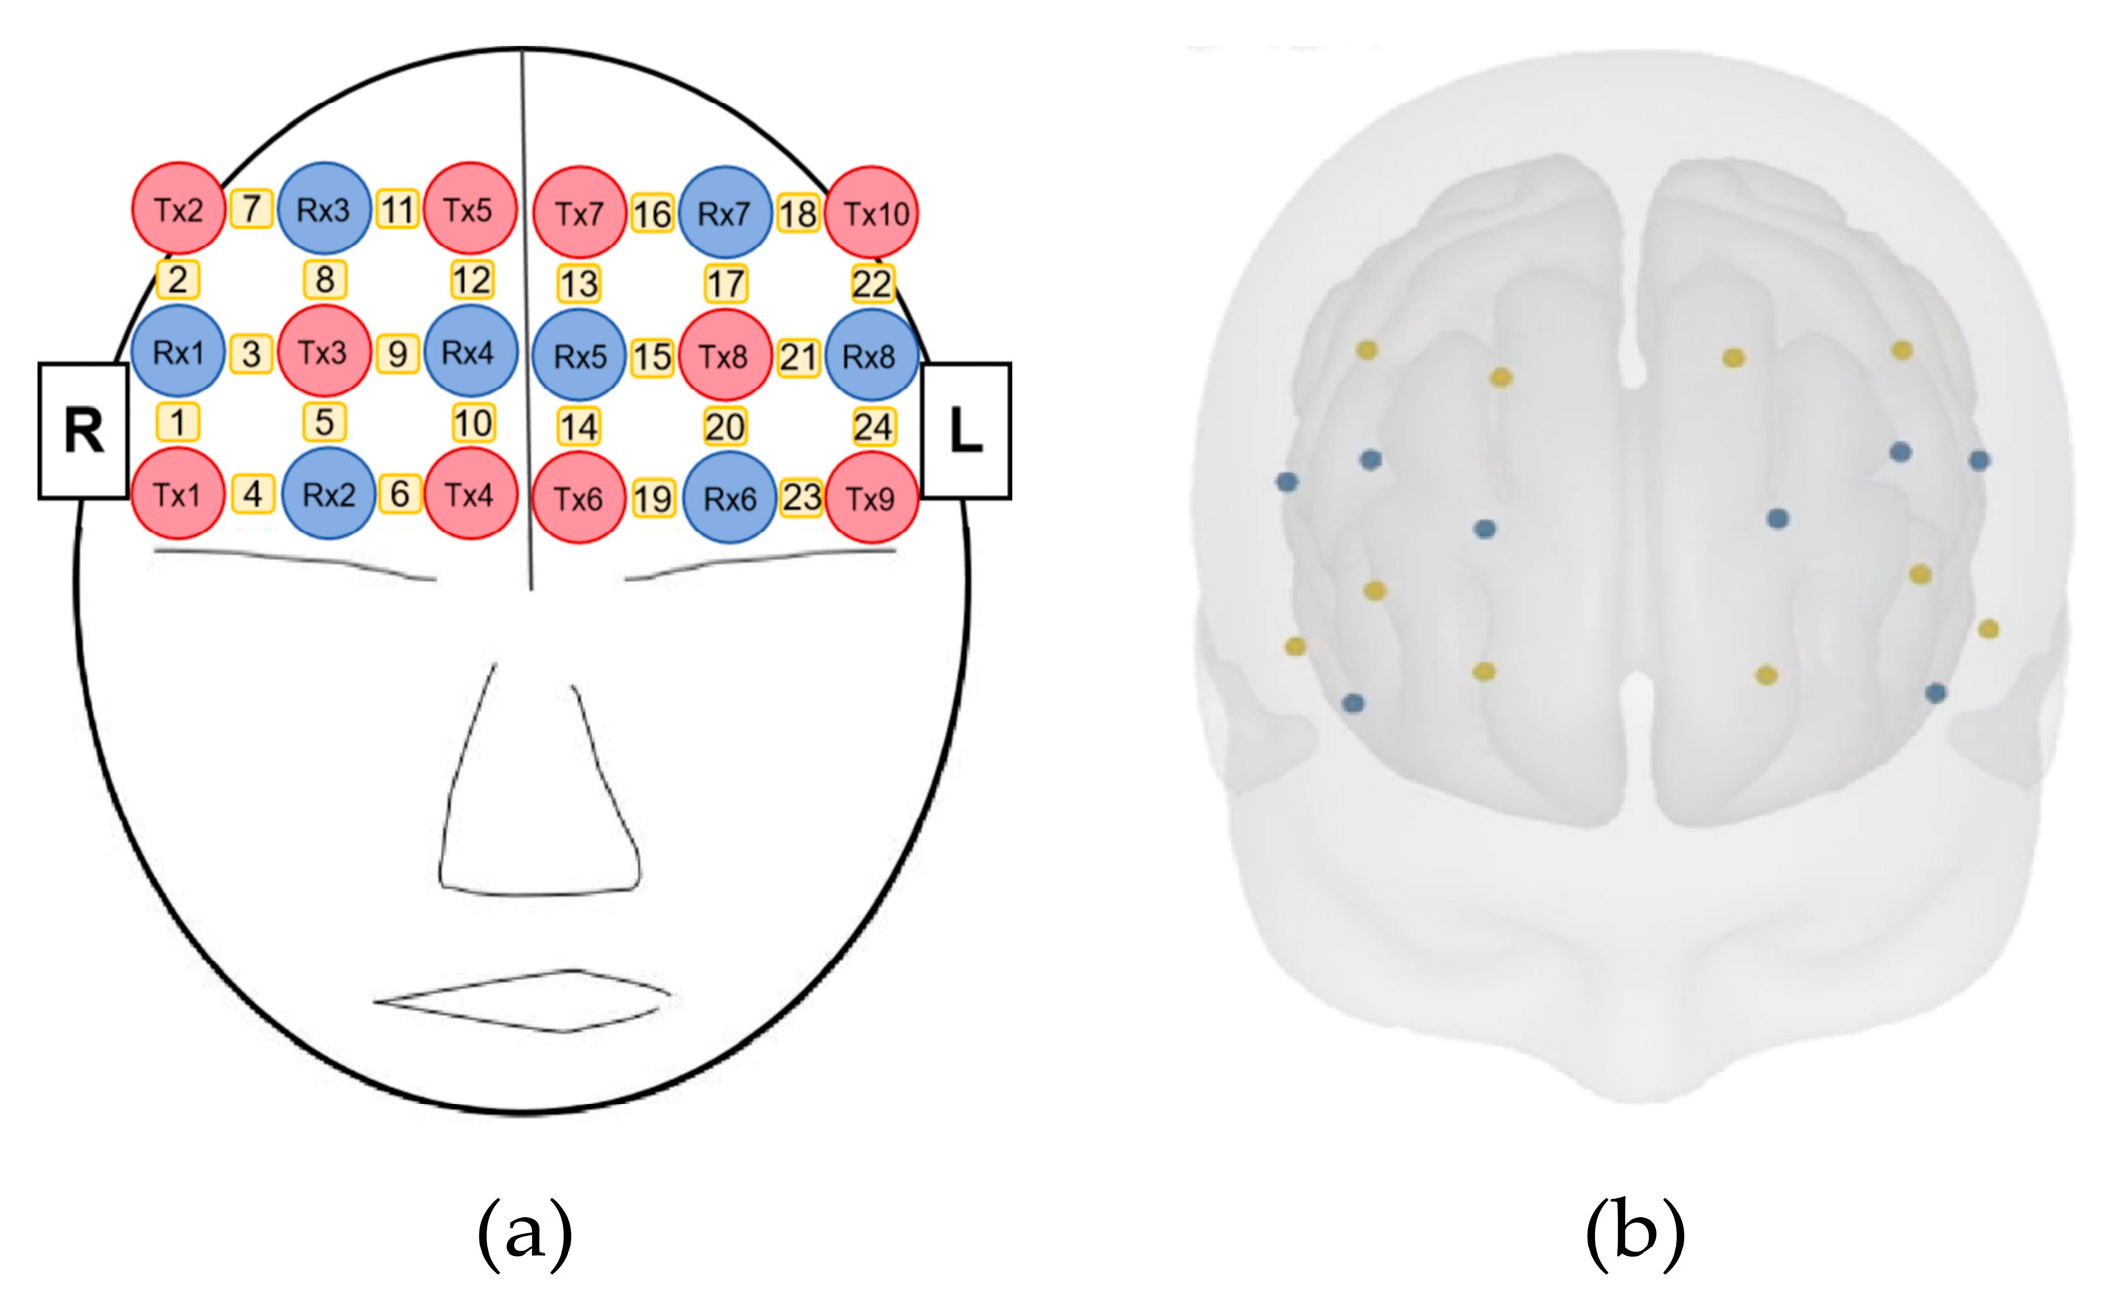
Figure 5.
Right, front, and left optical poles localization brain map.
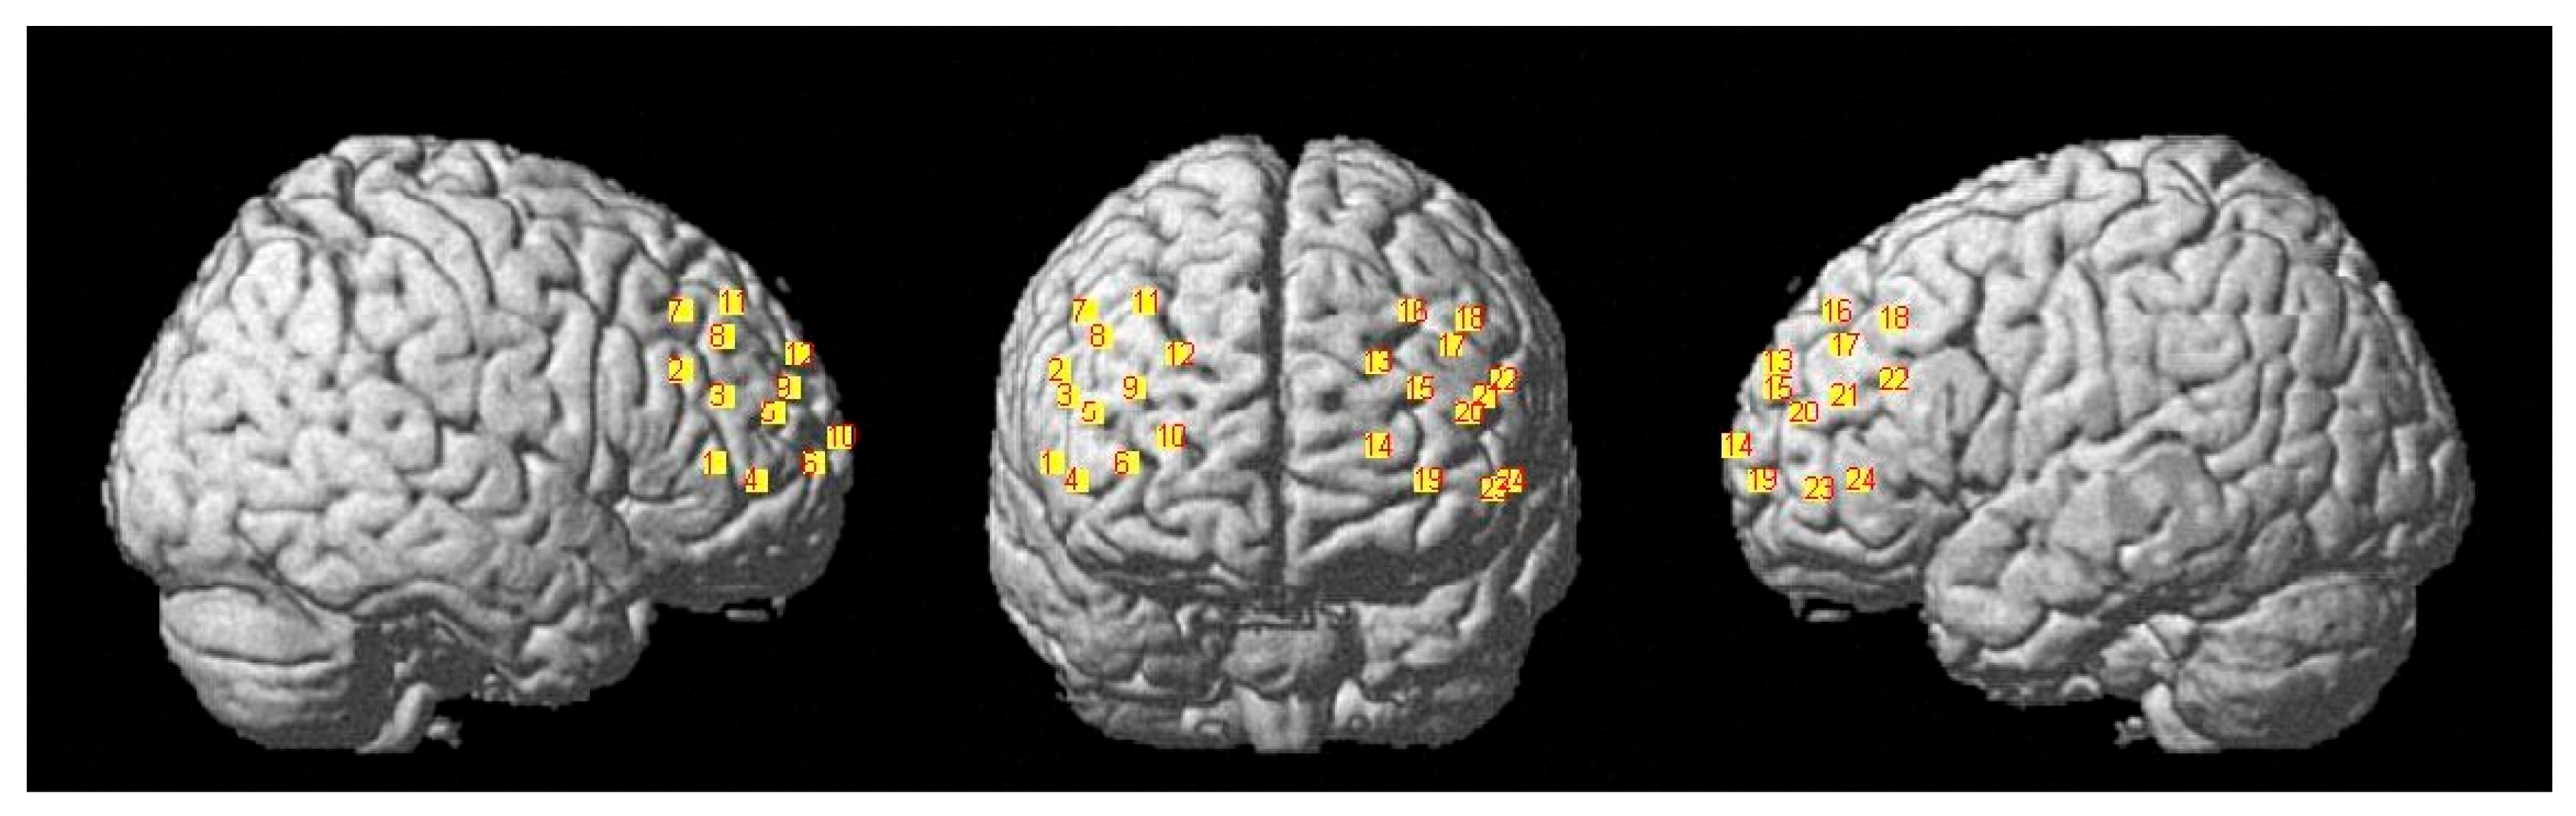
Figure 6.
The CH4 IBS increases in the DLPFC & BROCA during Traditional and Co-designs rounds: (a) Traditional; (b) Co-design.
Figure 6.
The CH4 IBS increases in the DLPFC & BROCA during Traditional and Co-designs rounds: (a) Traditional; (b) Co-design.
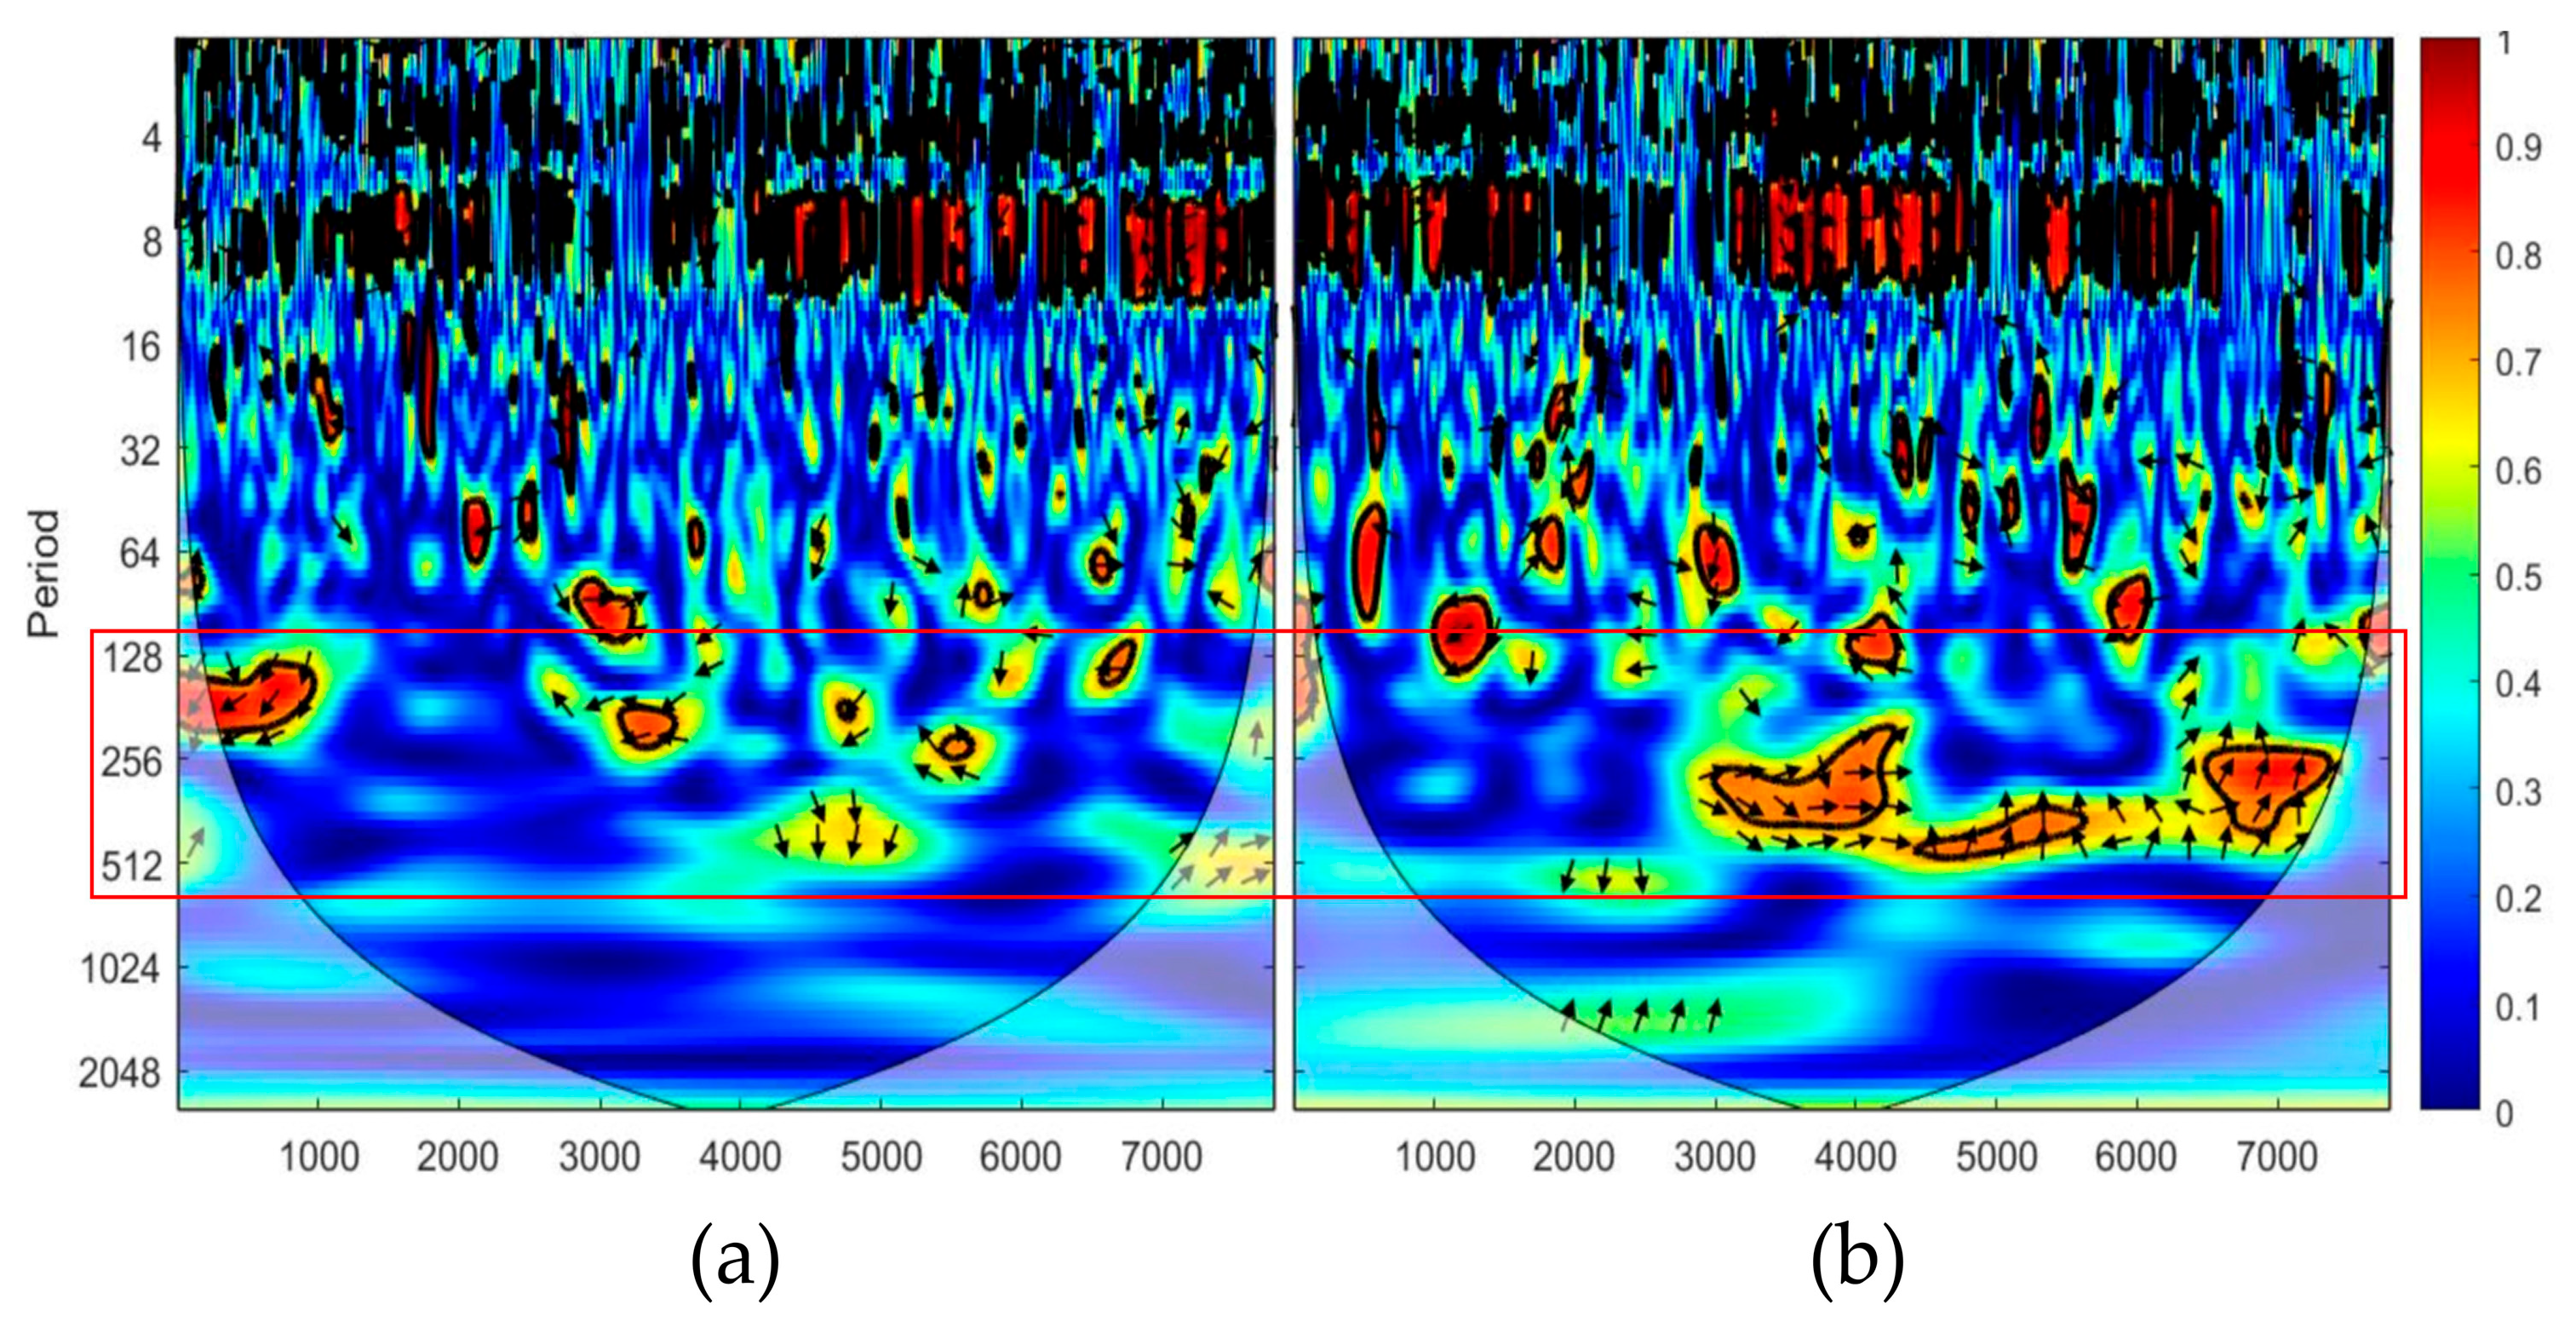
Figure 7.
Topographic map of IBS t-values across different blocks under Traditional and Co-designs rounds, Color indicates the t value: (a) Traditional Com; (b) Co-design Com; (c) Traditional Draw; (d) Co-design Draw.
Figure 7.
Topographic map of IBS t-values across different blocks under Traditional and Co-designs rounds, Color indicates the t value: (a) Traditional Com; (b) Co-design Com; (c) Traditional Draw; (d) Co-design Draw.
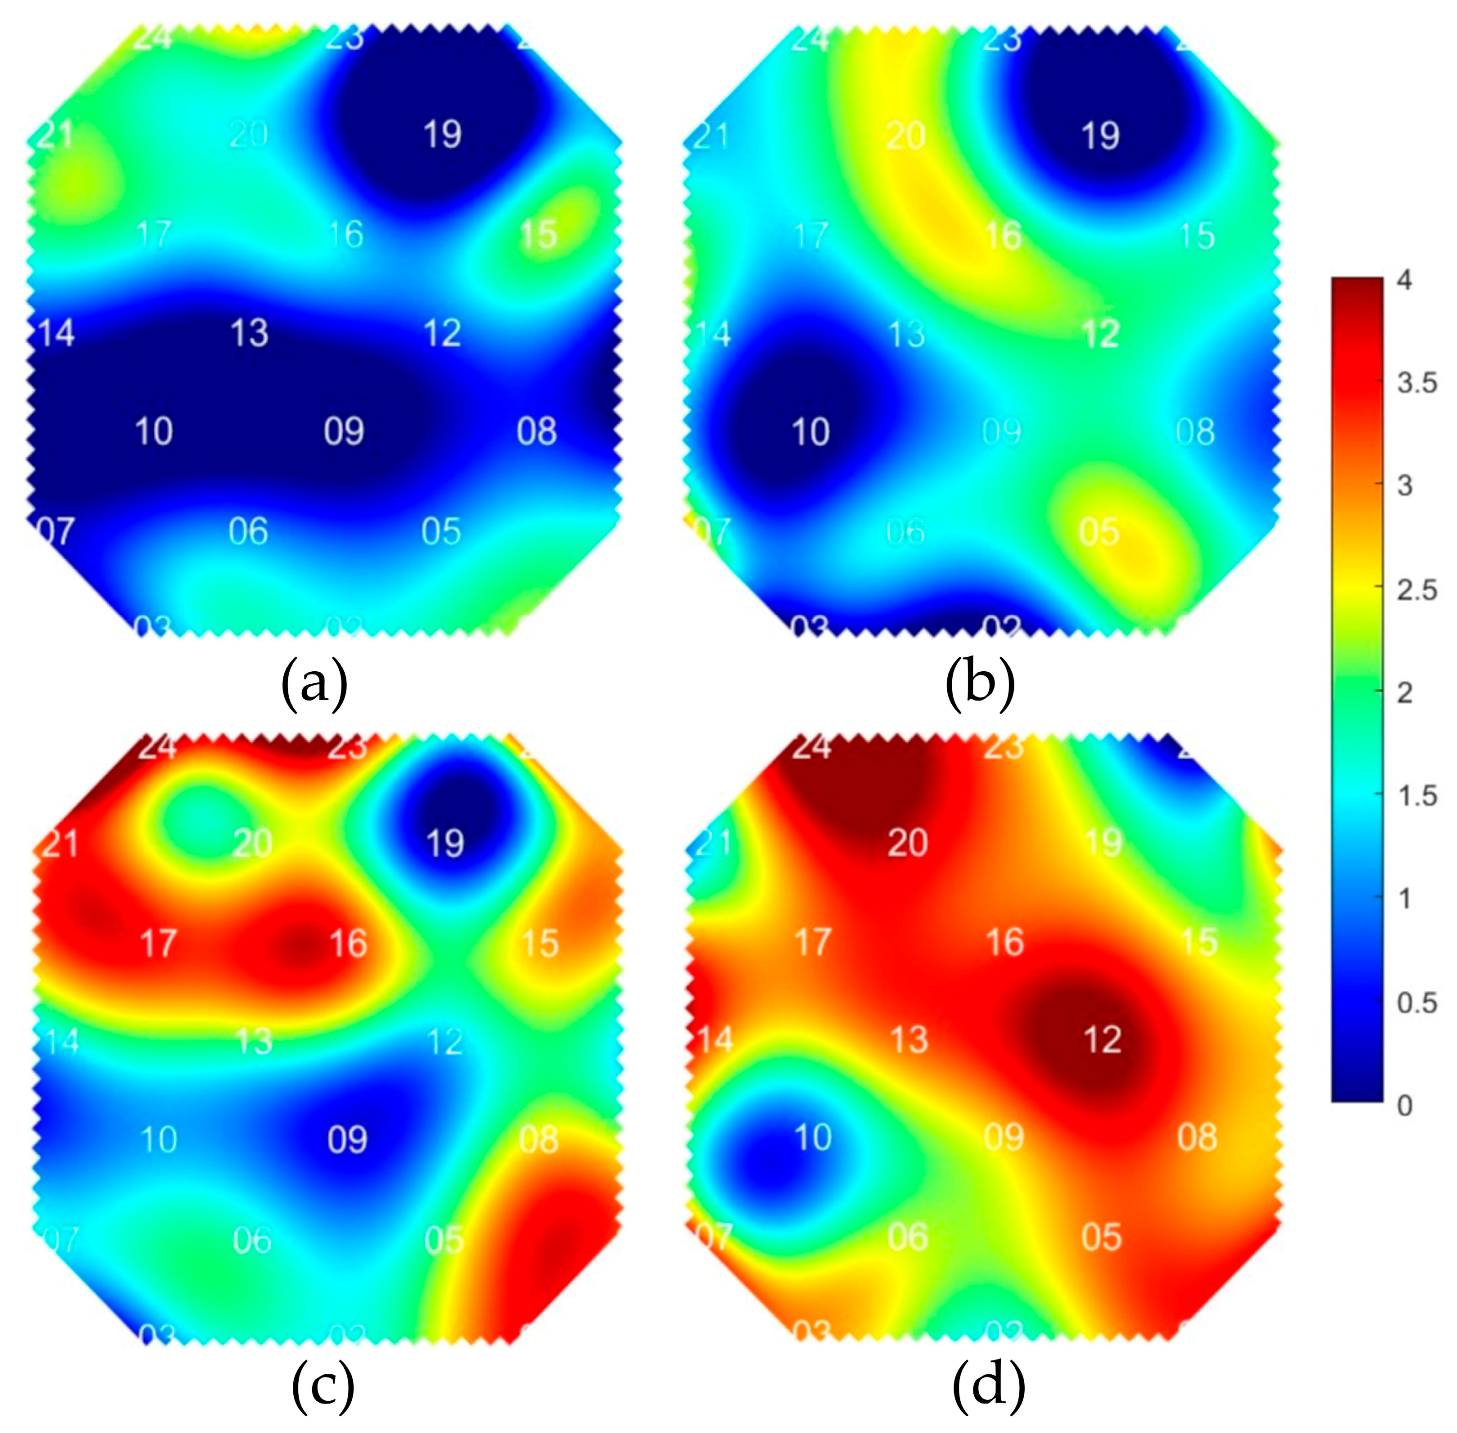
Figure 8.
Topographic map of t-values representing the differences in IBS between Draw and Com blocks , Color indicates the t value: (a) Traditional; (b) Co-design.
Figure 8.
Topographic map of t-values representing the differences in IBS between Draw and Com blocks , Color indicates the t value: (a) Traditional; (b) Co-design.
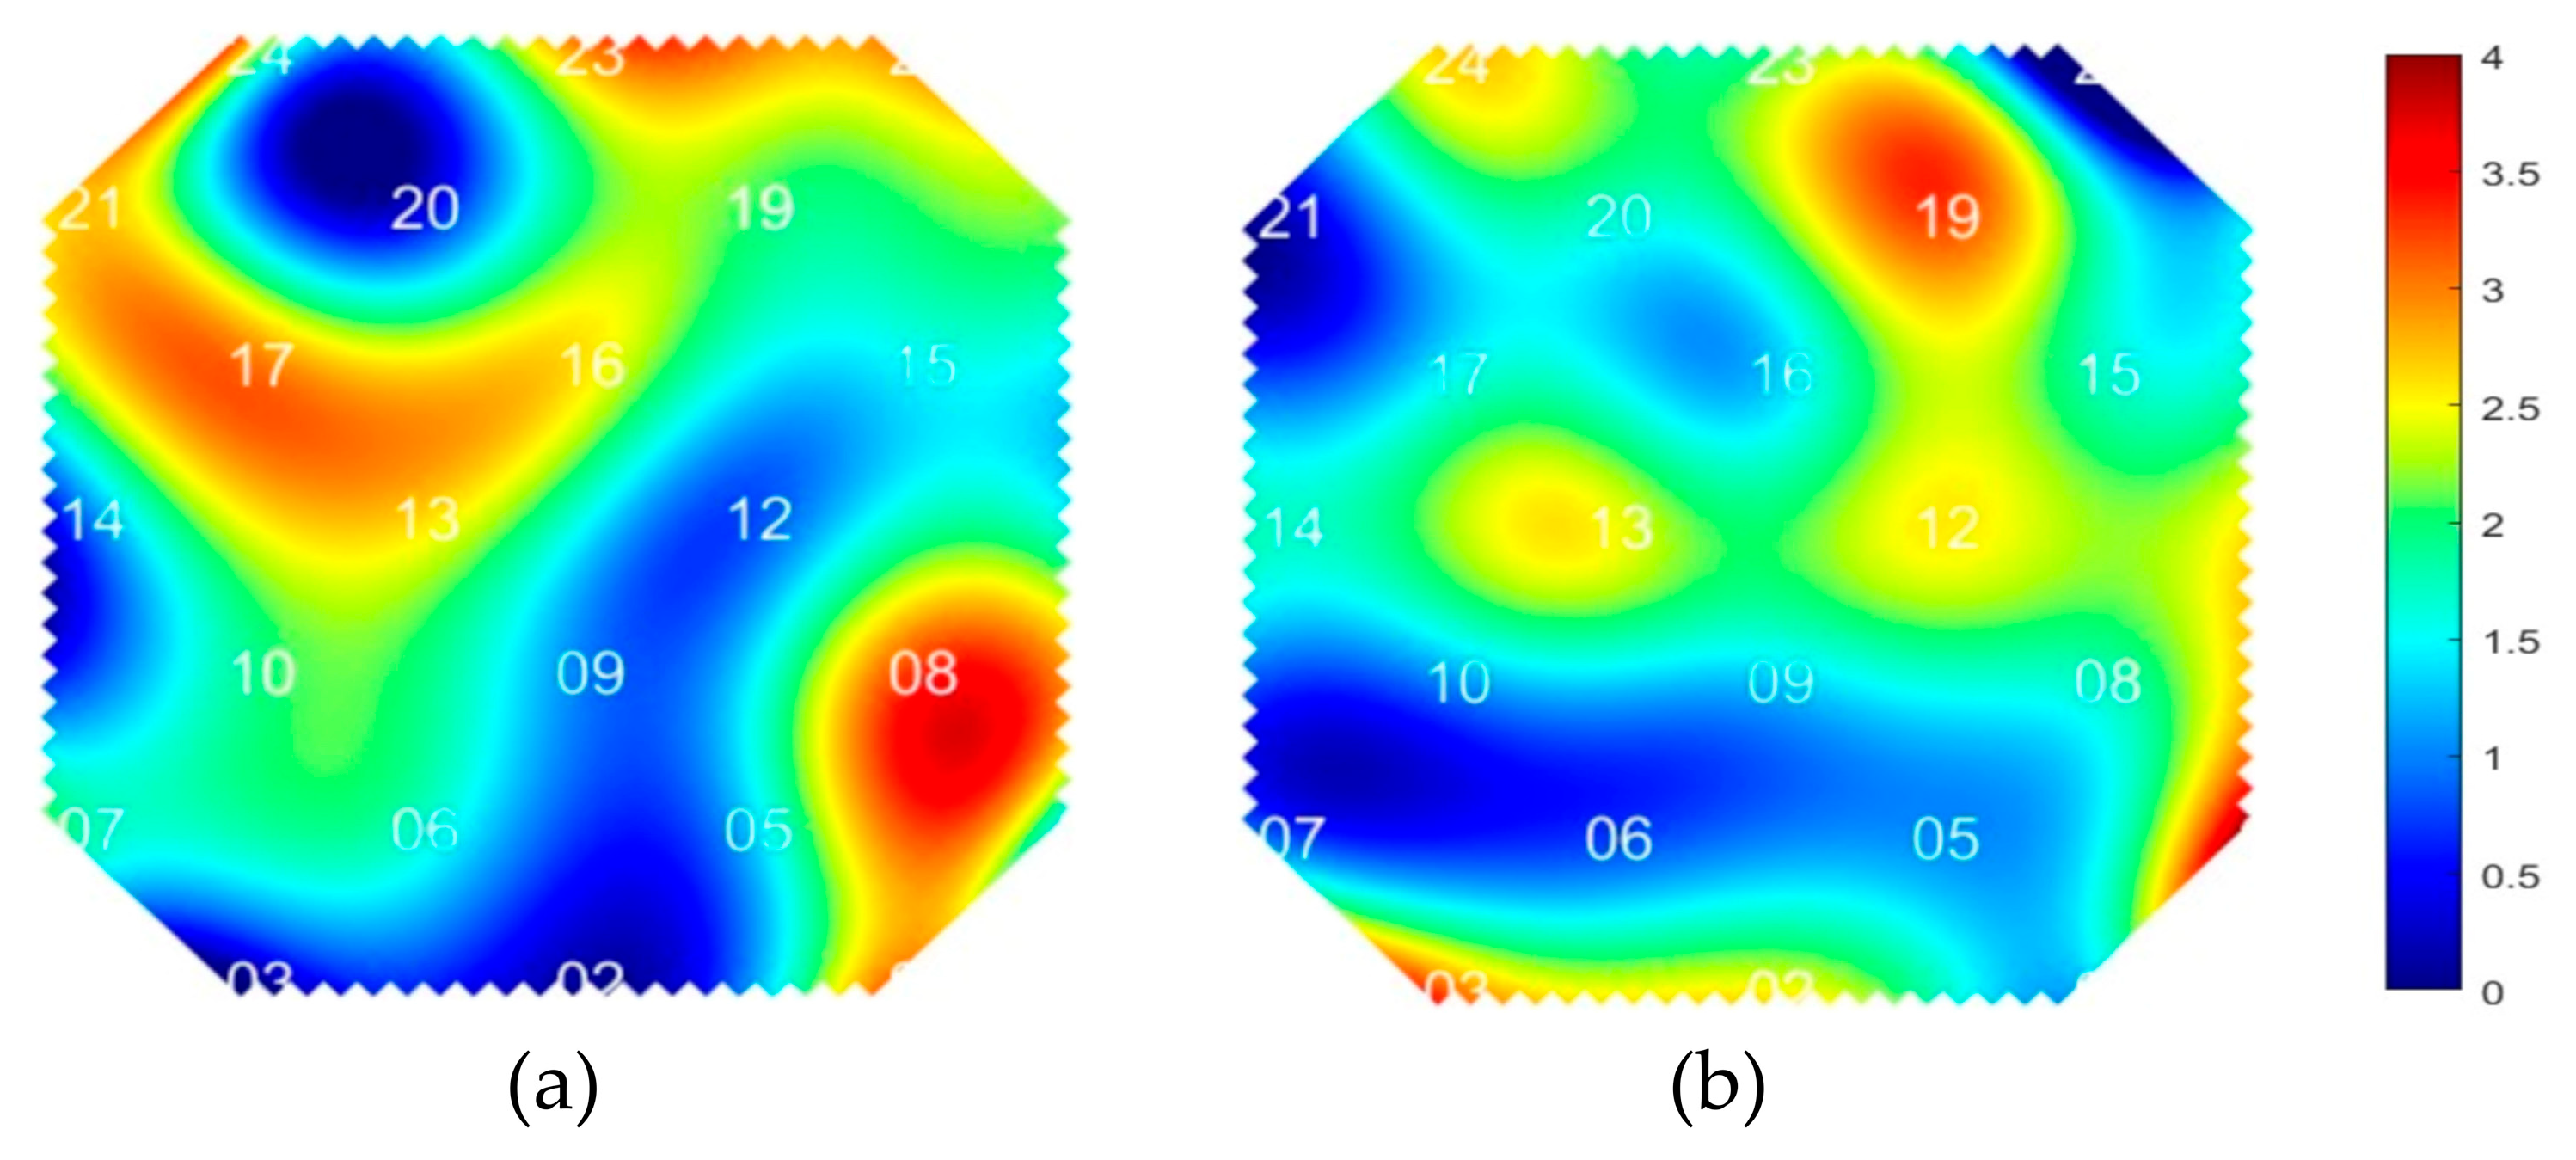
Figure 9.
Line graph of IBS across significant channels under Com and Draw block conditions: (a) Traditional; (b) Co-design.
Figure 9.
Line graph of IBS across significant channels under Com and Draw block conditions: (a) Traditional; (b) Co-design.
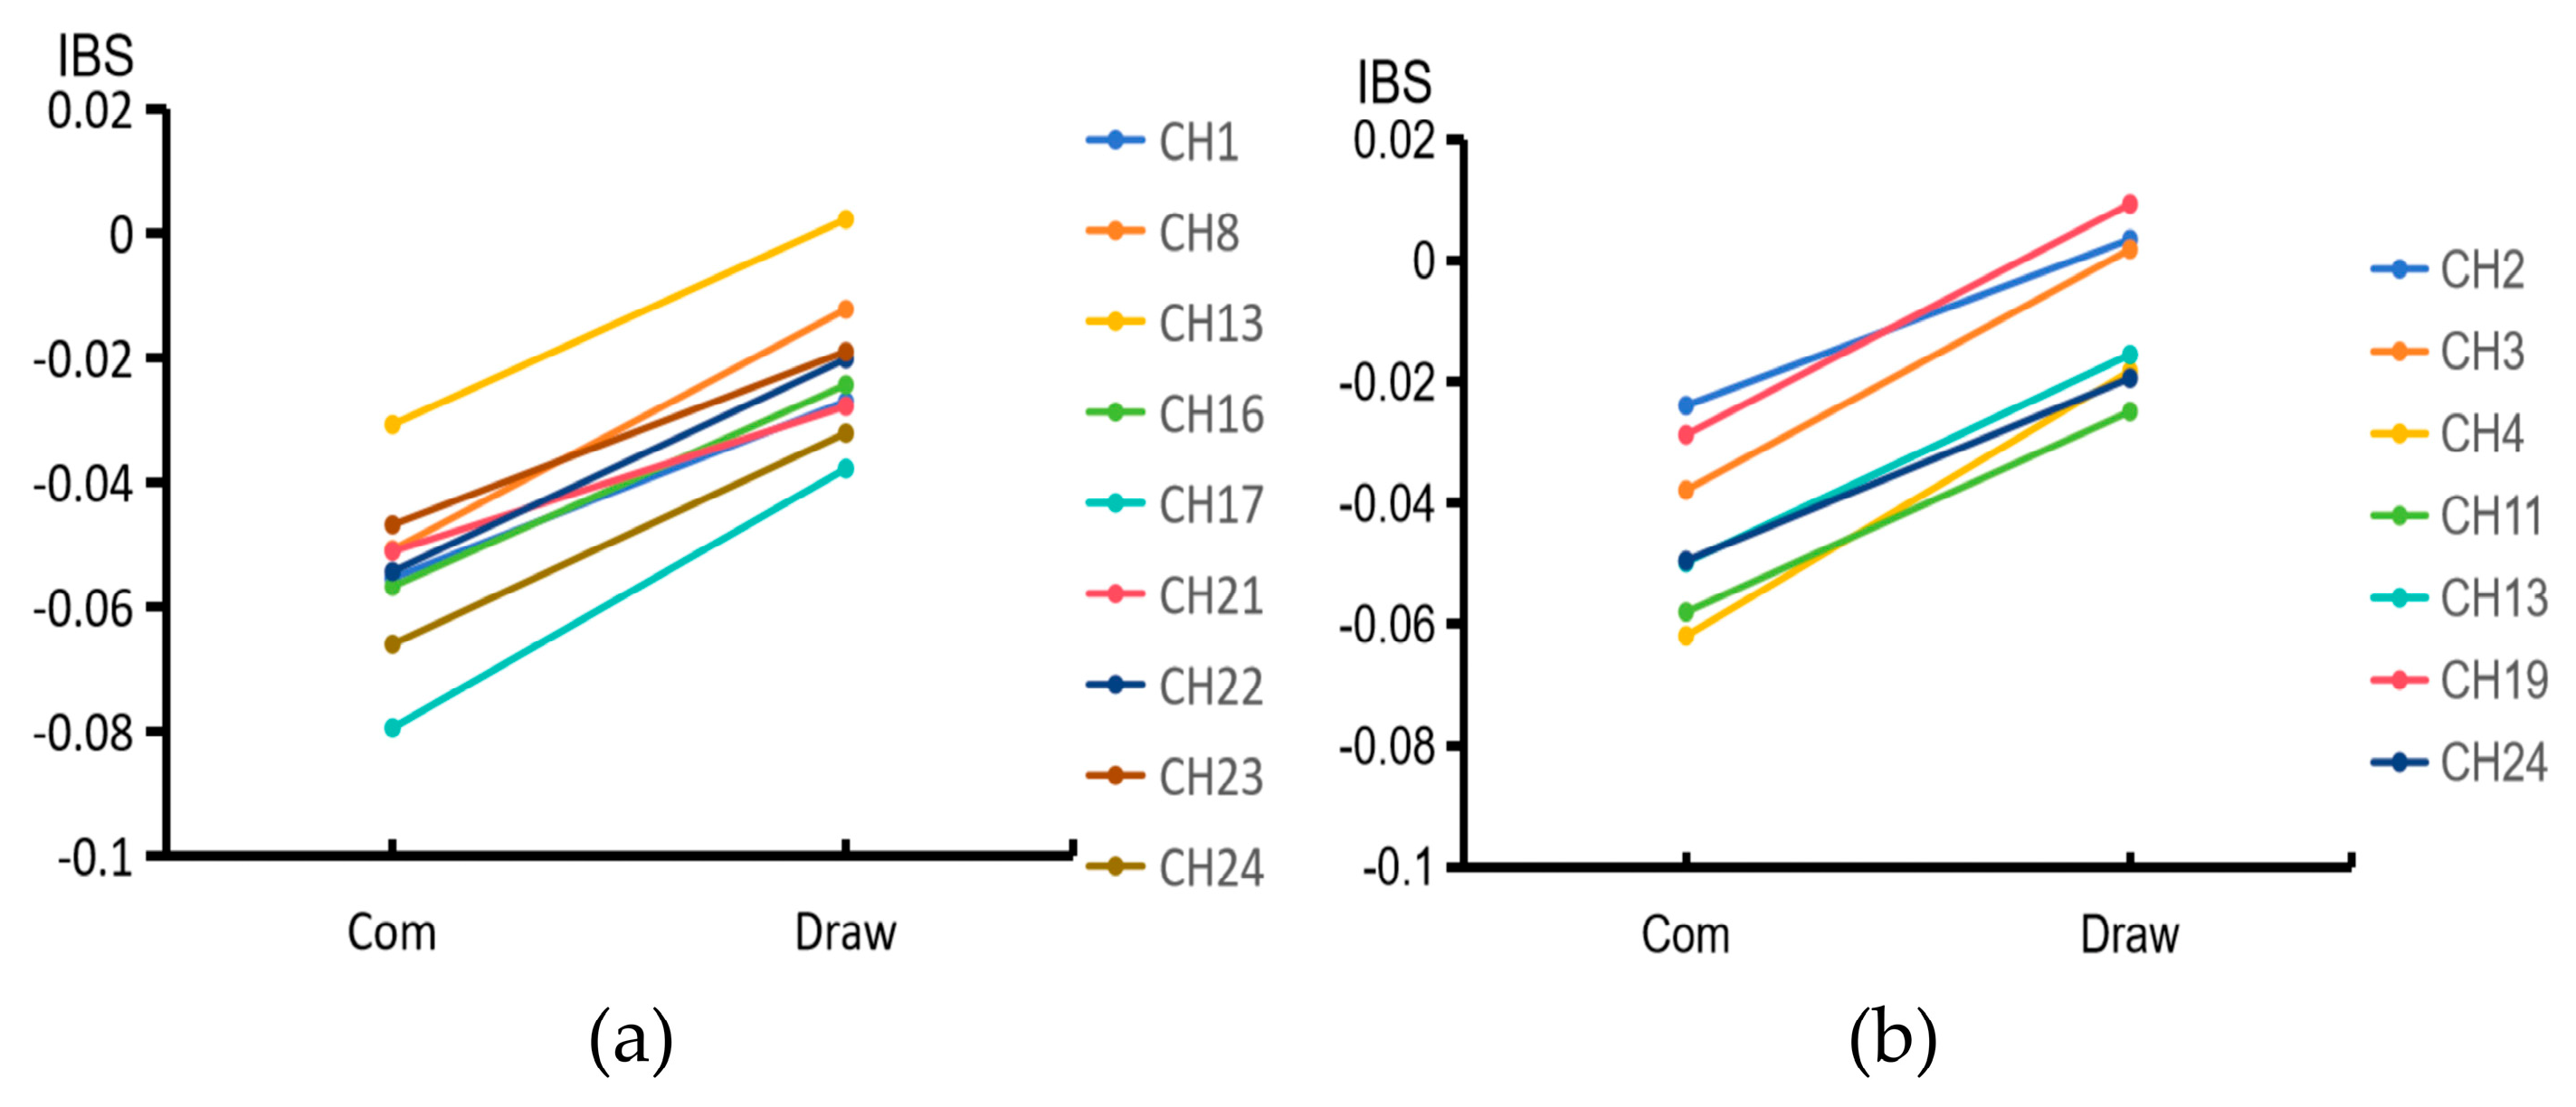
Figure 10.
Scatter plot of IBS versus psychological needs satisfaction rate in CH2 and CH3 under the Com block condition: (a) Traditional CH2 Com (T2C); (b) Traditional CH3 Com (T3C); (c) Co-design CH2 Com (C2C); (d) Co-design CH3 Com (C3C).
Figure 10.
Scatter plot of IBS versus psychological needs satisfaction rate in CH2 and CH3 under the Com block condition: (a) Traditional CH2 Com (T2C); (b) Traditional CH3 Com (T3C); (c) Co-design CH2 Com (C2C); (d) Co-design CH3 Com (C3C).
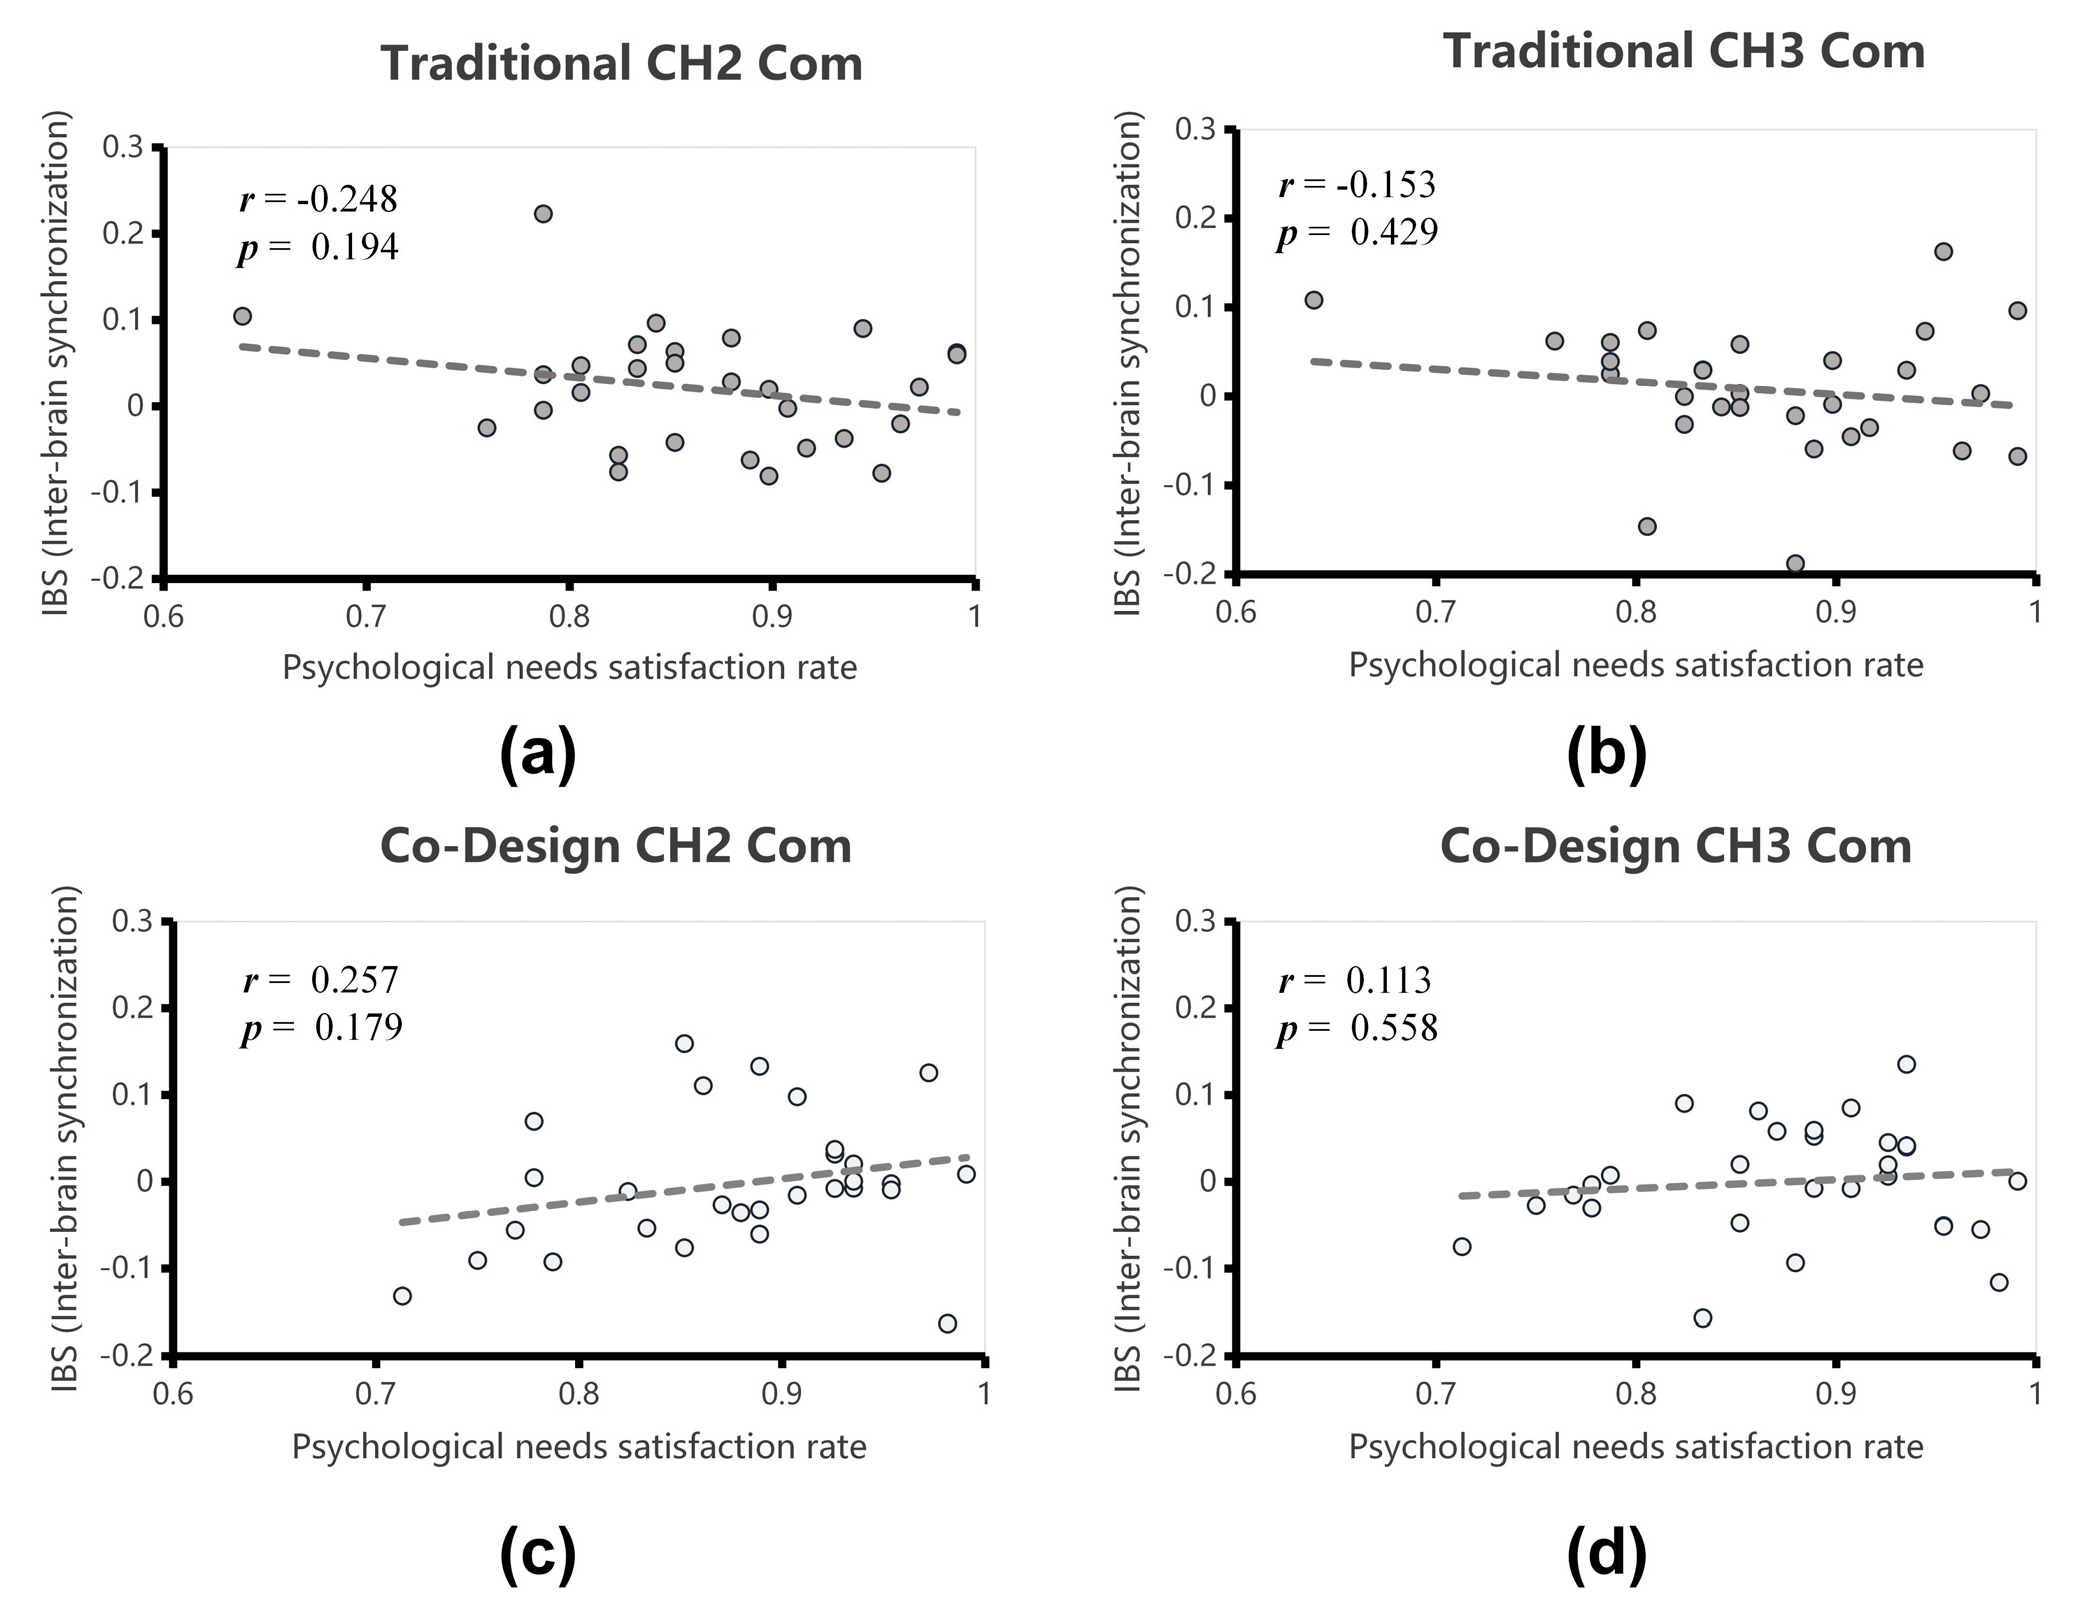
Figure 11.
Scatter plot of IBS versus psychological needs satisfaction rate in CH2 and CH3 under the Draw block condition: (a) Traditional CH2 Draw (T2D); (b) Traditional CH3 Draw (T3D); (c) Co-design CH2 Draw (C2D); (d) Co-design CH3 Draw (C3D).
Figure 11.
Scatter plot of IBS versus psychological needs satisfaction rate in CH2 and CH3 under the Draw block condition: (a) Traditional CH2 Draw (T2D); (b) Traditional CH3 Draw (T3D); (c) Co-design CH2 Draw (C2D); (d) Co-design CH3 Draw (C3D).
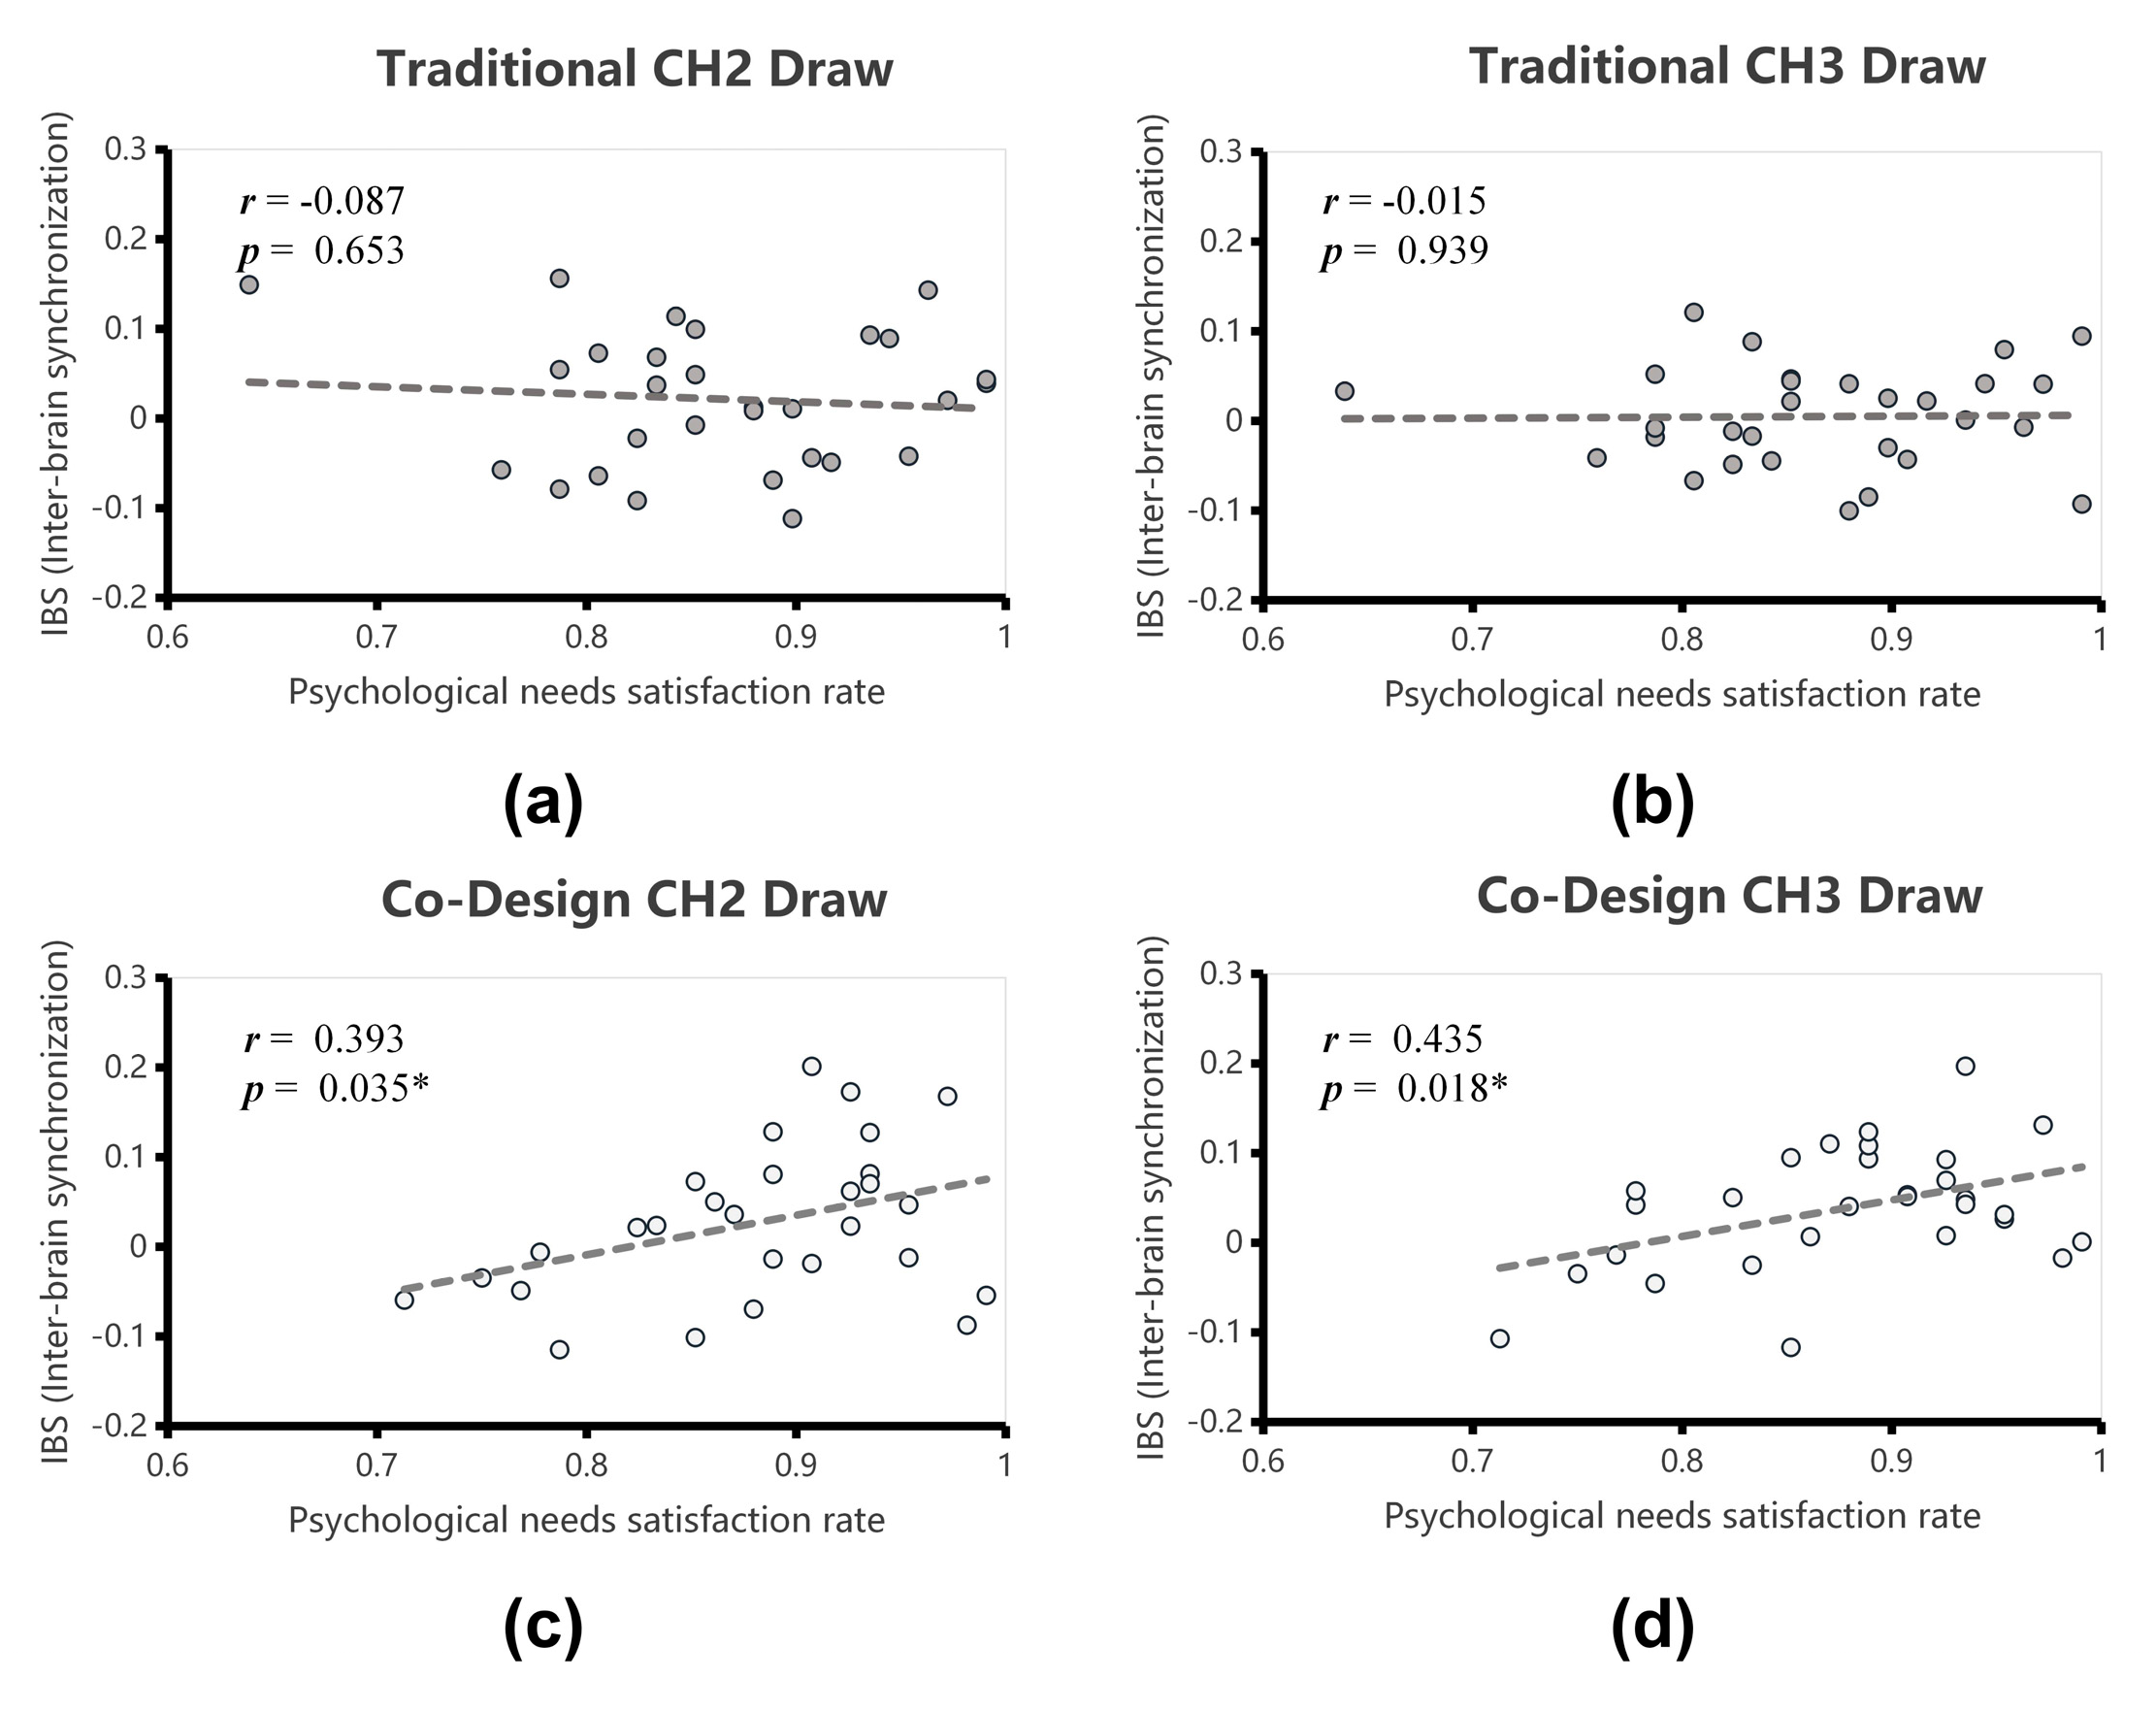

Table 1.
Table of significant channel data related to DLPFC and BROCA.
| Channel | No. | Brain area | PR | t | p | Cohen's d |
| CH2 | 44 | pars opercularis, part of Broca's area | 0.086 | 2.288 | 0.036 | 0.418 |
| 45 | pars triangularis Broca's area | 0.914 | ||||
| CH3 | 45 | pars triangularis Broca's area | 0.901 | 3.047 | 0.010 | 0.556 |
| 46 | Dorsolateral prefrontal cortex | 0.099 | ||||
| CH4 | 45 | pars triangularis Broca's area | 0.116 | 3.540 | 0.005 | 0.646 |
| 46 | Dorsolateral prefrontal cortex | 0.884 | ||||
| CH11 | 9 | Dorsolateral prefrontal cortex | 0.912 | 2.665 | 0.018 | 0.486 |
| 46 | Dorsolateral prefrontal cortex | 0.088 | ||||
| CH24 | 45 | pars triangularis Broca's area | 0.807 | 4.290 | 0.005 | 0.783 |
| 46 | Dorsolateral prefrontal cortex | 0.193 |
Disclaimer/Publisher’s Note: The statements, opinions and data contained in all publications are solely those of the individual author(s) and contributor(s) and not of MDPI and/or the editor(s). MDPI and/or the editor(s) disclaim responsibility for any injury to people or property resulting from any ideas, methods, instructions or products referred to in the content. |
© 2025 by the authors. Licensee MDPI, Basel, Switzerland. This article is an open access article distributed under the terms and conditions of the Creative Commons Attribution (CC BY) license (http://creativecommons.org/licenses/by/4.0/).
Copyright: This open access article is published under a Creative Commons CC BY 4.0 license, which permit the free download, distribution, and reuse, provided that the author and preprint are cited in any reuse.


