Submitted:
27 May 2025
Posted:
28 May 2025
You are already at the latest version
Abstract
Aiming at the problem that the interface functional area cannot be dynamically optimized according to the user's usage habits, this paper proposes an optimization model that integrates user behavior analysis, functional area recommendation and interface adaption. Through front-end behavioral data collection, TF-IDF and PCA extraction of preference features, combined with K-means clustering and graph embedding to model user usage patterns, and constructed a personalized recommendation algorithm integrating collaborative filtering and graph representation. The system significantly improves the task completion efficiency and user satisfaction in actual deployment, and verifies the effectiveness and scalability of the model. The research results provide a feasible path for the optimization of human-computer interaction in complex system interfaces.
Keywords:
user behavior modeling
; ribbon recommendation
; adaptive interface optimization
1. Introduction
With the increasing complexity of software system functions, the traditional interface design is difficult to meet the diversified and dynamic operational needs of users, resulting in a decline in the use of efficiency and satisfaction. Functional area recommendation and interface adaptive optimization for user habits have become an important path to improve interaction quality and system intelligence . Based on user behavior data collection and modeling, this paper constructs a personalized recommendation mechanism and responsive optimization strategy, realizes dynamic reconstruction and continuous iteration of interface structure, and promotes the development of human-computer interaction in the direction of precision and adaptability.
2. Analysis of User Habits
2.1. User Behavior Data Collection and Analysis
In the process of user behavior data collection and analysis, the combination of front-end based buried points and log tracking is used to obtain the whole process data of user operation in the system. Specifically, it includes key indicators such as function click records, page dwell time, scrolling behavior, path jumping and operation frequency . By deploying JavaScript buried scripts, real-time user click events are captured and structured data are generated, and the back-end realizes data flow and storage through Kafka log pipeline. In order to improve the analysis accuracy, a data cleaning process is introduced to eliminate abnormal operations (e.g., click jitter) and noise data. Subsequently, the user session recognition model is used to construct behavioral sequences, and the Markov chain model is used to model their behavioral transfer probability, as in Equation (1):
Where is the number of times a user jumps from feature to to reveal the migration pattern of usage between features.
On this basis, a heat map (see Figure 1) and a click flow path map are generated to visualize the user attention and usage flow of different functional areas. Preliminary analysis results show that the click frequency of function A and B accounts for 24.7% and 19.3% of the total operation respectively, which is significantly higher than that of other regions, verifying that there is a significant concentration in the use of the functional area, and providing a data basis for the subsequent personalized recommendation and interface layout optimization.
2.2. User Preference and Feature Extraction
User usage preferences are modeled by constructing a user-function click matrix , where each row represents a user and each column corresponds to a function. The element denotes the number of clicks user iii made on function . To capture individual behavior salience, the TF-IDF weighting is applied:
Where is the raw count of clicks of user on function , is the total number of users, and the denominator in the logarithmic term is the number of users who used function .
To reduce dimensionality and extract dominant preference directions, PCA is applied on the TF-IDF matrix. The covariance matrix is decomposed, and the top two principal components are selected to project each user onto a 2D preference space. The resulting plot (Figure 2) reveals clustering patterns that form the basis of segmentation and further recommendation.
2.3. User Group Segmentation and Modeling
On the basis of completing the user preference feature extraction, this paper further adopts the K-means clustering algorithm to divide the users into groups and establish the corresponding behavioral model . First, the user click vectors normalized by TF-IDF are used as input features, and the optimal number of clusters is determined using the Elbow Method (see Figure 3). Define the sum of squared errors within clusters (SSE) as:
Where denotes the cluster of class and is its center point.
Figure 3 shows the SSE trends under different values of , and the results show that the inflection point at is the most obvious, and three user groups are identified. Subsequent visualization of the clustering results reveals that Cluster 1 is dominated by "Func A" and "Func B" high-frequency users, accounting for 47% of the total number of users; Cluster 2 favors "Func C" and "D"; and Cluster 3 shows the trend of "Func C" and "Func D". Cluster 2 favors "Func C" and "D", while Cluster 3 exhibits decentralized click characteristics. Further, Markov transfer model and click probability matrix are constructed for each type of group to predict the transfer trend between different functional areas, which provides the behavioral image basis for personalized recommendation and adaptive interface optimization .
3. Mechanisms for Recommending Functional Areas
3.1. Analysis of the Frequency of Use of Functional Areas
In the analysis of the frequency of use of functional areas, the number of clicks and the percentage of the use of each functional area in the system during the user's operation were counted, in order to identify the high-frequency operation area and the focus of user attention. Through the aggregation analysis of the log data in the past 30 days, it was found that functional areas A, B and C received a total of 247, 193 and 88 clicks, respectively, accounting for 41.5%, 32.4% and 14.8% of the total number of clicks, and the three together accounted for 88.7% of the total number of clicks, which is significantly higher than that of the other functional areas, and shows a high concentration of operating behavior. In order to facilitate intuitive comparison, this paper draws a histogram of function clicks. with the function number on the horizontal axis and the number of clicks on the vertical axis, and the specific values are marked in the diagram. The usage trend of each function in different time periods (e.g., the peak period is concentrated in 9:00-11:30 and 14:00-17:00) is further analyzed to reveal the differences in the intensity of users' reliance on the functional areas in specific task scenarios. Function B was used significantly more frequently in mobile access than desktop, suggesting that it is more popular in clean interfaces. These usage frequency analysis results provide a key supportive basis for the subsequent prioritized display and recommendation strategy of functional areas.
3.2. Modeling of Functional Area Correlations
The modeling of functional area correlation adopts a combination of functional co-occurrence matrix and Apriori algorithm. Firstly, the functional pairs continuously used by users in a single session are counted to construct a functional co-occurrence matrix; Subsequently, Apriori was used to mine high-frequency functional combinations, extract support and confidence indicators, quantify the strength of correlations between functions, and provide a structured dependency basis for subsequent recommendations .
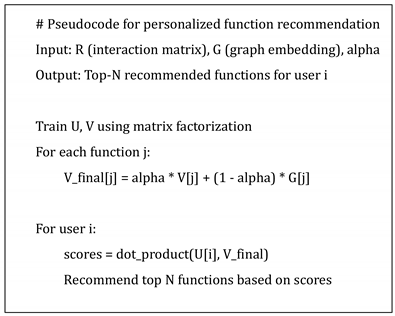
3.3. Personalized Ribbon Recommendation Algorithm
In the design of personalized function area recommendation algorithm, this paper adopts the method of fusion of collaborative filtering and graph embedding, and comprehensively considers the semantic correlation between the user's historical behavioral preferences and the function area to realize individualized function recommendation. Firstly, based on the user-function click matrix , matrix decomposition method is used to obtain the user potential preference vector and function representation vector , and the optimization objective is to minimize the loss function:
where, is the set of observed interactions and is the regularization parameter.
Subsequently, the pre-trained functional vectors in Graph Embedding are introduced, and the functionally enhanced representation is constructed by fusing with , and the modulation parameter controls the fusion weight . The final recommendation score is calculated from the inner product:
And the Top-N functional areas are recommended according to the scores sorted from high to low. The algorithm takes into account individual preferences, functional structural relationships and semantic similarity, and effectively improves recommendation accuracy and user acceptance.
Top-N recommendations are obtained by sorting scores descendingly. Below is a simplified pseudocode:
4. Interface Adaptive Optimization
4.1. Interface Layout and Interaction Design
Based on user behavior and preferences, the interface adopts a modular layout and task-oriented interaction strategy. Core functions are placed centrally, while auxiliary ones are marginal, with a grid system ensuring consistency across devices. Interaction design follows shortest path logic to reduce steps, using responsive cards and sliding menus for efficient operation. Shortcut identification and feedback mechanisms enhance navigation. Click heatmaps and eye-tracking simulations guide optimization of information density and visual load, balancing efficiency, clarity, and aesthetics.
4.2. Responsive Interface Adaptive Strategies
The responsive interface strategy dynamically adjusts layout and interaction based on device type, screen size, user behavior, and preferences to ensure optimal display and experience. It integrates Media Query, Component Adaptive Rules, and Behavior-Driven Mechanisms. Structurally, a Grid System with breakpoints controls layout flexibly. Components adapt via visibility and icon simplification, while content uses folding and tabs. User behavior (e.g., click frequency, dwell time) guides personalized adjustments. Lazy loading and async rendering enhance performance on low-end devices. This forms a “structure-behavior-preference” adaptive model for broad compatibility and user-centric optimization.
4.3. Optimization Algorithm and Iterative Validation
In addition to the genetic algorithm-driven interface optimization, a comparative experimental framework is introduced to benchmark our model against baseline methods, including:
Rule-Based Layout: fixed predefined positions for core functions;
Traditional Collaborative Filtering: without graph embedding or behavioral modeling.
A dataset of 120 users (balanced by age, device type, and usage frequency) is used. Each user completes identical interface tasks under all three systems. Performance is measured in task completion time and satisfaction score. A one-way ANOVA followed by Tukey's HSD test confirms that our method significantly outperforms the baselines (p<0.01).Furthermore, sub-group analysis reveals our model’s superior adaptability in mobile-heavy users and high-function-switching scenarios, demonstrating strong generalization.
5. System Implementation and Validation
5.1. System Architecture Design
The functional area recommendation and interface adaptive optimization system proposed in this paper adopts a front-end and back-end separation architecture, which is divided into four core layers: data acquisition layer, analysis modeling layer, recommendation service layer and interface presentation layer. The data collection layer is based on the front-end buried point and log system, which acquires user behavior in real time and transmits it to the back-end. The analysis and modeling layer uses Python and Spark framework for data cleaning, user modeling and recommendation model training. Recommendation service layer deploys model interfaces in the form of Flask microservices to provide personalized recommendations and layout optimization strategy output. The interface rendering layer is built based on the React framework, combining responsive design and behavior-aware modules to dynamically render the interface structure. Each layer realizes the efficient transfer of data and model flow through Kafka and REST API, constituting a scalable and iterative adaptive optimization system.
5.2. Key Technology Realization
The key technology implementation of the system covers three core modules: front-end behavior capture, back-end model service and interface dynamic rendering. In the front-end, JavaScript embedded embedding technology is used to realize the real-time capture of user clicks, dwell time, scrolling behavior and other operational data, which is transmitted to the server via WebSocket. In the back-end, Python is used to build a data processing pipeline, combining Pandas and Sklearn to complete user feature extraction and function recommendation model training, and deploying Flask-based API interfaces for front-end calls. The interface adaptive part utilizes React framework and CSS media query to achieve responsive layout, and dynamically adjusts the component reveal and layout structure in combination with user preference. Recommendation results and optimization strategies are sent back via REST interface to achieve intelligent rearrangement and interaction optimization of functional areas.
5.3. Performance Evaluation and User Experience Testing
The optimization effect of this system in the actual use of the scene, the design of the user experience comparison test, selected 10 users before and after the optimization of the same operation tasks, and statistics on the key interaction index changes, the specific data are shown in Table 1.
As seen in Table 1, after system optimization, the average task completion time of users decreased from 42.1 seconds before optimization to 32.9 seconds, shortening by nearly 9.2 seconds on average, a decrease of 21.9%, which significantly improves the operation efficiency. Meanwhile, the average satisfaction score increased from 67.8 to 83.6, an increase of 23.2%. Among them, user 3 and user 7 showed the most significant increase in satisfaction, with 18 and 17 points respectively. The overall data show that the system is effective in improving interaction fluency and user experience, and has strong practical value.
In order to further verify the operation efficiency of the system in different terminals and environments, the performance of the system was tested and compared in three dimensions: page loading, response delay and resource consumption, and the specific data are shown in Table 2.
As shown in Table 2, after optimization, the page loading time of the system is reduced from 850ms to 690ms, and the interface response delay is reduced from 120ms to 88ms, which is 18.8% and 26.7% respectively; the CPU occupancy rate is reduced to 33.4%, and the memory usage is reduced from 184.2MB to 173.8MB; the system's response performance is significantly optimized at the same time as the consumption of hardware resources is reduced. The system reduces the consumption of hardware resources while the front-end response performance is obviously optimized, which provides a technical guarantee for the efficient operation of multiple terminals.
6. Conclusion
In this paper, we constructed a functional area recommendation and interface adaptive optimization model oriented to user habits, integrating behavioral data analysis, clustering modeling, correlation mining and multi-source recommendation algorithms to realize the precise optimization of interface function layout and interaction mode. The system shows obvious advantages in performance evaluation and user experience validation, reflecting the feasibility and practicality of behavior-driven interface adaptation strategy. Subsequent research can further introduce multimodal data sources and context-aware mechanisms to explore high-dimensional user intent modeling and real-time interface intelligent evolution paths in more complex application scenarios, so as to improve the response accuracy and system adaptability of individualized human-computer interaction.
References
- Chen M, Kang Y, Li K, et al. Deep reinforcement learning for maintenance optimization of multi-component production systems considering quality and production plan [J]. Quality Engineering, 2025, 37 (2): 219-230.
- Li F, Sui Y, Lin H, et al. Self-adaptive interfacial evaporation for high-efficiency photovoltaic panel cooling [J]. Device, 2025, 3 (2): 100569-100569.
- Ding J, Tu J, Li H, et al. Chemical-Strain-Engineered Adaptive Interfaces in Nanocomposite Films for Robust Ferroelectricity [J]. Advanced Functional Materials, 2024, 35 (5): 2414698-2414698.
- Stockinger E, Gallotti R, Hausladen I C. Early morning hour and evening usage habits increase misinformation-spread [J]. Scientific Reports, 2024, 14 (1): 20233-20233. [CrossRef]
- Cao C, Su H, Ai L, et al. Highly Stable Liquid Metal-Based Electronic Textiles by Adaptive Interfacial Interactions [J]. Advanced Functional Materials, 2024, 34 (49): 2409586-2409586.
- Suryani M, Sensuse I D, Santoso B H, et al. An initial user model design for adaptive interface development in learning management system based on cognitive load [J]. Cognition, Technology & Work, 2024, 26 (4): 653-672. [CrossRef]
- Li J, Zhou Y, Huang X, et al. Surface-adaptive interfaces: Bioresorbable ultrasound biomedical devices for noninvasive monitoring and imaging of deep-tissue homeostasis [J]. The Innovation, 2024, 5 (4): 100651-100651.
- Zhang Q, Li R, Li J, et al. Probing plastic and adhesive self-healing interface using in situ electrochemical atomic force microscopy for high-rate Si/C anode [J]. Cell Reports Physical Science, 2024, 5 (6): 102000-102000.
- Haifeng B, Weining F, Beiyuan G, et al. Adaptive Human–Computer Interface Design for Supervision Task Based on User Attention and System State [J]. International Journal of Human–Computer Interaction, 2024, 40 (8): 2054-2066. [CrossRef]
- Zhikun G, Lishuang F, Chenyang Z, et al. Dynamic and Self-adapting Interface Coating for Stable Zn Metal Anode. [J]. Advanced materials (Deerfield Beach, Fla.), 2021, 34 (2): e2105133-e2105133.
- C K N, M P G, D S S, et al. Development of a Perioperative Medication-Related Clinical Decision Support Tool to Prevent Medication Errors: An Analysis of User Feedback. [J]. Applied clinical informatics, 2021, 12 (5): 984-995.
Figure 1.
Function Transition Heatmap.
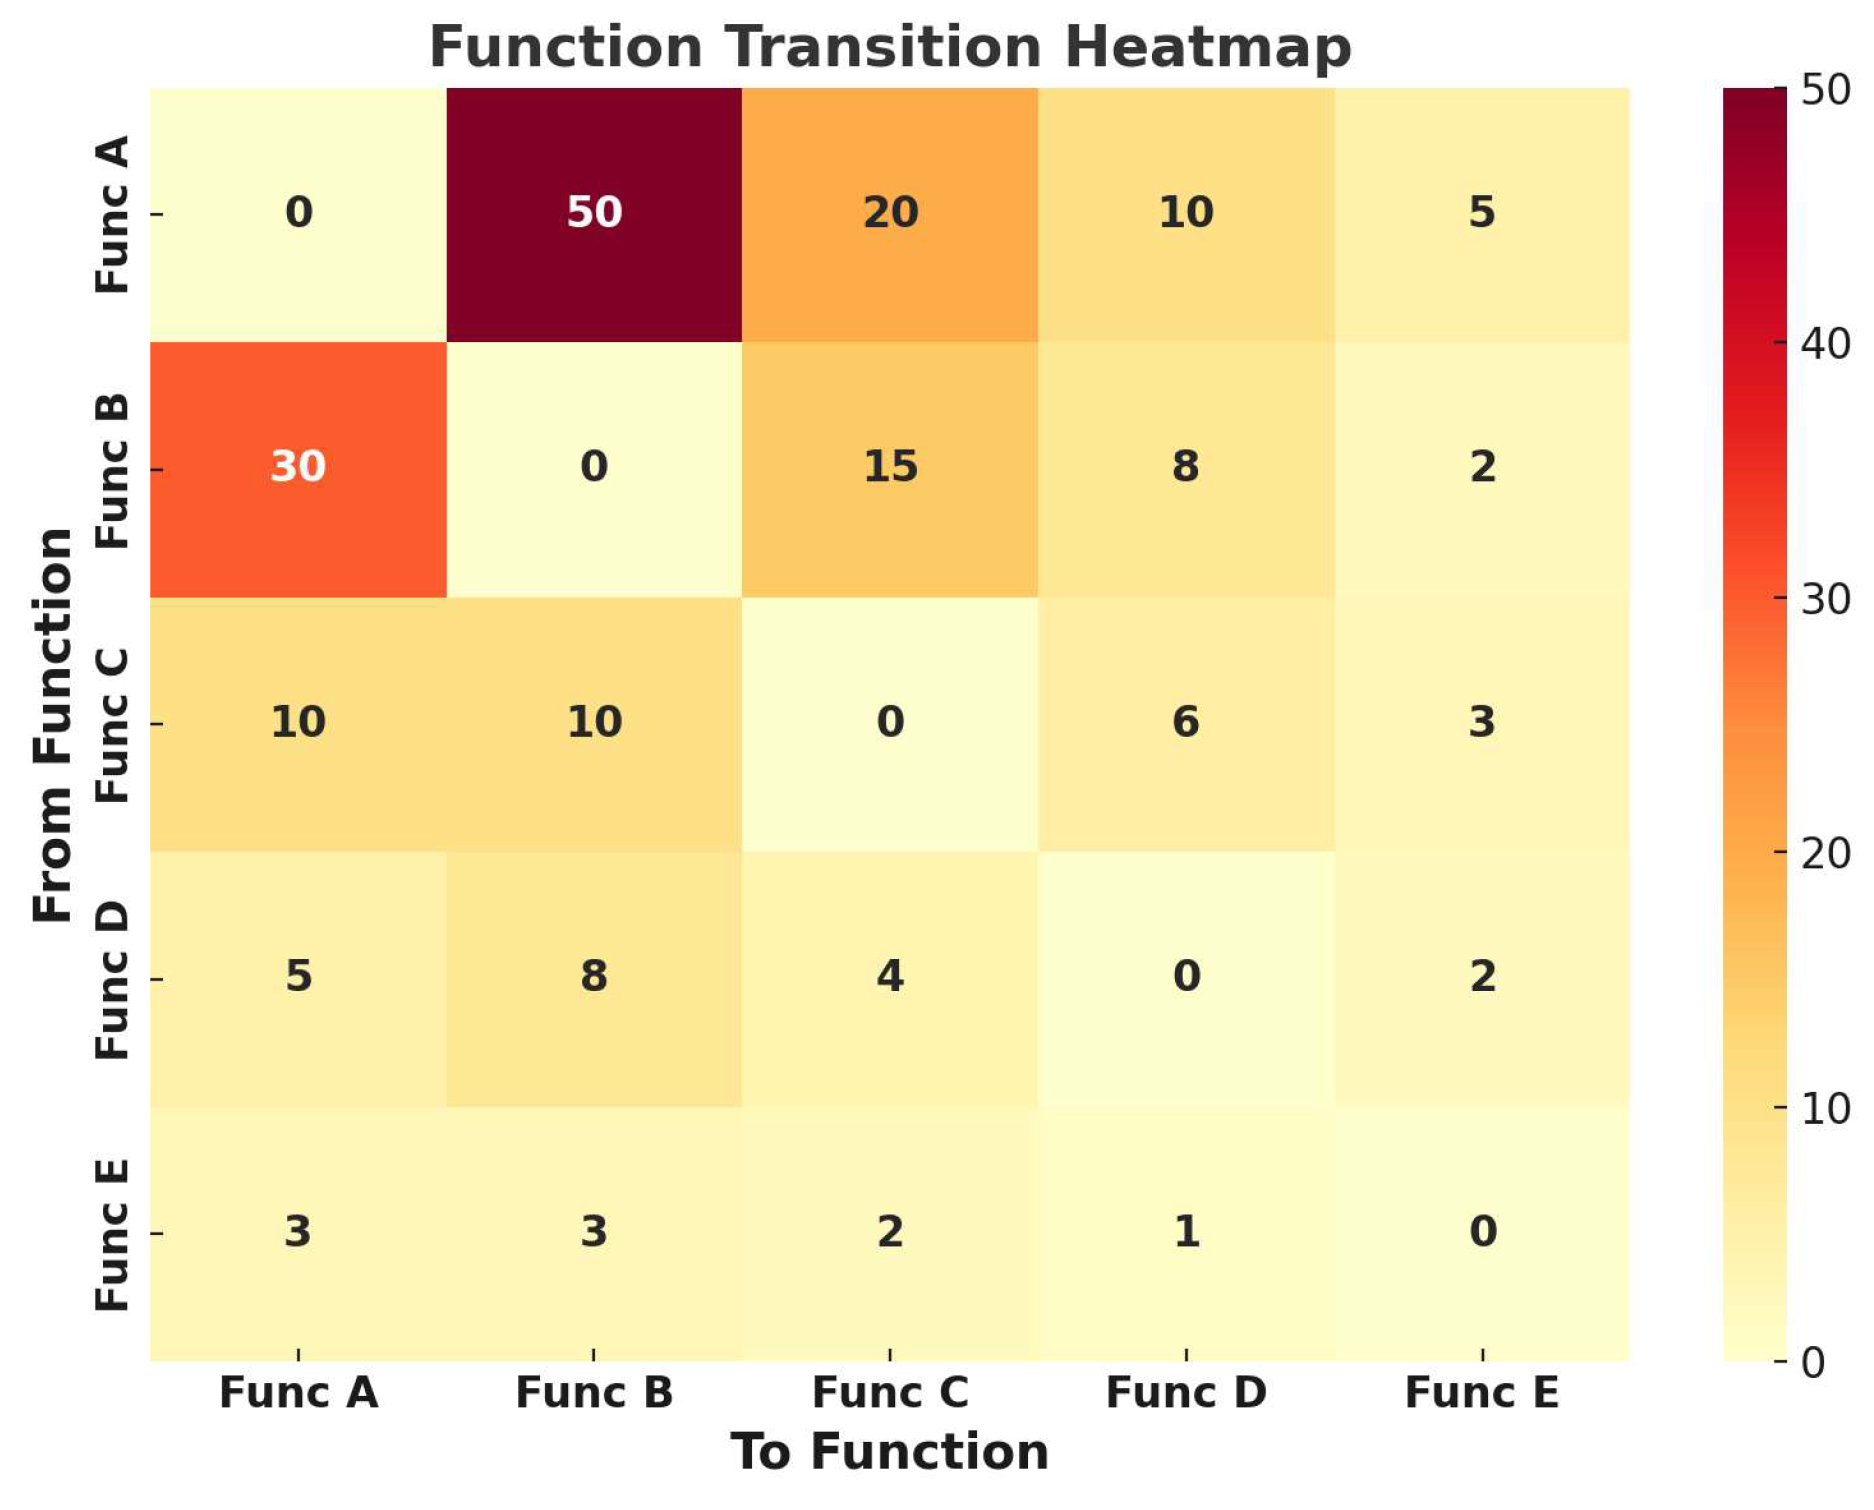
Figure 2.
User Preference Distribution (PCA).
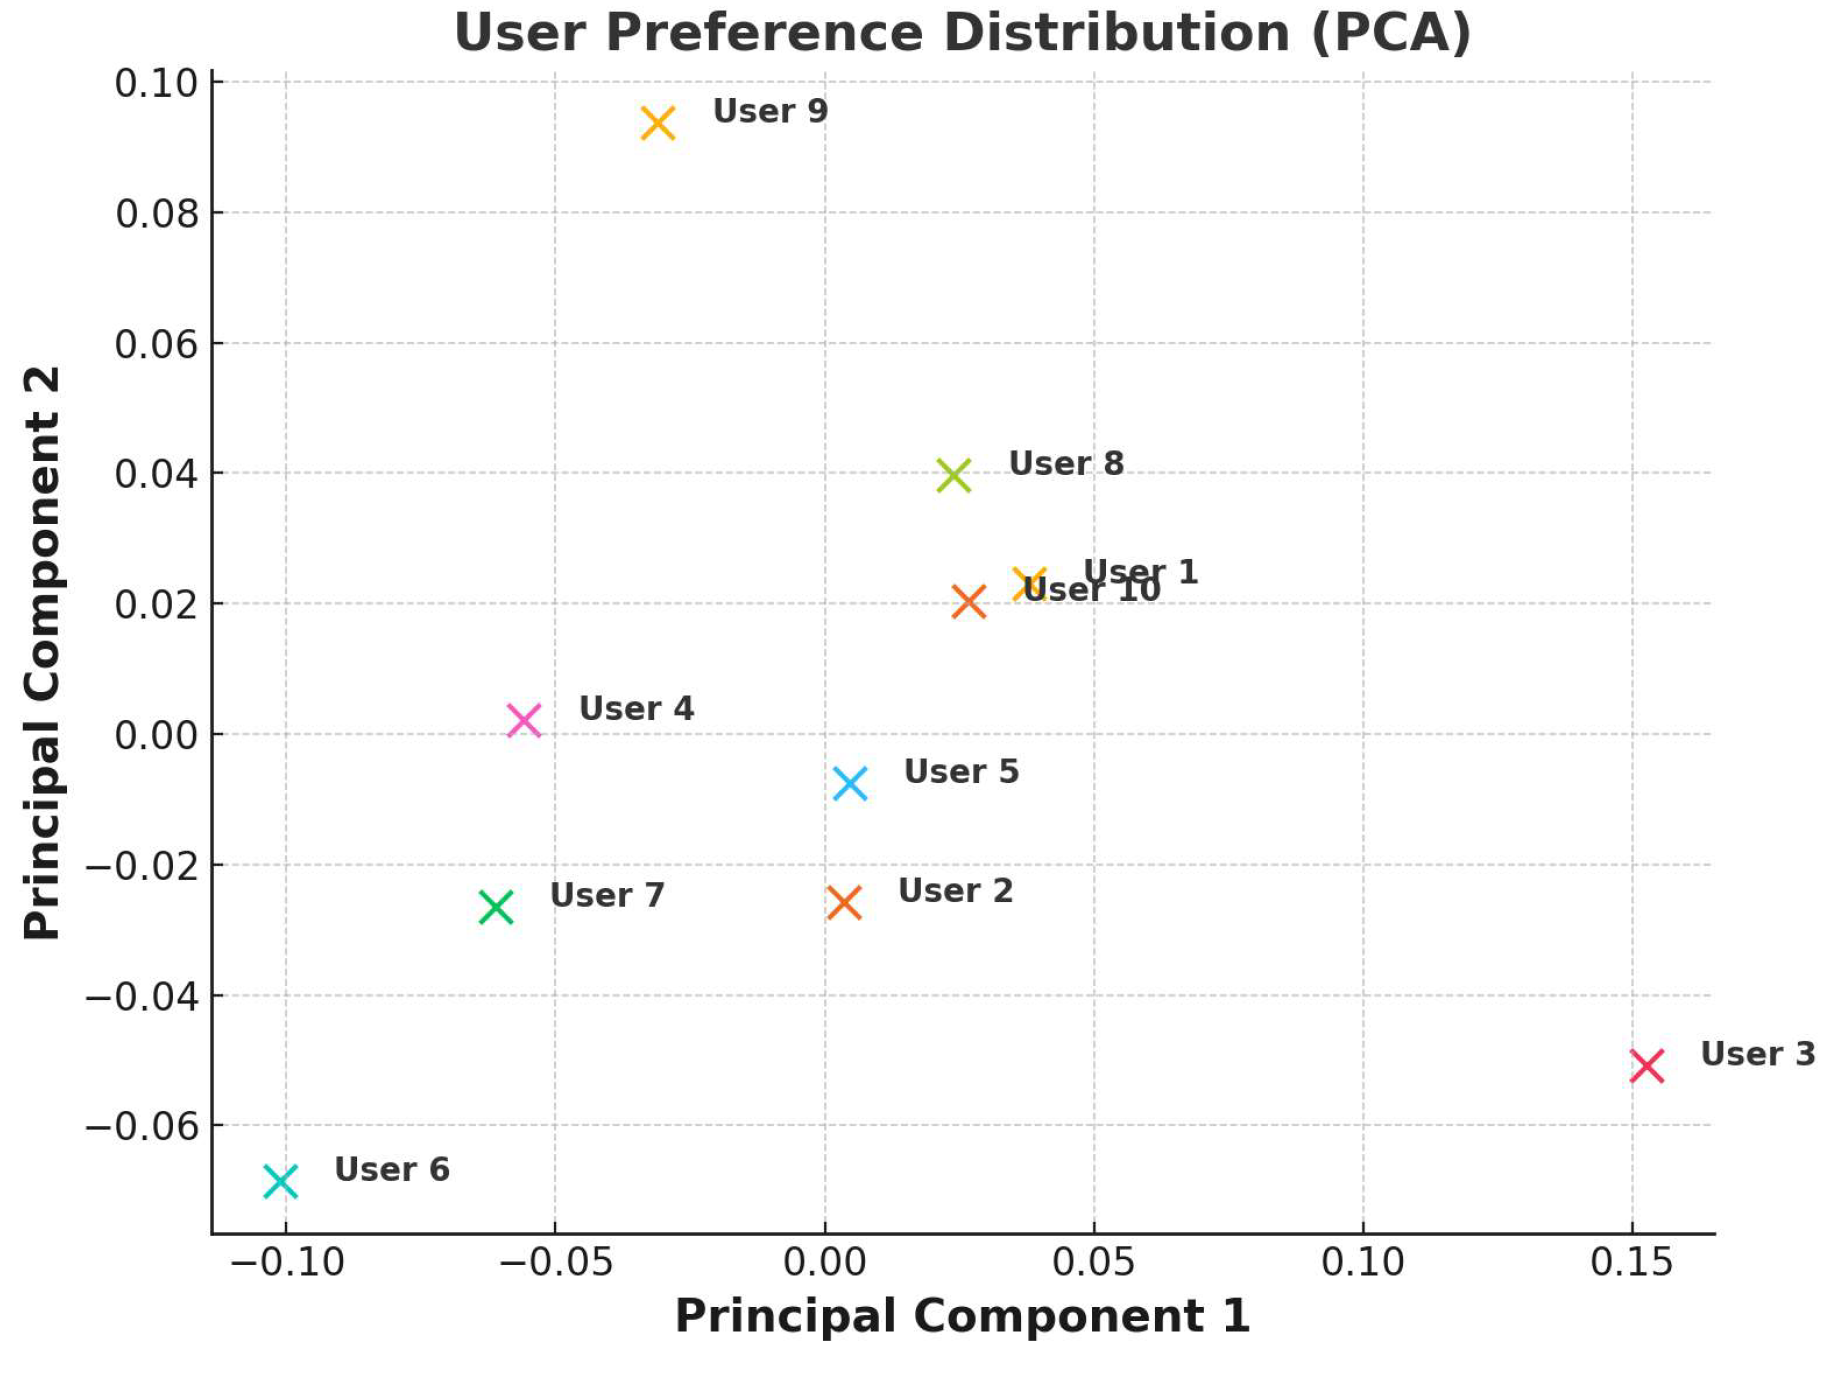
Figure 3.
Elbow Method For Optimal K.
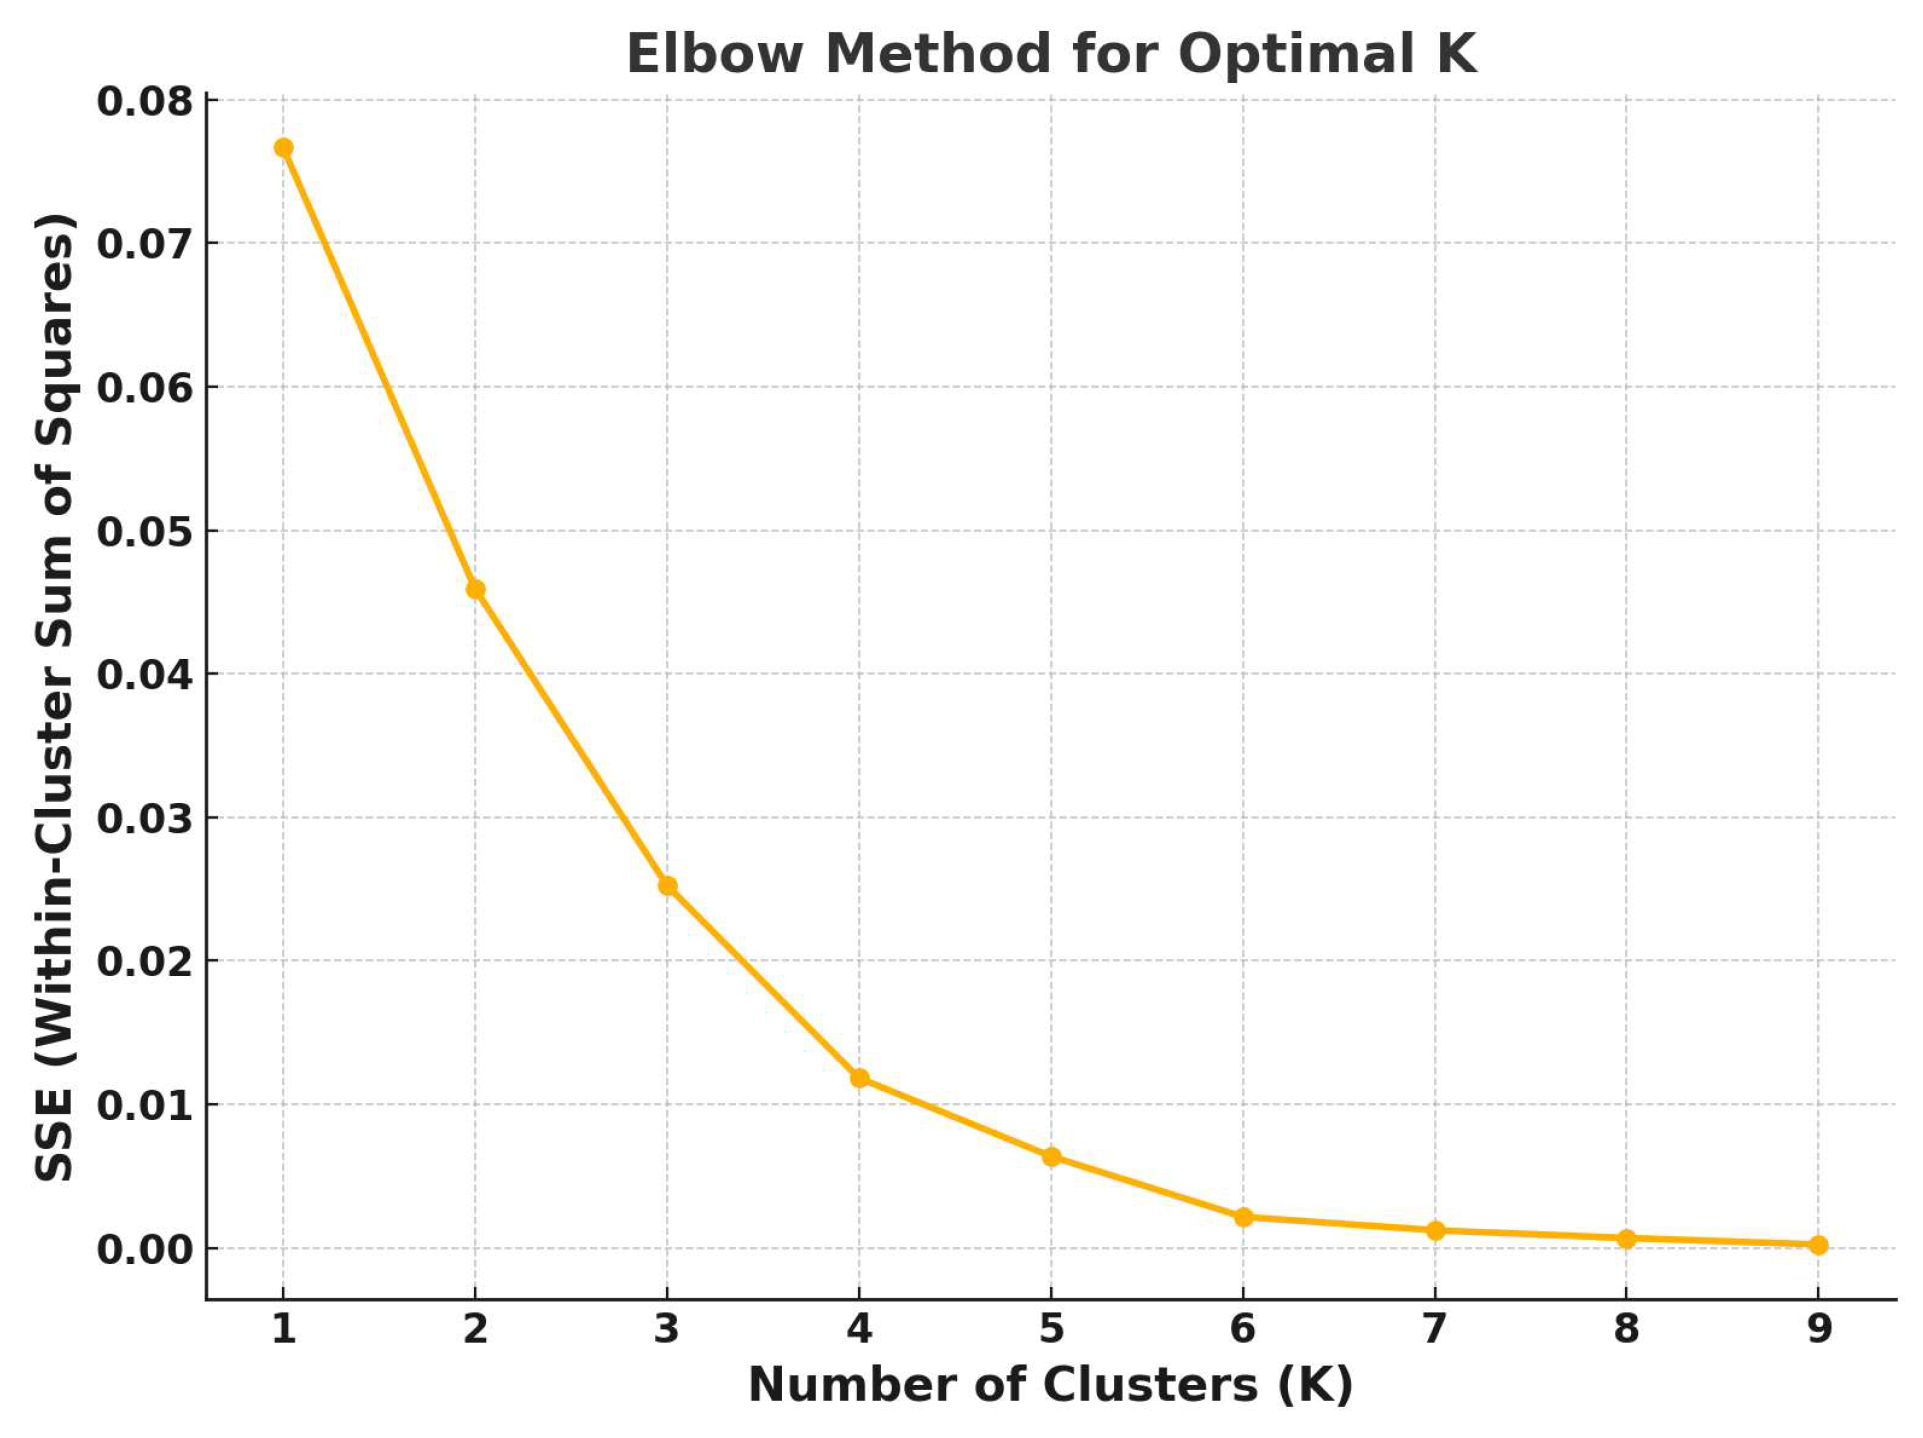

Table 1.
User experience test results.
| User ID | Avg Task Time Before (s) | Avg Task Time After (s) | Satisfaction Score Before | Satisfaction Score After |
| User 1 | 38.9 | 32.5 | 67 | 83 |
| User 2 | 50 | 42.5 | 63 | 82 |
| User 3 | 38.4 | 32.1 | 71 | 89 |
| User 4 | 44.1 | 36.8 | 60 | 72 |
| User 5 | 37.9 | 30.2 | 74 | 89 |
| User 6 | 43.6 | 35.7 | 71 | 90 |
| User 7 | 44.6 | 35.7 | 72 | 83 |
| User 8 | 39.2 | 31.9 | 65 | 77 |
| User 9 | 43.6 | 36.2 | 74 | 89 |
| User 10 | 43.5 | 35.8 | 64 | 76 |
Table 2.
System Performance Evaluation Data Sheet.
| Metric | Before Optimization | After Optimization |
| Page Load Time (ms) | 850 | 690 |
| Interface Latency (ms) | 120 | 88 |
| CPU Usage (%) | 38.5 | 33.4 |
| Memory Usage (MB) | 184.2 | 173.8 |
Disclaimer/Publisher’s Note: The statements, opinions and data contained in all publications are solely those of the individual author(s) and contributor(s) and not of MDPI and/or the editor(s). MDPI and/or the editor(s) disclaim responsibility for any injury to people or property resulting from any ideas, methods, instructions or products referred to in the content. |
© 2025 by the authors. Licensee MDPI, Basel, Switzerland. This article is an open access article distributed under the terms and conditions of the Creative Commons Attribution (CC BY) license (http://creativecommons.org/licenses/by/4.0/).
Copyright: This open access article is published under a Creative Commons CC BY 4.0 license, which permit the free download, distribution, and reuse, provided that the author and preprint are cited in any reuse.


