
Submitted:
09 January 2025
Posted:
10 January 2025
You are already at the latest version
Abstract
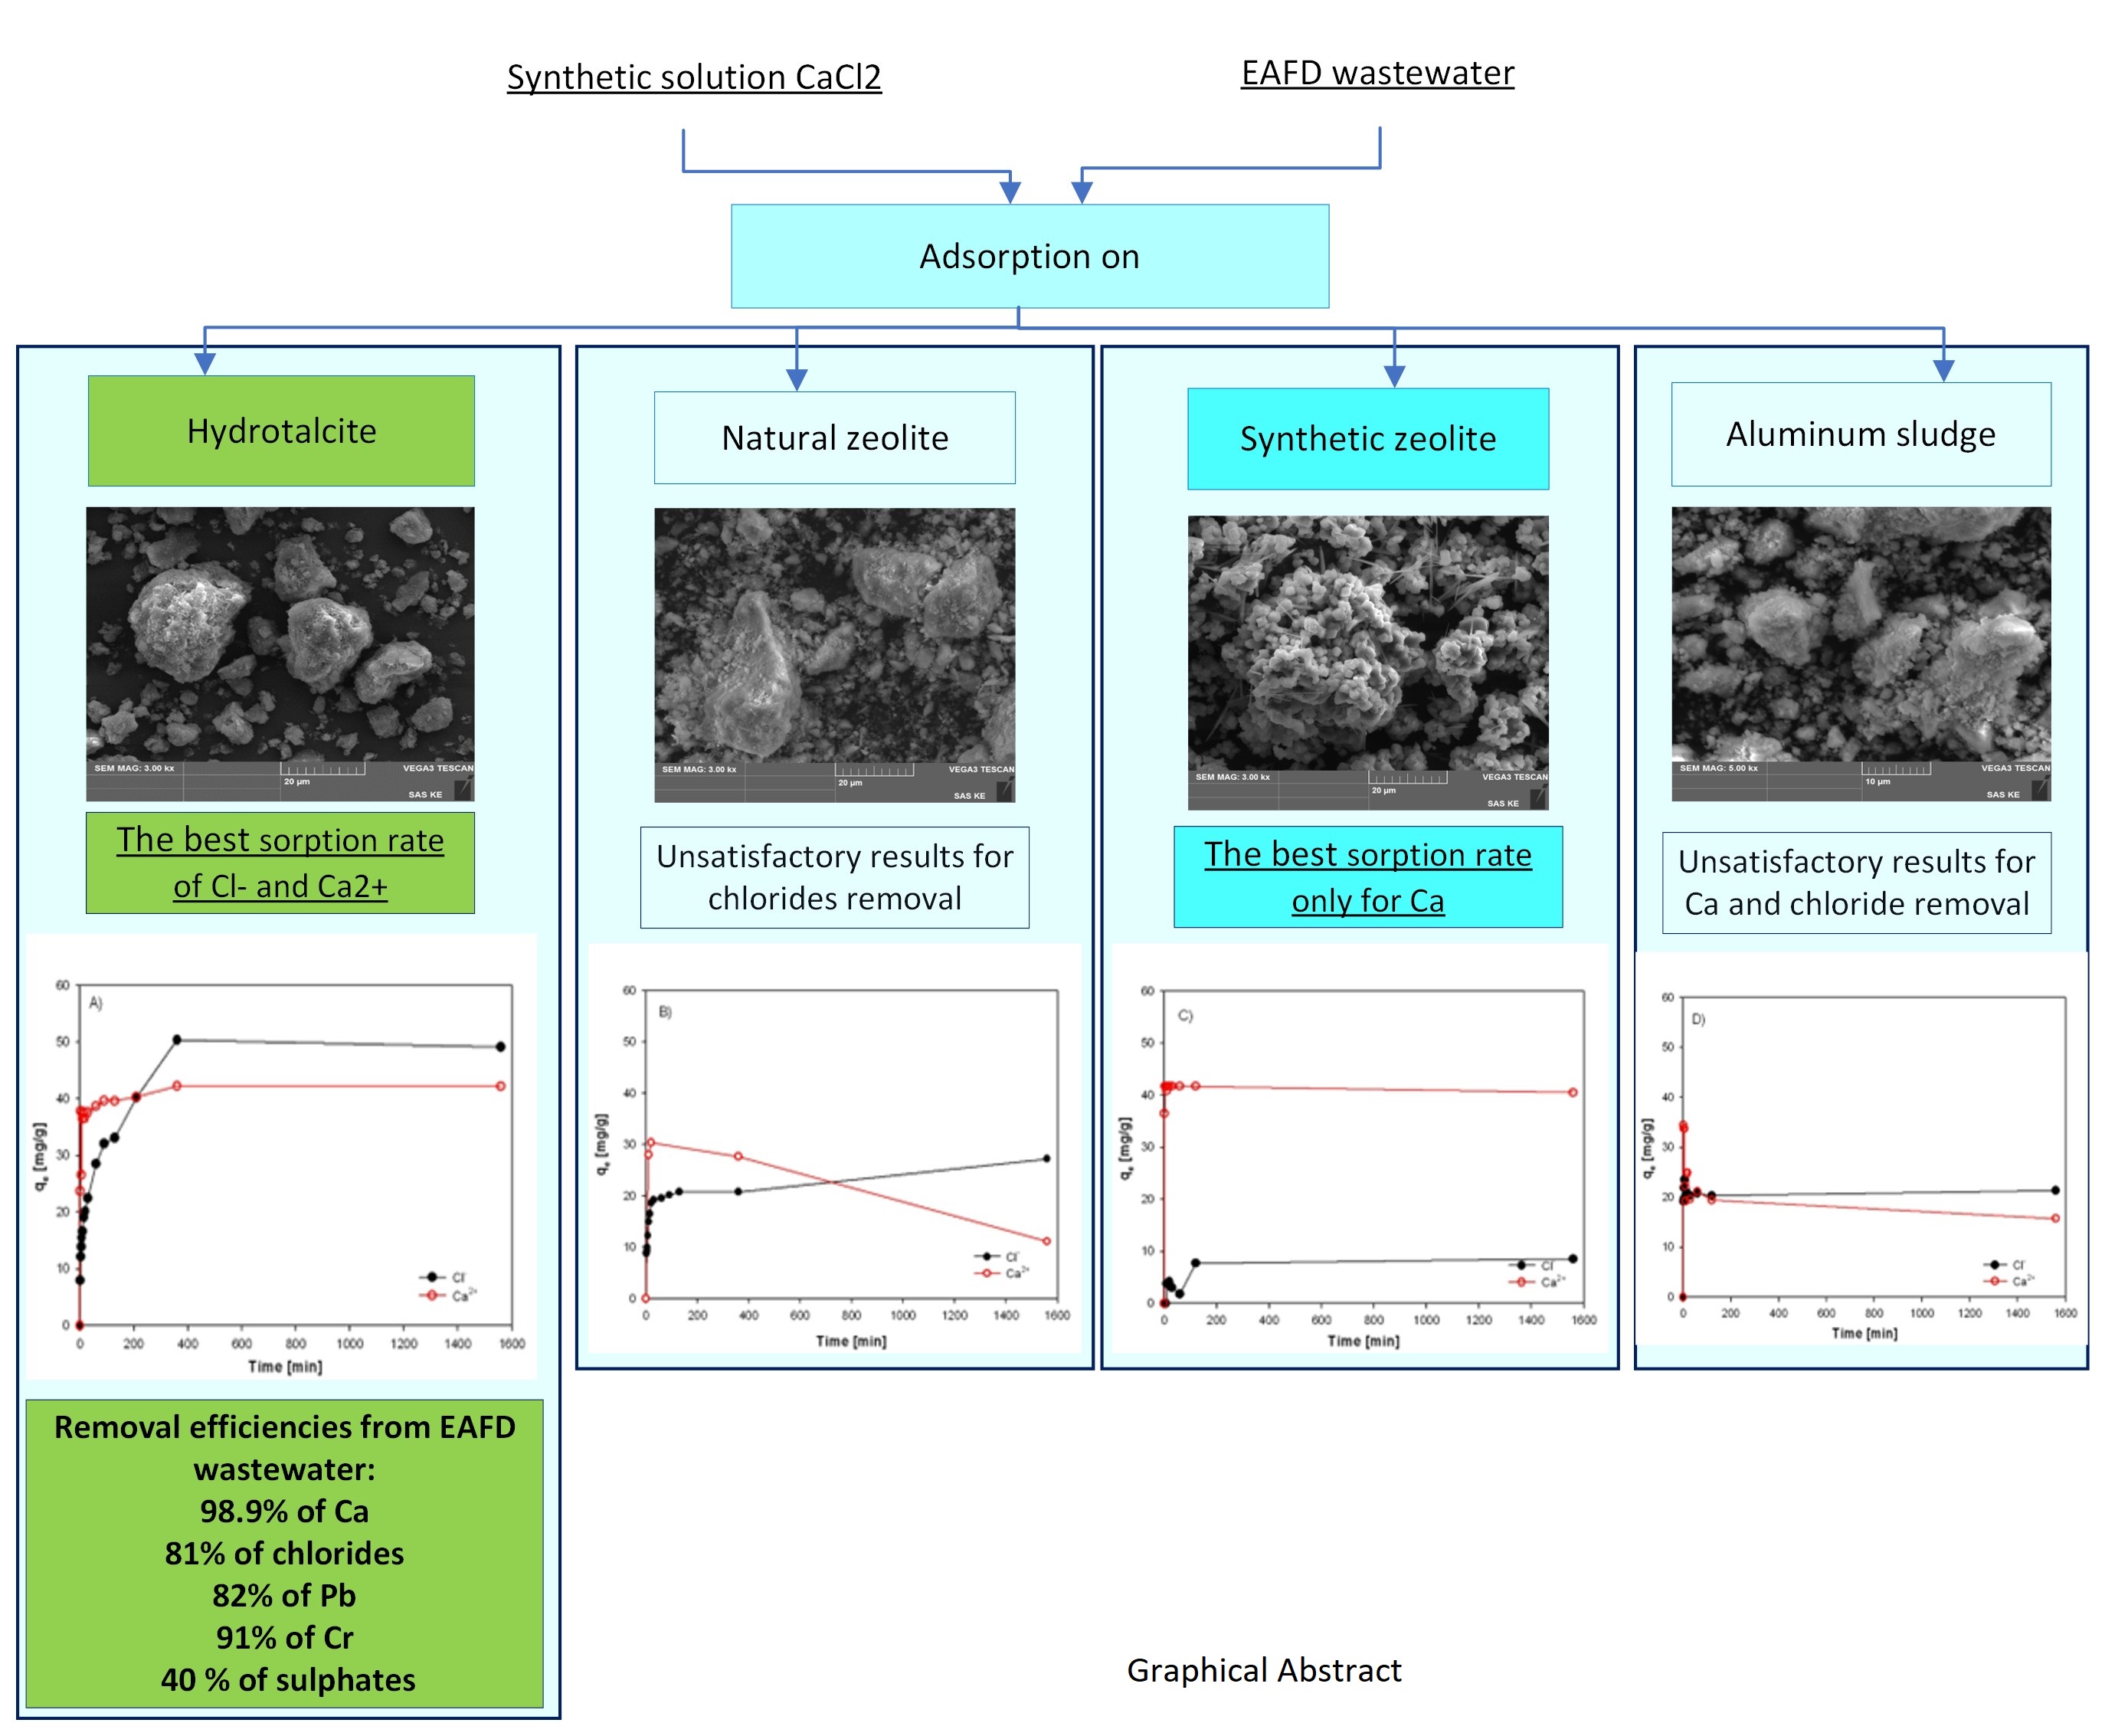
This work is focused on the investigation of sorption efficiencies and capacities of different adsorbents (synthesized Hydrotalcite, natural zeolite Clinoptilolite, synthetic zeolite and waste sludge from Al anodic oxidation) for simultaneous Cl- and Ca2+ removal from a synthetic solution (CaCl2) as well as from real wastewater (from EAFD recycling) for sustainable industrial wastewater purification process. The initial samples of adsorbents, as well as after the calcination and sorption process, were characterized, and it was described their chemical and phase composition (by AAS and XRD), surface area (BET analysis), porosity (BJH method) and molecule structure (FTIR). The highest efficiency (~100%) for Ca2+ removal from the synthetic solution as well as from real wastewater showed the synthetic zeolite. However, calcined Hydrotalcite at 500°C (HT-b) appeared to be the most efficient adsorbent for the simultaneous removal of Cl- and Ca2+. In this case, the maximum sorption capacity for Cl- (50.3 mg/g) and Ca2+ (42.2 mg/g) from EAFD wastewater were obtained after 360 minutes and the highest sorption efficiencies were achieved 98.9% for Ca2+ and 81% for Cl- after 24 hours. At the same time, 82% of Pb, 91% of Cr and 40 % of SO42 were removed from wastewater by HT-b.
Keywords:
Water purification
; EAFD Wastewater Treatment
; Adsorption
; Chloride
; Calcium
; Sustainable Adsorbent
; Hydrotalcite
; Clinoptilolite
; Zeolite A
; Alumina sludge
 |
1. Introduction
Globally, more than 1.5 Mt of crude steel are produced each year [1]. Steel production is closely related to the generating significant amounts of electric arc furnace dust (EAFD). Steel mills are facing the demand of decarbonisation, and together with this activity, there is the necessity to reduce the carbon footprint by decreasing generated amounts of waste or recycling and closing the processing loop appropriately. This should be applied also to EAFD. EAFD can be recycled by pyrometallurgical processes to recover metals or by hydrometallurgical processes. Hydrometallurgical methods involve leaching in water, acids, bases or salts; in this case, it is also eligible to consider the regeneration/recycling of this wastewater. Steel plants or waste recycling companies would require improved, highly effective, fast water treatment technology. Legacy treatment modes cannot thoroughly remediate water for reclamation, but new techniques show great promise [2]. One major problem that steel and recycling companies face is how to reduce salts from process water and increase the reusing of process water, which reduces freshwater costs and wastewater discharge costs [3]. Except for heavy metals, the problematic issues are organic matter, calcium, chlorides and sulphates. For instance, calcium causes severe scaling in the pipes, chlorides cause metal framework corrosion and sulphates cause problems with fouling, which increase the operation cost when membrane technologies are applied.
Desalinisation process is associated with a high demand for energy to crystallise the solid salt out of wastewater and brines. Furthermore, salts of poor quality, as a by-product of desalinisation need to be landfilled at a very high cost. If the source of water is freshwater, it is becoming more common to introduce “zero discharge” policies for industrial plants. The purpose is to reduce freshwater usage by encouraging water recirculation [4]. Before hydrometallurgical treatment, the EAFD is usually subjected to water washing due to decreased acid/base consumption and contamination by various dissolved ionic substances in the next leaching step. This wastewater often contains chlorides, sulphates, carbonates, heavy metals, calcium, silicon, phosphor, organic matter, etc.
There are multiple methods for water desalination, but some are very expensive, and others require high energy. Membrane technologies (reverse osmosis, electrodialysis, microfiltration, nanofiltration, etc.) can be particularly prone to scale formation and fouling, and regular membrane cleaning is required [5,6]. In addition, water pretreatment, such as coagulation, sedimentation, and sand filtration, is sometimes needed [3,7,8,9]. Another option for water desalination is ion exchange. Various ion exchange resins can successfully remove chlorides from synthetic solutions [10,11,12]. Ion exchange is considered one of the best and most effective methods for removing anions from water due to its high efficiency, simplicity and low cost [13]. Also, cation exchange resins were successfully applied to remove calcium and magnesium [14]. The effective removal of chlorides and sulphates was achieved by adsorption with solid waste, namely iron sand and pulp-and-paper waste from alkaline mining process water. The iron sand removal efficiency for Cl- ions was assigned mainly to the high porosity of sorption material and the small ion diameter of chloride [13]. The calcium could be successfully removed from a solution by natural zeolites, which have been widely used as adsorbents in separation and purification processes in the past decades [15,16].
A promising method for removing pollutants from industrial wastewater is sorption. Several experimental studies have been performed on the simultaneous removal of chlorides and calcium from synthetic solutions by sorption [17,18]. However, there are no studies on the possibility of simultaneous removal of chlorides and calcium by sorption from industrial wastewater. Industrial wastewater contains various pollutants (heavy metals, salts, organic matter), which could affect the sorption efficiency of sorbents [19]. Therefore, interactions between cations and anions must be considered during industrial wastewater sorption studies. This research was a holistic approach to removing chloride and calcium from industrial wastewater from the water washing of EAFD from steel production.
In order to compare the sorption behaviour of four different sorbents, a synthetic solution and real wastewater (EAFD wastewater) were used. The sorbents from different sources (laboratory synthetized Hydrotalcite, natural zeolite - Clinoptilolite, laboratory synthetized zeolite from waste, and waste Alumina sludge) were characterized. Then it was investigated the sorption capacity of the sorbents and the efficiency of the removal of Cl- and Ca2+ ions in the absence and presence of other ions. The aim of the study was to determine and select a prospective sorbent which is most effective and sustainable in the simultaneous removal of chlorides and calcium from industrial wastewater (alkaline).
2. Experimental Procedures
2.1. Sorption Materials
Four various types of adsorption materials were tested. Two solid materials were prepared for this study in the laboratory: hydrotalcite (HT) and synthetic zeolite (SZ). The other used sorption materials were the waste product, sludge from anodic oxidation of aluminum (KA) which was provided by a Slovakian aluminum finished product producer, and natural zeolite Clinoptilolite (ZC) obtained from Zeocem, Bystré, a.s. (Slovakia).
2.1.1. Preparation of Hydrotalcite
Hydrotalcite (LDH - layered-double-hydroxide) was synthesized hydrothermally by a co-precipitation method from sulphate salts, as described elsewhere [20].
MgSO4.7H2O (208.5 g) and Al2(SO4)3.18 H20 (33.3 g) were dissolved together in deionized water (500 ml). The obtained sulphate solution was continually dropped under vigorously stirred conditions into 1M Na2CO3 (200 ml) tempered to 40°C. Simultaneously, 2M NaOH (total volume of 600 ml) was added to the suspension to maintain the pH value at 10. After the synthesis, the temperature of the mixture was increased up to the range of 70-75°C. Subsequently, the mixture was kept crystallized for 12 hours in the hydrothermal bath under the stirring conditions and then for the next 12 hours placed in the oven at 70°C without stirring for further ageing of crystals. The obtained precipitate was washed ten times with 4000 ml deionized water and dried in the oven at 105°C for 12 hours. The dried precursor (HT-a) sample was calcined for 2 hours at 500°C. The calcined product (HT-b) of Mg-Al oxide was stored in a glass bottle or subsequent use.
2.1.2. Preparation of Natural Zeolite Clinoptilolite
Clinoptilolite, the Slovakian natural mineral obtained from deposit Nižný Hrabovec (Zeocem Bystré, a.s., Slovakia), has been milled in a vibration disc mill to powder and washed with deionized water to remove soluble matters. Before usage for sorption tests, the zeolite sample was dried at 105°C for 24 hours and calcined at 500°C, for 2 hours. Calcined Clinoptilolite (ZC-b) was stored in a glass bottle.
2.1.3. Preparation of Synthetic Zeolite
Sulphate waste liquor (167 ml) obtained from anodic oxidation of aluminum (hazardous waste) with known Al content (29.835 g Al3+/l) was mixed with 0.6M NaOH (400 ml). The mixture was heated at 80°C for 4 hours under stirring in a beaker where the sodium silica glass with a total volume of 121 ml was discontinuously added. During the synthesis, the product was crystallized, then filtered, washed with deionized water, and dried at 105 °C, for 3 hours. The dried product (SZ-a) was stored.
2.1.4. Preparation of Sludge
Alumina sludge (non-hazardous waste) obtained from the aluminum profiles surface finishing (after anodic oxidation and waste solutions neutralization) was ground to powder, and calcined at 500°C, for 2 hours in the electrical resistance oven, and used as an adsorbent (KA-b).
2.2. Preparation of Synthetic and Real Wastewater
The synthetic solution with the content of Cl- and Ca2+ ions was prepared by diluting anhydrous calcium chloride (Merck) in deionised water. The synthetic solution of CaCl2 contained 2530 mg/l of Cl and 1307 mg/l of Ca.
Industrial wastewater was obtained by washing EAFD with deionised water for 30 minutes at room temperature. The ratio of deionised water and EAFD during washing was 10. The partial composition of EAFD wastewater is shown in Table 1.
2.3. Adsorption Test
Batch sorption experiments using the synthetic solution and EAFD wastewater were provided. The sorption rate of Cl- and Ca2+ ions removal from industrial water was tested for 24 hours. 100 ml of CaCl2 solution and EAFD wastewater were placed into beakers where 3g of tested sorption materials were added. The beakers were shaken for 24 hours to reach sorption equilibrium. After reaching equilibrium in the solution, samples were filtrated.
The solutions before and after sorption were analysed for concentrations of Cl- and Ca2+ ions. Also, the initial and final pH values of the solutions were recorded. The remaining solids were stored for characterisation by XRD (X-Ray powder diffraction phase analysis) and FTIR (Fourier Transformation Infrared spectroscopy) and for selected adsorbents also by LIBS (Laser Induced Breakdown Spectroscopy) and SEM-EDS (Scanning electron microscopy with Energy Dispersive Spectrometry) analysis. The sorption efficiency, η[%] and sorption capacities, qe [mg/g] of Cl- and Ca2+ were obtained by equations (1) and (2), respectively:
where C0 (mg/l) and Ce (mg/l) are initial and equilibrium ion concentrations, respectively; V (l) is the initial volume of solution, and m (g) is the mass of adsorption material.
The sorption rate of sorbents was tested in EAFD wastewater. The sample of sorption material was dispersed in 100 ml of wastewater, and the mixture was stirred for 24 hours. Individual samples were collected and filtered at chosen time intervals. The samples were analysed for calcium and chloride contents, and sorption capacities at various sorption times were calculated by using the equation (3):
where qt (mg/l) is the uptake capacity of ions by an adsorbent at time t; C0 (mg/l) and Ct (mg/l) are initial ion concentration and ion concentration at time t, and V (l) is the volume of solution, and m (g) is the mass of adsorption material.
2.4. Analytical Methods
The chemical composition of solid and liquid samples was determined by Atomic absorption spectrometry (AAS, Varian Spectrophotometer AA20+). The weight 0.2 g sorbent sample was dissolved in 100 ml of concentrated HCl, and the main elements were analysed in each sorbent. AAS analysis was also used for measuring calcium, lead, chromium, potassium, and sodium in solutions. Chlorides in liquid samples were analysed using the Argentometric titration method. Each sample was titrated three times, and the average value was used for evaluation. Sulphates were determined by spectrophotometry (HACH DR/2000 Direct Reading). The LIBS analysis using optical microscope Keyence VHX 970F with LIBS analyser EA-300 was chosen mainly for elements monitoring within the input sorbent and as a complementary dry analytical method to the standard wet chemical method used in this study. Moreover, it serves also for a comparison of the composition of selected sorbents before and after sorption.
The phases presented in precursors and calcined sorbents before and after adsorption were analysed by X-Ray Diffraction (XRD) using a PANalytical X'Pert PRO MRD powder diffractometer using Co Kα radiation. The XRD data were evaluated using software X'Pert Pro. The morphology observation of input sorbents before sorption was performed by using a scanning electron microscope (SEM) Tescan Vega3 and EDS analysis (with detector Bruker) was used for chemical composition analysis of selected sorbents after sorption. Infrared spectroscopy measurements of sorbents were recorded with a Nicolet Avatar 330 spectrometer. Spectra were collected in the middle infrared region (4000 – 400 cm-1) averaging 32 scans with 4 cm-1 resolution. Samples were obtained using the attenuated total reflection (ATR-FTIR) method. The specific surface areas of adsorbents were determined by the N2 adsorption/desorption method (calculated using the BET equation) with a NOVA 2200e gas adsorption system at 77.3 K (Quantachrome Instruments, USA). The pore volume and diameter of pores were calculated by the Barrett, Joyner, and Halenda (BJH) method.
Chemical and phase analyses were provided for each sorbent to better understand the sorption behaviour of chlorides and calcium on different sorbent materials. The changes in infrared spectra give us insight into what bonds in the structure of materials could be responsible for the sorption of Cl- and Ca2+ ions from solutions.
3. Results and Discussion
3.1. Characterization of Sorption Materials
3.1.1. Chemical Composition, Surface Area, Pore Size Distribution and Morphology
Table 2 provides an overview of the elemental chemical composition of sorption materials used for removing Ca2+ and Cl- ions from CaCl2 solution and EAFD wastewater.
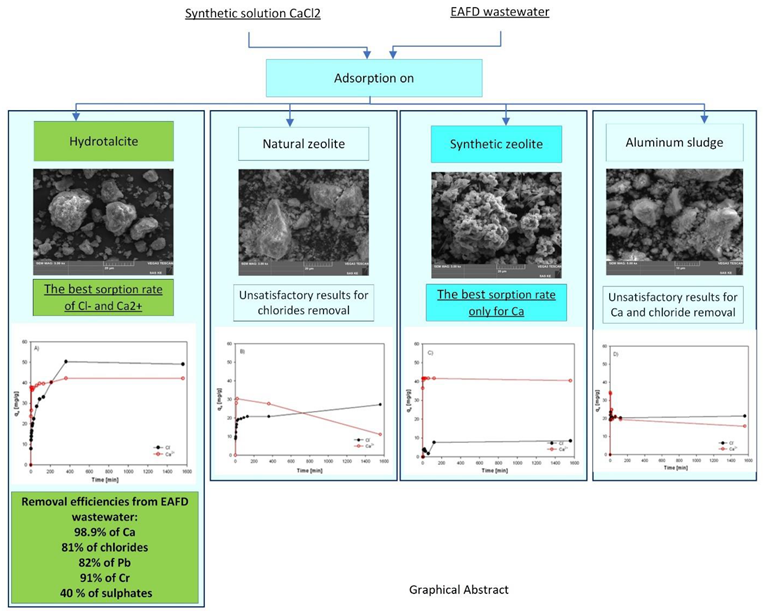
The specific surface area was determined using the adsorption/desorption method, and the BHJ model was used to calculate pore volume and diameter. The purpose of these analyses was to better understand of the their porosity. Figure 1 presents the results of analyses of sorption materials on pore size distributions, N2 adsorption and desorption isotherms, and BHJ models of pore size distributions of sorbents.
A hysteresis loop with a specific shape can be observed in three samples (HT-b, ZC-b, and KA-b). The results indicate that the N2 adsorption isotherms belong to Type II and III according to the Brunauer, Deming, Deming and Teller classification, which indicates multilayer adsorbption [21].
According to IUPAC isotherms and hysteresis loop classification, the adsorption-desorption curves of HT-b, ZC-b, and KA-b exhibit an inverse “S” shape, which is similar to those of IV and V and represents type H3 loop [21]. This means that types IV and V belong to mesoporous adsorbents with strong and weak affinities, respectively. Therefore, adsorbents appear to have a large sheet grain matrices, and there are three main types of pore geometry: plates, sheet cracks, and mixed-pores. SZ-a, on the contrary, showed an adsorption-desorption isotherm typical of a uniform, non-porous surface material. Because glassy materials are almost amorphous, this is understandable. According to its chemical analysis, SZ-a contains the highest percentage of Si (34%) in all sorbents.
Based on de Boer’s analysis of the desorption isotherms, Figure 1 illustrates the pore size distribution of samples, showing which pore sizes contribute to the total pore volume. All materials have pore sizes in the mesoporous range (2–50 nm).
The specific surface areas (SSA) of all tested sorption materials was determined from N2 adsorption and desorption data based on the BET analysis. This test aimed to measure the SSA of used sorbents, pore volume and diameter. Textural parameters of used sorbents are listed in Table 3.
The sample KA-b exhibits the highest SSA (118.89 m2/g), probably as a result of mild calcination conditions of hydrated alumina sludge and break-up of the particles and pore evolution during releasing of chemically bound water. The sample KA-b has a 2.5 times higher SSA than HT-b (48.532 m2/g) but a similar pore volume (0.2 cm3/g). The second-largest surface exhibits a sample of SZ-a, with an area of 78.267 m2/g and the lowest pore volume, which corresponds to BHJ analysis (Figure 1c) and confirms that SZ-a exhibits non-porous particles of small size (~ nm). The reason for the low surface area at ZC-b (27.060 m2/g) and HT-b is probably that sorbents have larger particle size (aggregates) compared to KA-b and SZ-a (see also the SEM morphology pictures in Figure 2a) and Figure 3a).
SEM analysis of HT-b (Figure 2) showed a wide particle size distribution with the occurrence of particle aggregates mostly of rounded shape with visible layered structure, with a size above ~25 µm. SEM-EDS as well as LIBS analysis confirm the presence of main elements Mg-O-Al (with higher quantities), but SEM-EDS also pointed out minor impurities based on Na, K, Fe, S and Si. LIBS analysis also identified some water bound with Mg-O and Mg-O-Al in HT-b sample, what indicates the quick adsorption of water from humid air even after calcination and the ability of both compounds to adsorb water.
SEM picture of ZC-b (Figure 3) shows mostly irregular prolonged particles with smooth or sharp edges with a size distribution similar to that of HT-b sample. LIBS analysis confirms the presence of compounds based on Si-Al-O-Na-K, Si-O, Si-Al-O-K and indicated also occurrence of Fe and Ti.
SZ-a sorbent (Figure 4) exhibits a 3D net morphology structure consisting of individual 2D particles of square/cubic shape (~1 µm), which form bigger clusters (around 40 µm) which are interconnected within the 3D aggregate net (Figure 4 a). LIBS confirm the presence of main elements incorporated in the specific zeolite structure, Al-Si-Na-O. Moreover, in SZ-a sample some whiskers are visible, which could be realted to the crystallization of sodium or sodium silica compounds (from residual solvents) as revealed by SEM-EDS and LIBS results.
SEM picture of KA-b sorbent (Figure 5) shows irregular shapes of particles bound in layer-like aggregates around the size of approximately 10 µm. LIBS analysis confirms that sorbent KA-b predominantly contains Al-O or Al-O-H phases.
3.1.2. Mineralogical Composition of Sorption Materials
Hydrotalcite
XRD patterns of samples of Hydrotalcite HT-a and HT-b are shown in Figure 6. In sample HT-a, phase Mg6Al2(OH)16CO3.4H2O (JCPDS 00-041-01428) was identified. The additional diffraction lines appear in sample HT-a, which may be attributed to the presence of Nordstrandite Al(OH)3 (JCPDS 01-085-1049), Brucite Mg(OH)2 (JCPDS 00-001-1169) and Na9(Al(OH)6)2(OH)3.(H2O)6 (JCPDS 01-086-1306) due to the residual concentration of Al and Mg in the initial Mg-Al solution after HT formation. In the calcined HT-b sample, Periclase MgO (JCPDS 00-001-1235), Spinel MgAl2O4 (JCPDS 96-500-0121), Corundum Al2O3 (JCPDS 01-089-3072) and sodium sulphate Na2SO4 (JCPDS 01-083-1570) were identified.
Natural Zeolite Clinoptilolite
ZC is composed of a three-dimensional grid that consists of silicate tetrahedrites (SiO4)4- that are connected by oxygen atoms, with a few silicon atoms being substituted for aluminum (AlO4)5- [22]. Clinoptilolite becomes stable over the temperature 450°C because all bounded water is removed from Clinoptilolite [23]. Therefore, Clinoptilolite was calcined at 500°C before being used as an adsorbent. A fine powder with an average particle diameter of 32.8 μm (measured by analyzer Mastersizer 3000, Malvern Instruments, Ltd.) was used in the present study and has a molar ratio of Si/Al of 6.62. The main mineralogical phases detected (XRD pattern, Figure 7) in raw zeolite ZC-a were Clinoptilolite-Na (JCPDS file 96-900-1395), Cristobalite SiO2 (JCPDS file 00-039-1425), Albite Na(AlSi308) (JCPDS file 00-020-0572), Anorthite CaAl2Si2O8 (JCPDS file 00-041-1486), Muscovite-3T (K,Na)(Al,Mg,Fe)2 (Si3.1Al0.9)O10(OH)2 (JCPDS file 00-007-0042), Orthoclase KAlSi3O8 (JCPDS file 00-031-0966), Quartz SiO2 (JCPDS file 00-046-1045), Magadiite NaSi7O13(OH)3.3H2O (JCPDS file 00-020-1156). The ZC-a sample also contains titanium impurity (confirmed by LIBS analysis), which could be in the form of rutile. The XRD pattern of calcined zeolite ZC-b does not show significant phase changes in comparison to ZC-a.
Synthetic Zeolite
The XRD pattern of synthetic zeolite SZ-a is shown in Figure 8. The main mineralogical phases observed from the XRD pattern of sample SZ-a are Zeolite A, sodium (LTA) Na12Al12Si12O48)NaAlO2(H2O)29 (JCPDS 01-089-3859) with the possible presence of hydrated sodium carbonate Na2CO3.H2O (JCPDS 01-070-2148 ). The characterization of this zeolite type was described in detail in the study [24].
Alumina Sludge
From the XRD pattern of sorbent KA-a in Figure 9, it was apparent that KA-a is mostly amorphous, but it may indicate the presence of phases such as Bayerite Al(OH)3 (JCPDS 00-012-0457), Boehmite AlO(OH) (JCPDS 01-088-2112) and Brucite Mg(OH)2 (JCPDS 00-044-1482). Mg presence in KA-a was confirmed by SEM-EDS. Possibly there could be phases based on sodium and aluminum sulphates like Felsobanyaite Al4(SO4)(OH)10(H2O)4 (JCPDS 01-088-0765) and Mirabilite Na2SO4.10H2O (JCPDS 00-001-0207), as sulphur and sodium are expected impurities from the neutralization step during sludge formation.
The calcination of the sample caused a change in phase composition. The non-stable polymorph of the d-alumina phase (JCPDS 00-047-1770) was formed, and another possible candidate is Quintinite-2H Al2Mg4(OH)12(CO3)(H2O)3 (JCPDS 01-087-1138). This phase could form from the Al and Mg phases present in the sorbent KA-b during calcination. The phase Quintinite-2H has a similar structure to Hydrotalcite, but the amorphous nature of the sample does not allow for a more precise phase analysis. Mg impurities in the sludge and KA-b sample are due to the dissolution of Mg as an alloying element during anodic oxidation of Al alloy profiles, followed by precipitation with aluminium. SEM-EDS analysis confirms the presence of Mg and some other impurities in KA-b, such as Si, S, and Fe, representing standard contaminants in a sludge.
3.2. Results of Chlorides and Calcium Adsorption from Synthetic Solution and EAFD Wastewater
Experiments investigated the behavior of four different sorbents during the sorption of chlorides and calcium from synthetic solutions and EAFD wastewater. Synthetic solutions of CaCl2 contained 2530 mg/l of Cl- and 1307 mg/l of Ca. The initial Cl- and Ca concentrations in EAFD wastewater were 1995 and 1084 mg/l, respectively.
After 24 hours of the sorption process, concentrations before and after sorption were converted to adsorption capacities and compared. The comparison of adsorption capacities within 24 hours for chlorides and calcium removal from synthetic solutions and real wastewater using a volume of 100 ml of solution and a concentration of adsorbent (Cs) 30g/l is shown in Figure 10.
Comparing the sorption capacities of chlorides achieved by four tested sorption materials, depicted in Figure 10a), implies that the most suitable sorbent for removal of Cl- is Hydrotalcite (HT-b). The adsorption capacities of HT-b in CaCl2 solution and EAFD wastewater were 41.6 and 38.6 mg Cl-/g, respectively. A different behaviour was noticed by using other tested sorbents where the sorption of chlorides was less effective from EAFD wastewater. In equilibrium, the sorption capacities were 28.2 and 29.2 mg Cl-/g using ZC-b and KA-b, respectively. On the contrary, SZ-a reached an adsorption capacity of only 7.4 mg Cl-/g. With sorbents, ZC-b, SZ-a and KA-b have achieved 0 mg/g Cl-removal from the synthetic solution of CaCl2, which is represented in Figure 10a).
The efficiency of calcium removal (Figure 10b) from both solutions using SZ-a adsorbent was around 100%, and it represents adsorption capacities from synthetic solution 43.55 mg Ca2+/g and 36 mg Ca2+/g from wastewater. Sorption capacity for HT-b was 21.5 and 15.6 mg Ca2+/g to remove Ca2+ ions from synthetic solution and EAFD wastewater, respectively. ZC-b and KA-b reached poor adsorption capacity in the synthetic solution. Whilst there are no differences in reaching equilibrium sorption capacity between KA-b (around 7 mg Ca2+/g) in both solutions, the qe reached in synthetic solution (5 mg Ca2+/g) by using ZC-b was much lower than that in EAFD wastewater (26.2 mg Ca2+/g).
The behaviour of pH values of solutions during sorption varies. Table 4 shows the solution's final pH after sorption of synthetic and real wastewater. In the beginning, the pH value of the synthetic solution was equal to 6.9. The rapid pH decrease to 4.41 was determined after 24 hours of sorption with KA-b. We can attribute this to sulphates released into the solution from KA-b during sorption. The previous experiment in another study of authors showed that 1.7 % sulphates and 1% aluminum ions are released into the solution of synthetic CaCl2 after 24 hours of contact with sorbent KA-b.
3.3. Evaluation of Sorption Results
After sorption, the resulting sorption materials were subjected to further analyses to obtain FTIR records and X-ray diffraction patterns of sorbents. The changes in FTIR and XRD records before and after sorption in synthetic solution and EAFD wastewater were analysed to better understand the sorption behaviour of different sorbents.
3.3.1. Characterization of Adsorbents after Sorption
Hydrotalcite
After the sorption from the synthetic CaCl2 solution, it can be seen from XRD patterns of HT-c (Figure 11) together with HT-a, HT-b (Figure 6) that the calcined sorbent HT-b was rehydrated in the synthetic solution as well as in EAFD wastewater.
The Hydrotalcite phase Mg6Al2(OH)16CO3.4H2O (JCPDS 00-041-01428) was identified, but in XRD patterns it is visible some shift in individual peak position of Hydrotalcite phase in the sample HT-c in comparison to HT-a. By XRD pattern analysis using software (HighScore X-Pert) Hydrotalcite phase in HT-c sorbent exhibited an increased d006 basal spacing of the diffracting plane (006) from 7.86 to 8.15 Å. The increase of “d006” indicates accommodation of chlorides or other ions (Ca2+) in interlayers of the HT-c structure, and not only adsorption onto the surface of Hydrotalcite or other mineral phases contained in the sample HT-c. In addition, the XRD pattern of HT-c revealed some new phases containing chlorides as Mg2(OH)3Cl(H2O)4 (JCPDS 01-073-2119), Mg3Cl(OH)5.4H2O (JCPDS 00-007-0416) or Mg-Al chloride hydrate MgxAl (OH)2x+2Cl.zH2O (JCPDS 00-019-0748). This finding suggests the important role of magnesium species and the hydration process of HT sorbent in chloride interaction and final capture into the hydrated sorbent structure from wastewater. Ca2+ ions were removed by HT-b with high efficiency too, what was caused by the reaction of Ca2+ with carbonate anions present in the structure of the HT-c and intercalation of formed CaCO3 into the interlayer space of HT-c or eventually it is also possible precipitation from solution at the given conditions (pH). Residual sodium and sulphates together with aluminum present in HT-b and during sorption could probably also contribute and assist in the calcium removal by means of precipitation and forming the more stable solid phases like CaSO4(H2O)2 (JCPDS 01-072-0596) and Na3.2(CaSO4)2.6.1.5H2O (JCPDS 00-024-0927) or Ca4Al2O6(SO4).14.H2O, as indicated by XRD analysis. XRD pattern of HT-c further indicated phases Mg(OH)2 (JCPDS 00-044-1482), Norstrandite Al(OH)3 (JCPDS 00-024-0006), MgAl2(OH)8 (JCPDS 00-035-1274) which were formed by rehydration of phases MgO, MgAl2O4, Al2O3 present in calcined HT-b. Possibly, also non-reacted MgO could be present in HT-c as it was indicated by LIBS analysis.
LIBS analysis of HT-c showed the elemental composition based on Mg-O-Al-S-H-Cl elements (Figure 12) showing the ability of HT-b to adsorb chlorides together with the present residual sulphates which are probably coupled within the rehydrated HT-c phases. Moreover, the group of elements Mg-O-Ca-S-H-C was also observed as well as Mg-O-Ca-H, which indicates the probable affinity of Ca species towards hydrated Mg oxide phases of HT-c. In contrast to LIBS analysis results for HT-b (before sorption) even Ca-Mg-O elemental composition was found, which could signify the ability of active MgO phase to adsorb Ca even without water assistance. This deduction was also supported by the other LIBS point analysis, which found composition Mg-O-Ca-C, which could indicate Ca capturing into the Mg structure and carbonate formation, which XRD also confirmed. On the other hand, the compositions of individual particles within the HT-c without Al and with Ca also could mean that Ca is exchanged for Al in HT-c structure. Another interesting cognition was noticed that chlorides could be adsorbed not only by HT phase but also by Mg hydrated oxide phase. In addition, in both samples before and after sorption in the synthetic solution the hydrated and non-hydrated MgO phases could be present as it was indicated by LIBS analysis (Mg-O and Mg-O-H).
Mineralogical changes were investigated after sorption in EAFD wastewater from the XRD pattern of HT-d (Figure 11). Amongst phases of Mg(OH)2 and Al(OH)3 (similar to those observed in HT-c using the synthetic solution) also other new phases were identified like Stichtite Mg6Cr2CO3(OH)16·4H2O (JCPDS 00-045-1475), Ca4Al2Cr0,5O8Cl.12H2O (JCPDS 00-043-0088), Mg3Cl(OH)5.4H2O (JCPDS 00-007-0420), Na(Cr(SO4)2).12H2O (JCPDS 00-008-0039) and CaAl2((OH)8(H2O)2)(H2O)1.84 (JCPDS 01-088-1410) which suggest rehydration of calcined HT-b and at the same time readily binding of Cl-, Ca2+ and Cr3+ ions into the HT-d structure. The phase analysis shows that aluminum phases seem to have a higher affinity for calcium or chromium species. Calcium also formed CaCO3 phase similarly in the case of synthetic solution sorption, which suggests the presence of residual carbonate groups within the calcined HT-b. LIBS analysis and composition observation using different places of the sample of HT-d sorbent (Figure 13) indicated that chlorides are adsorbed in the composition O-S-Cl-C-Mg-H (for example, as Mg oxichloride-carbonate-sulphate-hydrate). The composition of O-C-S-Mg-H obtained by LIBS measurements of HT-d suggests the good affinity of sulphate to Mg hydrated phases of HT or absorption of sulphates into the layers of rehydrated Hydrotalcite phase. No Al and Ca were found in those compositions of HT-d, which means that the adsorption process in EAFD wastewater is not homogenous, and those elements are not evenly distributed in the bulk of the sorbent. However, Ca and other elements are present in HT-d and were confirmed by SEM-EDS analysis (Figure 15b).
From SEM morphology picture (Figure 14) it is visible that the surface of HT-c particles (evident from bigger aggregates) is covered by adsorbed individual particles/species. In Figure 14, the detail of HT-c particles after sorption from synthetic solution is shown, where a visible hydrated fluffy HT layered structure reminds clouds. This is due to rehydration of calcined HT-b (absorption of water and incorporation into the HT-c structure) and expansion of the material volume and interlayer and planar space. This is a difference between calcined HT-b not hydrated structure and HT-c after sorption from water solution. Figure 15a shows the SEM morphology of HT-d, and Figure 15b) shows the elemental composition map of selected areas of the sample HT-d.The morphology of HT-d (Figure 15a) is slightly different from HT-c. HT-d is characterized by a more chaotic arrangement of particles and rehydrated HT-d layers. Moreover, those layers do not look fluffy like HT-c and have a more distorted structure with a thin and solid appearance. SEM-EDS analysis of HT-d (Figure 15b) together with LIBS confirmed the presence and thus sorption of studied impurities Cr, Pb, Ca and Cl and furthermore Zn from real EAFD wastewater. Results also revealed the presence of other quite common impurities Si, Fe in HT-d and residual species Na and K coming from the preparation process of HT-b. From the SEM-EDS map picture, it is also evident that HT-d sorbent particles are practically completely covered by adsorbed elements, and Mg, Al, and O are hidden (the intensity of colour is diminished).
FTIR spectra of sample HT-a synthetised, HT-b calcined, HT-c after sorption from the synthetic solution and HT-d from EAFD wastewater are shown in Figure 16.
Comparing FTIR samples of Hydrotalcite before and after sorption showed that the sample HT-a reveals a very weak peak at 3694 cm-1, and it is attributed to cation hydroxyl stretching regions. This may be assigned to the cation OH stretching vibration of brucite [25], and it is increasing in intensity probably due to rebuilding the structure after calcination and sorption of Hydrotalcite. In the sample, HT-d was not observed changes in FTIR bands belonging to CO32- which may be affected preferences to adsorb cations in EAFD wastewater mainly Cr3+ which was detected in XRD scan as Mg6Cr2CO3(OH)16.4H2O phase.
The increased pH value in the CaCl2 solution from initial 6.87 to 11.77 after sorption is evidence of anion sorption (Table 4). Hydroxide ions in the HT interlayer were released into the bulk solution by the adsorption of other anions [26]. Conversely, the adsorption capacity of Hydrotalcite for Cl- from EAFD wastewater (HT-d) was lower than from the CaCl2 solution. This was probably due to the different pH of solutions (lower initial and higher final pH of the solution after sorption in HT-d). The high OH- concentration in the solution could prevent Cl- from combining with MgAl2O4, thereby hindering Cl- removal and supporting the sorption of Me2+ [18].
Natural Zeolite – Clinoptilolite
Diffraction peaks of zeolite after sorption in XRD patterns of the samples ZC-c (Figure 17) did not show substantial changes in the phase composition against ZC-b, which means the sorbent is relatively stable in the solution under given conditions. XRD patterns are similar in main detected phases to ZC-b {main phases: Clinoptilolite-Na (JCPDS 96-900-1395), Cristobalite SiO2 (JCPDS 00-039-1425), Albite Na(AlSi3O8) (JCPDS 00-020-0572), Anorthite CaAl2Si2O8 (JCPDS 00-041-1486), Muscovite-3T (K,Na)(Al,Mg,Fe)2(Si3.1Al0.9)O10(OH)2 (JCPDS 00-007-0042), Orthoclase KAlSi3O8 (JCPDS 00-031-0966), Quartz SiO2 (JCPDS 00-046-1045), Magadiite NaSi7O13(OH)3.3H2O (JCPDS 00-020-1156)}, but diffraction peaks are a little bit shifted which could be caused by partial adsorption of Ca and some structural disorder. Except for phases mentioned above, ZC-c, which also indicated the presence of possible phases based on Ca after sorption like Ca2Al4Si14O36.14H2O (JCPDS 00-025-0124) and Heulandite Ca3.6K0.8Al8.8Si27.4O72.26.1H2O (JCPDS 00-053-1176) and Ti in the form of Na4((TiO4)(SiO4)3).(H2O)6 (JCPDS 01-088-0703).
ZC-d has similar main diffraction peaks like ZC-b (associated to above mentioned main phases detected in ZC-c, Figure 17) and the new phases occurred based on hydrated calcium, chromium, lead, zinc, chlorides and sulphates like KCa4Si8O20(OH).8H2O (JCPDS 00-030-0920), Ti29O42Cl32.110H2O (JCPDS 00-021-1237), Cr2(SO4)3.17H2O (JCPDS 00-049-0999), Pb10(SO4)O7Cl4(H2O) (JCPDS 01-0070-3392) and K2Zn(H2O)6(SO4)2 (JCPDS 01-070-1827). These findings revealed that natural zeolite is suitable to adsorb except calcium and chlorides also mentioned heavy metals from wastewater.
FTIR spectra of Clinoptilolite ZC–b calcined, ZC-c after sorption from the synthetic solution, and ZC-d from real wastewater are shown in Figure 18.
The FTIR analyses confirmed at wavelength 594 cm-1 Heulandite phase while the existence of 594 cm-1 indicates the presence of “Heulandite type-II”. In CaCl2 solution, the sorption of Ca2+ was very low (11%) probably due to limited ability of present aluminum silicate phases (Ca3.6K0.8Al8.8Si27.4O72.26.1H2O) to adsorb or exchange ions at given conditions (low pH around 8 of synthetic solution). The sorption of Cl- was not recorded in the CaCl2 solution. Surprisingly, the sorption of Ca2+ and Cl- from EAFD wastewater increased to 72% and 43%, respectively. The parameters of the real wastewater solution (presence of more ions and different ionic strength, higher pH above 12) seem to be more convenient for both Ca and Cl ions removal. XRD analysis of ZC-d (Figure 17) indicated the occurrence of new phase KCa4Si8O20(OH).8H2O, which could be associated with calcium better adsorption (chemisorption). Chloride ions from EAFD wastewater are probably adsorbed onto the Clinoptilolite surface via titanium compound Ti29O42Cl32.110H2O, which was observed by XRD analysis in sample ZC-d (Figure 17). Although, in ZC-c titanium compound was detected, too, Ti was bound probably into a more stable silicate phase (Na4((TiO4)(SiO4)3).(H2O)6) which seems to be less active towards chloride ions.
From FTIR measurements (Figure 18), rehydration was not evident after sorption in the samples ZC-c and ZC-d. The bonds observed at band 1025 cm-1 are more intense, caused by O-Si (Al)-O-bond vibrations. Shifting of the characteristic ring band at 1055 cm-1 at raw Clinoptilolite to the lower wavenumber about 20 cm-1 at sample after calcination results in an increase in the number of ring members. The zeolite can be estimated on the basis of band shape changes in the region of 1055 cm-1. This O-Si/Al-O band is sensitive to the content of the framework silicon and aluminum, so it is also susceptible to the dealumination degree [27]. Due to the low pH value in CaCl2 solution (Table 4) some portion of Ca (~ 28%) was dissolved from zeolite ZC-b, and this caused the lower degree of Ca2+ (and Cl-) adsorption onto the zeolite surface.
Synthetic Zeolite
By XRD analysis of Zeolite A, sodian (LTA) after sorption from synthetic solution SZ-c and from EAFD wastewater SZ-d (Figure 19), except for the main zeolite phase also the new phase CaCO3 (JCPDS 01-083-0578) was detected. This was probably caused by Ca ion exchange with sodium from NaCO3.H2O phase which was identified in sorbent before sorption SZ-a. The concentration of Na in solutions was increased after sorption more than five times and the pH values were also raised above 12.00, which confirms the release of sodium ions into the solution. Ca sorption was almost 100% from both solutions via forming CaCO3 (Table 4).
The FTIR spectra of synthetic zeolite before and after sorption from synthetic solution SZ-c and EAFD wastewater SZ-d are illustrated in Figure 20.
The FTIR spectrum of synthetic zeolite A, sodian (LTA) indicates that the sample before sorption SZ-a contains a broadband OH group at 3243 cm-1. The intensity of the bands is attributed to bending vibrations of Al–OH at 1397 cm-1 in the raw SZ-a. The band at 952 cm-1 is associated with asymmetric stretching vibration T-O (T= Al, Si) in aluminosilicates. At lower wavenumbers positions are presented vibration assumed to ν O–Al/Si–O.
As it is evident from the FTIR spectra in Figure 20, the intensity of the peak of OH- groups is decreased after sorption in both of the solutions after sorption from synthetic CaCl2 and after sorption from EAFD wastewater. This could be attributed to the sorption of Ca2+ onto the hydroxyl groups presented in synthetic zeolite. The intensity of the bands suggested that the bending vibrations of Al–OH at 1397 cm-1 in the raw SZ-a decreased significantly in SZ-b and SZ-c because of the decomposition of the minerals after sorption [28]. The band at 952 cm-1 in a sample before sorption SZ-a associated with asymmetric stretching vibration T-O (T= Al, Si) in aluminosilicates with zeolite or sodalite structure is shifted upward after sorption from CaCl2 solution (sample SZ-c). It is connected with decreases in the content of tetrahedrally positioned Al atoms in the system [28,29]. This is in agreement with other literature where shift vibration ν O–Al/Si–O toward higher frequency is connected to the dissolution of Al and Si [27]. In addition, in the sample, SZ-d peaks at 952, 707 and 666 cm-1 were observed dissolution of zeolite structure due to the high value of pH solution (12.87).
Alumina Sludge
The sorption of Cl- efficiency in EAFD wastewater reached 45% at final pH of 7.78. During the sorption process, a decrease in pH from 6.87 to 4.41 (Table 4) was recorded in the synthetic solution, and it may be caused by dissolving mainly phases NaAl(SO4)2.12H2O, Al4(SO4)(OH)10.4H2O and Mg(OH)2 from KA (Figure 21).
The FTIR spectra of KA-b calcined, KA-c after sorption from synthetic solution and KA-d from EAFD wastewater are illustrated in Figure 22. The OH bands at the wavelength 3408 cm-1 of Mg(OH)2 and Al(OH)3 were not reconstructed after sorption in CaCl2 solution and EAFD wastewater. At the wavelength 1363 cm-1 at KA-a sample, a very intensive peak was observed, which is assumed to be CH or CH2 aliphatic bending group. It could be from degreasing agents in the anodic oxidation process of aluminum profiles. After sorption, FTIR results do not show evidence of this phase anymore in both samples, which is probably the signature of its dissolving into the wastewater. Also, the peak at wavelength 934 cm-1 at sample KA-d diminished after sorption, and it contributed to the Si-OH stretching bend. XRD analysis of KA-c and KA-d after sorption revealed the attained amorphous character and presence of phase d-alumina (JCPDS 00-047-1770) in the sorbents after sorption and disappearance of diffraction peaks associated with compound Quintinite-2H Al2Mg4(OH)12(CO3)(H2O)3 (JCPDS 01-087-1138). In KA-c and KA-d the probable new phases were identified as Na1.67Mg0.67Al10.33O17 (JCPDS 01-084-0214) and Mg0.4Al0.6Al1.8O4 (JCPDS 01-087-0340). In opposite, in KA-c appeared another quite well crystallized phase associated with Mg3(SO4)2(OH)2 (JCPDS 01-079-1189). In addition, in KA-d the phase Mg(OH)2 (JCPDS 01-082-2454) was indicated with some probability in contrary to KA-c. However, it is necessary to mention that the XRD phase analysis of KA sorbents is only indicative due to the amorphous character of samples (a nanometric particle size). That is why for example new Ca or Cl phases were not detected in KA sorbents after sorption.
3.4. Investigation of Sorption Rate of Individual Sorbents from EAFD Wastewater
Equilibrium time is an essential parameter for an economical wastewater treatment system. The time necessary to reach the maximum sorption capacity with HT-b, ZC-b, SZ-a, and KA-b for Ca2+ and Cl- ions was investigated by a sorption test using EAFD wastewater for 24 hours (Figure 23). The initial concentrations of Cl- and Ca2+ ions in wastewater were 1890.4 mg/l and 1266 mg/l, respectively.
Figure 23a) represents a comparison of the progress of the sorption capacity of Ca2+ and Cl- ions with HT-b. The sorption of calcium from wastewater is very fast. Within the first 10 minutes, it reached a sorption capacity of 37 mg Ca2+/l (the sorption efficiency is 85%). On the contrary, the sorption capacity of chlorides increases slowly over time, with a sorption efficiency of only 16% after 10 min.
Experimental results have shown that the maximum sorption capacity of HT-b for chlorides and calcium was 50.3 mg/g and 42.2 mg/g, respectively, obtained for both ions after 360 minutes of the process, where equilibrium was reached in the system. The highest efficiencies of sorption after 24 hours were 98.9% for Ca2+ and 81% for Cl-. No significant increase in residual Cl- and Ca2+ concentration was observed, with a further increase in retention time after 24 h with HT-b.
According to reaction (4)
the release of OH groups accompanies rehydration and subsequent combination of Mg-Al oxides with anions in solution. In the EAFD wastewater, visible turbidity after sorption was observed. This was probably due to the small Al3+ ions from Hydrotalcite, which dissolved and precipitated with OH- during sorption. From the sorption time period of 30 minutes in the EAFD wastewater, a gradual increase in the aluminum concentration from 35 mg.l-1 to 80 mg.l-1 up to 120 minutes was recorded. In 240 minutes of the process, Al concentration in the solution decreases again, probably due to precipitation of Al3+ ions with OH- ions (forming Al(OH)4-), which are released from Hydrotalcite during its rehydration and reconstruction during the incorporation of anions into its structure according to the general reaction (5).
where x - molar ratio Al/(Mg + Al) and An n-valent anion. This phenomenon of precipitation of Al with OH- helps to more or less maintain a constant concentration of OH- groups in solution [7].
Mg0,80Al0,20O1,10 +1,10 H2O → Mg0,80Al0,20OH2(OH)0,20
The sorption study [17] describes the precipitation of Ca2+ ions with Hydrotalcite from a solution of CaCl2 with OH- released from Hydrotalcite into Ca(OH)2. The researchers claim that Cl- ions will be sorbed just when calcium precipitates with released OH- in the form of Ca(OH)2. In addition, to sorb chlorides, the chlorides must be in solution over the amount of OH- groups. Conversely, in the case of EAFD wastewater, where carbonates are present, Ca(OH)2 is rather not formed. In part, the OH- groups released from Hydrotalcite appear to inhibit chloride sorption because they have a higher affinity for Hydrotalcite than chlorides. Thus, only when Al begins to dissolve from Hydrotalcite to form Al(OH)4-, and when no sulphate ion is present in the solution, chloride ions begin to sorb. In addition, divalent anions such as SO42- or CO32- have higher selectivity than monovalent ions. The selectivity of Mg-Al oxides increases with the increasing electric charge of the anion and decreasing anion size. Thus, it is not very easy for Hydrotalcite to combine with Cl- ions due to the preference to combine with OH- formed during the reaction (5) [18].
Sorption of Cl and Ca with other tested materials (Figure 23b) - d) was very fast and within the first 5 minutes of the process reached maximum sorption capacities, but due to partial dissolution of sorption materials a desorption behaviour of calcium from Clinoptilolite (ZC-b) and alumina sludge (KA-b) was also observed.
3.5. The sorption of Other Species from EAFD Wastewater by Hydrotalcite Sorbent
Based on the achieved results and in order to discover the behaviour and sorption ability of other present species in EAFD wastewater except Cl and Ca like heavy metals (Pb, Cr) and sulphates, the 24 hour sorption test was performed with the identified best sorbent, HT-b. The experimental conditions for the sorption experiment and obtained results are shown in Figure 23.
From the results in Table 5 it was obvious the decreasing of heavy metals concentration in EAFD wastewater output despite their low initial concentration in the initial sample. Pb2+ was removed with the efficiency of 82% and Cr3+ with the efficiency of 91%. The positive finding was that by HT-b it is possible to achieve some sulphates removal up to around 40% which was not studied much yet. The salts especially sulphate, and chloride ions together with calcium presence in wastewaters represent a significant problematic issue in water purification in different industrial sectors. In particular, the sulphates could inhibit and decrease the efficiency of salt and heavy metals impurities removal where membrane technologies are applied. Achieved results confirmed and suggest that HT could serve as a universal and sustainable adsorbent based on magnesium and aluminium oxides with good raw materials availability, which can remove a wide spectrum of cationic and anionic character impurities from industrial wastewaters. Moreover, it could even be helpful as a pre-treatment step in membrane technology applications.
Despite promising results, there are some challenges, and the optimization of the HT sorption process for the removal of selected species from the wastewater is further required. The efficiency of sulphate and other heavy metal ions besides calcium and chlorides could be improved by changing conditions at sorption, at least the sorbent dosage. The process is also influenced by pH value, time, the presence of other species and other factors. Of course, the important issue in the real industrial applicability of HT for the selected purposes is the effectivity of regeneration of HT (desorption and calcination) in wastewater management of industrial production processes in order to decrease the fresh water consumption and secure the water recirculation in the process and remain sustainable.
4. Conclusions
The hydrometallurgical recycling process of EAFD generates, among other products based on zinc, also a large amount of wastewater. This wastewater is alkaline (~ pH=12) and contains chlorides, sulphates, calcium, sodium, potassium, heavy metals (Cr, Zn, Pb) and other species, and it requires further treatment and purification. This work was focused on the evaluation of efficiency for removal of chlorides and calcium ions by four different sorption materials, namely synthetized Hydrotalcite, natural zeolite Clinoptilolite, synthetized zeolite A, sodian (LTA) and waste alumina sludge. Experimental results have shown the following important findings:
- It was approved the possibility of simultaneous removal of chloride anions and calcium cations by sorption from EAFD wastewater (generated during EAFD washing) by laboratory prepared and calcined Hydrotalcite sorbent (500°C). The highest sorption efficiencies of 98.9% for Ca2+ and 81% for Cl- ions were achieved by using calcined HT adsorbent after 24 hours for EAFD wastewater. The results implies that the sorption process of calcium is faster and preferential to chlorides. This could be caused by two different mechanisms which occur during the simultaneous sorption of Ca2+ and Cl- ions. Calcium is probably adsorbed into the interlayers where it is physically bonded to the carboxyl groups. The rate of chloride sorption is slower than calcium due to the outer parts of the Hydrotalcite sorbent, which has positively charged layers.
- Besides Ca and Cl-, calcined HT also removes Pb, Cr (82-91%), and partially sulphates (40%).
- Adsorption with Hydrotalcite (HT-b) requires a long contact time (6 h), which indicates a diffusion-controlled process and the anion-exchange mechanism.
- Other tested sorption materials of ZC-b, KA-b, SZ-a have shown unsatisfactory results for chloride removal. However, a sample of SZ-a exhibits a very high sorption capacity for calcium and could be used in wastewater purification except in very acid solutions. These results support knowledge and enhance efforts to recycle and reutilize waste materials to produce high-quality raw materials.
The results also suggest that the mechanism by which all studied adsorbents remove impurities from synthetic and wastewater solutions is quite complex and could integrate individual or even parallel running steps like adsorption (chemisorption), absorption, and ion exchange.
Moreover, this study brings a new challenge concerning increasing the rate of sorption for Cl- and Ca2+ ions and increasing the sorption capacity of Hydrotalcite. This could be achieved, for example, by the Mg/Al ratio, the time of crystallization, the temperature of synthesis and co-precipitation, and the temperature and time of calcination, which are very important factors influencing the final effectivity of Hydrotalcite in the sorption of chlorides and calcium. Knowledge of the desorption process of adsorbed impurities and regeneration possibilities and further reuse is required for its application in a full-scale process and enormous contribution to increasing the effectivity of recycling processes and sustainability for not only EAFD as a hazardous waste treatment from steel production. The sustainability concept would also support the research focused on preparation possibilities of HT from secondary sources like, for example, acid and alkaline waste solutions from surface finishing operations in the aluminum industry as it was used for zeolite preparation in this study.
Author Contributions
Conceptualization, H.H., A.M. and Z.T.; methodology, H.H., A.M.; investigation, H.H., A.M. R.B. and M.F. validation, H.H., A.M., Z.T. and A.M.B.; formal analysis, H.H., A.M..; resources, H.H., A.M., Z.T.; data curation, A.M.B., A.M. D.O.; writing—original draft preparation, H.H., A.M.; writing—review and editing, H.H., A.M., Z.T., A.M.B., R.B., M.F. and D.O.; visualization, H.H., A.M., Z.T.; supervision, A.M. All authors have read and agreed to the published version of the manuscript.
Funding
This work was funded by the Ministry of Education of the Slovak Republic under grant VEGA 1/0678/23 and by the Slovak Research and Development Agency under the contract No. APVV-23-0051 and APVV-23-0055.
Institutional Review Board Statement
Not applicable.
Informed Consent Statement
Not applicable.
Data Availability Statement
Not applicable.
Acknowledgments
Authors would like to express their gratitude to Miroslav Almáši from the Faculty of Science of the Pavol Jozef Šafárik University in Košice, Slovakia for his kind support and help in FTIR measurements and to Silvia Brožová from Faculty of Material Science and Technology of VSB Technical University of Ostrava for her`s contribution and help in BET and BJH analysis.
Conflicts of Interest
The authors declare no conflict of interest.
References
- World Steel Association: Crude Steel Production. Available online: https://worldsteel.org/data/steel-data-viewer/ (accessed on 28 June 2024).
- Sustainable Water Treatment, Delivered Anywhere. Available online: https://www.fluencecorp.com/ (accessed on 28 June 2024).
- Colla, V.; Branca, T. A.; Rosito, F.; Lucca, C.; Vivas, B.P.; Delmiro, V.M. Sustainable reverse osmosis application for wastewater treatment in the steel industry. J. Clean. Prod. 2016, 130, 103–115. [Google Scholar] [CrossRef]
- Water management in the steel industry. Available online: https://worldsteel.org/wp-content/uploads/ Water-management-in-the-steel-industry.pdf (accessed on 28 June 2024).
- Kirkelund, G. M.; Magro, C.; Guedes, P.; Jensen, P. E.; Ribeiro, A. B.; Ottosen, L. M. Electrodialytic removal of heavy metals and chloride from municipal solid waste incineration fly ash and air pollution control residue in suspension - test of a new two compartment experimental cell. Electrochimica Acta 2015, 181, 73–81. [Google Scholar] [CrossRef]
- Ozugbe, E.O.; Rathilal, S. Membrane Technologies in Wastewater Treatment: A Review. Membranes 2020, 10, 89. [Google Scholar] [CrossRef] [PubMed]
- Kameda, T.; Miyano, Y.; Yoshioka, Y.; Uchida, M.; Okuwaki, A. New treatment methods for waste water containing chloride ion using magnesium-aluminium oxide. Chem. Lett. 2000, 29, 1136–1137. [Google Scholar] [CrossRef]
- Wang, J.; Qu, D.; Tie, M.; Ren, H.; Peng, X.; Luan, Z. Effect of coagulation pretreatment on membrane distillation process for desalination of recirculating cooling water. Sep. Purif. Technol. 2008, 64, 108–115. [Google Scholar] [CrossRef]
- Shehata, N.; Egirani, D.; Olabi, A.G.; Inayat, A.; Abdelkareem, M.A.; Chae, K.-J.; Sayed, E.T. Membrane-based water and wastewater treatment technologies: Issues, current trends, challenges, and role in achieving sustainable development goals, and circular economy. Chemosphere 2023, 320, 137993. [Google Scholar] [CrossRef]
- Dron, J.; Dodi, A. Comparison of adsorption equilibrium models for the study of Cl−, NO3− and SO42− removal from aqueous solutions by an anion exchange resin. J. Hazard. Mat. 2011, 190, 300–307. [Google Scholar] [CrossRef] [PubMed]
- Hilal, N.; Kochkodan, V.; Al Abdulgader, H.; Mandale, S.; Al-Jlil S., A. A combined ion exchange-nanofiltration process for water desalination: I. sulphate-chloride ion-exchange in saline solutions. Desalination 2015, 363, 44–50. [Google Scholar] [CrossRef]
- Darracq, G.; Baron, J.; Joyeux, M. Kinetic and isotherm studies on perchlorate sorption by ion-exchange resins in drinking water treatment. J. Water Process Eng., 2014, 3, 123–131. [Google Scholar] [CrossRef]
- Iakovleva, E.; Mäkilä, E.; Salonen, J.; Sitarz, M.; Sillanpää, M. Industrial products and wastes as adsorbents for sulphate and chloride removal from synthetic alkaline solution and mine process water, Chem. Eng. J. 2015, 259, 364–371. [Google Scholar]
- Dahmani, K.; Kherroub, D.E.; Boucherdoud, A.; Bestani, B. Removal of Ca(II) and Mg(II) hardness by ion exchange resins and soda ash for seawater pretreatment to reduce scale formation in evaporators multi-stage flash desalination. Desalin. Water. Treat. 2021, 221, 23–30. [Google Scholar] [CrossRef]
- Wang, S.; Peng, Y. Natural zeolites as effective adsorbents in water and wastewater treatment. Chem. Eng. J. 2010, 156, 11–24. [Google Scholar] [CrossRef]
- Hailu, Y.; Tilahun, E.; Brhane, A.; Resky, H.; Sahu, O. Ion exchanges process for calcium, magnesium and total hardness from ground water with natural zeolite. Groundwater for Sustainable Development 2019, 8, 457–467. [Google Scholar] [CrossRef]
- Kameda, T.; Yoshioka, T.; Mitsuhashi, T.; Uchida, M.; Okuwaki, A. The simultaneous removal of calcium and chloride ions from calcium chloride solution using magnesium–aluminum oxide. Water Res. 2023, 37, 4045–4050. [Google Scholar] [CrossRef]
- Kameda, T.; Yoshioka, T.; Hoshi, T.; Uchida, M.; Okuwaki, A. The removal of chloride from solutions with various cations using magnesium–aluminum oxide, Sep. Purif. Technol. 2005, 42, 25–29. [Google Scholar] [CrossRef]
- Hamidi, R.; Kazemi, P. Kinetics and mechanism of sorption of chloride ion from sodium carbonate manufacturing wastewater by Mg–Al oxide. Desal. Water Treat. 2014, 54, 332–341. [Google Scholar] [CrossRef]
- Miyata, S. Anion-exchange properties of hydrotalcite-like compounds. Clays Clay Miner. 1983, 4, 4–311. [Google Scholar] [CrossRef]
- Jun-yi, L.; Zheng-song, Q.; Yang, L. Nano-pore structure characterization of shales using gas adsorption and mercury intrusion techniques. Journal of Chemical and Pharmaceutical Research 2014, 6, 850–857. [Google Scholar]
- Shoumkova, A.; Stoyanova, V. Zeolites formation by hydrothermal alkali activation of coal fly ash from thermal power station “Maritsa 3”, Bulgaria. Fuel 2013, 103, 533–541. [Google Scholar] [CrossRef]
- About zeolite. Available online: https://worldsteel.org/data/steel-data-viewer/ (accessed on 1 July 2024).
- Yang, S.; Lach-hab, M.; Vaisman, I.I.; Blaisten-Barojas, E.; Li, X.; Karen, V.L. Framework-Type Determination for Zeolite Structures in the Inorganic Crystal Structure Database. J. Phys. Chem. Ref. Data 2010, 39, 3. [Google Scholar] [CrossRef]
- Frost, R.L.; Martens, W.; Ding, Z.; Kloprogge, J.T.; Johnson, T.E. The role of water in synthesized hydrotalcites of formula MgxZn6-xCr2(OH)16(CO3).4H2O and NixCo6-xCr2(OH)16(CO3).4H2O – an infrared spectroscopic study. Spectrochim. Acta A Mol. Biomol. Spectrosc. 2003, 59, 291–302. [Google Scholar] [CrossRef]
- Morimoto, K.; Anraku, S.; Hoshino, J.; Yoneda, T.; Sato, T. Surface complexation reactions of inorganic anions on hydrotalcite-like compounds. J. Colloid. Interface Sci. 2012, 384, 99–104. [Google Scholar] [CrossRef]
- Polatoglu, I.; Cakicioglu-Ozkan, F. Aqueous interactions of zeolitic material in acidic and basic solutions. Microporous and Mesoporous Mater. 2010, 132, 219–225. [Google Scholar] [CrossRef]
- Ye, N.; Yang, J.; Liang, S.; Hu, Y.; Hu, J.; Xiao, B.; Huang, O. Synthesis and strength optimization of one-part geopolymer based on red mud. Constr. Build. Mater. 2016, 111, 317–325. [Google Scholar] [CrossRef]
- Demortier, A.; Gobeltz, N.; Lelieur, J.P.; Duhayon, C. Infrared evidence for the formation of an intermediate compound during the synthesis of zeolite Na–A from metakaolin. Intern. J. Inorg. Mat. 1999, 1, 129–134. [Google Scholar] [CrossRef]
Figure 1.
N2 adsorption-desorption isotherms and the corresponding pore size distribution estimated from the desorption isotherm by de Boer for a) HT-b, b) ZC-b, c) SZ-a and d) KA-b.
Figure 1.
N2 adsorption-desorption isotherms and the corresponding pore size distribution estimated from the desorption isotherm by de Boer for a) HT-b, b) ZC-b, c) SZ-a and d) KA-b.
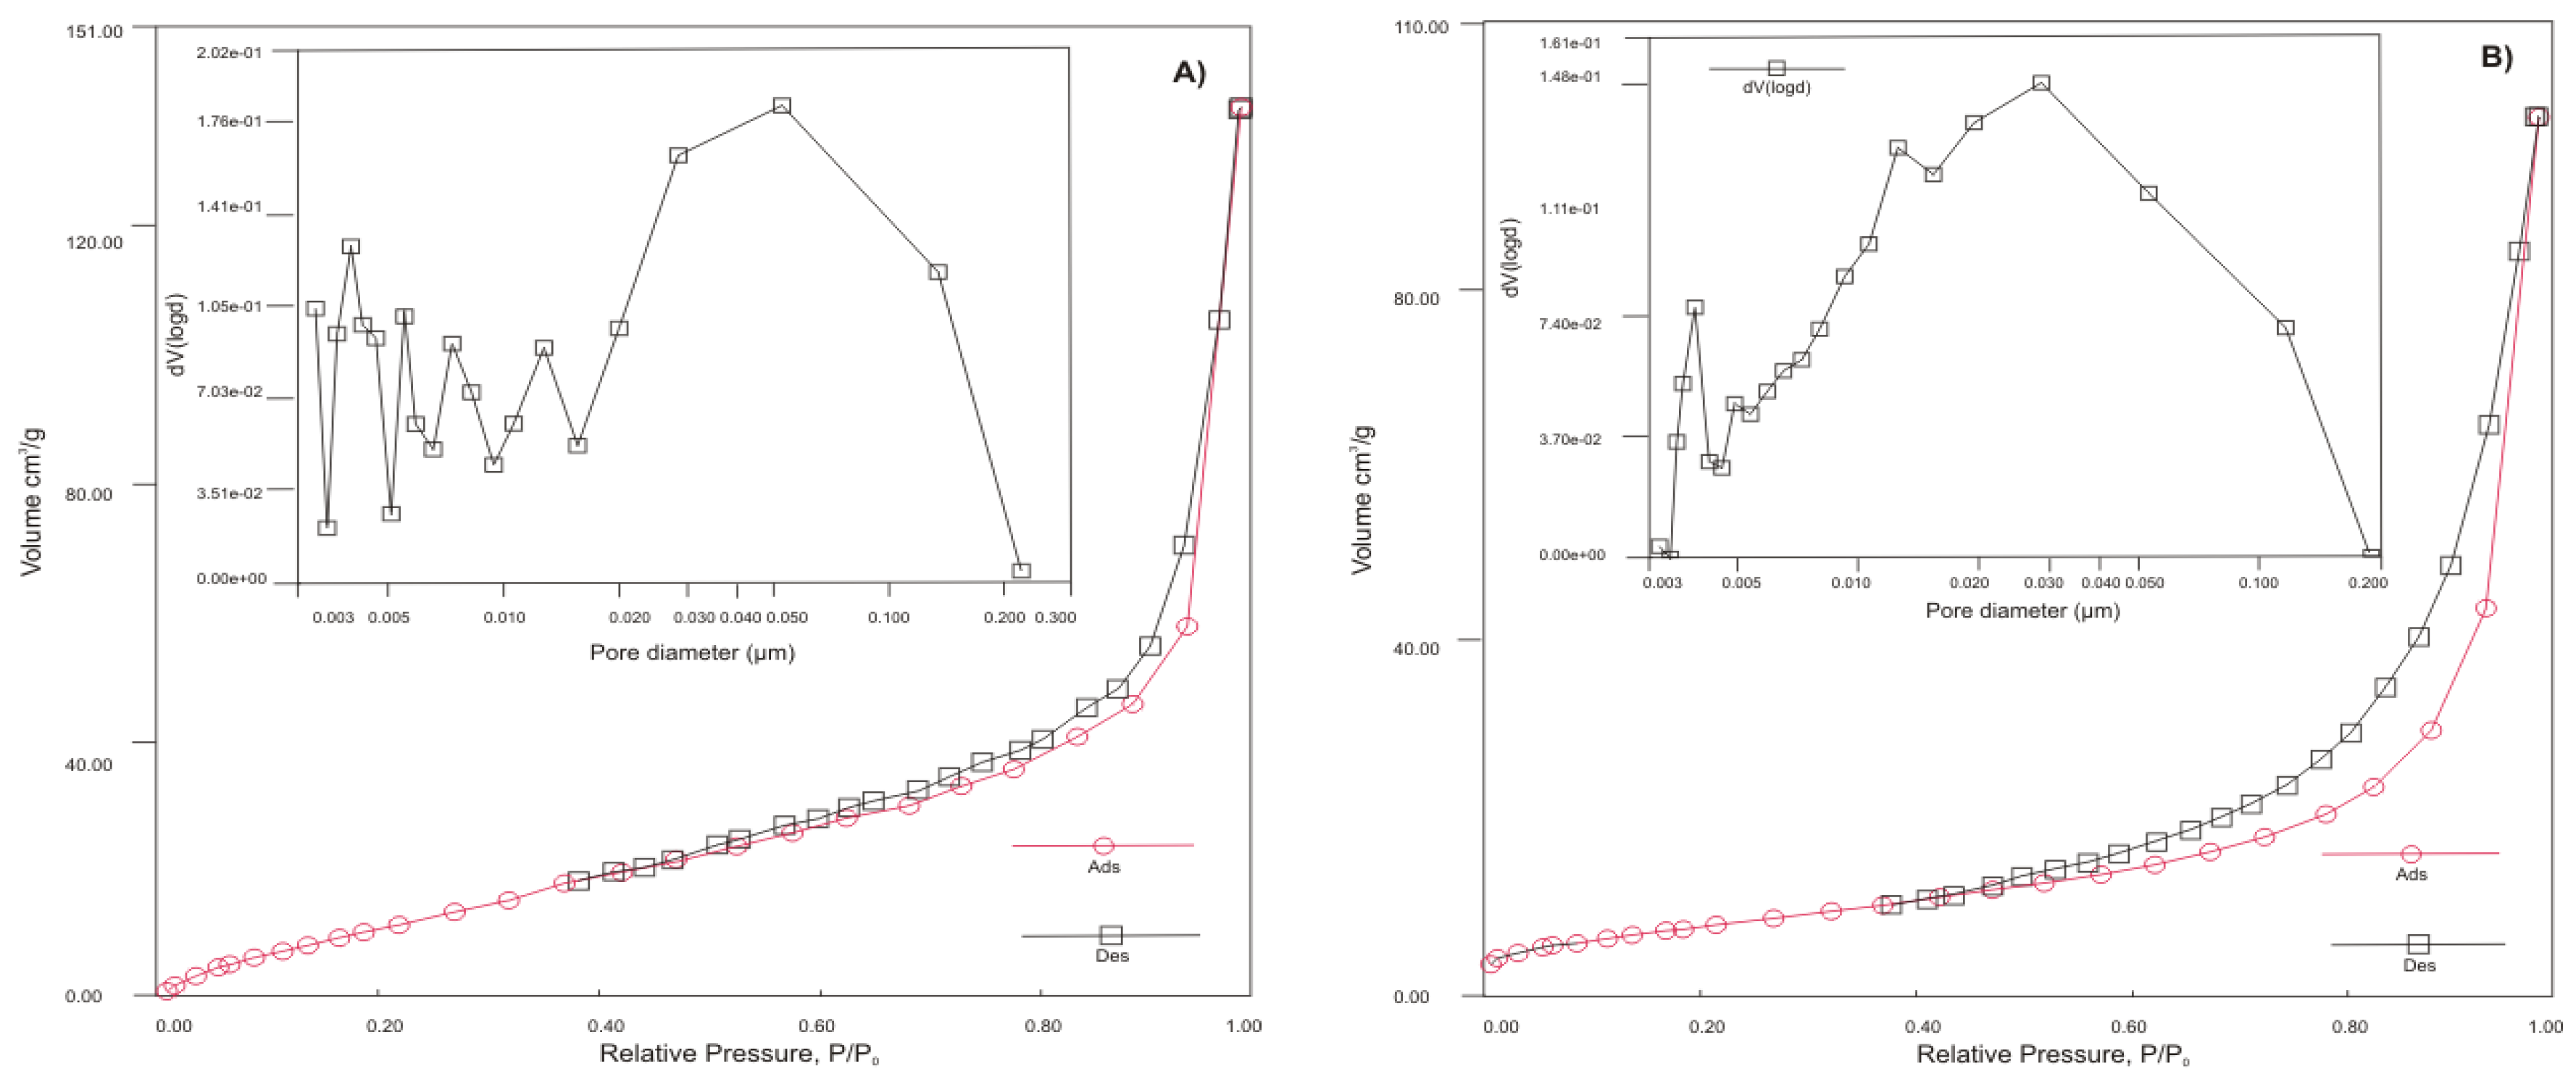
Figure 2.
HT-b sorbent: a) SEM picture, b) LIBS point analysis, c) LIBS point analysis d) LIBS-3D image of the loose powder sorbent.
Figure 2.
HT-b sorbent: a) SEM picture, b) LIBS point analysis, c) LIBS point analysis d) LIBS-3D image of the loose powder sorbent.
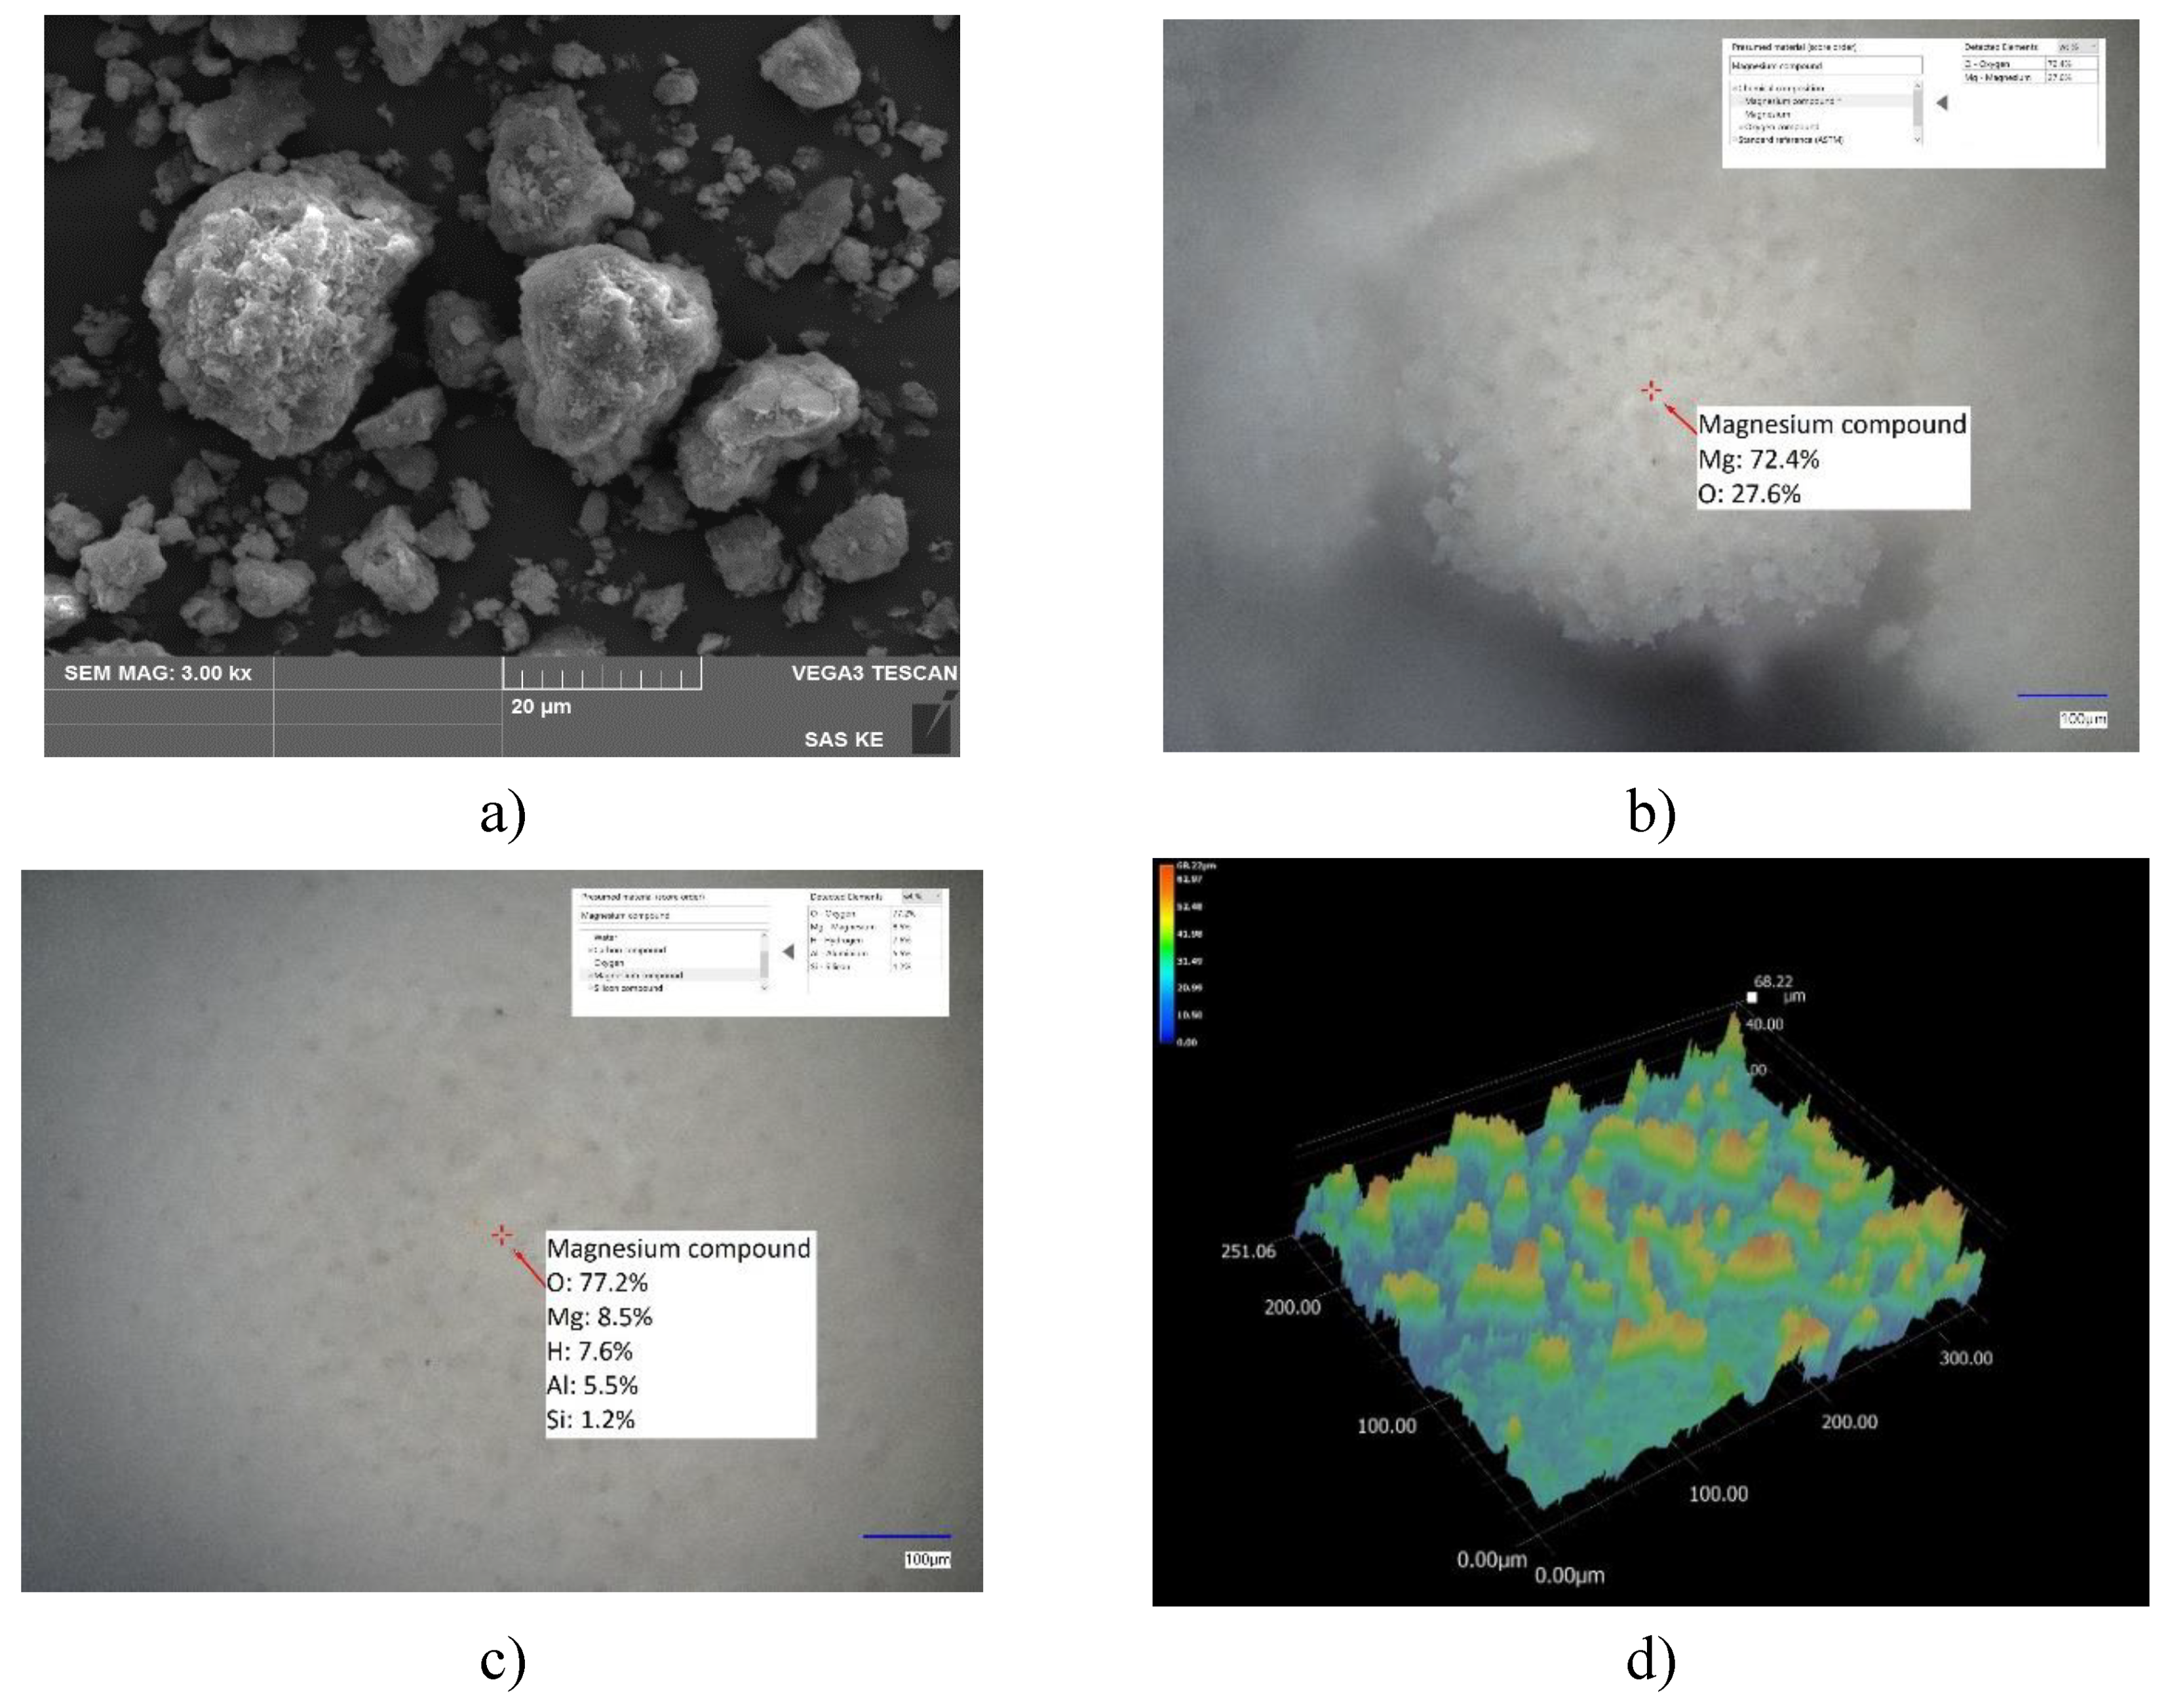
Figure 3.
ZC-b sorbent: a) SEM morphology picture, b) LIBS point analysis.
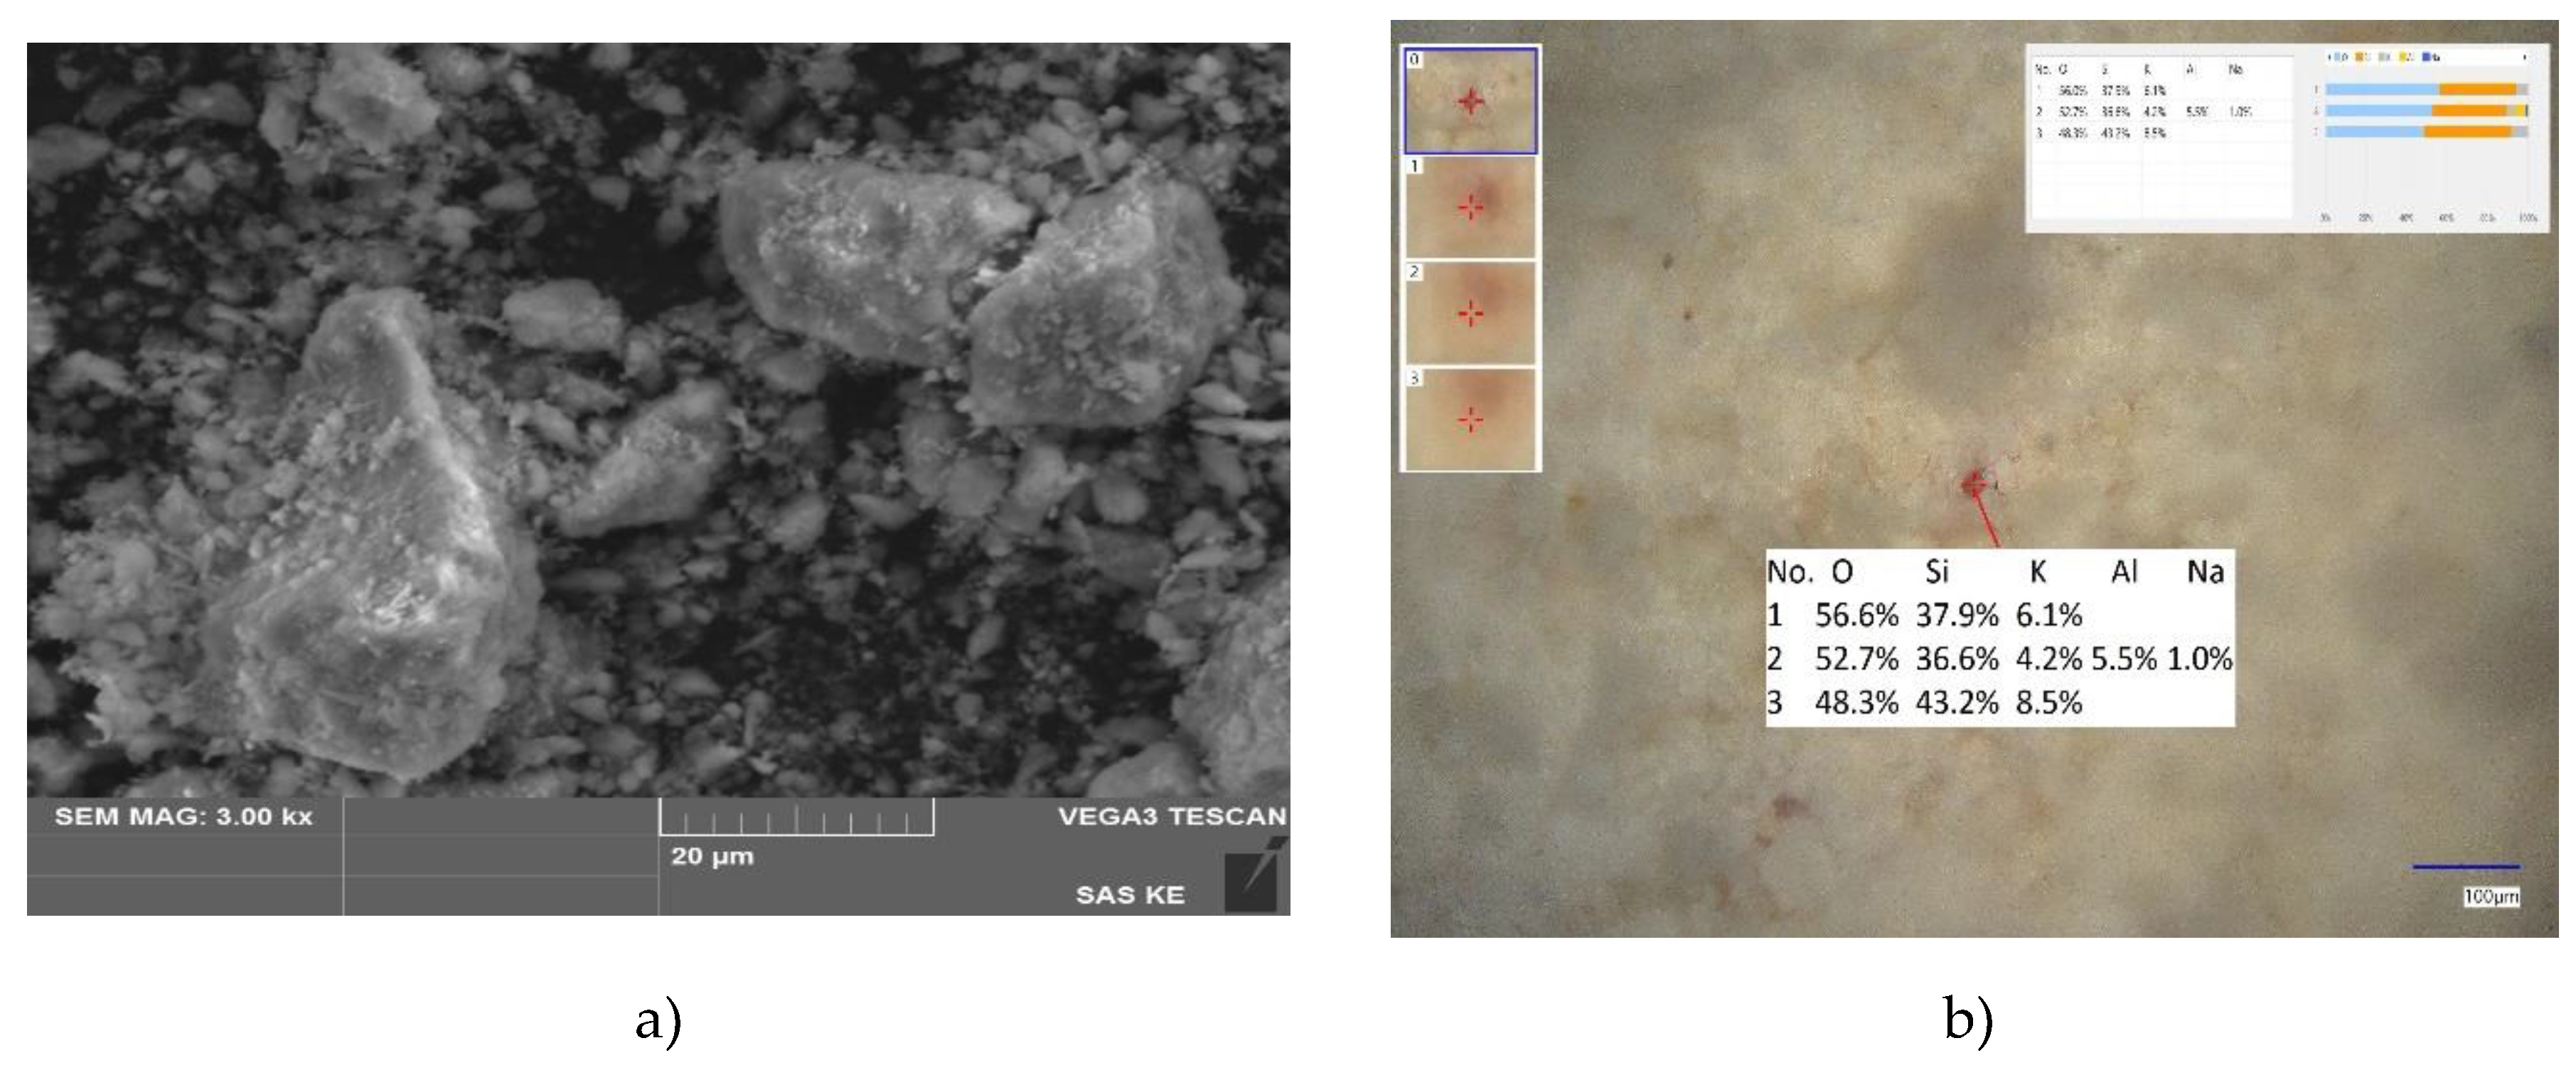
Figure 4.
SZ-a sorbent: a) SEM morphology picture, b) LIBS point analysis.
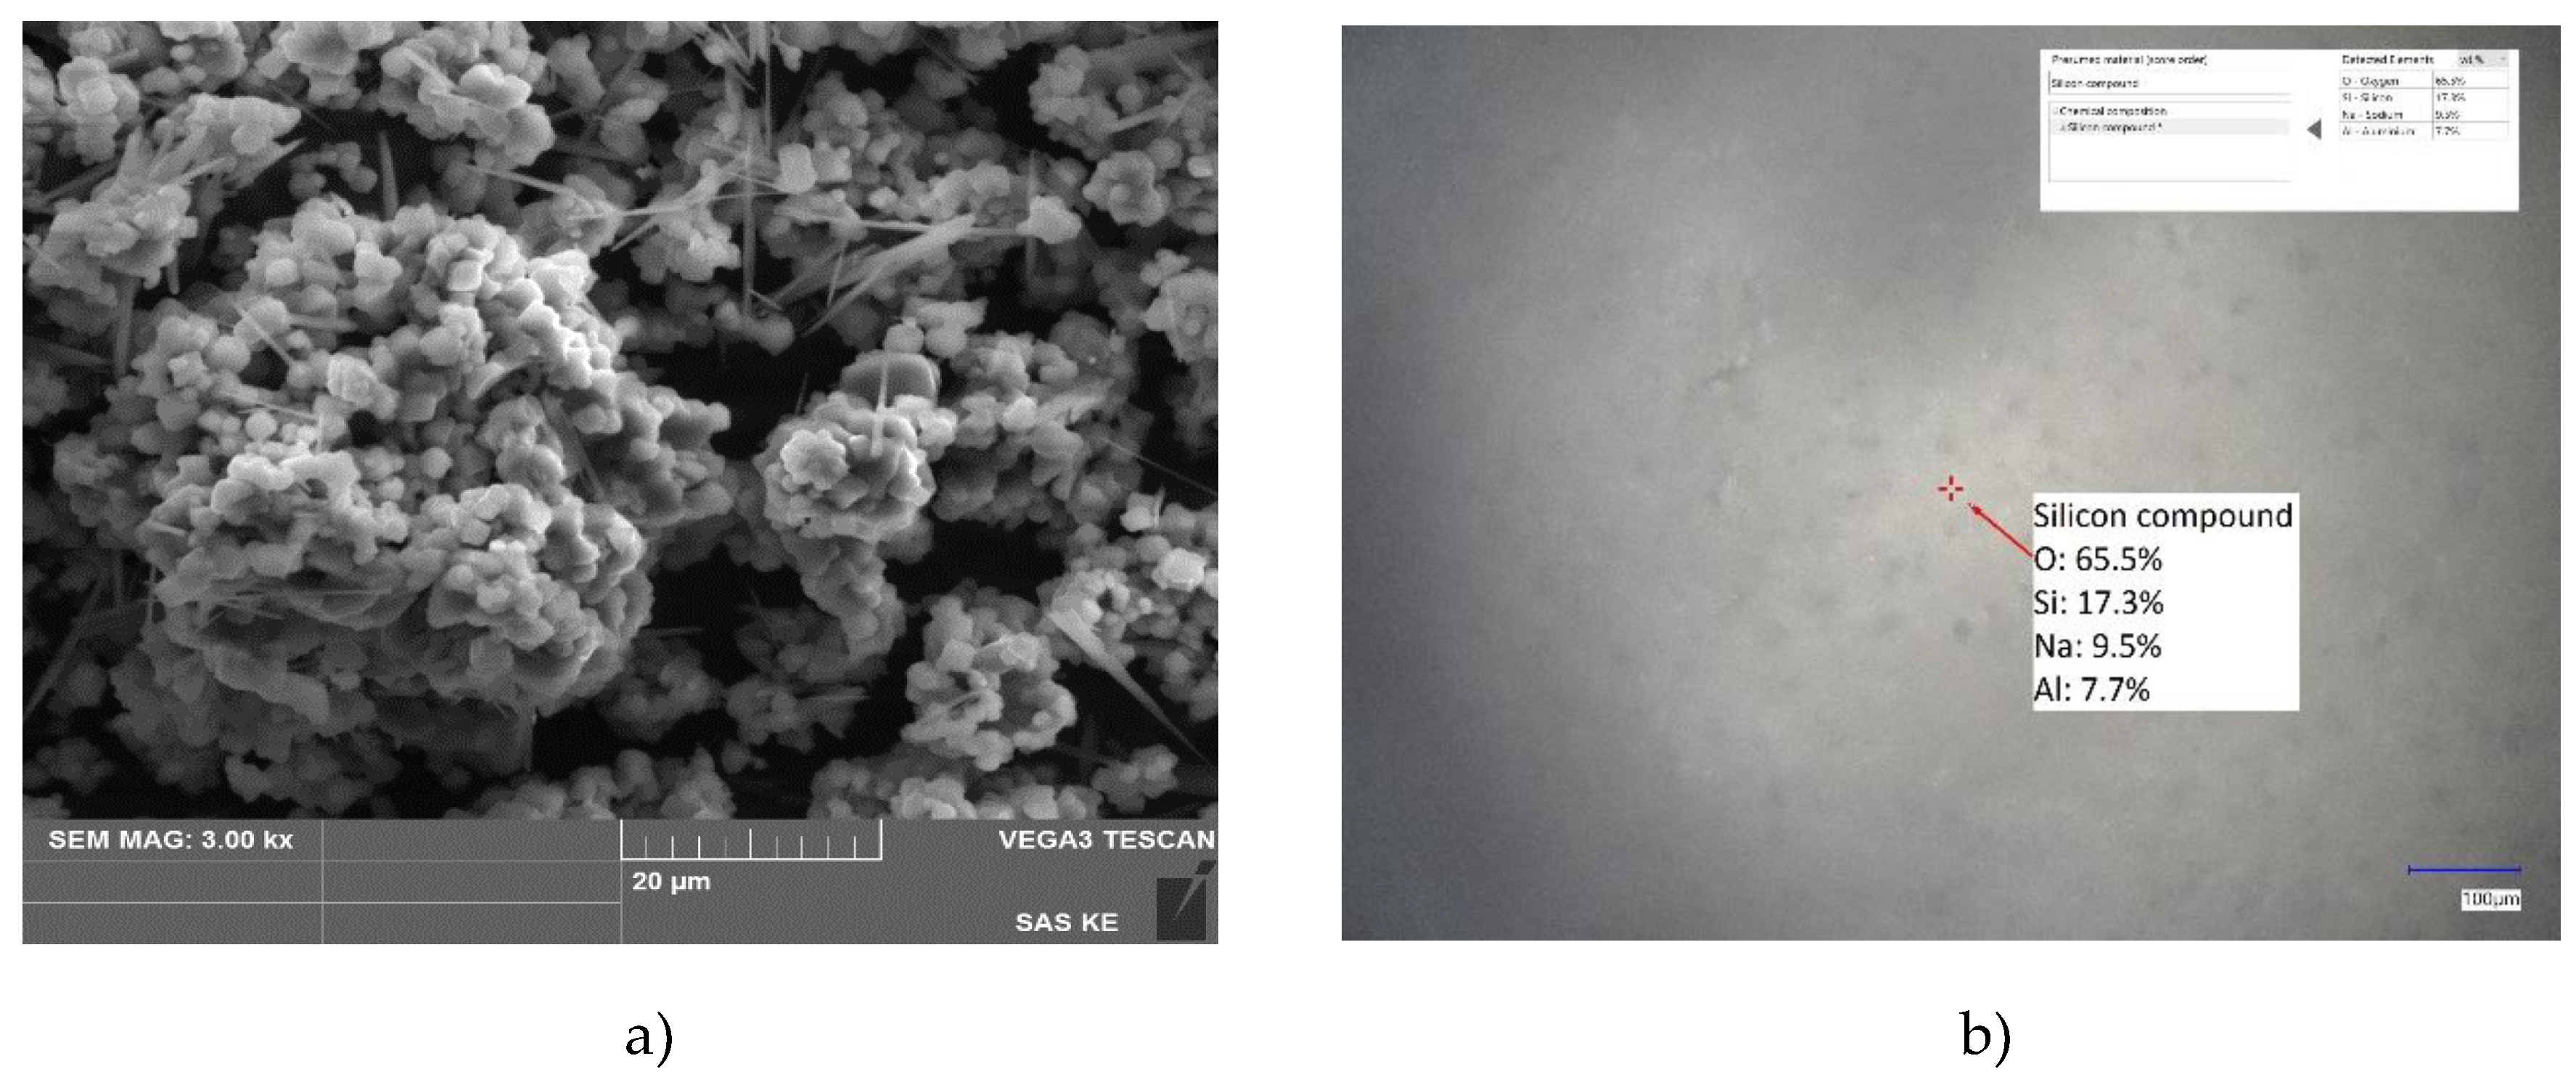
Figure 5.
KA-b sorbent: a) SEM morphology picture, b) LIBS point analysis.
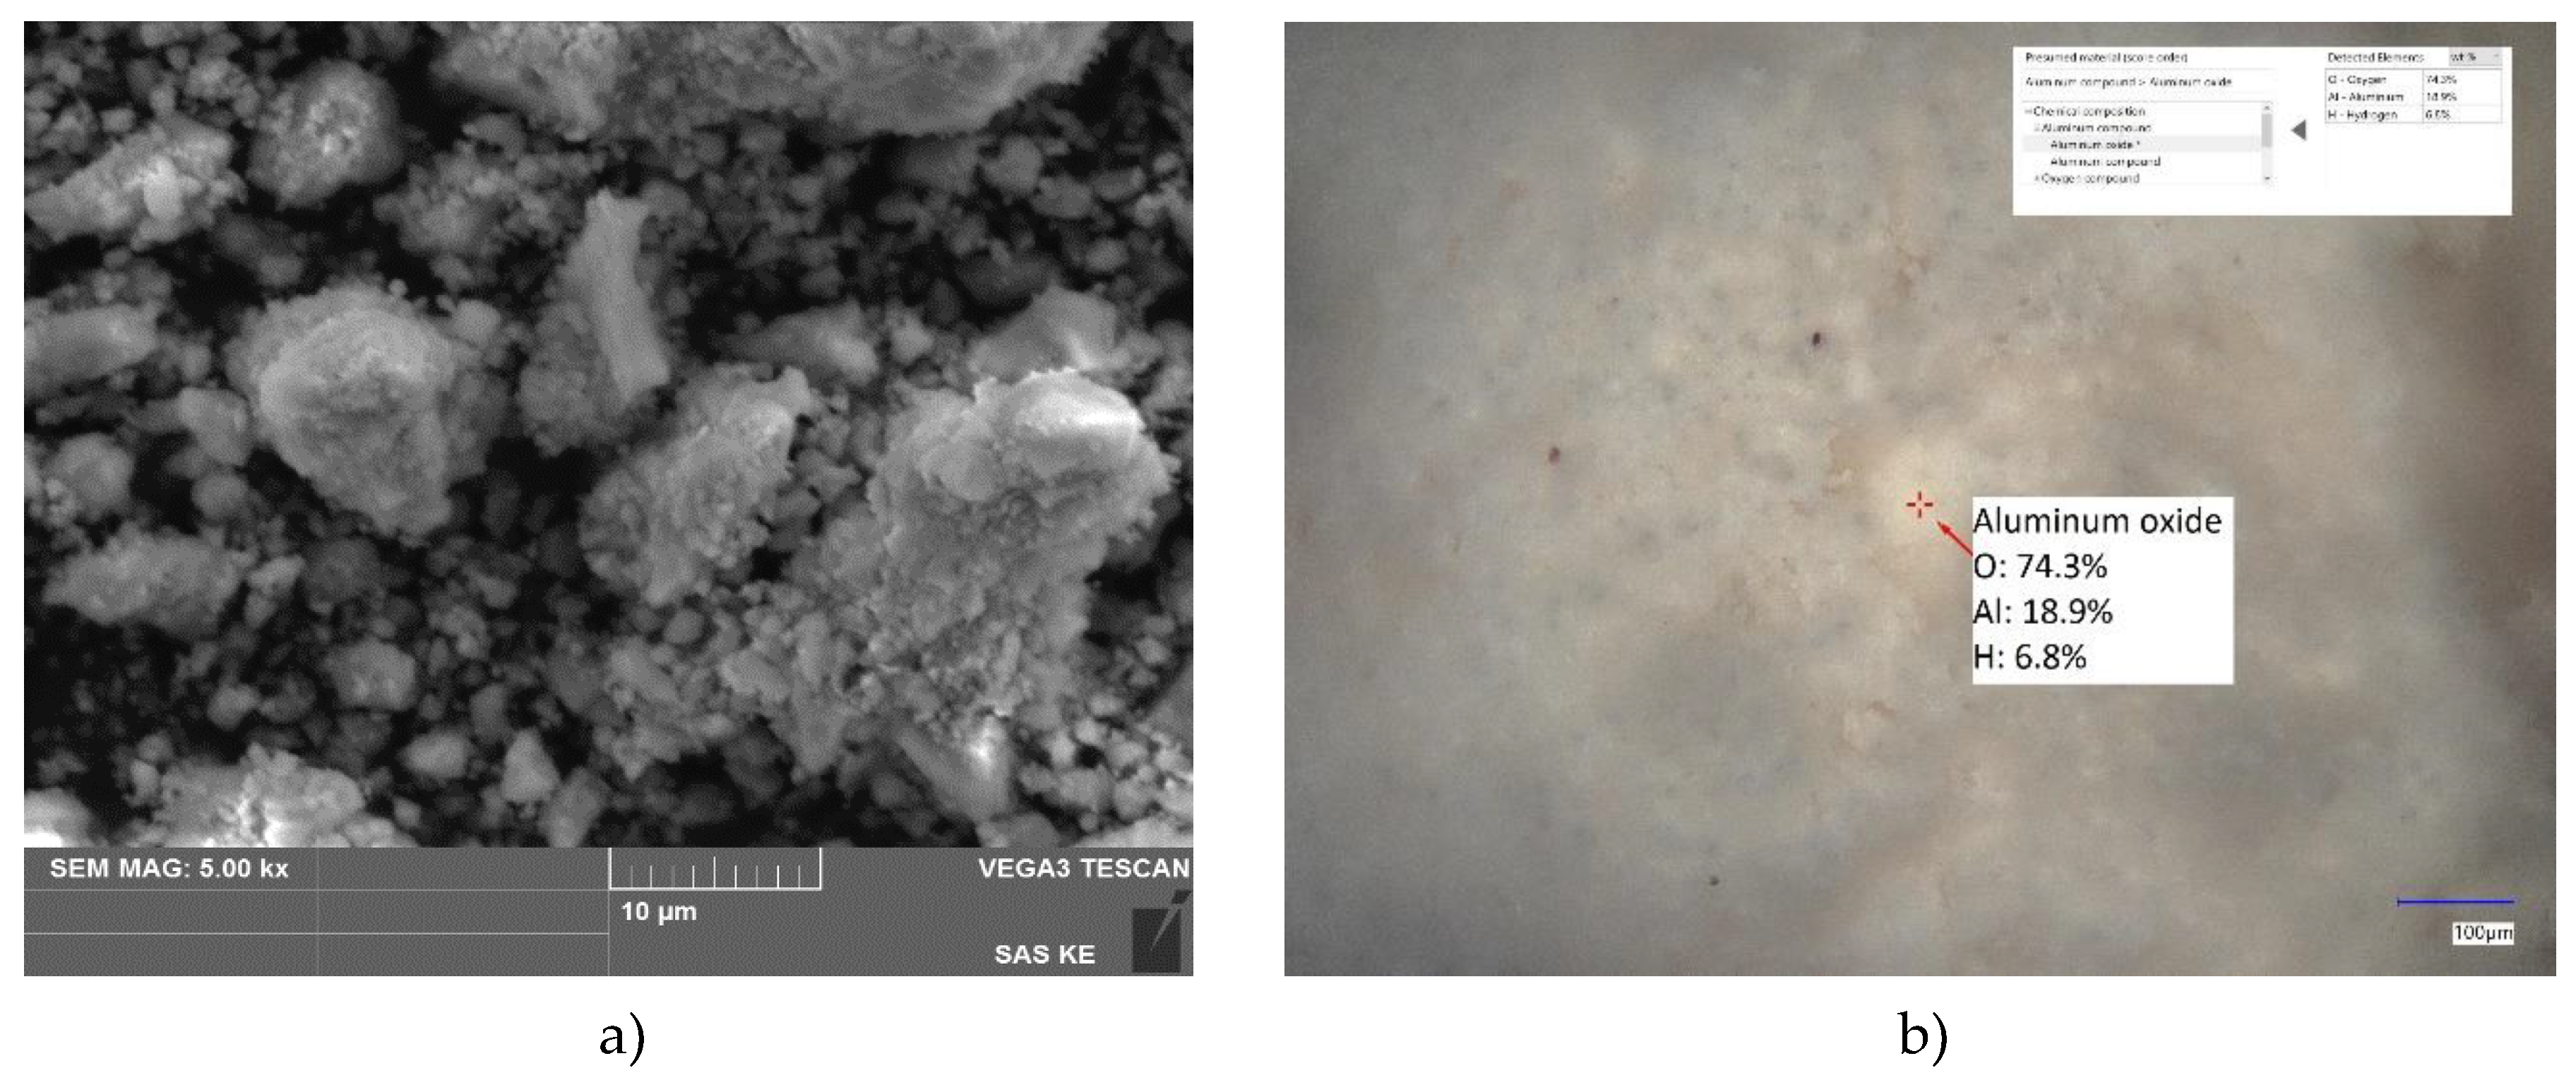
Figure 6.
XRD pattern of HT-a synthetized, HT-b calcined at 500°C.
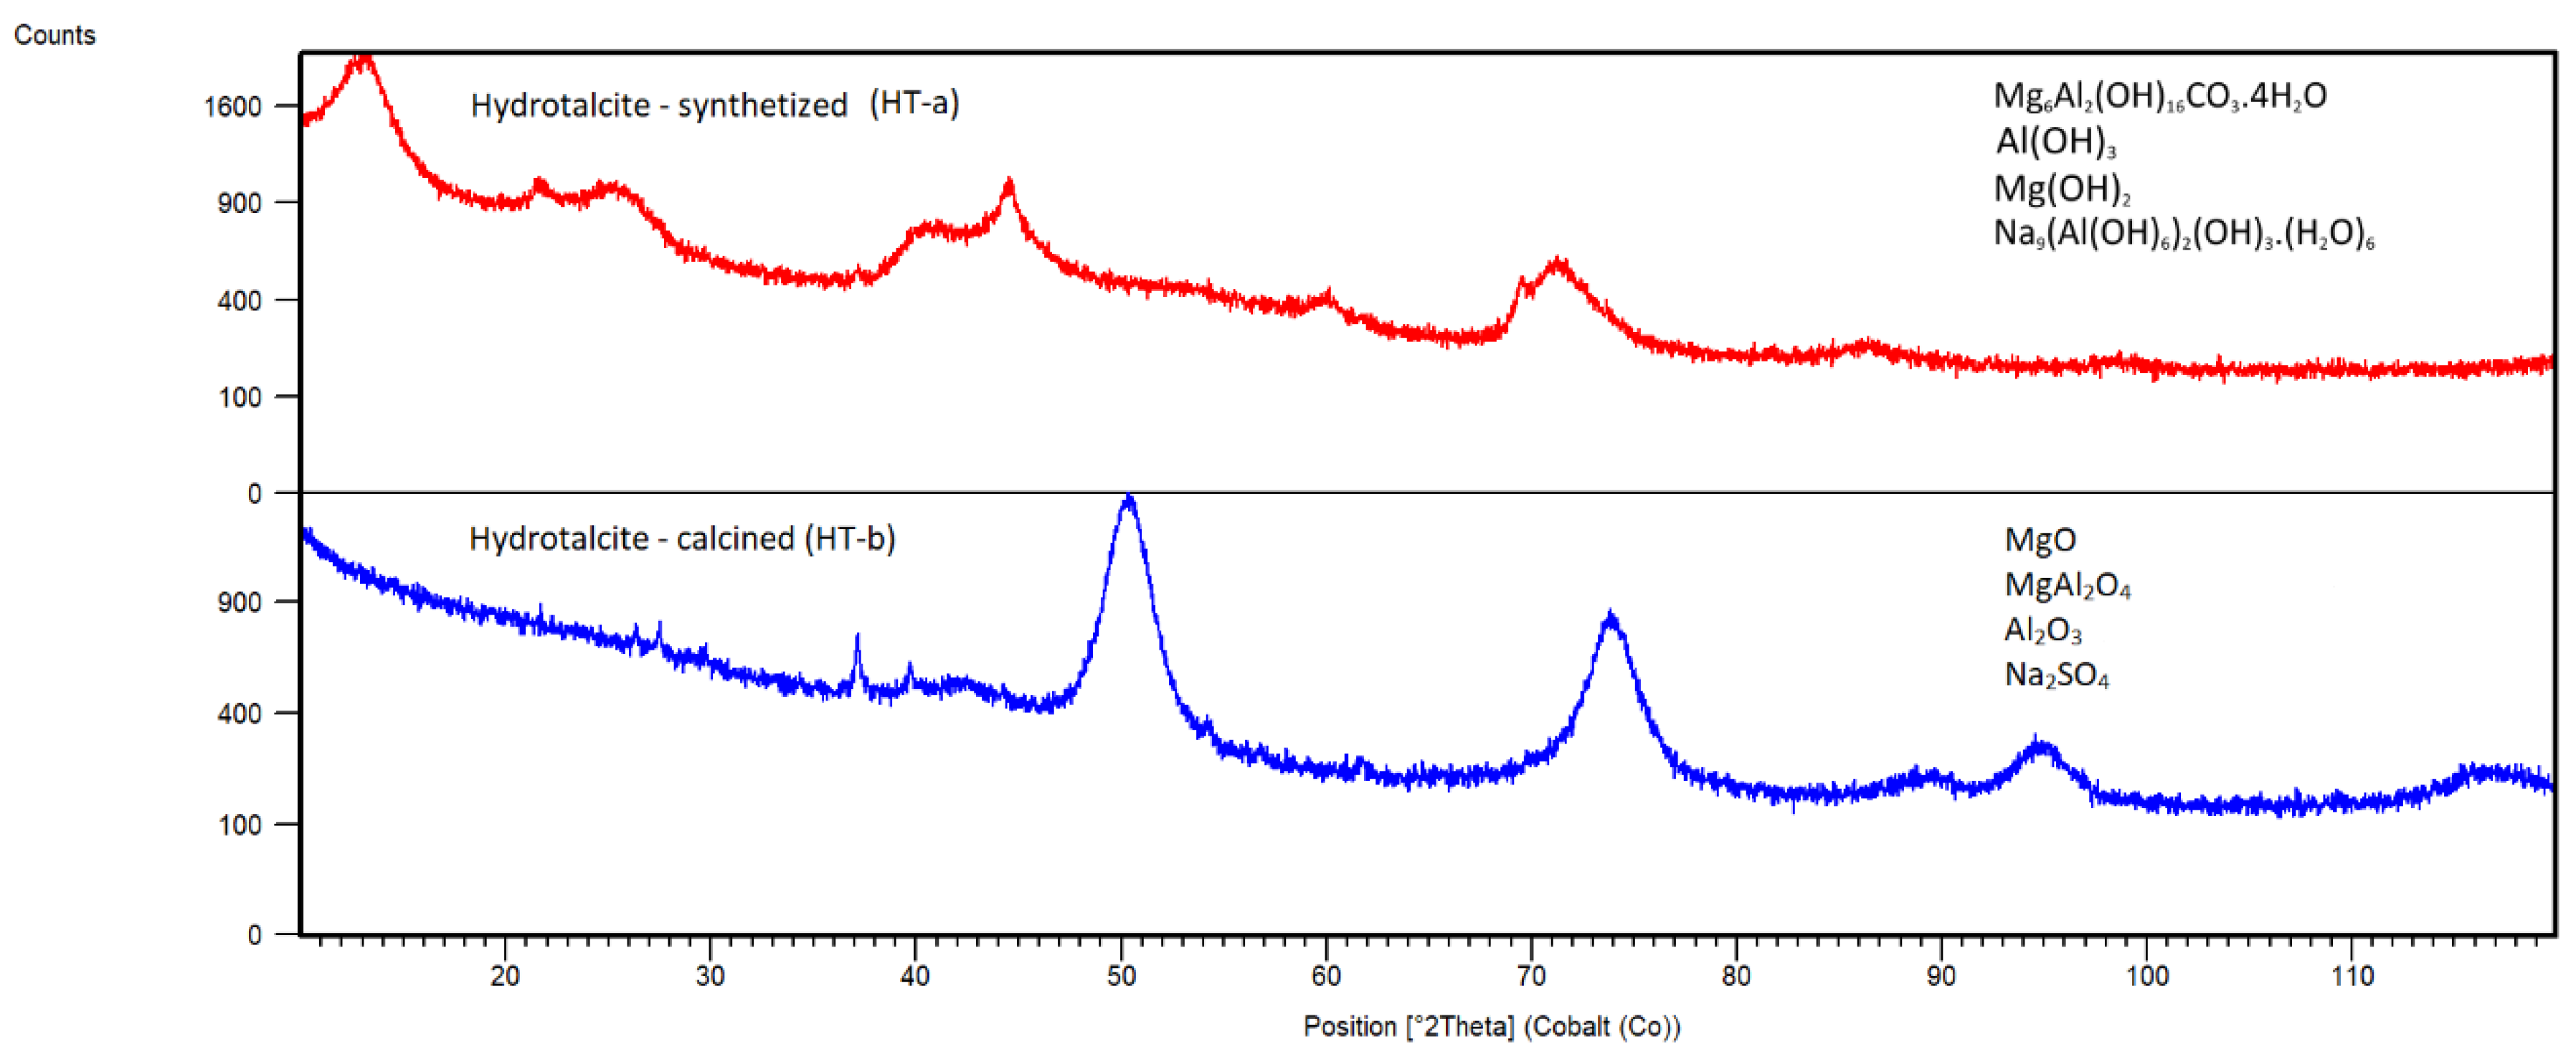
Figure 7.
XRD pattern of ZC-a dried, ZC-b calcined at 500 °C.
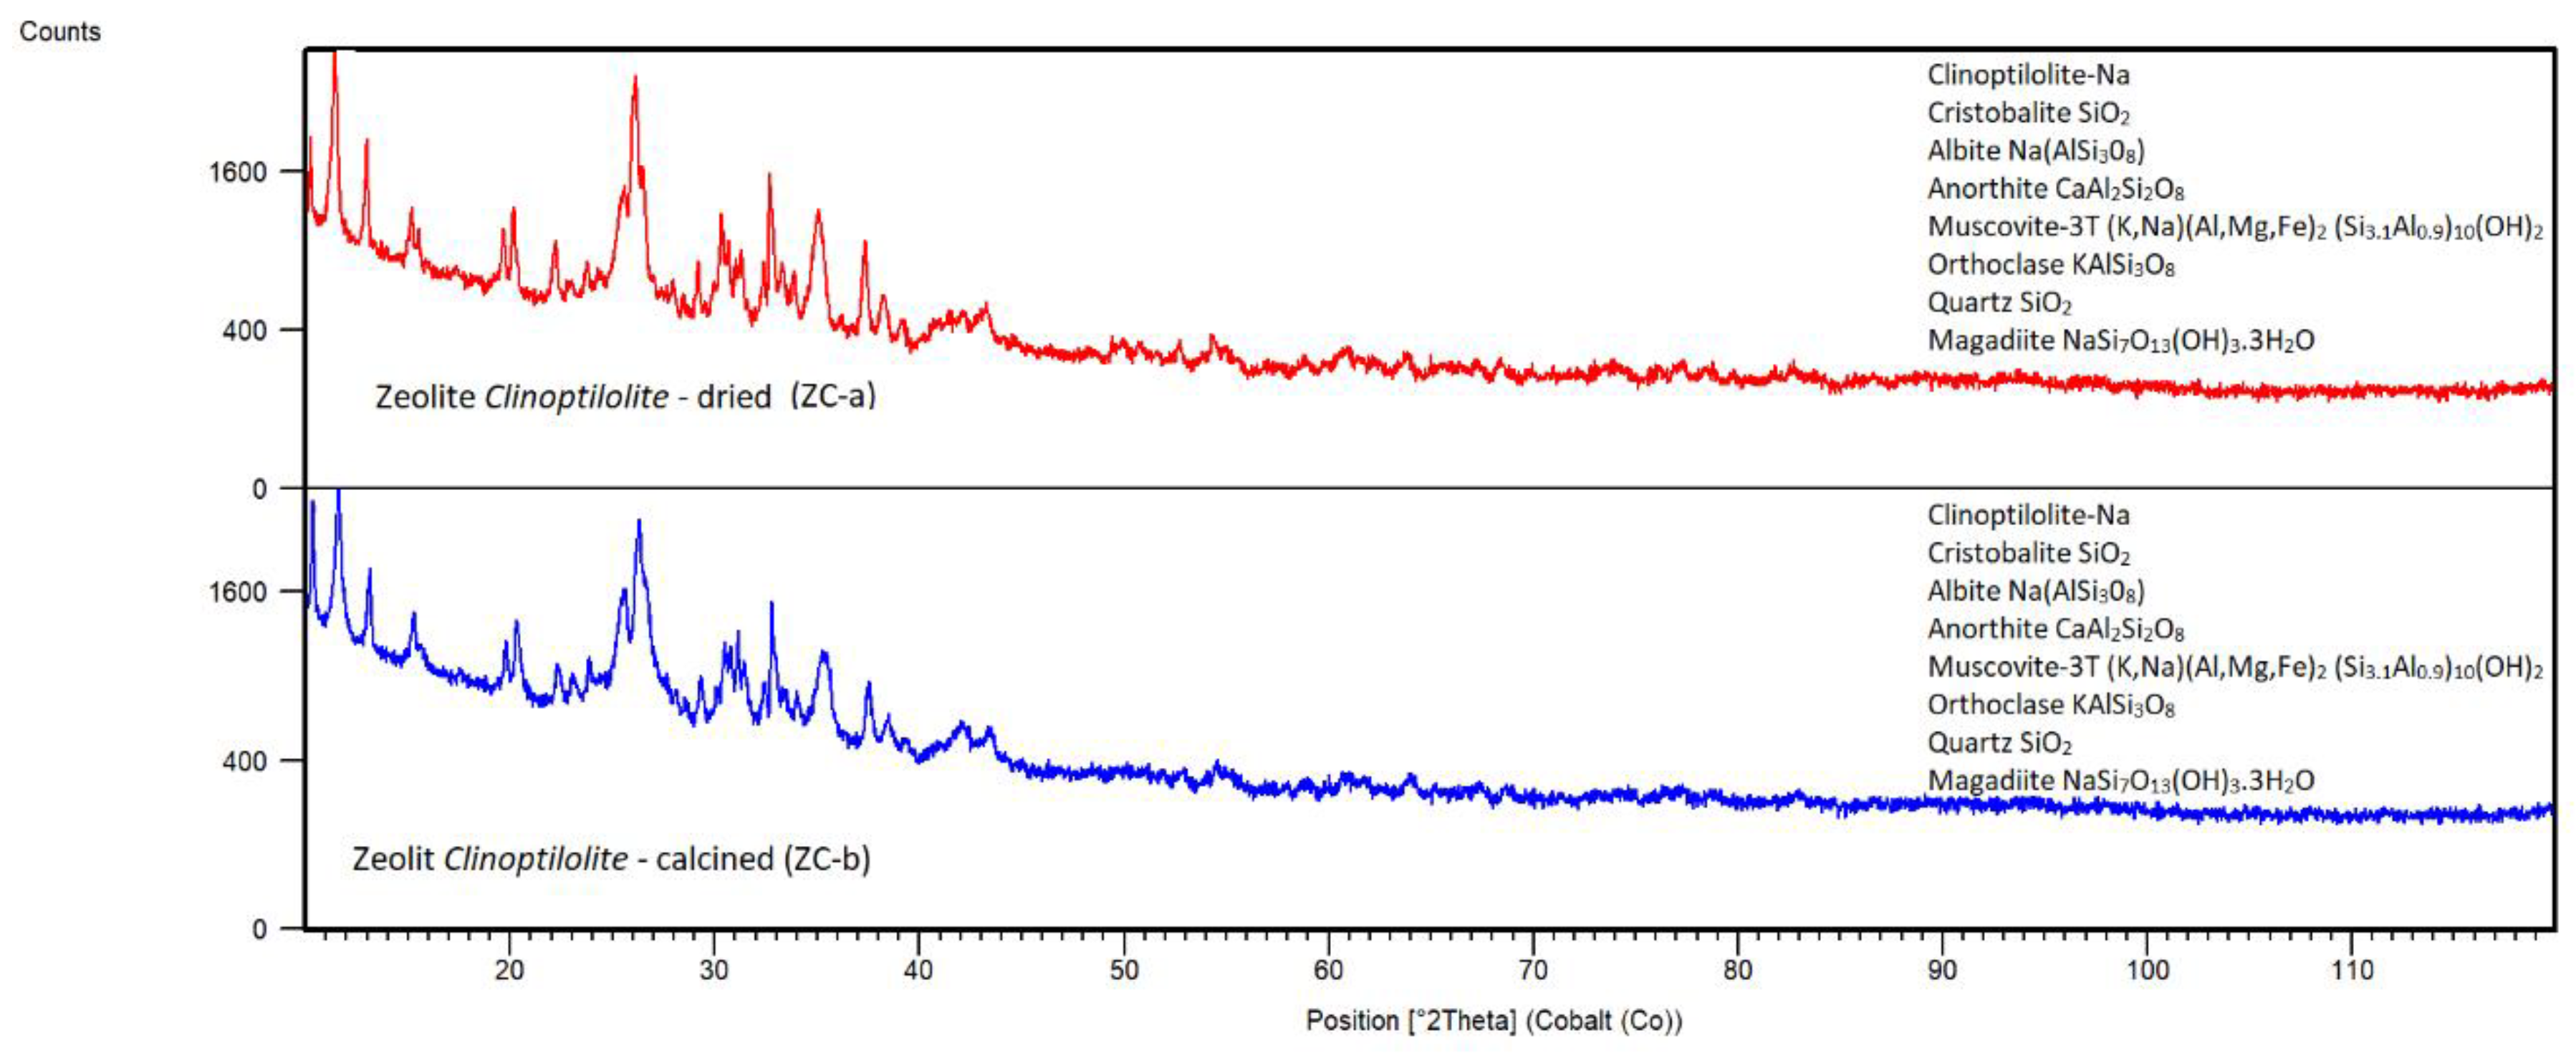
Figure 8.
XRD pattern of SZ-a synthetized (not calcined).
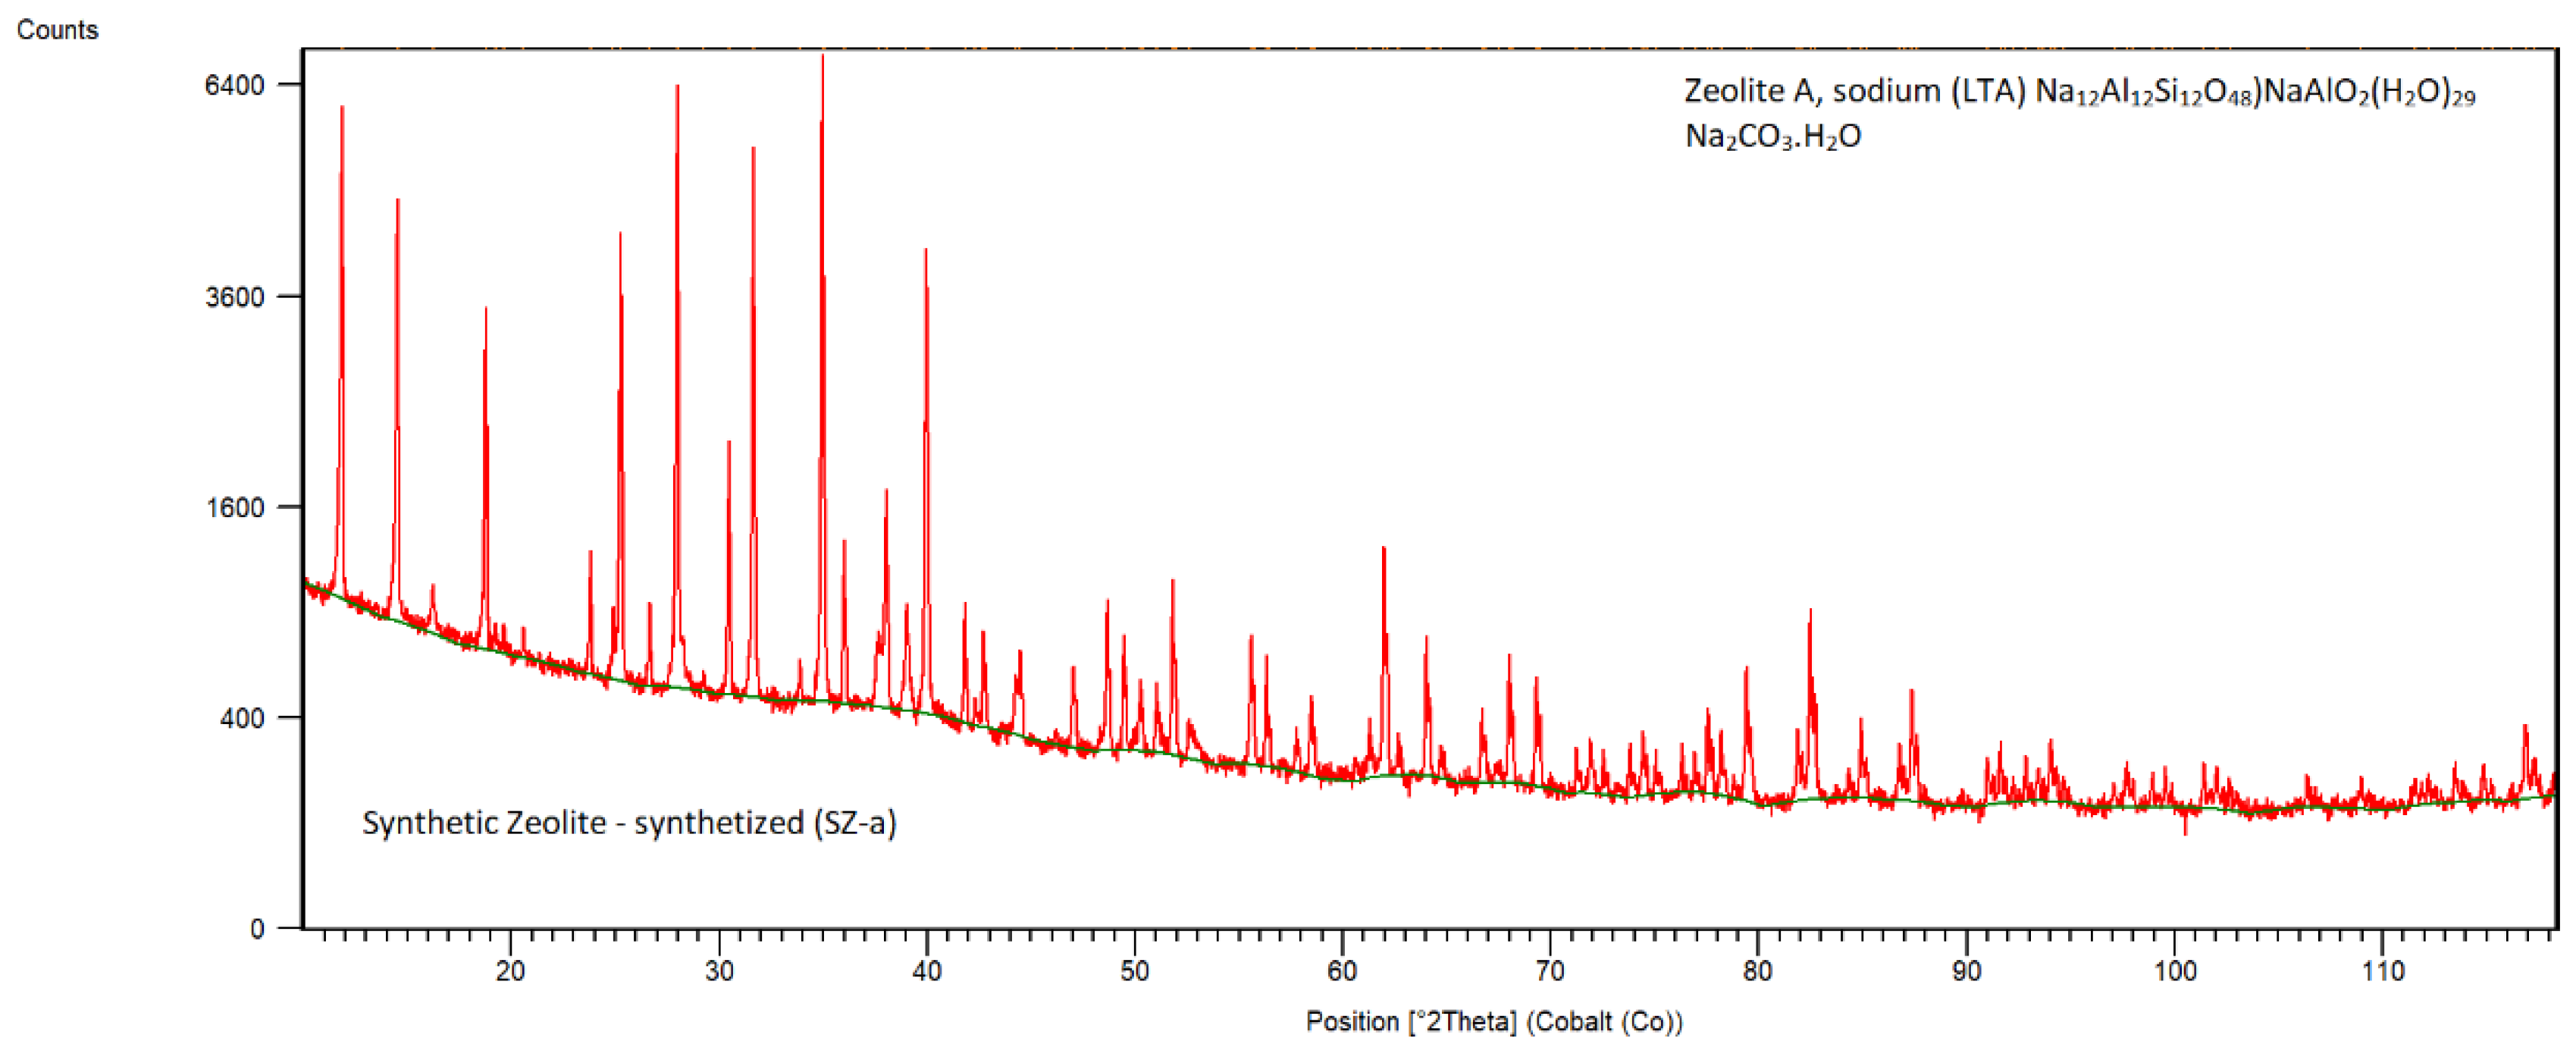
Figure 9.
XRD pattern of alumina sludge KA-a dried, KA-b calcined at 500°C.
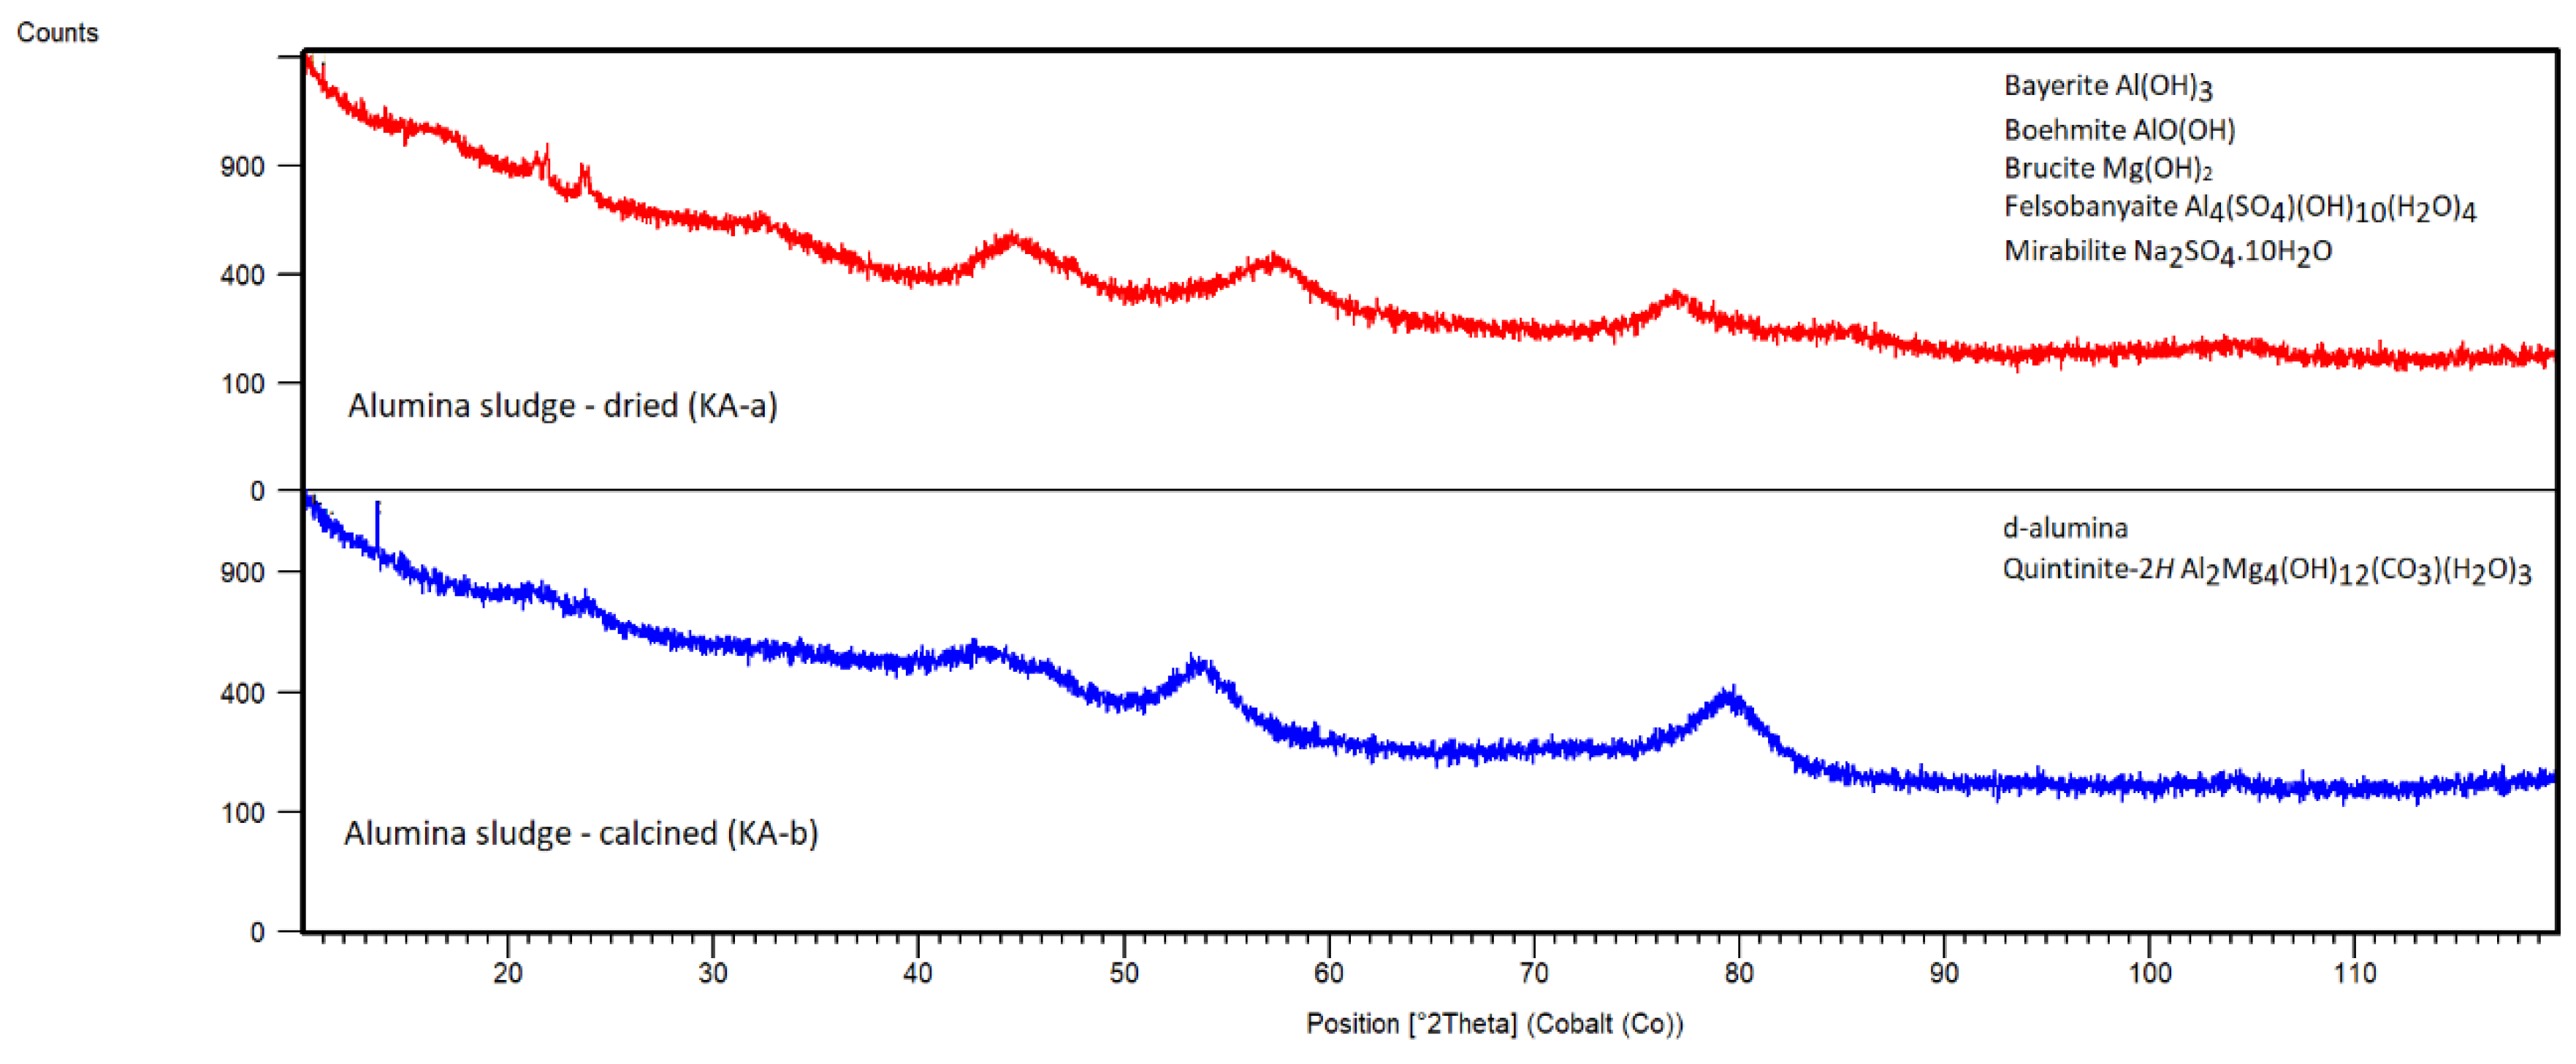
Figure 10.
The comparison of adsorption capacities for a) Cl- and b) Ca2+ removal from synthetic solution and real wastewater (Experimental conditions: V=100 ml, Cs = 30 g/l, t = 24 hrs).
Figure 10.
The comparison of adsorption capacities for a) Cl- and b) Ca2+ removal from synthetic solution and real wastewater (Experimental conditions: V=100 ml, Cs = 30 g/l, t = 24 hrs).
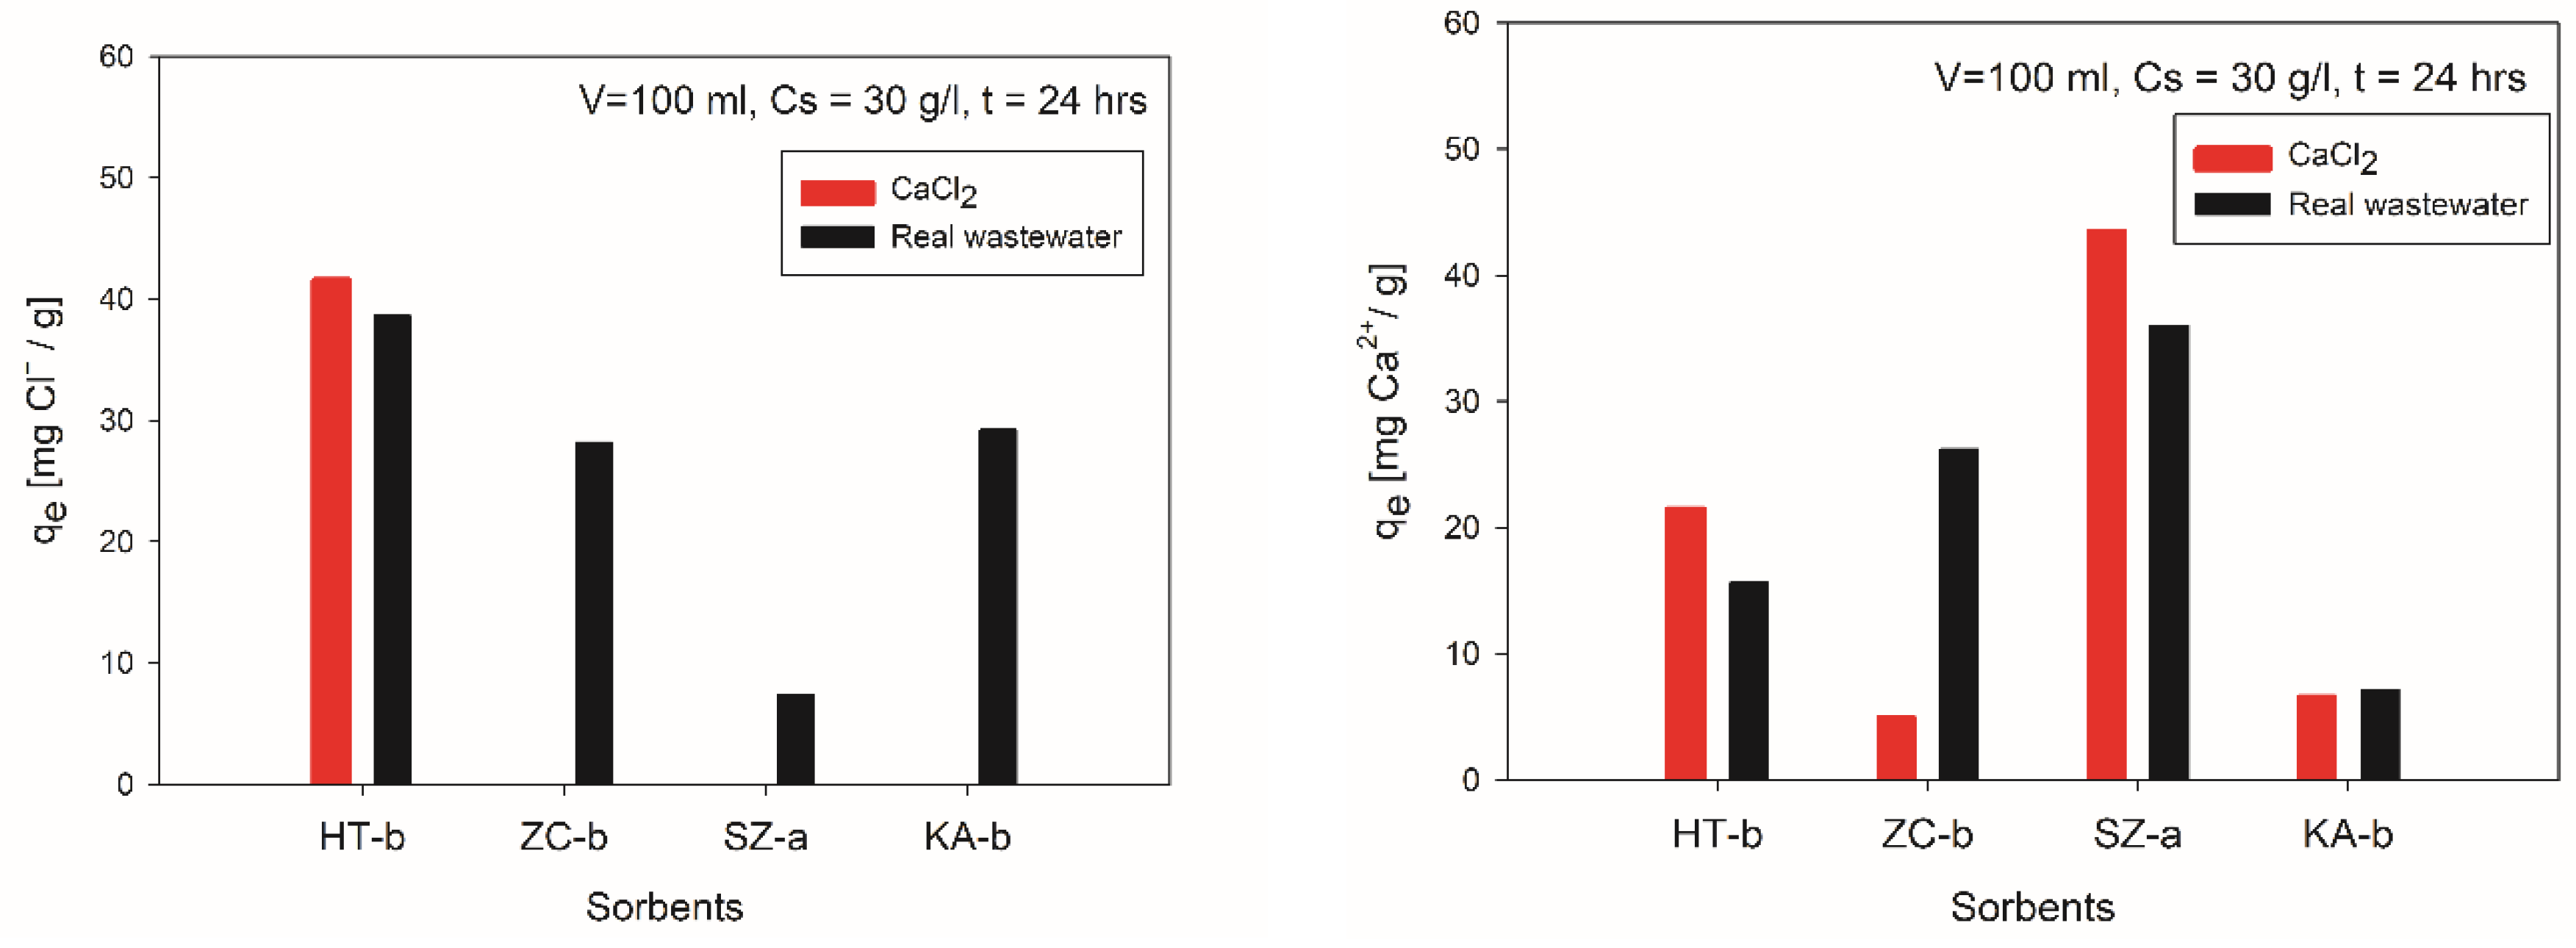
Figure 11.
XRD pattern of HT-c after sorption from the synthetic solution, HT-d from EAFD wastewater.
Figure 11.
XRD pattern of HT-c after sorption from the synthetic solution, HT-d from EAFD wastewater.
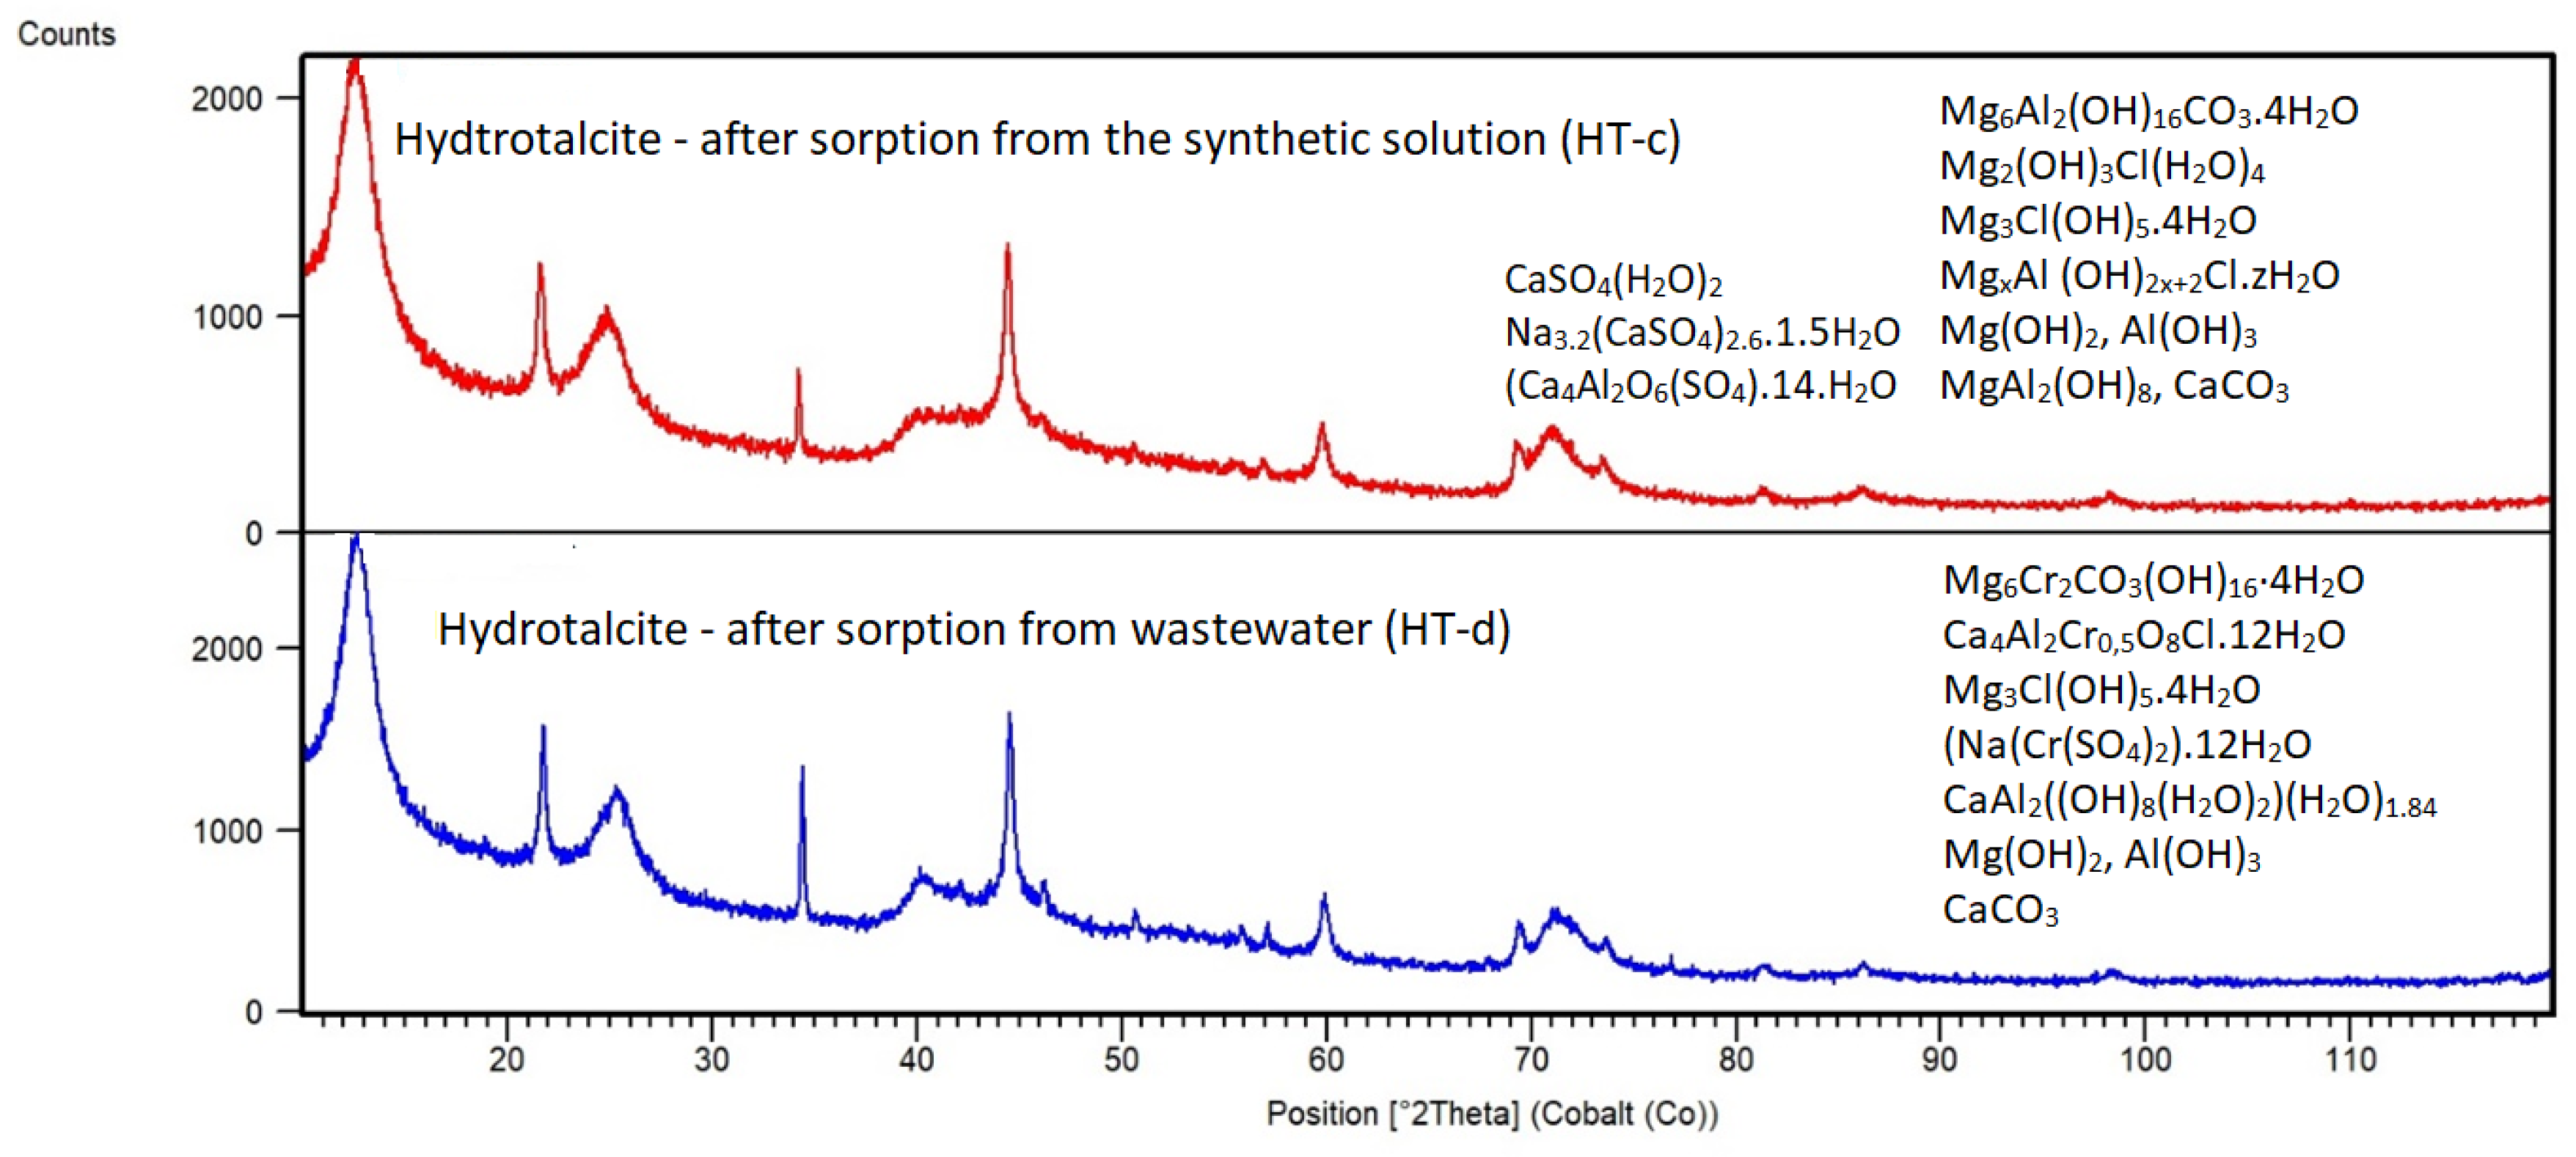
Figure 12.
LIBS analysis of two different places (a, b) of HT-c sorbent after sorption from the synthetic solution.
Figure 12.
LIBS analysis of two different places (a, b) of HT-c sorbent after sorption from the synthetic solution.
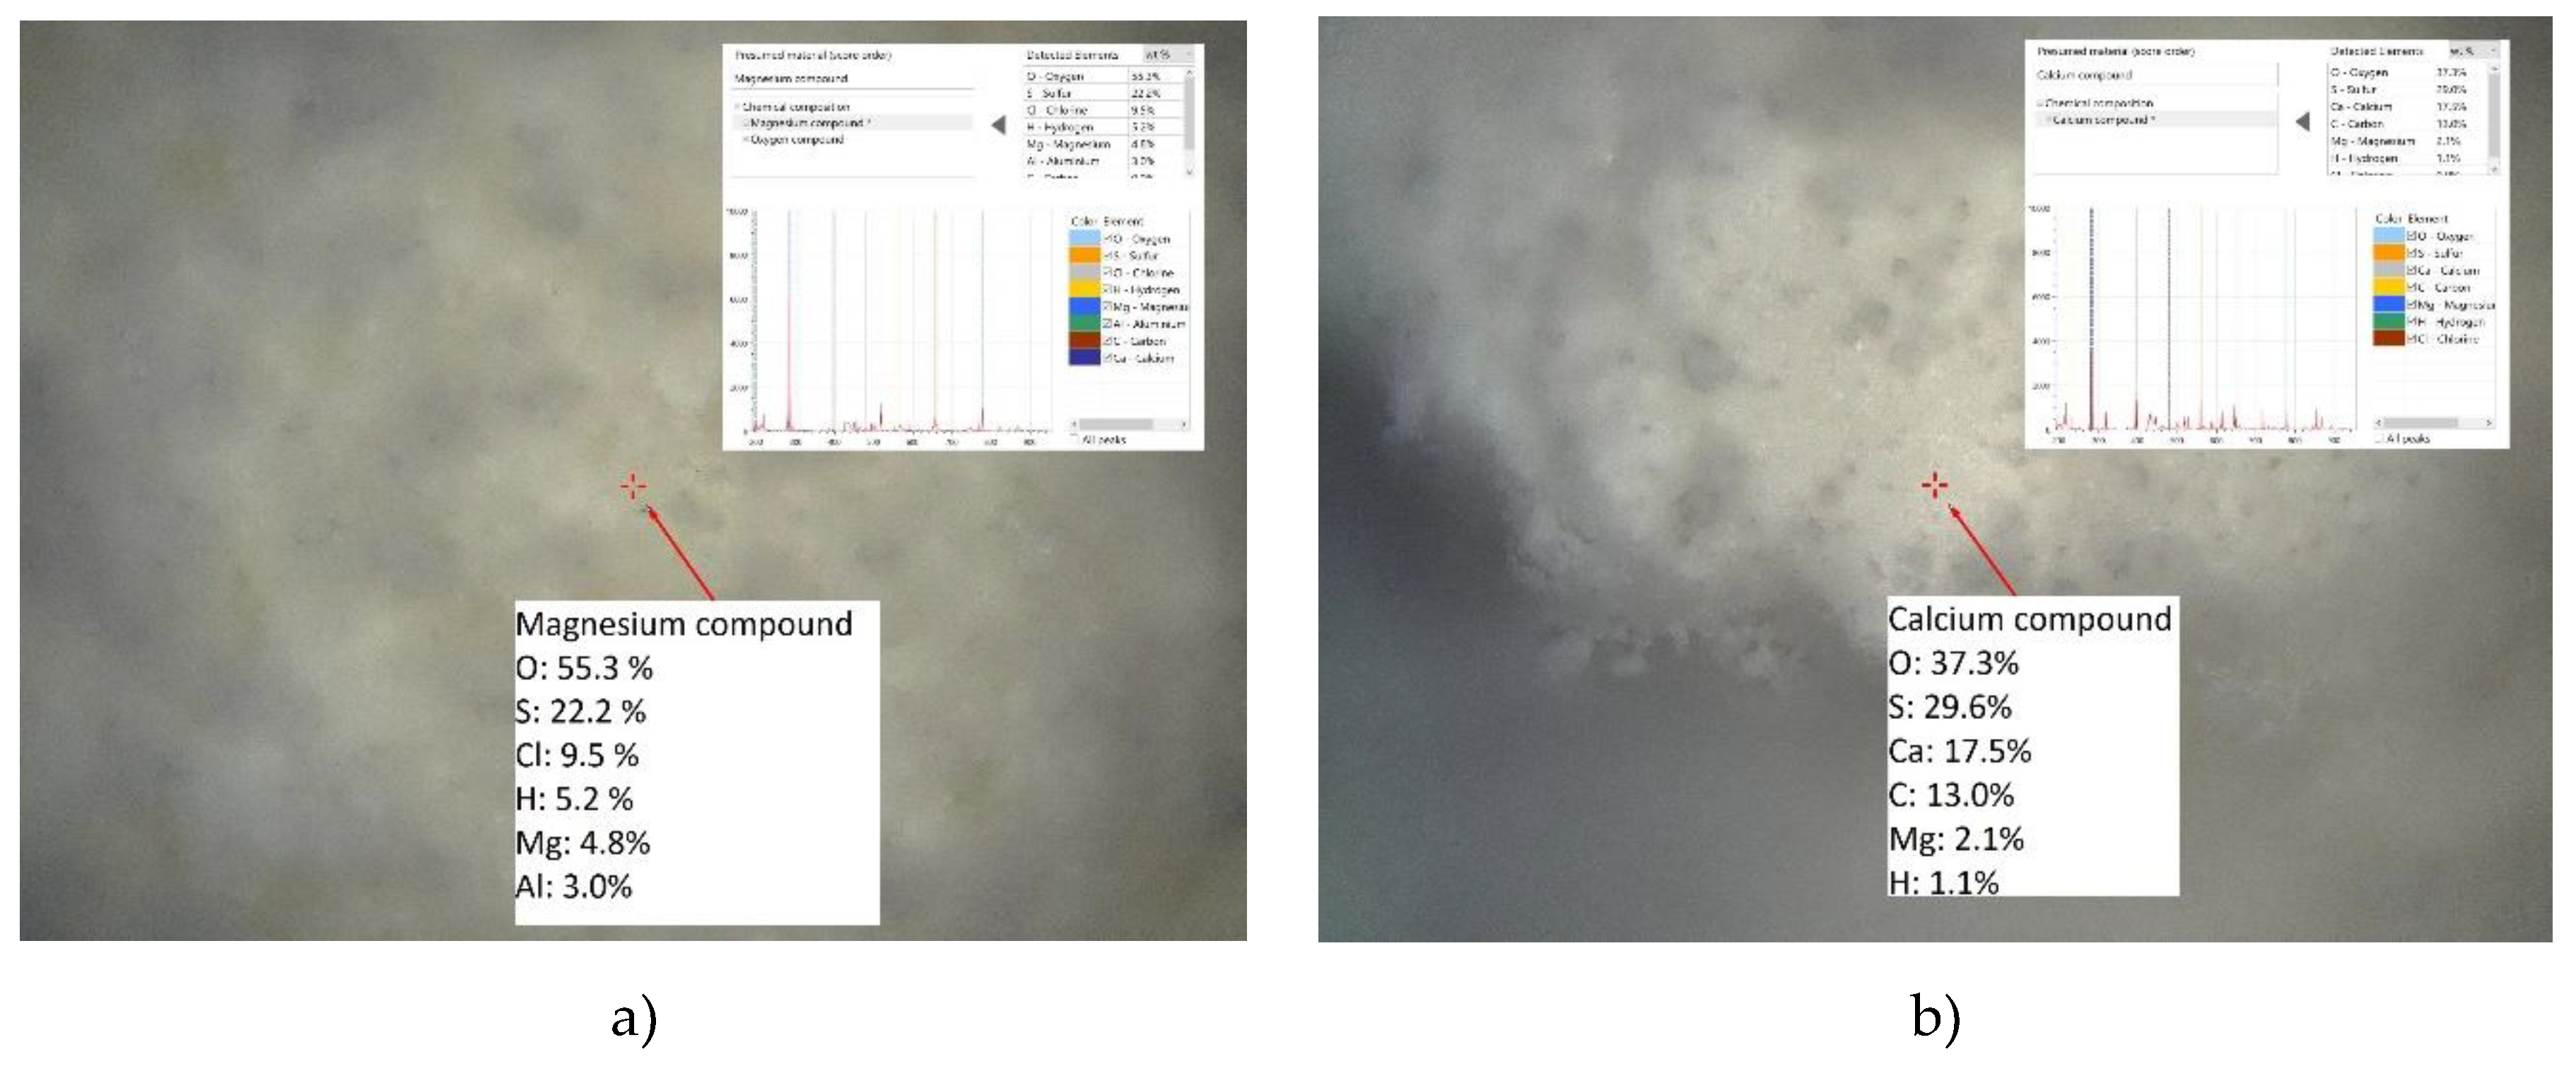
Figure 13.
LIBS analysis of two different places (a,b) of HT-d sorbent after sorption from wastewater.
Figure 13.
LIBS analysis of two different places (a,b) of HT-d sorbent after sorption from wastewater.
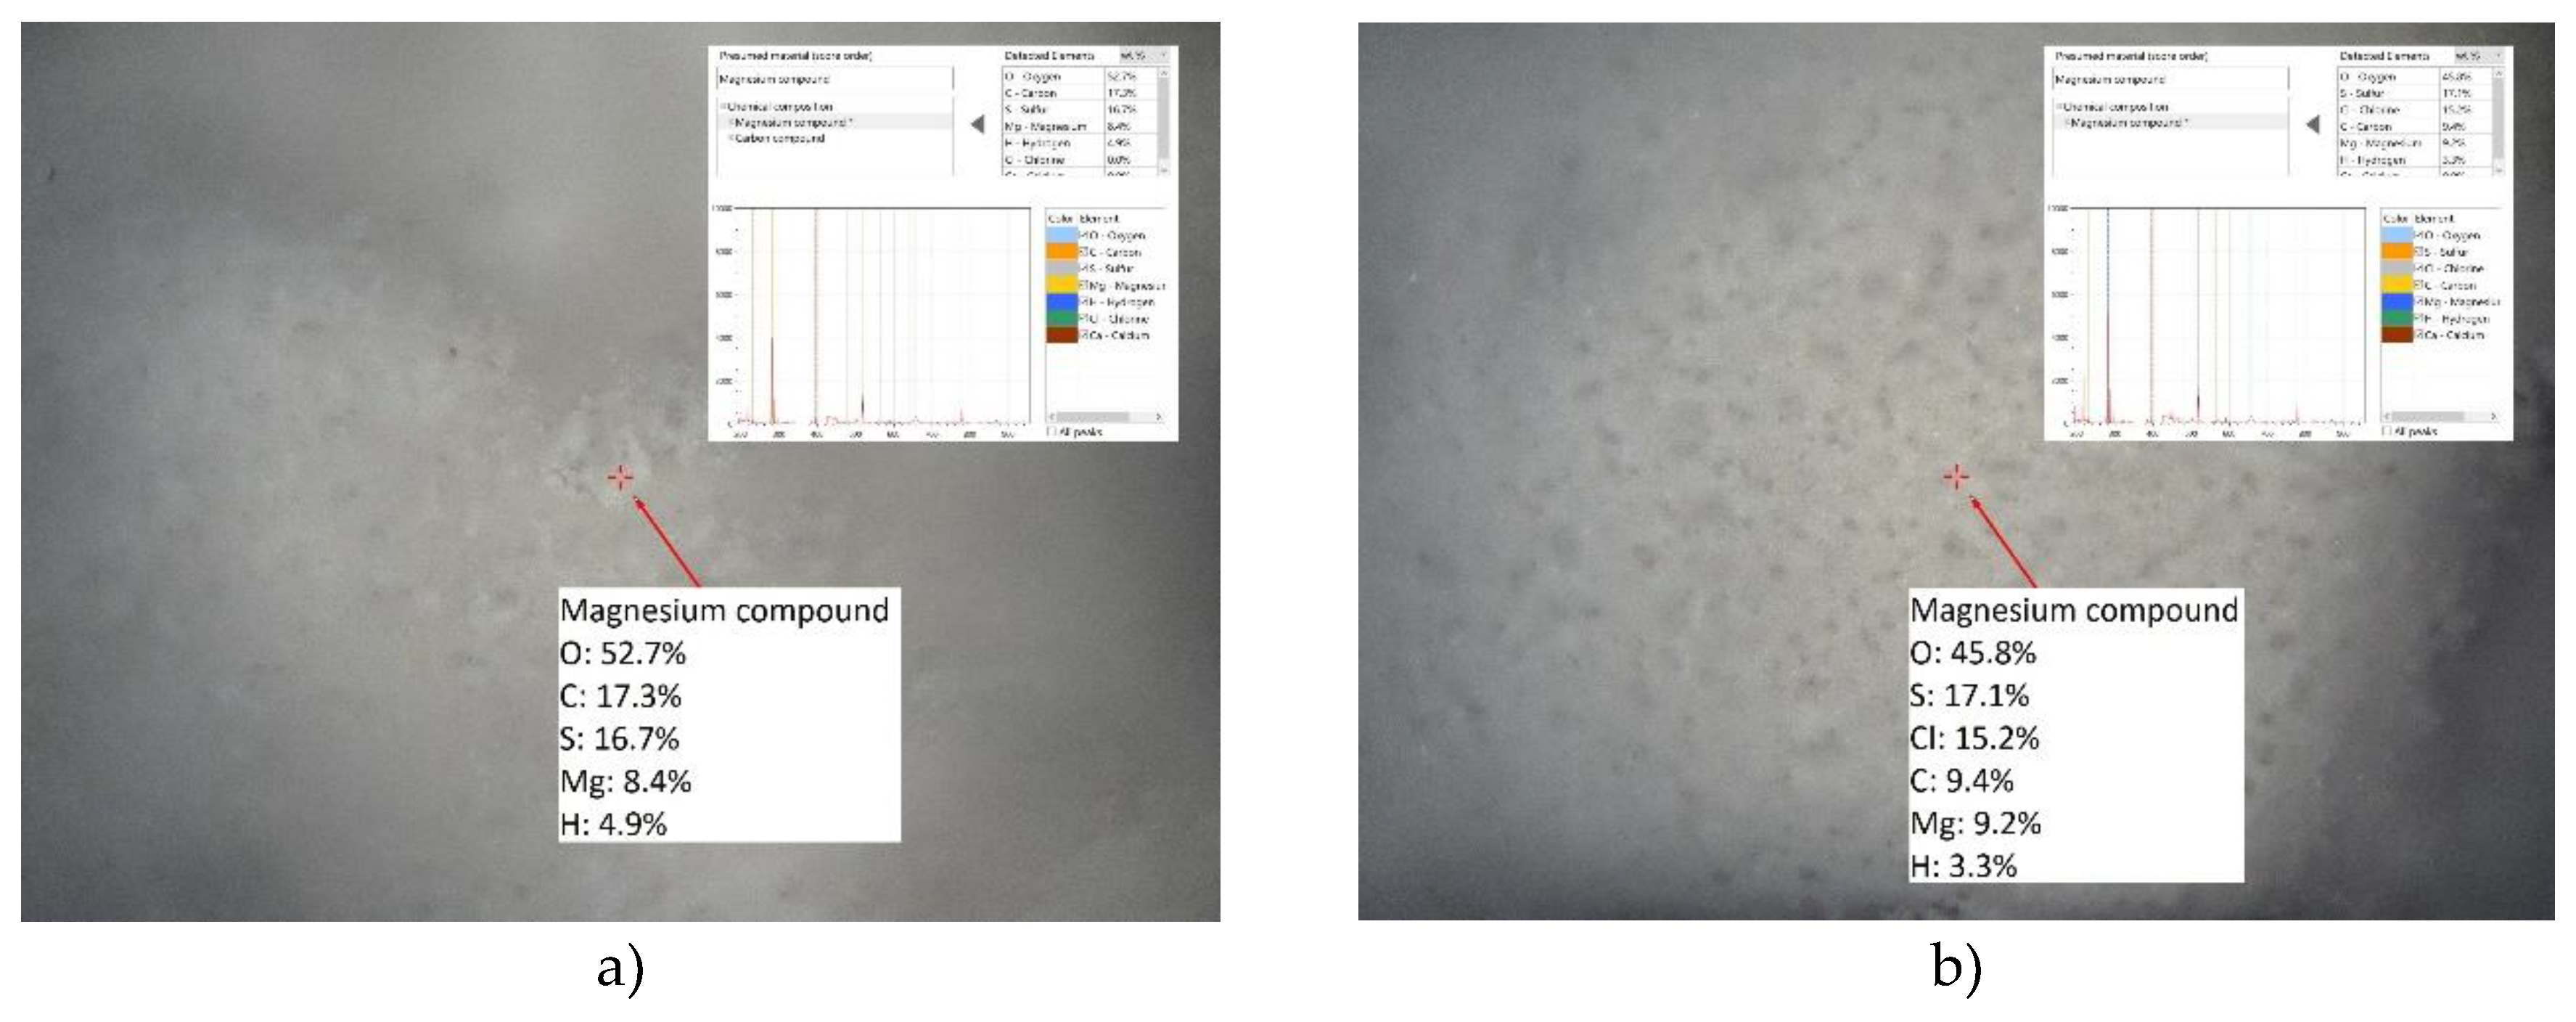
Figure 14.
SEM picture of HT-c: a) visible adsorbed particles on the HT-c surface, b) cloudy-like structure of rehydrated HT-c with adsorbed Ca and Cl species in the interlayer space.
Figure 14.
SEM picture of HT-c: a) visible adsorbed particles on the HT-c surface, b) cloudy-like structure of rehydrated HT-c with adsorbed Ca and Cl species in the interlayer space.
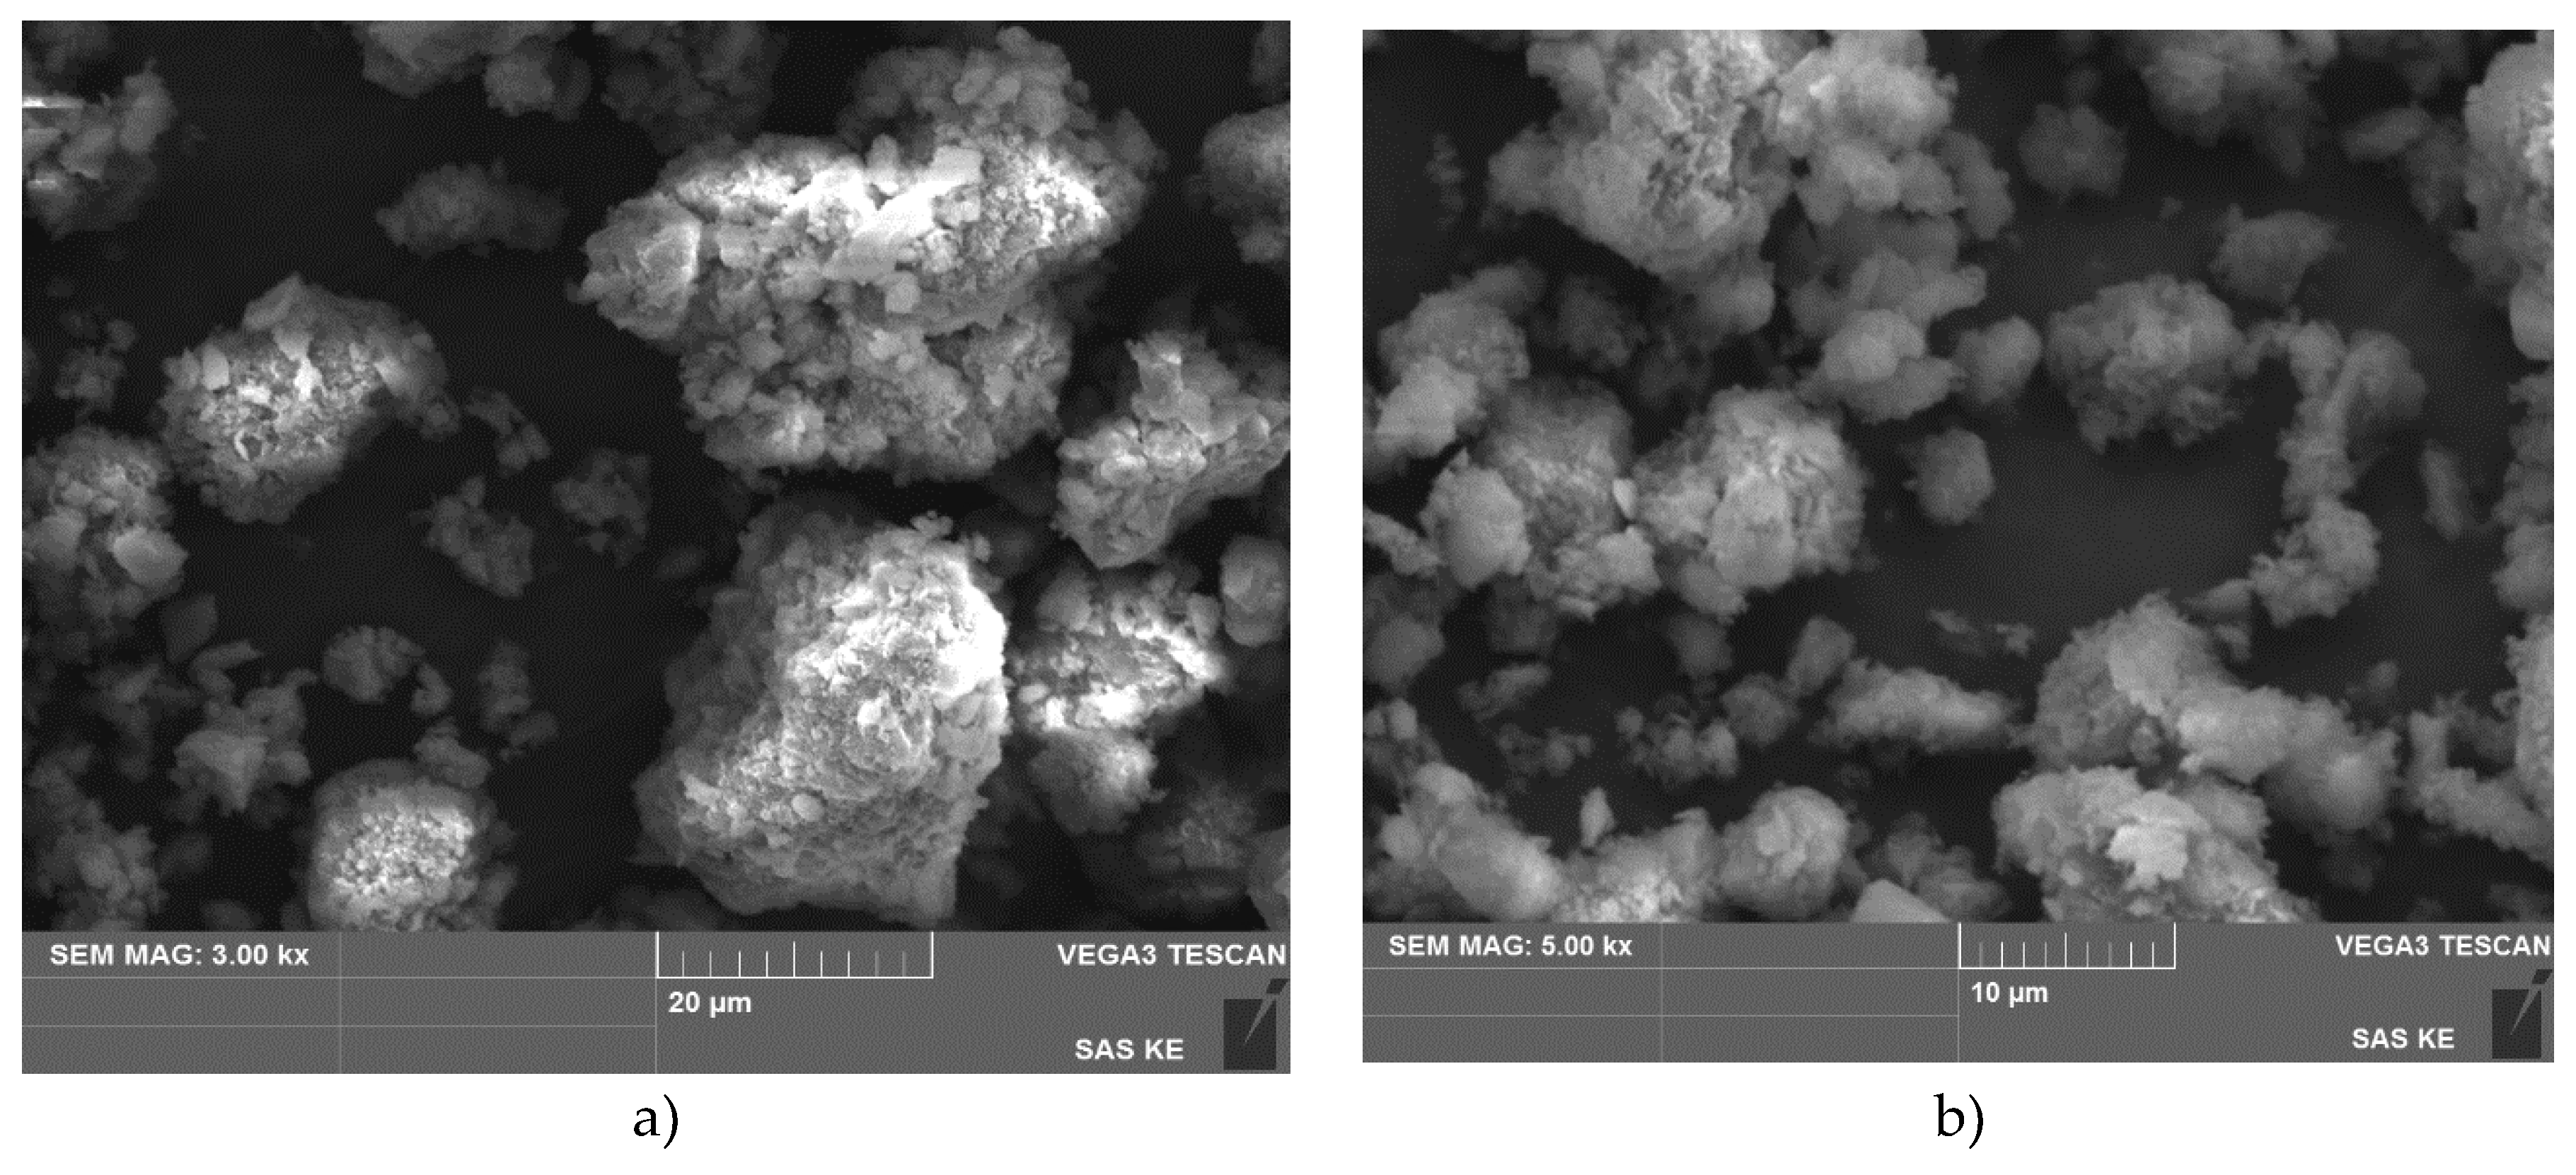
Figure 15.
a) SEM picture of HT-d, b) elemental map of HT-d.
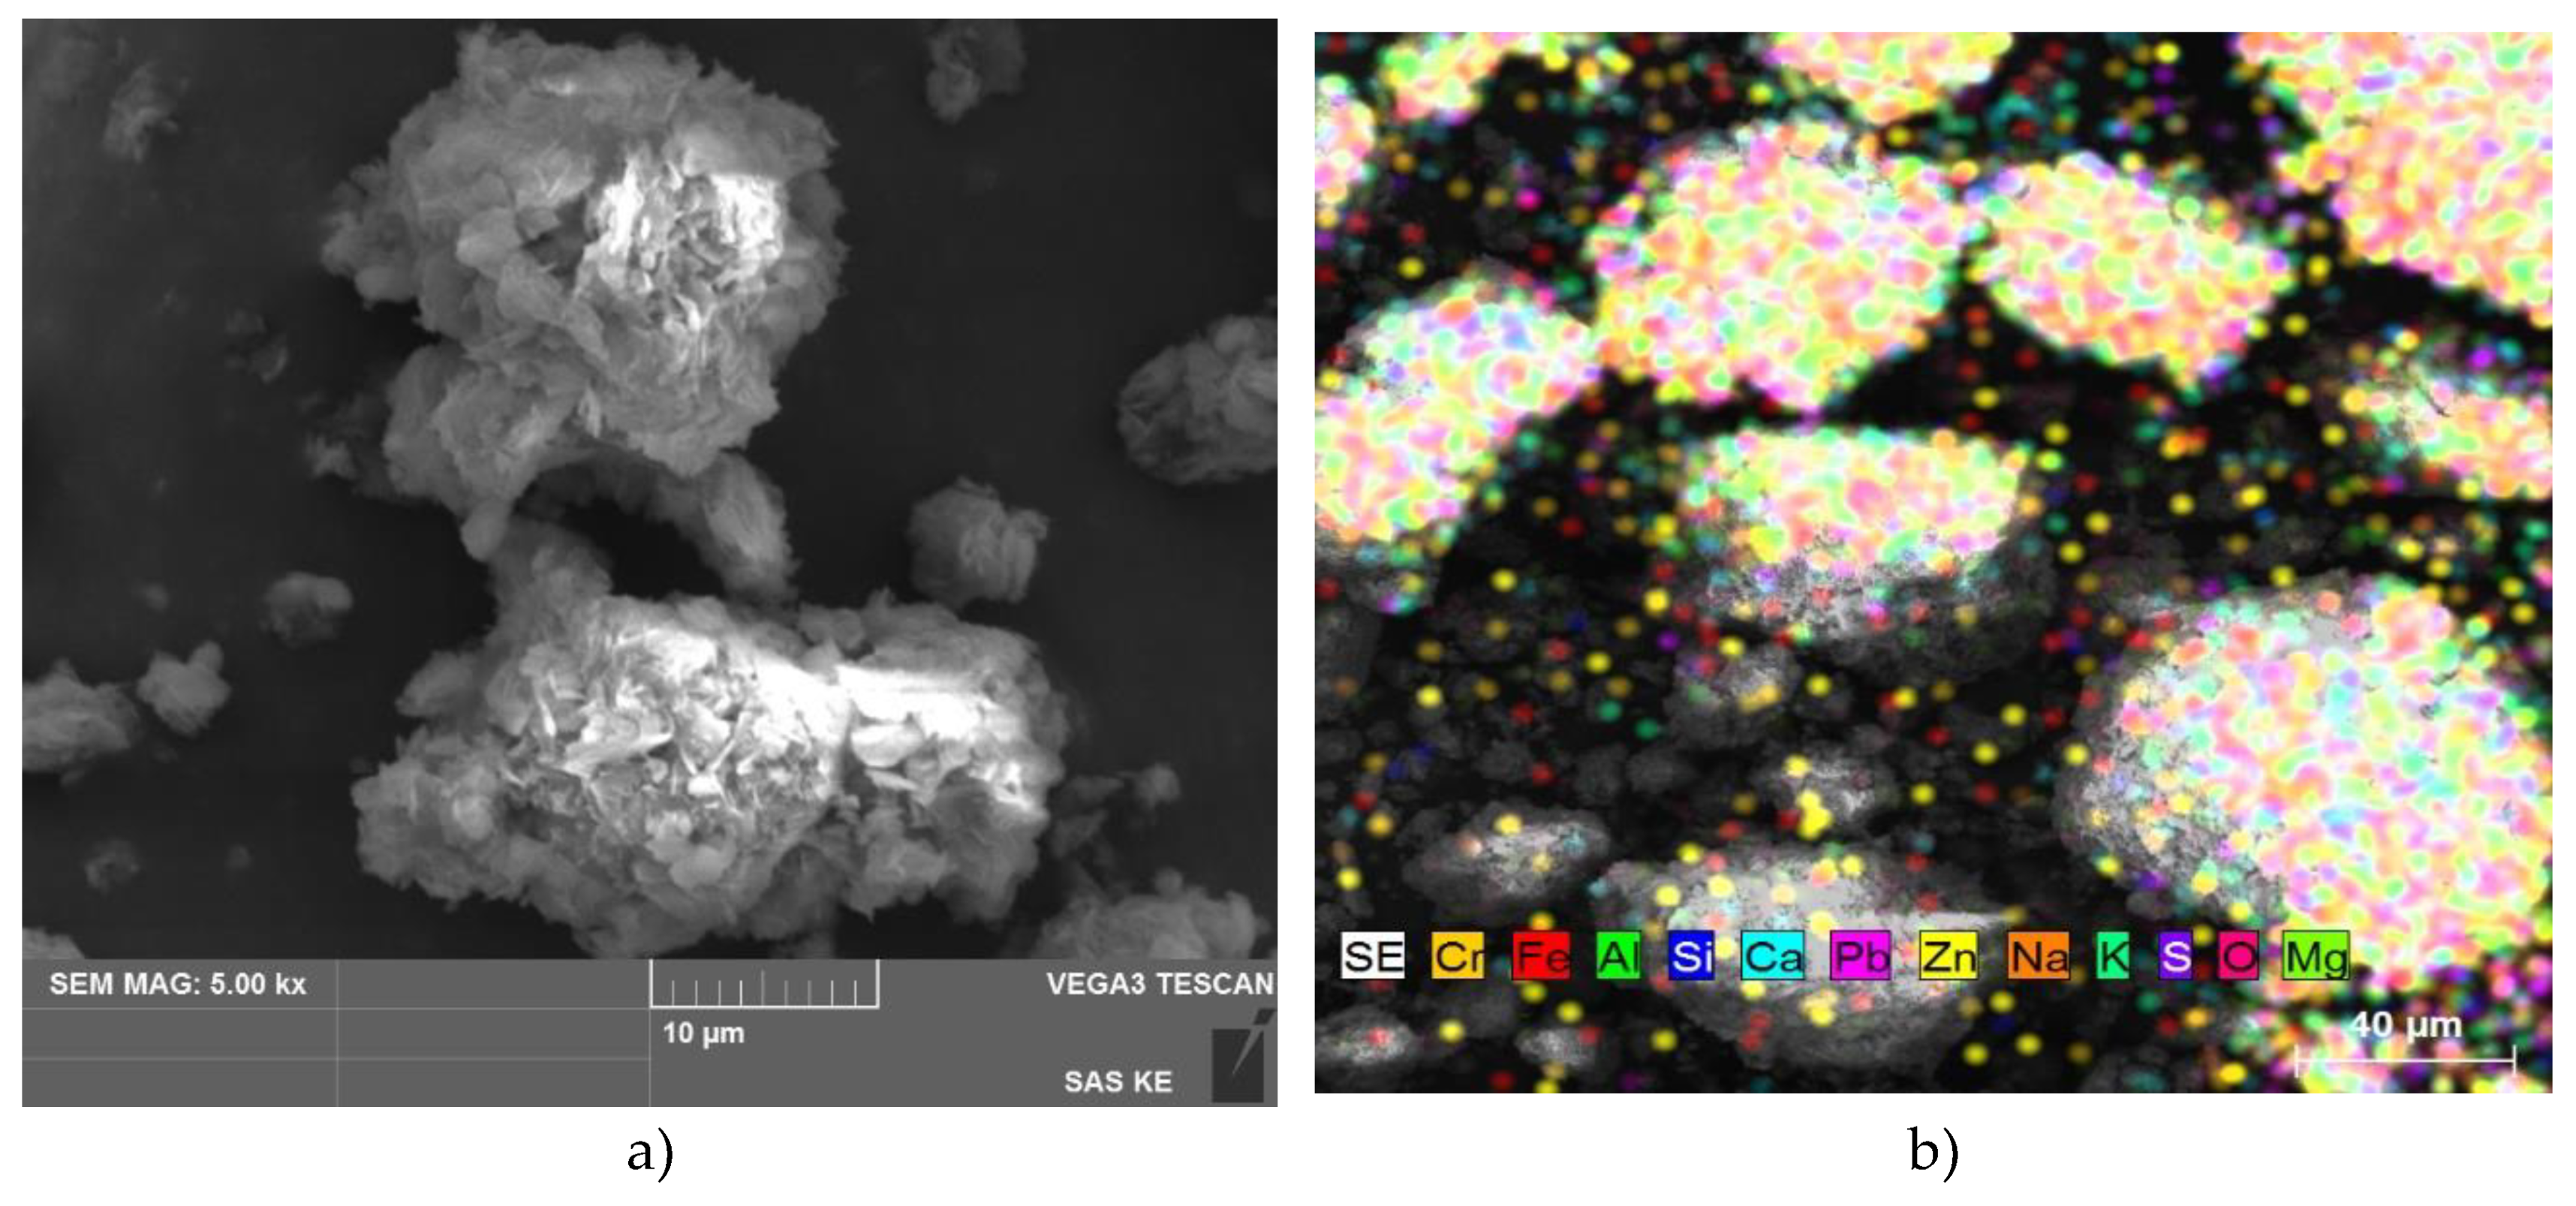
Figure 16.
FTIR spectra of sample HT-a synthetized, HT-b calcined at 500°C, HT-c after sorption from the synthetic solution, HT-d from real wastewater.
Figure 16.
FTIR spectra of sample HT-a synthetized, HT-b calcined at 500°C, HT-c after sorption from the synthetic solution, HT-d from real wastewater.
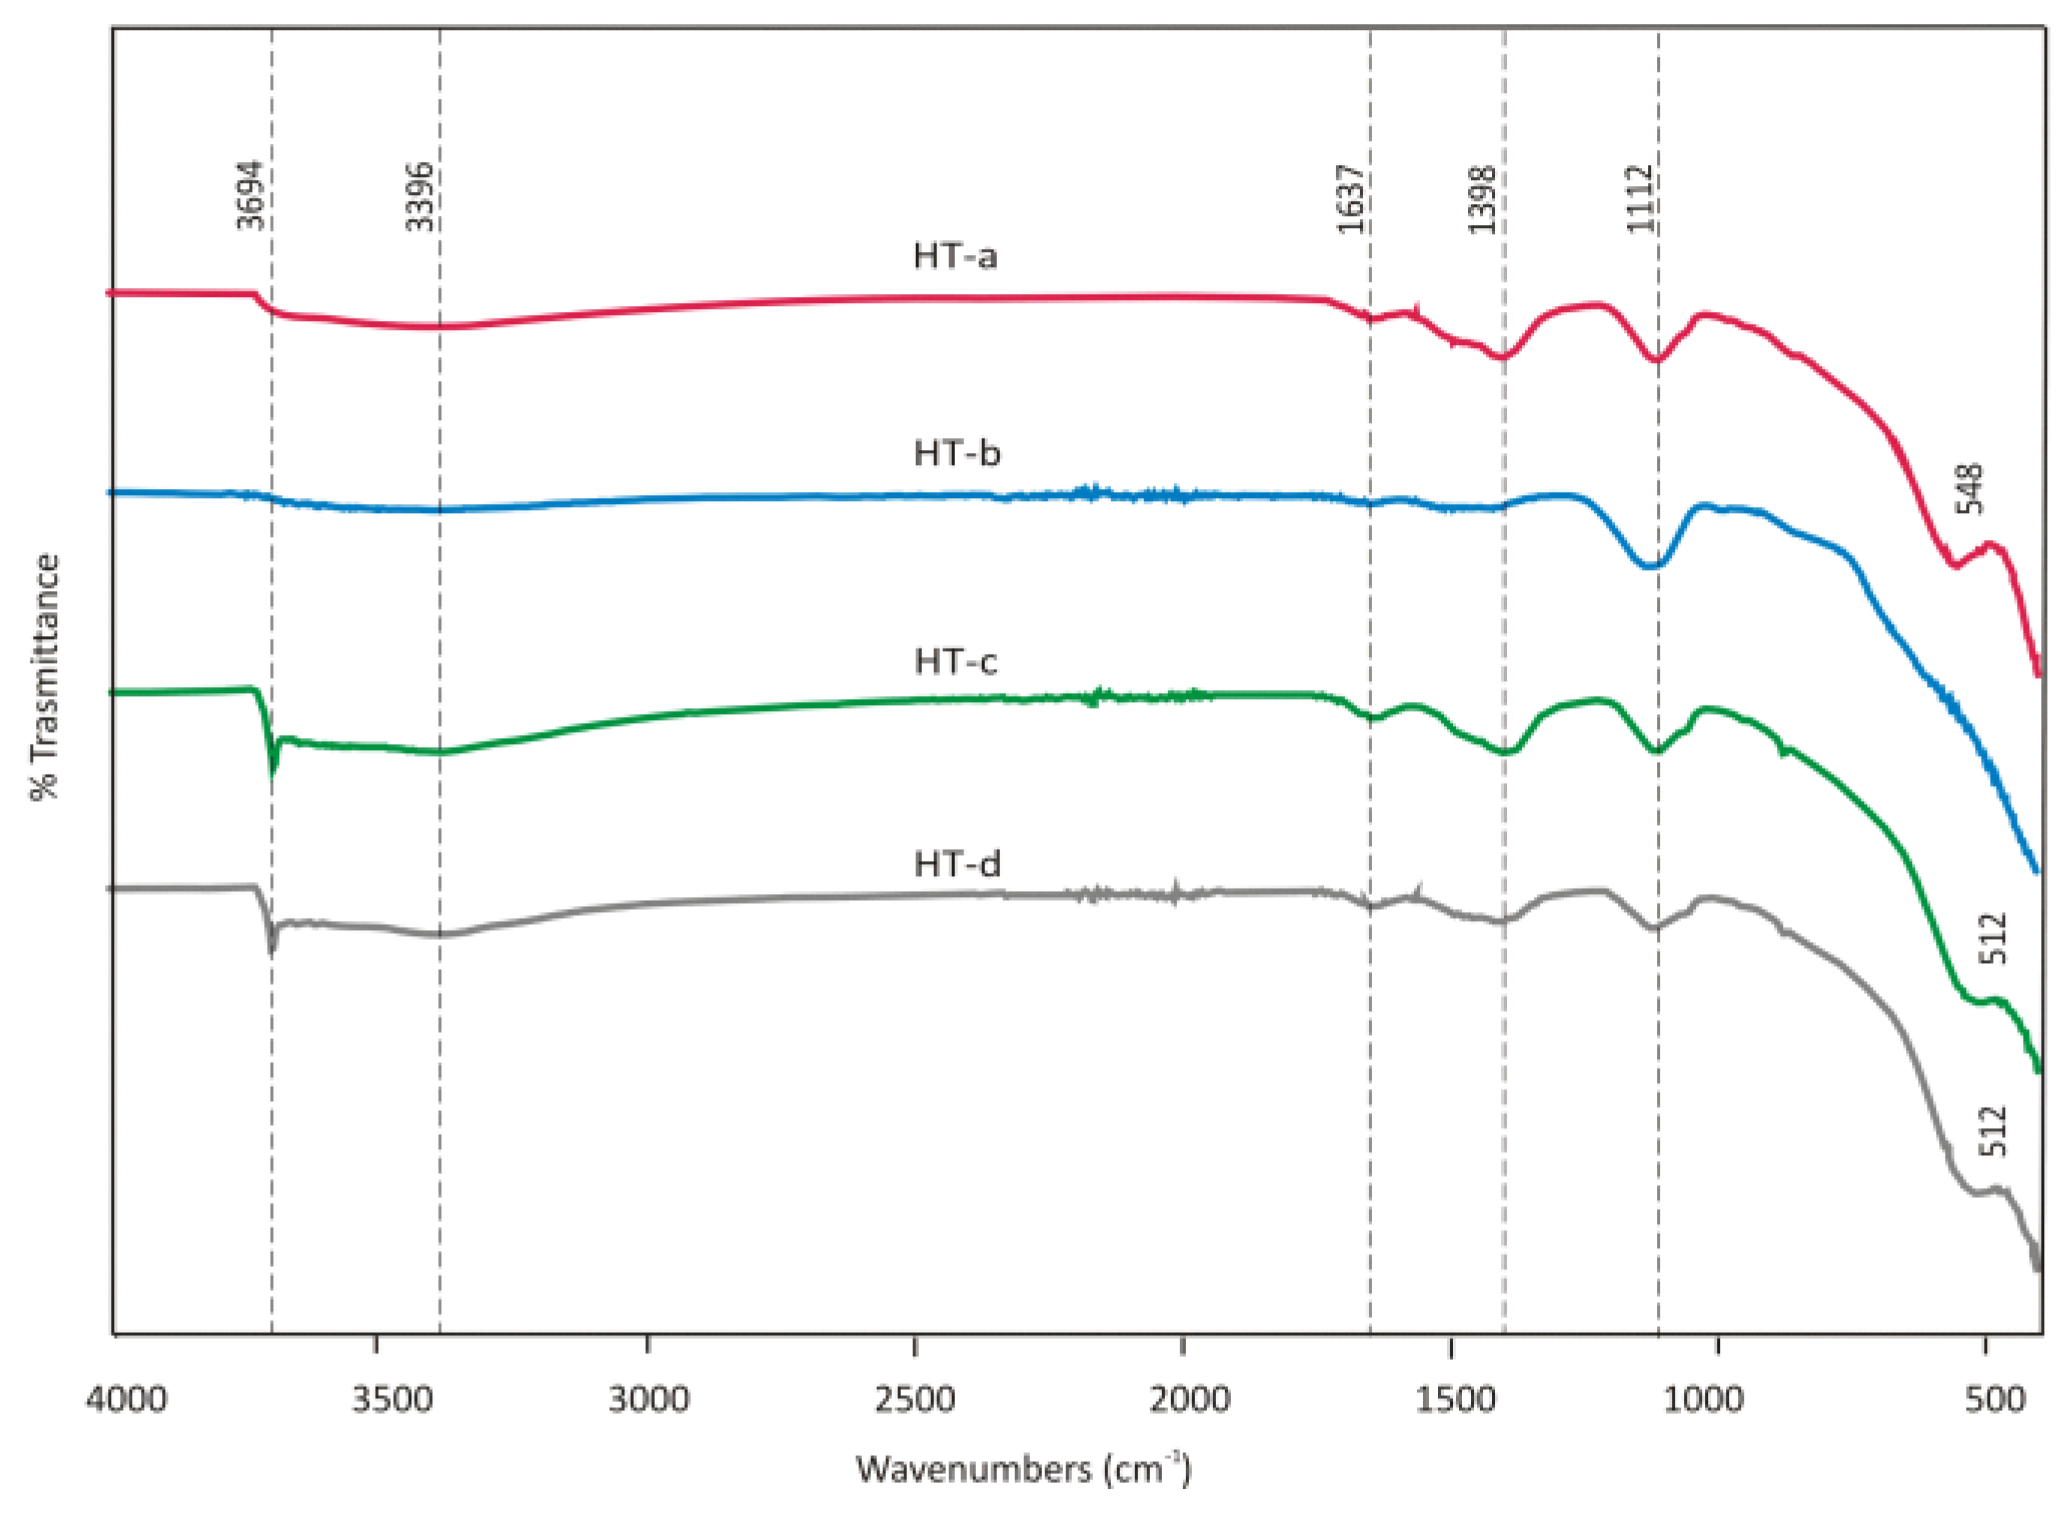
Figure 17.
XRD pattern of ZC-c after sorption from the synthetic solution, ZC-d from real wastewater.
Figure 17.
XRD pattern of ZC-c after sorption from the synthetic solution, ZC-d from real wastewater.
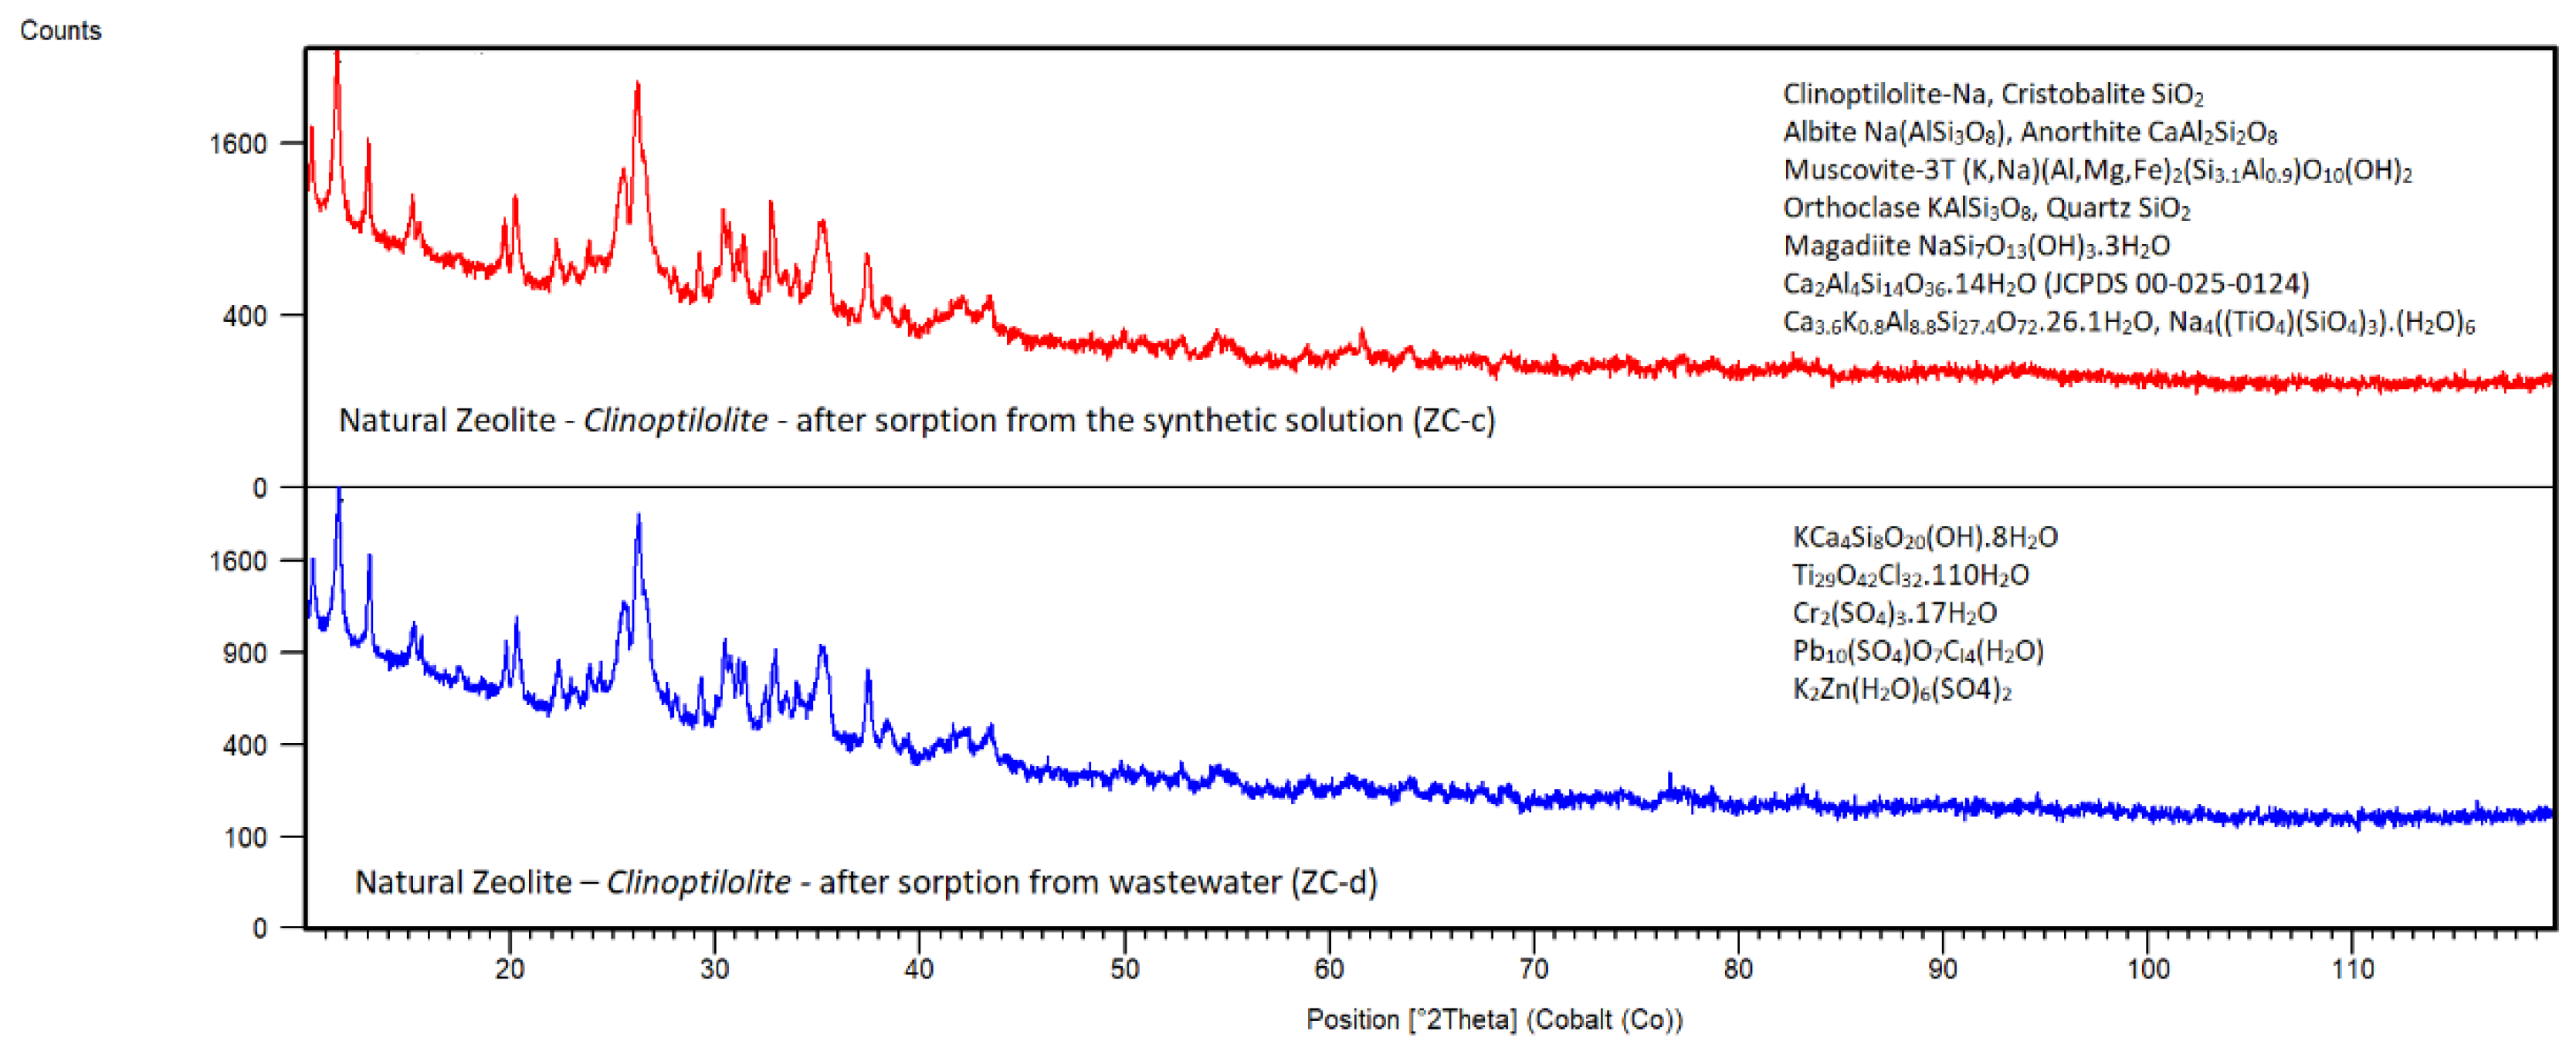
Figure 18.
FTIR spectra of sample ZC-b calcined at 500 °C, ZC-c after sorption from the synthetic solution, ZC-d from real wastewater.
Figure 18.
FTIR spectra of sample ZC-b calcined at 500 °C, ZC-c after sorption from the synthetic solution, ZC-d from real wastewater.
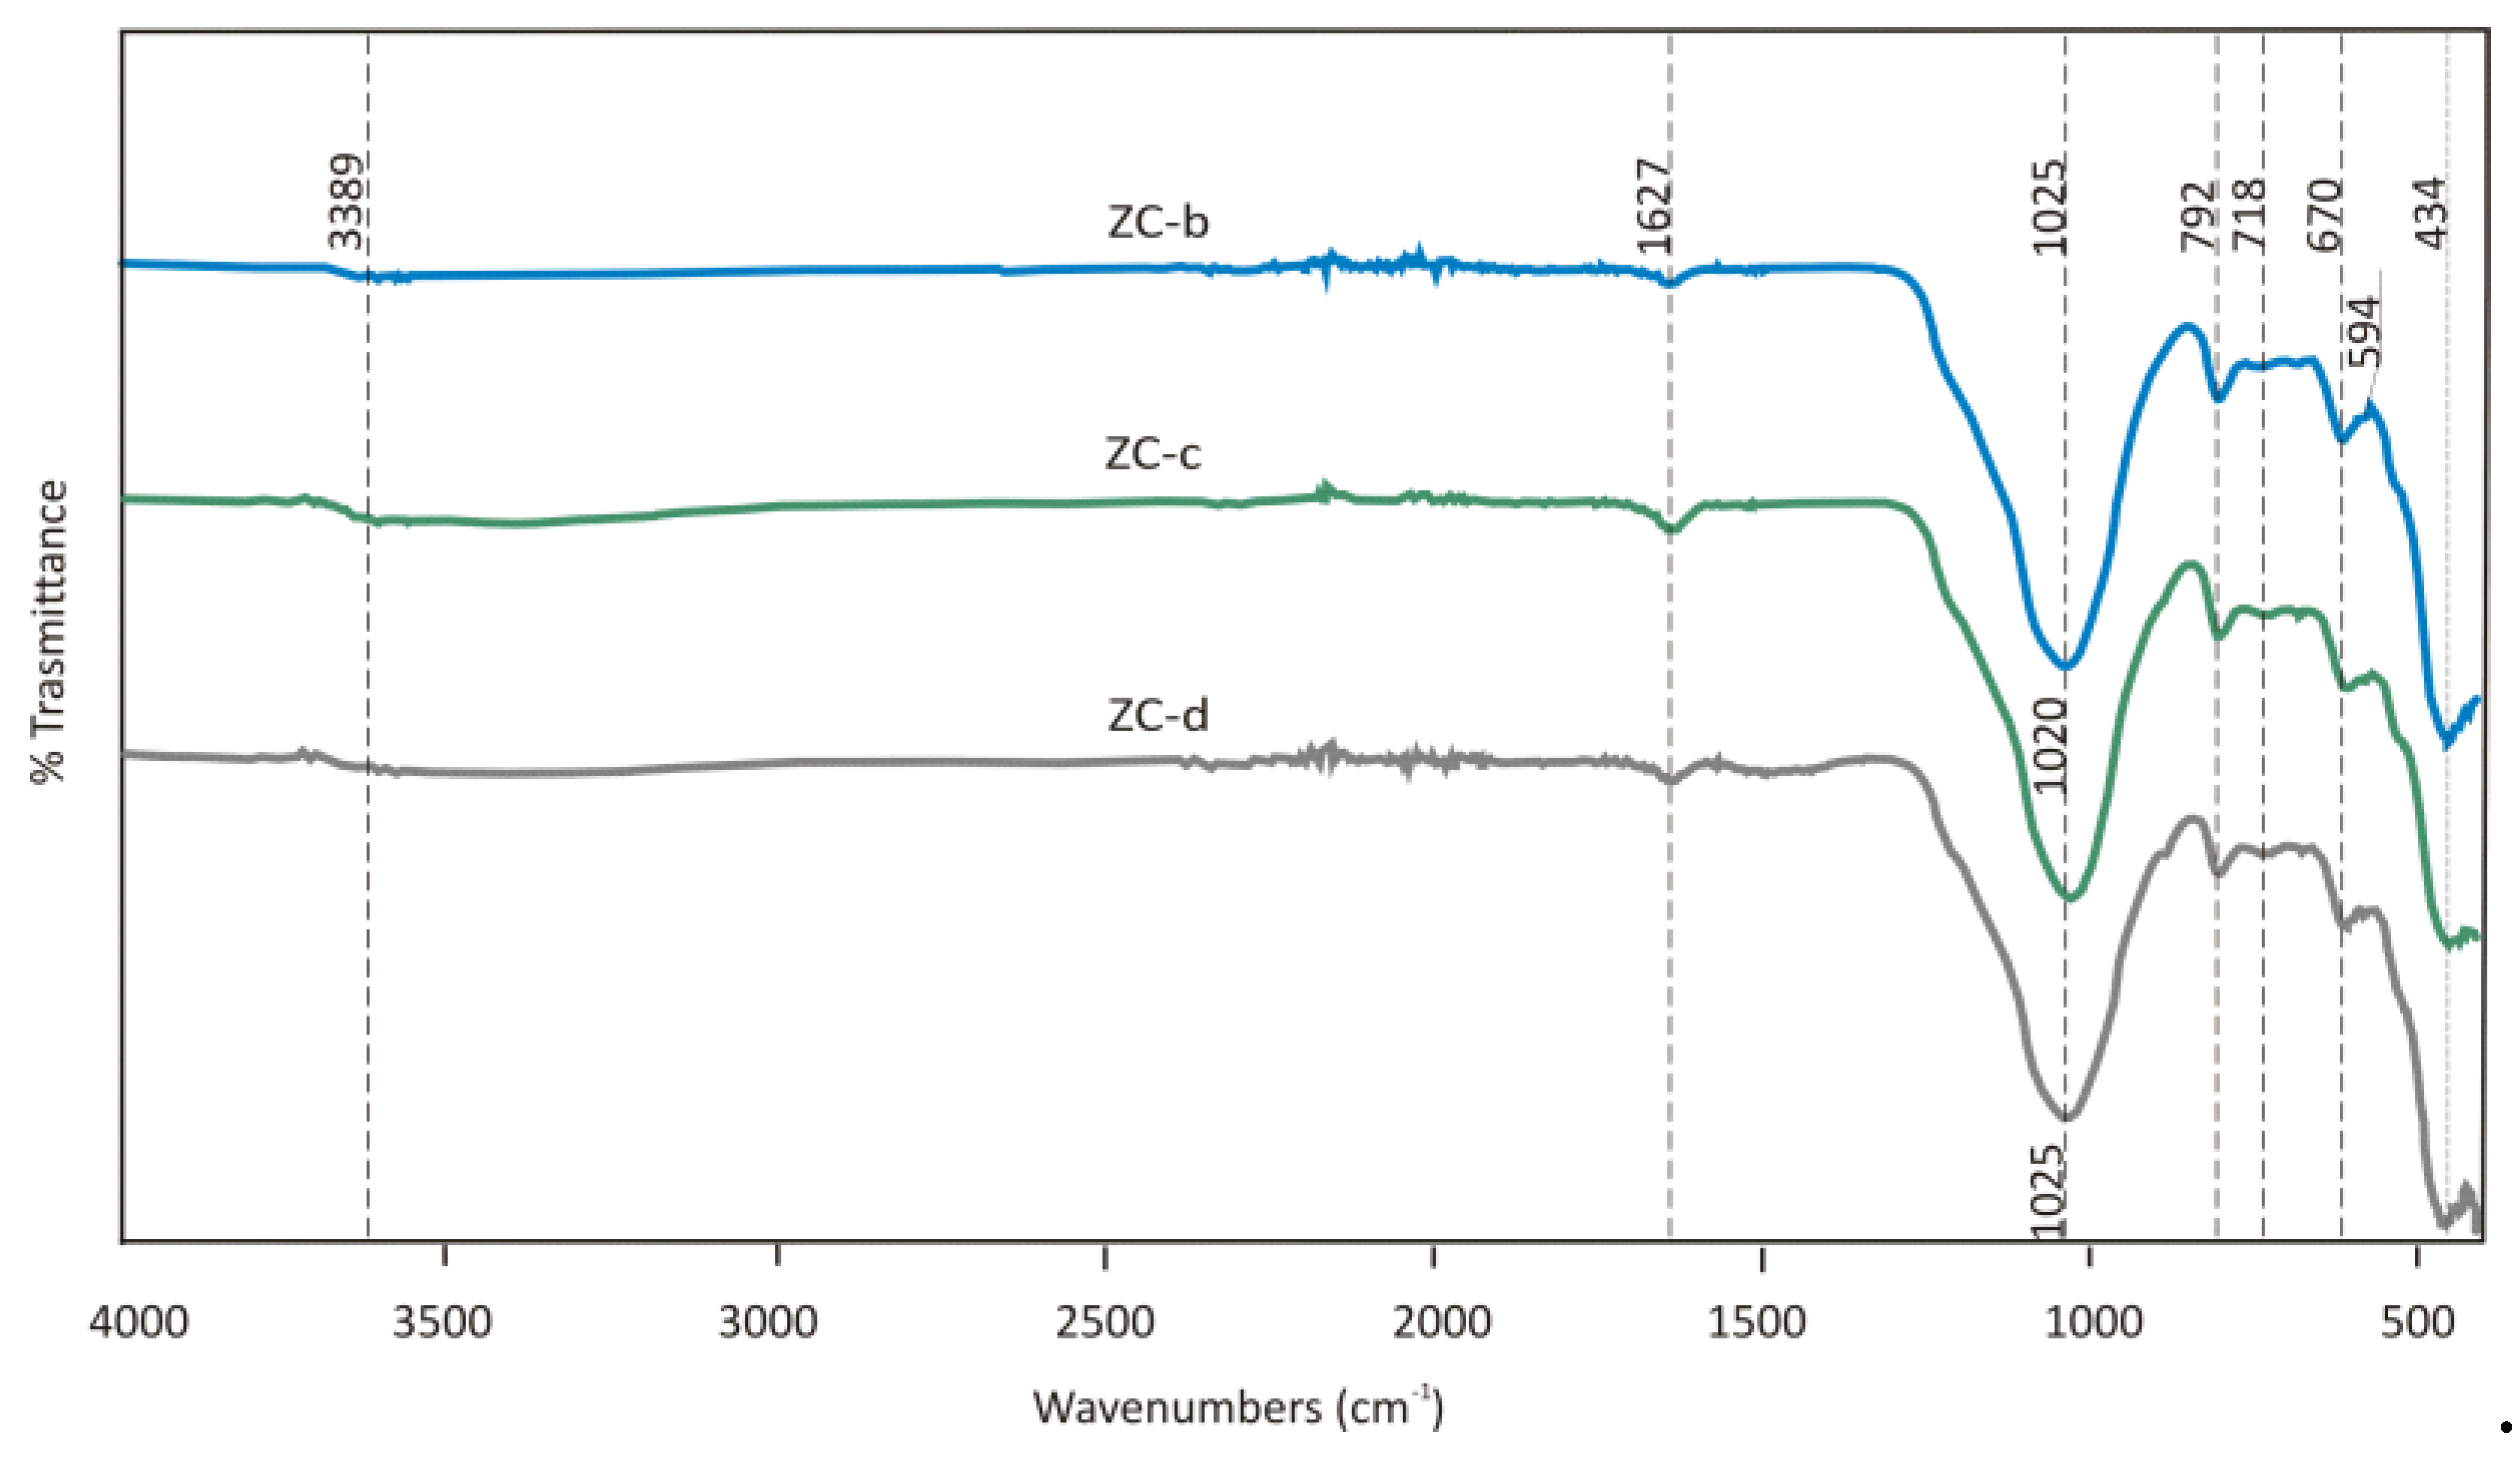
Figure 19.
XRD pattern of SZ-c after sorption from the synthetic solution, SZ-d from real wastewater.
Figure 19.
XRD pattern of SZ-c after sorption from the synthetic solution, SZ-d from real wastewater.
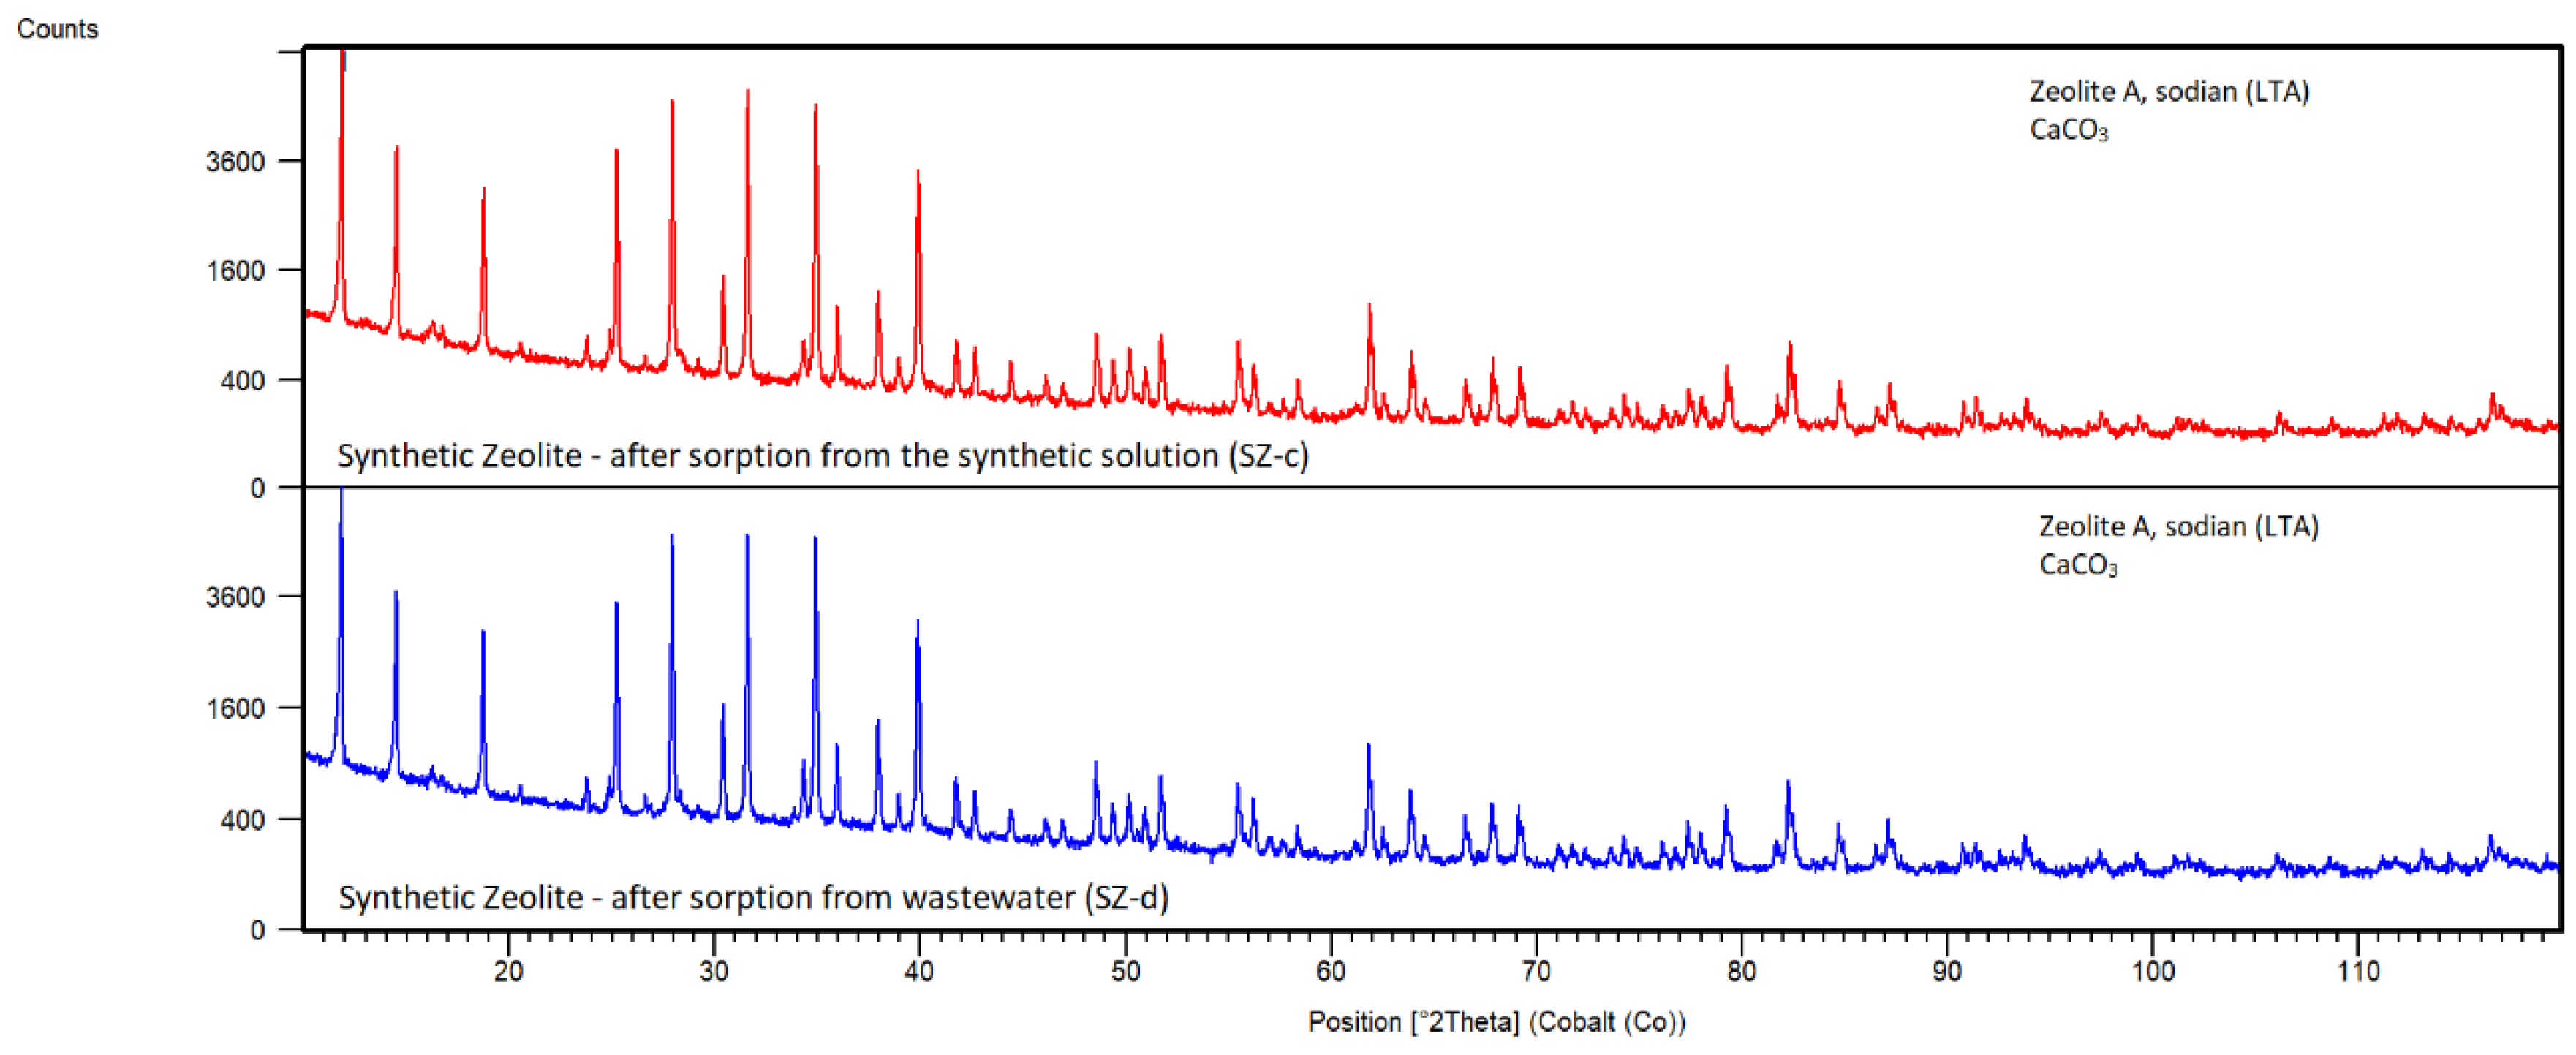
Figure 20.
FTIR spectra of sample SZ-a dried, SZ-c after sorption from the synthetic solution, SZ-d from EAFD wastewater.
Figure 20.
FTIR spectra of sample SZ-a dried, SZ-c after sorption from the synthetic solution, SZ-d from EAFD wastewater.
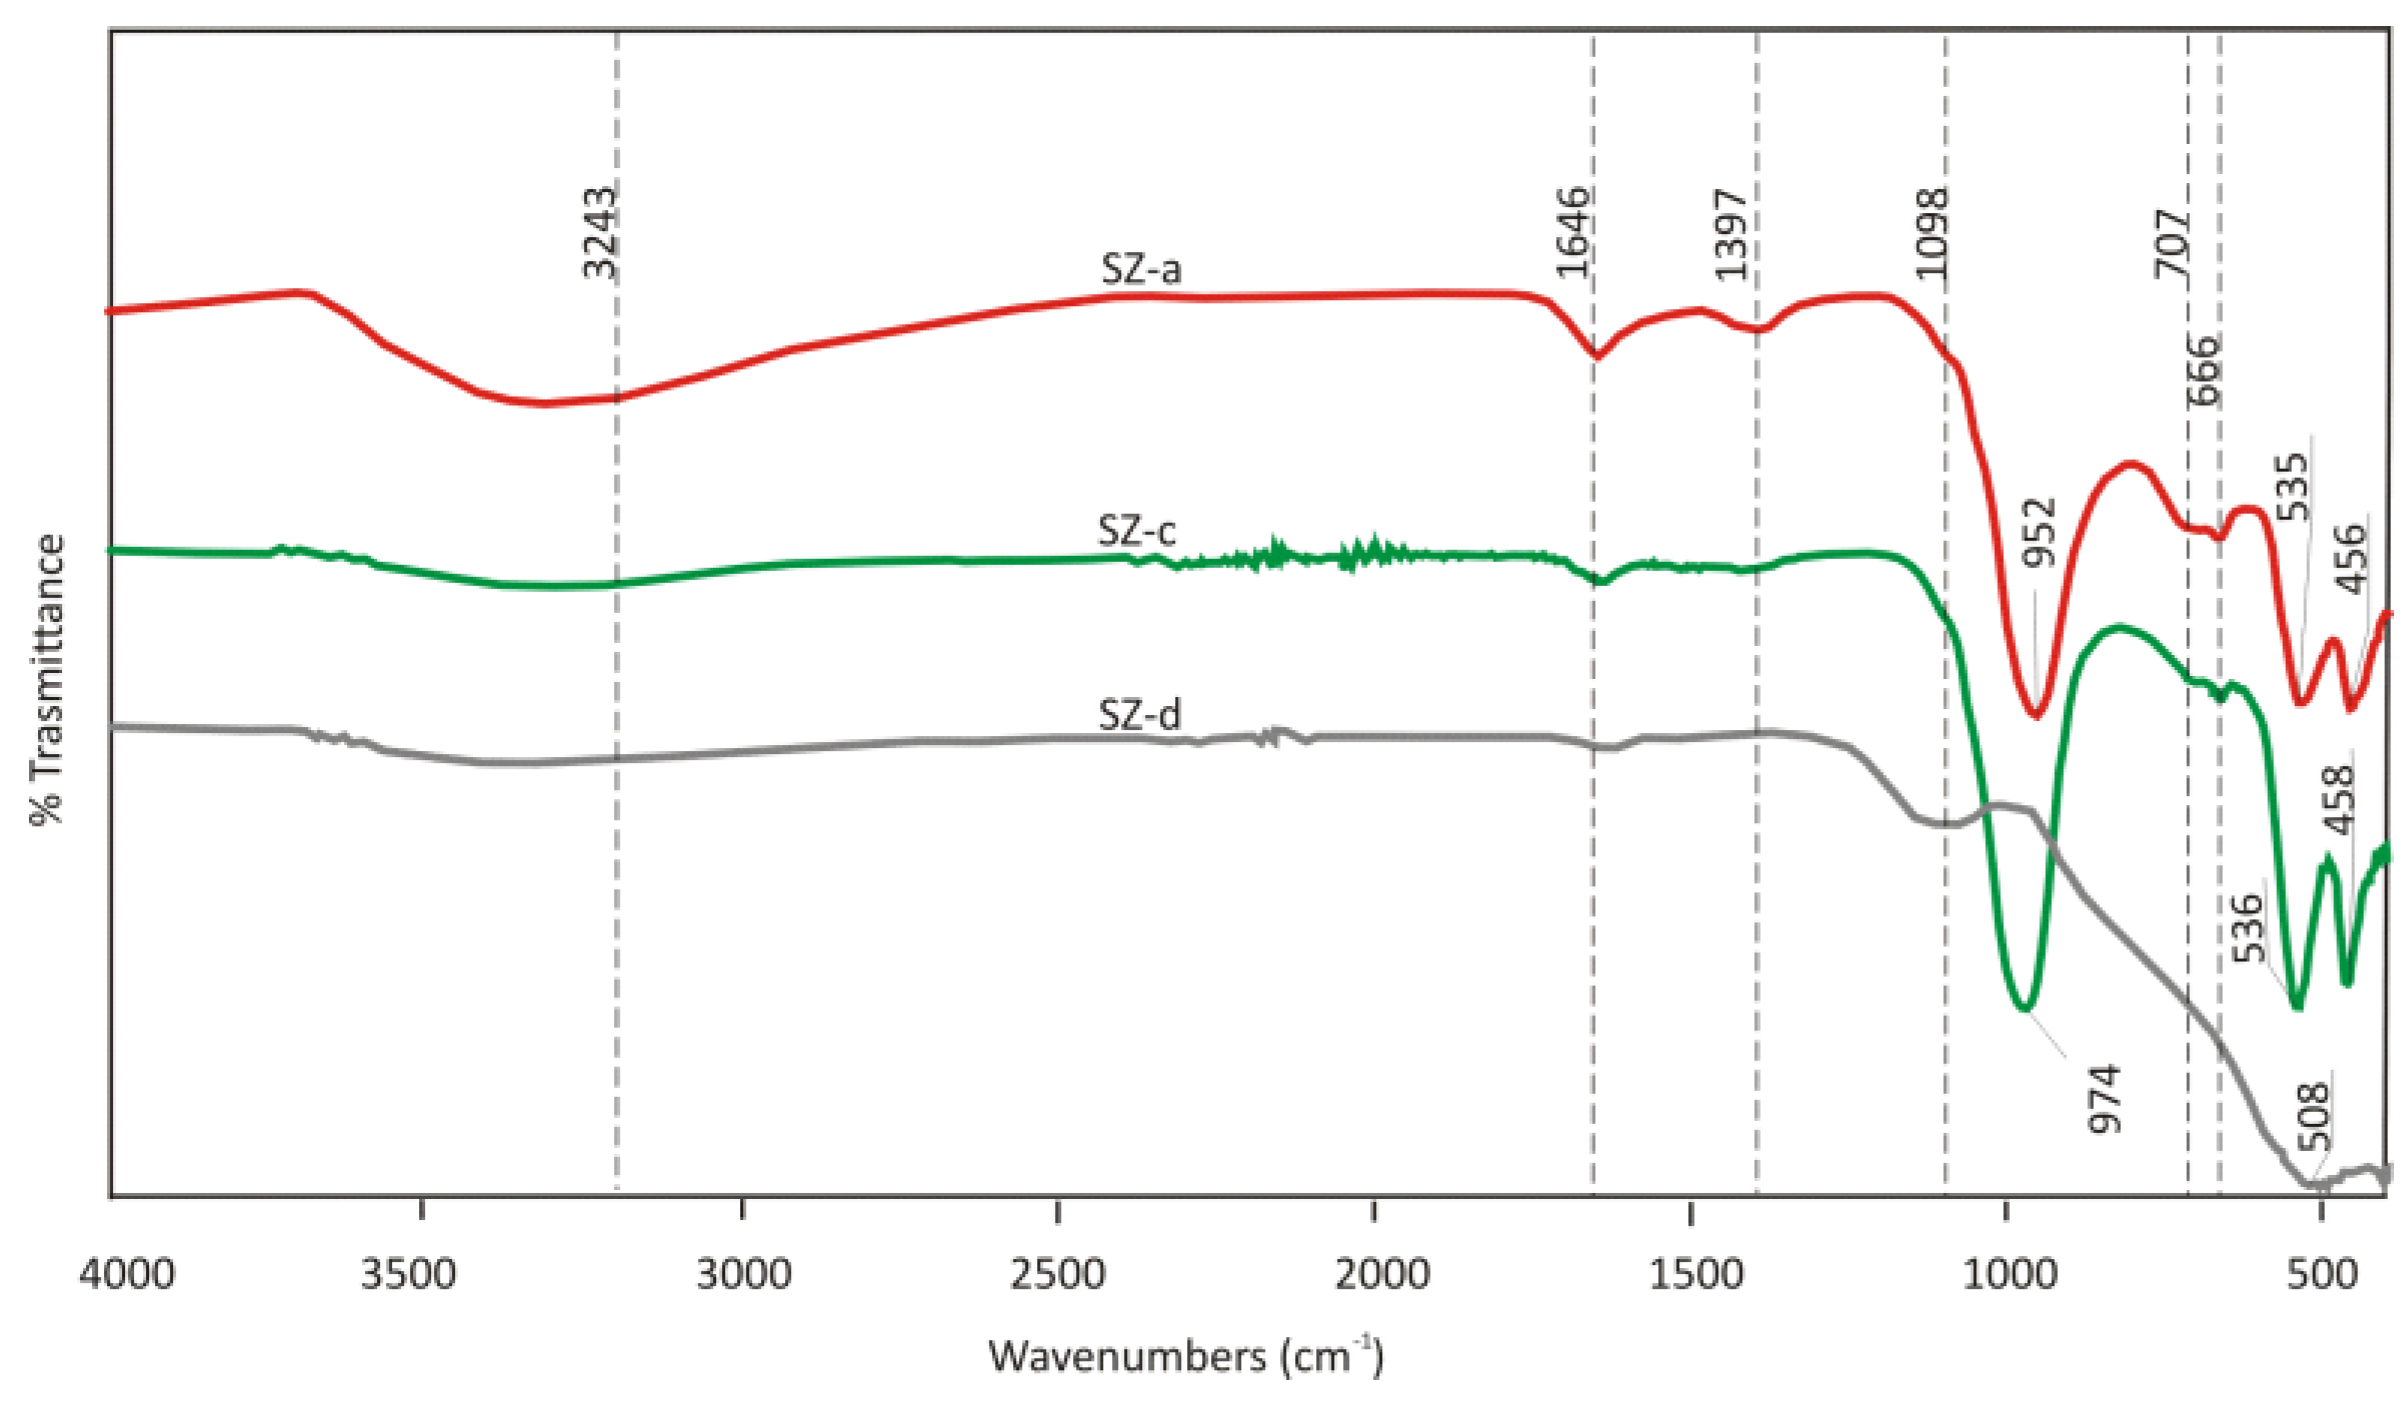
Figure 21.
XRD pattern of KA-c after sorption from the synthetic solution, KA-d from EAFD wastewater.
Figure 21.
XRD pattern of KA-c after sorption from the synthetic solution, KA-d from EAFD wastewater.
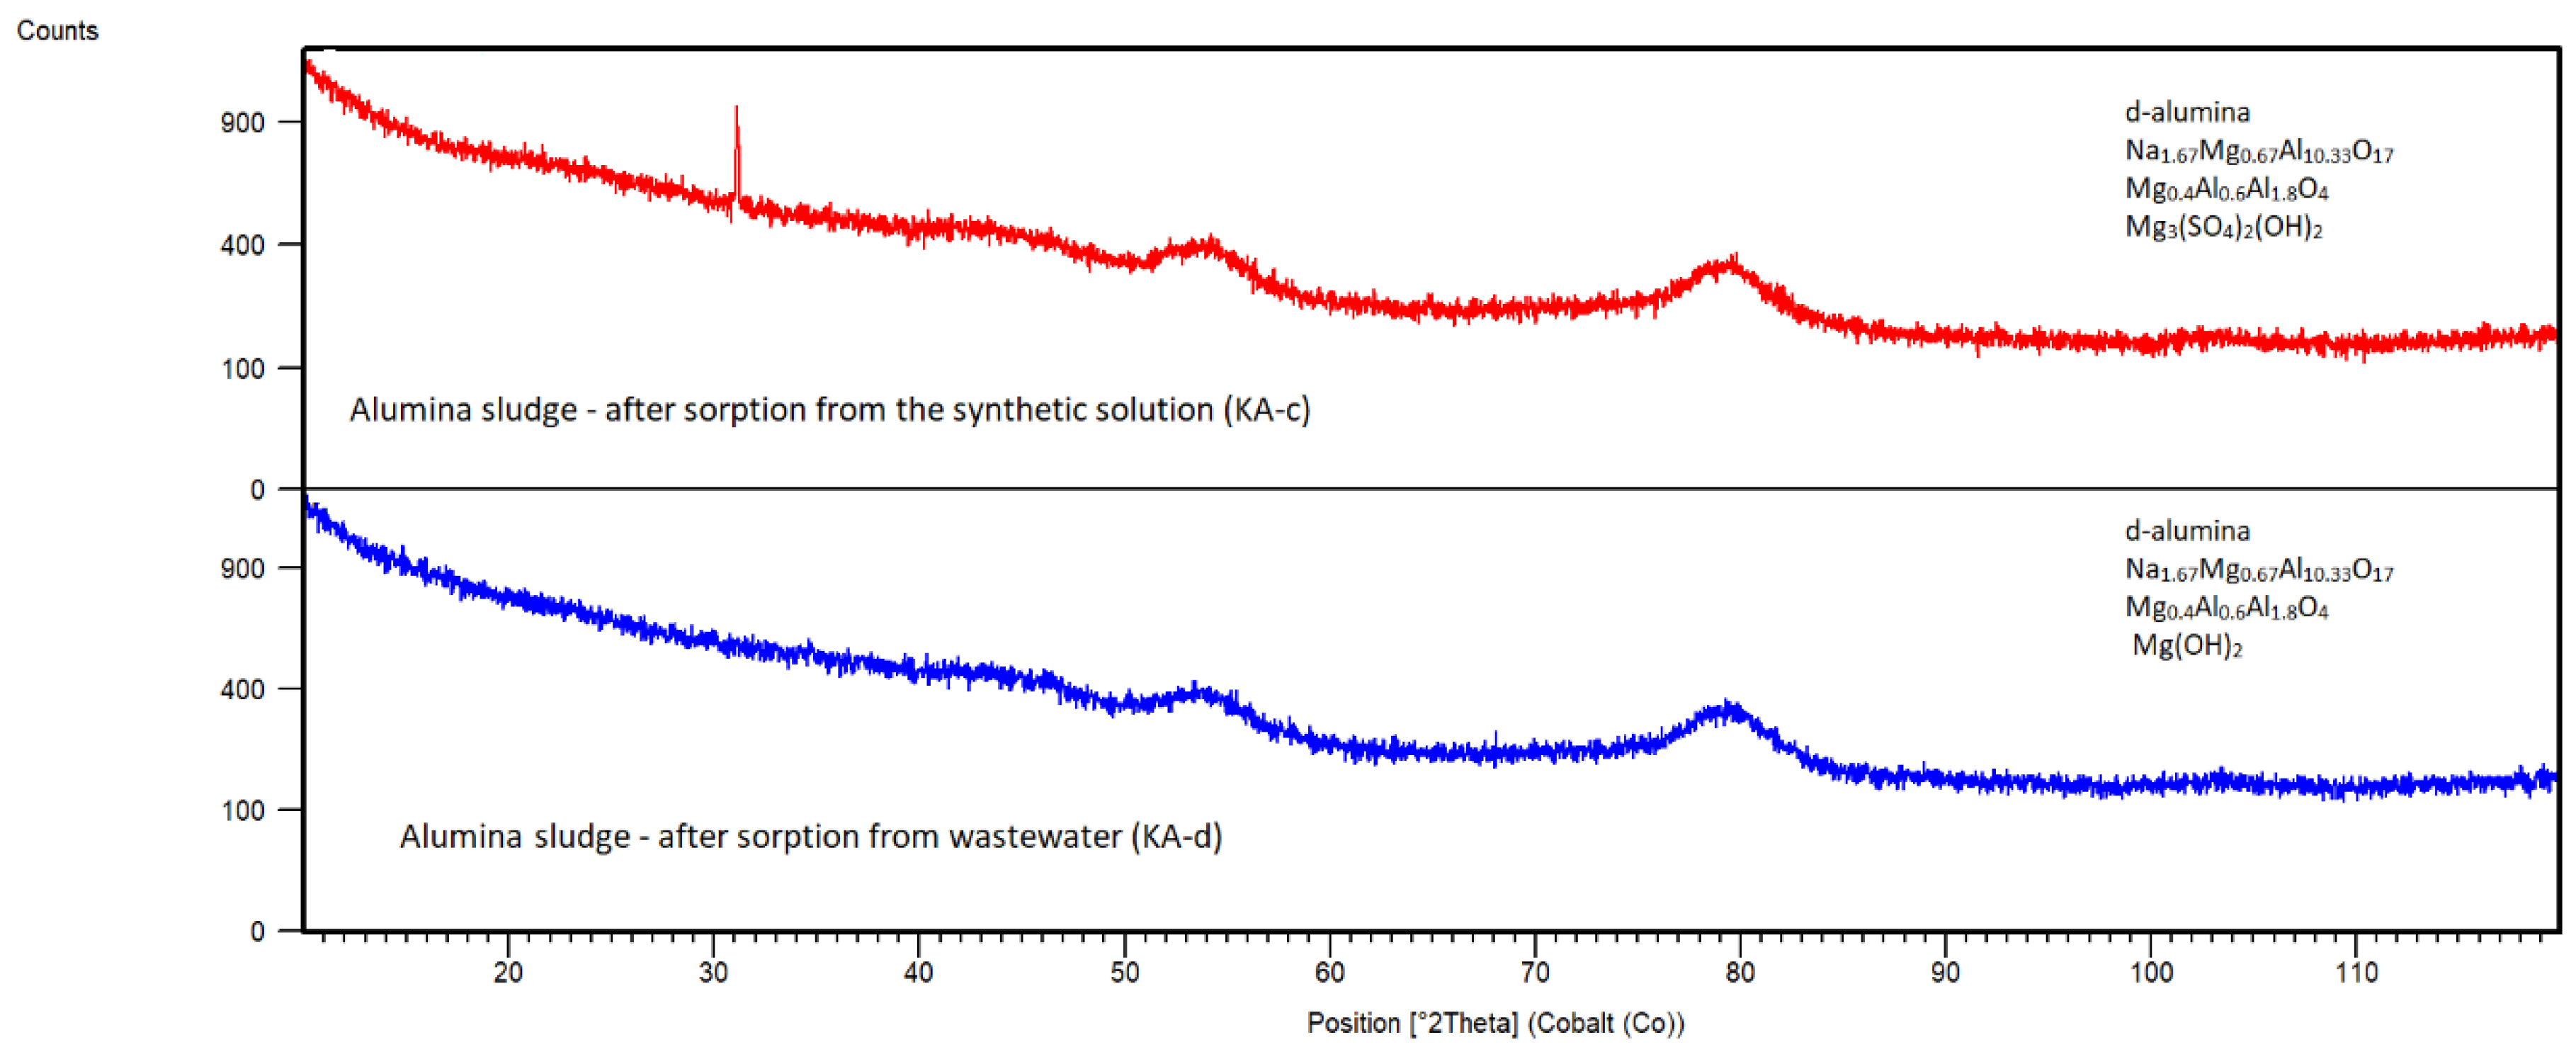
Figure 22.
FTIR spectra of sample KA-b calcined at 500°C, KA-c after sorption from the synthetic solution, KA-d from EAFD wastewater.
Figure 22.
FTIR spectra of sample KA-b calcined at 500°C, KA-c after sorption from the synthetic solution, KA-d from EAFD wastewater.
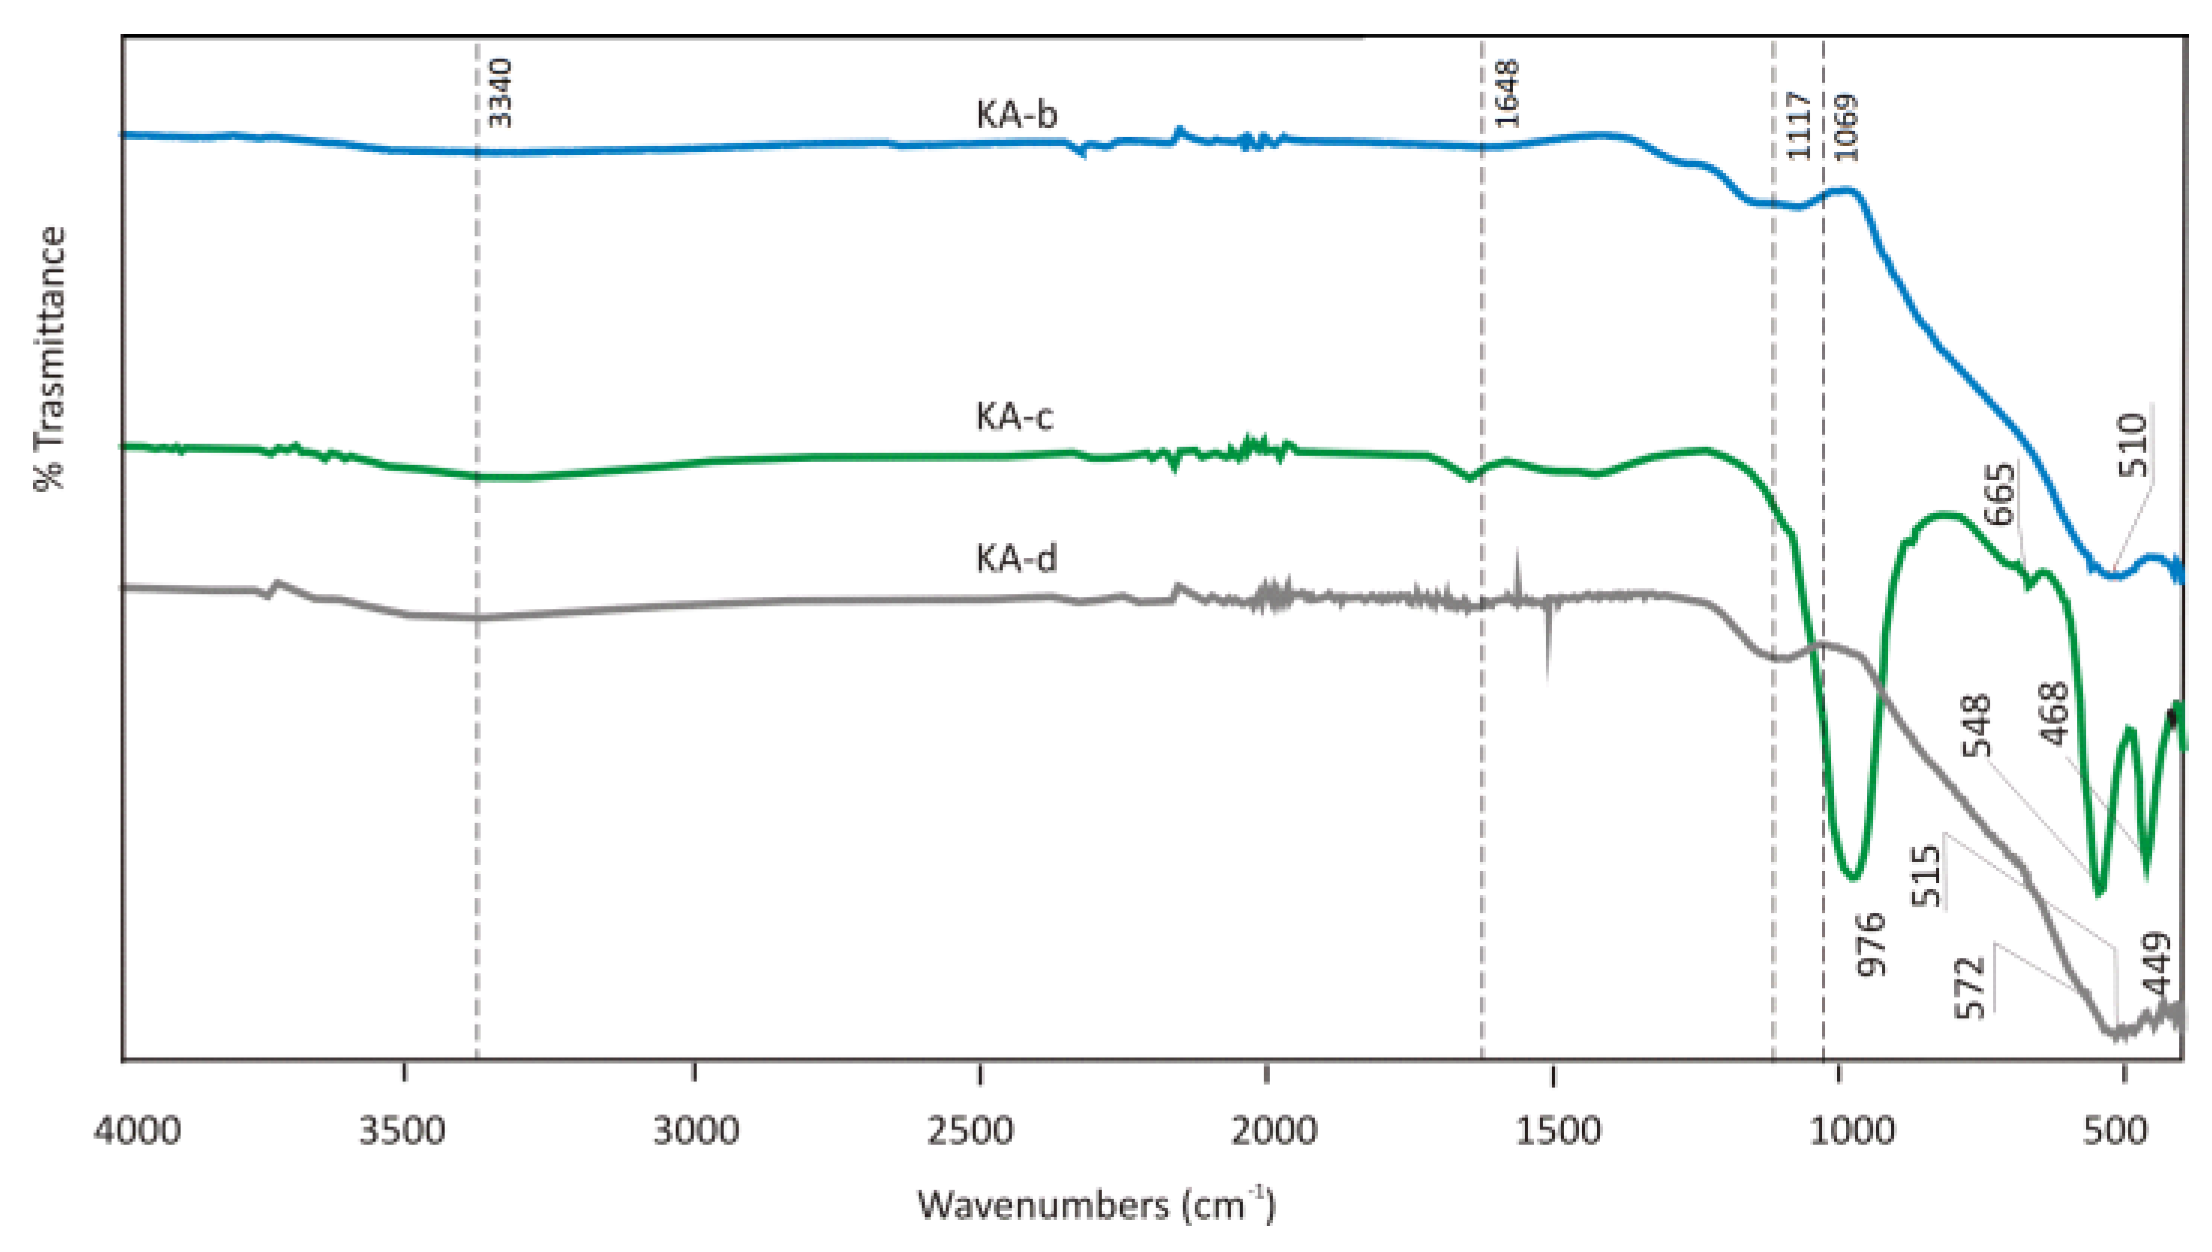
Figure 23.
The sorption rate of Cl- and Ca2+ on the a) HT-b, b) ZC-b, c) SZ-a and d) KA-b.
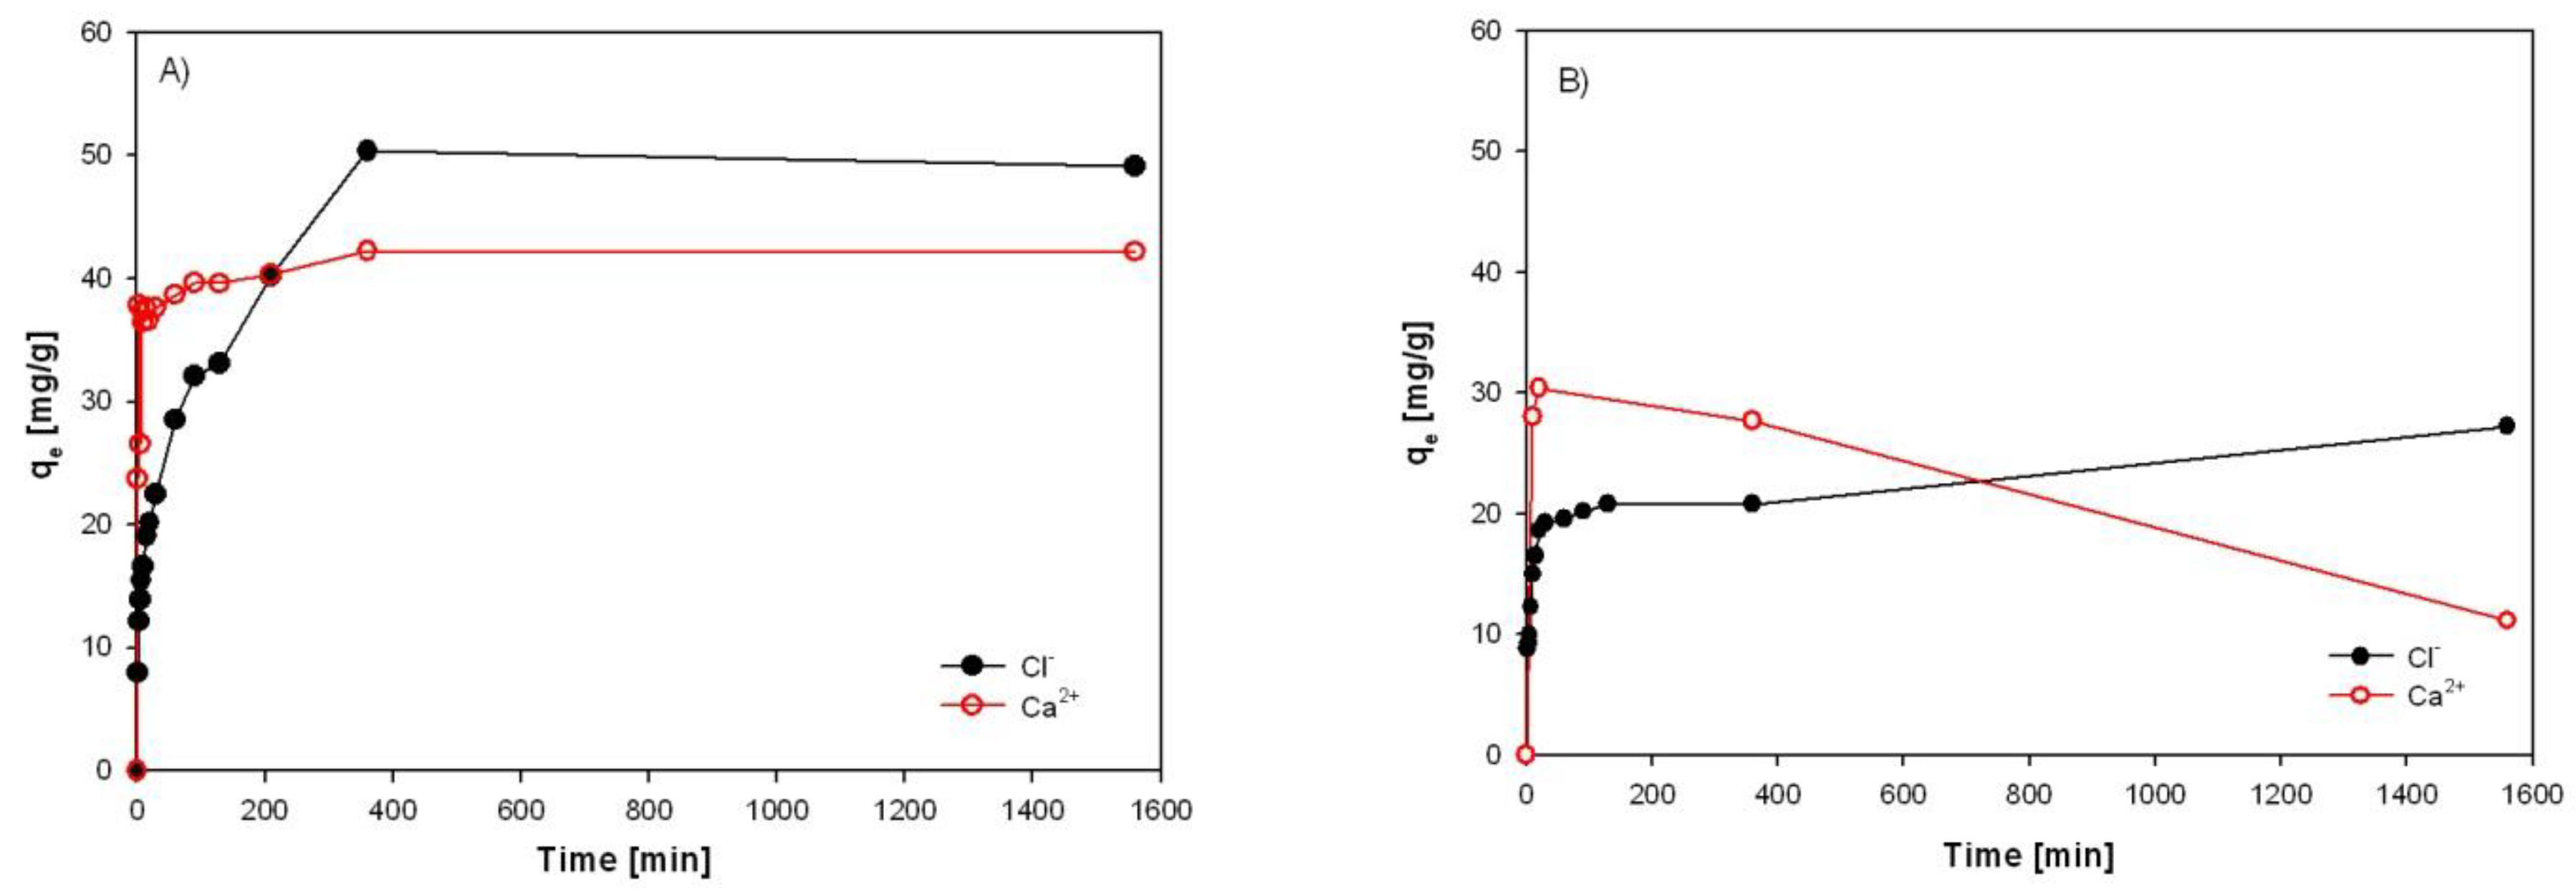
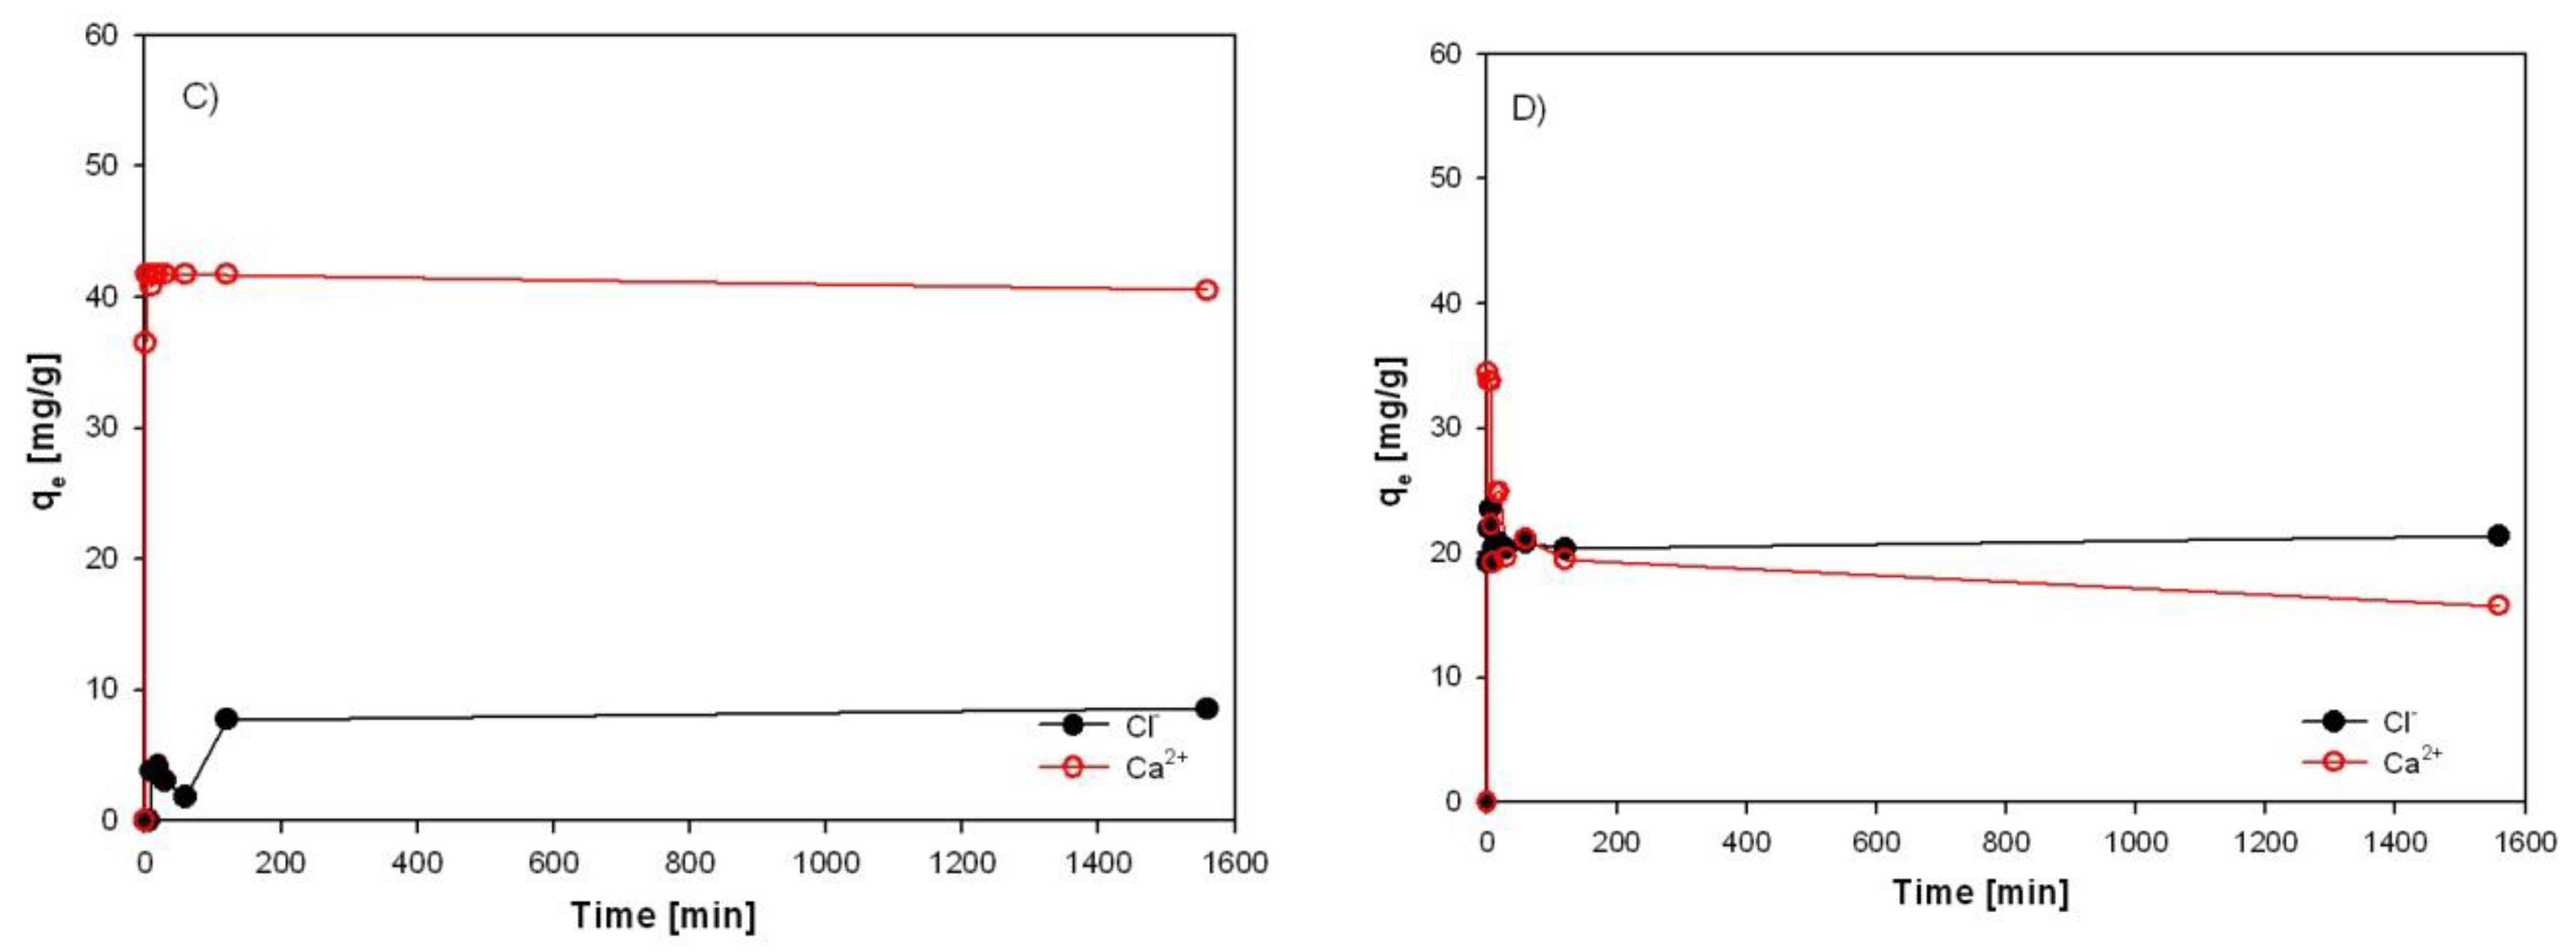

Table 1.
Partial elemental composition of industrial wastewater from washed EAFD (60 minutes, L:S ratio = 10).
Table 1.
Partial elemental composition of industrial wastewater from washed EAFD (60 minutes, L:S ratio = 10).
| Elements | Cl- | SO42- | Ca2+ | Pb2+ | Cr | Na+ | K+ |
|---|---|---|---|---|---|---|---|
| Ci [mg/l] | 1995.2 | 1200 | 1084 | 6.16 | 1.69 | 525 | 694 |
Table 2.
Content of selected elements in sorption materials.
| Sample | Metal content [wt.%] | ||
|---|---|---|---|
| - | Mg | Al | |
| HT-b | - | 24.42 | 3.72 |
| Si | Ca | Al | |
| ZC-b | 13.32 | 3.38 | 2.01 |
| SZ-a | 34.7 | 0.13 | 11.5 |
| KA-b | 0.27 | 0.04 | 30.265 |
Table 3.
Textural parameters of sorbents.
| Sample | BET surface area [m2 g-1] | Single point pore volume [cm3 g-1] | Pore diameter Dv (d) [nm] |
|---|---|---|---|
| HT-b | 48.532 | 0.209 | 3 |
| ZC-b | 27.060 | 0.157 | 4 |
| SZ-a | 78.267 | 0.064 | 3 |
| KA-b | 118.890 | 0.200 | 4 |
Table 4.
The comparison of changes in pH values in the synthetic solution and EAFD wastewater (Experimental conditions: V=100 ml, Cs = 30 g/l, t = 24 hours).
Table 4.
The comparison of changes in pH values in the synthetic solution and EAFD wastewater (Experimental conditions: V=100 ml, Cs = 30 g/l, t = 24 hours).
| Adsorption material | Synthetic | EAFD wastewater | |
|---|---|---|---|
| Initial pH value (pHi) | - | 6.87 | 12.78 |
| Final pH value (pHf) | HT-b | 11.77 | 12.54 |
| ZC-b | 8.53 | 12.24 | |
| SZ-a | 12.34 | 12.87 | |
| KA-b | 4.41 | 7.78 |
Table 5.
The sorption efficiencies and capacities for studying impurities in EAFD wastewater by sorbent HT-b (24 hours test, sorbent concentration 30g/l; V = 300 ml; 20°C, pH0 = 13.34), x- were not measured.
Table 5.
The sorption efficiencies and capacities for studying impurities in EAFD wastewater by sorbent HT-b (24 hours test, sorbent concentration 30g/l; V = 300 ml; 20°C, pH0 = 13.34), x- were not measured.
| Ion | SO42- | K+ | Na+ | Pb2+ | Cr3+ |
|---|---|---|---|---|---|
| Initial concentration [mg/l] | 1910 | 838 | 560 | 5.52 | 4.52 |
| Final concentration [mg/l] | 1150 | x | x | 0.97 | 0.4 |
| Sorption capacity [mg/g] | 25.33 | - | - | 0.15 | 0.14 |
| Removal efficiency [%] | 39.79 | - | - | 82.43 | 91.15 |
Disclaimer/Publisher’s Note: The statements, opinions and data contained in all publications are solely those of the individual author(s) and contributor(s) and not of MDPI and/or the editor(s). MDPI and/or the editor(s) disclaim responsibility for any injury to people or property resulting from any ideas, methods, instructions or products referred to in the content. |
© 2025 by the authors. Licensee MDPI, Basel, Switzerland. This article is an open access article distributed under the terms and conditions of the Creative Commons Attribution (CC BY) license (http://creativecommons.org/licenses/by/4.0/).
Copyright: This open access article is published under a Creative Commons CC BY 4.0 license, which permit the free download, distribution, and reuse, provided that the author and preprint are cited in any reuse.


