Submitted:
09 August 2024
Posted:
12 August 2024
You are already at the latest version
Abstract
Ammonium ion is a chemical species that is found in abundance in natural waters, whether underground or surface, but also in wastewater resulting from agricultural and industrial activities. Even if the removal of the ammonium ion from water has been studied for a very long time, it has been found that its removal is far from being solved. In this study, we evaluated the performance of the ammonium ions adsorption process on two adsorbents, zeolite clinoptilolite, ZR, (manufacturer Zeolite Develop-ment SRL, Rupea, Brasov, Romania) and the other granular activated carbon type Norit GAC 830 W. In the first step the paper presents the mineralogical (XRD) and structural (SEM and EDX) characterization of the ZR and determination of the pH zero-point charge, pHZPC, for all the adsorbents. Studies were carried out in equilibrium and kinetic conditions. The efficiency of the adsorbent was investigated in different experimental conditions by varying the initial concentration, particle size, temperature, pH, ionic strength and contact time. The mathematical models and parameters specific to the adsorption isotherms that best describe the experimental results were identified. Langmuir, Freundlich, Temkin and Dubinin-Radushkevich mathematical models were used for comparison. The Langmuir isotherm proved to be the most appropriate to describe the adsorption of ammonium ions on all types of adsorbents used. The adsorption capacity of ammonium ion from synthetic solutions, at 20 °C, pH = 6.09, for the range of initial concentrations 0 - 50 mg/L for Rupea Zeolite is in the range of 10.46 mg/g -12.34 mg/g and for granular activated carbon GAC W830 is 16.64 mg/g. It was found that the increase in temperature and pH have a positive effect on the adsorption capacity of the ammonium ion on the studied adsorbents, and the ionic strength determines the decrease in the adsorption capacity. Kinetic models were also identified that best describe the experimental processes. In this sense, pseudo first order, pseudo second order, intraparticle diffusion and the Elovich model were used. The results of the investigation showed that second-order kinetics governs the adsorption process on ZR zeolites and pseudo-first order for activated carbon.
Keywords:
ammonium removal
; adsorption
; ionic exchange
; equilibrium and kinetic studies
; mathematical model characterization
1. Introduction
The removal of the ammonium ion from water was and still is an area of current research. A challenge is the removal of ammonium ion with increasingly high concentrations from natural waters and from industrial and agricultural wastewater using simple and cheap methods with high efficiency [1,2].
Lately, the growth of the global population has determined a sharp development of anthropogenic, agricultural and industrial activities that have a special impact on the environment, especially regarding the increase in the concentration of the ammonium ion [2,3].
The intensive exploitation of agricultural areas and the administration of large quantities of fertilizers have altered the underground water resources where, in some cases, the ammonium ion has reached concentrations around 10 mg/L. In industrial wastewater and agricultural wastewater, ammonium ion concentrations can reach over 50 mg/L [3,4].
In the literature studies, numerous methods of ammonium ion removal are presented, which are effective. Of these, special attention is given to biological degradation processes for domestic wastewater [5], adsorption and biosorption on various materials [6,7], ion exchange [8,9], oxidation with ozone [10], chlorine compounds [11] with ultrasound [12], stripping [3], membrane processes [13], etc. Although these processes are effective in choosing the optimal method of water treatment and purification, the following aspects must be taken into account: the efficiency of the process, the cost of materials, the costs of operation, exploitation and maintenance, the amount and fate of the materials resulting from the processes after exhaustion (waste), their toxicity, their capacity for regeneration and valorization [14,15].
In order to choose a sustainable method of water treatment and purification, materials must be chosen that have low costs, that are found in natural deposits with low exploitation and preparation costs, that after exhaustion are not toxic and can be exploited or regenerated, with long life cycles, in accordance with the principles of sustainable development and circular economy policies. [16,17]. A viable solution is the retention of the ammonium ion on clinoptilolite-type zeolite. There are numerous studies that have developed this subject where numerous zeolites from various corners of the world are used, each with its own specificity. to give examples [18,19].
There are numerous natural deposits of zeolites worldwide (China, South Korea, Japan, Jordan and Turkey, Brasil, Romania, etc.) that deserve to be exploited and used taking into account their efficiency, cost, but also their capacity for adsorption and ion exchange, their long life span with the capacity for regeneration and long-term use, but also for valorization after total exhaustion as an amendment in agriculture [3,20].
The general purpose of the study is to identify viable solutions for removing the ammonium ion from water up to the limits imposed by the legislation in force depending on the final utility of the water (water discharged into a natural receiver or drinking water).
Maximum admissible limit is 0.5 mg/L for drinking water - according to the European Directive 2020/2184 and the World Health Organization (WHO) and of 7 mg/L -10 mg/L total nitrogen depending on the number of equivalent inhabitants according to the Directive 91/271/EEC for wastewater. It will soon be replaced by the Proposal for a Directive of the European Parliament and of the Council concerning urban wastewater treatment (recast) of the Council of the European Union, which will impose a minimum 80% reduction of the total nitrogen concentration values at the exit from the treatment plant [21,22].
In the article, we evaluated the performance of the ammonium ions adsorption process on two adsorbents, zeolite clinoptilolite, ZR, (manufacturer Zeolite Development SRL, Rupea, Brasov, Romania) and the other granular activated carbon type Norit GAC 830 W. In the first step the study presents the mineralogical (XRD) and structural (SEM and EDX) characterization of the ZR and determination of the pH zero-point charge, pHZPC, for all the adsorbents. Studies were carried out in equilibrium and kinetic conditions. The influence of the zeolite particles sizes, the initial concentration of the ammonium ion, the temperature, pH and the ionic strength on the adsorption capacity were identified. The experimental results were compared with mathematical models of Langmuir, Freundlich, Temkin, and Dubinin-Radushkevich isotherms, and the mathematical model that best describes the process was identified. In order to identify the mathematical model that best describes the adsorption kinetics, we compared the experimental results with the kinetic models type of pseudo-first order, pseudo-second order, Elovich and intra-particle diffusion.
2. Materials and Methods
2.1. Characterization of Adsorbents
2.1.1. Adsorbents Preparing
The article presents a comparative study of the equilibrium and kinetics of the adsorption process of ammonium cations, from synthetic waters, on natural zeolites of the clinoptilolite type, ZR, and on granular activated carbon, CAG 830 W, in statical conditions. The zeolite and activated carbon samples used in these experiments were washed with distilled water until all dust was removed and the washing water remained clear. The adsorbents were dried in an oven at 105 °C until constant weight, cooled and stored in a desiccator. From them, the necessary samples for the experiments were weighed. In the first step the study presents the mineralogical (XRD) and structural (SEM and EDX) characterization of the ZR and determination of the pH zero-point charge, pHZPC, for all the adsorbents.
2.1.2. XRD Characterization
The crystallographic structure was determined by X-ray diffraction technique (XRD), using PANalytical Empyrean (Almelo, Netherlands) equipment provided with a characteristic Cu X-ray tube (λ Cu Kα1 = 1.541874 Å). The sample was scanned in the 2θ angle range of 10-80°, with a scan increment of 0.02° and a time of 100 s/step. Phase identification and Rietveld quantitative phase analysis were performed, using the X′Pert High Score Plus 3.0 software (PANalytical, Almelo, The Netherlands). The results are shown in Figure 1 and Table 3.
2.1.3. SEM and EDX Analysis for ZR
The internal structural aspect of zeolite ZR was analyzed using the HRSEM high-resolution scanning electron microscopy images (secondary electron images – SEI) technique. Scanning electron microscope QUANTA INSPECT F50, equipped with a field emission electron gun - FEG (field emission gun) with a resolution of 1.2 nm, and an energy dispersive X-ray spectrometer (EDX) with a resolution of MnK of 133 eV was used. The results are shown in Figure 2 and Figure 3 and Table 4.
2.1.4. Zero-Point Charge for Adsorbents
In this study we determined pHZPC for ZR with sizes between 0.5<d<1.25 mm and d>3 mm and for GAC. In this sense, were contacted 0.5 g each adsorbent sample with 50 mL of 0.01 M NaCl solution for 48 hours. The initial pH of the solutions between 2 and 12 was corrected with 0.1 M HCl and 0.1 M NaOH solutions. The initial and final pH was measured with a pH meter Jenway 370 pH-meter [ccc]. It was graphically represented ∆pH (pH initial - pHfinal), as a function of the pHinitial and the point of intersection with the Ox axis represents the pHzPC. See Figure 4 (a), (b), (c), (d).
2.2. Adsorption Experiments
2.2.1. Experiments Development
In the studies carried out both for equilibrium and for kinetics, ZR with sizes in ranges 0.5mm<d<1.25 mm, 1.25<d<2.5, and d>2.5 mm and GAC with sizes in range 0.6<d<3 mm. A solid/liquid ratio of 1/1 was worked on. The samples were shaken using a VELP analog orbital shaker, at frequency of 150 rotations per minute. The influence of initial concentration, particles sizes, pH, temperature and ionic strength on the adsorption process was studied. It was worked at three temperatures 10°C, 20°C and 40°C, at three ionic states, 0, 0.01 and 0.1 M obtained with KCl solution, and at a pH variation in the range 5.02 – 9.16. The pH was maintained at the working values using buffer solutions prepared from an equimolecular mixture of phosphoric, acetic and boric acids to which different doses of sodium hydroxide were added [24].
The concentration of ammonium ions in the synthetic solutions for the sorption equilibrium study varied between 0 and 50 mg/L and the contact time was 93 hours. In the case of reaction kinetics, synthetic solutions were used with an ammonium concentration of 38.6 mg/L, working pH 6.09. The initial and final NH4+/N (ammonium) concentrations from the systems were determined according to SR ISO 7150-1 /2001 using a Jenway Aquanova spectrophotometer.
Adsorption capacity (a) at equilibrium or for kinetics studies of adsorbents is calculated using relations:
where: C0 and C represent the initial at equilibrium or for moment t concentration of ammonium solution; mg/L, V – the volume of the solution, L; and m -mass of the adsorbent, g.
2.2.2. Mathematical Models for Characterization the Equilibrium of Adsorption Processes
In order to identify the mathematical models that best describe the adsorption process in static conditions, at equilibrium, the experimental results were compared with the adsorption isotherms models Langmuir, Freundlich, Temkin and Dubinin-Radushkevich. Table 1 shows the linear, L, and non-linear, NL, equations specific for the adsorption isotherms models used.
1.2.3. Mathematical Models for Characterization the Kinetic of Adsorption Processes
The experimental results obtained in the study of the kinetics of the adsorption process were compared with mathematical models. The mathematical model’s pseudo first order, pseudo second order, Elovich, and intra-particle diffusion were used. The characteristic equations are presented in Table 2.
3. Results and Discussions
3.1. Characterization of Adsorbents
The zeolite, ZR, used in their experiments has the total surface area BET analyses 41 m2/g, apparent density 2.38 kg/m3 [30]. Activated carbon type—Norit GAC 830 W, has a particle size grater to 2.36 mm maximum 15 % in mass unit and particle size slowly 0.6 mm maximum 5% in mass unit, the total surface area BET analyses 1100 m2/g and apparent density 500 kg/m3 [31.
3.1.1. Mineralogical Structure of ZR, XRD Characterization
The mineralogical composition of ZR are showen in Figure 1 and The proportion of phases highlighted after the Rietveld processing, was centralized in Table 3.
The main cristallyne form present in ZR are Ca Clinoptinolite ((Na1.32K1.28Ca1.72Mg0.52 ) (Al6.77Si29.23O72)(H 2O)26.84), over 80 %, fallowed by Phlogopite-1M (KMg3Si3AlO10(OH)2), over 11 %, Albite ((Na0.84Ca0.16 )Al1.16Si2.84 O8) and SiO2 over 2%.
Figure 1.
Characteristic diffractograms for ZR.
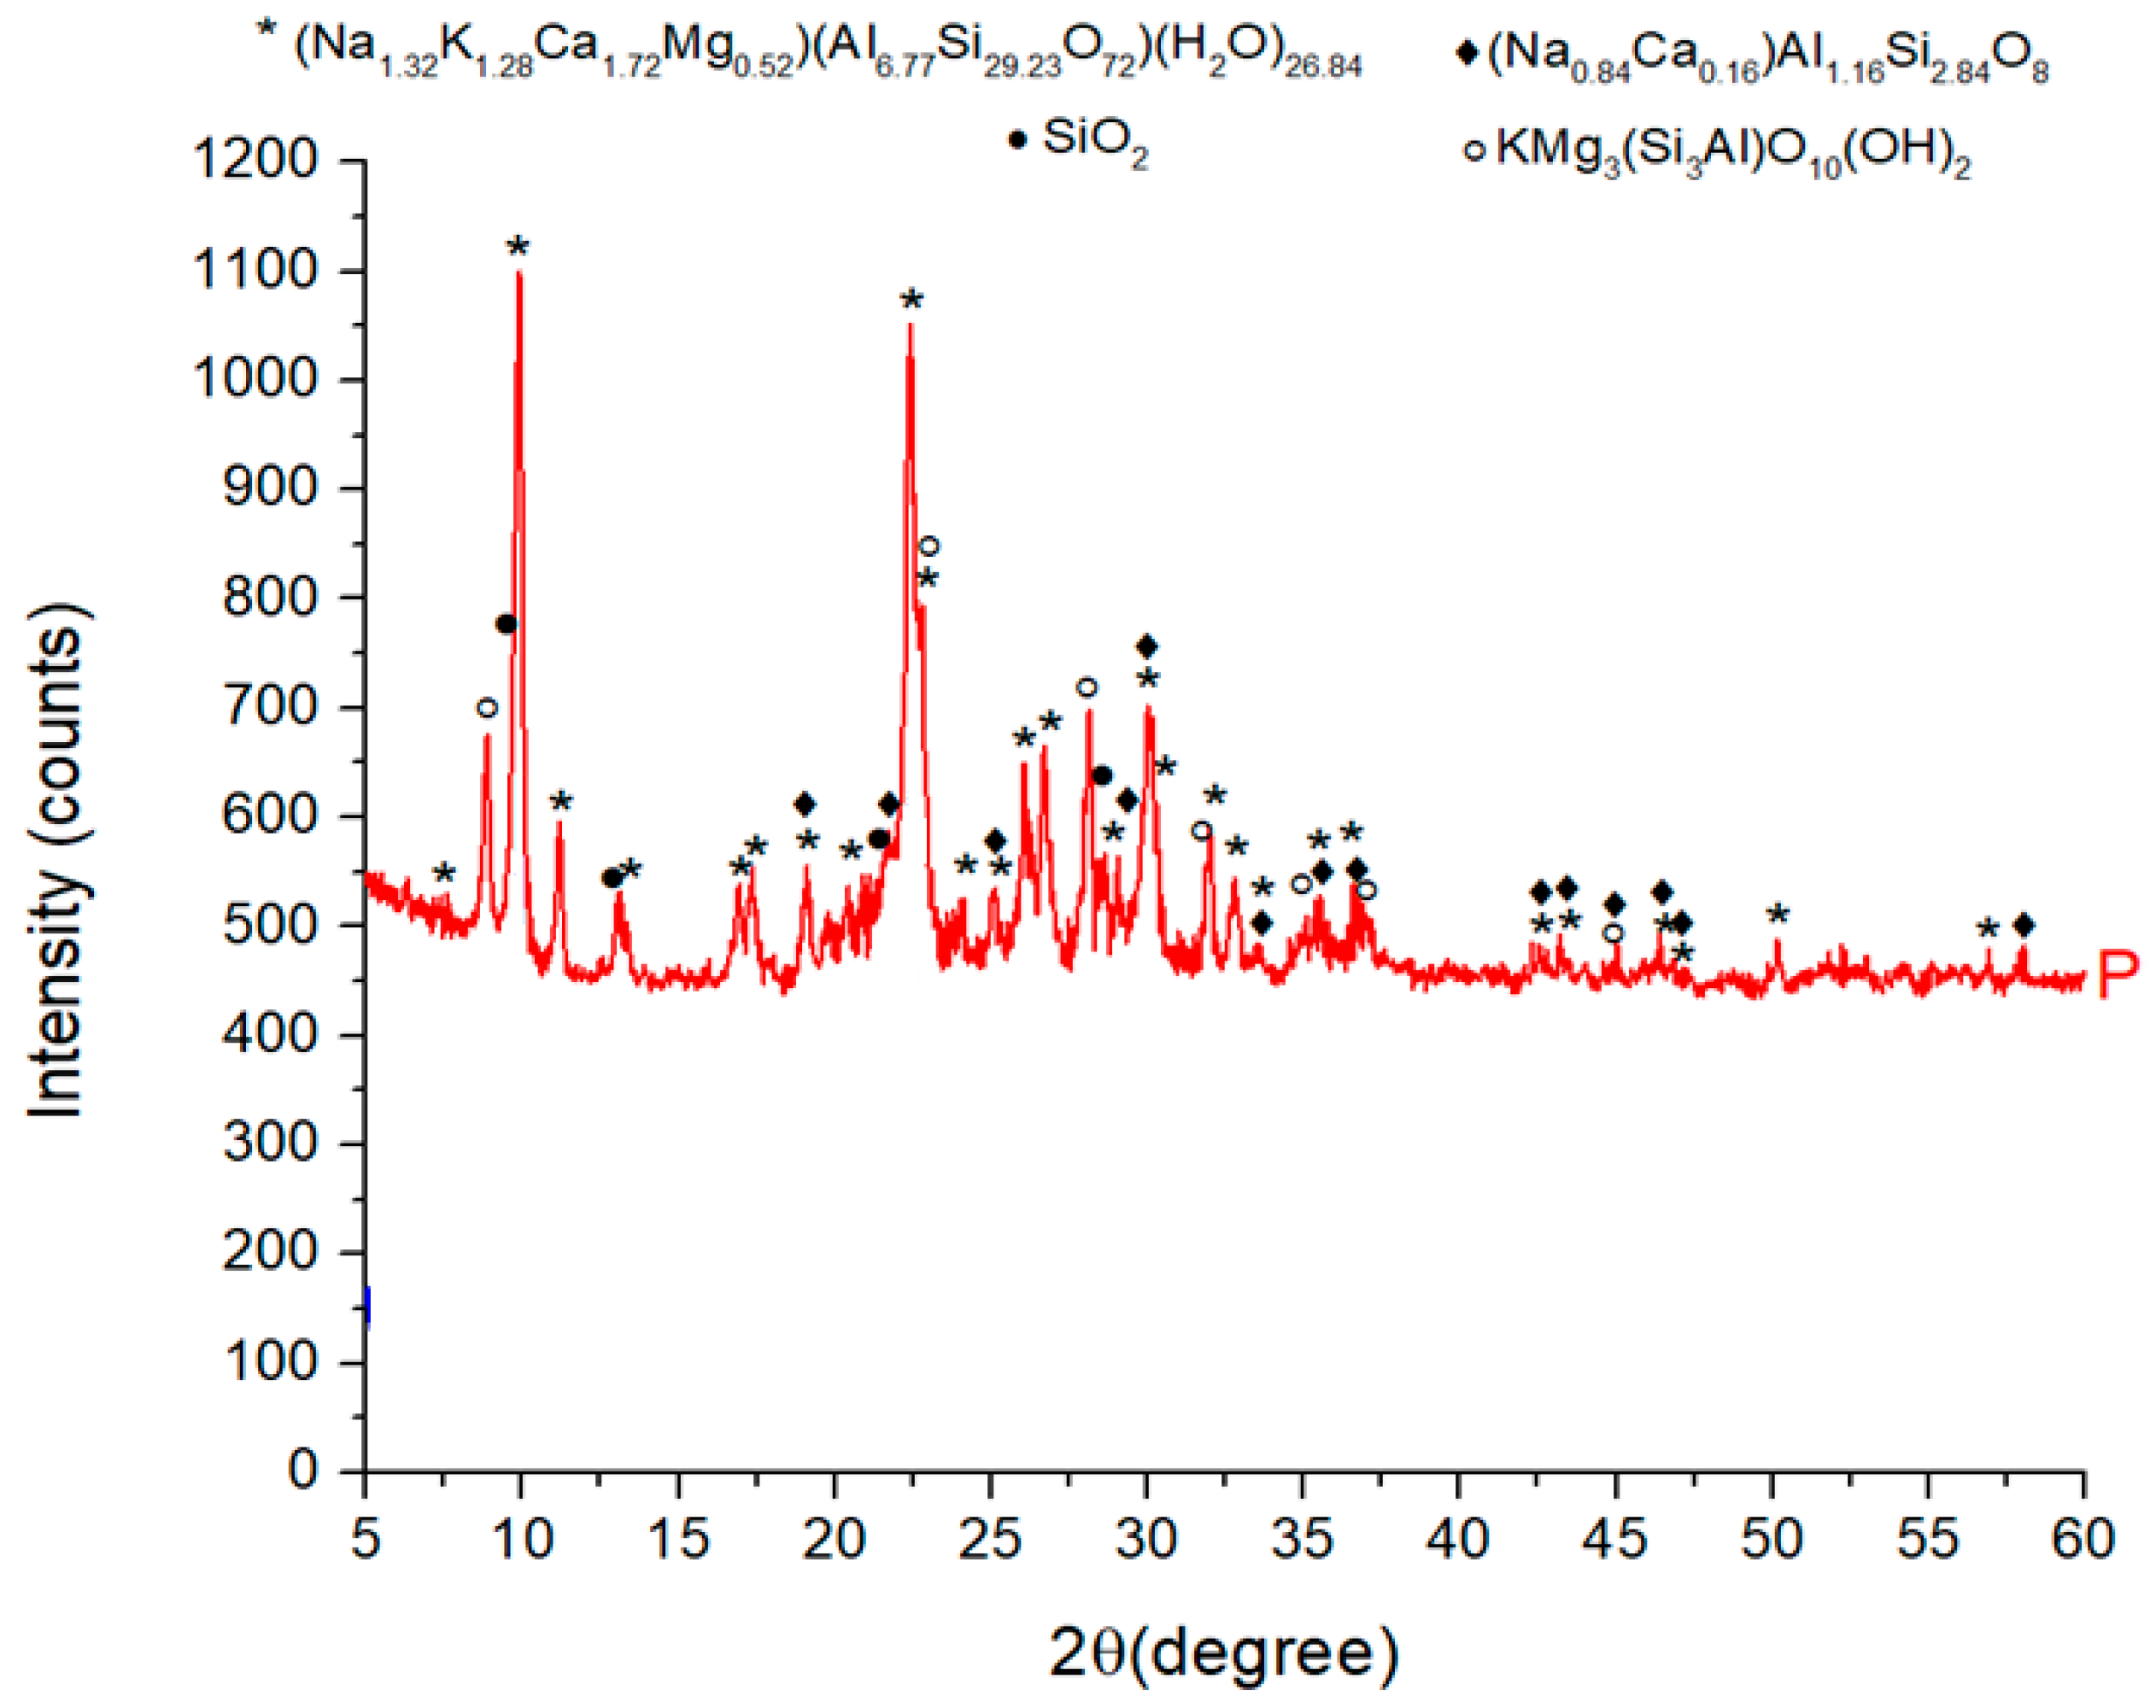

Table 3.
Proportion of cristals in ZR.
| No. | Compound | Quantity (%) | Quantity (%) P |
|
|---|---|---|---|---|
| 1 | Clinoptilolite Ca | (Na1.32K1.28Ca1.72Mg0.52)(Al6.77Si29.23O72)(H2O)26.84 | 81.0 | |
| 2 | Phlogopite-1M | (KMg3Si3AlO10(OH)2) | 11.5 | |
| 3 | Albite | (Na0.84Ca0.16)Al1.16Si2.84O8 | 5.4 | |
| 4 | Quartz | SiO2 | 2.1 |
3.1.2. SEM and EDX Analysis for ZR
Figure 2 represents the morphological image of a ZR granule at various magnification levels: (a)- 100 times, (b) -1000 times, (c) - 10,000 times, and (d) - 20,000 times.
From the analysis of Figure 2 we can see that the external and internal aspect of zeolite particle shows a morphological uniformity with a lamellar structure with platelet thicknesses of up to 100 nm. Zeolite can adsorb chemical species with sizes ranging from nanometers to micrometers, according to Figure 2 (c) and (d), the pore sizes varied around 1 µm. The EDX spectrum, Figure 3 highlighted the presence of the main elements: O, Na, Mg, Al, Si, K, Ca and Fe. The main component element is oxygen, which confirms that the metals present are in the form of oxides, and the high content of silicon, atomic ratio Si/Al equal with 4.8 greather like 4, that ensures of ZR good performance in terms of adsorption capacity, (see Table 3).
Figure 2.
The SEM analysis for ZR.
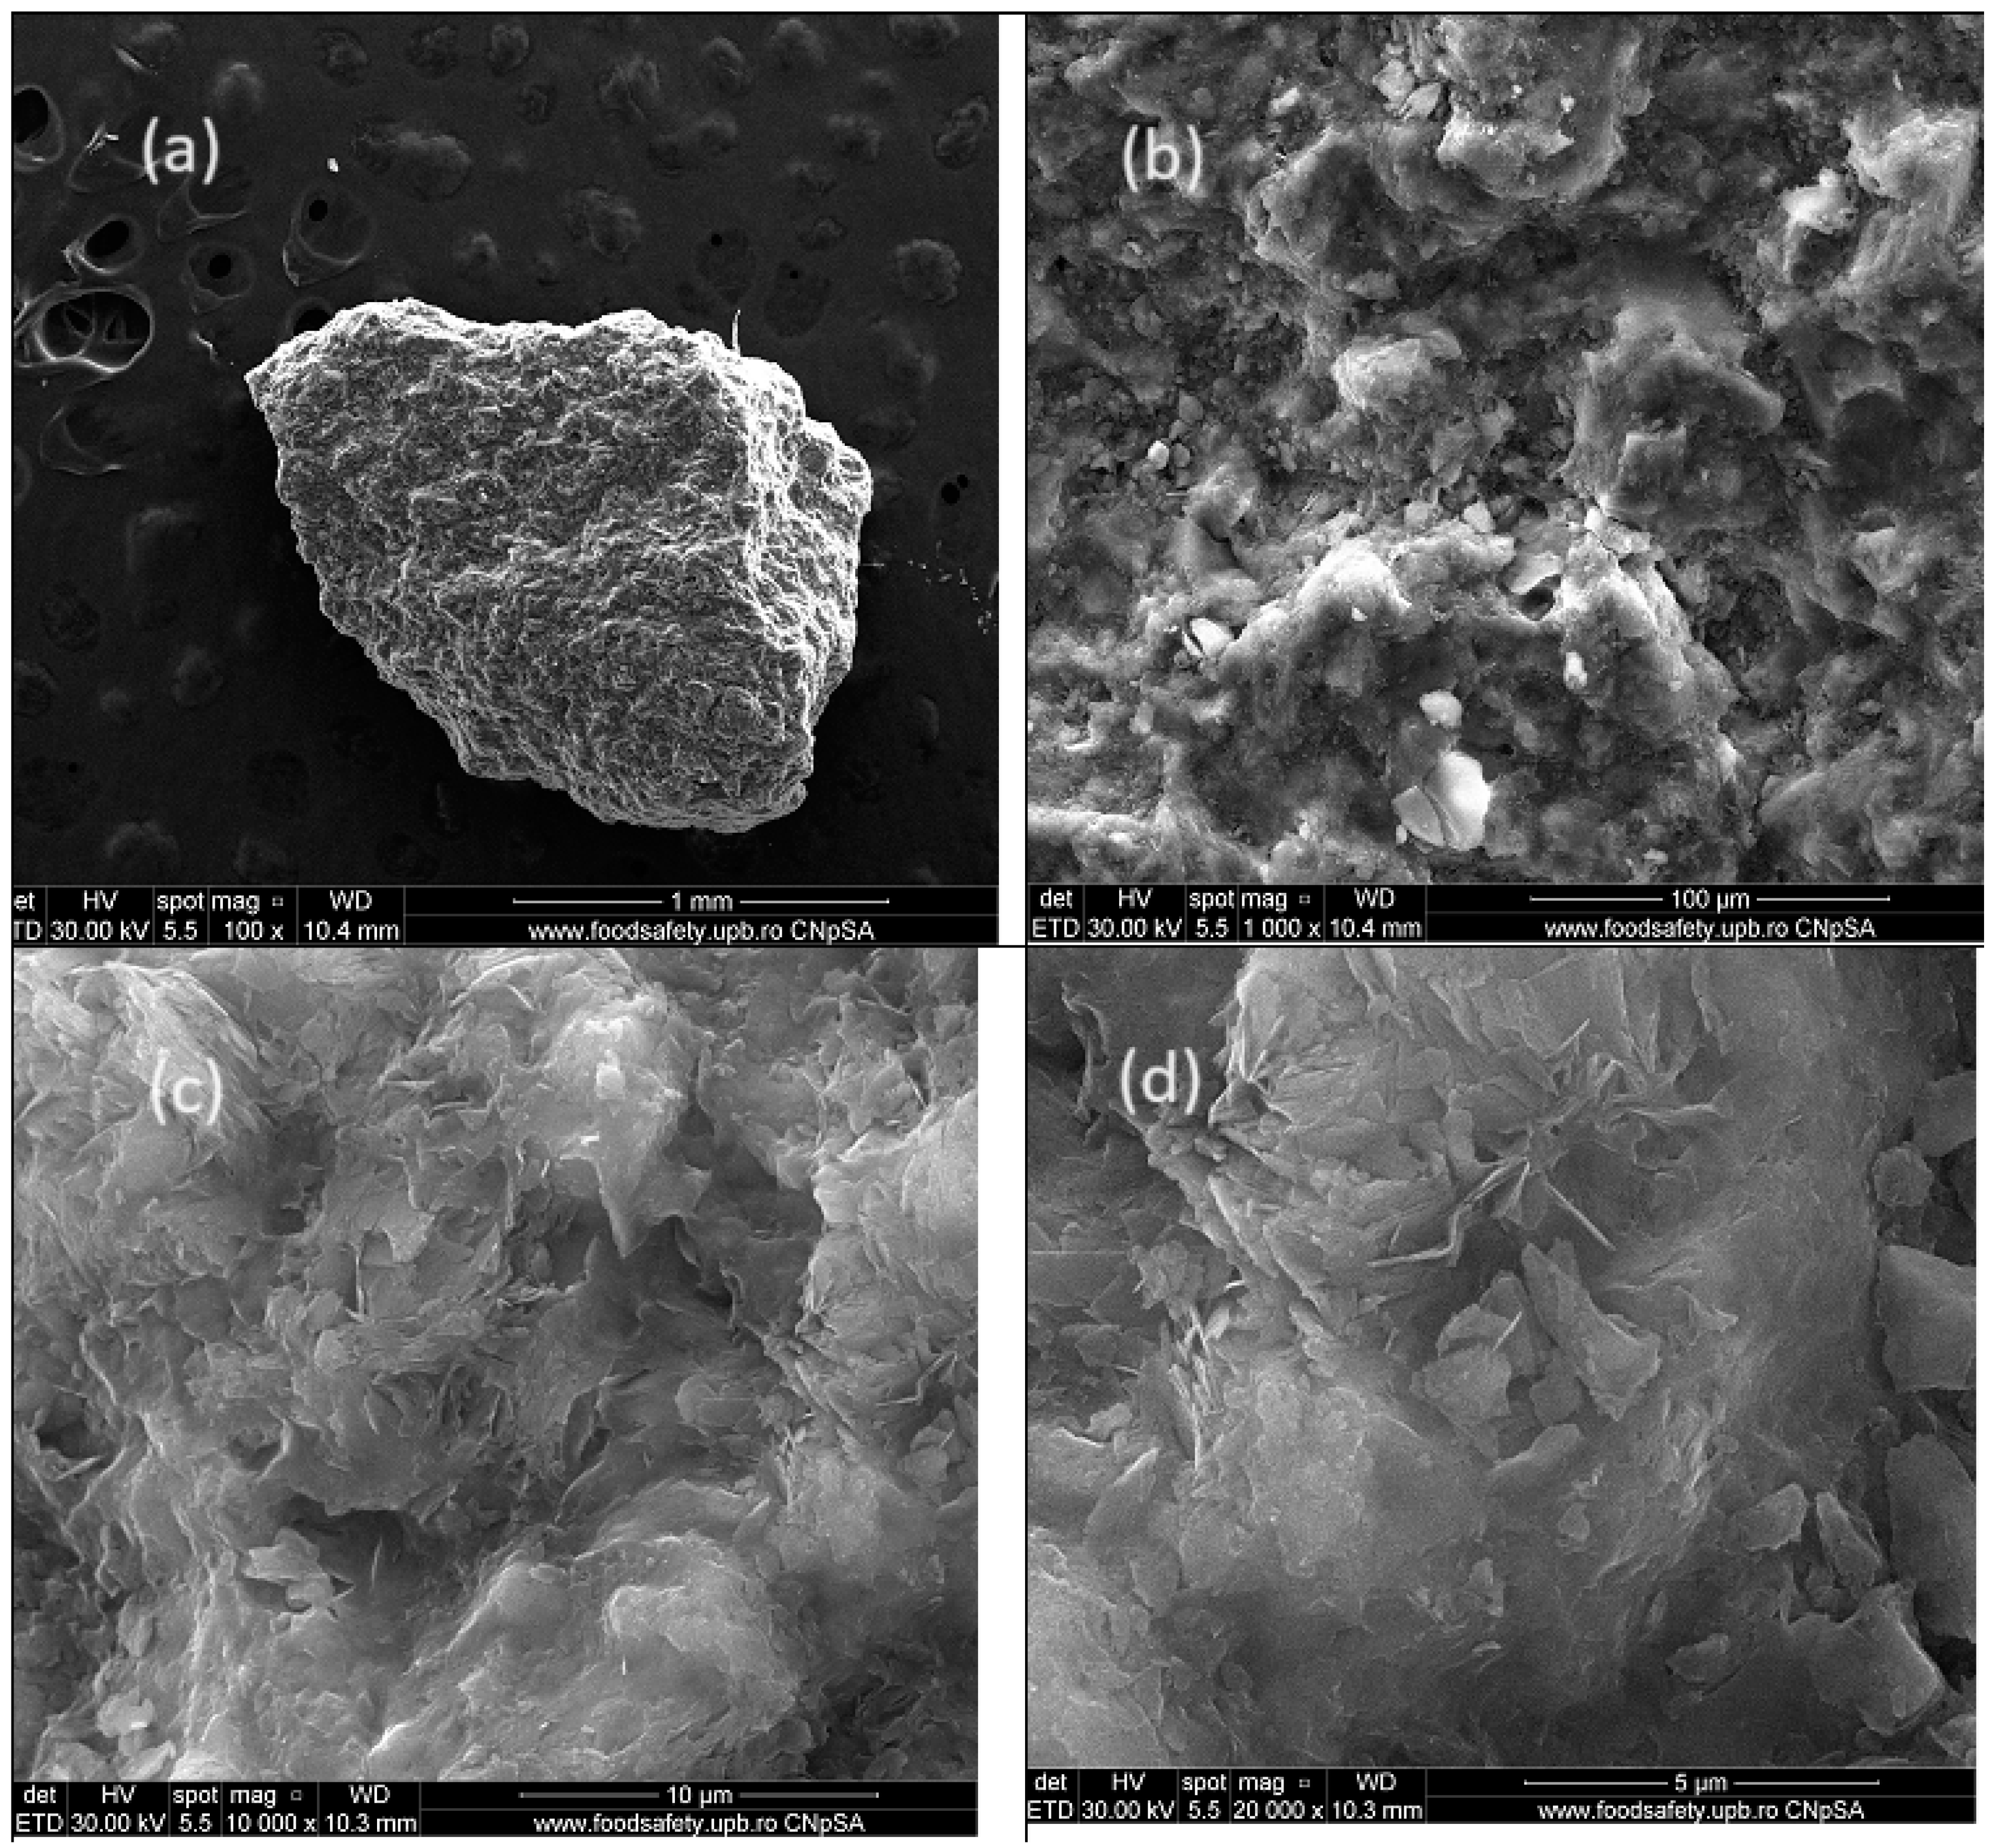
Figure 3.
EDX spectrum specific to ZR.
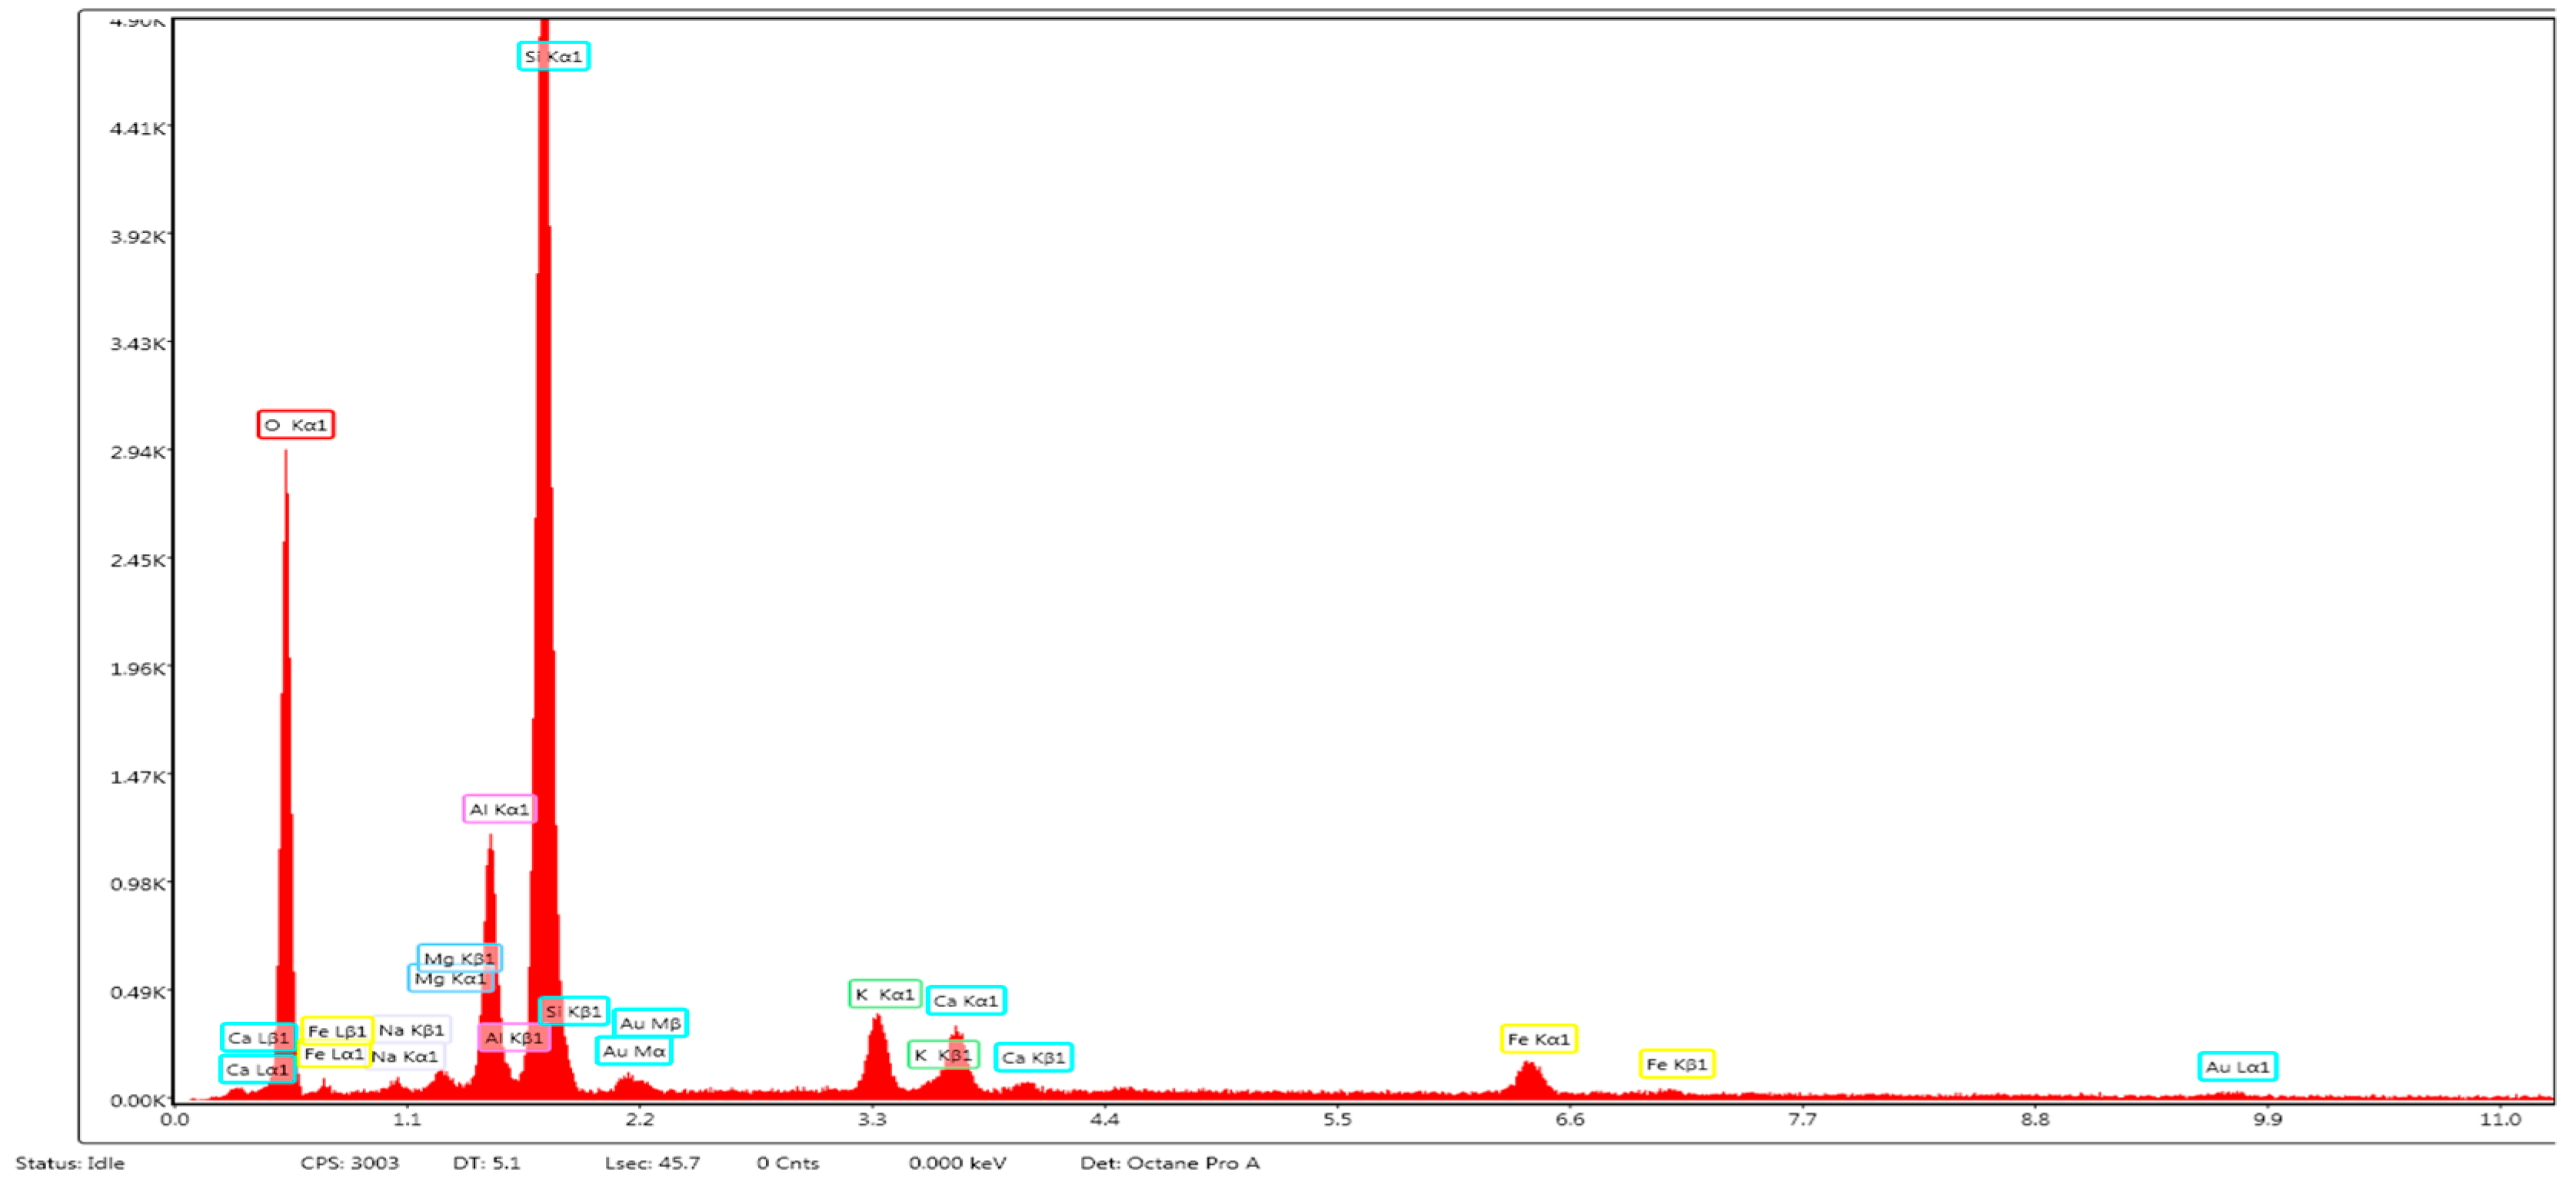
Table 4.
Elemental composition and weight and atomic percent of the component elements for ZR.
| Element | Weight % | Atomic % |
|---|---|---|
| O K | 52.54 | 66.94 |
| Na K | 0.39 | 0.35 |
| Mg K | 0.52 | 0.44 |
| Al K | 6.97 | 5.27 |
| Si K | 32.81 | 23.81 |
| K K | 2.52 | 1.32 |
| Ca K | 2.32 | 1.18 |
| Fe K | 1.92 | 0.7 |
3.1.3. Zero-Point Charge, pHZPC, for Adsorbents
The zero-charge point, pHZPC, of the ZR varied with the particles sizes if the particle size increases, the zero-charge point value decreases (see Figure 4 (a), (b), (c)). Thus, for particle sizes between 0.5 <d<1.25mm, pHZPC is 4.34 and for sizes d> 3 mm, pHZPC is 2.97. If the zeolite is in the ZR-Ca form, the pH is 5.43. It can also be seen that the pH for CA is 6.79 (see Figure 4(d)).
As you know, the zero point charge (pHzpc) represents the pH at which the electric charge of a solid surface is zero, when of equal numbers of cations and anions [32]. At pH less than pHZPC, the surface of adsorbent has positive charges and while at pH greater than pHZPC, the surface has predominated negative charges [25].
Figure 4.
The pHzPC for adsorbants.
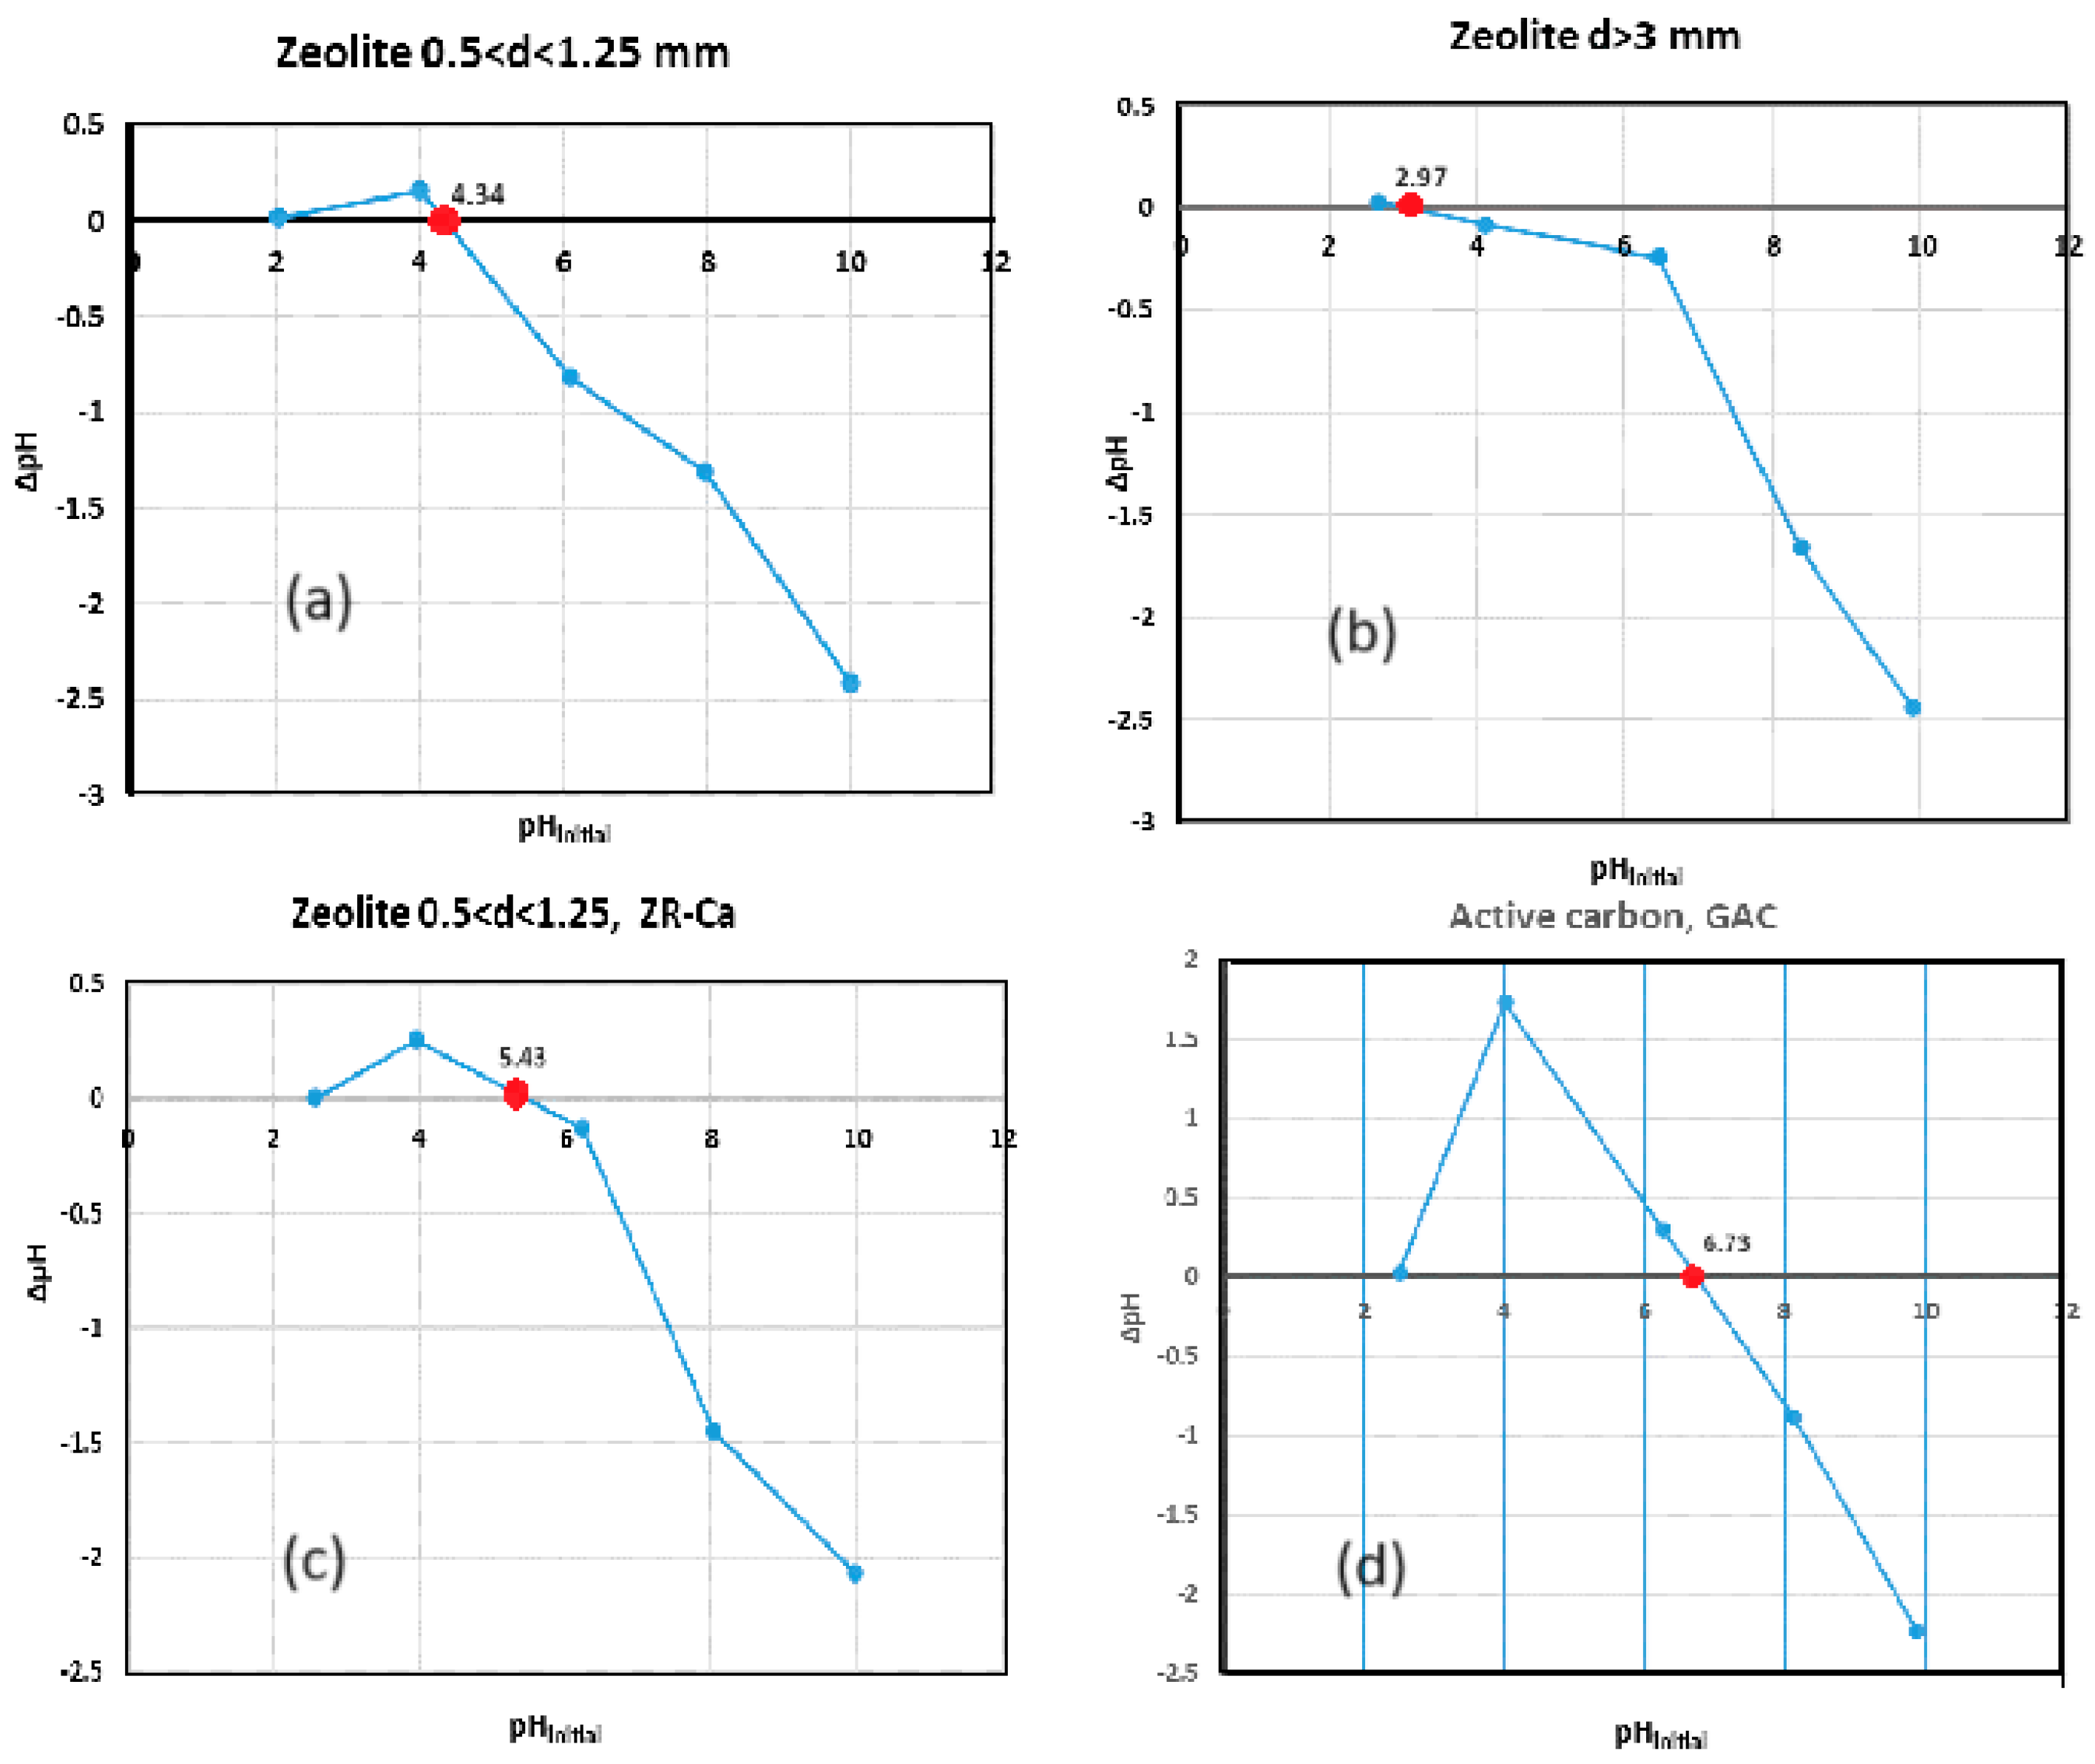
Cotton A. in 2008 highlighted that pHzpc for SiO2 is 2.4, and for Al(IV)2O3 is pH 5–7 and Al(VI)2O3 is pH 8 (where IV and VI represent tetrahedrally and octahedrally co-ordinated Al, respectively). This suggesting that silica is most likely a source of negative charges at higher pH [32]. In ZR clinoptilolite, the higher ratio between Si/Al influences the values of pHzpc. The low pHzpc values of 2.97 for d>3mm and of 4.34 for d>0.5 mm values determines the increase in the pH range for which the adsorbent surface is negative, stimulating the retention processes of positively charged species. The increase in pHzpc values with the decrease in the size of the zeolite particles suggests that the proportion of Si in smaller particles decreases through mechanical processes. Activated carbon is loaded with negative charges from a pH higher than 6.79, which explains the low adsorption capacity of positive ions compared to the very large active surface of 1100 m2/g.
3.2. Adsorption Process
3.2.1. Equilibrium of Adsorption
3.2.1.1. Isotherm of Adsorption
The experiments to obtain the adsorption isotherms for ZR at the three particle sizes and for AC were carried out at a temperature of 20 C, pH=-6.09, at a stirring speed of 150 ratation per minute, and at an initial concentration of the ion ammonium in synthetic solutions ranging from 0 to 50 mg/, the contact time of 93 hours. The experimental results are presented in Figure 5.
Figure 5.
Izotherms of adsorption for ZR and AC.
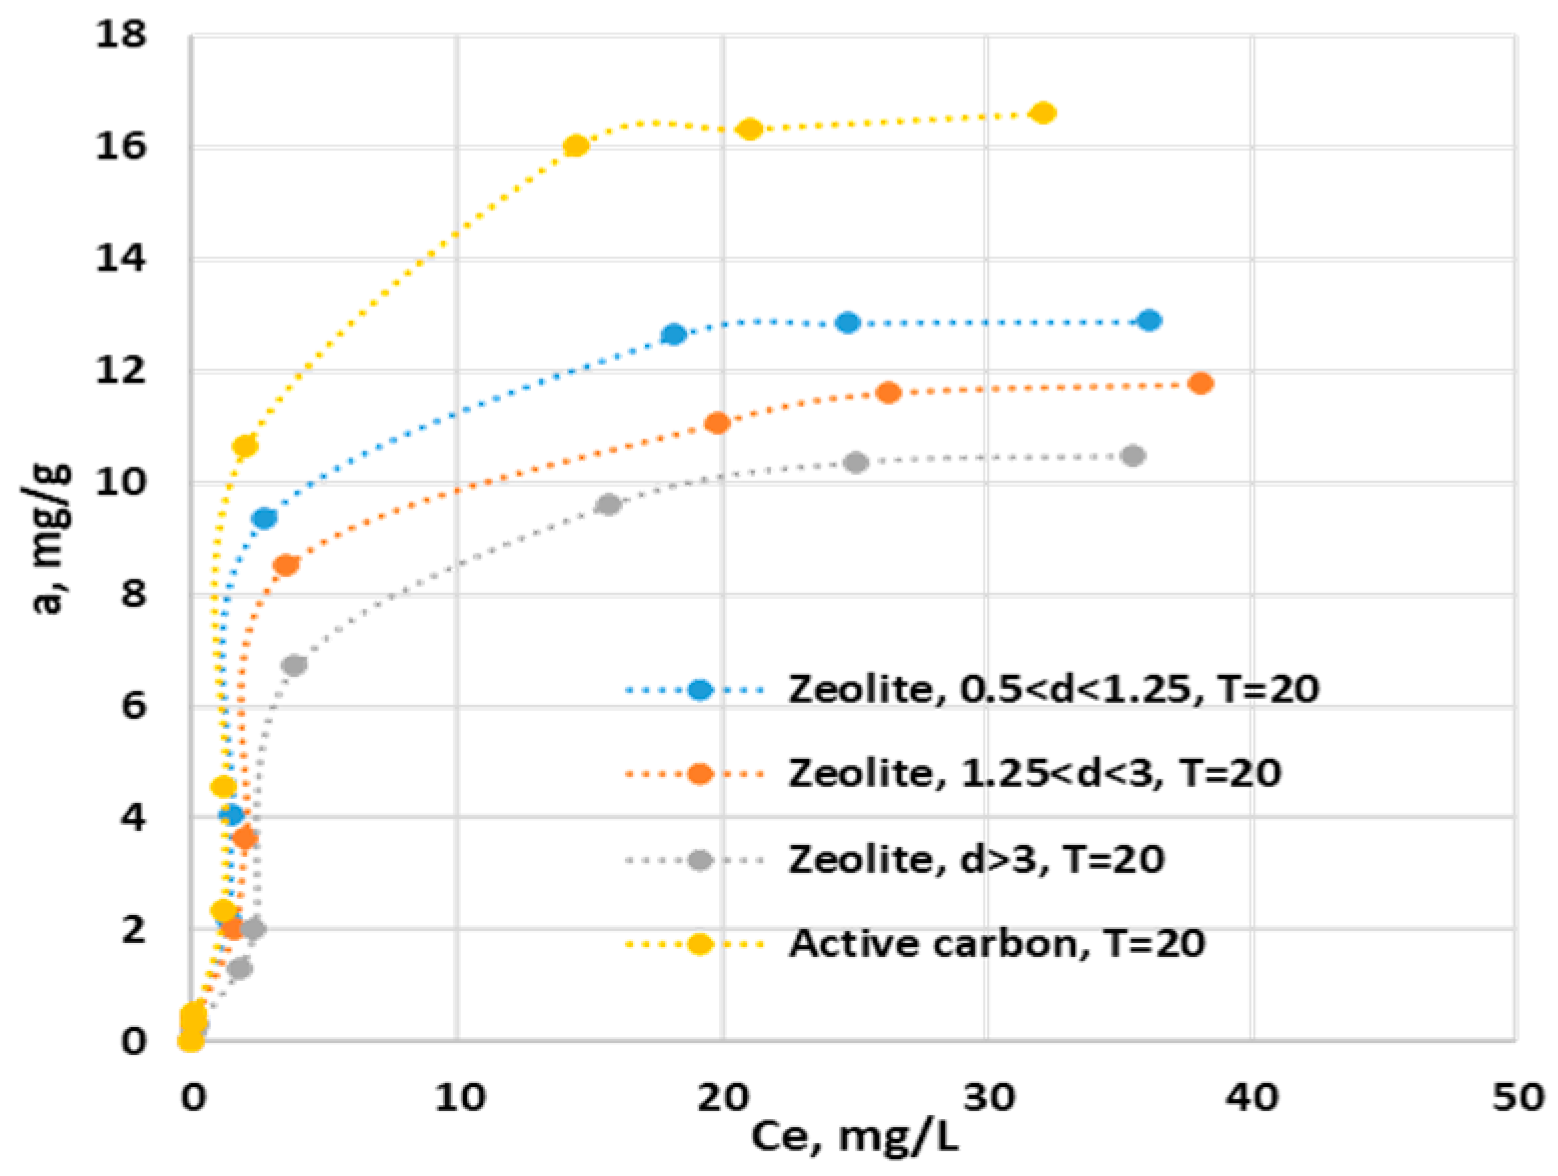
Figure 6.
Effect of temeprature on adsorption capacity of ZR and AC.
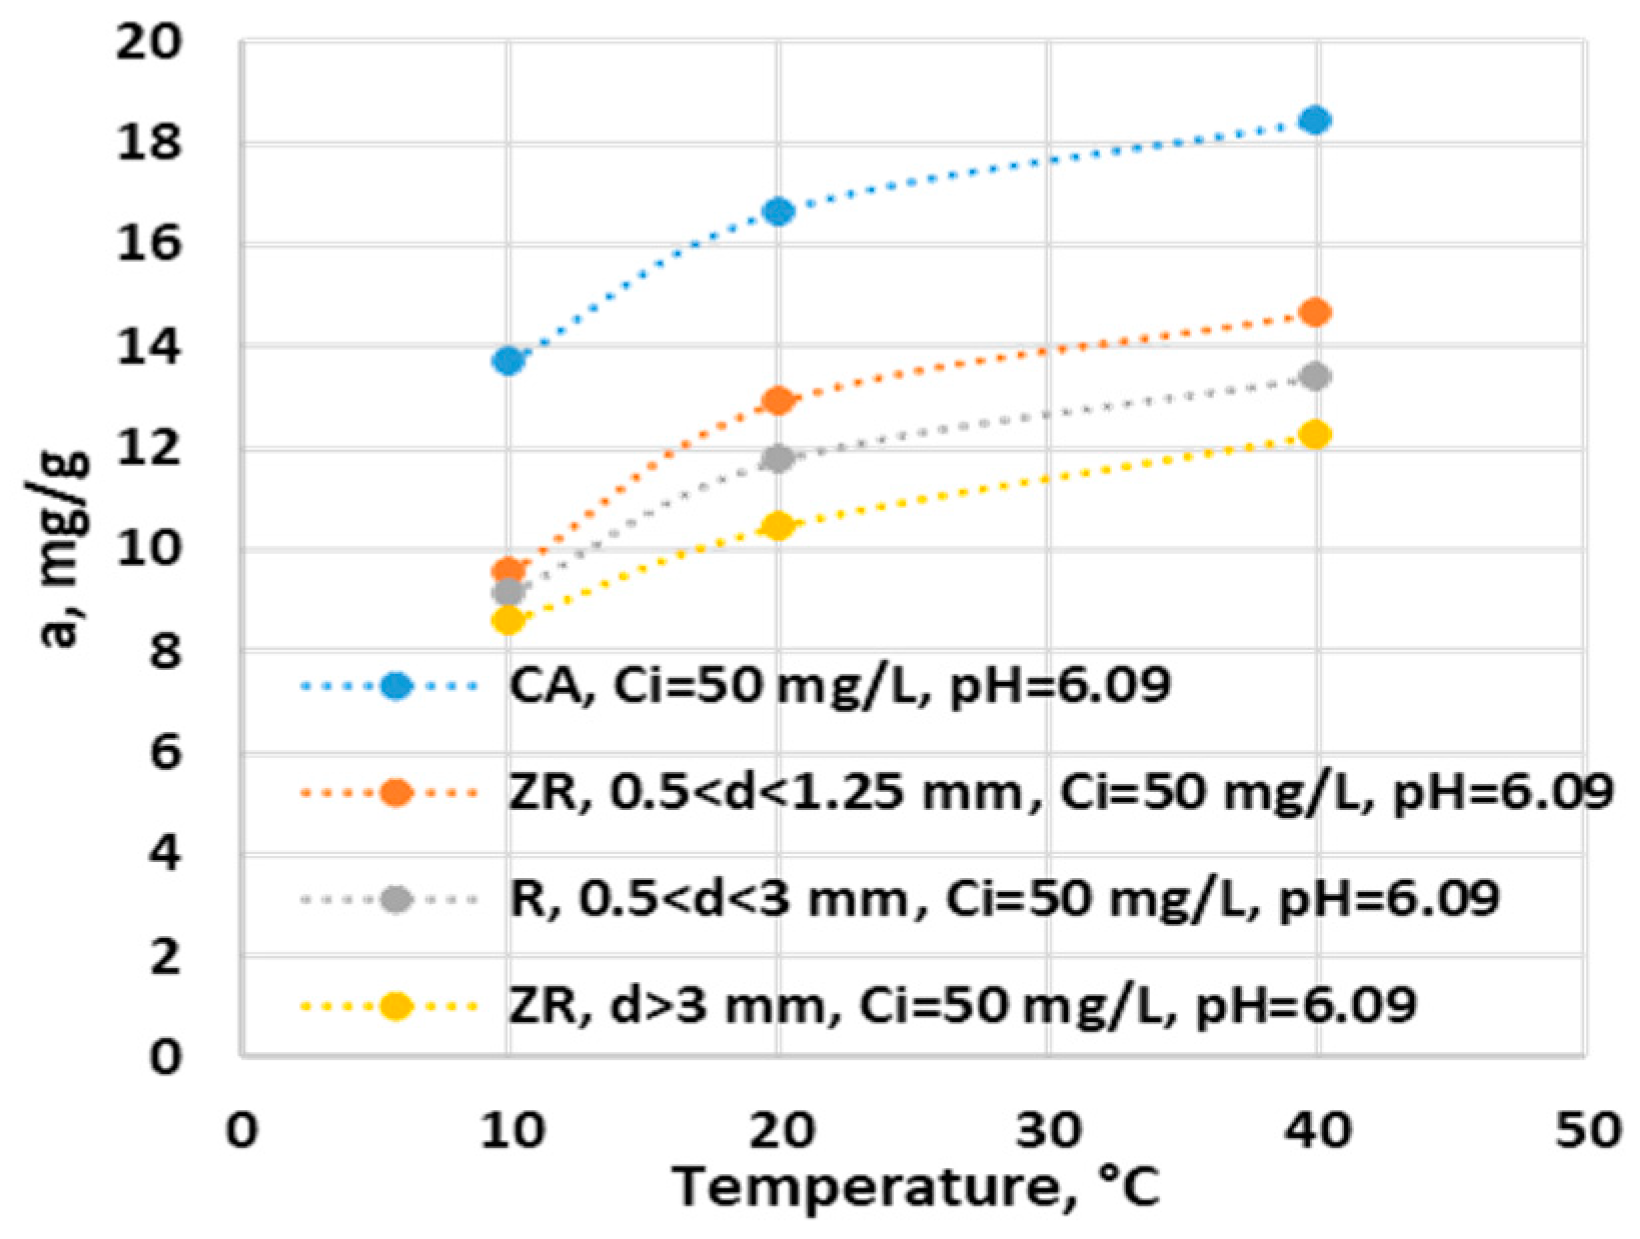
Figure 7.
Effect of initial pH on adsorption capacity of ZR and AC.
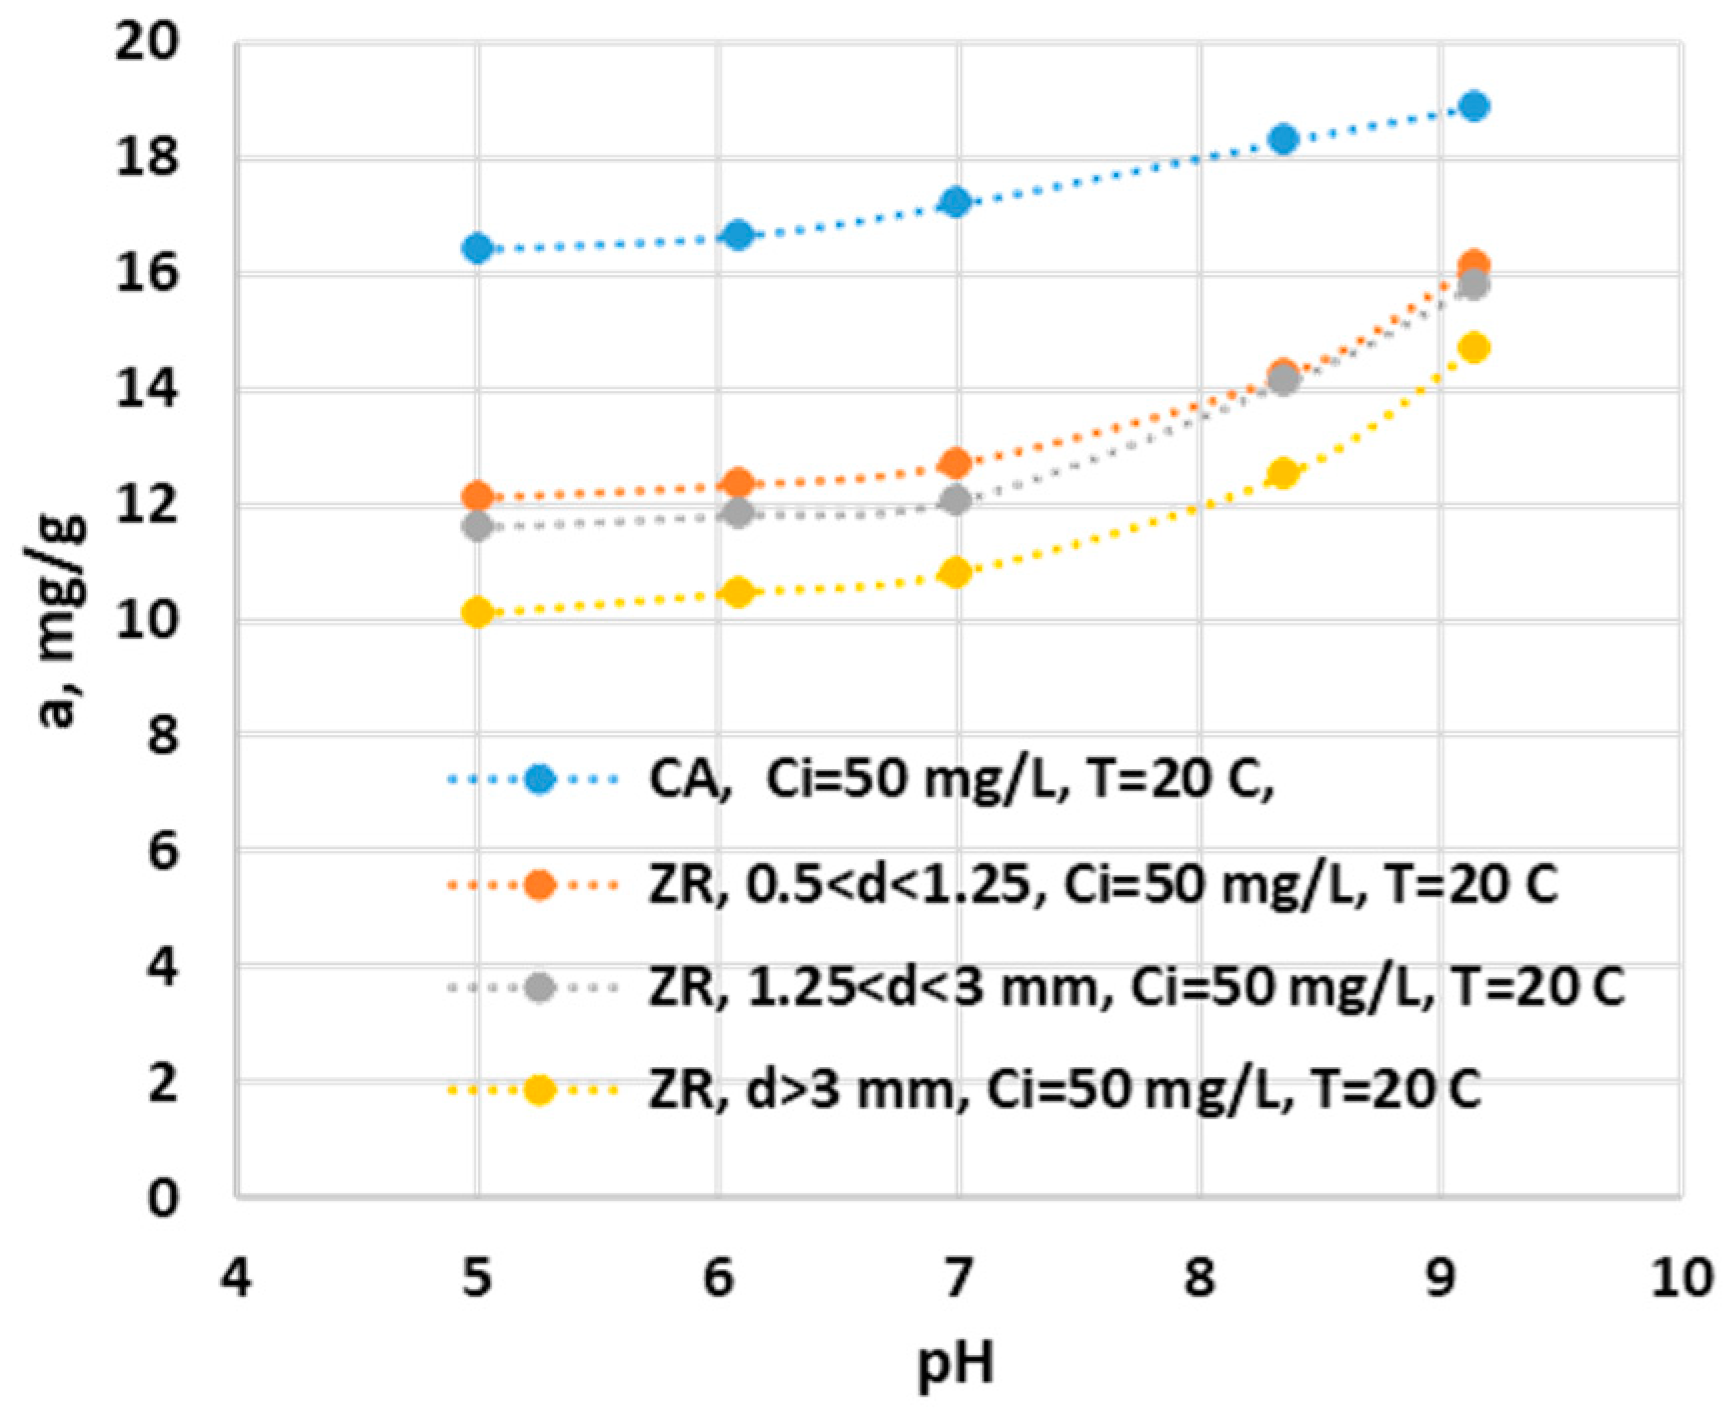
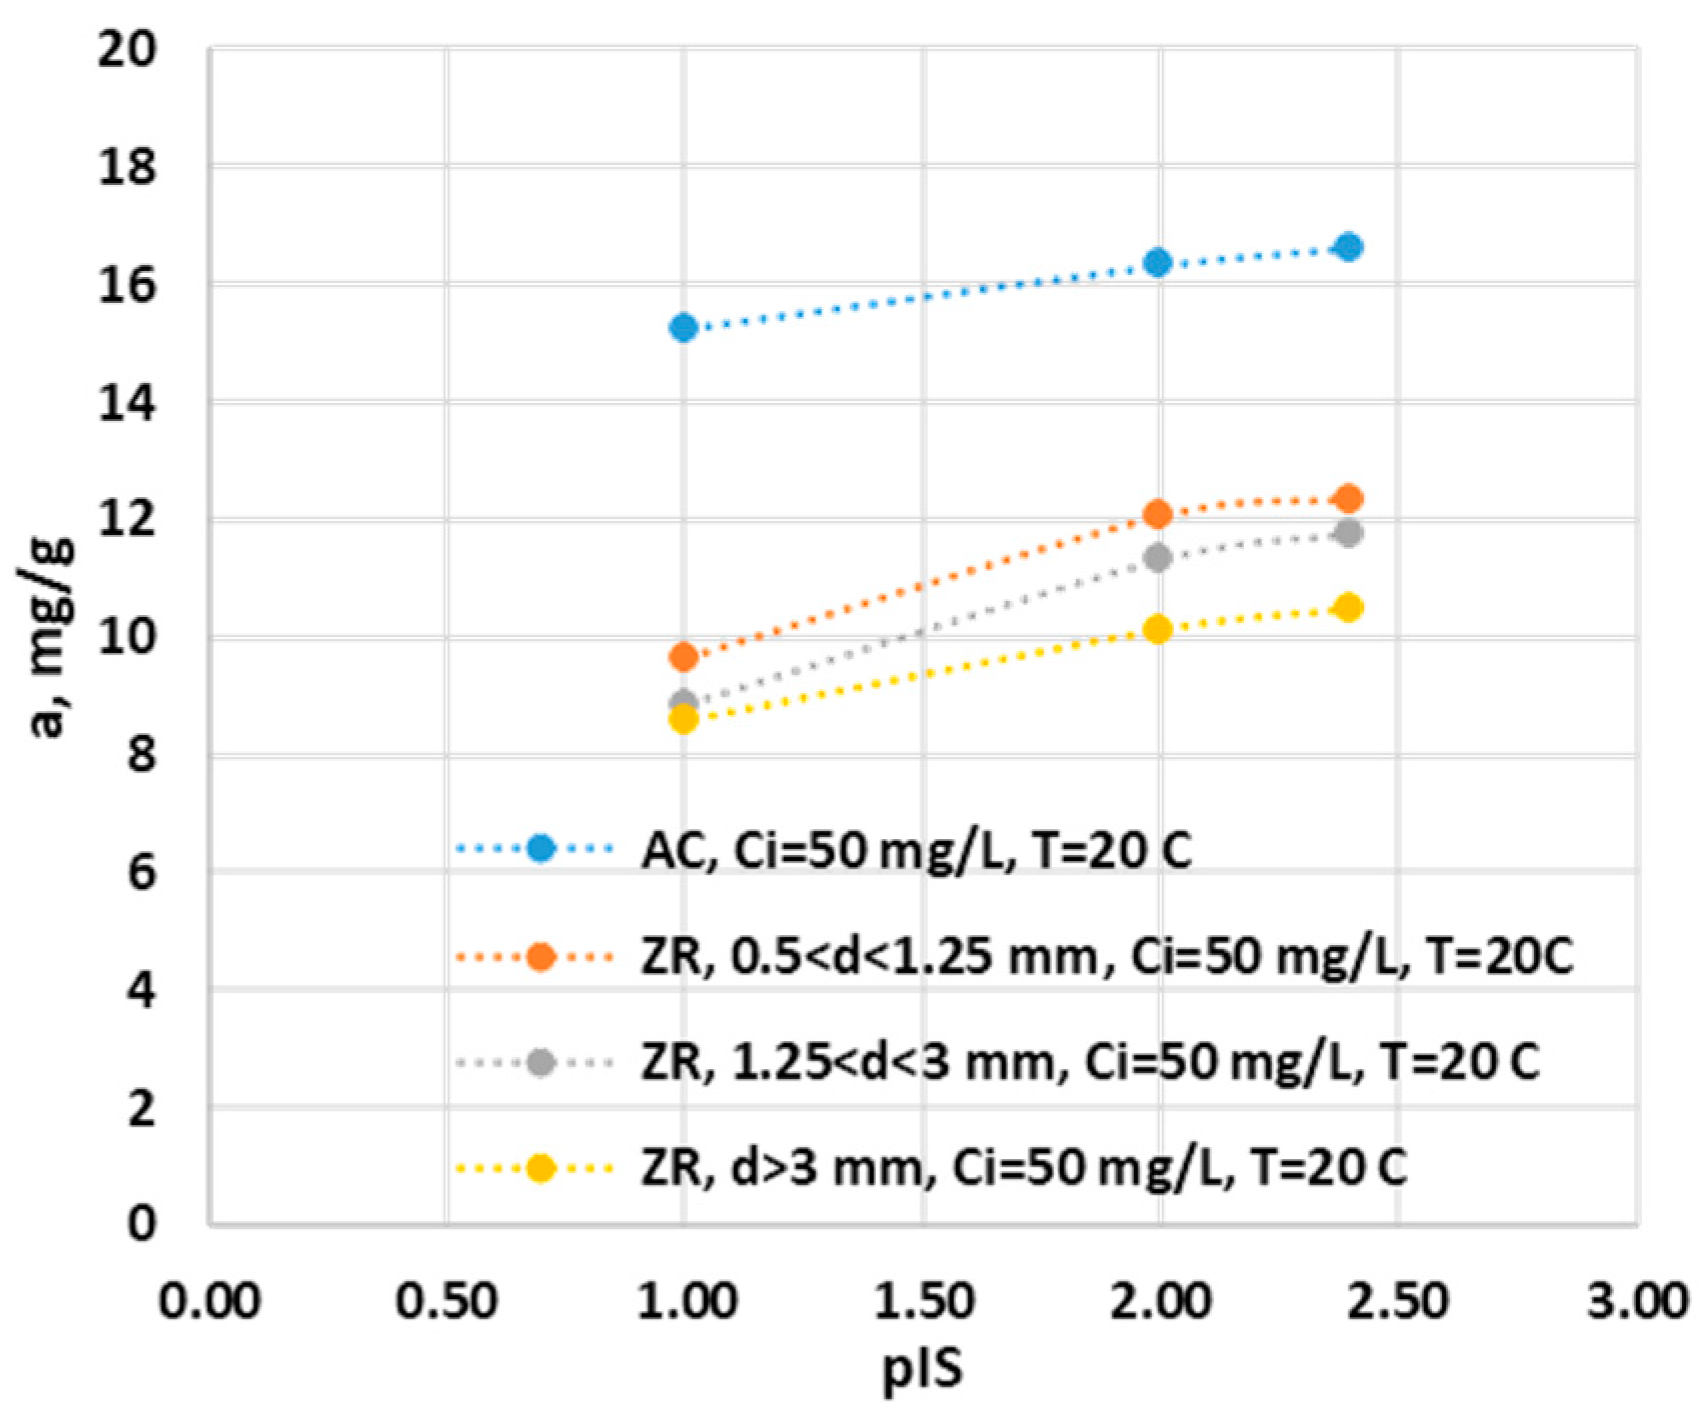
Figure 8.
Effect of ionic streangh on adsorption capacity of ZR and AC.
It can be seen that GAC has an adsorption capacity for ammonium ion that varies depending on the working conditions between 15 and 19 mg/g at an ionic strength of 0.1 M KCl and at zero ionic strength and 40 C respectively. Similar results were obtained by Halim and Latif (2013) for organic acid modified activated carbon whose adsorption capacity was 19.34 mg/g [33]. Other activated carbons obtained from vegetable waste have adsorption capacities betweern 1.7 and 39.2 mg/g [2]. Rupea zeolite has an adsorption capacity for ammonium that decreases with increasing grain size, varying from 12.34 mg/g for 0.5 <d<1.25 mm to 10.46 mg/g for d>3 mm, under the working conditions mentioned in Figure 5. Similar results were obtained for Chinese clinoptilolites (11.2 mg/g) [34], and for natural Iranian zeolites (8.5-10.30 mg/g), [35]. For the zeolitic tuff from Romania, for a granulometry between 0.16 and 0.25 mm, the adsorption capacity was 19 mg/g under similar working conditions [36]. In order to identify the mechanism by which the adsorption process takes place, the experimental data were compared with different mathematical models of Langmuir, Freundlich, Temkin and Dubinin-Radushkevich adsorption isotherms, and which are presented in Table 1, both in non-linear (NL) and linear (L) form, equations 2 - 11. In Table 5, the values of the specific parameters of the mathematical models were presented. They were obtained through the graphic representation of the linearized forms, the identification of the specific equation, the specific coefficients from which the parameters were determined and the mean square deviation, R2. The latter highlights the degree of overlap of the mathematical model on the experimental results, the closer its value is to the value 1, the better the equation describes the process [27].
Table 5.
Parameters of isotherm models for ammonium cations adsorption at 20°C.
| Model | Parameters | Ammonium | |||
|---|---|---|---|---|---|
| Active carbon | ZR 0.5<d<1.25 |
ZR 1.25<d<3 |
ZR d>3 |
||
| Langmuir | aL(mg/g) | 15.22 | 11.99 | 9.50 | 11.04 |
| KL (L/mg) | 0.26 | 0.31 | 0.34 | 0.13 | |
| R2 | 0.990 | 0.991 | 0.990 | 0.970 | |
| Freundlich | 1/n | 0.251 | 0.632 | 0.630 | 0.757 |
| KF (mg/g) | 2.21 | 2.04 | 1.726 | 1.031 | |
| R2 | 0.899 | 0.917 | 0.936 | 0.948 | |
| Temkin | KT (L.mg–1) | 0.0027 | 0.01 | 0.0225 | 0.07 |
| bT (J.mol–1) | 8323.21 | 6328.9 | 5724.2 | 5644.1 | |
| R² | 0.829 | 0.898 | 0.897 | 0.857 | |
| D-R | KD (mol2J–1) | 1.43 | 1.42 | 1.43 | 0.3 |
| am (mg/g)) | 9.41 | 7.95 | 7.09 | 9.74 | |
| E (J.mol-1 ) | 0.59 | 0.59 | 0.59 | 1.58 | |
| R² | 0.825 | 0.854 | 0.845 | 0.812 | |
The results presented in Table 4 show that the Langmuir model best describes the ammonium ion adsorption process on all four adsorbent materials, R 2 having values over 0.970. This suggests that the adsorption process takes place in a monolayer, there is a small number of active sites on the surface of the adsorbent involved in the process, and the binding forces between ammonium and active sites are weak, Van der Waals type [27].
In order to highlight the affinity of the adsorbent for an adsorbate, RL is calculated, a dimensionless constant referred to as separation factor or equilibrium parameter. Relation (19) allows the calculation of RL, where KL (L mol−1) is Langmuir constant and C0 (mol. L−1) the highest initial ions concentration [3,27]
If the values of the RL coefficient are lower than 1, then it means that the adsorption process is favoured. In Table 6 the values of RL calculated for all the adsorbents used are presented
Table 6.
The RL values for ZR and GAC from equation (19).
| dimensionless constant | Ammonium | |||
|---|---|---|---|---|
| GAC | ZR 0.5<d<1.25 mm |
ZR 1.25<d<3mm |
ZR d>3 mm |
|
| RL | 0.5806 | 0.5373 | 0.5142 | 0.7346 |
From Table 6 it can be seen that the values of RL are sub-unit, which proves a high affinity of the studied adsorbents for ammonium ions [25].
3.2.1.2. Influence of Temperature
The temperature influences the adsorption process. It can be observed that the adsorption capacity of the ammonium ion on both activated carbon and zeolite increases with increasing temperature. Thus, between 10 and 40 degrees, the adsorption capacity for the ammonium ion increases by 4.25 mg/g, 5.09 mg/g, 4.31 mg/g and 3.36 mg/g for CAG and zeolite in the increasing order of sizes, respectively, (see Figure 6)
3.2.1.3. Influence of pH
The adsorption capacity of the ammonium ion increased with increasing pH for all adsorbent samples see Figure 7.. The increase in the adsorption capacity for CAG is reduced until the pH value is equal to the pHZPC, after which this increase is constant with the increase in pH. This increase is slow in the range 5.02 -7.0 with a capacity of 0.2 mg/g for each pH unit, after which the increase in capacity is uniform and equal to 1.2 mg/g for each pH unit. ZR also has a slow increase in adsorption capacity of only 0.28 mg/g per pH unit for the range 5.02 - 7.0, after which there is an increase in adsorption capacity for ammonium ion of 1.6 mg/g per pH unit. The sharp increase in the adsorption capacity of the ammonium ion in the basic pH range can be explained by the increase in the concentration of hydroxyl ions in the solution, which stimulates the processes of charging the active surface of adsorbents with negative charges with affinity for the ammonium ion [32]. Added to this is the fact that the hydroxyl ions react with the ammonium ion forming ammonia, a slightly volatile compound that can be removed from the system by desorption through agitation. [3].
3.2.1.4. Influence of Ionic Strength
The ionic strength is another important parameter that influences the adsorption capacity of the ammonium ion on ZR and GAC as seen in Figure 8. To simplify the evaluation, we defined by analogy with the pH:
where [IS] is the ionic strength of the solution expressed in mol/L.
pIS = -log [IS],
Research was done at three ionic states, the initial one introduced by the ammonium ion, and two others introduced by KCl, of 0.01 M and 0.1 M. Work was done at a temperature of 20 C, pH=6.09, the initial concentration of 39 mg/ IT. In Figure 8, we graphically represented the variation of the adsorption capacity of the ammonium ion as a function of pIS for all ZR with the three dimensions and for GAC. It can be observed that as the ionic strength increases, the adsorption capacity decreases for all four adsorbents. With an increase in the ionic strength at a pIS equal to 2, it can be observed that there is a decrease to 98% of the adsorption capacity of GAC, and at a pIS equal to 1, the capacity decreases to 91% compared to the value of the initial adsorption capacity, of 16.64 mg/g. This demonstrates that the active centers on the active surface of GaC do not have a high affinity for the ionic species present in the solution.
Zeolite has a different behaviour. An ionic strength with pIS equal to 2 the adsorption capacity of the ammonium ion decreases to values between 96% and 98% compared to the initial capacity between 10.5-12.34 mg/g. At pIS values of 1, the ammonium ion adsorption capacity is between 75% and 82% of the initial adsorption capacity. This decrease shows us that the active surface has active centres for which the ammonium ion competes with the potassium ion and possibly with other ions. Therefore, there is a possibility that under the conditions of using real waters with a varied content of cationic species, the adsorption capacity for the ammonium ion will be much lower due to the competition between ammonium and the other cations for the active centres.
3.3. Kinetic of Adsorption
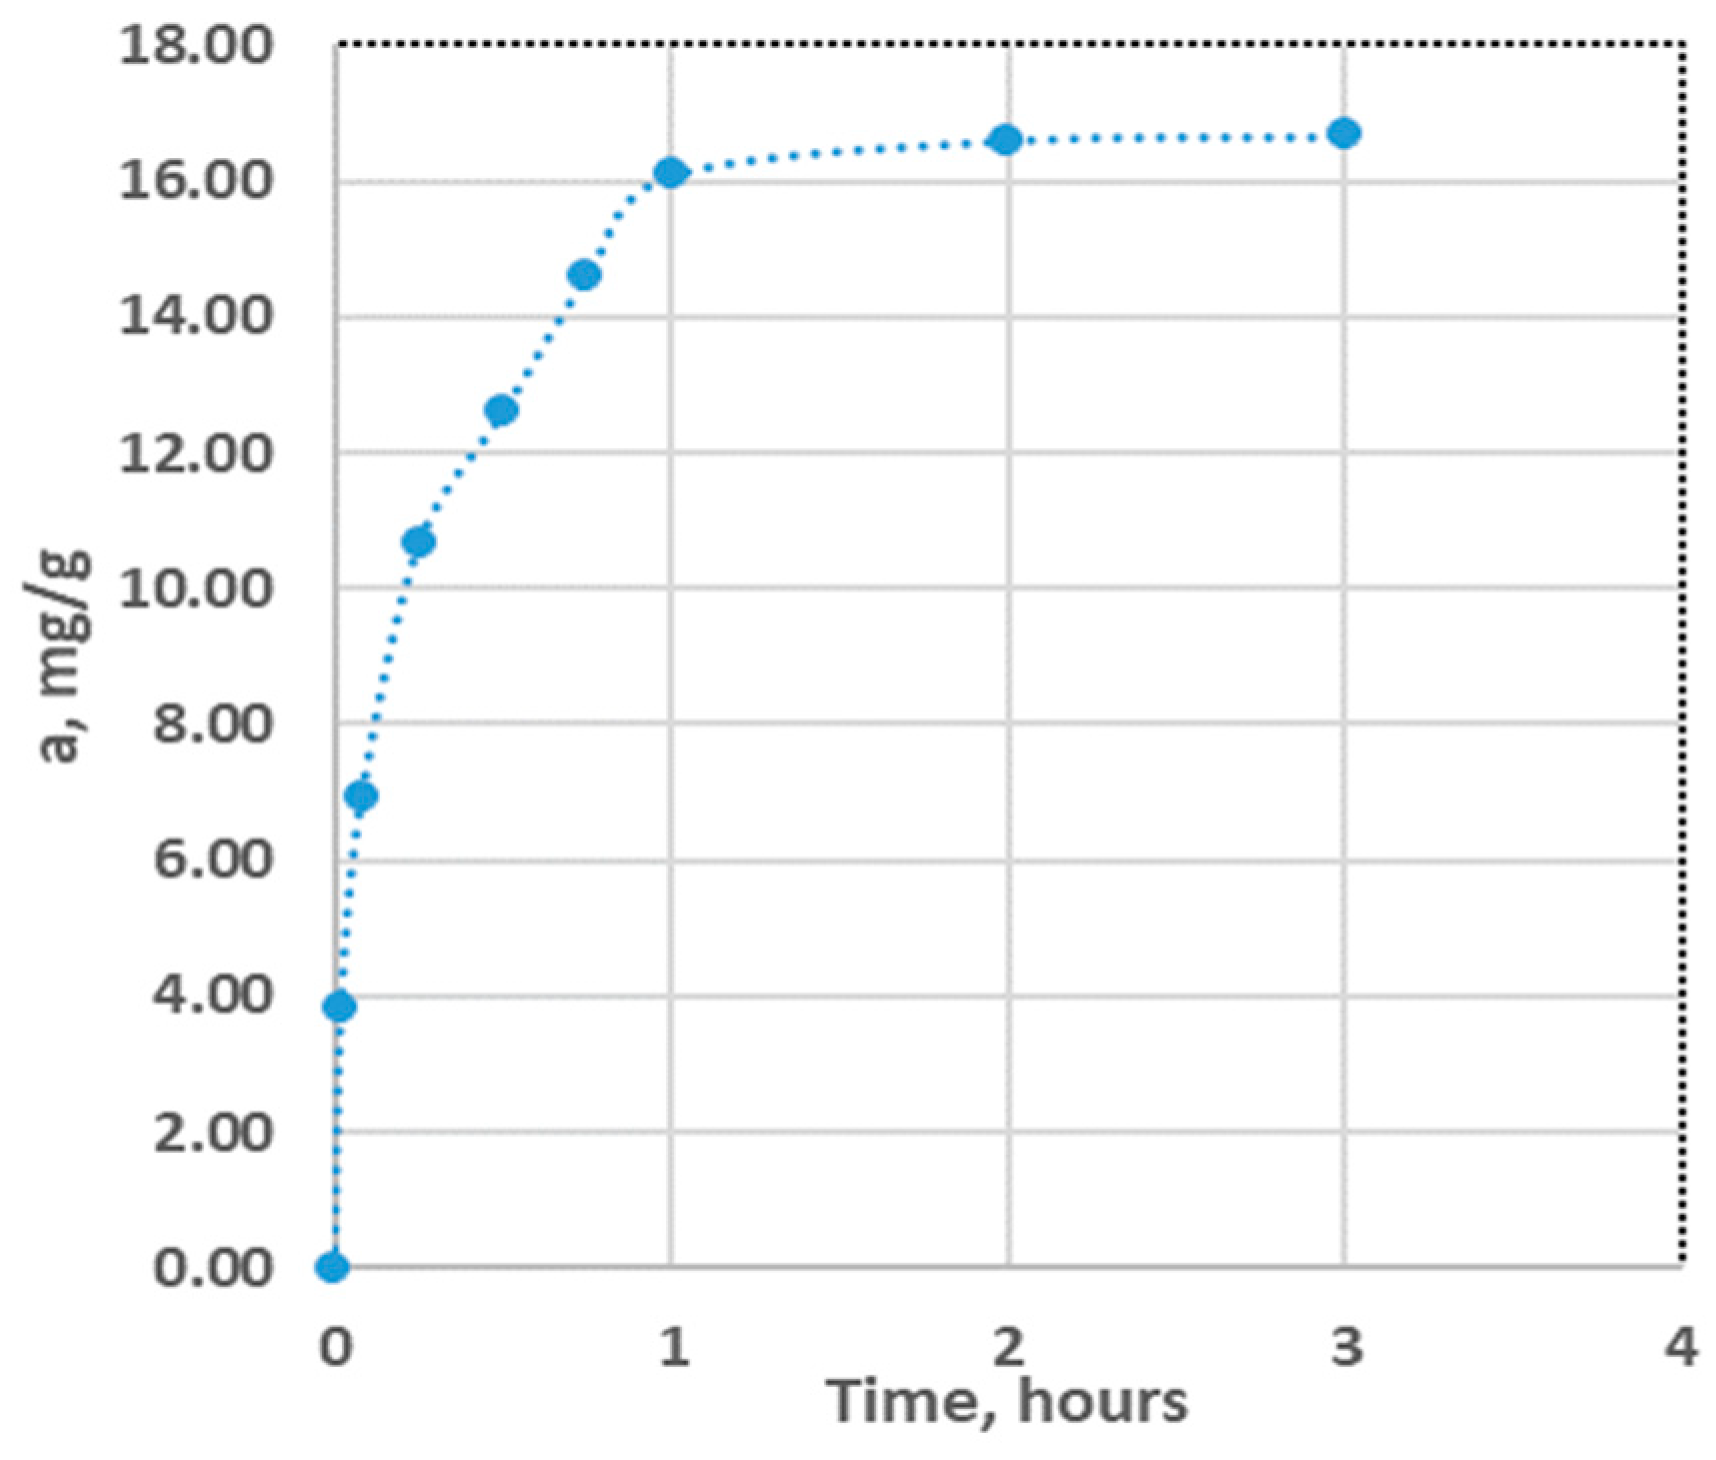
From the analysis of Figure 9, it can be seen that the size of the granule influences the time required to reach the sorption equilibrium of the ammonium ion on ZR, so it is approximately 48, 72 and 93 hours for ZR with 0.5<d<1.25 mm, 1.25<d<3 mm, d>3 mm respectively. In the first 10 minutes of contact, ZR at all sizes retain about 12% of the total adsorption capacity, after 60 minutes the adsorption capacities are 41%, 22.5% and 25.6% for ZR in the order of increasing size respectively. After 48 hours, the adsorption capacities increase to values of 98%, 94% and 85.4% for ZR in order of increasing size. Other studies have been done on ammonium sorption on zeolites, times mentioned as being necessary to reach equilibrium in the range of tens and hundreds of minutes [2] up to 72 hours for New Zealand zeolites and modenites [38]. GAC has a different behavior, it retains 60% of the total adsorption capacity in the first 15 minutes and after two hours it reaches a capacity of 96.6% of this.
Figure 9.
Variation of ZR adsorption capacity for ammonium ion over time.
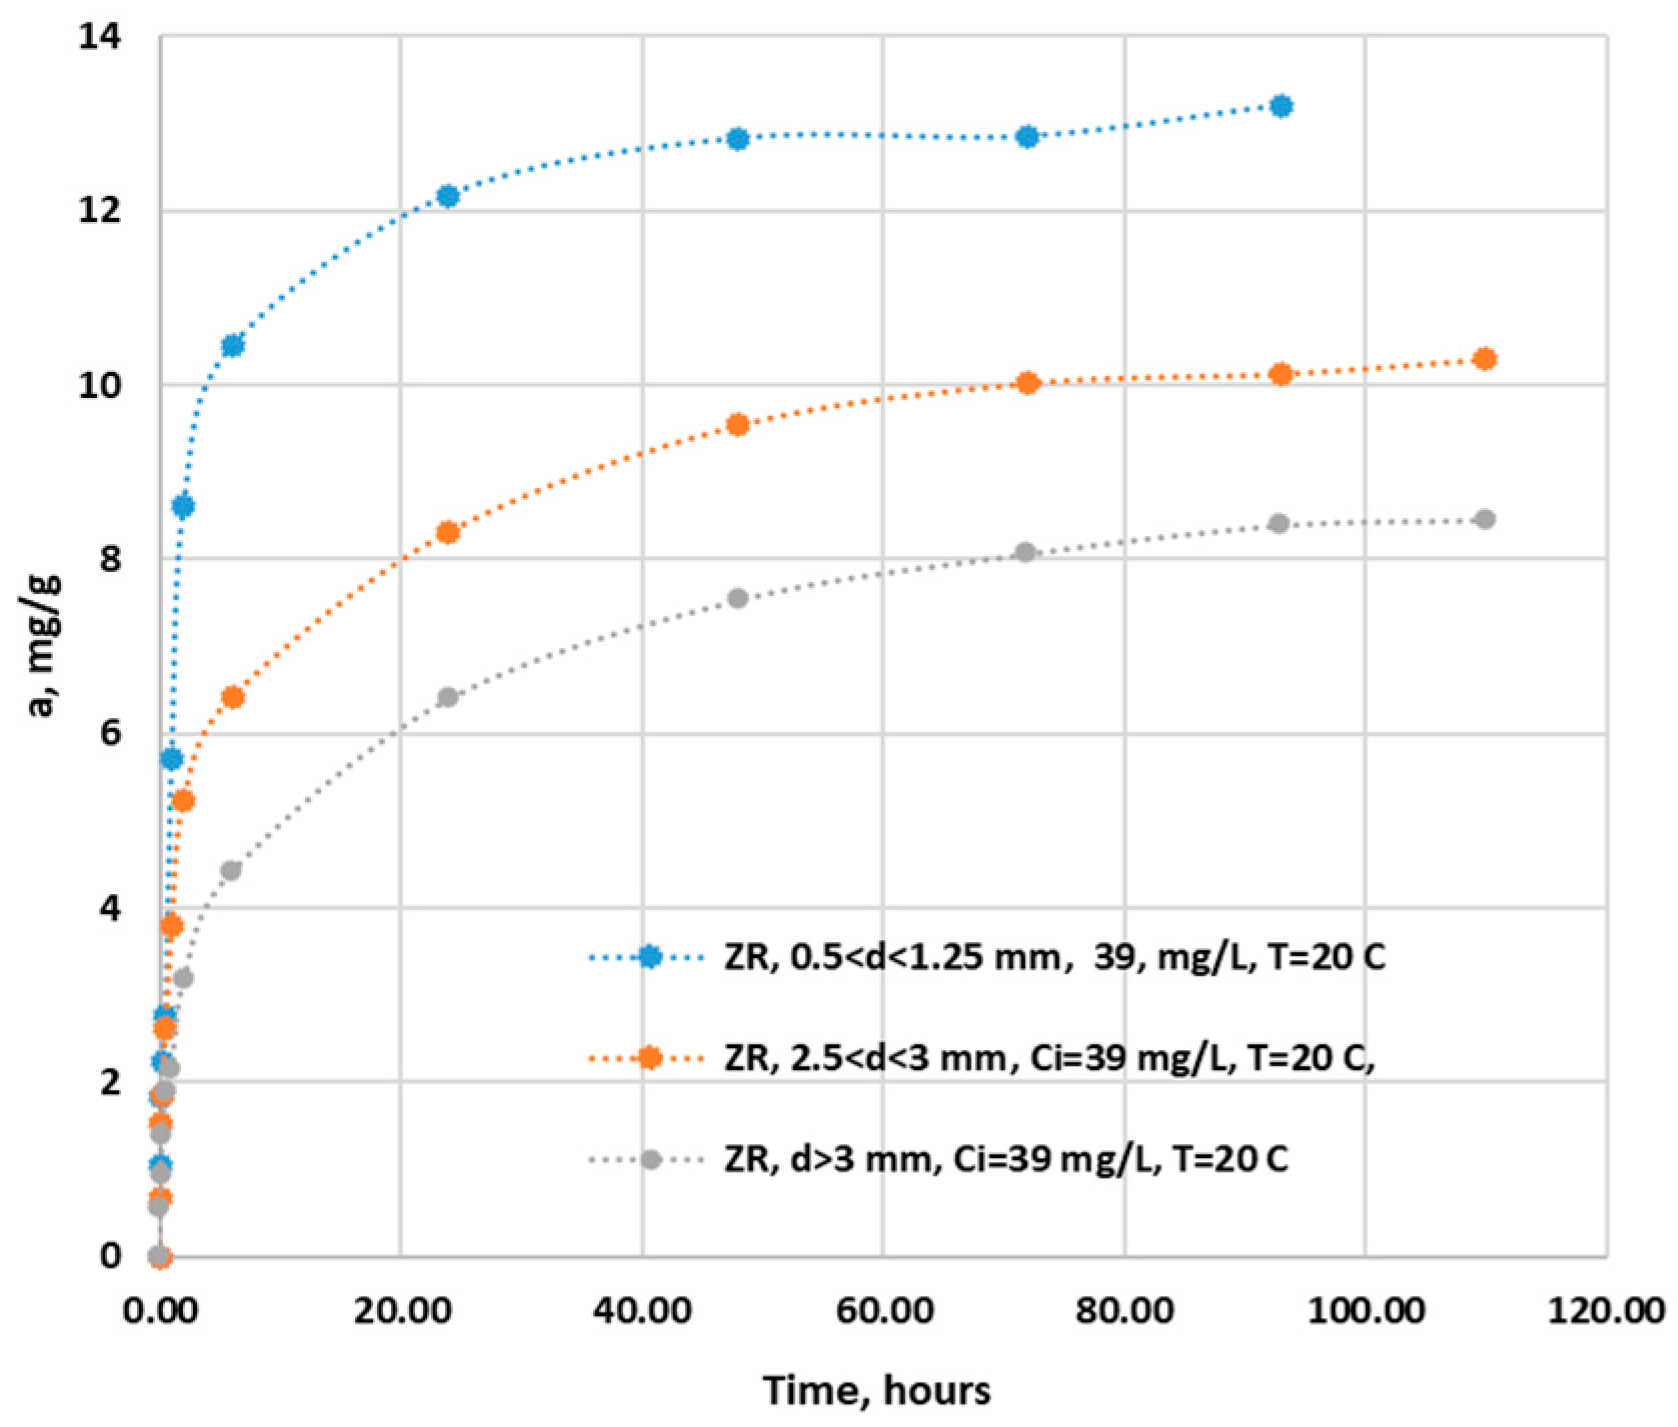
Figure 10.
Variation of CA adsorption capacity for ammonium ion over time.
The kinetic study of the adsorption process is very important because it provides information about the rate at which the adsorption process takes place and the mass transfer mechanism. The kinetics of the adsorption process takes into account the particularities of adsorbents that have a porous structure [29]. The porosity of the adsorbent must be high and the size of the pores must be larger than the size of the chemical species that are adsorbed. Another important parameter is the size of the internal surface of the adsorbent, the larger it is, the better the adsorbent can come into contact with the adsorbate. In order for the adsorbent to perform well, it is absolutely necessary that on the internal surface there is a significant number of active centers that show affinity for the adsorbate and that they are uniformly distributed on the surface.[29]
Table 7.
Characteristic parameters of the kinetic models that describe the adsorption of the ammonium ion on ZR and GAC.
Table 7.
Characteristic parameters of the kinetic models that describe the adsorption of the ammonium ion on ZR and GAC.
| kinetics model | Parameters | Adsorbents | |||
|---|---|---|---|---|---|
| AC GAC |
ZR 0.5<d,1.25 mm |
ZR 1.25<d<3mm |
ZR d>3 mm |
||
| Pseudo- first order model | am,exp (mg/g) | 16.64 | 12.20 | 9.876 | 8.26 |
| K1 (min-1) | 2.75 | 0.0051 | 0.04 | 0.034 | |
| am,cal(mg/g) | 12.97 | 7.84 | 7.042 | 6.59 | |
| R2 | 0.990 | 0.875 | 0.945 | 0.976 | |
| Pseudo-Second order model | am,exp (mg/g) | 16.64 | 12.20 | 9.876 | 8.264 |
| K2 (g.mg-1min-1) | 0.018 | 0.056 | 0.043 | 0.036 | |
| am,cal(mg/g) | 14.1 | 12.24 | 9.794 | 8.21 | |
| R2 | 0.964 | 0.999 | 0.9985 | 0.995 | |
| Elovich model | am,exp(mg/g) | 16.64 | 12.20 | 9.876 | 8.264 |
| α | 0.0063 | 0.0026 | 0.018 | 0.018 | |
| β | 6.834 | 1.63 | 1.32 | 1.32 | |
| R2 | 0.984 | 0.941 | 0.951 | 0.951 | |
| Intra-particle diffusion | KInt(mg.g-1min-1/2) | 0.2384 | 1.21 | 0.97 | 0.74 |
| CI | 0.671 | 2.43 | 1.2 | 1.3 | |
| R2 | 0.943 | 0.790 | 0.895 | 0.947 | |
The mass transfer kinetics in the adsorption process takes place in three stages: external diffusion determined by the concentration difference between the solution and the adsorbent surface; internal diffusion that depends on the size of the pores and the adsorbed species; and the proper adsorption at the level of the active center where physical or chemical processes take place between the active center and adsorbates [37.].
To characterize the kinetics of the ammonium ion adsorption process on zeolites ZR and CA, they chose pseudo first order, pseudo second order, Elovich, and intra-particle diffusion mathematical models. In Table 2 are the mathematical equations that characterize the different kinetics models. From Table 7 it can be seen that the kinetics of the ammonium ion adsorption process on ZR zeolite for all three dimensions is best characterized by the pseudo second order mathematical model, the values of R2 are between 0.995 -0.999.
In this case, the retention of the ammonium ion is controlled by the stage of the chemical adsorption process, that is, the reaction between the active center and the ammonium ion. In this situation, the concentration of the ammonium ion in the solution in the pores is equal to its concentration outside the granule. This model characterizes the materials that have a very large number of active centers, uniformly distributed on the specific surface of the adsorbent and the concentration of the adsorbate is low [29.]. The zeolite ZR has an active surface of 41 m2/g and an adsorption capacity of 12.34 mg/g, which proves that there is a large number of active centers that are involved in adsorption or ion exchange processes.
The kinetics of the ammonium ion adsorption process on CAG is best characterized by the pseudo first order kinetic model, R2 is 0.990. This kinetic model is specific to processes in which the adsorbents have a small number of active cents that react with ammonium, the concentration of ammonium is very high and the rate-determining step is either external diffusion or internal diffusion [29]. Although activated carbon has a specific surface area of 1100 m2/g, 23 times greater than ZR, the ammonium ion retention capacity is reduced by only 16.7 mg/g. Active cents can contain hydroxyl, carboxyl groups that can react with the ammonium ion, the process can be especially a Van der Waals type physical process.
The characteristic values of the specific parameters of all kinetic models are presented in Table 7
5. Conclusions
This paper presents a comparison between efficiency of Zeolite type clinoptilolite from Romania with Granular Activated carbon Norit GAC 830 E, an adsorbent frequently used in water treatment. The choice of this absorbent was not accidental. Zeolite is found in very large deposits in Romania, it is a natural, cheap material, with costs between 50-100 Euro/ton compared to other adsorbents that cost over 500 Euro/ton and which can be regenerated and reuse in the technological process of water treatment and purification, but also after exhaustion as an amendment for the soil. The zeolite type clinoptilolite from Romania is a material that meets all the conditions to be called sustainable.
The main cristallyne form present in ZR are Ca Clinoptinolite ((Na1.32K1.28Ca1.72Mg0.52 ) (Al6.77Si29.23O72)(H 2O)26.84), over 80 %, with a ratio of Si/ Al greater than 4. The size of the pores is predominantly of the order of micrometers. The adsorption capacity of the zeolite for the three dimensions. The pH for which the number of positive charges is equal to the number of negative charges, ZPC pH, is between 2.97 and 4.34 for zeolite and 6.79 for GAC. The adsorption capacity of ammonium ion from synthetic solutions, at 20 °C, pH = 6.09, for the range of initial concentrations 0 - 50 mg/L for Rupea Zeolite is in the range of 10.46 mg/g -12.34 mg/g and for granular activated carbon GAC W830 is 16.64 mg/g. It was found that the increase in temperature and pH have a positive effect on the adsorption capacity of the ammonium ion on the studied adsorbents, and the ionic strength determines the decrease in the adsorption capacity. The Langmuir isotherm proved to be the most appropriate to describe the adsorption of ammonium ions on all types of adsorbents used. Kinetic models were also identified that best describe the experimental processes. The results of the investigation showed that second-order kinetics governs the adsorption process on ZR zeolites and pseudo-first order for activated carbon.
Author Contributions
Conceptualization, D.S.S. and M.S.; Data curation: D.S.S. methodology, D.B.. and M.S.; software, D.S.S.; validation, M.S., T.H.A., and N.C.M. formal analysis, T.H.A..; investigation, T.H.A..; resources, D.S.S.; writing—original draft preparation, D.S.S.; T.H.A. writing—review and editing, D.B., N.C.M. visualization, M.S.; supervision, M.S,; funding acquisition, D.S.S. All authors have read and agreed to the published version of the manuscript.
References
- Li P, Wu J, Qian H, Zhang Y, Yang N, Jing L, Yu P., Hydrogeochemical characterization of groundwater in and around a wastewater irrigated forest in the Southeastern Edge of the Tengger Desert, Northwest China, Expo Health, 2016, 8, pp. 331–348. [CrossRef]
- Huang J., Kankanamge N. R., Chow C., Welsh D.T., Li T., Teasdale P.R., Removing ammonium from water and wastewater using cost-effective adsorbents: A Review, Journal of Environmental Science, 2018, 63, pp. 174-197. [CrossRef]
- Abed T. H., Ștefan D. S., Pauna G., Ștefan M., Study of the effectiveness of membrane aeration systems on the removal of ammonium ions from natural waters, U.P.B. Scientific Bulletin, Series B, 2024, 86, pp.
- Gao Y., Yu G., Luo C., Zhou P., Groundwater nitrogen pollution and assessment of its health risks: a case study of a typical village in rural-urban continuum, China, Plos One, 2012, 7, pp. 1–8, e33982. [CrossRef]
- Turan, M., Application of nanoporous zeolites for the removal of ammonium from wastewaters: a review, low-dimensional and nanostructured materials and devices. Springer, 2016. pp. 477–504. Application of Nanoporous Zeolites for the Removal of Ammonium from Wastewaters: A Review | SpringerLink Application of Nanoporous Zeolites for the Removal of Ammonium from Wastewaters: A Review | SpringerLink;
- Boopathy, R., Karthikeyan, S., Mandal, A.B., Sekaran, G., Adsorption Of Ammonium Ion By Coconut Shell-Activated, Carbon From Aqueous Solution: Kinetic, Isotherm, And Thermodynamic Studies, Environmental Science Pollutants Research, 2013, 20, pp. 533–542. [CrossRef]
- Dey S., Charan S.S., Pallavi U., Sreenivasulu A., Haripavan N., The removal of ammonia from contaminated water by using various solid waste biosorbents, Energy Nexus, 2022, 7, 100119. [CrossRef]
- Sica, M., Duta, A., Teodosiu, C., Draghici, C., Thermodynamic and kinetic study on ammonium removal from a synthetic water solution using ion exchange resin, Clean Technologies and Environmental Policy, 2014., 16, pp.351–359. [CrossRef]
- Gupta, V., Sadegh, H., Yari, M., Shahryari Ghoshekandi, R., Maazinejad, B., Chahardori, M., Removal of ammonium ions from wastewater: a short review in development of efficient methods, Global Journal of Environmental Science Management, 2015. 1, pp. 149–158.
- Yang Y., Liu H., The mechanisms of ozonation for ammonia nitrogen removal: an indirect process. Journal of Environmental Chemical Engineering, 2022, 10 (5), 108525. [CrossRef]
- Zhang C., He D., Ma J., Waite T.D., Active chlorine mediated ammonia oxidation revisited: Reaction mechanism, kinetic modelling and implications, Water Research, 2018, 145, 15, pp. 220-230. [CrossRef]
- Liu C., Chen Y., He C., Yin R., Liu J. and Qiu T., Ultrasound-Enhanced Catalytic Ozonation Oxidation of Ammonia in Aqueous Solution, International Journal of Environmental Research and. Public Health, 2019, 16(12), 2139. [CrossRef]
- Bodalo, A., Gomez, J.-L., Gomez, E., Leon, Gerardo, Tejera, M., Ammonium Removal From Aqueous Solutions By Reverse Osmosis Using Cellulose Acetate Membranes. Desalination, 2005, 184, pp 149–155. [CrossRef]
- Zuo R., Chen X., Li X., Shan D., Yang J., Wang J., Teng Y., Distribution, genesis, and pollution risk of ammonium nitrogen in groundwater in an arid loess plain, northwestern China, Environmental Earth Science, 2017, 76:629. [CrossRef]
- Potting J., Hekkert M., Worrell E. and Hanemaaijer A., Report Circular Economy: Measuring Innovation In The Product Chain, Policy Report January 2017, 1PBL Netherlands Environmental Assessment Agency, 2017, pbl-2016-circular-economy-measuring-innovation-in-product-chains-2544.pdf.
- Hungaro Arruda E., Brancalhão Melatto R.A,P., Levy W., Conti D., Circular economy: A brief literature review (2015–2020), Sustainable Operations and Computers 2021, 2, pp. 79–86. [CrossRef]
- Han B., Butterly C., Zhang W., Zheng He J., Chen D., Adsorbent Materials For Ammonium And Ammonia Removal: A Review, Journal of Cleaner Production, 2012, 283, 10, 124611. [CrossRef]
- Khosravi, A., Esmhosseini, M., Khezri, S., Removal of Ammonium Ion From Aqueous Solutions Using Natural Zeolite: Kinetic, Equilibrium And Thermodynamic Studies, Research on Chemical Intermediates, 2014, 40, pp. 2905–2917. [CrossRef]
- Millar, G.J., Winnett, A., Thompson, T., Couperthwaite, S.J., Equilibrium Studies of Ammonium Exchange With Australian Natural Zeolites. Journal of Water Processes Engineering, 2016, 9, pp. 47–57. [CrossRef]
- Clark, R.N., Swayze, G.A., Gallagher, A.J., King, T.V., Calvin, W.M., 1993. The Us Geological Survey, Digital Spectral Library, Version 1 (0.2 To 3.0 Um). Geological Survey (US).
- Directive EU 2020/2184 on the quality of water intended for human consumption (recast), drinking water — essential quality standards (europa.eu).
- Council Directive 91/271/Eec Of 21 May 1991 Concerning Urban Waste-Water Treatment, Directive - 91/271 - EN - EUR-Lex (europa.eu).
- Concil of European Union , Interinstitutional File: 2022/0345(Cod, Proposal for A Directive of the European Parliament and of the Council Concerning Urban Wastewater Treatment (Recast, Pdf (Europa.Eu).
- Lurie I. I., Director of analytical chemistry, Te chnical publishing house, Bucharest, 1970, pp 250-252.
- [25]/ Aziam R., Stefan D.S., Nouaa S., Chiban M. And Bosomoiu M., Adsorption of metal ions from single and binary aqueous systems on bio-nanocomposite, alginate-clay, Nanomaterials, 2024, 14, pp 362-383. [CrossRef]
- Ngenoa E. C., Shikukua V.O., Orataa B.F., Barazaa L.D. and Kimosopa S.J., Caffeine and Ciprofloxacin Adsorption from Water Onto Clinoptilolite: Linear Isotherms, Kinetics, Thermodynamic And Mechanistic Studies, Shouth AfricanJournal of Chemistry., 2019, 72, pp. 136–142. [CrossRef]
- Wang J., Guo X.., Adsorption isotherm models: Classification, physical meaning, application and solving method, Chemosphere, 2020, 127279 . [CrossRef]
- Ghouti M. A.Al., Da'ana A. A., Guidelines for the use and interpretation of adsorption isotherm models: a review, Journal of Hazardous Materials, 2020, 393 (5), pp 122383. [CrossRef]
- Wang J. Guo X., Adsorption Kinetic Models: Physical Meanings, Applications, and Solving Methods, Journal Of Hazardous Materials, 2020, 390(15), pp 12215. [CrossRef]
- Dura A. M., Stefan D.S., Chiriac F. L., Trusca R., Nicoara A. I. and Stefan M., Clinoptilolite—A Sustainable Material for the Removal of Bisphenol A from Water, Sustainability, Special Issue "Innovative Treatments for Wastewater and Natural Water: Towards a Modern and Sustainable World", 2023, 15(17), 13253. [CrossRef]
- Norit Gac 830 W: Datasheet. Specification (Technical Standard). Carbon. Norit Gac 830 W: Datasheet | PDF | Specification.
- Cotton A., Research article Dissolution kinetics of clinoptilolite and heulandite in alkaline conditions, Biohorizons, 2008, 1(1). [CrossRef]
- Halim, M.T., Latif, A.I., Ammonia Removal from Aqueous, Solution Using Organic Acid Modified Activated Carbon. World Applied Sciences Journal, 2013, 24, pp 1–6 . [CrossRef]
- Wang, Y.F., Lin, F., Pang, W.Q., 2007. Ammonium Exchange n Aqueous Solution Using Chinese Natural Clinoptilolite and Modified Zeolite, Journal of Hazardous Materials, 2007, 142, pp 160–164. [CrossRef]
- Mazloomi, F., Jalali, M., Ammonium Removal from Aqueous Solutions by Natural Iranian Zeolite in The Presence of Organic Acids, Cations and Anions, Journal of Environmental Chemical Engineering, 2016, 4, pp 240–249. [CrossRef]
- Marañón, E., Ulmanu, M., Fernández, Y., Anger, I., Castrillón, L., 1540 2006. Removal ff Ammonium from Aqueous Solutions with Volcanic Tuff, Journal of Hazardous Materials. 2006, 137, pp 1402–1409. [CrossRef]
- Tien, C., Ramarao, B.V., Further Examination of the Relationship Between the Langmuir Kinetics and the Lagergren and the Second-Order Rate Models of Batch Adsorption, Separation and Purification Technology 2014, 136, pp 303–308. [CrossRef]
- Weatherley, L.R., Miladinovic, N.D., 2004. Comparison of the Ion Exchange Uptake of Ammonium Ion Onto New Zealand Clinoptilolite and Mordenite. Water Resources. 2004, 38, pp 4305–4312. [CrossRef]
Table 1.
Characteristic mathematical equations for adsorption isotherms models [25–28].
| Isotherm model |
Form type |
Mathematic relation | Parameters signification |
|---|---|---|---|
| Langmuir | NL | (2) |
-adsorption capacity, mg/g; Ce - equilibrium concentration, mg/l, aL- maximum adsorption capacity, mg/g KL - Langmuir constant, L/mg |
| L | (3) | ||
| Freundlich | NL | (4) |
ae - adsorption capacity, mg.g–1; Ce - equilibrium concentration, mg/L; KF - Freundlich constant, mg.g–1; n - empirical constant related to heterogeneity of the adsorbent surface. |
| L | (5) | ||
| Temkin | NL | (6) |
T - temperature, K; R - universal gas constant, 8.314, J.mol-1K-1; bT - Temkin isotherm constant related to the heat of adsorption, J/mol; KT - equilibrium constant for the maximum binding energy, L/mg. |
| L | (7) | ||
| Dubinin-Radushkevich. | NL | (8) |
am maximum adsorption capacity, mg/g; ε - Polanyi potential that can be calculated from Eq. 10 Ce - equilibrium concentration, mg/L; KD -- constant, (mol2 J–2) |
| L |
(9) (10) E= (11) |
Table 2.
Characteristic mathematical equations for kinetics adsorption models [24,25,29].
| Kinetic model |
Form type |
Mathematic relation | Parameters signification |
|---|---|---|---|
| Pseudo- first order | NL | (12) |
am - adsorption capacity at equilibrium, mg.g–1; at- adsorption capacity at moment t, mg/g k2 - rate constant for the pseudo-first order kinetics model, (g.mg-1min-1) t, contact time t, min. |
| L | (13) | ||
| `Pseudo-Second order | NL | (14) |
am - adsorption capacity, mg.g–1; at- adsorption capacity at moment t, mg/g k2 - rate constant for the pseudo-second order kinetics model, g.mg-1min-1 t - contact time t, min. |
| L | (15) | ||
| Elovich | NL | (16) |
at -adsorption capacity at time t, mg/g t-time, minute α - initial adsorption rate, mg. g−1.min−1, β - desorption constant, g.mg−1; |
| L | (17) | ||
| Intra-particle diffusion | L | (18) |
KID - intra-particle diffusion rate constant, mg-1·min1/2 cID - ammonium concentration, mg/L at - adsorption capacity at moment t, mg.g-1; t - contact time, minutes. |
Disclaimer/Publisher’s Note: The statements, opinions and data contained in all publications are solely those of the individual author(s) and contributor(s) and not of MDPI and/or the editor(s). MDPI and/or the editor(s) disclaim responsibility for any injury to people or property resulting from any ideas, methods, instructions or products referred to in the content. |
© 2024 by the authors. Licensee MDPI, Basel, Switzerland. This article is an open access article distributed under the terms and conditions of the Creative Commons Attribution (CC BY) license (http://creativecommons.org/licenses/by/4.0/).
Copyright: This open access article is published under a Creative Commons CC BY 4.0 license, which permit the free download, distribution, and reuse, provided that the author and preprint are cited in any reuse.


