
Submitted:
07 January 2025
Posted:
09 January 2025
You are already at the latest version
Abstract
There is limited information on genetic response of tomato cultivars to fungi. This study investigated genetic resistance of tomato accessions, chromosomes and morphological characters to Phytophtora infestans and Aspergillus niger infection. Thirty tomato seed accessions were grown in screen house using complete randomised design in triplicates, and evaluated for resistance to both fungi using disease severity rating scale of 1 (highly resistant) to 6 (highly susceptible), while chromosome assessment was done using Carnoys protocol. Morphological data of 28 characters were collected using IPGRI descriptor, while Variance components, Genetic Advance (GA) and Heritability were estimated for treated tomato and control using R statistical program. Accession NHT0254b that was highly resistant to P.infestans (1.00) and A.niger (1.33) were diploid (2n=2x=24). Phytophtora infestans treated NHT343a was moderately susceptible (3.67) with 2n=2x=23, while NGB00711 was moderately susceptible (4.33) with 2n=2x=22 after A.niger treatment, indicating aneuploidy. The Environmental variance (1509.57) and genotypic variance (8.22) were highest for Cumulative Fruit Weight (CFW) and Number of Seeds (NS), respectively for P.infestans treatment, while GA (2.97) and phenotypic variance (754.91) were higher for NS and CFW, respectively in A.niger treatment. Heritability estimate showed that fruit length (63.0%), size of core (65.0%), and number of chambers (60.0%) were resistant to P.infestans, while only fruit length (56.0%) was resistant to A.niger for yield characters. Therefore, accessions and characters that showed resistance to P.infestans and A.niger are recommended for selection and genetic improvement.
Keywords:
Genetic resistance
; Morphological characters
; Mitotic chromosome
; Solanum lycopersicum
; Tomato fungi
; Phytophthora infestans
; Aspergillus niger
1. Introduction
Tomato (Solanum Lycopersicum) is a common vegetable crop that is universally consumed (Tejada-Alvarado et al., 2023). It is a subtropical and annual plant that belongs to nightshade family which has high sunlight and temperature requirements for growth (Lee et al., 2016; Vermeiren et al., 2020; Chikkeri et al., 2023; Alani et al., 2023). Tomato has a diploid chromosome number of 2n=2x=24 (Waiba et al., 2021; Brake et al., 2022). Domestication of tomato started from the Andean region of Peru and Ecuador, and extended to Mesoamerica (Ercolano et al., 2020). Solanum lycopersicum is the most cultivated of the wild relatives that include Solanum juglandifolium, Solanum chimiewelskii, Solanum neorickii, Solanum pimpinellifollium, Solanum sitiens, Solanum chilense, Solanum galapagence, Solanum ochrantium, Solanum corneliomuelleri and Solanum habrochaites (Gutierrez, 2018). The determinate type of tomato is small and has regulated growth while the indeterminate species are generally large and have continuous growth (Altemimi et al., 2017). Different soil types are used in tomato cultivation but sandy loamy soil is best because of good water drainage (Tuan, 2015). Tomato does best between pH of 6.0 to 7.0 and requires high amount of nutrients for growth and productivity. Tomato fruits have many nutritive components that include lutein, β-carotene and lycopene that have health advantages associated with reduced cancer rate and diseases of the heart (Islam et al., 2023; Ahmed et al., 2023). There are many factors that cause poor yield of tomato production which include attack by pathogens (Arah et al., 2016).
Fungi is one of the major pathogens that cause spoilage of tomato (Onuorah and Orji, 2015; Bello et al., 2016; Ezikanyi, 2016; Sajad et al., 2017; Lamidi et al., 2020). Phytophthora infestans (P. infestans) and Aspergillus niger (A. niger) are among fungi that cause serious effects during infection of various parts of tomato (Santos et al., 2016; Mekapogu et al., 2021; Gwa and Lum., 2023). High moisture composition of fruits makes tomato prone to attack by these fungi which causes lots of health problems to man due to mycotoxins secreted (Santos et al., 2016; Agbabiaka et al., 2020). Factors such as rain, dew and irrigation support the germination of fungi spores on fruit surfaces that subsequently penetrates tomato epicarp, while fragile and injured tissues of tomato are the major sources of entry by fungi pathogens such as P. infestans and A. niger.
Extensive studies on spoilage of tomato by fungi has been done (Abioye et al., 2021; Sola et al.,2022; Sobowale et al., 2022; Danaski et al., 2022; Ya et al., 2022; Sani et al., 2023; Akotowanou et al., 2023; Okolo and Abubakar, 2023). However, information on genetic resistance of tomato to P. infestans and A. niger is scarce. Additionally, the estimates of heritability, genetic advance and variance components on morphological characteristics of tomato to disease resistance of fungi Trichoderma, Alternaria alternata, Alternaria solani, Alternaria tomatophila, Alternaria linariae, and Septoria lycopersici has also been studied (Ohlson and Foolad, 2016; Bharathkumar et al., 2017; Kouam et al., 2018; Plouznikoff et al., 2019; Rubio et al., 2019; Panthee et al., 2024). The study of heritability estimates, genetic advance and components of variance on resistance of tomato characters to P. infestans, as reported in the works of Sullenberger et al. (2018); Copati et al. (2019), Elafifi et al., (2019), Jia and Foolad, (2020), Panthee et al. (2018) were limited to ancestral and wild forms like Solanum Pimpinellifolium and Solanum habrachaites. Presently, there is limited knowledge on the resistance of morphological characters in currently cultivated germplasm accessions of tomato to P.infestans, while there is no traceable information on resistance of the agro-morphological characters of tomato to A. niger. Therefore, this study investigated genetic resistance of thirty tomato accessions to P. infestans and A. niger, the effect of these fungi on the chromosomes and heritability estimates, genetic advance and component of variance on resistance of morphological characters in tomato.
2. Materials and Methods
2.1. Experimental Location
The experiment was carried out at the screen house of the teaching and research farm of the University of Ibadan which lies on latitude 7°27’1634.77’’N and longitude 3°53’3214.96’’E on an altitude of 236m above sea level, while growth of fungi and preparation of inoculum for experiment was carried out at the mycology and biotechnology laboratory of the Department of Botany, University of Ibadan all of which are located in the Guinea Savanna of South Western Nigeria.
2.2. Planting Materials and Soil Sterilization
Thirty germplasm accessions of tomato seeds were collected from National Center for Genetic Resources and Biotechnology (NACGRAB), and National Horticultural Research Institute (NIHORT). Top sandy-loamy soil was collected from the teaching and research farm of the University of Ibadan, while sterilization was done at 100°C for seven hours as described by Olowe et al. (2018). Eight kilograms (8kg) of the soil was packed into black polythene bags as modified from methods of Dossoumou et al. (2021) and aseptically transferred to the screen house.
2.3. Experimental Design, Planting of Seeds and Inoculation.
The experiment was completely randomized in three replicates ensuring 60cm x 60cm spacing between rows and columns (Olawuyi and Ajie., 2023). Seeds were sterilized for three minutes with 1% Sodium hypochloride solution and rinsed three times with sterile water after which drying in a laminar flow hood for 2 hours was done (Oyewole et al., 2017). Five seeds were planted in each pot after which thinning to two seedlings per pot was carried out three weeks after germination (Oyewole et al., 2017). Irrigation of plants, weeding and staking was done in accordance with methods described by Naika et al. (2019). Pure cultures of P. infestans and A. niger isolated from diseased tomatoes obtained from farmers fields were grown on Potato Dextrose Agar (Jonathan et al., 2016) and inoculating solutions were prepared by aseptically mixing the spores of each fungus with sterile water to a wavelength of 0.5 at OD600 using light spectrophotometer. Inoculation of plants was done using 40ml of each solution at sunset shortly after watering of plants at 45 days post growth.
2.4. Assessment of Plants for Disease Symptoms.
The plant leaves were assessed for blight symptoms associated with P. infestans and bulls eyes spots that indicates A. niger attack after two weeks of infection. Table 1 below shows the severity rating scale used for assessing disease symptoms in plants (Oyewole et al., 2017 and Olowe et al., 2013).
2.5. Chromosome Assessment
Three representatives from the accessions that were highly resistant, resistant, moderately resistant, moderately susceptible, susceptible and completely susceptible were selected for chromosome assessment from the plants treated with P. infestans and A. niger. Carnoys fixative solution was prepared using 96% ethanol and acetic acid in 3:1 ratio (Wang et al., 2006; Szinay, 2010; Sarma et al., 2017; Willem et al., 2022). The root tips of various accessions were collected between the hours of 9am to 10am two weeks post infection and immediately transferred to the fixing solution for 48 hours to arrest the cells at metaphase which is the visible stage of the chromosome. Washing of the root tips was done using 70% ethanol. Hydrolyzation of the tips was carried out for 5 minutes using 18% hydrochloric acid then transferred to microscope slides containing one drop of the fixative where gradual squashing and staining with FLP orcein was done for 1 hour (Wahua and Olaleye, 2013; Ngwe and Siljak-Yakovlev, 2023). The stained tips were mounted on microscope slides and coverslip after which the chromosomes in seven cells at metaphase stage in each root tip were examined using X40 objective lens and capturing was done using X100 objective lens of fluorescence microscope. The chromosomes were counted and ploidy level were determined.
2.6. Collection of Morphological Data and Statistical Analysis
Morphological data was collected from treated plants using IPGRI (1996) descriptor of tomato for growth, agronomic and yield characters as follows; Plant Height (PH), Number of Leaves (NL), Leaf Length (LL), Leaf Width (LW), Stem Girth (SG), Sepal Length (SL), Petal Length (PL), Stamen Length (STL), Number of Days to First Flower Bud (NDFFB), Number of Days to First Flower (NDFF), Number of Flowers (NF), Number of Inflorescence (NI), Number of Days to Fruit Ripening (NDFR ), Number of Fruits (NFS), Cumulative Fruit Weight (CFW), Fruit Diameter at Maturity (FDM ), Fruit Length (FL), Fruit Width (FW), Number of Ribs on Calyx (NRC), Pedicel length (PL), Pedicel Length from Abscission Layer (PLAL), Size of Corky Area Around Pedicel Scar (SCAAPS), Thickness of Pericarp (TP), Size of Core (SC), Number of Locules (NLS), Number of Chambers (NC), Number of Seeds (NS).
2.7. Statistical Analysis
The data for chromosome count was analyzed using ANOVA, descriptive statistics and Duncan Multiple Range Test with Statistical Package for Social Sciences (Version 26), while morphological data was evaluated for Environmental Variance (EV), Genotypic Variance (GV), Phenotypic Variance (PV), Environmental Component of Variance (ECV), Genotypic Component of Variance (GCV), Phenotypic Component of Variance (PCV), Heritability (H), Genetic Advance (GA) and Genetic Advance as a Percentage of Mean (GAM) using R statistical program (version 4.4.0).
3. Results
3.1. Morphological Resistance of Tomato Accessions to P. infestans and A. niger
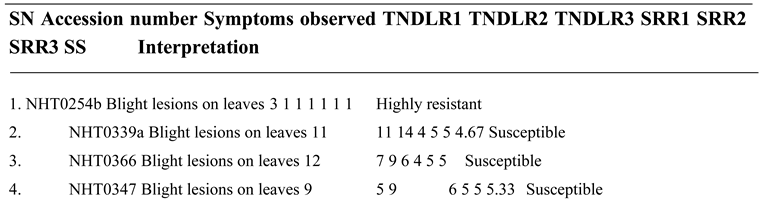
The resistance rating of various tomato accessions to P. infestans is shown in Table 2. The NHT0254b and NHT0343b were highly resistant. The NGB00699 and NHT0206a accessions were resistant. Accessions NGB00729, NHT0213, NHT100, NHT0353-1, NHT0199c, NGB00733 and NGB00710 were moderately resistant. The NGB00739, NHT343a, NHT0226a, NGB00711 and NHT0342a accessions showed moderate susceptibility. The NHT0339a, NHT0366, NHT0347, NGB00749, NHT034a, NHT0216a, NGB00755 and NHT0227c were susceptible, while NHT0355a, NGB00206b, NHT0259a, NGB00713, NGB00734 and NGB00757 were highly susceptible. Plate 1 shows the disease severity ratings of selected accessions to P. infestans infection.
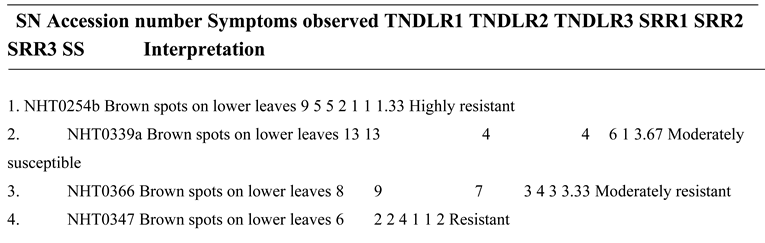
The resistance rating of various accessions to A. niger infection is demonstrated in Table 3. Accessions NHT0254b, NGB00749, NGB00729, NGB00699, NHT0213, NHT356b and NHT0199c showed high level of resistance. The NHT0347, NGB0206b, NHT70206a, NHT0216a, NHT100 and NHT0226 were resistant. The NHT0366, NHT0355a, NHT034a, NHT343a, NGB0734, NGB0057, NHT0342a, NGB00755 and NHT0227c showed moderate level of resistance. The NHT0339a, NHT0259a, NGB00739, NGB00713, NGB03531, NGB00711 and NGB00710 showed moderate level of susceptibility while, NGB00733 was susceptible. Plate 2 reports disease severity ratings of selected accessions to A. niger infection.
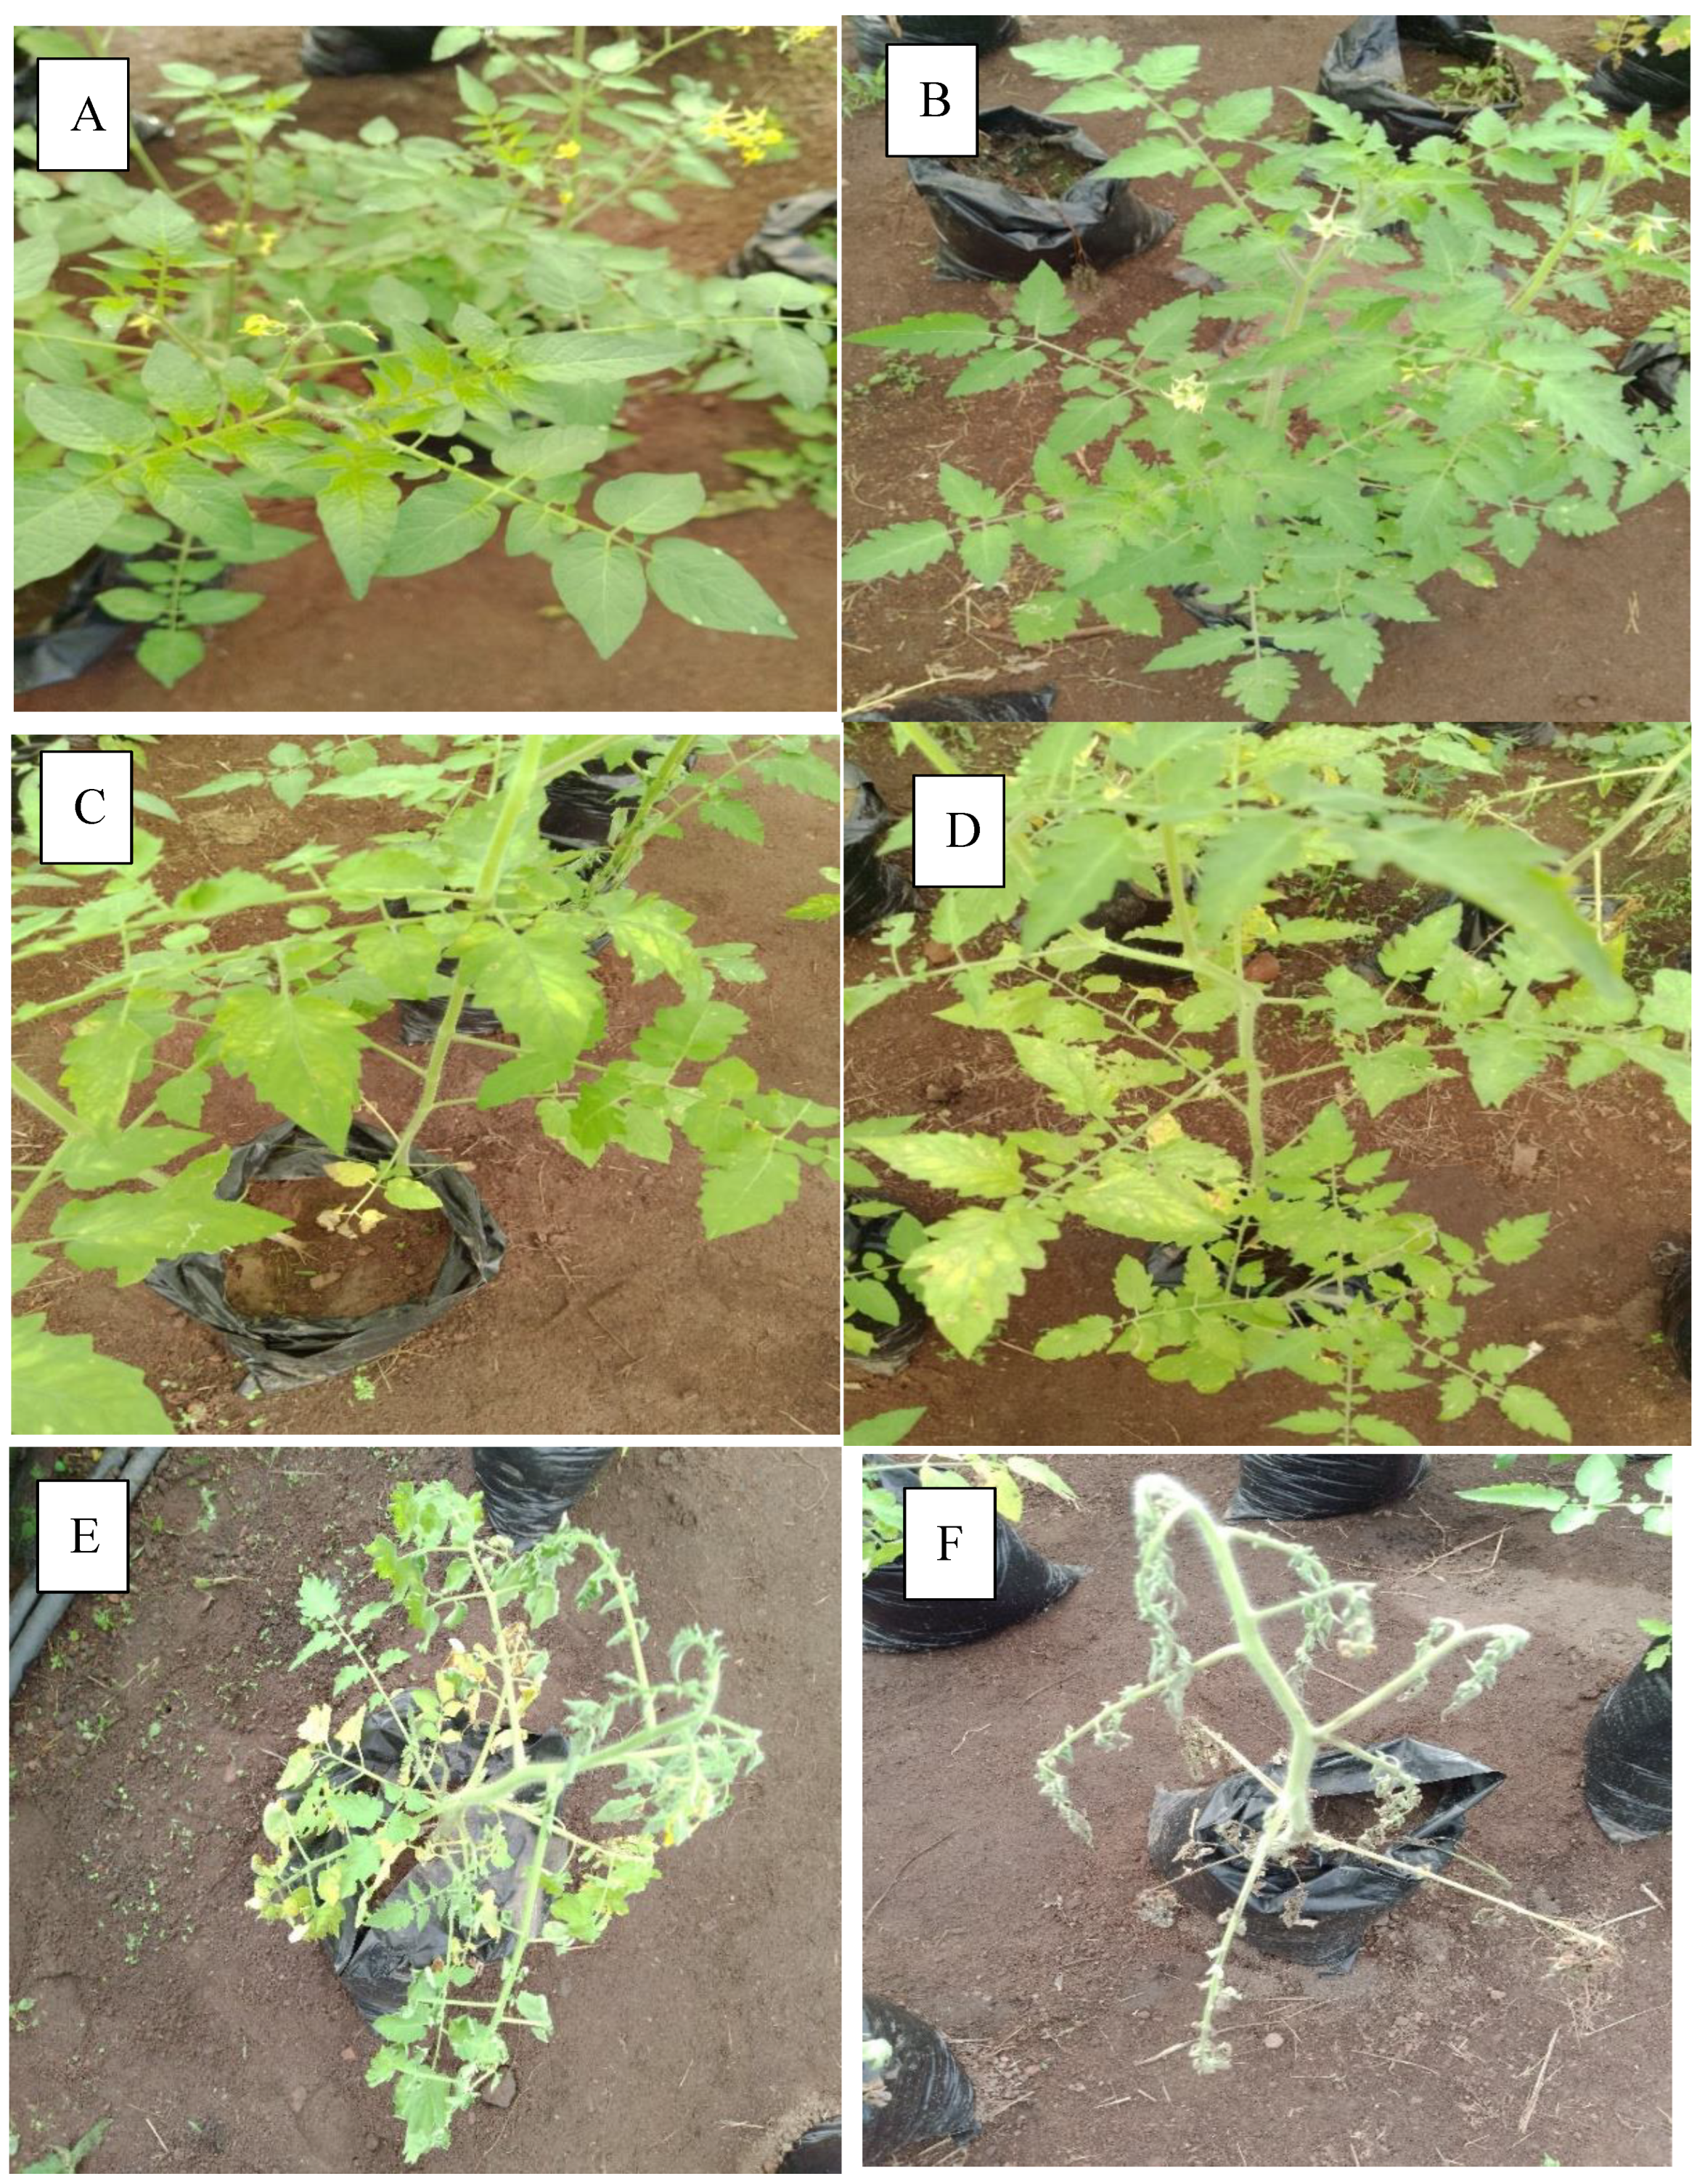
Plate 1. shows resistance ratings of P. infestans in the accessions. Plate 1a showed that NHT0254b exhibited high level of resistance, Plate 1b reported that NGB00699 was resistant, Plate 1c revealed that NHT100 was moderately resistant, Plate 1d reported that NGB00739 was moderately susceptibility, Plate 1e showed the susceptibility of NHT0339a and Plate 1f revealed that NHT0259a had high level of susceptibility.
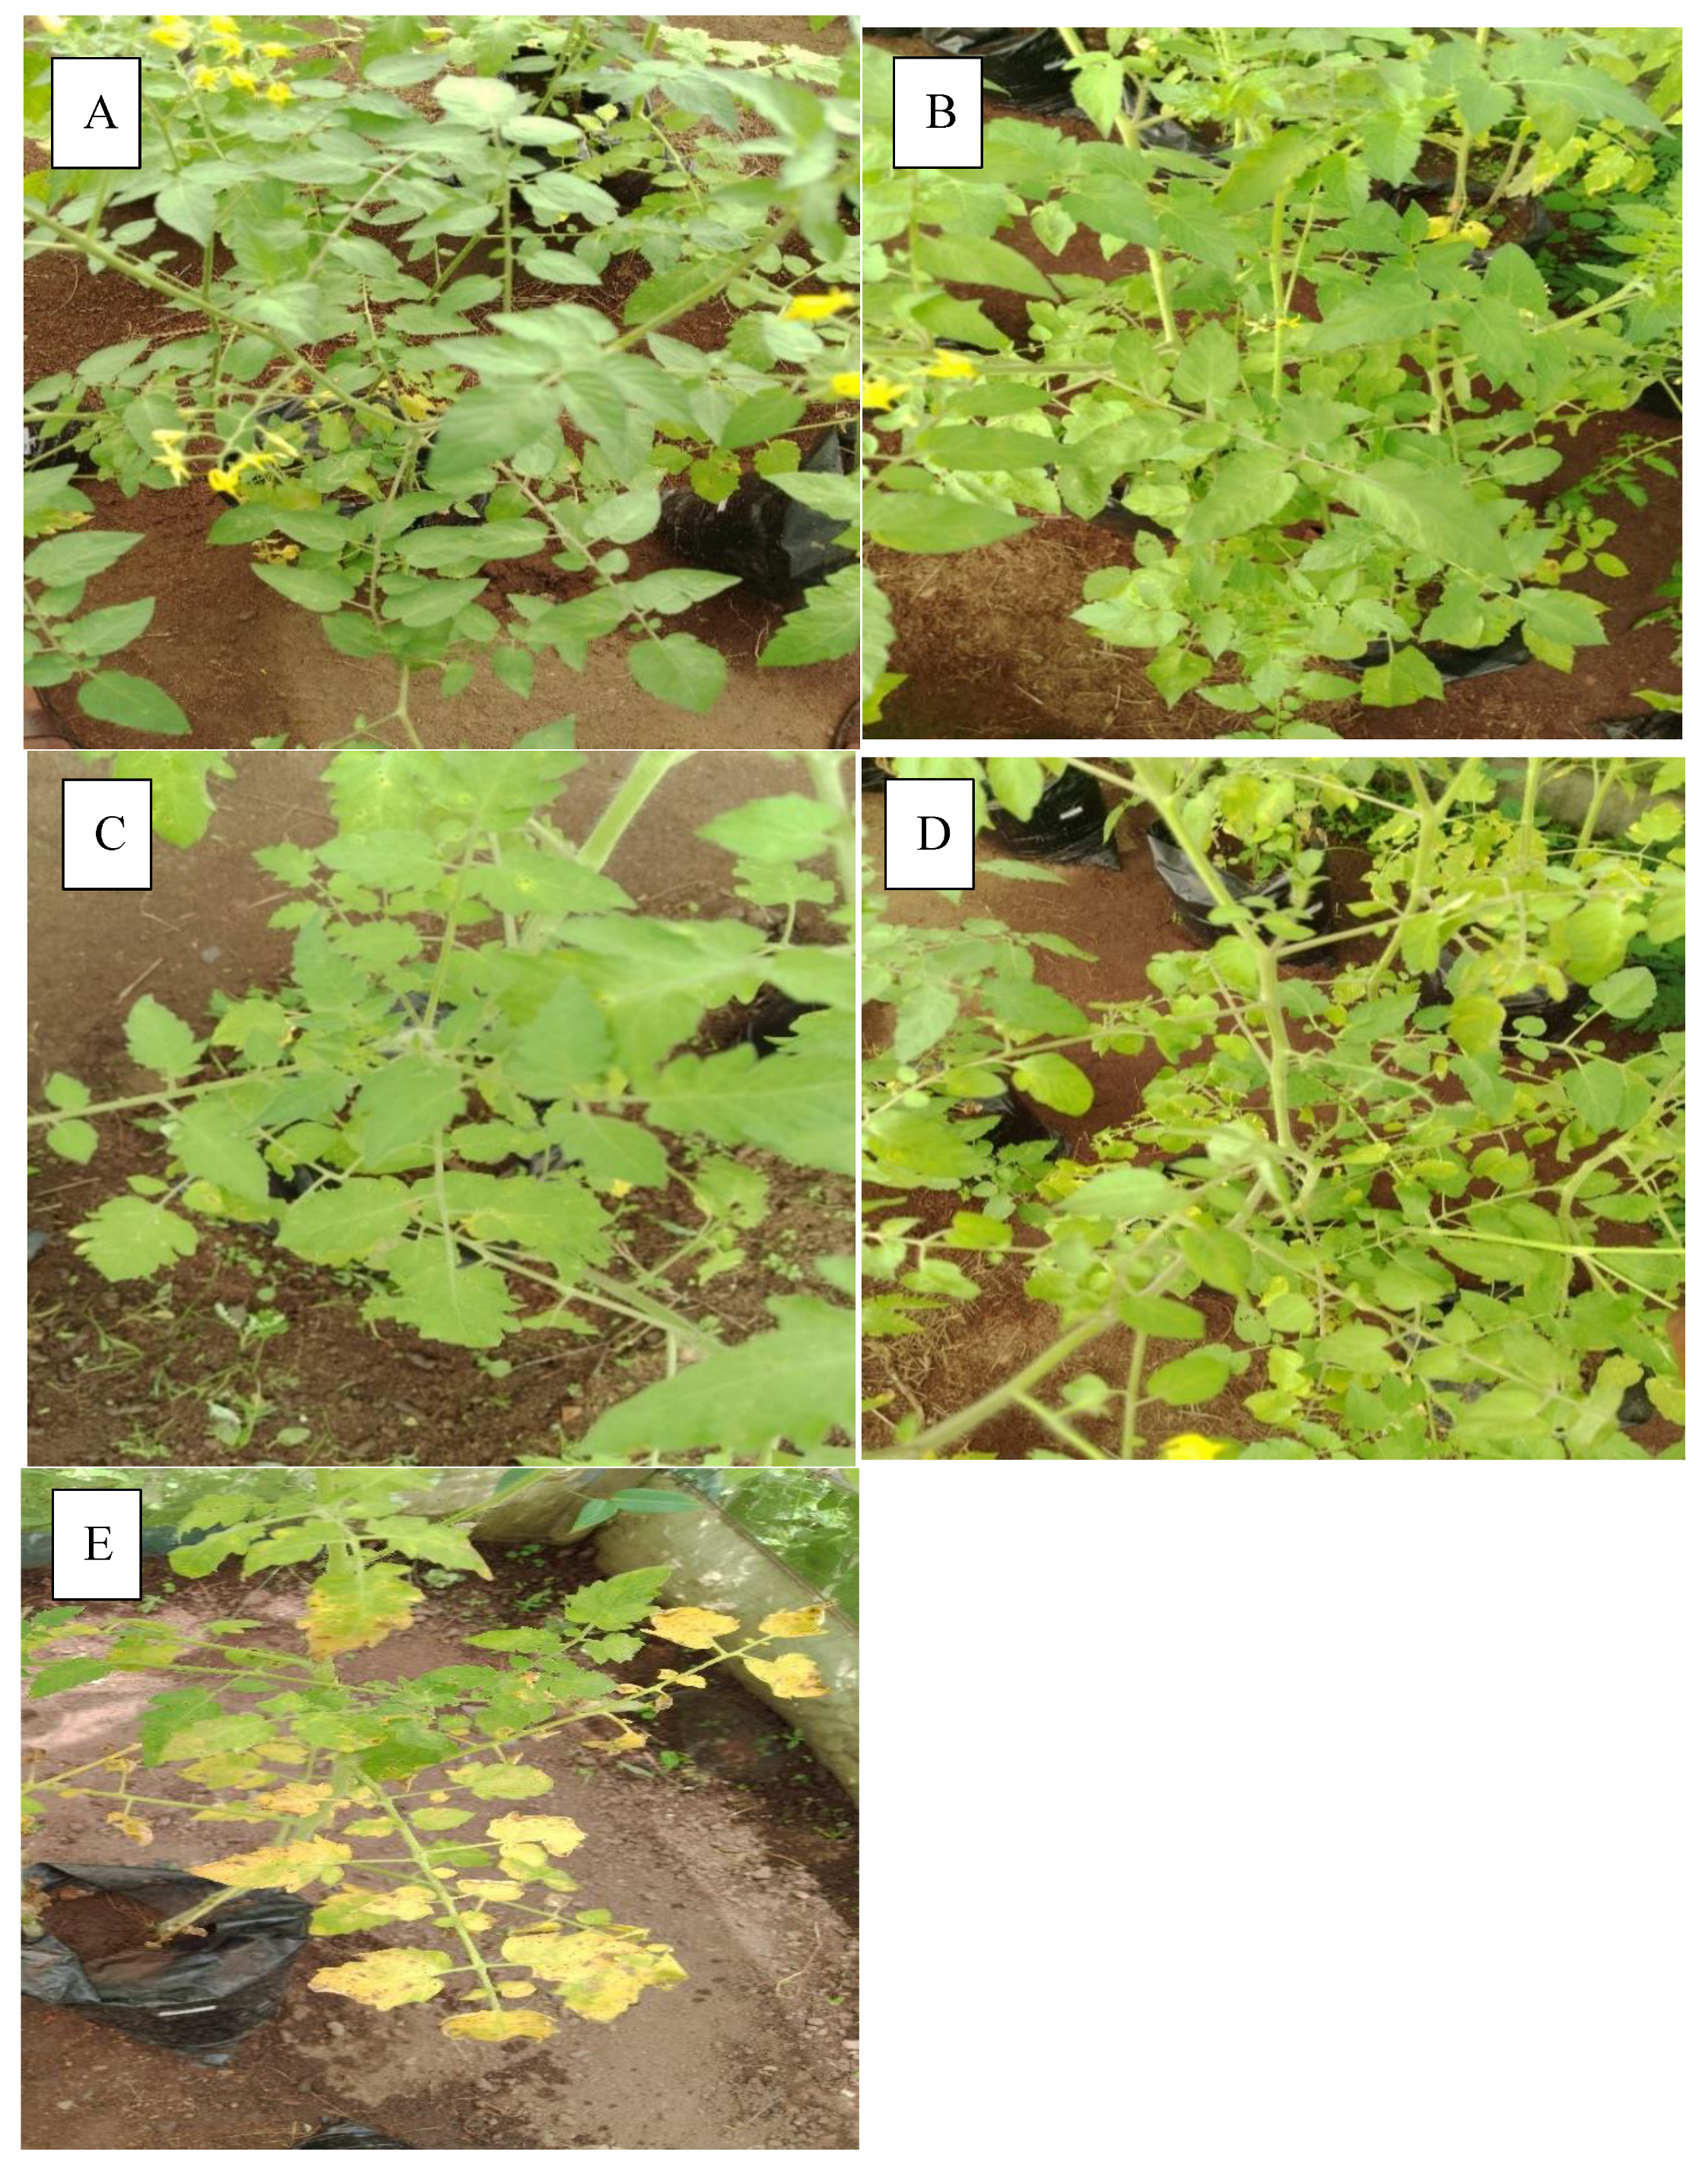
Plate 2. shows resistance ratings of treated plants to A. niger. Plate 2a showed that NTH0254b was highly resistant, plate 2b reported that NHT100 was resistant, plate 2c revealed moderate resistance in NHT0355a, plate 2d showed moderate level susceptibility in NHT0339a and plate 2e reported susceptibility in NHT00733.
3.2. Mean Square Variance and Ploidy Levels of Chromosomes after Fungi Treatment
The mean square variance of chromosomes in plants treated with both fungi is shown in Table 4. There was significant difference at P˂0.001 between accessions treated with P. infestans (7.52) and A. niger (10.48).
The ploidy status of chromosomes after two weeks of treatment with P. infestans is shown in Table 5. Accessions NHT0254b, NHT0356b, NGB00699, NGB00739, NHT0226a, NHT0399a, NHT0366, NHT0216a, NHT0355a, NHT0259a, NGB00713 and Control accessions did not show any change in chromosome number (2n=2x=24). The NHT0206a, NHT0199c and NHT034a accessions had 2n=2x=23 chromosomes. The NGB00733 had 2n=2x=22 chromosomes, while NH100 was observed to have 2n=2x=20 chromosomes. The chromosome count of various accessions after P. imfestans infection is shown in Plate 3.
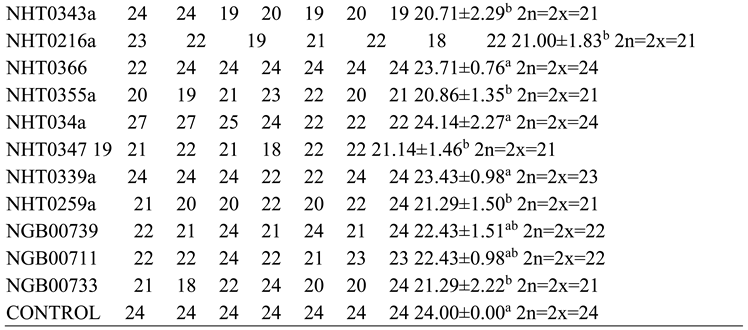
The chromosome counts of A. niger treated plant accessions is revealed in Table 6. There were no deletions observed in NHT0254b, NHT0366, NHT034a and control accessions. The NGB00749, NHT356b and NHT0339a accessions had 2n=2x=23 chromosomes. The NGB00739 and NGB00711 accessions had 2n=2x=22 chromosomes, while NHT0343a, NHT0216a, NHT0355a, NHT0347, NHT0259a and NGB00733 accessions had 2n=2x=21 chromosomes which was observed to have the greatest number of deletions. Plate 4 reveals the number of chromosomes observed in various accessions after treatment with A. niger.
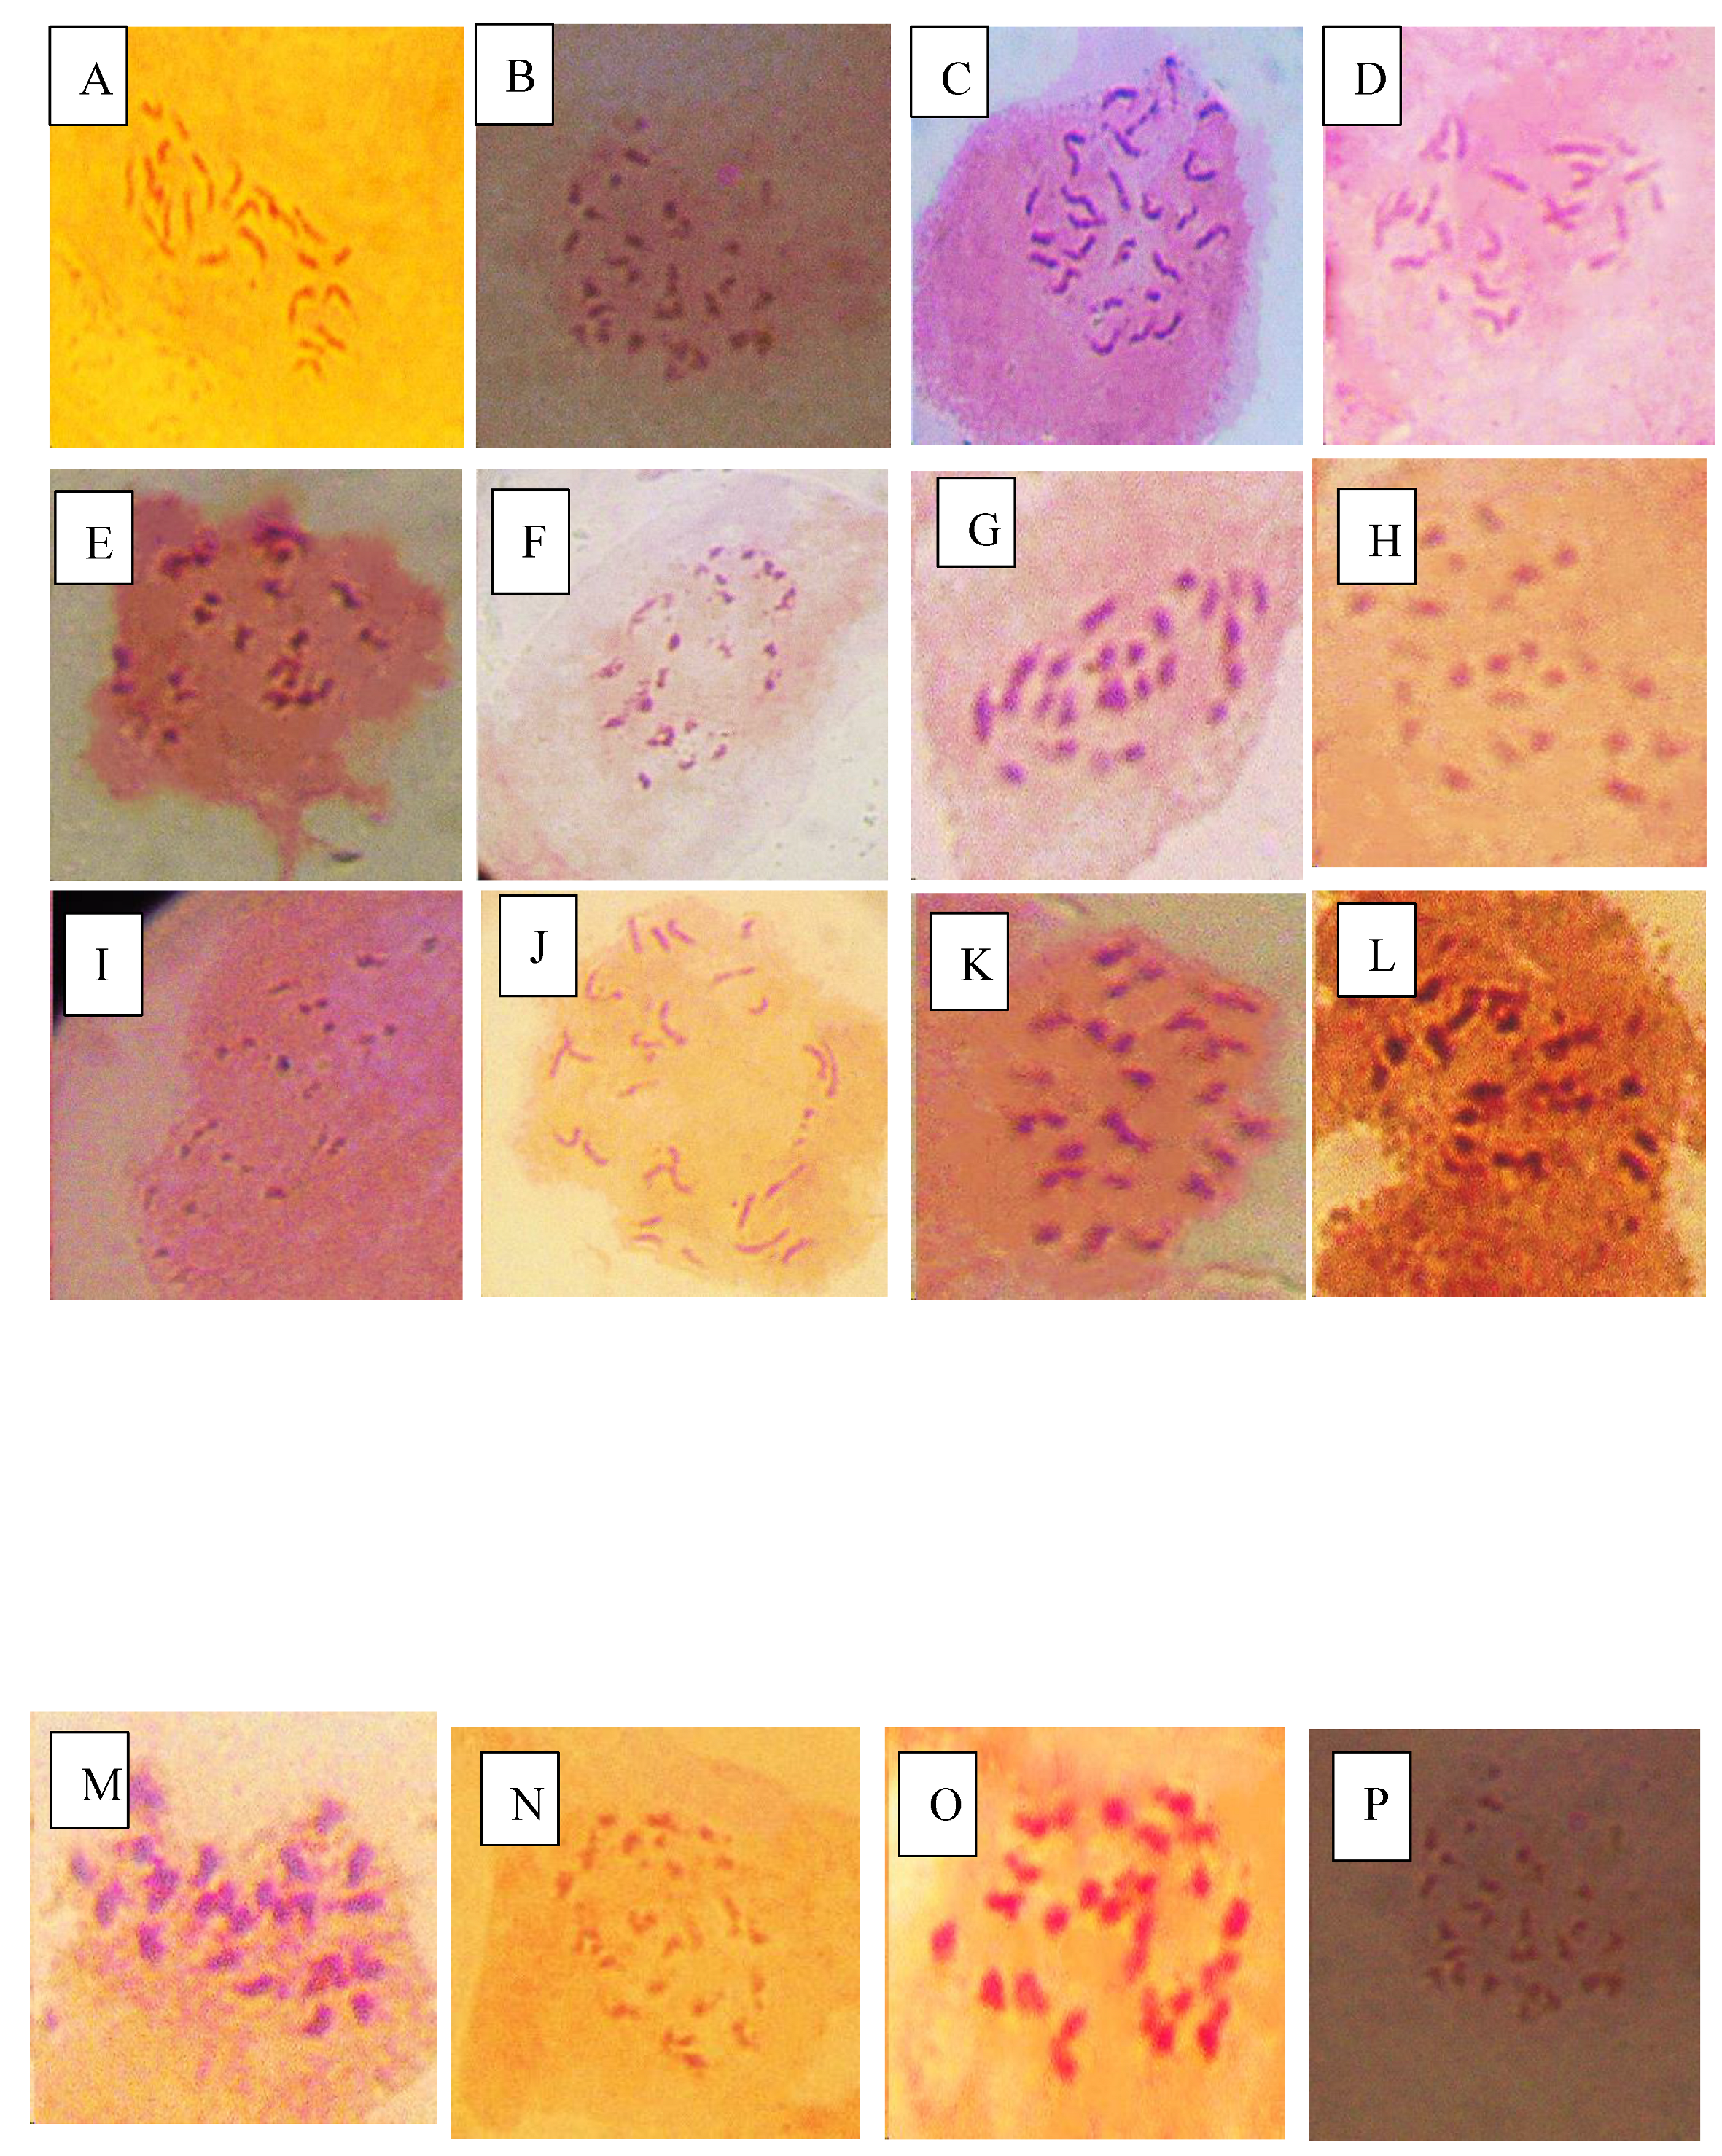
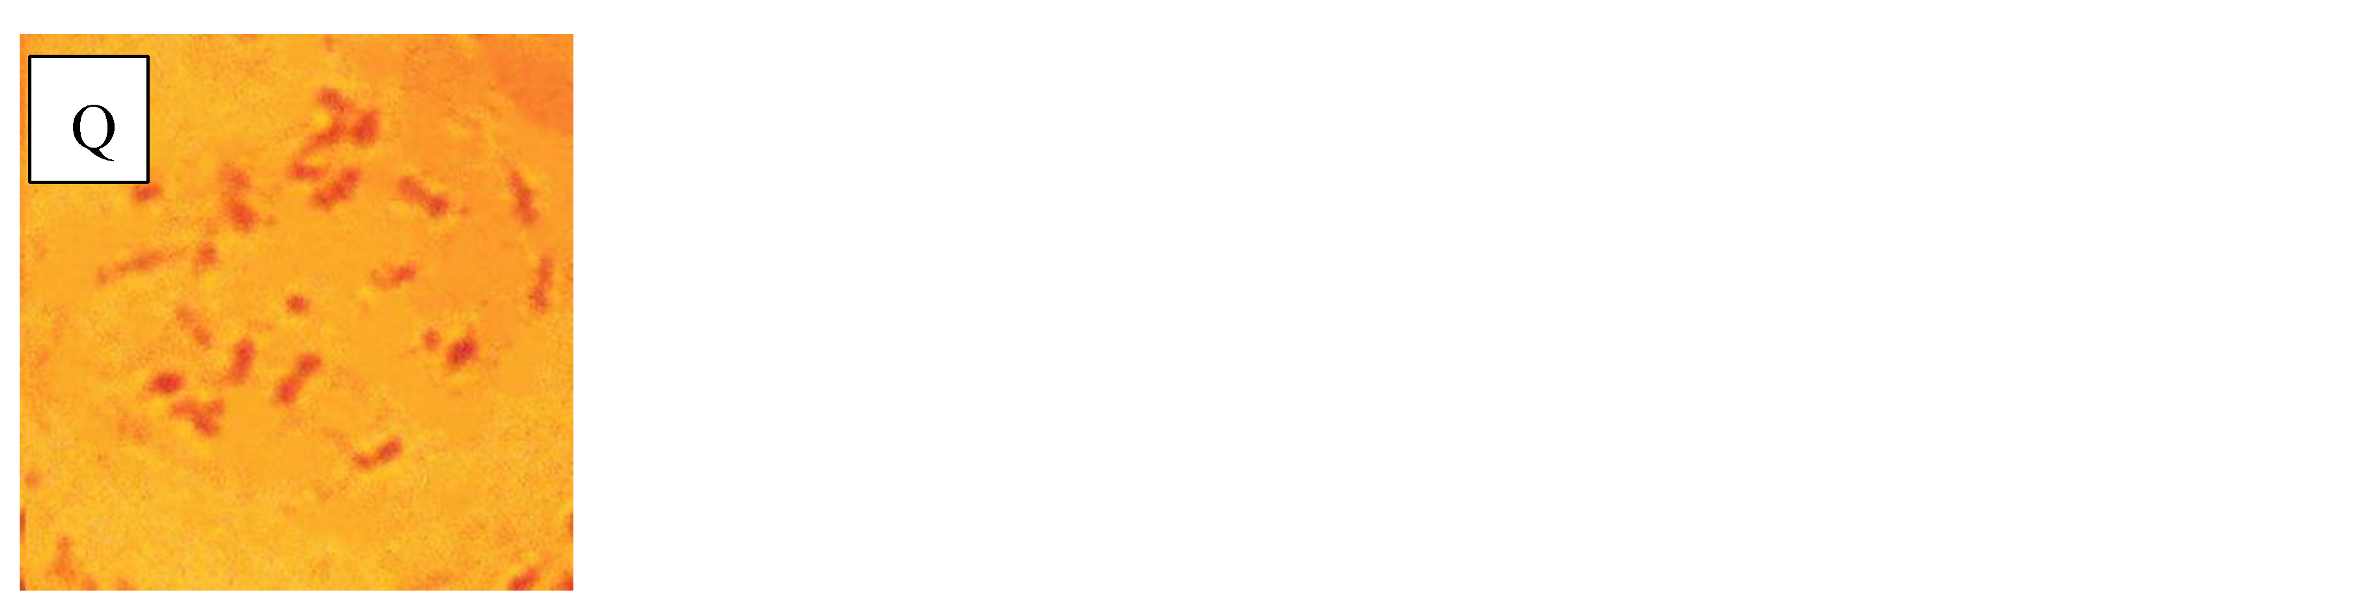
Plate 3. shows chromosome count of accessions after P. imfestans infection. Plate 3a = NHT0254b (24), Plate 3b = NHT0356b (24), Plate 3c = NGB00699 (24), Plate 3d = NHT0206a (23), Plate 3e = NHT100 (20), Plate 3f = NHT0199c (23), Plate 3g = NGB00733 (22), Plate 3h = NGB00739 (24), Plate 3i = NHT034a (23), Plate 3j= NHT0226a (24), Plate 3k = NHT0339a (24), Plate 3l = NHT0366 (24), Plate 3m = NHT0216a (24), Plate 3n = NHT0355a (24), Plate 3o = NHT0259a (24), Plate 3p = NGB00713 (24), Plate 3q = Control (24).
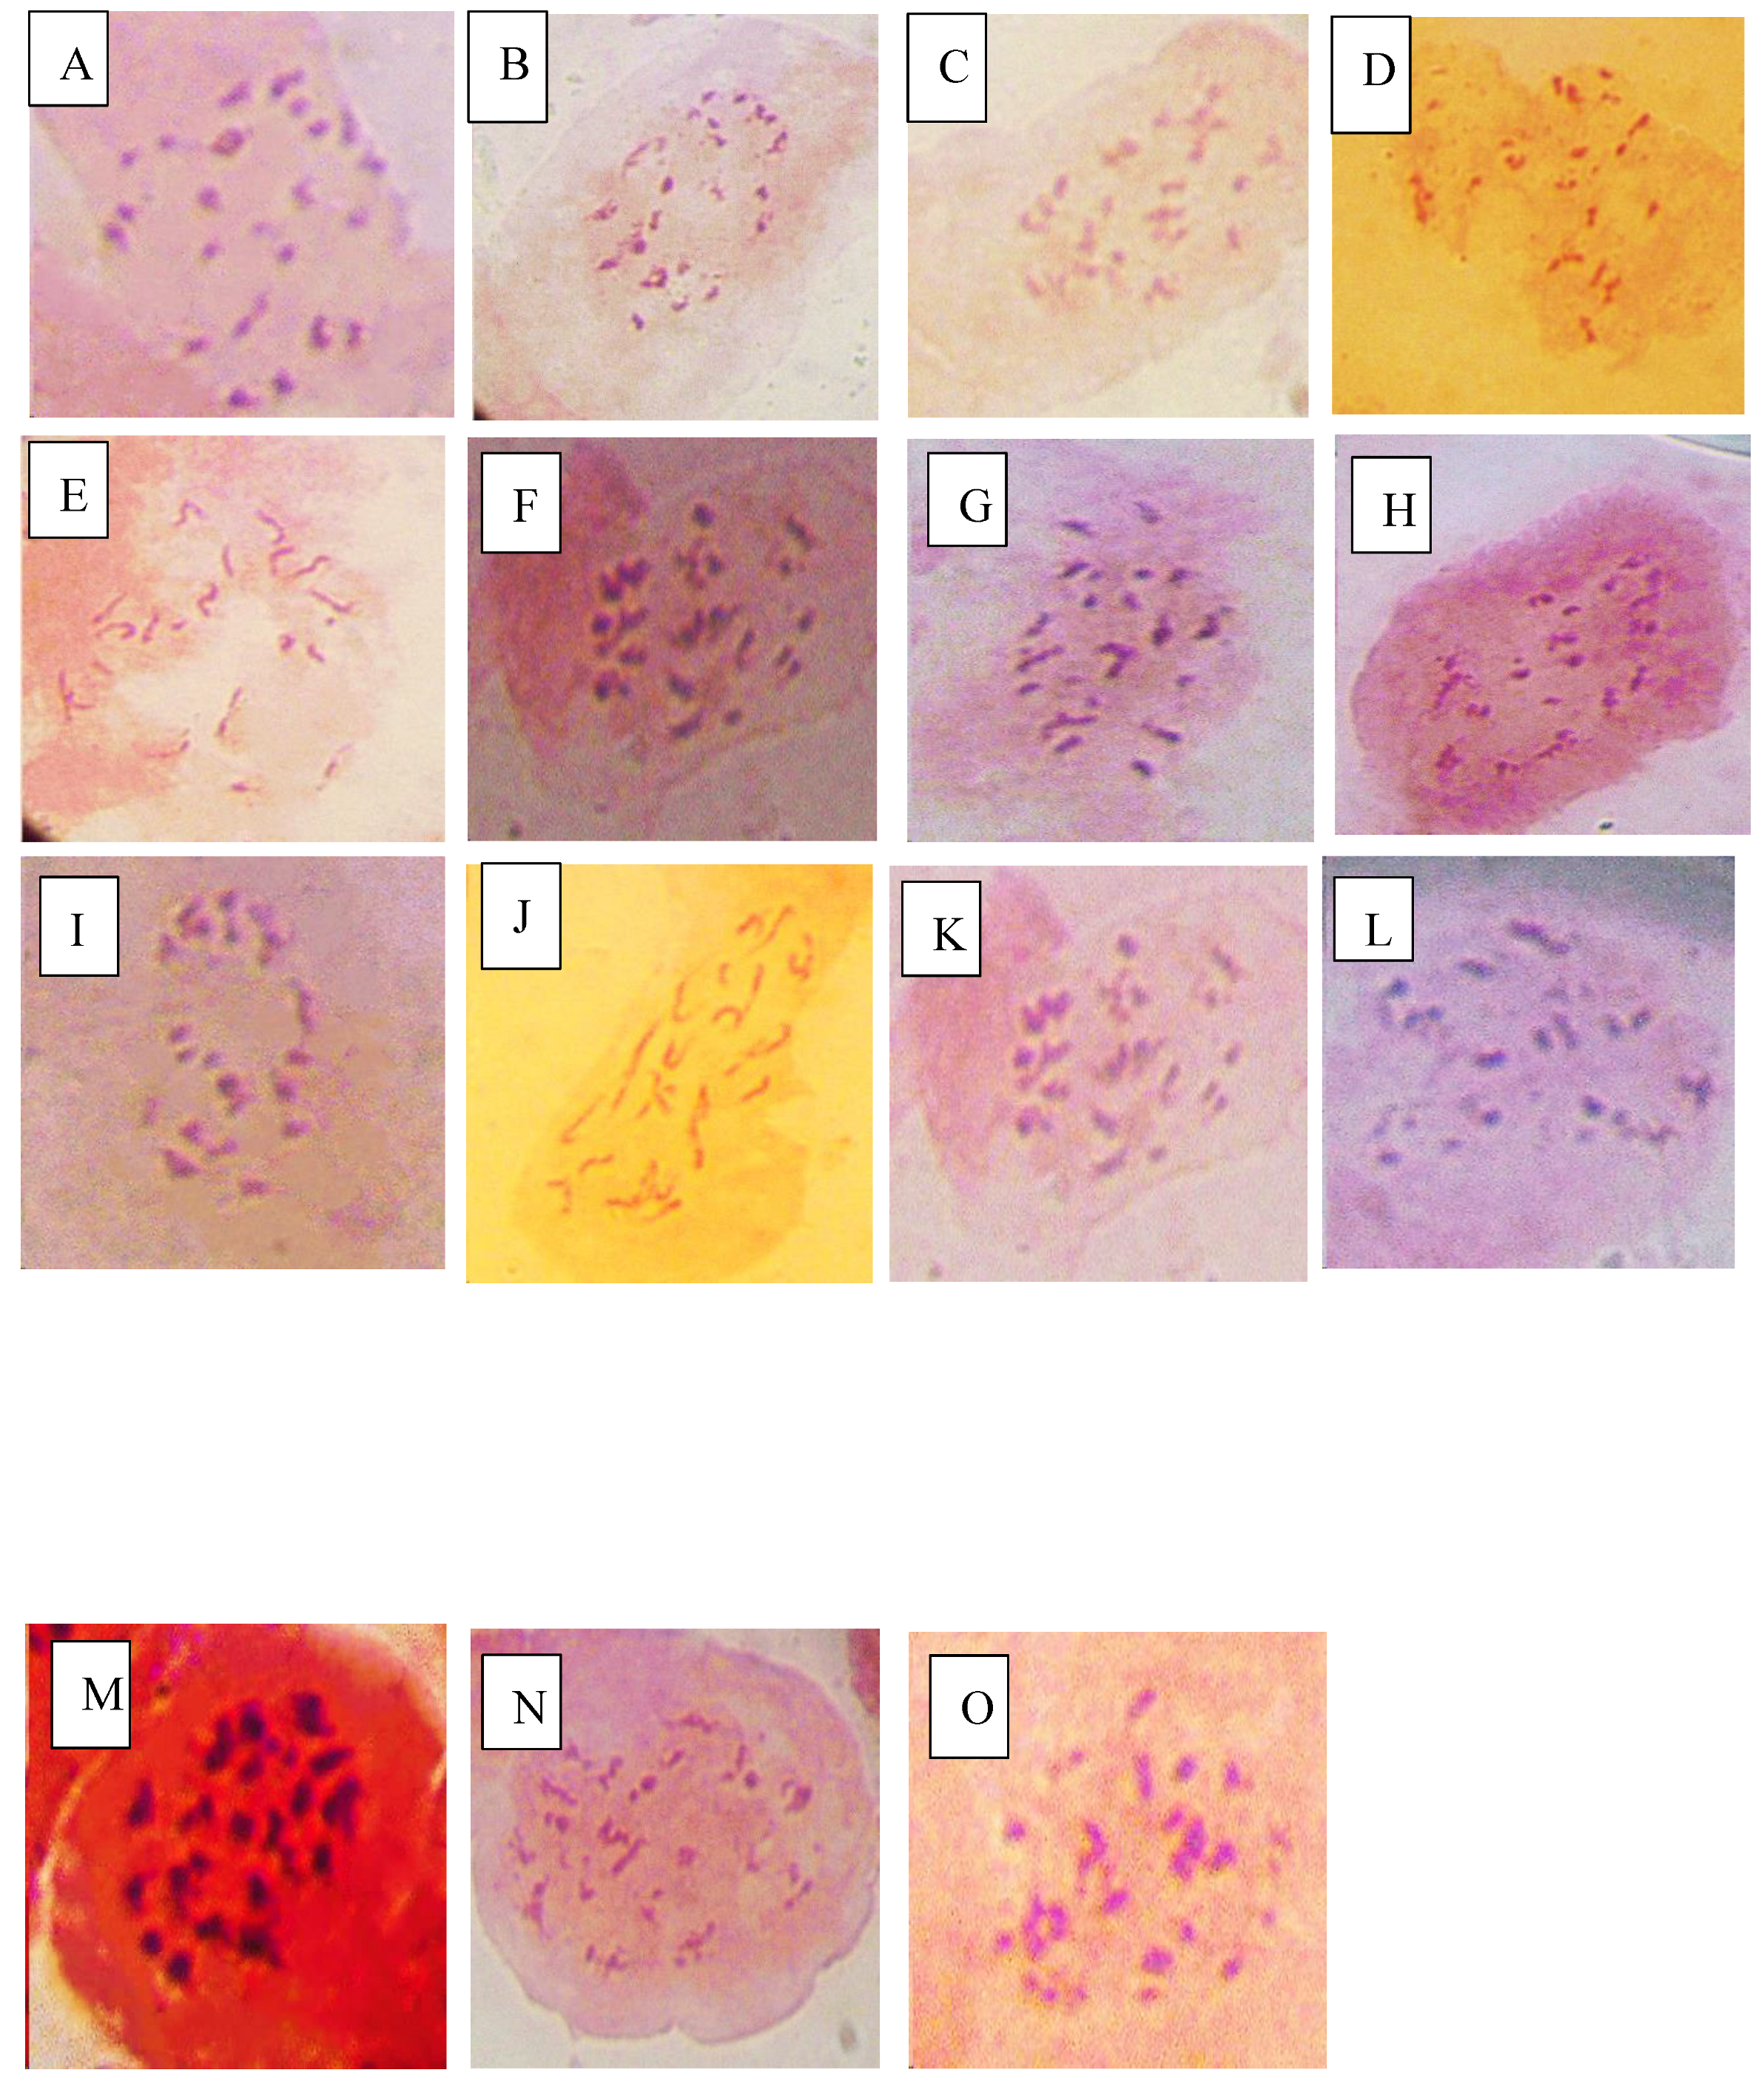
Plate 4. shows chromosome count of accessions after A. niger treatment. Plate 4a = NHT0254b (24), plate 4b = NGB00749 (23), plate 4c = NHT356b (23), plate 4d = NHT0343a (21), plate 4e = NHT0216a (21), plate 4f = NHT0366 (24), plate 4g = NHT0355a (21), plate 4h = NHT034a (24), plate 4i = NHT0347 (21), plate 4j = NHT0339a (23), plate 4k = NHT0259a (21), plate 4l = NGB00739 (22), plate 4m = NGB00711 (22), plate 4n = NGB00733 (24) and plate 4o = Control (24).
3.3. Variance Components, Genetic Advance and Heritability for Growth Characters of Treated Plants
The EV, GV, PV, ECV, GCV, PCV, H, GA, and GAM for growth characters of plants infected with P. infestans is shown in Table 7. The PH showed highest EV (1493.36), while SG (2.99) was least. The NL was highest for GV (222.75), while SG (0.46) was least. The PH was highest for PV (1646.53), and SG (3.46) was low. Under the ECV, the NL (78.27) had highest occurrence, while LL (31.67) was least. The NL was highest (49.56) for the GCV, while LL was lowest (17.36). The NL (92.65) was equally highest for PCV, while LL (36.12) was least. The NL (29%) had highest H, while PH was lowest (9%). The NL (16.45) also had highest GAM (54.62%), while SG (0.51) and PH (11.17%) had least GAM.
The PH (1968.91) was highest under EV, while SG (1.24) was least (Table 8) for plants treated with A. niger. The NL (212.57) was highest for GV, while LW (4.59) was least. The PH (1970.80) had highest PV, while SG (1.52) was least. The NL (60.64) was most common ECV, while LW (31.04) was least common. The NL (47.56) was highest for GCV, while PH (1.64) was least. The NL (77.06) was most common for PCV, while LW (0.16) was least common. The highest H was observed in NL (38%), while lowest was seen in PH (0%). The NL (18.54) had highest GA, while PH (0.09) was least. The NL (60.46) also had highest GAM, while PH (0.10) was lowest.
3.4. Variance Components, Genetic Advance and Heritability for Agronomic Characters of Plants
For plants infected with P. infestans as reported in Table 9, the NF (83.29) was highest for EV, while STL (0.01) was least. The NDFFB (10.61) was highest for GV, while PL (0.01) and STL (0.01) were least. The NF (92.14) had highest occurrence for PV, while STL (0.01) was least. The NF (71.30) also had highest occurrence for ECV, while NDFF (1.75) was least. The SL (21.78) was highest for GCV, while NDFF (3.60) had least. The NF was highest (74.99) for PCV, while NDFF was least (4.00). The NDFFB was highest (87%) for H, while NF (10%) was least. The NDFFB (6.27) had highest rating of GA, while STL (0.09) had least. The NI (26.64) was highest for GAM, while NDFF (6.67) had lowest score.
The NF (34.31) had highest occurrence for EV, while STL (0.02) was least for A. niger treatments (Table 10). The NF (11.30) was also highest for GV, while SL (0.03) was lowest. The NF (45.60) was still highest occurring in PV, while STL (0.04) was least. The highest ECV was NF (72.27), while NDFF (1.43) was lowest. The NF (41.47) was also highest for GCV, while NDFF (4.53) was least. The most common PCV was NF (83.33), while NDFF (4.75) was least common. The highest estimate of H was observed in NDFF (89%), while NI (21%) was least. The NF (3.47) was highest for GA, while PL (0.14) and STL (0.14) were least. The NF (42.53) was highest in GAM, while NDFF (8.90) was lowest.
3.4. Variance Components, Genetic Advance and Heritability for Yield Characters of Plants
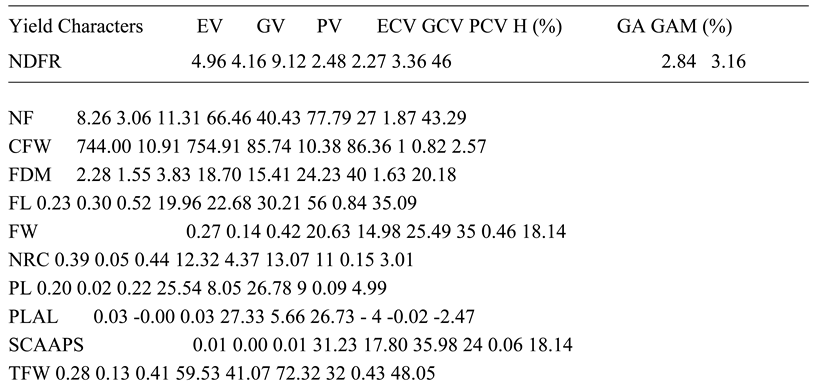
The CFW had highest (1509.57) occurrence for EV, while PLAL and SCAAPS were least (0.01) in P. infestans treated tomato (Table 11). The NS was strongest (8.22) for GV, while CFW was least (-210.63) among negative ratings. The CFW was highest (1298.95) for PV, while PLAL and SCAAPS were least (0.01). The NLS was highest (158.67) for ECV, while NDFR was least (1.45). The NC (109.65) had highest occurrence for GCV, while NDFR (0.52) was lowest. The NC (149.20) was highest for PCV, while NDFR (1.54) was least. The SC (65%) had highest H, while CFW (-16%) was lowest. The NS (2.34) was also highest for GA, while CFW (-12.04) was lowest. The NC (175.20) was highest for GAM, while NLS (-40.27) was least.
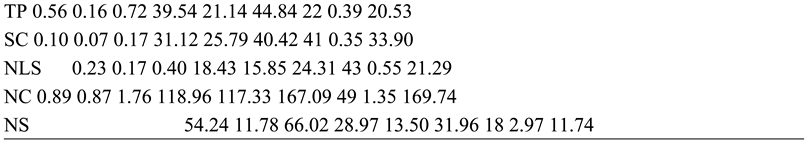
The CFW (744.00) was highest for EV, while SCAAPS (0.01) was lowest for A. niger treated plants (Table 12). The NS (11.78) was highest for GV, while PLAL (-0.00) was least. The CFW (754.91) was highest observed in PV, while SCAAPS (0.01) was least. The NC (118.96) was highest for ECV, while NDFR (2.48) was lowest. The NC (117.33) was most common in GCV, while NDFR (2.27) was lowest. The NC (167.09) was also highest in PCV, while NDFR (3.36) was lowest. The highest H was observed in FL (56%), while the lowest was seen in PLAL (-4%). The NS (2.97) was highest observed in GA, while PLAL (-0.02) was least. The NC (169.74) was highest for GAM, while PLAL (-0.47) was least.
4. Discussion
4.1. Genetic Resistance of Accessions to P. infestans and A. niger
High level of resistance reported in NHT0254b and NHT0343b is consistent with Arafa et al. (2017) that reported similar findings in LA1777 accession. The resistance of NGB00699 and NHT0206a is also in line with LA1352, LA2855, LA1347, LA1718 and LA1295 that also showed good level of resistance. Occurrence of moderate resistance in NGB00729, NHT0213, NHT100, NHT0353-1, NHT0199c, NGB00733 and NGB00710 is in accordance with LA1269, LA1578, LA3152 (Ph-2), LA3151 (Ph-2) and LA4286 (Ph-3) accessions. Moderate susceptibility as reported in NGB00739, NHT343a, NHT0226a, NGB00711 and NHT0342a is similar to LA2196. Susceptibility of NHT0339a, NHT0366, NHT0347, NGB00749, NHT034a, NHT0216a, NGB00755 and NHT0227c is consistent with LA1252, LA1772, LA1223, LA1378, LA1367, LA1340, LA0716, LA1674, LA1478, LA1594, LA2646 and LA2009 (Ph-1) accessions while, high susceptibility in NHT0355a, NGB00206b, NHT0259a, NGB00713, NGB00734 and NGB00757 is in accordance with LA1303, LA1302, LA0751, LA1649, LA0443, LA1586, LA1561, LA0413, LA2147, LA1579, LA1617, LA1633, LA2391, LA3123, LA3161, LA1246, LA0375, LA0114, LA1237, LA1469, LA1256, LA1242, LA1343, LA1935, LA0446, LA2581, LA1333 and Super Strain B accessions of Arafa et al. (2017).
High level of resistance observed in NHT0254b, NGB00749, NGB00729, NGB00699, NHT0213, NHT356b and NHT0199c is in line with the work of Aguilar-Gonzalez et al. (2017) that reported high level of resistance of tomato to A. niger in three treatments using essential oil. The level of resistance observed in NHT0347, NGB0206b, NHT70206a, NHT0216a, NHT100 and NHT0226 is consistent with similar study that used 3/4M treatment which revealed 8/20 positive cases after inoculation with A. niger while, moderate resistance observed in NHT0366, NHT0355a, NHT034a, NHT343a, NGB0734, NGB00757, NHT0342a, NGB00755 and NHT0227c is also in line with Aguilar-Gonzalez et al. (2017) after observing 10/20 infection rate on tomatoes after inoculation of A. niger using 1/2M concentration of essential oil treatment. The susceptibility of NHT0339a, NHT0259a, NGB00739, NGB00713, NGB03531, NGB00733, NGB00711 and NGB00710 is consistent with the findings of Sale et al. (2018) that reported susceptibility of Siria and UTC varieties of tomatoes (Solanum lycopersicum).
4.2. Variations in Chromosome Number and Ploidy Levels after Fungi Infection
This study revealed that variations in chromosomes of tomato occur during infection by P. infestans and A. niger which highlights intricate host pathogen interaction and likely cytological effects. Infections by these pathogens trigger genomic stress in tomato which potentially lead to alterations in chromosomes. The P. infestans that causes late blight can induce significant variations in the regulation of genes related to resistance and control of reactive oxygen in tomato cultivars which can affect genomic composition that include changes in chromosome numbers especially in susceptible tomato accessions (Ayala-Usma et al., 2021; Liu et al., 2021). Similarly, A. niger is associated with metabolic changes that can disturb genome stability. This study suggests that chromosome instability such as deletions that lead to aneuploidy can occur in tomato during infection by both fungi as a result of pressure from the pathogen with the aim of compromising the defense mechanisms of tomato (Panthee et al., 2024).
The deletions observed in NHT0206a, NHT100, NHT0199c, NGB00733 and NHT034a treated with P. infestans is not in line with Bal and Abak. (2007) and El-Mansy et al. (2021) that reported the least number of chromosomes in tomato roots to be 2n=2x=24 which is the diploid state. This suggests that chromosomal deletions is a mechanism used by P. infestans during infection. Similarly, the highest chromosome numbers of 2n=2x=26 reported by Bal and Abak. (2007) and El-Mansy et al. (2021) is also not in accordance to the diploid (2n=2x=24) chromosome number observed in NHT0254b, NHT0356b, NGB00699, NGB00739, NHT0226a, NHT0339a, NHT0366, NHT0216a, NHT0355a, NHT0259a, NGB00713 and control. The differences in results observed in present study compared to Bal and Abak. (2007) and El-Mansy et al. (2021) can be attributed to differences in treatments used in the various experiments. The occurrence of 2n=2x=24 chromosomes in the accessions earlier mentioned is in accordance with Wang et al. (2006), Song et al. (2012), Gerszberg et al. (2015), Singh et al. (2015), Mesquita et al. (2019) and Waiba et al. (2021).
Chromosomal deletions were observed in NGB00749, NHT356b, NHT0343a, NHT0216a, NHT0355a, NHT0347, NHT0339a, NHT0259a, NGB00739, NGB00711 and NGB00733, while NHT0254b, NHT0366, NHT034a and control were observed to have diploid state of 2n=2x=24 chromosomes in A. niger treated plants. The deletion of chromosomes in present study is not in line with Bal and Abak. (2007) and El-Mansy et al. (2021) that reported 2n=2x=26 chromosomes in tomato. The variations observed between both studies can be attributed to differences in the treatments used between the two experiments. The reduction of chromosomes observed in some accessions imply that A. niger functions by deleting chromosomes in susceptible accessions of tomato. The diploid state (2n=2x=24) of chromosomes observed earlier is consistent with reports from Brasileiro-Vidal et al. (2009), Pavan et al. (2009), Bhala and Verma. (2018) and Brake et al. (2022).
4.3. Variance Components and Heritability, Genetic Advance of Growth Characters
The PV was highly susceptible to P. infestans, as supported by EV compared to GV for growth characters. The ECV was high, indicating a strong influence on PCV, which was highest over the GCV, suggesting susceptibility of growth characters to the fungus. The H also revealed susceptibility of growth characters to P. infestans. The GA was low for all characters, while GAM was moderate, with the exception of the NL, which was high. Low GA compared to H further confirms that the growth characters were susceptible to P. infestans. Moderate GCV, GAM and high PCV scores reported in this study for PH are not consistent with the work of Meena et al. (2018), which reported low GCV, GAM and PCV scores for PH; however, low scores for GA are consistent with this study.
The higher PV than GV in the present study is consistent with PV and GV by Pooja et al. (2022). The high ECV, GCV and PCV for NL in present study are not in line with the moderate ECV, GCV and PCV scores of Phom et al. (2016). The observed differences can be attributed to different genotypes and treatments used between Nigeria and India. The high PCV and moderate GCV for LL are not consistent with moderate PCV and low GCV observed by Yadav et al. (2016). Moderate GAM in this study is also not in accordance with low GAM, while low GA is consistent with GA reported by Yadav et al. (2016). The H in this study showed that LL was susceptible to P. infestans, while that of Yadav et al. (2016) reported the strongest effect to be from genetic factors. Differences between accessions, genotypes, and treatments used can account for the observed variations.
Similarly, high PCV and moderate GCV for LW are further in line with reports from Yadav et al. (2016), which observed PCV and moderate GCV values. The moderate GAM in this study is not in line with GAM reported by Yadav et al. (2016), while low GA is in accordance with the GA of similar studies. However, H for LW in this study implied susceptibility, while Yadav et al. (2016) observed the strongest influence on observed phenotypes to be resistant. The differences between accessions, genotypes, and treatments used can account for the observed variations. The low GV and higher PV for SG in this study are in line with GV and PV observed by Tripura et al. (2016); however, H in present study reported implied susceptibility, while Tripura et al. (2016) observed that a greater portion of observed phenotypes were influenced by genes. The differences can be attributed to the different species of Solanum plants used in the two experiments.
The PH was susceptible to A. niger. The PV had a higher score than GV, indicating susceptibility to the fungus as supported by high EV. The PCV also confirmed a stronger influence of A. niger on observed phenotypes over resistance genes, as seen by GCV, and this was supported by high values observed in the ECV. The H shows that there was no effect of resistant genes on observed phenotypes, and this was further supported by low GA and GAM. The higher PV than GV scores for PH in this study are consistent with PV and GV reported by Shah et al. (2022). The H shows that observed variances in PH are purely caused by the effect of A. niger, whereas H reported by Shah et al. (2022) implies that greater proportion of observed variations are influenced by dominant genes.
This is corroborated by the low GAM and higher GAM between the two studies. The differences in accessions, genotypes, and treatments used for the two experiments can account for observed variations. The effect of A. niger was also greater on NL than genetic effect. The higher PV than GV, which is confirmed by EV, which was highest, is proof of strong effect of A. niger on observed variations for NL. This is further supported by higher scores for PCV than GCV, which is supported by ECV, which was highest. The H for NL reports that lesser proportion of observed characters were influenced by genes, while greater percentage was influenced by the fungus, and low GA further agrees that the fungus had the strongest effect. The higher PV and GV observed in this study are in line with the PV and GV reported by Saini et al. (2018).
The higher PCV than GCV reported in this work is also in line with PCV and GCV findings of Saini et al. (2018). However, H in this study reveals that A. niger had the strongest influence on observed characters, while Saini et al. (2018) reported that higher portion of observed characters were influenced by genes. This is further corroborated by low GA in this study compared to high GA reported by Saini et al. (2018). The different accessions, genotypes, and treatments used in the two studies can account for the observed differences. The effect of A. niger was strongest on LL for the observed variations. The PV that was higher than the GV is consistent with the PV and GV observed by Saini et al. (2018). Similar trend observed in PCV and GCV is also consistent with Saini et al. (2018).
The H for LL in this study showed that lesser percentage of the observed variances were influenced by genes, whereas greater proportion of the observed variances were influenced by the treatment. This is not consistent with the study by Saini et al. (2018), that reported higher proportion for effect of genes on observed characters than environmental factors on observed variances. The different accessions, genotypes, and treatments used can account for observed differences. Low GA and GAM for leaf length in this study further support the strong effect of A. niger on observed phenotypes. The H for leaf width shows that dominant genes are responsible for the observed variances. This is consistent with the report of Saini et al. (2018), which found that higher proportion of the observed variances for LW were influenced by dominant genes.
The treatment effect had strongest influence on the observed variations for LW. The PV was higher than the GV, which was further supported by the high EV. A similar trend was observed for PCV, GCV, and ECV, while GA and GAM were low and moderate, respectively. The PV that was higher than GV for SG in this study is consistent with the findings of Tripura et al. (2016) for PV and GV. However, H for SG showed that lesser portion of the observed phenotypes were influenced by genes, while Tripura et al. (2016) observed that higher proportion of observed phenotypes for SG were influenced by genes. The differences can be attributed to different plants of the Solanum family used in the various experiments.
4.4. Variance Components, Heritability and Genetic Advance of Agronomic Characters
The PV was higher than GV for SL, followed by EV, implying that P. infestans had a greater effect on SL than resistance genes, as supported by high EV. Similarly, PCV was higher than GCV, while ECV was relatively high, further supporting the effect of P. infestans on SL. The H further confirms that the fungus had a stronger effect on SL than genetic factors. Low GA and GAM also prove the effect of the treatment on the observed variances. PV was further higher than GV in PL, while EV was next to PV. The PCV similarly higher than GCV, while ECV was also relatively higher. This suggests that P. infestans had strongest effect on the observed variations. The H showed that lesser proportion of the observed variations in PL were influenced by genes, while most of the observed variations were influenced by the treatment, which further confirms that P. infestans had the strongest effect on PL. The GA was low, while the GAM was moderate.
Low GA further confirms the strength of the treatment based on the observed variations. The EV, GV, and PV were same for STL; however, PVC was higher than GCV, while ECV was also relatively high, implying that the fungus had the strongest effect on the observed phenotypes. The H reveals that a lesser percentage of the observed variations are from dominant genes, while higher proportion of the variations were from the effect of P. infestans. The GA was low, while GAM was moderate. Low GA further confirms that the strongest effect on observed variations was from the fungus. The PV had the highest score for NDFFB, while GC was next and EV was least. This suggests that the resistance genes had stronger influence on the observed phenotype compared to the treatment. The PCV, GCV, and ECV also followed the same pattern, implying that the strongest effect on the observed variations was genetic in nature.
The H showed that most of the observed variations were influenced by dominant genes, while a lesser portion were influenced by P. infestans. This confirms that the resistance genes had stronger effect on the observed phenotypes. The GA and GAM were respectively low and moderate. Low GA further confirms that the dominant genes had stronger effect on NDFFB. The PV was highest for NDFF, while GV was lower and EV was least. This suggests that the influence on observed variations is largely genetic. Similarly, PCV was higher than the PCV, while the ECV was least likely, suggesting a stronger effect of genes on observed variations. The H reported that higher percentage of the observed variations were from dominant genes, while a lesser proportion were influenced by the fungus. This confirms that the dominant genes are the major influencers NF. The PV was higher than the GV for NI, while EV was relatively high, suggesting that the treatment effect was stronger than genetic effect. A similar trend that was observed for PCV, GCV, and ECV further agrees that P. infestans had a stronger effect than genes on observed phenotypes.
The H showed that lesser portion of observed variances were influenced by genes, while greater proportion was influenced by the treatment. This confirms that the treatment effect was stronger than genetic effect. The GA and GAM were respectively low and high. Low GA further confirms that the effect of P. infestans was stronger than that of dominant genes. The PV for NF was higher than the GV, while the EV was relatively high implying that the fungus effect was stronger than resistance genes. Similar trend was observed for PCV, GCV, and ECV, while H revealed that a smaller percentage of the observed variances were influenced by genes than greater portion that was affected by P. infestans. The GA was low, while GAM was moderate. Low GA further confirms that the fungus effect was stronger than genetic factors. The genetic effect that had stronger effect on NDFF is in line with Singh et al. (2015). The NI that was largely influenced by P. infestans is consistent with observations of Pandey et al. (2018). The fungus effect that was strongest for NF in present study is also in line with Pandey et al. (2018).
The PV was higher than GV for SL, while EV was also relatively high, suggesting that the effect of A. niger on SL was stronger than that of dominant genes. The PCV was also greater than GCV, while ECV was relatively high, further implying that A. niger had stronger effect on SL than resistance genes. The H shows that lower percentage of observed phenotype was influenced by genes, while a greater portion was from the effects of A. niger. The GA and GAM for SL were respectively low and high. Low GA further supports stronger effect of fungus compared to genetic factors. The PV was greater, followed by EV and GV for PL, implying that the effect of A. niger was stronger on the observed variances than genetic factors. Similar trends were followed for PCV, ECV, and GCV, further supporting that the fungus effect was stronger. The H reported a lesser percentage of the observed variances for SL were influenced by genes, while higher proportion were due to the effects of A. niger. This confirms that the treatment effect was stronger than the effect of the dominant genes.
The GA and GAM were respectively low and moderate. The low GA further confirms that A. niger had stronger influence than resistance genes for the observed variations in PL. This implies that the effect of A. niger was stronger on STL than genetic factors as implied by PV that was higher, followed by EV and GV, respectively. The PCV was greater than GCV, followed by ECV, further suggesting strength of A. niger over dominant genes for STL. The H revealed that lower proportion of observed variances for STL were influenced by dominant genes, while most portion was from the treatment effect. This confirms that the effect of A. niger on STL was stronger than that of genetic factors. The GA and GAM were low and high, respectively. Low GA further confirms that the fungus effect was stronger than genetic factors. The PV was slightly above GV, while EV was low for NDFFB. A similar trend was observed for PCV, GCV, and ECV; however, H showed that most of the observed variations for NDFFB were controlled by dominant genes, while lesser were from treatment effect.
This shows that genetic factors had stronger effects on NDFFB. The GA and GAM were respectively low and moderate. PV was higher than GV for NDFF, while EV was least; however, the difference between PV and GV was not much. Similarly, the same trend was observed for PCV, GCV, and ECV. The H for NDFF reports that most of the observed phenotypes were influenced by genes, while a little portion were from the fungus. This suggests that the stronger influence on the observed variations was from genes; however, GA and GAM were low. The PV was higher than GV for NI, while EV was also relatively high, suggesting that the effect of A. niger on NI was stronger than genetic factors. The PCV was also higher than GCV, while ECV was also relatively high, further supporting the stronger effect of treatment than genes. The H showed that a little portion of the observed variances were influenced by genes, while higher proportion was from the treatment. This confirms that the effect of A. niger on NI was stronger than resistance factors.
The GA and GAM were respectively low and high. Low GA further proves that the effect of A. niger was strongest on NI. The PV for NF was higher than GV, while EV was also high, suggesting that the observed phenotypes for NF were from the effect of A. niger rather than genes. The PCV was higher than GCV, while ECV was also high, further implying a stronger effect of treatment compared to genetic factors. The H revealed that lesser proportion of the observed phenotypes were controlled by genes, while a greater portion was influenced by the fungus. This confirms that the effect of A. niger was more on NF compared to genetic factors. The GA and GAM were respectively low and high. The low GA further proves the stronger effect of treatment over genetic factors. The stronger genetic effect that was observed for NDFF is in line with Mohamed et al. (2012). The NI that was influenced by treatment in this study is in line with Pandey et al. (2018). The NF that was influenced by treatment is in accordance with Pandey et al. (2018).
4.5. Variance Components, Heritability and Genetic Advance of Yield Characters
The NDFR, NFS, CFW, FDM, FW, NRC, PL, PLAL, SCAAPS, TFW, TP, NLS, and NS were strongly influenced by the effect of P. infestans rather than genes. This was indicated by high PV score for all the mentioned characters, which is backed up by a relatively high EV compared to GV. The PCV for all the mentioned characters was also high, while the ECV was higher than the GCV, further implying that treatment effect was stronger than the effect of resistance genes on observed variances. The H for similar characters showed the percentage of observed variances that were influenced by dominant genes were respectively lower than the effect of P. infestans for the characters. These confirm that the treatment effect was stronger than those of genetic factors for the observed characters. The low genetic advance for the tested characters earlier mentioned also confirms the stronger effect of P. infestans over genes.
The FL, SC and NC were strongly influenced by dominant genes rather than treatment effects. These were indicated by GV, which was higher than EV, and GCV, which was higher than ECV. The H for FL, SC and NC showed that higher percentages of observed phenotypes were influenced by the dominant genes, which confirms that genetic effect was stronger than treatment effect for the three characters. Low genetic advance was observed for FL and NC, and moderate for SC. These are further proofs that genetic effect was stronger than effect of the fungus on the characters. The H in this study shows that NFS, CFW, NS and NLS were strongly influenced by the treatment effect, which is not consistent with Bhandari et al. (2017), who reported a stronger effect from dominant genes. The accessions, genotypes, and treatments used between the two studies can account for the observed differences. The H in FDM, TP and NLS that showed a stronger effect from treatment in the present study are not consistent with Pooja et al. (2022), who reported the strongest influence to be dominant genes. The accessions, treatments, and environment used can account for the various differences. The strong effect of dominant genes on FL is in accordance with Pooja et al. (2022). The FW in this study was influenced by treatment, while that of Somraj et al. (2017) was influenced by genetic factors. Variations in results can be attributed to different treatments used in the two experiments.
The NDFR, NFS, CFW, FDM, FW, NRC, PL, PLAL, SCAAPS, TFW, TP, SC, NLS, NC and NS were more influenced by A. niger than genetic factors for the observed characters. This is indicated by high PV backed up by high EV, while GV was least. The PCV was also high for the aforementioned characters and was supported by a high ECV, while the GCV was least. This further supports that the effect of A. niger on the characters was stronger than that of the dominant genes. The H for NDFR, NFS, CFW, FDM, FW, NRC, PL, PLAL, SCAAPS, TFW, TP, SC, NLS, NC and NS showed that the percentage of observed variances that were influenced by resistance genes were respectively lower than the effect of A. niger which confirms that the strongest effect for the observed variations was influenced by A. niger. Low GA for all the said characters further supports that the treatment effect was higher than genetic effect. The NDFR, CFW, NRC, PL and PLAL had low GAM.
The FW, SCAAPS and NS were moderate for GAM, while NF, FDM, TFW, TP, SC, NLS and NC had high GAM. Low and moderate GAM further prove that influence of A. niger on observed characters was greater than genetic effect. The FL was the only character that was strongly influenced by dominant genes. This was indicated by GV, which was higher than EV, and the GCV, which was also higher than ECV. The H for fruit length showed that most of the observed phenotype was influenced by dominant genes, compared to A. niger. This confirms that genetic response for FL was stronger than the fungus effect. The NLS in present study that were highly influenced by treatment effect is not in line with the report of Rasheed et al. (2023), which found that NLS was influenced by genetic factors. The TP and CFW that were influenced by treatment effect in this work are not in line with the findings of Meena et al. (2018), which reported these to be strongly influenced by dominant genes. The FL in this study was influenced by genetic factors, while Meena et al. (2018) reported that FL was controlled by treatment.
The NC in the present study was influenced by the environment, while Meena et al. (2018) observed this character to be controlled by dominant genes. The observed variations can be attributed to different treatments used for the two studies. The FDM and NF were controlled by treatment effect in this study, while Singh et al. (2015) reported these characters to be controlled by genes, suggesting that A. niger had a strong influence on the characters. The NS in this work was influenced by treatment, while Aralikatti et al. (2018) reported seed number to be controlled by dominant genes. The differences in results are attributed to various treatments used in the two studies.
5. Conclusion
This work revealed the resistance profile of thirty germplasm accessions of tomato to Phytophtora infestans and Aspergillus niger infection, the effect of these pathogens on chromosomes and variance components as well as genetic advance and heritability of phenotypic characters in response to the fungi. This study showed that NHT0254b and NGB00699 that showed no chromosomal deletions were resistant to P. infestans, while NHT0254b, NHT0366 and NHT034a with diploid chromosome number were resistant to A. niger treatment. The plant height, number of leaves, leaf length, leaf width, and stem girth were susceptible to P. infestans and A. niger during infection. The sepal length, petal length, stamen length, number of inflorescences and number of flowers were susceptible to both fungi, while number of days to the first flower bud and number of days to the first flower were resistant. The number of days to fruit ripening, number of fruits, cumulative fruit weight, fruit diameter at maturity, fruit width, number of ribs at calyx, pedicel length, pedicel length from abscission layer, size of corky area around pedicel scar, thickness of fruit wall, thickness of pericarp, number of locules, and number of seeds were susceptible P. infestans, while fruit length, size of core, and number of chambers were resistant. Fruit length was the only yield character that showed resistance to A. niger infection, while the remaining characters were susceptible. Therefore, resistant germplasm accessions and morphological characters that conferred resistance can be selected and improved to prevent the effect of these fungi on tomato. Although, some accessions treated with P. infestans (NHT0206a, NHT0199c, NGB00733, NHT0366, NHT0355a, NHT0259a and NGB00713) and A. niger (NHT0254b, NHT356b, NHT0366, NHT0355a, NHT0347 and NGB00711) showed possibility of deviation from the observed disease severity ratings in the long run; further resistance and susceptibility status will be determined in ‘‘Molecular expression of Nucleic Acids and Thaumatin-Like-Protein resistant gene 5 in Solanum lycopersicum L. (Tomato) to Phytophthora infestans and Aspergillus niger’’.
References
- Abioye, J.; Raymond, J.; Olayemi, I. Spatial distribution and isolation of microbiota associated with spoilage of tomatoes sold in selected Markets in in Nassarawa State, Nigeria. Journal of Applied Life Sciences International 2021, 24, 10–24. [Google Scholar] [CrossRef]
- Ahmed, D.A.E.; Slima, D.F.; Al-Yasi, H.M.; Hassan, L.M. and Gala, T.M. Risk assessment of trace metals in Solanum lycopersicum L. (tomato) grown under wastewater irrigation conditions. Environmental Science and Pollution Research 2023, 30, 42255–42266. [Google Scholar] [CrossRef] [PubMed]
- Agbabiaka, T.O.; Saliu, B.K.; Sule, I.O.; Oyeyiola, G.P.; Odedina, G.F. Microbial Deterioration of Tomato Fruit (Lycopersicon esculentum) Sold in Three Popular Markets in Ilorin, Kwara State, Nigeria. Fountain Journal of Natural and Applied Sciences 2020, 4, 10–18. [Google Scholar] [CrossRef]
- Aguilar-González, A.E.; Palou, E.; López-Malo, A. Response of Aspergillus niger inoculated on tomatoes exposed to vapor phase mustard essential oil for short or long periods and sensory evaluation of treated tomatoes. Journal of Food Quality 2017, 2017, 4067856. [Google Scholar] [CrossRef]
- Akotowanou, O.C.A.; Adjou, E.S.; Kougblenou, S.D.; Akpo, E.; Oluba, A.B.; Ahoussi, E.D.; Yessoufou, A.; Bankole, H.; Sohounhloue, D.C.K. Occurrence of Foodborne Bacteria with Outbreak Potentials and Fungi Associated with Tomato (Solanum lycopersicum L.) in Postharvest. Journal of Advances in Microbiology 2023, 23, 7–14. [Google Scholar] [CrossRef]
- Alani, M.A.R.; Elkaaby, E.A.J.; Majeed, W.A.A.; Al-Mandelawy, F.N.; Almaliky, A.K.Q.; Raad, J.M.; Salih, K.S.; Jabbar, N. and Shukor, K. Evaluation of Growth, Yield and some Qualities Characteristics of Two Cherry Tomato (Solanum lycopersicum var. cerasiforme) Cultivars under Plastichouse Conditions. Earth and Environmental Science 2023, 1225, 012026. [Google Scholar]
- Altemimi, A.; Lakhssassi, N.; Baharlouei, A.; Watson, D.G.; Lightfoot, D.A. Phytochemicals: Extraction, Isolation, and Identification of Bioactive Compounds from Plant Extracts. Plants 2017, 6, 42. [Google Scholar] [CrossRef]
- Anguilar-Gonzalez, A.E.; Palou, E.; Lopez-Malo, A. Response of Aspergillus niger Inoculated on Tomatoes Exposed to Vapor Phase Mustard Essential Oil for Short or Long Periods and Sensory Evaluation of Treated Tomatoes. Journal of Food Quality 2017, 4067856. [Google Scholar]
- Arah, I.K.; Ahorbo, G.K.; Anku, E.K.; Ernest, K.K.; Amaglo, H. Postharvest Handling Practices and Treatment Methods for Tomato Handlers in Developing Countries. Advances in Agriculture 2016, 6436945. [Google Scholar] [CrossRef]
- Arafa, R.A.; Moussa,O. M.; Soliman, N.E.; Shirasawa, K.; Kamel, S.M.; Rakha, M.T. Resistance to Phytophthora infestans in tomato wild relatives. T. Resistance to Phytophthora infestans in tomato wild relatives. African Journal of Agricultural Research 2017, 12(26), 2188–2196. [Google Scholar]
- Aralikatti, O.; Kanwar, S.H.; Chatterjee, S.; Patil, S.; Khanna, A. Genetic variability, heritability and genetic gain for yield and quality traits in tomato (Solanum lycopersicum L.). International Journal of Chemical Studies 2018, 6, 3095–3098. [Google Scholar]
- Ayala-Usma, D.A.; Cárdenas, M.; Guyot, R.; Mares, M.C. D.; Bernal, A.; Muñoz, A.R.; Restrepo, S. A whole genome duplication drives the genome evolution of Phytophthora betacei, a closely related species to Phytophthora infestans. BMC genomics 2021, 22, 795. [Google Scholar] [CrossRef] [PubMed]
- Bal, U.; Abak, K. Haploidy in tomato (Lycopersicon esculentum Mill.): a critical review. Euphytica 2007, 158, 1–9. [Google Scholar] [CrossRef]
- Bharathkumar, M.V.; Sadashiva, A.T.; Punith, K.R. Combining ability, gene action and heritability analysis for early blight resistance, yield and quality traits in tomato (Solanum lycopersicum L.). Journal of Applied and Natural Science 2017, 9, 1495–1500. [Google Scholar]
- Bello, O.B.; Ullah, H.; Olawuyi, O.; Adebisi., O.; Azeez, A.H.; Owoade, T.A. Microorganisms causing post-harvest tomato (Solanum lycopersicum L.) fruit decay in Nigeria. Journal of Entomology and Zooligical Studies 2016, 4, 374–377. [Google Scholar]
- Bhala, V.P.; Verma, R.C. Gamma rays induced chromosomal aberrations in tomato (Solanum lycopersicum L.). Chromosome Botany 2018, 12, 86–90. [Google Scholar] [CrossRef]
- Bhandari, H.R.; Srivastava, K.; Reddy, G.E. 2017. Genetic Variability, Heritability and Genetic Advance for Yield Traits in Tomato (Solanum lycopersicum L.). International Journal of Current Microbiology and Applied Sciences.
- Brake, M.; Al-Qadumii, L.; Hamasha, H.; Migdadi, H.; Awad, A.; Haddad, N.; Sadder, M. Development of SSR Markers Linked to Stress Responsive Genes along Tomato Chromosome 3 (Solanum lycopersicum L.). BioTech 2022, 11, 2–14. [Google Scholar] [CrossRef]
- Brasileiro-Vidal, A.C.; Melo-Oliveira, M.B.; Carvalheira, G.M.G.; Guerra, M. Different chromatin fractions of tomato (Solanum lycopersicum, L.) and related species. Micron 2009, 40, 851–859. [Google Scholar] [CrossRef]
- Chikkeri, S.S.; Kumar, S.; Samnotra, R.K.; Loona, D.; Noopur, K. Evaluation of tomato (Solanum lycopersicum L.) genotypes for growth, yield attributes and yield under subtropical region of Jammu. The Pharma Innovation Journal 2023, 12, 3036–3038. [Google Scholar]
- Copati, M.G.; Alves, F.M.; Dariva, F.D.; Pessoa, H.P.; Dias, F.O.; Carneiro, P.C.; Nick, C. Resistance of the wild tomato Solanum habrochaites to Phytophthora infestans is governed by a major gene and polygenes. Anais da Academia Brasileira de Ciências 2019, 91, e20190149. [Google Scholar] [CrossRef]
- Danaski, A.I.; Shugaba, A.; Milala, M.A.; Ndirmbula, J.B.; Gidado, A. Isolation, Identification and Pathogenicity Study of the Microbes Causing Tomato Post-Harvest Spoilage in Maiduguri Metropolis, Maiduguri, Nigeria. Nigerian Journal of Biochemistry and Molecular Biology 2022, 37, 303–313. [Google Scholar]
- Dossoumou, M.E.; Sikirou, R.; Adandonon, A.; Gonroundobou, J.; Baba-Moussa, L. Tomato Hybrid and Local Varieties Screened for Resistance to Bacterial Wilt Caused by Ralstonia solanacearum under Screen House and Field Conditions. American Journal of Plant Sciences 2021, 12, 1222–1235. [Google Scholar] [CrossRef]
- Elafifi, S.T.; Ramadan, W.A.; El-Saady, W.A.; Abdelmalek, P.A. Inheritance of Resistance against Phytophthora Infestans in Wiled Tomato Genotype (Lycopersicon hirsutum l03684). Journal of Plant Production 2019, 10, 675. [Google Scholar]
- El-Mansy, A.B.; El-Moneim, D.A.; Alshamrami, S.M.; Safhi, F.A.; Abdein, M.A.; Ibrahim, A.A. Genetic Diversity Analysis of Tomato (Solanum lycopersicum L.) with Morphological, Cytological, and Molecular Markers under Heat Stress. Horticulturae 2021, 7, 2–18. [Google Scholar] [CrossRef]
- Ercolano, M.R.; Donato, A.D.; Sanseverino, W.; Barbella, M.; Natale, A.D.; Frusciante, L. Complex migration history is revealed by genetic diversity of tomato samples collected in Italy during the eighteenth and nineteenth centuries. Horticulture Research 2020, 7, 2–8. [Google Scholar] [CrossRef]
- Ezikanyi, D.N. Isolation and Identification of Fungi Associated with Postharvest Decay of Lycopersicum esculentum M. sold in Abakaliki, Nigeria. IOSR Journal of Agriculture and Veterinary Science 2016, 9, 87–89. [Google Scholar]
- Gerszberg, A.; Hnatuszko-Konka, K.; Kowalczyk, T.; Kononowicz, A.K. Tomato (Solanum lycopersicum L.) in the service of biotechnology. Plant Cell, Tissue and Organ Culture 2015, 120, 881–902. [Google Scholar] [CrossRef]
- Gutierrez, E.E. V. An overview of recent studies of tomato (Solanum lycopersicum spp) from a social, biochemical and genetic perspective on quality parameters. Basic Microbiology 2018, 50, 211–217. [Google Scholar]
- Gwa, V.I.; Lum, A.F. (2023). Isolation and identification of fungi associated with fruit rot disease of tomato (Solanum lycopersicum, L) in the Southern Guinea savannah, Nigeria. International Journal of Pathogen Research.
- Islam, M.M.; Jahan, K.; Sen, A.; Urmi, T.A.; Haque, M.M.; Ali, H.M.; Siddique, M.H.; Murata, Y. Exogenous Application of Calcium Ameliorates Salinity Salt Tolerance of Tomato (Solanum lycopersicum L.) and Enhances Food Quality. Antioxidants.
- Jia, M.; Foolad, M.R. Genetic analysis of late blight resistance in a new RIL population of tomato derived from LB-resistant Solanum pimpinellifolium accession PI 270443. Plant Breeding 2020, 139, 651–659. [Google Scholar] [CrossRef]
- Jonathan, S.G.; Babalola, B.J.; Olawuyi, O.J.; Odebode, J.A.; Ajayi, O.A. Nutritional composition and fungi deterioration of canned tomato products collected from Ibadan, South-western Nigeria. Tropical Plant Research 2016, 3, 642–648. [Google Scholar] [CrossRef]
- Kimura, S.; Sinha, N. Tomato (Solanum lycopersicum): a model fruit-bearing crop. Cold Spring.
- Harbor Protocols 2008, 2008, 105. 2008.
- Kouam, E.B.; Dongmo, J.R.; Djeugap, J.F. Exploring morphological variation in tomato (Solanum lycopersicum): A combined study of disease resistance, genetic divergence and association of characters. Agricultura Tropica et Subtropica 2018, 51, 71–82. [Google Scholar] [CrossRef]
- Lamidi, Y.; Agieni, G.A.; Isreal, O.A. Isolation and Identification of Fungi Associated with Tomato (Lycopersicon esculentum M.) ROT. IOSR Journal of Agriculture and Veterinary Science 2020, 3, 2617–3131. [Google Scholar]
- Lee, K.J.; Lee, G.; Ma, K.; Raveendar, S.; Cho, Y.; Lee, J.; Chung, J. Chemical Constitutions and Antioxidant Activities of Tomato Leaf Extracts. Plant Breeding and Biotechnology 2016, 4, 362–372. [Google Scholar] [CrossRef]
- Liu, C.; Zhang, Y.; Tan, Y.; Zhao, T.; Xu, X.; Yang, H.; Li, J. CRISPR/Cas9-mediated SlMYBS2 mutagenesis reduces tomato resistance to Phytophthora infestans. International Journal of Molecular Sciences 2021, 22, 11423. [Google Scholar] [CrossRef]
- Meena, R.K.; Kumar, S.; Meena, M.L.; Verma, S. Genetic variability, heritability and genetic advance for yield and quality attributes in tomato (Solanum lycopersicum L.). Journal of Phymacognosy and Phytochemistry 2018, 7, 1937–1939. [Google Scholar]
- Mekapogu, M.; Jumg, J.A.; Kwon, O.K.; Ahn, M.S.; Song, H.Y.; Jang, S. Recent Progress in Enhancing Fungal Disease Resistance in Ornamental Plants. International Journal of Molecular Sciences.
- Mesquita, A.T.; Cruz, M.V.R.; Azevedo, A. Chromosome number and genome size diversity in five Solanaceae genome. Caryologia 2019, 7, 0008–7114. [Google Scholar]
- Mohamed, S.M.; Ali, E.E.; Mohamed, T.Y. Study of Heritability and Genetic Variabilityamong Different Plant and Fruit Characters of Tomato (Solanum lycopersicon L.). International Journal of Scientific and Technology Research 2012, 1, 55–58. [Google Scholar]
- Naika, S.; Jeude, J.L.; Goffau, M.; Hilmi, M.; Dam, B. ; 2019. Agrdock. In: Cultivation of tomato. Production, processing and marketing, B.V Dam (Ed.), Digigrafi Press, Wageningen, Netherlands. Pp 6-92.
- Ngwe, F.N.; Siljak-Yakovlev, S. ; 2023. Sex Determination in Dioscorea dumetorum: Evidence of Heteromorphic Sex Chromosomes and Sex-Linked NORs. Plants. 12, 228.
- Ohlson, E.W.; Foolad, M.R. Genetic analysis of resistance to tomato late blight in Solanum pimpinellifolium accession PI 163245. Plant Breeding 2016, 135, 391–398. [Google Scholar] [CrossRef]
- Okolo, E.; Abubakar, A. Investigation of the mycoflora of deteriorating tomatoes (Solanum lycopersicum mill.) Sold in Lokoja Markets, Kogi state, Nigeria. Science World Journal 2023, 18, 597–601. [Google Scholar] [CrossRef]
- Olawuyi, O.J.; Ajie, V.I. Diverse morphological and molecular patterns of tomato (Solanum lycopersicum Linn.) accessions. Plant Gene 2023, 34, 100423. [Google Scholar] [CrossRef]
- Olowe, O.M.; Odebode, A.C.; Olawuyi, O.J.; Akanmu, A.O. Correlation, Principal Component Analysis and Tolerance of Maize Genotypes to Drought and Diseases in Relation to Growth Traits. American-Eurasian Journal of Agriculture and Environmental Sciences 2013, 13, 1554–1561. [Google Scholar]
- Olowe, O.M.; Olawuyi, O.J.; Sobowale, A.A.; Odebode, A.C. Role of arbuscular mycorrhizal fungi as biocontrol agents against Fusarium verticillioides causing ear rot of Zea mays L. (Maize). Current Plant Biology 2018, 15, 30–37. [Google Scholar] [CrossRef]
- Onuorah, S.; Orji, M.U. Fungi Associated with the Spoilage of Post-harvest Tomato Fruits Sold in Major Markets in Awka, Nigeria. Universal Journal of Microbiology Research 2015, 3, 11–16. [Google Scholar]
- Oyewole, B.O.; Olawuyi, O.J.; Odebode, A.C.; Abiala, M.A. Influence of Arbuscular Mycorrhiza fungi (AMF) on Drought Tolerance and Charcoal Rot Disease of Cowpea. Biotechnology Reports 2017, 14, 8–15. [Google Scholar] [CrossRef]
- Pandey, R.P.; Kumar, N.; Mishra, S.P. Study on genetic variability, heritability and genetic advance in tomato (Solanum lycopersicum L Mill.). Journal of Pharmacognosy and Phytochemistry 2018, 7, 3387–3389. [Google Scholar]
- Panthee, D.R.; Pandey, A.; Paudel, R. Multiple Foliar Fungal Disease Management in Tomatoes: A Comprehensive Approach. International Journal of Plant Biology 2024, 15, 69–93. [Google Scholar] [CrossRef]
- Pavan, S.; Van, H.; Adriaan, W.; Bai, Y. Solanum lycopersicum (Tomato). Encyclopedia of Life Sciences (ELS). John Wiley & Sons, Ltd: Chichester. 2009. [Google Scholar]
- Phom, M.; Chaturvedi, H.P. and Kanaujia, S.P. Genetic variability, character association and path coefficient analysis in tomato (Lycopersicon esculentum mill.) Genotypes. Plant Archives 2016, 15, 519–522. [Google Scholar]
- Plouznikoff, k. , Asins, M.J.; De Boulois, H.D.; Carbonell, E.A.; Declerck, S. Genetic analysis of tomato root colonization by arbuscular mycorrhizal fungi. Annals of Botany 2019, 124, 933–946. [Google Scholar]
- Pooja, H.M.; Gasti, V.D.; Bhavidoddi, A.; Yashavantakumar, H.K.; Prashantha, A.; Srikantaprasad, D. Genetic variability, heritability and genetic advance in determinate types of tomato (Solanum lycopersicum L.). The Pharma Innovation 2022, 11, 222–225. [Google Scholar]
- Rasheed, A.; Iliya, M.; Khan, T.N.; Mahmood, A.; Riaz, U.; Chattha, M.B. ; Najila,A.T.; kashgry, A.; Hassan, M.U.; Wu, Z.; Qari, S.H. Study of genetic variability, heritability and genetic advancefor yield related traits in tomato (Solanum lycopersicum Mill). Frontiers in genetics 2023, 10, 3389. [Google Scholar]
- Rubio, M.B.; De Medeiros, H.A.; Morán-Diez, M.E.; Castillo, P.; Hermosa, R.; Monte, E. ; 2019. A Split-Root Method to Study Systemic and Heritable Traits Induced by Trichoderma in Tomato Plants. In: Reinhardt, D.; Sharma, A. (eds) Methods in Rhizosphere Biology Research. Rhizosphere Biology. Springer, Singapore.
- Saini, P.; Chauhan, S.S.; Shabnam, A.A.; Chand, L.; Negi, N. Genetic Variability and Trait Association Analysis for Agro-Morphological Markers in Mulberry Genetic Resources from Kashmir, India. International Journal of current Microbiology and applied Sciences 2018, 7, 1799–1812. [Google Scholar] [CrossRef]
- Sajad, A.M.; Jamaluddin, J.; Abid, H.Q. Fungi Associated with the Spoilage of Post-Harvest Tomato Fruits and Their Frequency of Occurrences in Different Markets of Jabalpur, Madhya-Pradesh, India. International Journal of Current Research and Review 2017, 9, 12–16. [Google Scholar]
- Sale, A.; Sadiq, M.A.; Abbac, H.M.; Ahmadd, M.; Yuguda, U.A. Variation in Resistance to Fungal Attack among Tomato (Solanumlycopersicum) Fruits Varieties Sold in Gombe Metropolis, Nigeria. International Journal of Science: Basic and Applied Research 2018, 39, 139–148. [Google Scholar]
- Sani, A.; Abubakar, M.; Hamisu, A. Fungal pathogens associated with post-harvest deterioration of tomato fruits in Jega Local Government Area, Kebbi, Nigeria. International Journal of Research Publications and Reviews 2023, 4, 1303–1308. [Google Scholar]
- Santos, G.G.; Mattos, L.M.; Moretti, C. L. Quality and Occurrence of Mycotoxins in Tomato Products in the Brazilian Market. Enzyme Engineering 2016, 5, 2–7. [Google Scholar] [CrossRef]
- Sarma, S.; Pandey, A.K.; Sharma, K.; Ravi, M.; Sreelakshmi, Y.; Sharma, R. MutS-Homolog2 silencing generates tetraploid meiocytes in tomato (Solanum lycopersicum). Plant Direct 2017, 1, 1–5. [Google Scholar] [CrossRef]
- Shah, L.R.; Ahmed, N.; Murtaza, I.; Khan, I.; Hussain, K.; Khan, T.; Rashid, R.; Javeed, T.; Khan, S. and N, J. (2022). Genetic studies in tomato (Solanum spp.) under temperate conditions. ( 2022). Genetic studies in tomato (Solanum spp.) under temperate conditions. The Pharma Innovations. 11, 463–465.
- Singh, N.; Ram, C.N.; Deo, C.; Yadav, G.C.; Singh, D.P. Genetic Variability, Heritability and Genetic Advance in Tomato (Solanum Lycopersicum L.). Plant Archives 2015, 15, 705–709. [Google Scholar]
- Sobowale, A.A.; Omole, I.D.; Olawuyi, O.J. Relationship Among Fungi Associated with Whole and Rotting Solanum lycopersicum L. and Two Capsicum Species from Different Locations. European Journal of Applied Sciences 2022, 10, 73–89. [Google Scholar]
- Sola, A.O.; Oluwatoyin, I.O.; Samuel, A.O.; John, L.B. Isolation and identification of bacteria and fungi associated with tomatoes. Medical and Clinical Research 2022, 7, 1–11. [Google Scholar]
- Somraj, B.; Reddy, R.V.; Reddy, K.R.; Saidaiah, P.; Reddy, M.T. Genetic variability, heritability and genetic advance for yield and quality attributes in heat tolerant exotic lines of tomato (Solanum lycopersicum L.). Journal of Pharmacognosy and Phytochemistry 2017, 6, 1956–1960. [Google Scholar]
- Song, C.; Guo, J.; Sun. , W.; Wang, Y. Whole Genome Duplication of Intra- and Inter-chromosomes in the Tomato Genome. Journal of Genetics and Genomics 2012, 39, 361–368. [Google Scholar] [CrossRef] [PubMed]
- Sullenberger, M.T.; Jia, M.; Gao, S.; Foolad, M.R. Genetic analysis of late blight resistance in Solanum pimpinellifolium accession PI 270441: Heritability and response to selection. Plant Breeding 2018, 137, 89–96. [Google Scholar] [CrossRef]
- Szinay, D. ; 2010. The development of FISH tools for genetic, phylogenetic and breeding studies in tomato (Solanum lycopersicum). Wageningen University, Wageningen, NL. Pp:147.
- Tejada-Alvarado, J.J.; Mel’endez-Moria, J.B.; Vilca-Valquia, Juan, C. ; Neri, A.; Ayala-Tocto, R.Y.; Huaman-Huaman, E.; Ambler, E.R.; Gill, A.B.; Manuel, O.A.; Malluri, G. Impact of wild solanaceae rootstocks on morphological and physiological response, yield, and fruit quality of tomato (Solanum lycopersicum L.) grown under deficit irrigation conditions. Heliyon 2023, 9, e12755. [Google Scholar]
- Tripura, A.; Das, A.; Das, B.; Priya, B.; Sarkar, K.K. Genetic studies of variability, character association and path analysis of yield and its component traits in potato (Solanum tuberosum L.). Journal of Crop and Weed 2016, 12, 56–63. [Google Scholar]
- Tuan, M.H. Agronomic requirement and Production Methods Tomatoes in the Red River Delta of Vietnam. Journal of Tropical Crop Science 2015, 2, 33–38. [Google Scholar]
- Vermeiren, J.; Villers, S.L.; Wittemans, L.; Vanlommel, W.; Roy, J.V.; Marien, H.; Coussement, J.R.; Steppe, K. Quantifying the importance of a realistic tomato (Solanum lycopersicum) leaflet shape for 3-D light modelling. Annals of Botany 2020, 126, 661–670. [Google Scholar] [CrossRef]
- Waiba, K.M.; Sharma, P.; Kumar, K.I.; Chauhan, S. Studies of Genetic Variability of Tomato (Solanum lycopersicum L.) Hybrids under Protected Environment. International Journal of Bio-resource and Stress Management 2021, 12, 264–270. [Google Scholar] [CrossRef]
- Wahua, C.; Olaleye, S.M. Comparative Taxonomic Studies on Solanum aethiopicum Linn. and Solanum nigrum Linn. (Solanaceae). Greener Journal of Agricultural Sciences 2013, 3, 849–854. [Google Scholar] [CrossRef]
- Wang, Y.; Tang, X.; Cheng, Z.; Mueller, L.; Giovanannoni, J.; Tanksley. Euchromatin and Pericentromeric Heterochromatin: Comparative Composition in the Tomato Genome. Genetics 2006, 172, 2529–2540. [Google Scholar] [CrossRef]
- Willem, M.J.; Rengs, V.; Schmidt, M.H.W.; Effgen, S.; Le, D.B.; Wang, Y.; Zaidan, M.W.A.; Huetel, B.; Schouten, O.J.; Usadel, B.; Underwood, C.J. A chromosome scale tomato built from complementary PacBio and Nanopore sequences alone reveals extensive linkage drag during breeding. The Plant Journal 2022, 110, 572–588. [Google Scholar]
- Ya, A.; Ibrahim, B.; Aminu, F.; Ali, M. Incidence of Fungi Associated with the Spoilage of Post-Harvest Decay of Tomato (Lycopersicum esculentum) In Badikko Kaduna. Northern Nigeria Journal of Pulmonary Disease and Respiratory Medicine 2022, 3, 1–4. [Google Scholar]
- Yadav, S.; Ameta, K.D.; Sharma, S.K.; Dubey, R.B.; Rathore, R.S.; Kumar, H.; Kapuriya, V.K. Effect of Spacing and Training on Vegetative Growth Characteristics and Yield of Tomato (Solanum lycopersicum L.) Grown in Polyhouse. International Journal of Current Microbiology and Applied Sciences 2017, 6, 1969–1976. [Google Scholar] [CrossRef]

Table 1.
Severity rating scale for disease symptoms in plants.
 |
Table 2.
Resistance ratings of tomato accessions to P. infestans.
 |
 |
Table 3.
Resistance rating of tomato genotypes to A. niger.
 |
 |
Key: TNDL = Total number of days to disease in leaves, SR = Severity rating, SS = Severity scale.
Table 4.
Mean square variance of chromosomes in P. infestans and A. niger treated accessions.
 |
Key: ± = Standard deviation, means with same letter are not significantly different.
Table 5.
Chromosome assessment of seven cells from selected accessions treated with P. infestans.
 |
Key: ± = Standard deviation, means with same letter are not significantly different.
Table 6.
Chromosome assessment of seven cells from selected accessions treated with A. niger.
 |
 |
Key: ± = Standard deviation, means with same letter are not significantly different. .
Table 7.
Variance components, GA and heritability for growth characters of P. infestans treated plants.
Table 7.
Variance components, GA and heritability for growth characters of P. infestans treated plants.
 |
Table 8.
Variance components, GA and heritability for growth characters of A. niger treated plants.
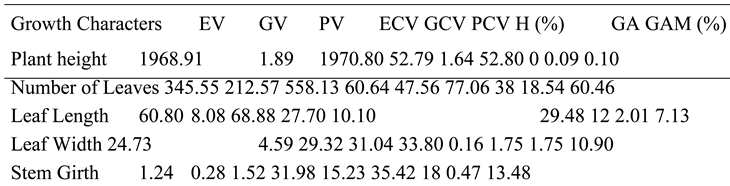 |
Table 9.
Variance components, GA and heritability for agronomic characters of P. infestans treatments.
Table 9.
Variance components, GA and heritability for agronomic characters of P. infestans treatments.
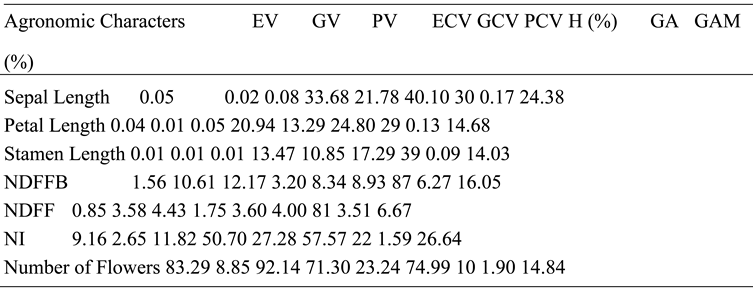 |
Table 10.
Variance components, GA and heritability for agronomic characters of A. niger treatments.
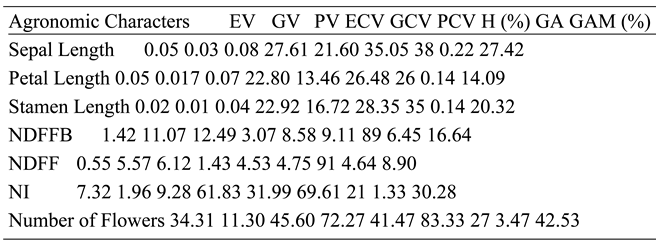 |
Table 11.
Variance components, GA and heritability for yield characters of P. infestans treated plants.
Table 11.
Variance components, GA and heritability for yield characters of P. infestans treated plants.
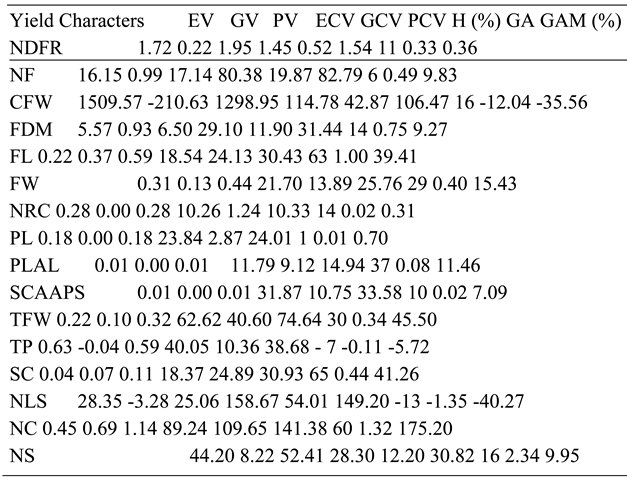 |
Table 12.
Variance components, GA and heritability for yield characters of P. infestans treated plants.
Table 12.
Variance components, GA and heritability for yield characters of P. infestans treated plants.
 |
 |
Disclaimer/Publisher’s Note: The statements, opinions and data contained in all publications are solely those of the individual author(s) and contributor(s) and not of MDPI and/or the editor(s). MDPI and/or the editor(s) disclaim responsibility for any injury to people or property resulting from any ideas, methods, instructions or products referred to in the content. |
© 2025 by the authors. Licensee MDPI, Basel, Switzerland. This article is an open access article distributed under the terms and conditions of the Creative Commons Attribution (CC BY) license (http://creativecommons.org/licenses/by/4.0/).
Copyright: This open access article is published under a Creative Commons CC BY 4.0 license, which permit the free download, distribution, and reuse, provided that the author and preprint are cited in any reuse.


