
Submitted:
07 January 2025
Posted:
08 January 2025
You are already at the latest version
Abstract
This study investigated the influence of different functional groups on the electro-optical properties of polymer-dispersed liquid crystal (PDLC) films. Twelve acrylate monomers with functional groups like amino, halogen, and double-bond were introduced into PDLC films, and twelve samples were prepared. The electro-optical properties and microstructure of the films were characterized. Results show that compared to films with amino and halogen groups, those with hydroxyl groups have the best balance of driving voltage and contrast, achieving higher contrast at lower driving voltage, making it an ideal preparation scheme for low-voltage, high-contrast PDLC films. Also, in the presence of hydroxyl groups, introducing double-bond increases driving voltage and decreases saturation. As the distance between hydroxyl and double-bond in the molecule rises, their mutual influence weakens, leading to a simultaneous increase in driving voltage and contrast.
Keywords:
PDLC
; Electro-optical properties
; Hydroxyl functional group
; Driving voltage
1. Introduction
The microstructure of polymer dispersed liquid crystal (PDLC) is an islands-in-sea structure formed by phase separation between the liquid crystal phase and the polymer phase [1]. Generally, liquid crystal molecules in PDLC films are randomly oriented. Currently, the average refractive index of liquid crystal microdroplets differs from the refractive index (np) of the polymer matrix. Consequently, incident light undergoes multiple reflections and refractions at the interface between the liquid crystal microdroplets and the polymer matrix [2]. When a high electric field is applied to a PDLC film, liquid crystal molecules with positive dielectric anisotropy realign parallel to the electric field. If the ordinary refractive index (no) of the liquid crystal is equal to the refractive index (np) of the polymer matrix, the incident light can pass through without scattering, achieving a transition from an opaque to a transparent state. This electro-optic (E-O) switching property from an opaque light-scattering state to a transparent light-transmitting state endows PDLC films with broad application prospects in displays, smart windows, holographic films, and optical shutters [3,4,5].
PDLC films have drawbacks such as high driving voltage and low contrast, limiting their application scope. Existing research shows that a PDLC film with a droplet diameter of about 1.0 microns requires a switching field intensity of about 1.0 volts per micron [6]. Factors influencing PDLC film contrast include refractive index, film thickness, and the size, shape, density, and orientation control of droplets. The driving voltage of PDLC films is closely related to film thickness and the micro-morphology of the two phases in PDLC. Thus, achieving a balance between driving voltage and contrast by modulating various factors in PDLC films is a major research direction.
Besides the material properties of PDLC films, the preparation conditions during fabrication also significantly affect electro-optical performance. Currently, many studies have focused on the impact of preparation factors like polymerization conditions on PDLC films, yielding useful findings [7,8,9,10]. However, research on the influence of the chemical nature of polymers and liquid crystal materials themselves on the electro-optical properties of PDLC films needs further intensification. Therefore, enhancing PDLC film electro-optical properties by optimizing material combinations is an effective way to improve performance.
In recent years, many research teams have made efforts to enhance PDLC film performance. Some uniquely designed liquid crystal molecules [11,12,13], such as fluorine-containing ones, vinyl-terminated molecules, and cyanide-capped molecules, have been incorporated to improve electro-optical properties, achieving PDLC film formulations with even lower driving voltages. To further investigate the impact of acrylate molecules with diverse functional groups on PDLC film performance, this paper selects twelve acrylate molecules with various functional groups like different hydroxyl groups, bromine, and amino groups, and incorporates them into the PDLC film formulation. Systematic experimental exploration of different functional groups provides a useful reference for preparing PDLC films with excellent electro-optical properties.
2. Results and Discussion
2.1. Influence of Acrylates with Different Functional Groups on the Properties of PDLC Films
Characterizations of electro-optical properties and micro-morphology were performed respectively on six samples (C1-C6) to which N, N-diethylaminoethyl acrylate, ethyl 2-chloromethyl acrylate, 2-aminoethyl methacrylate, butyl acrylate, ethyl 2-bromomethyl acrylate, and hydroxyethyl methacrylate were added. The electro-optical test data are presented in Figure 1, and the SEM images of micro-morphology are shown in Figure 2.
The voltage-transmittance curves of the electro-optical properties of the 6 samples in Group C are shown in Figure 1(a). The voltage-ontransmittance (V-T) curves of all 6 samples display a similar traditional shape, i.e., the transmittance value initially remains at a low level (Toff). When the voltage exceeds the threshold (Vth), the transmittance begins to increase and then reaches the on-state transmittance (Ton) as the voltage rises. Due to differences in the compositions of different PDLC films, the positions of the 6 V-T curves show distinct differences. That is, the 6 groups of PDLC films have different threshold voltages and saturation voltages. It can be observed that the samples C1 and C3 containing amino functional groups have higher threshold voltages, and the positions of the V-T curves have shifted significantly to the right, indicating a decline in electro-optical properties. This shows that the existence of amino functional groups leads to a significant increase in the threshold voltage of PDLC films.
The contrast ratio results of the electro-optical properties of the 6 samples in Group C are shown in Figure 1(b). The C6 sample with hydroxyl groups has the highest contrast data, reaching 178, which is 63% higher than the contrast (109) of the C5 sample containing bromine. For different types of functional groups, the C1 and C3 samples containing amino functional groups also have relatively low contrasts, being 126 and 118 respectively. The contrasts of the C2 and C5 samples containing halogen elements chlorine and bromine show a polarized situation. The contrast of the C2 sample with chlorine reaches 142, while the contrast of the C5 sample with bromine is only 109. The contrast of the C4 sample containing BA, which is widely used in current PDLC films, is 153, second only to the C6 sample with the highest contrast. This indicates that the presence of hydroxyl groups is beneficial for enhancing the contrast of PDLC films.
The saturation voltage data of the electro-optical properties of the 6 samples in Group C are shown in Figure 1(c). There are significant differences in the saturation voltages of the 6 samples. The saturation voltages of the C1 and C3 samples containing amino groups reach above 40V, clearly higher than those of other samples. The saturation voltage of the PDLC film of the C3 sample reaches 43.8V. The saturation voltages of the other four groups of samples are all within the range of 20V to 25V. Among them, the sample with the lowest saturation voltage is the C2 sample added with chlorine element. The saturation voltage is only 21.5V, which is 43% lower than the saturation voltage of the highest C3 sample. The saturation voltages of samples C4 to C6 are basically at the same level.
The data of on-state transmittance and off-state transmittance of the electro-optical properties of the 6 samples in Group C are shown in Figure 1(d). Combining the results of Figure 1(b) and Figure 1(d), it can be seen that the C1 sample containing amino groups has a relatively high off-state transmittance and a relatively low on-state transmittance. Hence, its contrast is low, and it also has a relatively high saturation voltage. The off-state transmittances of C2 to C6 are at the same level. Thus, the main factor influencing the contrast of these several groups of PDLC films is the on-state transmittance. Combining Figure 1(b) and Figure 1(d), it can be observed that the distribution of on-state transmittance basically corresponds to that of contrast. Incorporating the data of saturation voltage, it can be found that C6 is a relatively ideal preparation scheme for PDLC films with low driving voltage and high contrast.
To better understand the impact of acrylates with different functional groups such as amino, halogen, and hydroxyl on the properties of PDLC films, the microstructure of the polymer matrix in six samples was characterized. The scanning electron microscope (SEM) images are shown in Figure 2. It can be observed that the polymer matrix is porous, with small voids evenly dispersed, and the sizes of these voids differ among different samples.
The size of polymer meshes is mainly determined by the competitive relationship between the polymerization rate of acrylate monomers and the diffusion rate of liquid crystals. In this competition, when the polymerization rate is slower than the diffusion rate of liquid crystal within the system, a large polymer mesh morphology will be formed. Conversely, a smaller polymer mesh will be formed. When the polymer void is larger, the specific surface area of the liquid crystal/polymer interface is smaller, and the anchoring effect on liquid crystal droplets is weaker. Under the application of the same voltage, the PDLC film with large polymer meshes requires a shorter on-state response time.
Generally, the more side chains a polymerization monomer possesses, the greater the steric hindrance of its molecule. At the same time, under the same mass fraction, the polymerization monomer with more branched chains will have a decreased molar fraction of active groups in the reaction system. As a result, in the relative competition between the polymerization rate and the liquid crystal diffusion rate, the polymerization monomer is at a disadvantage, which consequently leads to an enlargement in the size of polymer meshes. The molecules of samples C1 and C3 have more branched chains, thus resulting in greater steric hindrance. Consequently, they form a spatial structure with fewer pore structures but relatively larger individual voids. This indicates that the polymer monomer phase containing amino groups has a higher viscosity and slows down the diffusion rate of liquid crystal droplets.
By comparing samples C2 and C5, which contain different halogens, it can be observed that sample C2, containing chlorine elements, forms larger pores. This demonstrates that its polymerization rate is significantly lower than the diffusion rate of liquid crystal within the system. Hence, C2 has a smaller saturation voltage. Sample C6 exhibits a polymer network structure with distinct and complete boundaries and uniform dispersion of voids. Therefore, the contrast of sample C6 is the highest among all samples. When comparing samples C6 and C4, it can be seen that the voids of sample C6 are slightly smaller than those of sample C4. Thus, C6 shows a higher saturation voltage than C4.
The main reason for this phenomenon is that during the photopolymerization process, the addition of the photopolymerizable monomer hydroxyethyl methacrylate, which contains hydrogen bonds, leads to small and dense voids in the polymer network of the PDLC system. This affects the microstructure of the polymer network and the size distribution of liquid crystal droplets in the PDLC system. The possible reason for this phenomenon is mainly that introducing hydroxyl groups into acrylate monomers can enhance the initiation efficiency of photoinitiators and accelerate the polymerization process of monomers.
2.2. Influence of Diverse Acrylates with Hydroxyl Moieties on the Performance of PDLC Films
Select various acrylates containing hydroxyl groups as monomers and add them to the PDLC system for further investigation of the impact of different hydroxyl-containing molecules on the performance of PDLC films. Specifically, hydroxyethyl methacrylate, 2 - hydroxyethyl methacrylate, hydroxypropyl methacrylate, hydroxyethyl acrylate, 4 – hydroxyl butyl acrylate, and 2 - hydroxy - 1,3 – propanediol diacrylate were added to the PDLC raw materials respectively, obtaining six different PDLC film samples (D1 - D6). The electro-optical properties and micro-morphology of these samples were characterized. Refer to Table 2 for the specific formulations of each sample.
The voltage-transmittance curves of the electro-optical properties of the 6 samples in Group D are depicted in Figure 3(a). The voltage-transmittance (V-T) curves of all 6 samples display a similar traditional shape. In terms of grouping, between samples D1 and D3, the curve of sample D3 is located to the left of the curve of sample D1. The threshold voltage and saturation voltage of sample D3 have decreased compared to sample D1. Since the acrylate monomers of D1 and D3 are hydroxyethyl methacrylate (-OH) and hydroxypropyl methacrylate (HPMA) respectively, the difference between the two molecules lies in the different lengths of the alkyl chains connected to the hydroxyl group. The chain length of sample D3 is longer than that of sample D1. Thus, as the alkyl chain length increases, there will be a reduction in threshold voltage and saturation voltage. By comparing the V - T curves of samples D2 and D4, it can be found that the V - T curve of D4 is on the right side of the D2 curve. The acrylate monomers added in samples D2 and D4 are 2-hydroxyethyl methacrylate (HEMA) and hydroxyethyl acrylate (HEA) respectively. The lengths of the alkane chains connected to the hydroxyl group of the two molecules are the same, but the HEA of sample D4 has an additional double-bond. This indicates that the presence of double-bond leads to an increase in threshold voltage and saturation voltage. Comparing samples D4 and D5, the V-T curve of sample D5 appears on the right side of sample D4. The acrylate monomers added in samples D4 and D5 are hydroxyethyl acrylate (HEA) and 4–hydroxyl butyl acrylate (HBA). The chain length of sample D5 is longer than that of sample D4. It can be observed that when double-bond and hydroxyl groups coexist, as the distance between the two groups increases, the threshold and saturation voltages increase. By comparing samples D4 and D6, the V-T curve of D6 has shifted to the right compared to D4, indicating an increase in threshold voltage and saturation voltage. This shows that as more double-bond structures are introduced, a similar effect to the increase in the distance between double-bond and hydroxyl groups will occur. Based on the results of all the above groups, it is hypothesized that the introduction of double-bond in acrylate can bring about the effect of lowering threshold voltage and saturation voltage. At the same time, as the distance between double-bond and hydroxyl groups in the same molecule increases, the influence of double-bond on hydroxyl groups will weaken.
The contrast ratio results of the electro-optical properties of the 6 samples in Group D are depicted as shown in Figure 3(b). Sample D1 shows the highest contrast data, reaching 178, which is superior to sample D3 which has an identical structure but a greater distance between hydroxyl groups. When comparing samples D2 and D4, it can be observed that sample D4 containing double-bond has the lowest contrast (121) among all the samples, being 26% lower than sample D2 (163) lacks double-bond but has a similar structure in other aspects. By comparing samples D4 and D5, it can be found that the contrast of sample D5 is 148, higher than 121 of sample D4. The contrast of sample D5 shows a significant increase, indicating that when double-bond are present simultaneously, as the distance between double-bond and hydroxyl groups increases, the mutual influence between the two groups is notably weakened. When comparing samples D4 and D6, it can be found that as the number of double-bond increases, the contrast of D6 also rises.
The test results of on-state transmittance and off-state transmittance of the electro-optical properties of the 6 samples in Group D are depicted as shown in Figure 3(c). The on-state transmittances of D1 and D3 are similar. However, as the alkyl chain length in acrylate increases, the off-state transmittance of D3 shows a marked increase. When comparing samples D2 and D4, with the introduction of double-bond, the on-state transmittance undergoes a significant decline, and the off-state transmittance shows a notable increase. When comparing samples D4 and D5, it can be observed that as the distance between double-bond and hydroxyl groups lengthens, the on-state transmittance rapidly ascends, and the off-state transmittance declines. When comparing samples D4 and D6, the on-state transmittance and off-state transmittance also present a similar changing tendency as that of samples D4 and D5.
The test results of the saturation voltage of the electro-optical properties of the 6 samples in Group D are depicted as shown in Figure 3(d). There are substantial differences in the saturation voltages of the 6 groups of samples. The saturation voltage of sample D1 is 21.2V, which is higher than 15.8V of sample D3. This indicates that as the chain length increases, the saturation voltage declines. When comparing samples D2 and D4, it can be observed that with the introduction of double-bond, the saturation voltage of sample D4 rises to 22.4V. The saturation voltage of sample D2 without double-bond is merely 16.3V. When comparing samples D4 and D5, it can be found that when double-bond and hydroxyl groups emerge simultaneously, as the distance between double-bond and hydroxyl groups lengthens, the saturation voltage undergoes a significant increase. The saturation voltage of sample D5 reaches 35.6V, which is the group with the highest saturation voltage among the six groups of samples. When comparing samples D4 and D6, it can be found that with the introduction of more double-bond, the saturation voltage decreases from 35.6V to 26.3V.
To gain a more profound understanding of the impact of different acrylates with hydroxyl groups on the properties of PDLC films, the microstructure of the polymer matrix in the 6 samples was characterized. The scanning electron microscope (SEM) images are presented as shown in Figure 4. It can be observed that the polymer matrix is porous, with small voids evenly dispersed, and the sizes of these voids differ among different samples.
In general, small-sized voids (liquid crystal droplets) will account for the change in critical voltage according to the following equation:
Vc≈d/3a(σ_2/σ_1 +2)√((K(l^2-1))/(ε_0 ∆ε))
In the formula, Vc represents the critical voltage. The parameters d, a, σ1, σ2, K, l, and Δε respectively represent the thickness of the liquid crystal cell, the major semi-axis, the electrical conductivity of the polymer, the electrical conductivity of the liquid crystal, the effective elastic constant, the aspect ratio (l = a/b, where b is the minor semi-axis), and the dielectric anisotropy of the liquid crystal.
According to the equation, explain the cause of this phenomenon from the perspective of free energy. The increase in the interaction area at the interface leads to the polymer exerting higher anchoring energy on the liquid crystal phase relatively. Consequently, more external energy is required to reorient the liquid crystal molecules, and the critical voltage rises. The void size corresponds to the voltage change. The abundant interface can enhance light scattering, resulting in a reduction in the off-state transmittance (Toff) value and an increase in contrast.
When comparing samples D1 and D3, it can be observed that as the alkyl chain length in the acrylate molecule increases, the voids in the polymer matrix enlarge, and the saturation voltage correspondingly decreases. Additionally, the off-state transmittance of D usurpation in the acrylate monomers and the diffusion rate of liquid crystal, the polymer matrix forms a relatively viscous state and a network structure with blurred boundaries. By comparing samples D3, D4, and D5, it can be found that under the condition where double-bond and hydroxyl groups coexist, as the positions of the two functional groups gradually move apart and the mutual influence gradually diminishes, a polymer network structure with uniform distribution and distinct boundaries is gradually formed. When comparing samples D4 and D6, it can be seen that with the introduction of more double-bond, a similar effect to the distancing of double-bond and hydroxyl groups will also be manifested, obtaining a larger polymer matrix void grid, thereby resulting in a decrease in saturation voltage and off - state transmittance. However, the decrease brought about by the introduction of double-bond is smaller than the effect caused by the distancing of the two groups.
3. Materials and Methods
3.1. Materials
In the experiment, PDLC films were prepared by combining various acrylate monomers, nematic liquid crystals, and photoinitiators. The specific chemical structures of each main raw material can be referred to in Figure 5.
The acrylate crosslinker 1,4 - butanediol diacrylate (BDDA) was purchased from Sartomer (Guangzhou) Chemical Co., Ltd. The initiator Irgacure 651, which is benzoin diethyl ether, was procured from Guangzhou Evergreen Trading Co., Ltd. The proportion of photoinitiator 651 added to the PDLC composite film is 1% of the total weight.
The acrylate monomers were purchased from Shanghai Macklin Biochemical Technology Co., Ltd., including butyl acrylate (BA), cyclohexyl methacrylate (CHMA), lauryl methacrylate (LMA), N, N - diethylaminoethyl acrylate (-N - C4H10), ethyl 2 - chloromethacrylate (-Cl), 2 - aminoethyl methacrylate (-NH2), ethyl 2 - bromomethacrylate (-Br), hydroxyethyl methacrylate (-OH), hydroxyethyl acryate (HEA), hydroxypropyl methacrylate (HPMA), 2 - hydroxyethyl methacrylate (HEMA), 4 - hydroxybutyl acrylate (HBA), and 2 - hydroxy - 1,3 - propanediyl diacrylate (AHMA), etc.
The liquid crystal E8 was procured from Jiangsu Hecheng New Materials Co., Ltd. The ordinary refractive index and extraordinary refractive index are denoted as no = 1.527 and ne = 1.774, respectively.
3.2. Sample Preparation
Polymer-dispersed liquid crystal (PDLC) films are fabricated utilizing ultraviolet light polymerization-induced phase separation (PIPS).
Step 1: Weighing. According to the proportions in Table 1 and Table 2, weigh the raw materials such as liquid crystal, acrylate monomer, and acrylate crosslinking agent respectively using an electronic balance and reserve them for subsequent use.
Step 2: Blending. After weighing, add each constituent into a centrifuge tube for blending. Incorporate Irgacure - 651 into the mixture at a proportion of 1% of the weight of the mixture. Then, use a Kylin-Bell vortex - 5 vortex mixer to agitate the mixture until it becomes clear and transparent.
Step 3: Injecting into the liquid crystal cell. Inject the mixture into a liquid crystal cell with a gap of 20 μm using capillary action. The liquid crystal cell used in the experiment is provided by Qingdao Taiweida Electronics Co., Ltd.
Step 4: Preparing the film. Place the filled liquid crystal cell under ultraviolet light to fabricate a PDLC film. The irradiation intensity of ultraviolet light is 15 mV/m2, and the irradiation time is 120 seconds.
3.3. Characterization
During the experiment, the electro-optical properties and microscopic morphologies of all samples were measured. The characterization methods are described in detail as follows:
(1) Characterization of electro-optical performance: In the experiment, electro-optical performance testing was carried out using a liquid crystal parameter tester (LCT - 5016C, Changchun Liancheng Instrument Co., Ltd.). A collimated light beam passes through the sample. The transmitted light is collected by an electro-optical detector. Then, the light intensity is converted into an electrical signal and processed by software. Finally, the transmittance data is output by the instrument. During transmittance measurement, a square-wave modulated alternating current (AC) voltage pulse is applied across the sample, and the frequency is set at 1 kilohertz. The transmittance values under air and in a dark environment are respectively normalized to 100% and 0%. Subsequently, relevant parameters are calculated, including the on-state transmittance (Ton), off-state transmittance (Toff), threshold voltage (Vth) and saturation voltage (Vsat), contrast ratio (CR), and rise (ton) and fall (toff) times. Ton and Toff denote the maximum and minimum transmissivity, respectively. Vth and Vsat are defined as the voltages required for the transmissivity to reach 10% and 90% of the maximum transmissivity Ton, respectively. The contrast is the ratio of Ton to Toff. ton and toff are the response times required for the transmissivity to ascend from 10% to 90% under the influence of an external voltage and the time needed to descend from 90% of Ton to 10% after a voltage pulse, respectively.
(2) Characterization of micro-morphology: The micro-morphology of the samples is inspected using a scanning electron microscope (SEM, Hitachi S - 4800). The preparation approach for the test sample is to cut the liquid crystal cell and then immerse it in cyclohexane for approximately ten days. After drying for one day, the sample is coated with gold and then characterized.
The Materials and Methods should be described with sufficient details to allow others to replicate and build on the published results. Please note that the publication of your manuscript implicates that you must make all materials, data, computer code, and protocols associated with the publication available to readers. Please disclose at the submission stage any restrictions on the availability of materials or information. New methods and protocols should be described in detail while well-established methods can be briefly described and appropriately cited.
Research manuscripts reporting large datasets that are deposited in a publicly available database should specify where the data have been deposited and provide the relevant accession numbers. If the accession numbers have not yet been obtained at the time of submission, please state that they will be provided during review. They must be provided prior to publication.
Interventionary studies involving animals or humans, and other studies that require ethical approval, must list the authority that provided approval and the corresponding ethical approval code.
4. Conclusions
In conclusion, the influence of various acrylate monomers on the electro-optical properties and polymer microstructure of PDLC films was investigated. Regarding acrylate monomers, the effects of acrylates with different functional groups like amino, halogen, and hydroxyl on the performance of PDLC films were primarily studied. By comparing the influence of different groups on the electro-optical properties of PDLC films, it was discovered that the addition of acrylates containing hydroxyl groups is beneficial for reducing the driving voltage and enhancing the contrast of PDLC films. Consequently, different acrylates containing hydroxyl groups were chosen to explore the influence of changes in other groups within acrylate molecules on the electro-optical properties of PDLC films in the presence of hydroxyl groups. Through a systematic study of the influence of different PDLC film properties, the following conclusions were reached:
(1) Compared to PDLC films containing amino and halogen groups, PDLC films with hydroxyl groups show the optimal balance between driving voltage and contrast and can achieve a relatively high contrast at a lower driving voltage. It is a relatively ideal preparation scheme for PDLC films with low driving voltage and high contrast.
(2) In the presence of hydroxyl groups, the simultaneous introduction of double-bond into acrylate molecules will cause an increase in driving voltage and a decrease in saturation. At the same time, as the distance between hydroxyl groups and double-bond in the molecule increases, the mutual influence of the two groups will gradually decrease, leading to a simultaneous increase in driving voltage and contrast. If the number of double-bond in the molecular structure is increased, a similar effect can be achieved, but the increase in driving voltage and contrast is relatively small.
(3) The introduction of acrylate molecules containing amino groups can lead to a significant increase in the saturation voltage of PDLC films. The main reason might be that the relatively large number of branched chains results in greater steric hindrance, causing an increase in voltage.
Author Contributions
Conceptualization, H Yang and M Yu; methodology, Z Zhang; data curation, N Sun; writing—original draft preparation, N Sun; writing—review and editing, N Sun; visualization, N Sun. All authors have read and agreed to the published version of the manuscript.
Funding
This research received no external funding.
Conflicts of Interest
The funders had no role in the design of the study; in the collection, analyses, or interpretation of data
References
- Hikmet, R.; Kemperman, H. Electrically switchable mirrors and optical components made from liquid crystal gels, Nature 1998, 392, 476–479.
- Doane, J.W.; Vaz, N.A.; Wu, B.G.; Zumer, S. , Field controlled light scattering from nematic microdroplets, Appl. Phys. Lett. 1986, 48, 269–271. [Google Scholar]
- He, Z.; Yin, K.; Hsiang, E.; Wu, S. , Volumetric light-shaping polymer-dispersed liquid crystal films for mini-LED backlights, Liq. Cryst. 2020, 47, 1458–1463. [Google Scholar]
- Halder, S.; Shin, Y.; Zhou, Z.; Zhang, X.; Hu, L.; Yang, D. , Aligned polymer dispersed liquid crystal film for light enhancement of quantum dot backlight, Opt. Express 2021, 29, 43241. [Google Scholar] [CrossRef]
- Oh, S.; Baek, J.; Heo, J.; Yoon, T. Dye-doped cholesteric liquid crystal light shutter with a polymer-dispersed liquid crystal film, Dyes Pigments 2016, 134, 36–40.
- Wu, B.; Erdmann, J.H.; Doane, J.W. Response times and voltages for PDLC light shutters, Liq. Cryst. 1989, 5, 1453–1465. [Google Scholar]
- Doane, J.W.; Golemme, A.; West, J.L.; Whitehead, J.B.; Wu, B.-G. , Polymer dispersed liquid crystals for display application, Mol. Cryst. Liq. Cryst 1988, 165, 511–532. [Google Scholar]
- Drzaic, P.S. , Reorientation dynamics of polymer dispersed nematic liquid crystal films, Liq. Cryst. 1988, 3, 1543–1559. [Google Scholar]
- Xu, J.; Yu, M.; Zou, C.; et al. Study on the preparation and performance of an electrically controlled dimming film with wide working temperature range[J]. Journal of Molecular Liquids 2022, 367, 120408. [Google Scholar] [CrossRef]
- Xu, J.; Li, H.; Guo, L.; et al. Effect of Curing Temperature on the Properties of Electrically Controlled Dimming Film with Wide Working Temperature Range[J]. Crystals, 2022, 122, 1551. [Google Scholar] [CrossRef]
- Xu, J.; Yu, M.; Zou, C.; et al. Effect of different types of mesogenic compounds with fluorine and cyano-group on the working temperature of polymer dispersed liquid crystal films [J]. Journal of Molecular Liquids, 2023, 387, 122629. [Google Scholar] [CrossRef]
- Zhang, Z.; He, X.; Zhang, L.; et al. A novel low-voltage fast-response electrically controlled dimming film based on fluorinated PDLC for smart window applications [J]. Chemical Engineering Journal, 2024, 479, 147668. [Google Scholar] [CrossRef]
- Zhang, Z.; He, X.; Zhang, L.; et al. A novel low-voltage fast-response electrically controlled dimming film based on fluorinated PDLC for smart window applications [J]. Chemical Engineering Journal 2024, 479, 147668. [Google Scholar] [CrossRef]
- Hu, J.M.; Hu, W.; Zhang, S.F.; et al. Combined effect of hydroxylated and ffuorinated acrylate monomers on improving the electro-optical and mechanical performances of pdlc-films, Liq. Cryst. 2022, 49, 769–779. [Google Scholar]
- Zhang, C.; Wang, D.; Cao, H.; et al. Preparation and electro-optical properties of polymer dispersed liquid crystal films with relatively low liquid crystal content, Polym. Adv. Technol. 2013, 24, 453–459. [Google Scholar] [CrossRef]
Figure 1.
Parameters of samples C1-C6: (a) voltage-transmittance curve; (b) contrast ratio; (c) saturation (Vsat) voltages per micron; (d)the on–(Ton) and off-state (Toff) transmittance.
Figure 1.
Parameters of samples C1-C6: (a) voltage-transmittance curve; (b) contrast ratio; (c) saturation (Vsat) voltages per micron; (d)the on–(Ton) and off-state (Toff) transmittance.
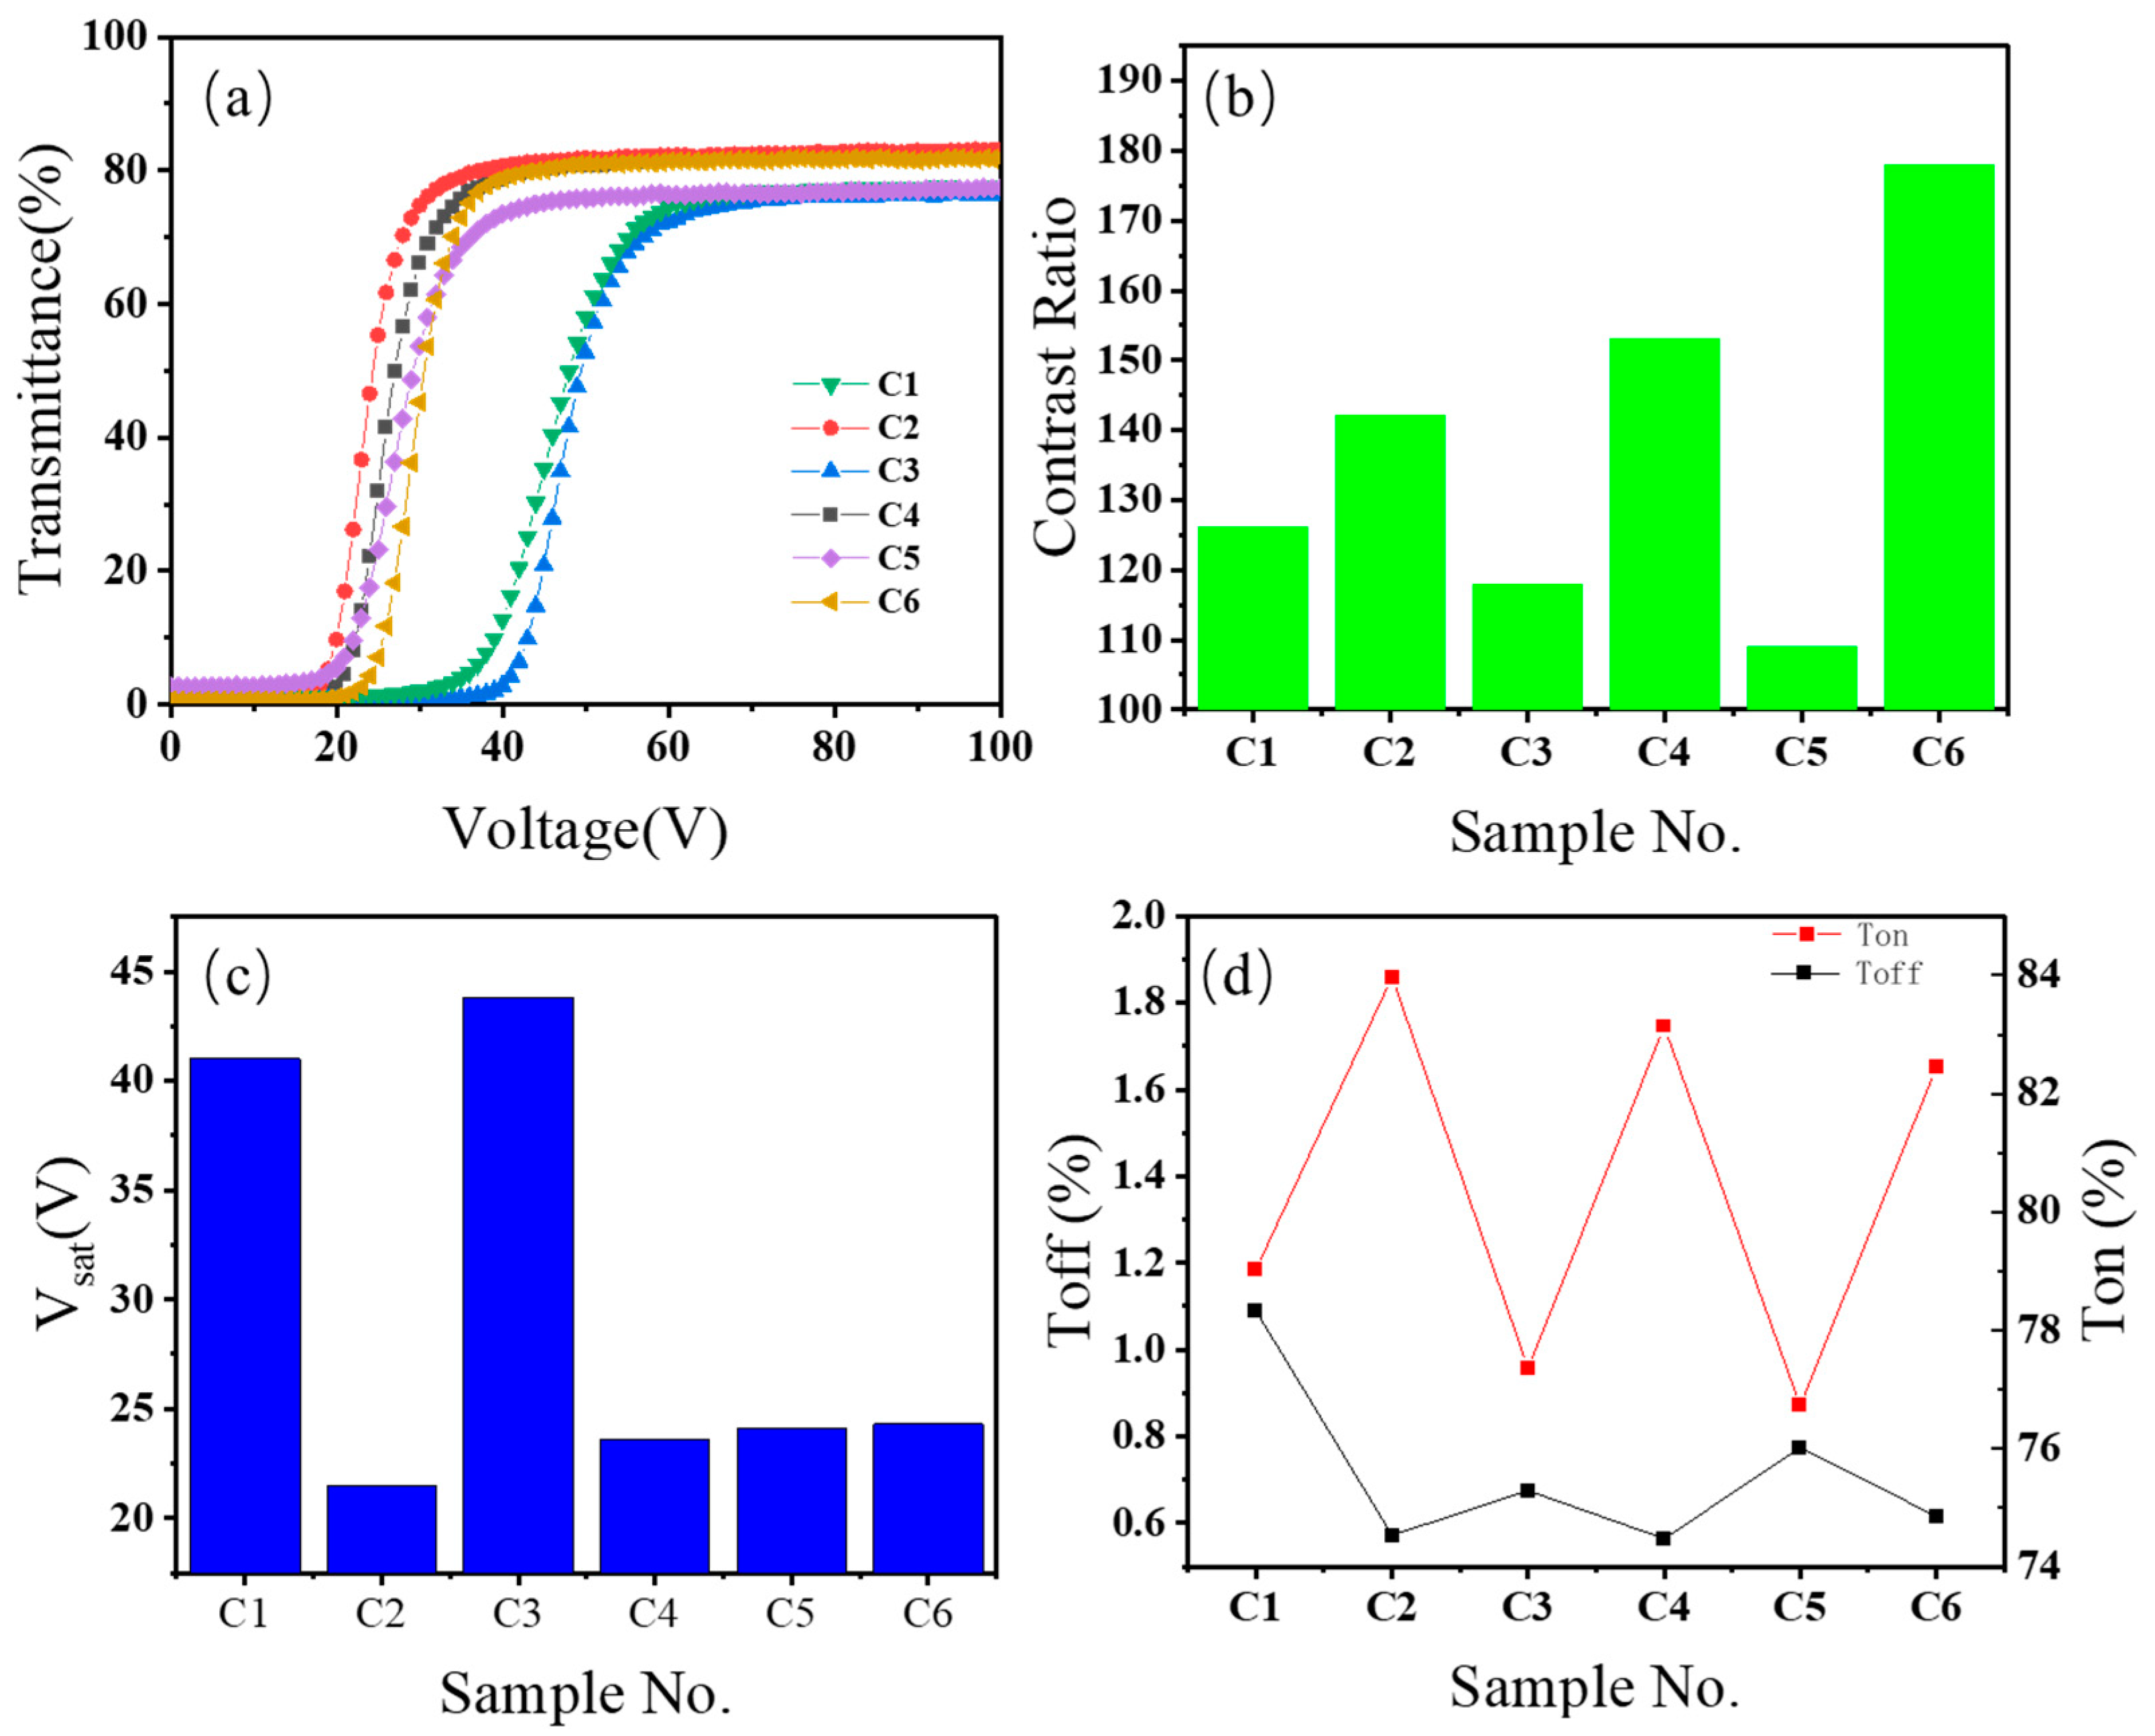
Figure 2.
SEM photos of the polymer matrix in samples C1-C6
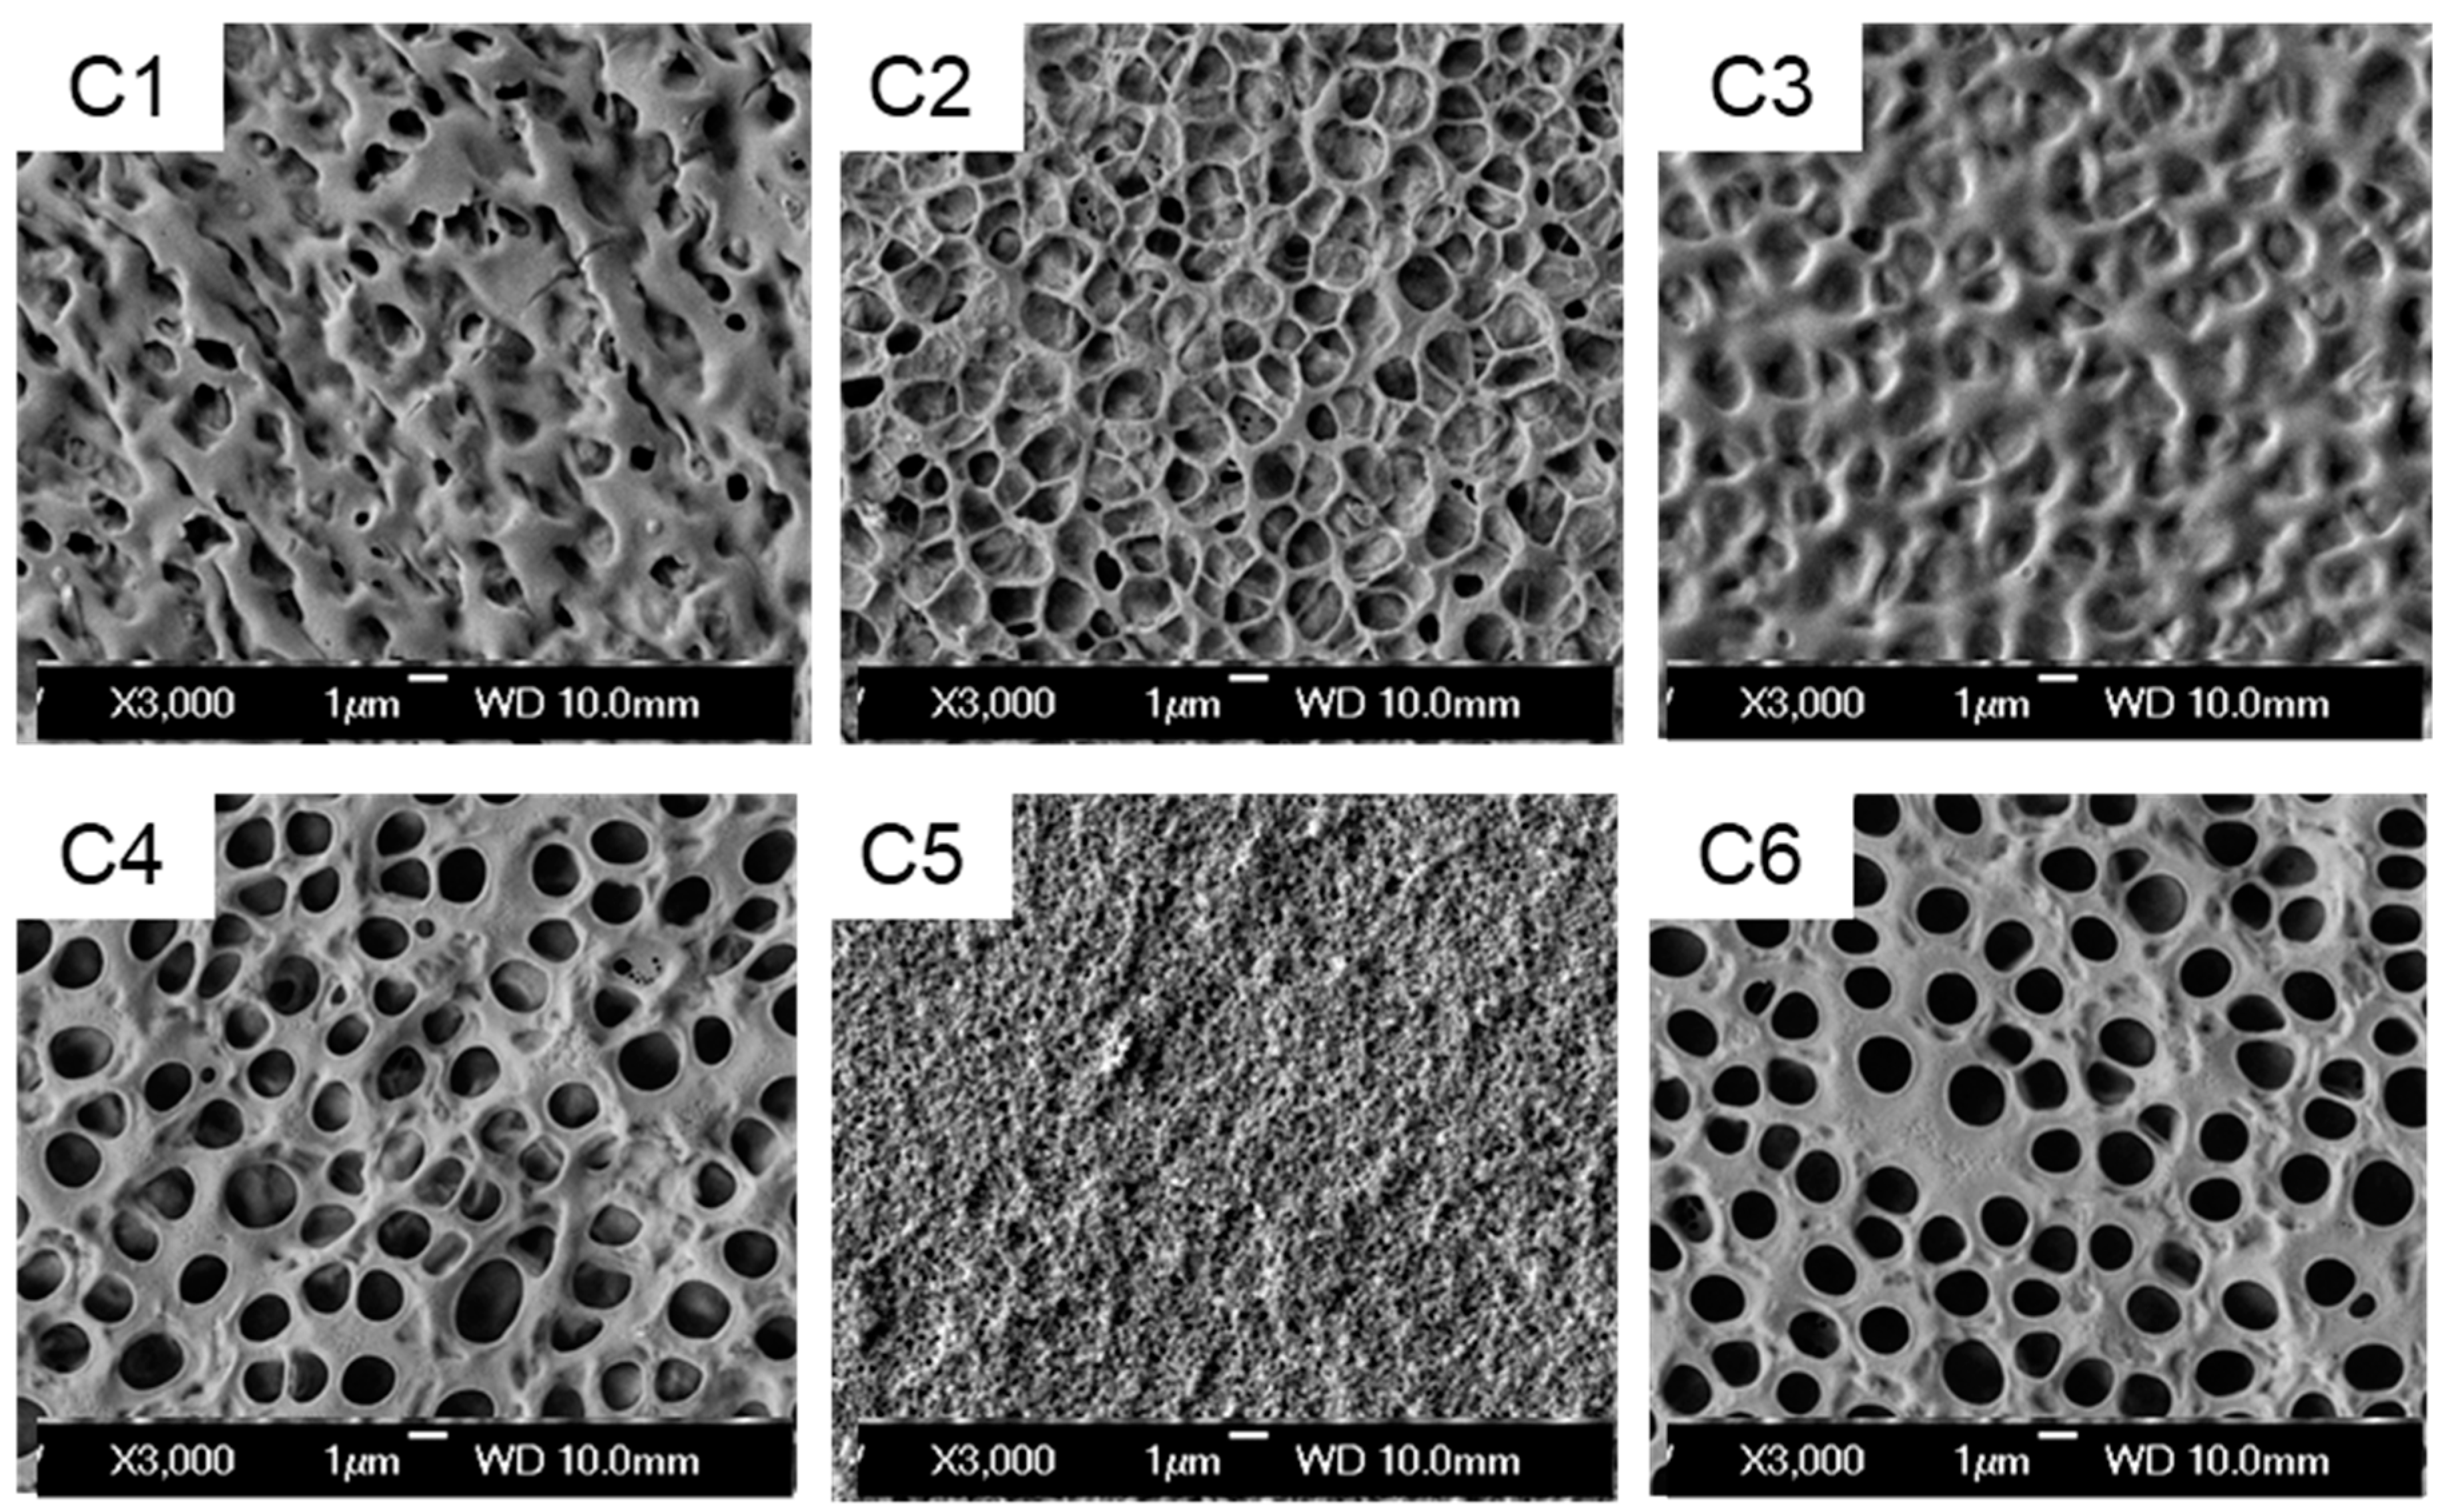
Figure 3.
Parameters of samples D1-D6: (a) voltage-transmittance curve; (b) contrast ratio; (c)the on–(Ton) and off-state (Toff) transmittance; (d) saturation (Vsat) voltages per micron.
Figure 3.
Parameters of samples D1-D6: (a) voltage-transmittance curve; (b) contrast ratio; (c)the on–(Ton) and off-state (Toff) transmittance; (d) saturation (Vsat) voltages per micron.
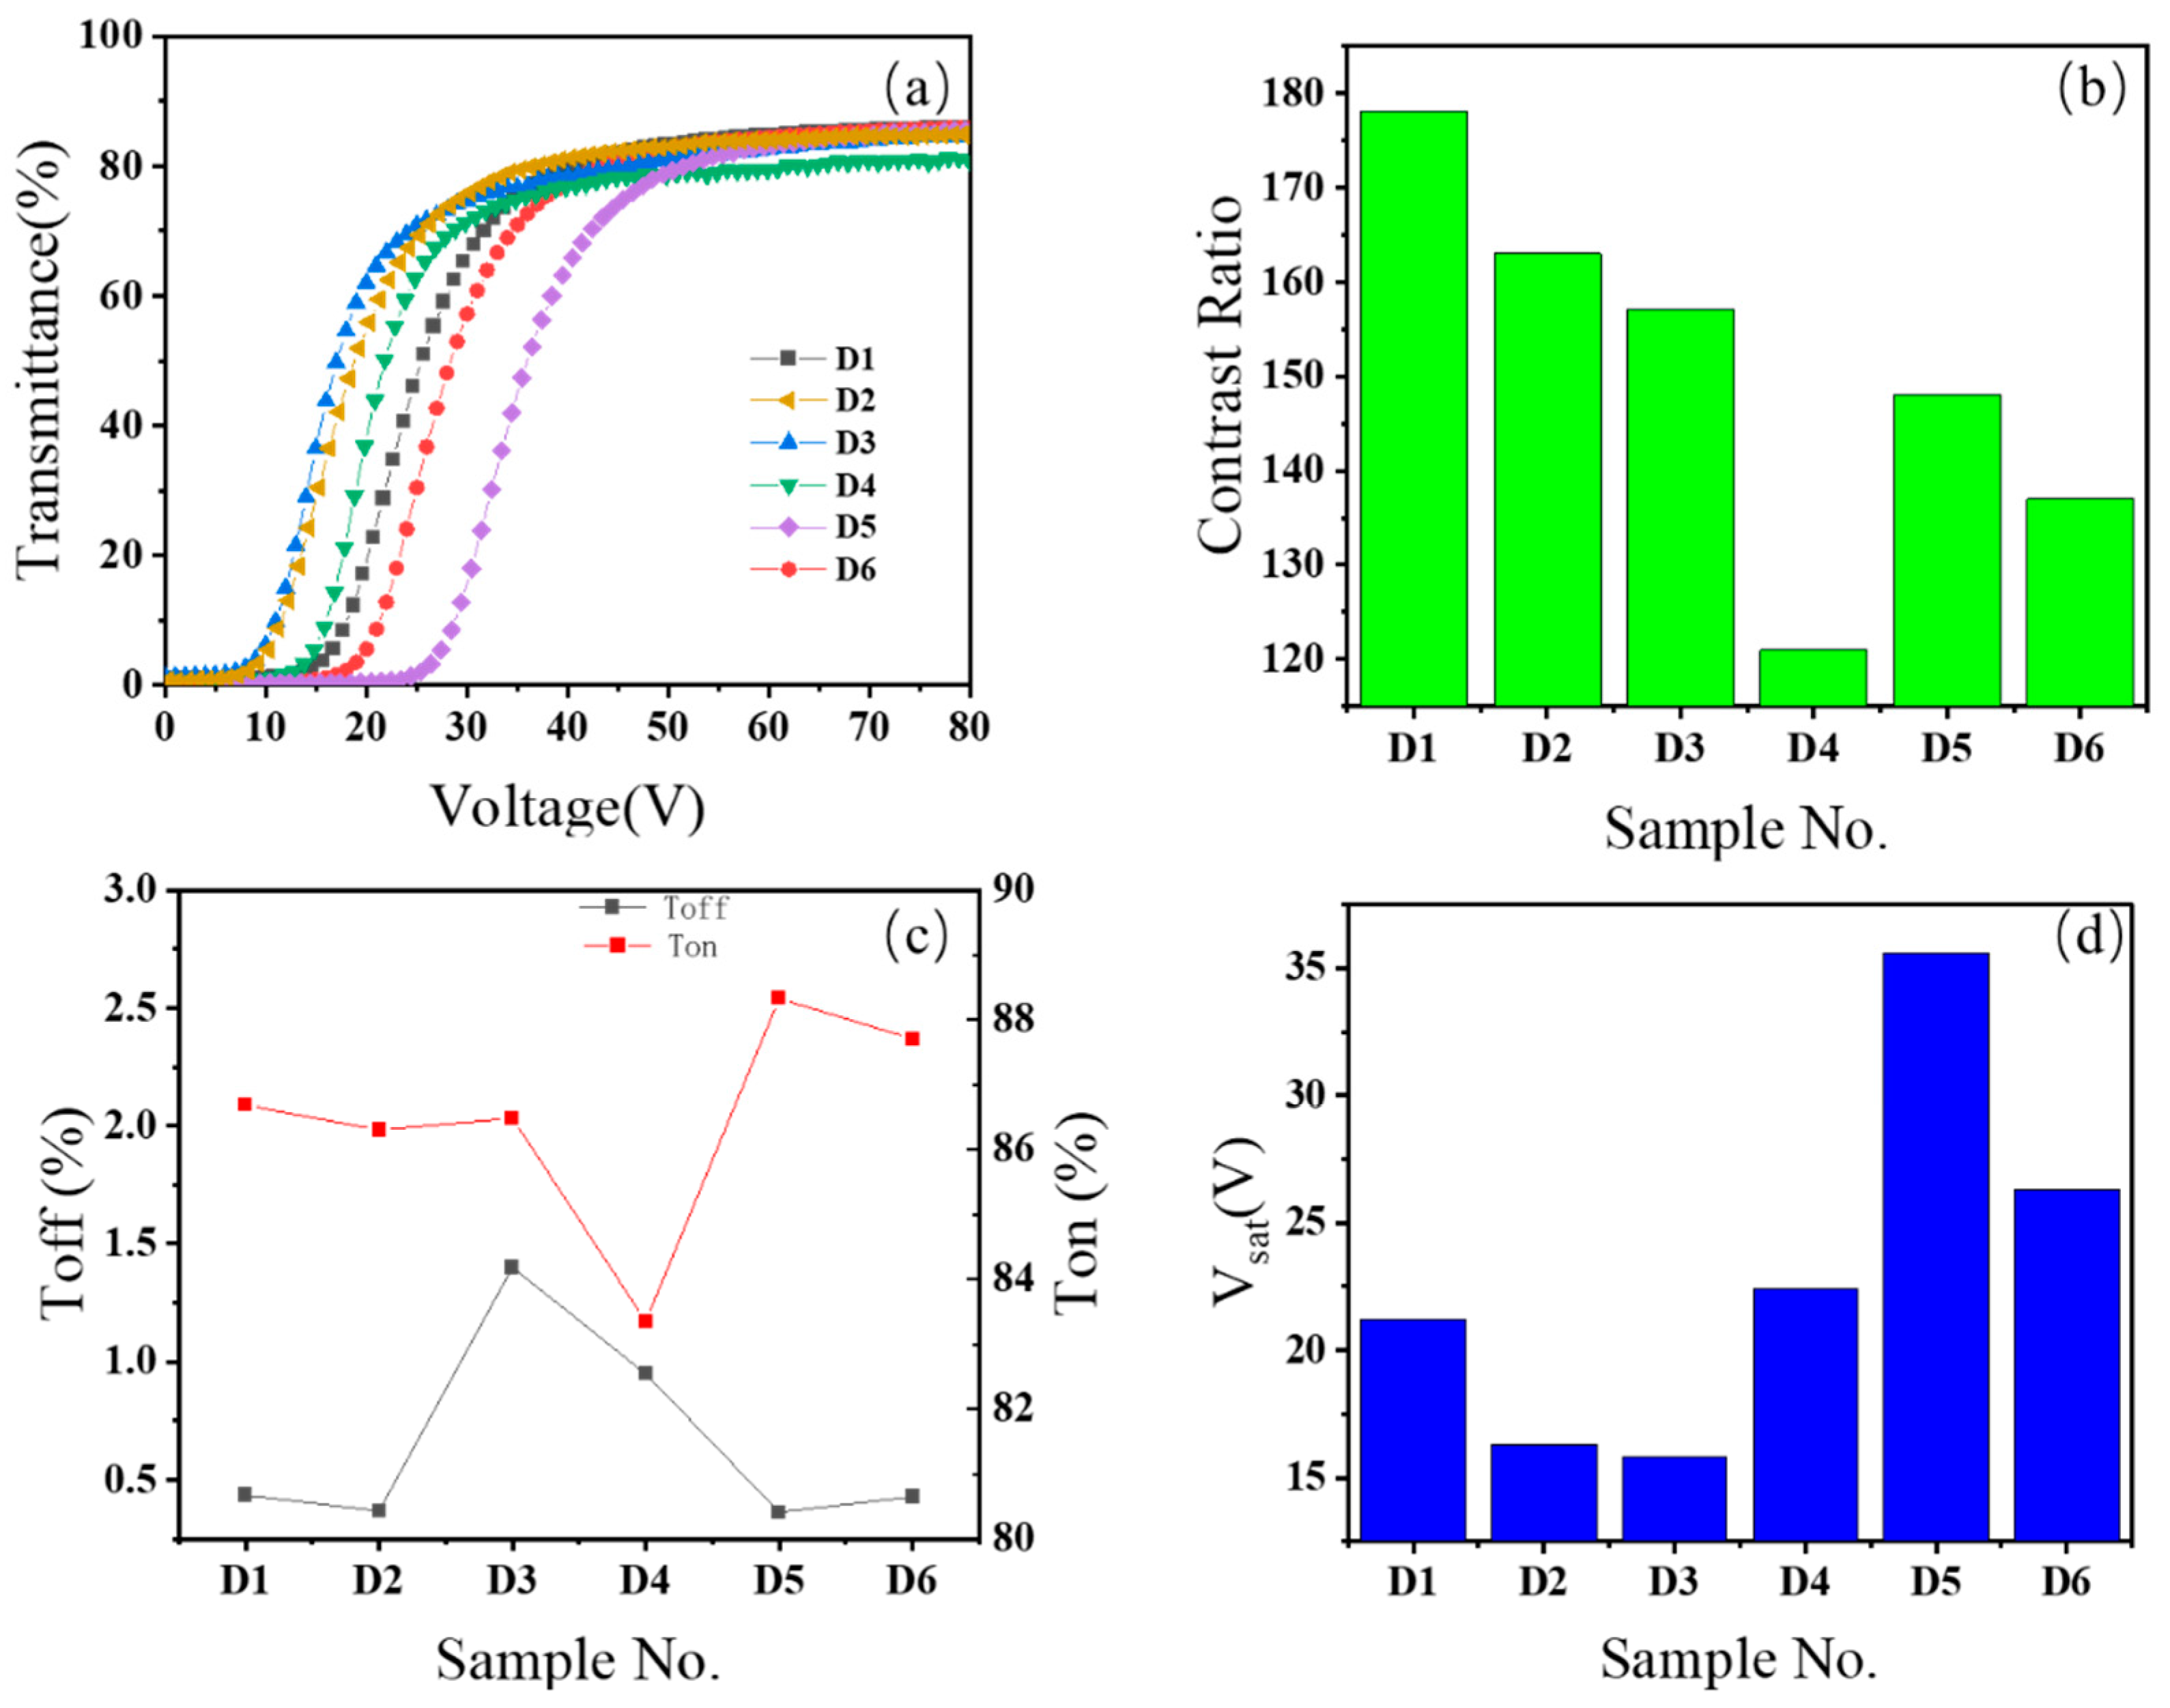
Figure 4.
SEM photos of the polymer matrix in samples D1-D6
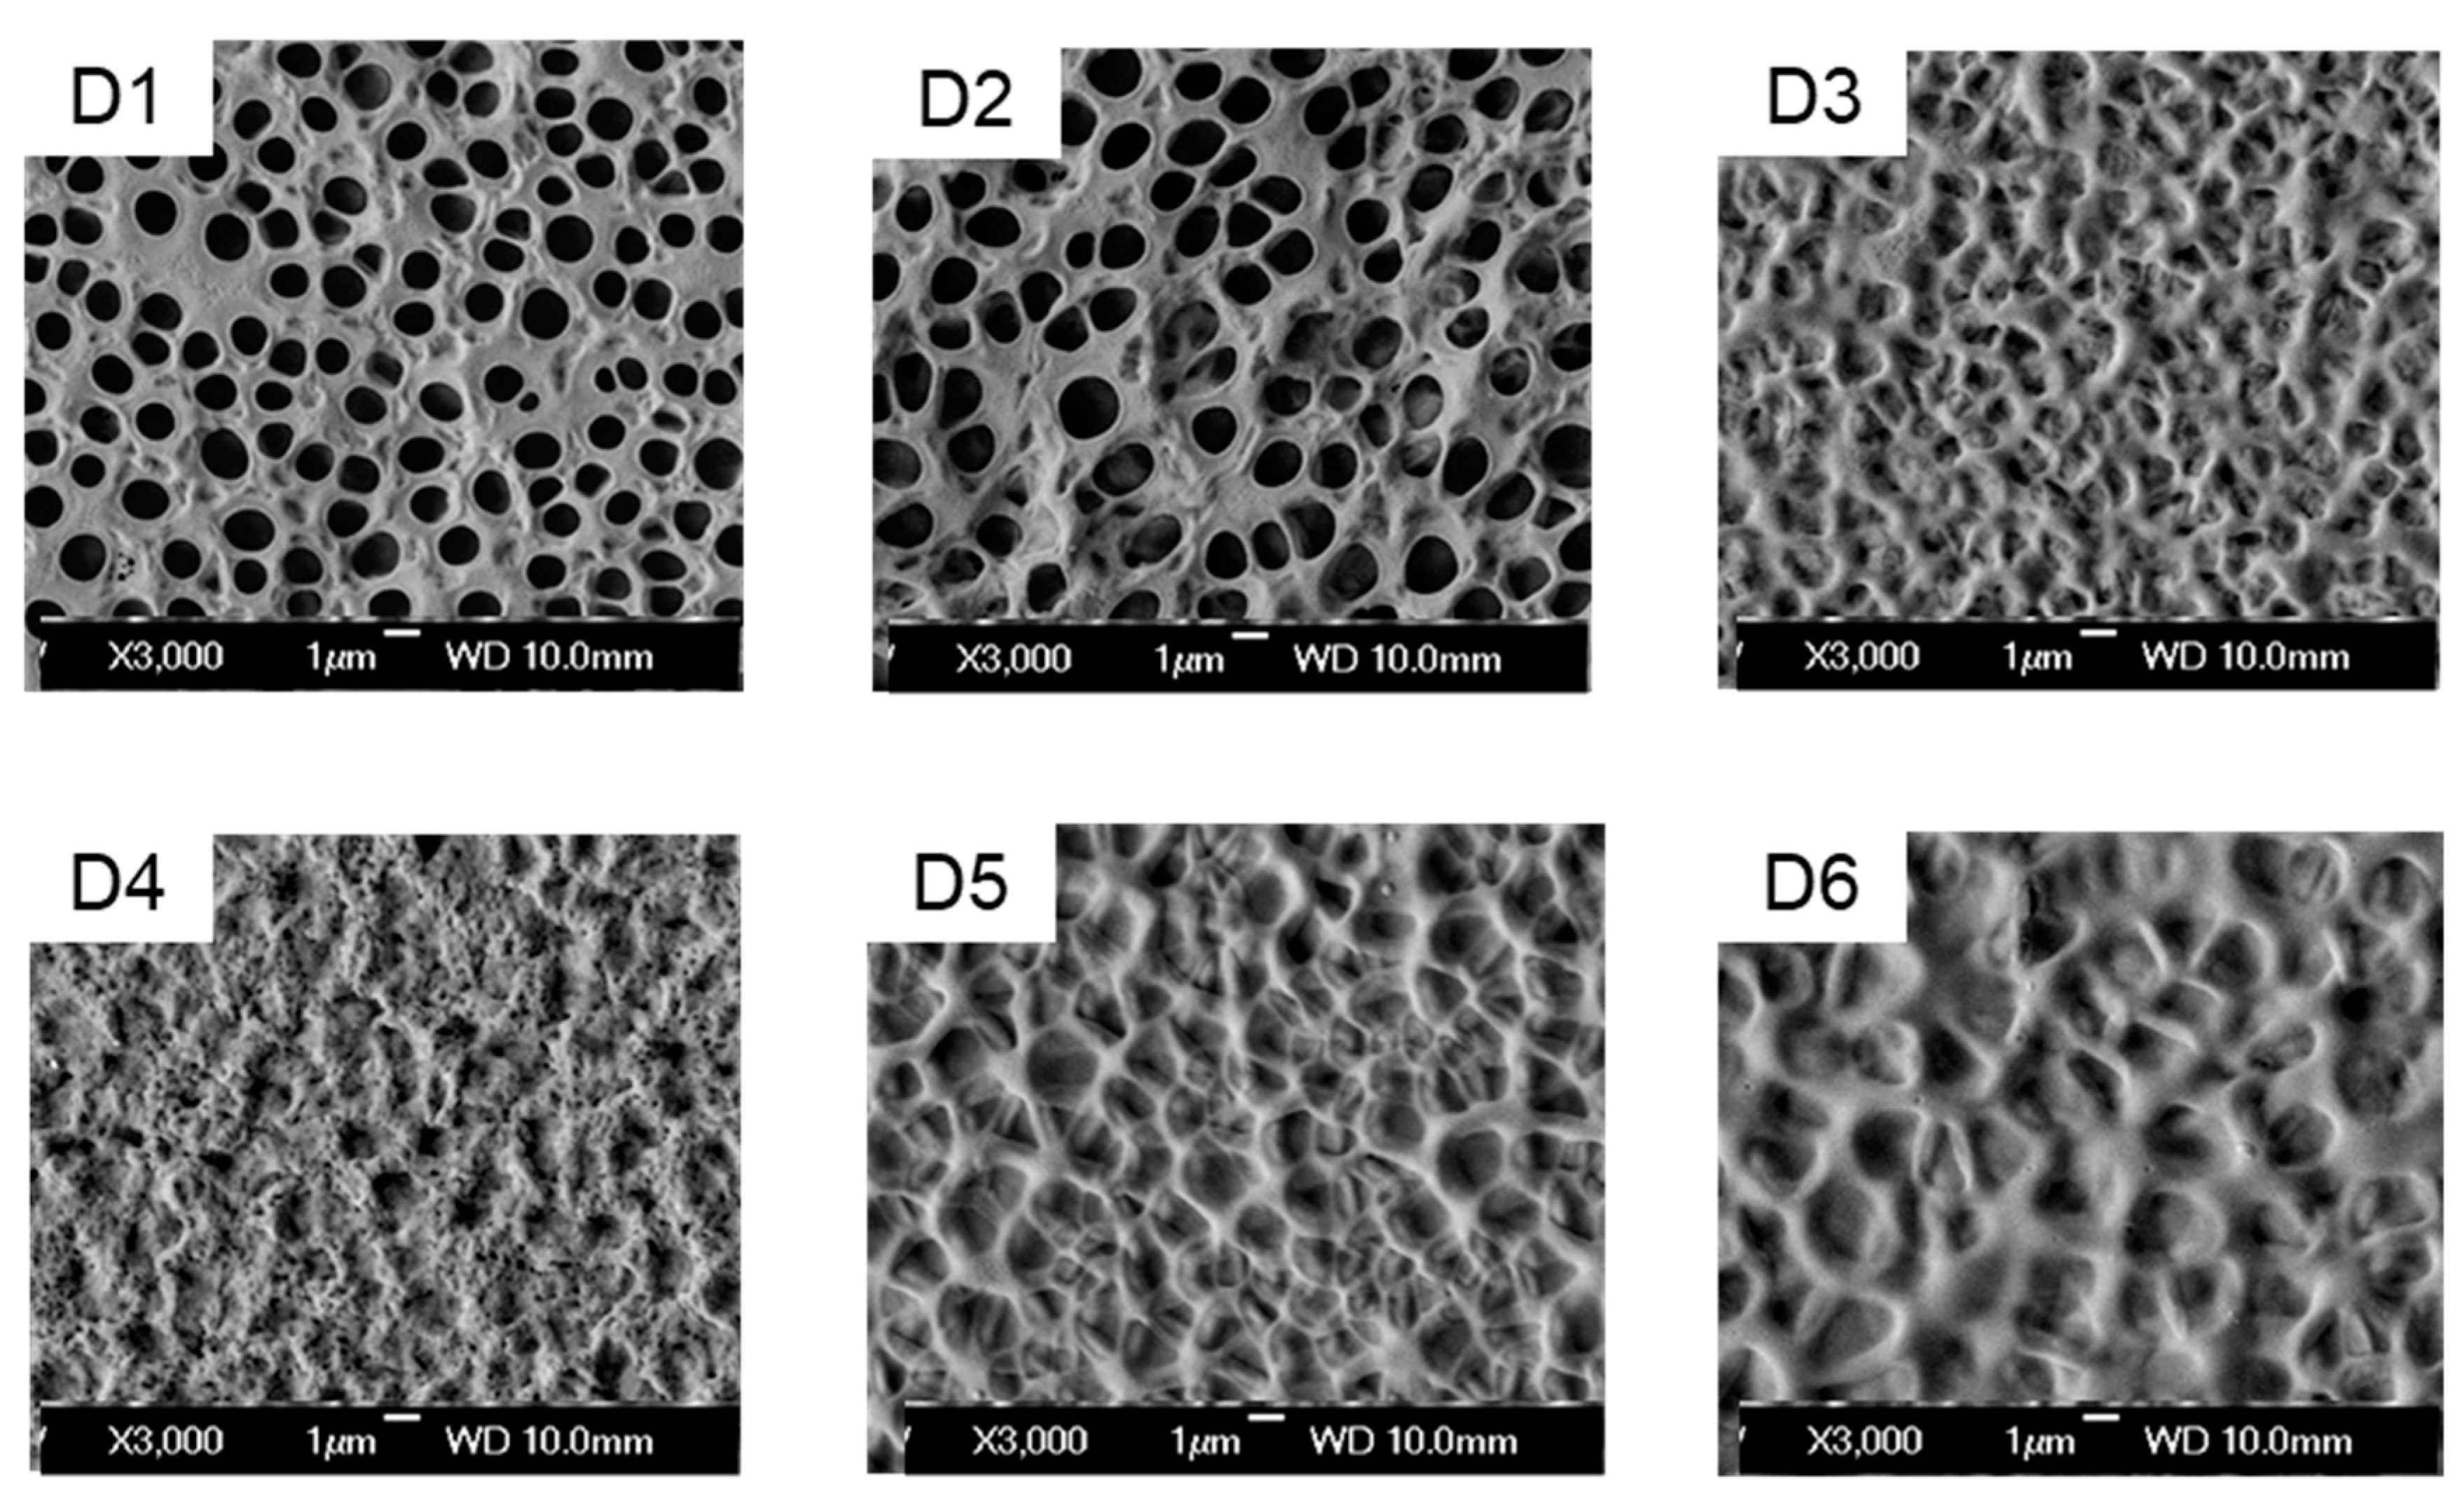
Figure 5.
Materials used in the experiments
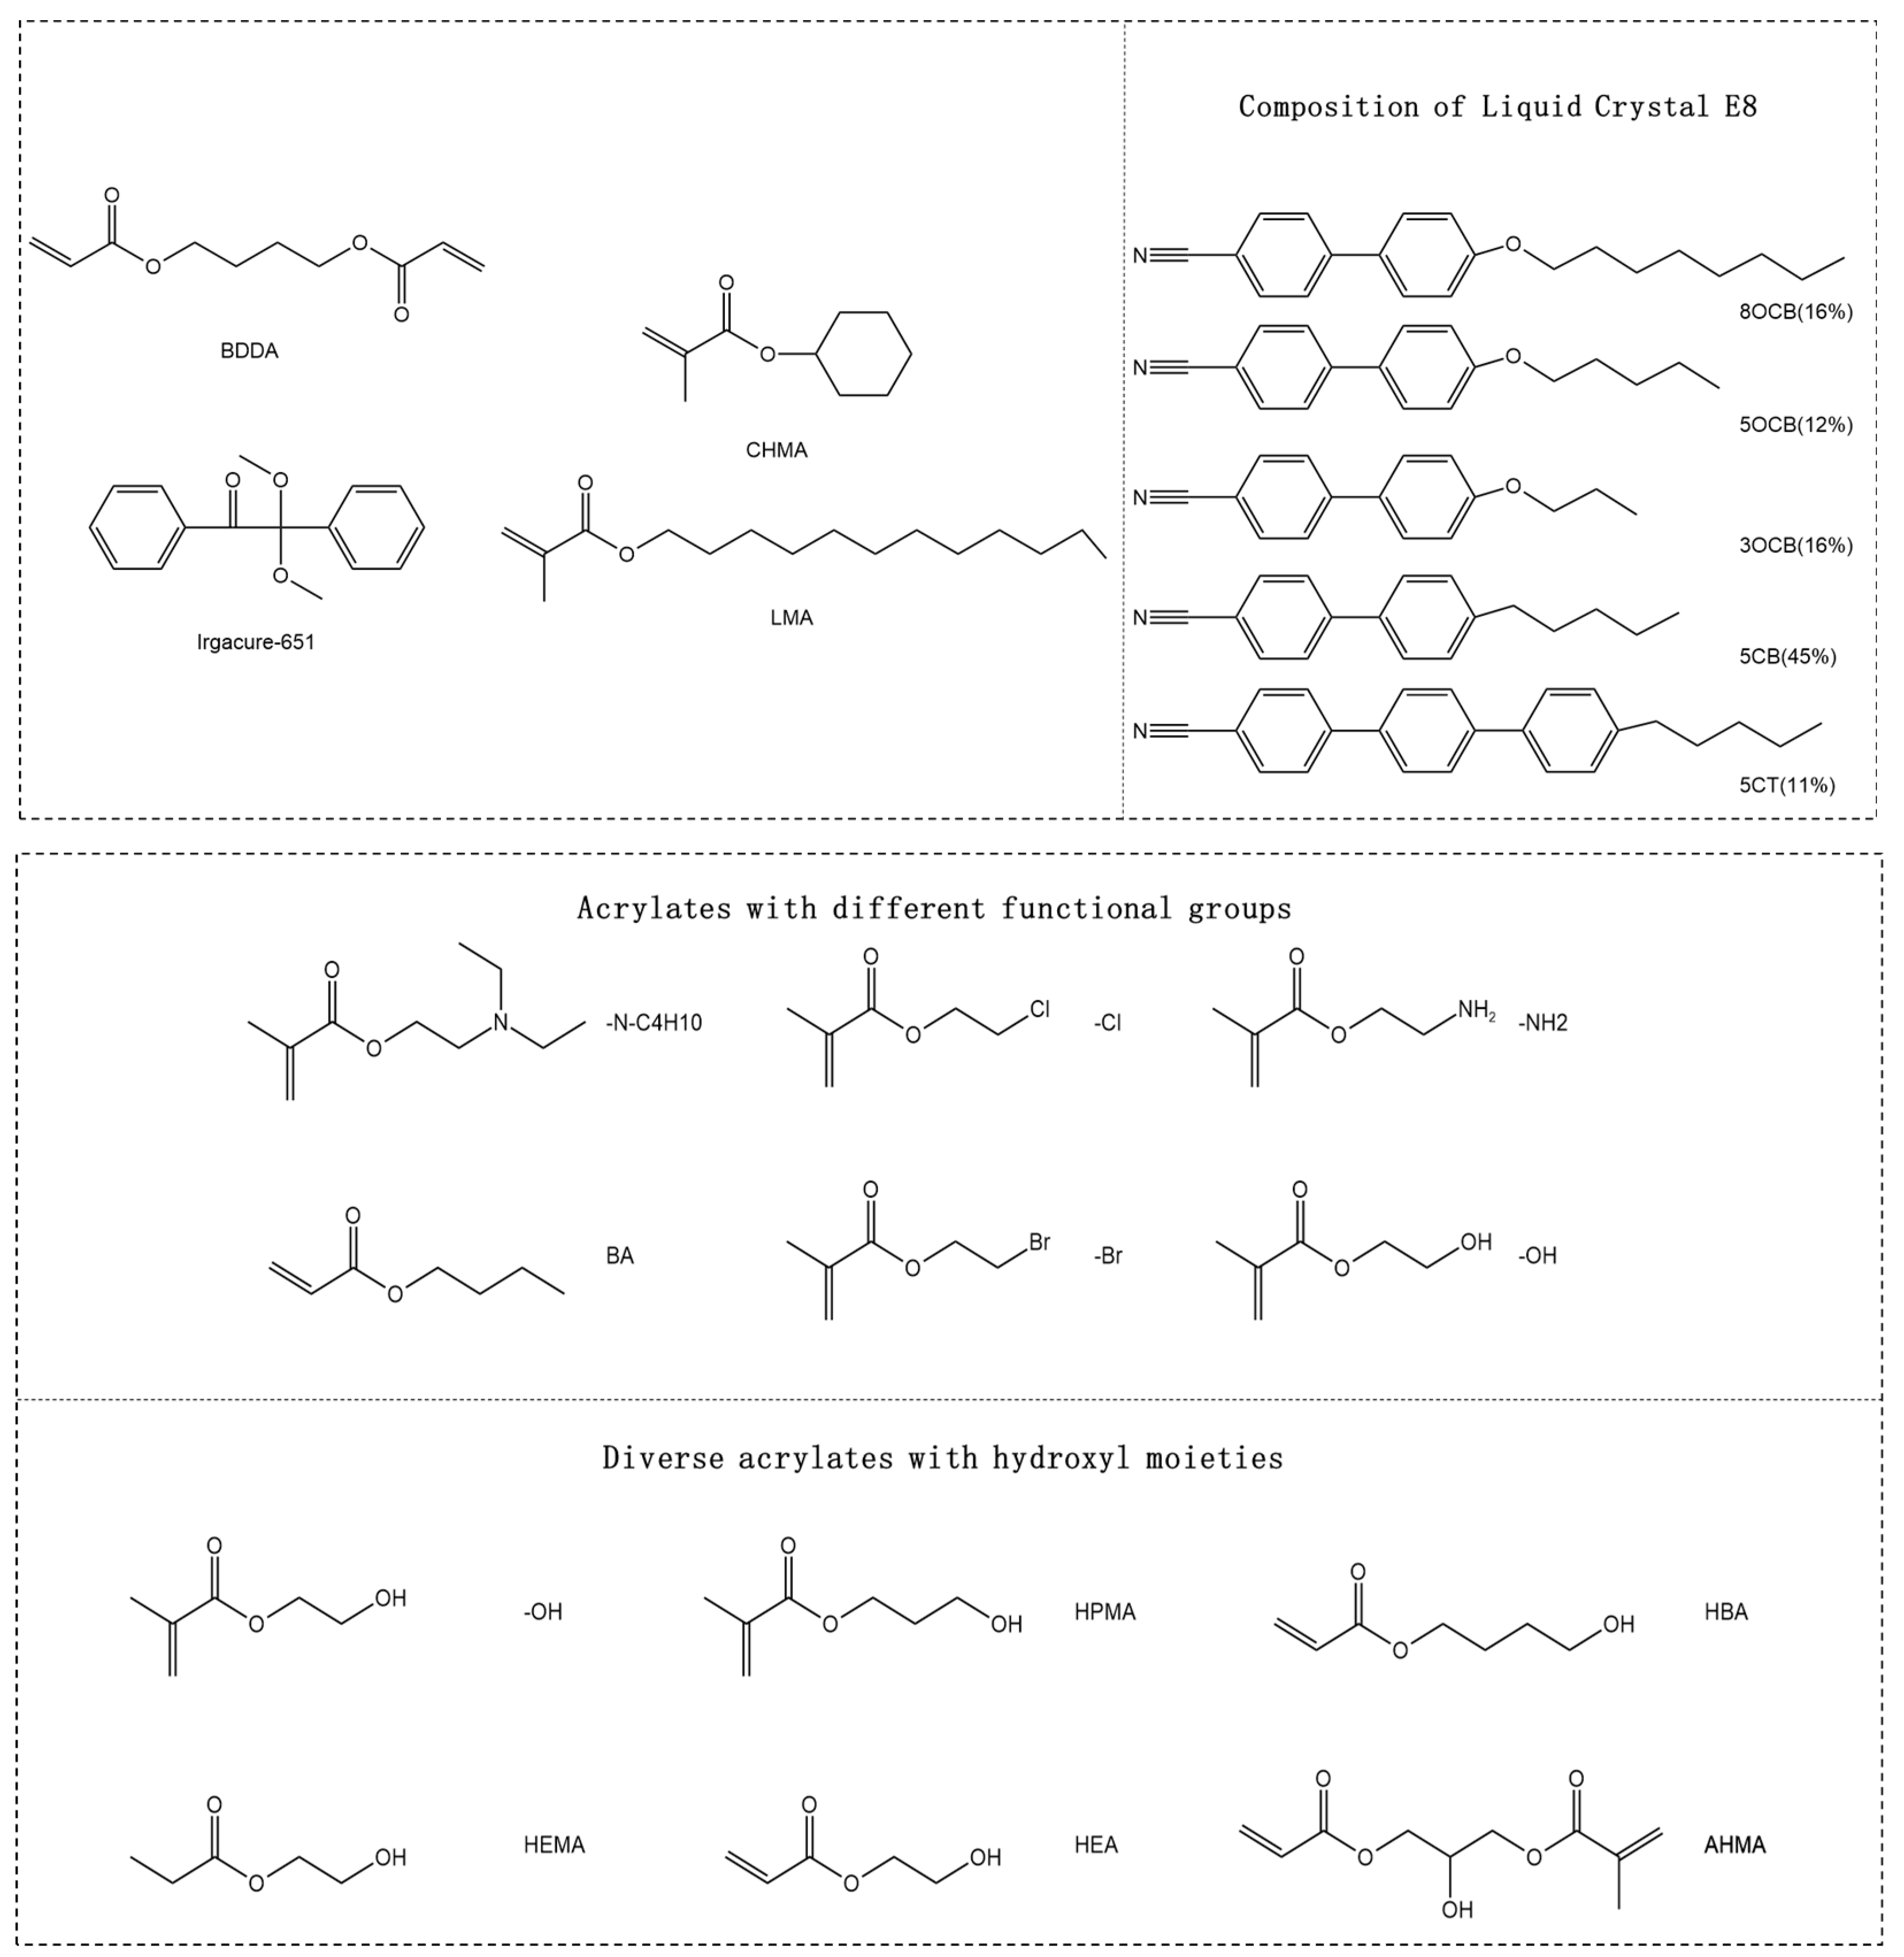

Table 1.
Compositions of Group C samples.
| Weight Ratio | 70% | 6% | 12% | 6% | 6% |
| Weight, g | 0.210 | 0.018 | 0.036 | 0.018 | 0.018 |
| C1 | E8 | BDDA | CHMA | LMA | -N-C4H10 |
| C2 | E8 | BDDA | CHMA | LMA | -Cl |
| C3 | E8 | BDDA | CHMA | LMA | -NH2 |
| C4 | E8 | BDDA | CHMA | LMA | BA |
| C5 | E8 | BDDA | CHMA | LMA | -Br |
| C6 | E8 | BDDA | CHMA | LMA | -OH |
Table 2.
Compositions of Group D samples.
| Weight Ratio | 70% | 6% | 12% | 6% | 6% |
| Weight, g | 0.210 | 0.018 | 0.036 | 0.018 | 0.018 |
| D1 | E8 | BDDA | CHMA | LMA | -OH |
| D2 | E8 | BDDA | CHMA | LMA | HEMA |
| D3 | E8 | BDDA | CHMA | LMA | HPMA |
| D4 | E8 | BDDA | CHMA | LMA | HEA |
| D5 | E8 | BDDA | CHMA | LMA | HBA |
| D6 | E8 | BDDA | CHMA | LMA | AHMA |
Disclaimer/Publisher’s Note: The statements, opinions and data contained in all publications are solely those of the individual author(s) and contributor(s) and not of MDPI and/or the editor(s). MDPI and/or the editor(s) disclaim responsibility for any injury to people or property resulting from any ideas, methods, instructions or products referred to in the content. |
© 2025 by the authors. Licensee MDPI, Basel, Switzerland. This article is an open access article distributed under the terms and conditions of the Creative Commons Attribution (CC BY) license (http://creativecommons.org/licenses/by/4.0/).
Copyright: This open access article is published under a Creative Commons CC BY 4.0 license, which permit the free download, distribution, and reuse, provided that the author and preprint are cited in any reuse.


