Preprint
Article

This version is not peer-reviewed.

Selection of Parent Materials for Alfalfa Recurrent Selection Using a Logistic Model

Submitted:

06 January 2025

Posted:

08 January 2025

You are already at the latest version

Abstract

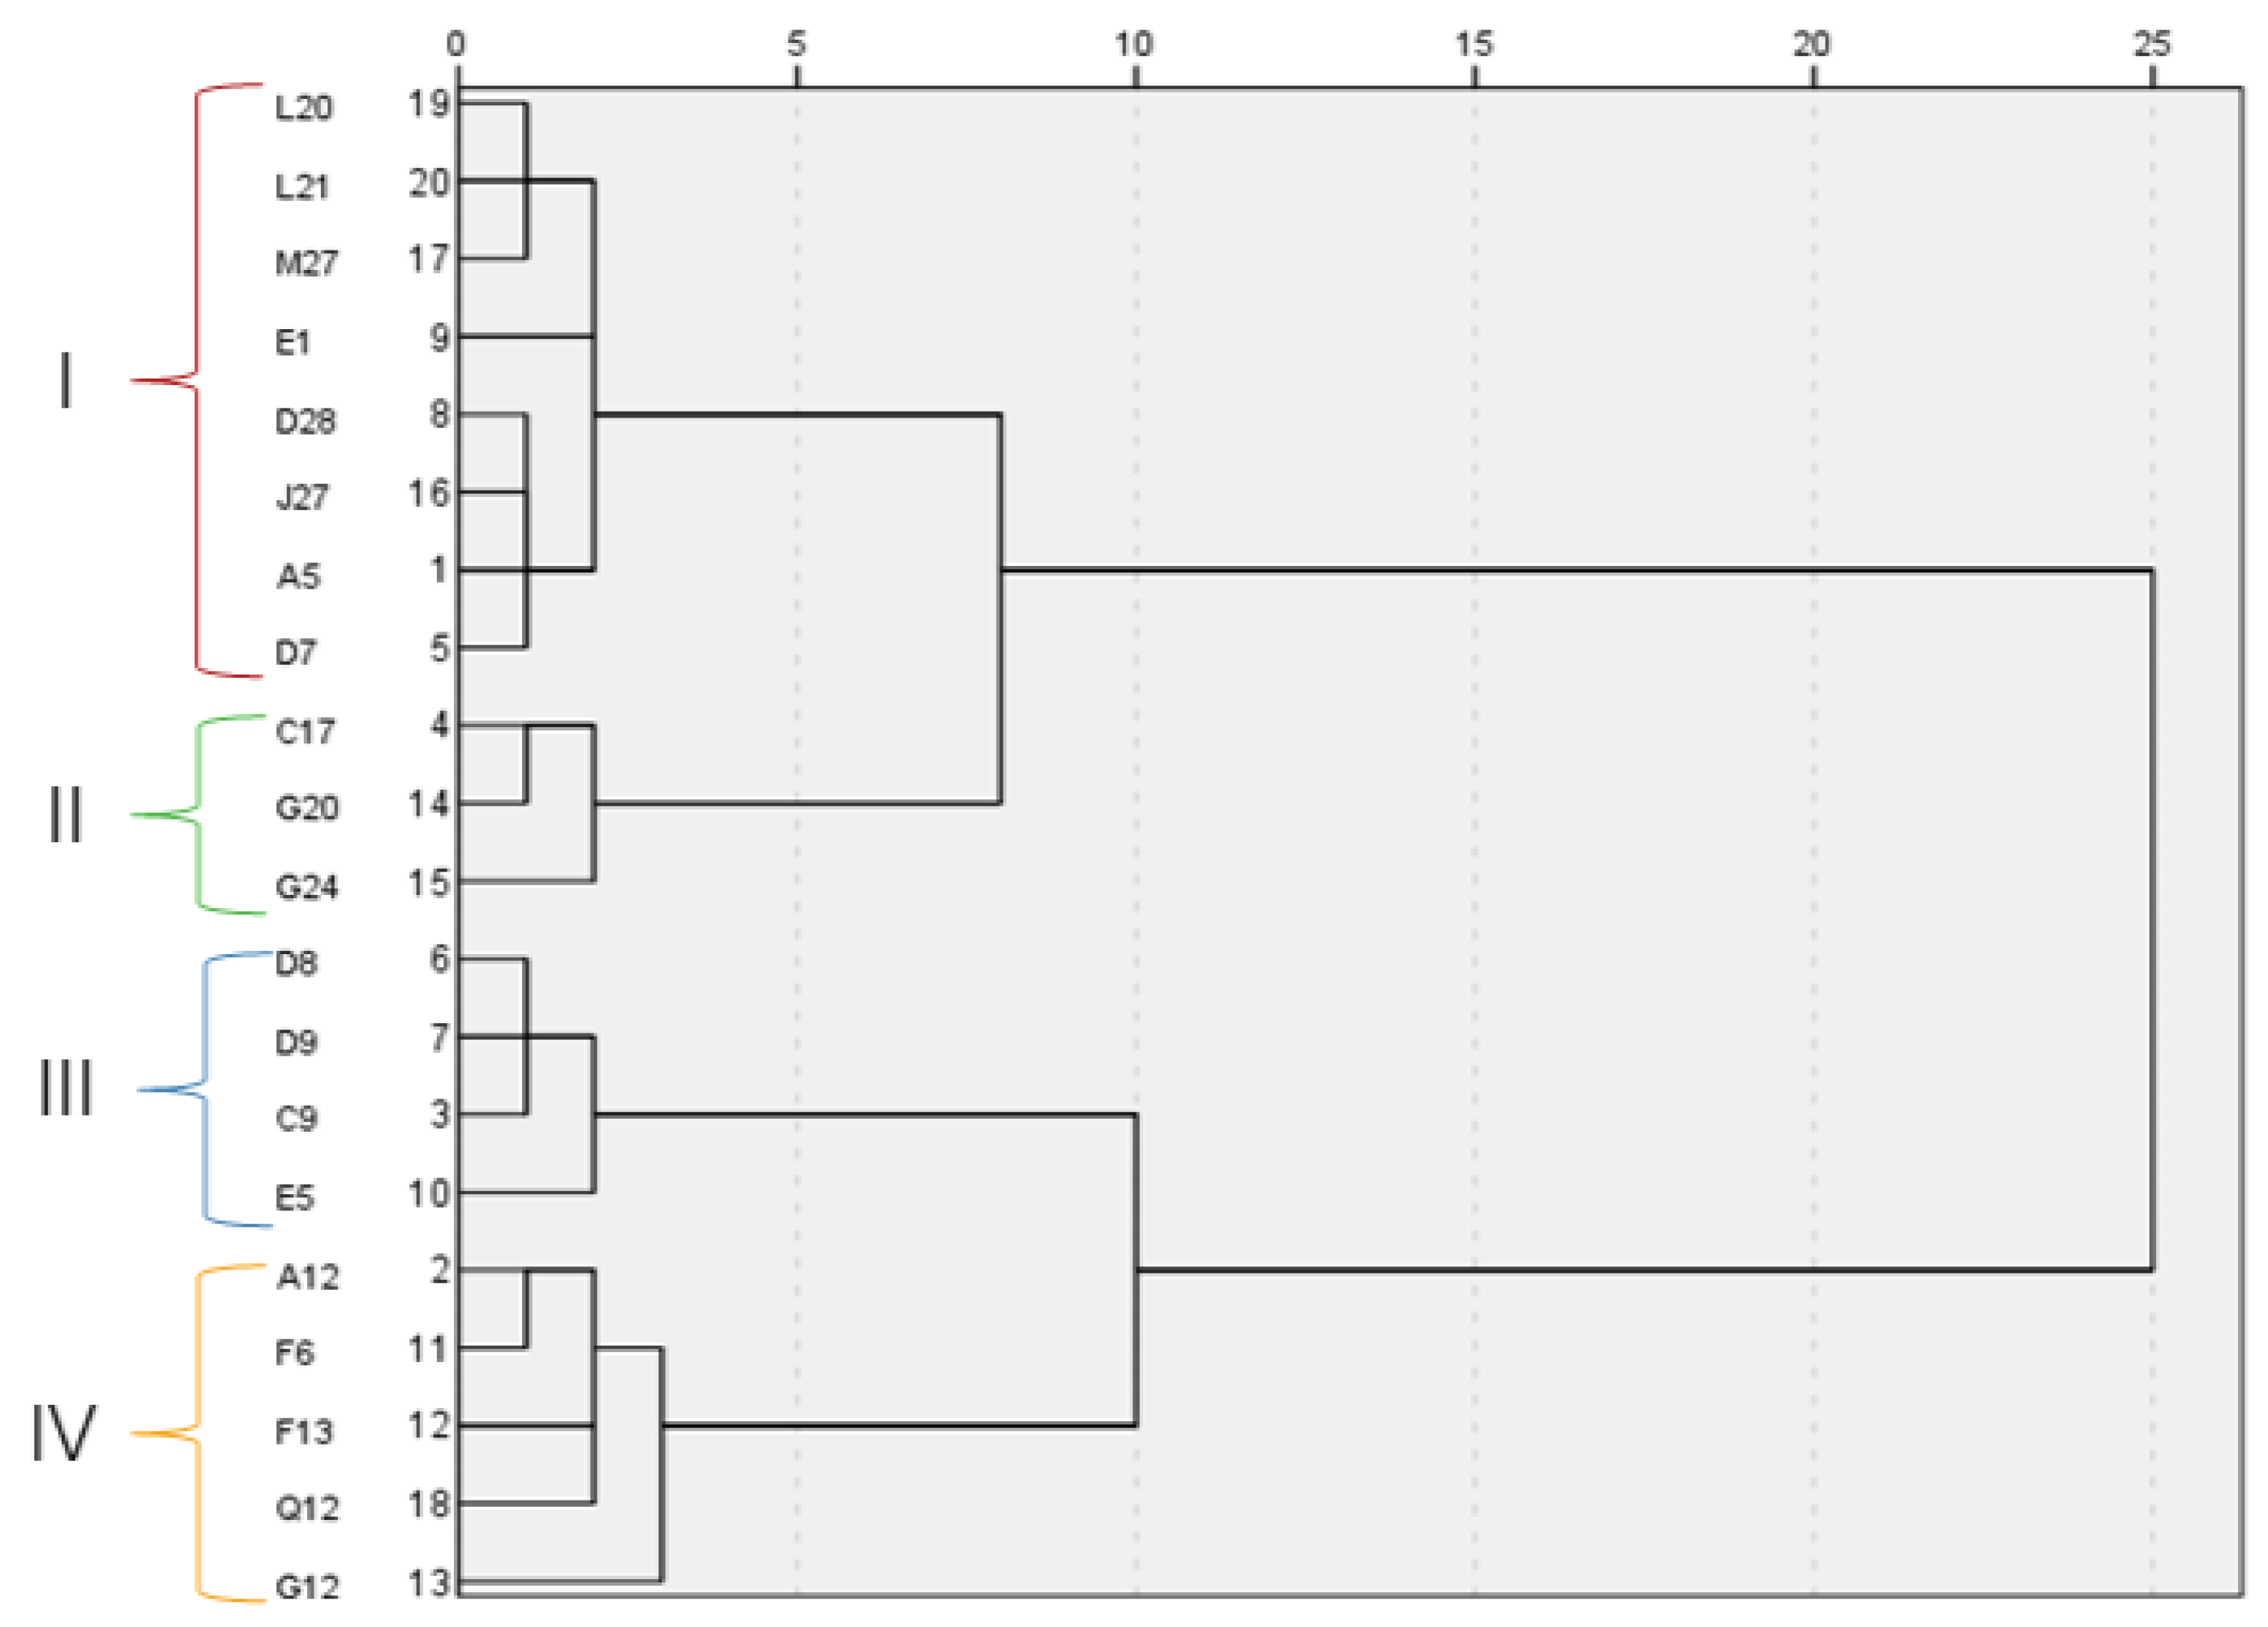
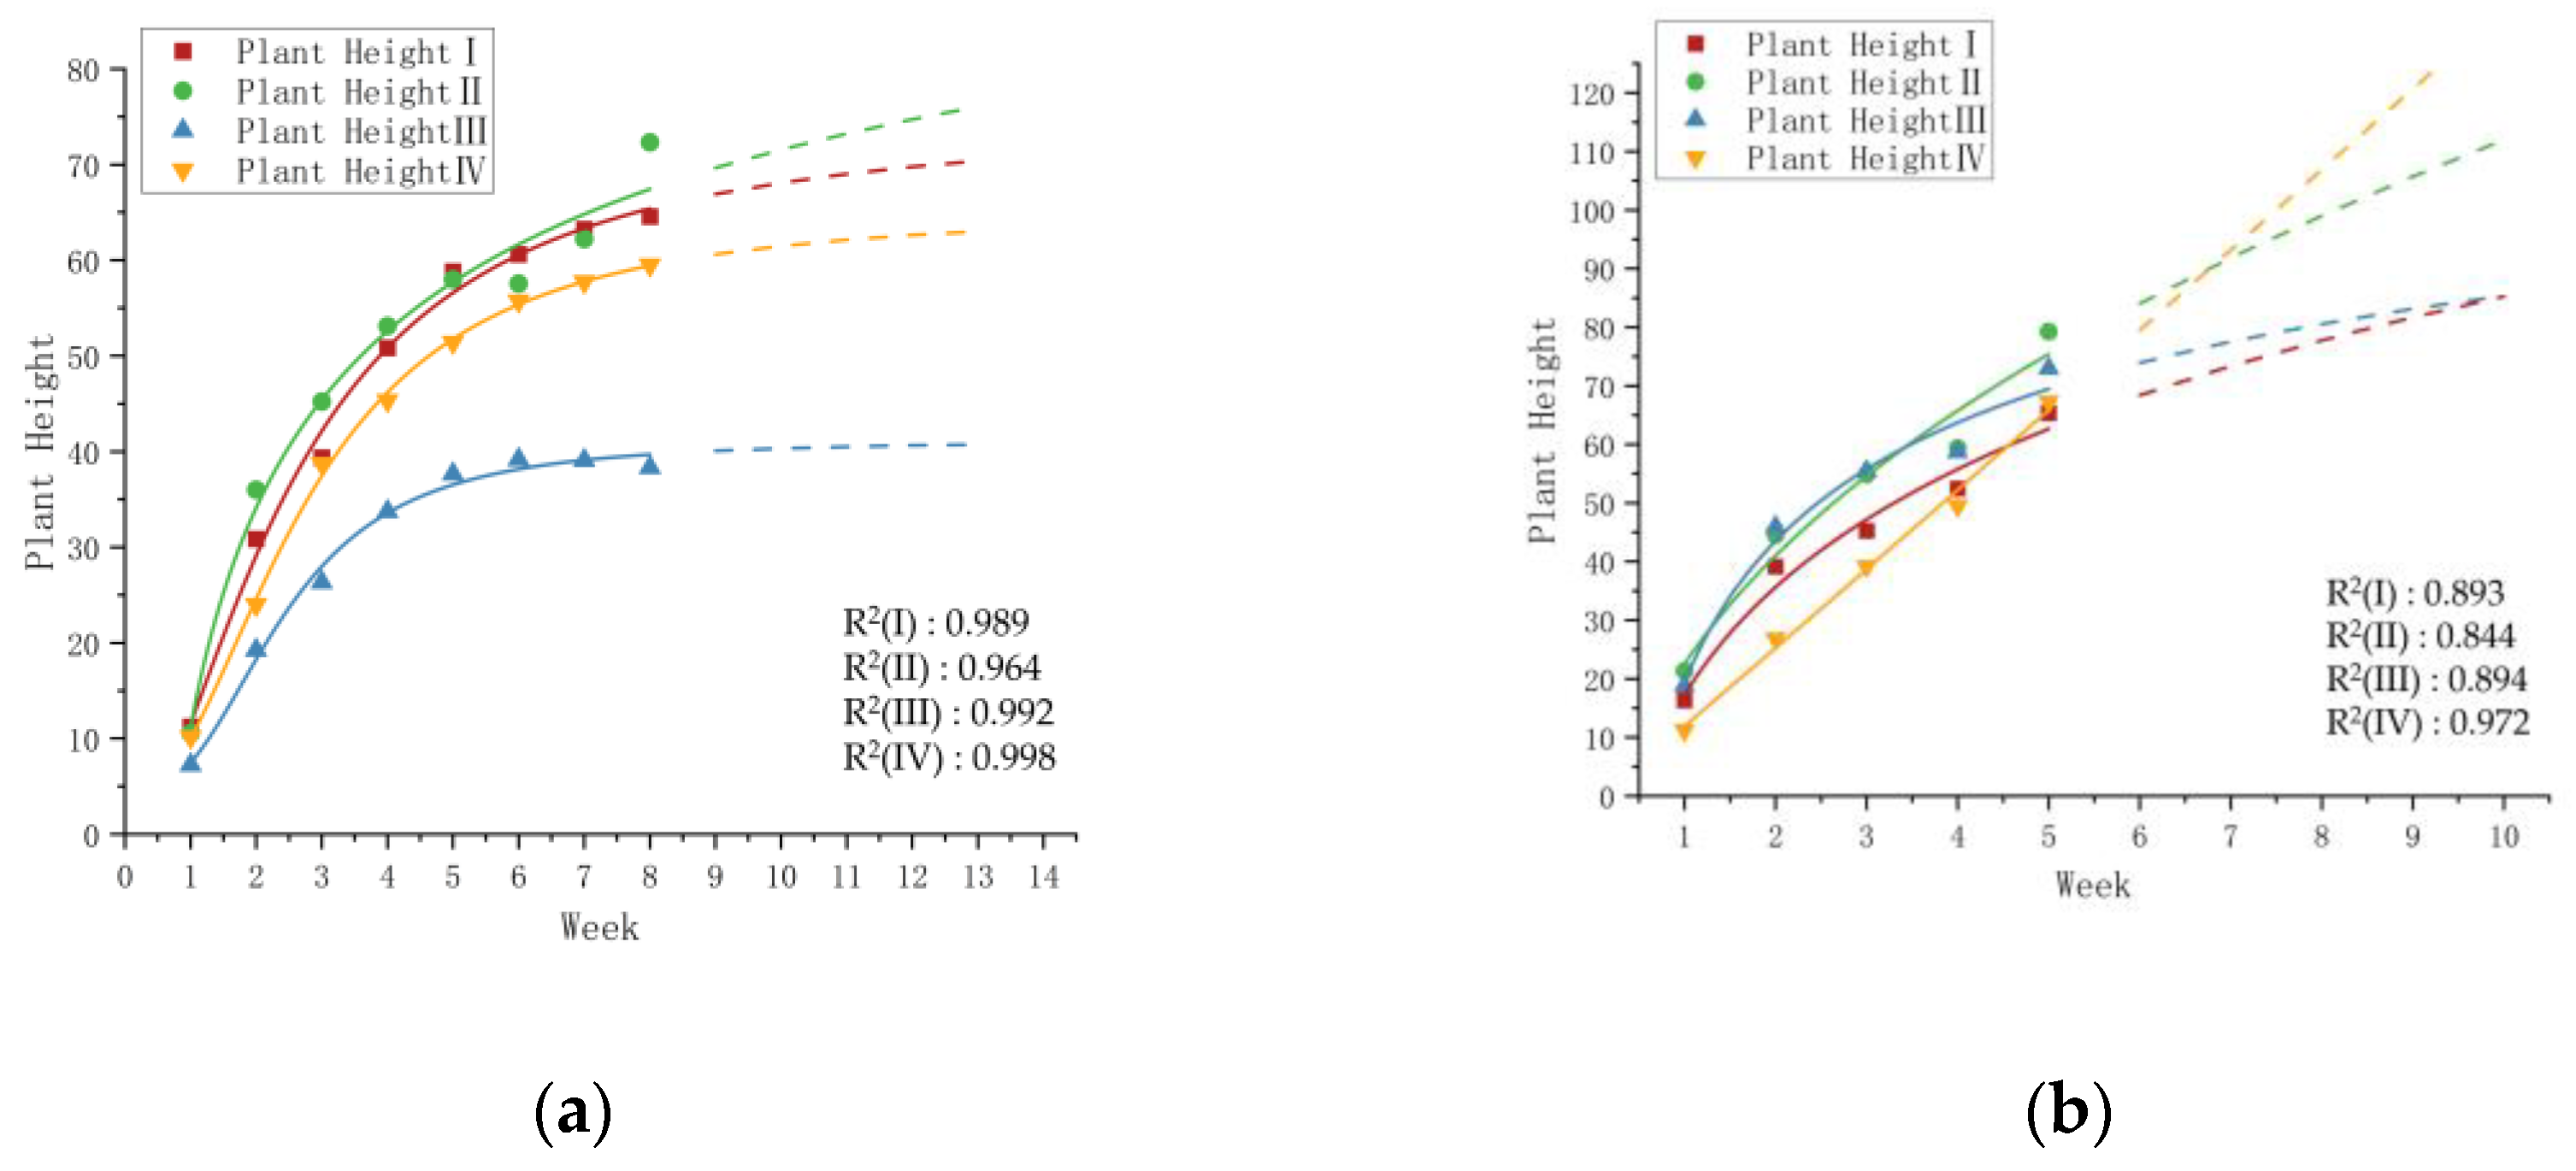
In alfalfa breeding, traditional recurrent selection methods often rely on extensive field trials and empirical judg-ment, which are inefficient and lack accuracy. This experiment attempts to introduce a logistic regression model combined with the analysis of alfalfa agronomic traits to select hybrid parents for alfalfa materials, thereby improving the efficiency and accuracy of recurrent selection. Using 20 alfalfa materials as subjects, the experiment involved agronomic trait analysis, variation analysis, cluster analysis, and the construction of a logistic model to evaluate and screen the alfalfa materials. The results showed that the 20 alfalfa materials were clustered into four clusters with similar performances. Based on the growth performance at the initial flowering stage, the best-performing alfalfa in autumn and spring was in cluster II. Around the 3.5th week of spring, cluster III > cluster II, showing the fastest growth. According to the predictions from the logistic fitting curve, the growth performance of cluster IV alfalfa surpassed that of cluster II around the 7th week, which was inconsistent with the growth performance before the initial flowering stage, revealing the genetic potential of cluster IV alfalfa in plant height traits. The results indicate that the Logistic model can improve the selection accuracy in alfalfa breeding, avoid the waste of genetic resources, and provide important reference value for the selection of parents in recurrent selection of alfalfa.

Keywords: 
;  ;  ;  ;  

1. Introduction

The Alfalfa (Medicago sativa L.), as an important perennial leguminous forage, is renowned as the "king of forages" due to its high yield, quality, and stress resistance[1]. Genetic improvement of alfalfa through breeding methods to enhance traits such as yield, quality, and stress resistance is crucial to meet the growing consumer demand[2]. Recurrent selection is an effective method for population improvement, which involves a process of continuous selection, elimination, and recombination to remove inferior genes, increase the frequency of superior genes, and improve the general combining ability and overall performance of the population, thus providing high-quality parents for breeding[3,4]. In the 1950s, Pioneer Hi-Bred used recurrent selection on two maize populations, Reid and Lancaster[5], to develop numerous excellent inbred lines that became important parents for hybrid maize production. Villegas C T[6]found a significant increase in self-fertility rates in alfalfa during repeated recurrent selection. Bertrand A[7] conducted recurrent selection to improve the winter hardiness of red clover populations. However, recurrent selection requires phenotypic identification of selected offspring, which involves long selection cycles and a large workload[8]; moreover, considering practical production needs, phenotypic identification in alfalfa cannot be performed throughout the entire growth period, and the accuracy of comparing and selecting offspring based on specific time points is not precise enough. Constructing mathematical models is considered an effective way to improve breeding efficiency. In recent years, some mathematical growth models have been applied to evaluate the physiological growth characteristics of alfalfa[9,10,11]. Karadavut[12]predicted alfalfa's growth characteristics by constructing several mathematical models; Vance[13]used various machine learning methods to predict the yield of alfalfa's aboveground biomass. Additionally, Songtao Tang[14]predicted the leaf area index of alfalfa using nonlinear models and deep learning models, M. Bergua[15]used logistic regression and growth function models to compare the incidence of alfalfa mosaic virus infection, and S. Lissbrant [16]found through clustering analysis and logistic regression that the concentration of P and K in plants is a better predictor of alfalfa's production performance than soil P and K concentrations. Numerous experiments have demonstrated that logistic models can be applied in alfalfa breeding programs. We attempt to introduce it into recurrent selection breeding, combining agronomic trait analysis, variance analysis, and cluster analysis to compare and select superior parents, repeatedly enter recurrent selection, and explore potential parent resources based on the fitted growth trends.

2. Materials and Methods

2.1. Plant Materials

The alfalfa materials used in the experiment were the "Huaiyang No. 4" line and Hangmu No. 1. They are breeding materials selected from our previous experiments for recycle selection. The "Huaiyang No. 4" line materials were obtained by crossing the high-yield local variety "Huaiyin Alfalfa" with the Australian multi-leaf variety "PL34HQ," totaling 20 samples (Table 1). Among them, the S1 material was obtained from 22 surviving plants of the first Self-pollination of Huaiyin alfalfa, and the S2 material was obtained from 94 plants of Self-pollination based on the S1 material. The BC1 and BC2 materials were obtained by backcrossing Huaiyin Alfalfa as the recurrent parent and Australian multi-leaf alfalfa PL34HQ as the non-recurrent parent once and twice, respectively ,The population size of BC1 is 89 strains, and the population size of BC2 is 200 strains. The population size of Hangmu No. 1 is 84 plants. The clonal materials were obtained from cuttings of Huaiyin Alfalfa branches.

2.2. Experimental Site Overview

The experiment was conducted at the Yangzijiang Pasture Experimental Base of Yangzhou University (longitude 119°36', latitude 32°43'). In 2022, the average annual temperature was 22.3°C, with December being the coldest month, ranging from -1.4 to 8.5°C, with an average temperature of 2.8°C; August was the hottest month, ranging from 26.9 to 35.3°C, with an average temperature of 30.8°C. The frost-free period lasts for about 220 days annually, with an average annual sunshine duration of 2,140 hours. There were 117 days of precipitation throughout the year, with a total annual rainfall of 833 mm in 2022, and an average monthly rainfall of 69.42 mm, primarily concentrated in July and August. The local soil used for cultivation has an organic matter content of 11.89 mg kg⁻¹, available phosphorus of 6.04 mg kg⁻¹, alkali-hydrolyzed nitrogen of 88.26 mg kg⁻¹, available potassium of 42.33 mg kg⁻¹, and a pH of 7.34.

2.3. Agronomic Traits and Methods

The trial was carried out from September 2022 to April 2023, covering two growth periods of alfalfa. From the beginning of alfalfa growth period, plant height and branch number were measured once a week, until the beginning of the initial flowering period. The measurement time was from September 24, 2022 to November 12, 2022, and from March 11, 2023 to April 8, 2023. The multi-leaf rate and leaf area were measured when alfalfa entered the initial flowering period.
Plant height: Using a 2m (±) ruler, three branches were randomly selected from each individual plant, and the absolute height was measured from the upper edge of the container to the highest point of the branch. The arithmetic mean was then calculated.
Number of branches: After cutting, the total number of main branches of alfalfa plants 15 cm and above within the container was recorded.
Leaf area: After alfalfa entered the initial flowering stage, complete leaves were randomly collected from individual plants. This was repeated five times. The leaves were laid flat on white paper and photographed. ImageJ software was used to identify and calculate the leaf area.
Multi-leaf rate: Three alfalfa branches were randomly selected, and the percentage of leaves with 4 or more leaflets out of the total number of leaflets was recorded and calculated.

2.4. Calculation of Alfalfa Variance Analysis

In the analysis of variation in agronomic traits of alfalfa, the range of variation and the coefficient of variation are relative indicators for evaluating the differences in trait performance and the degree of dispersion. The range of variation is the difference between the maximum and minimum values of the trait, as defined by the following formula:
Variation amplitude = Trait value Max - Trait value Min
The coefficient of variation represents the ratio of the standard deviation to the mean. The coefficient of variation is usually expressed as a percentage, and the formula is as follows:
Coefficient of Variation (CV) = (μ/σ) × 100%
Where μ is the mean of the data and σ is the standard deviation of the data.

2.5. Fitting and Prediction of Alfalfa Growth Dynamic Curve

During the process of linear fitting, a Logistic model is selected to simulate the growth dynamic curve of alfalfa. The equation for curve fitting is:
y = A2 + ( A1 - A2 ) / (1 + ( x / x0 ) ^ p )
where y is the dependent variable for plant height, x is the independent variable for time, A1 is the maximum value of plant height, A2 is the minimum value of plant height, x0 is the characteristic value, which is the x value when the dependent variable y reaches the midpoint of the model, and p is the slope parameter, indicating the steepness of the curve.

2.6. Data Statistics and Analysis

The experimental data were recorded and basic descriptive analyses, including the calculation and arrangement of arithmetic means and totals, were conducted using Microsoft Excel 2021 (Microsoft, Redmond, WA, USA). Single-sample t-tests, ANOVA analysis, and cluster analysis were performed in SPSS Statistics 26 (IBM, Armonk, NY, USA). Linear fitting utilized Origin 2022 (OriginLab, Northampton, MA, USA).

3. Results

3.1. Analysis of Agronomic Traits During the Initial Flowering Stage of Alfalfa

To evaluate the performance of 20 alfalfa materials in terms of production during the early flowering stage, we analyzed their plant height, number of branches, multi-leaf rate, and leaf area in the fall of 2022 and spring of 2023. The results in Table 2 show that in 2022, G20 had the highest plant height at 79.67 cm, C17 had the most branches, and Q12 had the highest multi-leaf rate at 91%. They are all BC2 strain materials. S2's G12 had the second highest plant height at 76 cm, and Hangmu No. 1 had the same highest multi-leaf rate of 91%. A5 had the largest leaf area at 10.71 cm2, and L21 had the smallest at 3.26 cm2; both are S1 materials. Among the clones, D9 and D8 had the lowest plant height and the fewest branches among all materials. In 2023, the BC2 material C17 had the highest plant height at 90.47 cm, and G24 had the most branches. Hangmu No. 1 and Q12 had the highest multi-leaf rate, both at 94%. The S1 material A5 had the largest leaf area at 9.87 cm2. The six materials C9, D8, D9, F6, L20, and L21 did not exhibit multi-leaf characteristics in either year.

3.2. Analysis of Variability in Agronomic Traits of Alfalfa Material

In order to further evaluate the performance of agronomic traits in alfalfa and select appropriate breeding routes, a variation analysis of agronomic traits at the early flowering stage of alfalfa materials was conducted. The results showed that plant height had the smallest coefficient of variation, with coefficients of variation of 24.55% and 24.67% in 2022 and 2023, respectively. The coefficient of variation for leafiness was the largest, with coeffi-cients of variation of 144.44% and 144.87% in 2022 and 2023, respectively. The coefficients of variation for other agronomic traits ranged between 28.78% and 43.33%. This indicates that there is a considerable degree of variation in the performance of agronomic traits among the 20 alfalfa materials. Therefore, selecting plant height, which has a smaller degree of variation, and using recurrent selection for breeding is more appropriate.
Table 3. Variation analysis of agronomic traits in alfalfa materials.
Trait Year Max Min variation range Average Standard deviation Coefficient ofvariation
Plant height (cm) 2022 79.67 32.67 47.00 58.23 14.30 24.55%
2023 90.47 21.13 69.34 66.84 16.49 24.67%
Number of Branches 2022 167 27 140 95.30 37.78 39.65%
2023 313 35 278 164.30 71.19 43.33%
leaf area(cm2) 2022 10.71 3.26 7.45 5.77 2.10 36.35%
2023 9.87 3.7 6.17 5.73 1.65 28.78%
Multiple leaf rate (%) 2022 0.91 0 0.91 0.21 0.30 144.44%
2023 0.95 0 0.95 0.22 0.32 144.87%

3.3. Clustering Analysis of Alfalfa Materials Based on the Recurrent Selection Method

In order to group materials with similar growth performance, select breeding materi-als with high yield potential, and conduct recurrent selection breeding, a cluster analysis was performed on the average trait values of 20 alfalfa materials for 2022 and 2023 using the average linkage method (between groups) based on squared Euclidean distances. The results in Figure 1 show that when the Euclidean distance is 5, the alfalfa can be divided into four categories. Cluster I includes materials L20, L21, M27, E1, D28, J27, A5, D7; Cluster II includes materials C17, G20, G24; Cluster III includes materials D8, D9, C9, E5; Cluster IV includes materials A12, F6, F13, Q12, G12. Among them, Cluster II alfalfa C17, G20, G24 are all BC2 materials; Cluster IV alfalfa includes BC1 line material A12, S2 line materials F6, G12, BC2 line materials F13, Q12; Cluster III alfalfa includes clone ma-terials D8, D9, C9, and S2 line material E5, which are the alfalfa with the poorest growth performance; Cluster II is the alfalfa cluster with high yield potential, making it the ideal target for breeding using the recurrent selection method.

3.4. Fitting and Predicting the Growth Dynamics Curve of Alfalfa Using a Logistic Model

To verify the accuracy of the clustering analysis results of agronomic traits of alfalfa at the initial flowering stage and to evaluate the feasibility of recurrent selection breeding for the four types of alfalfa populations, the average plant height during the growth period of the four classified alfalfa populations was calculated based on the clustering analysis re-sults. The plant growth variation curve was fitted using the Logistic model, as shown in Figure 2.

4. Discussion

Previous research has found that plant height and the number of branches are important factors in determining alfalfa yield[17,18], and that multi-leaf rate and leaf area are significantly correlated with alfalfa leaf protein [19,20]. Among the 20 alfalfa materials, the BC2 line materials showed excellent performance in plant height, number of branches, and multi-leaf rate. The S2 line materials G12 and Hangmu No. 1 also performed well in plant height and multi-leaf rate, respectively. The S1 materials A5 and L21 had the largest and smallest leaf areas, respectively. There is already a noticeable segregation of traits among the clonal materials, which is consistent with the results of alfalfa variation analysis. MONIRIFAR, H. [17] found that when evaluating the impact of yield and quality traits as selection criteria for alfalfa breeding, the coefficient of variation for yield components was high, while the variation in quality traits was relatively small. MARIJANA TUCAK [21]believes that for germplasm from different sources, it is crucial to establish variability and estimate the stability of agronomic traits in alfalfa. Therefore, for alfalfa germplasm materials with different genetic backgrounds, selecting traits with excellent performance and low variability for repeated selection can maintain the stability of trait expression during recurrent selection. However, we note that some experiments also analyze the correlation between traits when conducting variability analysis, aiming for a comprehensive evaluation of breeding goals[22,23,24]. Although we are more focused on the improvement of a particular major trait, this approach is worth considering and incorporating into future breeding programs.
In order to classify alfalfa materials with similar growth performance into the same category and to select alfalfa materials with high yield potential for recurrent selection breeding, a cluster analysis of the agronomic traits of alfalfa was conducted. M Farshadfar[25] evaluated 51 alfalfa populations using descriptive statistics, correlation, factor analysis, and cluster analysis, and identified five top genotypes—FAO 1 (KR-3003), Cody 2 (Es-058), Italy 2 (Es-75), Kazagi2 (KR-615), and Mashhad 2 (Es-067)—as improved varieties, demonstrating that this analytical method is feasible in the selection process of alfalfa varieties. The results of the cluster analysis were used to fit the growth curve during the alfalfa growth period accurately, with the dynamic of the plant height of alfalfa aligning with the Logistic model, consistent with previous studies[26,27]. The fitted curve for autumn better presents an S-shaped growth curve, with growth beginning to slow down after entering the early flowering stage, which is consistent with the results of Yue Feng [26]. Unlike the fitted curve for autumn, the fitted curve for spring enters the early flowering stage earlier. However, alfalfa of Class II and Class IV, developed from Huaiyin alfalfa, continue to grow rapidly after the early flowering stage, which is consistent with the curve fitted by Wu Zinian [28] for the period from March to June. This may be because the Yangzhou area is in the south, belonging to a temperate monsoon climate, and the abundant water and heat conditions in spring lead to this result. Studies have shown that the growth patterns of wheat differ under various climates in Europe [29]. Using a Logistic model, it was predicted that the fourth cluster of alfalfa would exhibit good growth performance after the initial flowering period in spring, avoiding the waste of genetic resources that occurs when selection is based on agronomic traits at the initial flowering stage. This improves the accuracy of selecting breeding materials during the recurrent selection of alfalfa. This experiment simulated the growth curve of alfalfa only at the level of agronomic traits. A considerable amount of research indicates that both the genotype and genetic diversity of alfalfa are suitable for the Logistic model [30,31]. In future studies, we will consider including an assessment of the genetic diversity of alfalfa, combining phenotypic traits with genotypic analysis to improve breeding strategies for alfalfa recurrent selection.

5. Conclusions

The analysis of 20 alfalfa materials includes agronomic trait analysis, variation analysis, cluster analysis, and logistic model fitting curves. Overall, the 20 alfalfa materials were divided into four clusters. Using the trait with the lowest variability, plant height, for logistic fitting, it was concluded that the second cluster group exhibited the best growth performance during the two growing seasons. In addition, it was predicted that the fourth cluster group of alfalfa would surpass the second cluster in the seventh week of the spring growing season, showing better performance. Ultimately, the second and fourth cluster groups of alfalfa were selected for recurrent selection breeding.

Author Contributions

During my experimentation process, I am responsible for the collection, processing, analysis of experimental data, and the writing of the manuscript. Jiaxiang Jiang participated in most of the work, such as reading references, measuring agronomic traits, and reviewing analytical codes. In addition, I received assistance from Master Cheng Haowen in data collection and measurement, help from Dr. Li Jiaqing in manuscript writing, and support from Master Wei Jia in chart analysis. Additionally, I am deeply grateful to my supervisor, Wei Zhenwu, for his strong support in project management, funding, and in my daily life.

Funding

This research was funded by Key Technology Research on Breeding and Production Application of 'Huaiyang No. 4' Alfalfa Cultivar, grant number BE2023383

Data Availability Statement

The data presented in this study are available upon request from the corresponding author.

Acknowledgments

Here, I sincerely thank my classmates Wu Tianyuan and Liu Chenxi for their genuine help. Their encouragement and comfort allowed me to get through difficult times and gave me the courage to complete this paper.

Conflicts of Interest

The authors declare no conflicts of interest.

Abbreviations

The following abbreviations are used in this manuscript:
S1 The first self- fertilization generation
S2 The second self- fertilization generation
BC1 The first Backcross generation
BC2 The second Backcross generation
F1 The first filial generation

References

  1. Shi, S.; Nan, L.; Smith, K.F. The Current Status, Problems, and Prospects of Alfalfa (Medicago sativa L.) Breeding in China. Agronomy 2017, 7, 1. [Google Scholar] [CrossRef]
  2. Tucak, M.; Horvat, D.; Čupić, T.; Krizmanić, G.; Ravlić, M. Assessment of Alfalfa Populations for Forage Productivity and Seed Yield Potential under a Multi-Year Field Trial. Agronomy 2023, 13, 349. [Google Scholar] [CrossRef]
  3. Horner, E.S.; Lundy, H.W.; Lutrick, M.C.; Chapman, W.H. Comparison of Three Methods of Recurrent Selection in Maize. Crop Sci. 1973, 43, 485–489. [Google Scholar] [CrossRef]
  4. de Castro, A.P.; Breseghello, F.; Furtini, I.V.; Utumi, M.M.; Pereira, J.A.; Cao, T.-V.; Bartholomé, J. Population improvement via recurrent selection drives genetic gain in upland rice breeding. Heredity 2023, 131, 201–210. [Google Scholar] [CrossRef] [PubMed]
  5. Gerdes, J.T.; Tracy, W.F. Pedigree Diversity within the Lancaster Surecrop Heterotic Group of Maize. Crop Sci. 1993, 33, 334–337. [Google Scholar] [CrossRef]
  6. Villegas, C.T.; Wilsie, C.P.; Frey, K.J. Recurrent Selection for High Self-Fertility in Vernal Alfalfa (Medicago sativa L.). Crop Sci. 1971, 11, 881–883. [Google Scholar] [CrossRef]
  7. Bertrand, A.; Rocher, S.; Claessens, A.; Bipfubusa, M.; Papadopoulos, Y.; Castonguay, Y. Biochemical and Molecular Responses during Overwintering of Red Clover Populations Recurrently Selected for Improved Freezing Tolerance. Plant Sci. 2020, 292, 110388. [Google Scholar] [CrossRef] [PubMed]
  8. Singh, M.; Nara, U.; Kumar, A.; et al. Enhancing genetic gains through marker-assisted recurrent selection: from phenotyping to genotyping. Cereal Research Communications 2022, 50, 523–538. [Google Scholar] [CrossRef]
  9. Paudel, D.; Boogaard, H.; de Wit, A.; Janssen, S.; Osinga, S.; Pylianidis, C.; Athanasiadis, I.N. Machine Learning for Large-Scale Crop Yield Forecasting. Agric. Syst. 2021, 187, 103016. [Google Scholar] [CrossRef]
  10. Brejea, R.; Rosca, S.; Taut, F.D.; Bilașco, Ș.; Domuța, C.; Borza, I.M. Quantitative GIS Model for Evaluating the Favorability of Alfalfa (Medicago sativa L.) Culture for Suitable Varieties in Romania: Case Study Bihor County. Appl. Sci. 2021, 11, 4205. [Google Scholar] [CrossRef]
  11. Dillehay, B.L.; Curran, W.S.; Mortensen, D.A. Critical Period for Weed Control in Alfalfa. Weed Science 2011, 59, 68–75. [Google Scholar] [CrossRef]
  12. Karadavut, U.; Palta, C. COMPARISON OF SOME MATHMATICAL GROWTH MODELS FOR ESTIMATING OF PYHSIOLOGICAL GROWTH CHARACTERS OF ALFALFA (Medicago Sativa L.). J. Glob. Innov. Agric. Sci. 2021, 9, 11–15. [Google Scholar]
  13. Vance, J.; Rasheed, K.; Missaoui, A.; Maier, F.; Adkins, C.; Whitmire, C. Comparing Machine Learning Techniques for Alfalfa Biomass Yield Prediction. arXiv 2022, arXiv:2210.11226. [Google Scholar]
  14. Yang, S.; Ge, Y.; Wang, J.; Liu, R.; Fu, L. Predicting Alfalfa Leaf Area Index by Non-Linear Models and Deep Learning Models. Front. Plant Sci. 2024, 15. [Google Scholar] [CrossRef] [PubMed]
  15. Bergua, M.; Luis-Arteaga, M.; Escriu, F. Comparison of Logistic Regression and Growth Function Models for the Analysis of the Incidence of Virus Infection. Span. J. Agric. Res. 2008, 6, 170–176. [Google Scholar] [CrossRef]
  16. Identification of Fertility Regimes That Enhance Long-Term Productivity of Alfalfa Using Cluster Analysis. Agronomy Journal 2010, 102, 580–591. [CrossRef]
  17. Monirifar, H. Path Analysis of Yield and Quality Traits in Alfalfa. Not. Bot. Horti Agrobot. Cluj-Napoca 2011, 39, 190–195. [Google Scholar] [CrossRef]
  18. Genetic Mapping Forage Yield, Plant Height, and Regrowth at Multiple Harvests in Tetraploid Alfalfa (Medicago Sativa L.). Crop Science 2007, 47, 11–18. [CrossRef]
  19. Effects of Nitrogen and Phosphorus Fertilization on Photosynthetic Properties of Leaves and Agronomic Characters of Alfalfa over Three Consecutive Years. Agriculture 2022, 12, 1187. [CrossRef]
  20. Genetic Mapping of Leaf-Related Traits in Autotetraploid Alfalfa (Medicago Sativa L.). Molecular Breeding 2019, 39, 147. [CrossRef]
  21. Tucak, M.; Popović, S.; Grljušić, S.; Čupić, T.; Kozumplik, V.; Šimić, B. Variability and Relationships of Important Alfalfa Germplasm Agronomic Traits. Period. Biol. 2008, 110, 311–315. [Google Scholar]
  22. Genetic Diversity, Analysis of Some Agro-Morphological and Quality Traits and Utilization of Plant Resources of Alfalfa. Genes 2022, 13, 1521. [CrossRef] [PubMed]
  23. Genetic Diversity and Salt Tolerance Assessment of 51 Alfalfa (Medicago Sativa) Varieties under Saline Soil Conditions. Frontiers 2023, 7, 1278913. [CrossRef]
  24. Greveniotis, V.; Bouloumpasi, E.; Skendi, A.; Korkovelos, A.; Kantas, D.; Zotis, S.; Ipsilandis, C.G. Modeling Stability of Alfalfa Yield and Main Quality Traits. Agriculture 2024, 14, 542. [Google Scholar] [CrossRef]
  25. Farshadfar, M.; Kakaei, M.; Salehabadi, Y.; Baghaeifar, Z.; Jaffari, A. ashraf Study of Diversity for Yield and Quality Traits in Alfalfa Medicago Sativa L.) and Determination of the Best Population for Cultivation in Dryland Farming in Iran. J. Rangel. Sci. 2022, 12. [Google Scholar] [CrossRef]
  26. Leveraging Logistic Models to Enhance Nutrient Dynamics Modeling in Intercropped Spring Wheat with Varied Nitrogen and Phosphorus Fertilization Strategies. PLOS ONE 2024, 19, e0314264. [CrossRef]
  27. Adjusting the growth curve of sugarcane varieties using nonlinear models. Cienc. Rural 2020. [CrossRef]
  28. Wu, Z. Research of applicability and growth feature for alfalfa in Jianghuai region of China. Doctoral, Gansu Agricultural University, Lanzhou, 2010. (In Chinese). [Google Scholar]
  29. Palosuo, T.; Kersebaum, K.C.; Angulo, C.; Hlavinka, P.; Moriondo, M.; Olesen, J.E.; Patil, R.H.; Ruget, F.; Rumbaur, C.; Takáč, J.; et al. Simulation of Winter Wheat Yield and Its Variability in Different Climates of Europe: A Comparison of Eight Crop Growth Models. Eur. J. Agron. 2011, 35, 103–114. [Google Scholar] [CrossRef]
  30. Cooper, M.; Technow, F.; Messina, C.; Gho, C.; Totir, L.R. Use of Crop Growth Models with Whole-Genome Prediction: Application to a Maize Multienvironment Trial. Crop Sci. 2016, 56, 2141–2156. [Google Scholar] [CrossRef]
  31. Yin, X.; Struik, P.C.; Kropff, M.J. Role of Crop Physiology in Predicting Gene-to-Phenotype Relationships. Trends Plant Sci. 2004, 9, 426–432. [Google Scholar] [CrossRef]
Figure 1. Cluster analysis of alfalfa agronomic traits. The horizontal axis represents the squared Euclidean distance, and the vertical axis represents the alfalfa material numbers. The clustering results are marked with brackets in different colors and are named I, II, III, and IV, respectively.
Preprints 145373 g001
Figure 2. Fitting and Prediction of Alfalfa Growth Curve Using Logistic Model. The horizontal axis represents the week number, and the vertical axis represents the plant height. The different colored points in the coordinate system are the actual data, the solid line represents the fitted curve, and the curved section represents the predicted growth trend. The R2 in the lower right corner of the coordinate system is the fitting coefficient for each curve. (a) Fitting and Predicting the Autumn Growth Curves of Four Alfalfa Clusters; (b) Fitting and Predicting the Spring Growth Curves of Four Alfalfa Clusters. The fitting coefficient R2 for autumn ranges from 0.964 to 0.998, and for spring, the fitting coefficient R2 ranges from 0.844 to 0.972. In the early flowering stage, the overall growth performance of autumn alfalfa is ranked as Class II > Class I > Class IV > Class III. After the early flowering stage, the growth trend slows down, and the growth performance remains unchanged, with Class II alfalfa showing the best growth performance. In the spring, during the third week of rapid growth before the early flowering stage, the performance is sequentially ranked as Class III > Class II > Class I > Class IV. Around 3.5 weeks, Class II > Class III, showing the fastest growth, and the growth performance of Class IV alfalfa surpasses that of Class II around 7 weeks. This is inconsistent with the growth performance before the early flowering stage, revealing the genetic potential of Class IV alfalfa in plant height traits.
Preprints 145373 g002
Table 1. Tested alfalfa Strain/lines and sources.
No. Code Strain/lines and sources Origins Region
1 A5 S1 Huaiyin alfalfa × Huaiyin alfalfa Yangzhou
2 A12 BC1 F1 × Huaiyin
alfalfa
Yangzhou
3 C9 Clone Huaiyin Alfalfa Cutting Yangzhou
4 C17 BC2 BC1 × Huaiyin
alfalfa
Yangzhou
5 D7 BC1 F1 × Huaiyin
alfalfa
Yangzhou
6 D8 Clone Huaiyin Alfalfa Cutting Yangzhou
7 D9 Clone Huaiyin Alfalfa Cutting Yangzhou
8 D28 BC1 F1 × Huaiyin
alfalfa
Yangzhou
9 E1 Hangmu No. 1 Space-induced
mutation
Lanzhou
10 E5 S2 S1 × S1 Yangzhou
11 F6 S2 S1 × S1 Yangzhou
12 F13 BC2 BC1 × Huaiyin
alfalfa
Yangzhou
13 G12 S2 S1 × S1 Yangzhou
14 G20 BC2 BC1 × Huaiyin
alfalfa
Yangzhou
15 G24 BC2 BC1 × Huaiyin
alfalfa
Yangzhou
16 J27 BC1 F1 × Huaiyin
alfalfa
Yangzhou
17 M27 BC2 BC1 × Huaiyin
alfalfa
Yangzhou
18 Q12 BC2 BC1 × Huaiyin
alfalfa
Yangzhou
19 L20 S1 Huaiyin alfalfa × Huaiyin alfalfa Yangzhou
20 L21 S1 Huaiyin alfalfa × Huaiyin alfalfa Yangzhou
Table 2. Agronomic traits of alfalfa materials during the initial flowering stage.
Strain/lines Plant height Number of Branches leaf area Multiple leaf rate
2022 2023 2022 2023 2022 2023 2022 2023
A5 69±6.56abcd 53.7±9.65fg 130 184 10.71±2.15a 9.87±3.89a 0.32±0.23c 0.3±0.09c
A12 58.67±2.08cdef 62.7±10.03def 112 84 4.07±1.16e 9.69±3.31a 0.63±0.2b 0.67±0.07b
C9 37±15.39hi 84.9±6.68abc 37 84 5.36±2.89cde 4.44±0.78cd 0 0
C17 72.33±4.73abc 90.47±5.04a 167 223 4.42±1.19de 4.88±0.87cd 0.05±0.03e 0.05±0.01d
D7 52.33±5.51efg 60.5±17.32def 126 220 4.99±1.4cde 5.25±0.74bcd 0.32±0.02c 0.3±0.09c
D8 35.33±6.11hi 69.33±4.59cdef 27 81 5.48±1.54cde 4.81±1.09cd 0 0
D9 32.67±6.11i 64.63±4.34def 31 86 5.26±2.33cde 3.7±0.55d 0 0
D28 68±4.36abcd 64.93±10.4def 97 220 8.23±2.13b 4.76±0.49cd 0.04±0.03e 0.08±0.02d
E1 57.33±8.5def 54.3±6.17fg 104 170 7.33±2.5bc 7.64±2.51ab 0.91±0.08a 0.95±0.05a
E5 48.33±4.04fgh 21.13±1.2h 86 35 8.3±2.06b 6.55±0.78bc 0.11±0.03de 0.09±0.01d
F6 48±6.56fgh 84.73±11.84abc 63 138 6.81±2.67bcd 5.94±1.42bcd 0 0
F13 55.33±3.51def 59±7.11ef 47 187 9.2±2.67ab 4.83±1.23cd 0.05±0.06e 0.03±0.03d
G12 76±10.15ab 87.87±6.72ab 120 114 3.6±0.72e 5.63±2.57bcd 0.01±0.02e 0.01±0.02d
G20 79.67±14.22a 73.23±5.32bcde 133 237 4.59±1.72de 5.81±2.34bcd 0.01±0.01e 0.05±0.06d
G24 65±1.73abcde 74.1±7.69bcde 113 313 4.12±1.08e 5.15±1.81bcd 0.29±0.09cd 0.3±0.02c
J27 68.33±8.02abcd 62.27±11.83def 73 255 3.64±1.19e 4.47±1.08cd 0.53±0.22b 0.61±0.17b
M27 62±9.54bcdef 75.8±4.56abcd 118 161 4.13±1.11e 4.55±0.94cd 0.03±0.01e 0.02±0.02d
Q12 39.67±2.52ghi 42±5.47g 104 112 7.26±1.34bc 6.56±2.5bcd 0.91±0.03a 0.94±0.05a
L20 65±9.85abcde 76.07±11.3abcd 107 190 4.7±0.98cde 4.77±0.75bcd 0 0
L21 74.67±6.66ab 75.1±6.17abcde 111 192 3.26±0.6e 5.28±0.93bcd 0 0
a,b: Different lowercase letters in the same column indicate significant difference at P < 0.05 level.
Disclaimer/Publisher’s Note: The statements, opinions and data contained in all publications are solely those of the individual author(s) and contributor(s) and not of MDPI and/or the editor(s). MDPI and/or the editor(s) disclaim responsibility for any injury to people or property resulting from any ideas, methods, instructions or products referred to in the content.
Copyright: This open access article is published under a Creative Commons CC BY 4.0 license, which permit the free download, distribution, and reuse, provided that the author and preprint are cited in any reuse.
Prerpints.org logo

Preprints.org is a free preprint server supported by MDPI in Basel, Switzerland.

Subscribe

Disclaimer

Terms of Use

Privacy Policy

Privacy Settings

© 2025 MDPI (Basel, Switzerland) unless otherwise stated