
Submitted:
06 January 2025
Posted:
08 January 2025
You are already at the latest version
Abstract
Breast cancer remains the most prevalent cancer among women worldwide, underscoring the critical need for effective early detection methods. Thermography presents a non-invasive and radiation-free alternative, offering significant potential in breast cancer screening; however, challenges such as noise, low resolution, and anatomical variability limit its potential. The aim of this project is to propose a method for segmenting the breast in thermograms to analyze thermal variations that might be associated with medical pathologies. To address these issues, we developed a hybrid segmentation approach that combines traditional computer vision techniques with a Dense Multiscale U-Net architecture, leveraging anatomical references extracted directly from thermographic images. Our method integrates the adaptability of deep learning with the domain-specific precision of traditional computer vision techniques, creating a hybrid framework designed to overcome individual limitations and enhance segmentation robustness. Our method demonstrated substantial advancements in segmentation performance, achieving a Dice Similarity Coefficient (DSC) of 0.987 and an Intersection over Union (IoU) of 0.963. These results not only surpassed those of standalone computer vision methods (DSC: 0.983, IoU: 0.934) and neural networks (DSC: 0.972, IoU: 0.922), but also highlighted the robustness, reproducibility, and precision of the hybrid approach in addressing critical challenges. Notably, the method effectively delineates the weak supramammary boundary, a common limitation of other techniques, thereby enhancing its clinical relevance and reliability in diverse imaging scenarios. This approach enhances the precision and robustness of breast segmentation, particularly in challenging regions such as the supramammary boundary. By bridging the gap between traditional and deep learning methods, this hybrid framework represents a significant advancement in thermography-based breast segmentation and lays the foundation for improving diagnostic accuracy in breast cancer screening.
Keywords:
hybrid segmentation
; deep learning
; thermography
; medical imaging
; Pattern Recognition
; AI in Oncology
1. Introduction
Technological developments in the use of artificial intelligence for automating the analysis of clinical data have revolutionized its application in the medical field. These advancements enable more efficient and accurate decision-making processes, thereby improving patient care and minimizing intra- and inter-operator variability. Among the various medical fields benefiting from AI, oncology is one where these technologies hold significant promise, particularly in improving early detection and diagnosis of complex diseases. One such disease is breast cancer, which remains a major global health challenge. It is the most common cancer in women and the leading cause of cancer-related deaths worldwide, with an estimated 2.3 million new cases and approximately 685,000 deaths reported in 2020, according to the World Health Organization (WHO) [1]. In Mexico, it is the most frequent malignancy and the leading cause of cancer-related deaths among women, with an upward trend over the last decade. In 2020, breast cancer accounted for 16.5% of all cancer cases diagnosed in women and resulted in over 7,800 deaths, according to the Mexican National Institute of Statistics and Geography (INEGI) [2]. These figures underscore the urgent need for effective early detection methods and advanced diagnostic techniques to address this public health problem.
Medical imaging plays a pivotal role in breast cancer analysis, enabling the non-invasive extraction of detailed tissue and metabolic activity information across various spatial scales. This versatility is achieved through multiple modalities: Microscopy, which measures optical density through reflection, scattering, and light absorption at the cellular level [3]; Magnetic Resonance Imaging (MRI), regarded as the gold standard for soft tissue visualization due to its ability to assess molecular density related to hydrogen proportions [4]; X-ray and Computed Tomography (CT), which analyze radiological attenuation to evaluate structures such as bones, air interfaces, and contrast media [5]; Ultrasound, offering insights into acoustic impedance at soft tissue boundaries [6]; PET, SPECT and Scintigraphy, which detect metabolic activity by tracing radiomarker uptake in targeted cells [7]; and Thermography, which reflects surface thermal patterns influenced by hybrid metabolic-anatomical processes [8].
These modalities, depending on their physical principles, allow the extraction of relevant data with different levels of specificity and sensitivity.
In particular, thermography has gained relevance due to its practicality, the absence of ionizing radiation, and its cost-benefit ratio, making it a valuable initial screening pre-diagnostic tool [9]. To improve the use of this technique as a complementary screening tool, it is necessary to automate the thermogram analysis process. This will depend on an accurate delineating of breast contours from thermal images.
Early approaches to this challenge relied on traditional computer vision techniques, such as thresholding and edge detection, to extract these contours [10,11]. However, these methods present significant limitations, particularly under high noise condition, low resolution images [12]. In addition to the anatomical differences between patients.
In the literature, several machine learning methods, such as region-based clustering and active contour models [13,14] has been explored for breast thermography segmentation. Techniques like K-means clustering and Gaussian Mixture Models (GMM) [15] have been used to identify and segment breast regions by grouping pixels based on their thermal properties and spatial features. Additionally, machine learning models, such as decision trees combined with feature extraction techniques [16], have also been proposed. However, these methods often require intensive manual feature engineering and may not generalize well to varying imaging conditions or patient anatomies, limiting their robustness.
Deep learning has opened new possibilities for breast segmentation in thermography. Convolutional Neural Network (CNN) architectures such as U-Net [17], SegNet [18], and customized variants have proven effective in extracting hierarchical features that enable precise segmentation of complex structures, such as breast contours. However, the adaptation of these architectures to the context of thermographic images remains limited, with only a few studies attempting to customize these models to improve accuracy in detecting and segmenting thermal patterns specific to breast cancer [19].
In this work, we propose a hybrid approach that combines traditional computer vision algorithms with deep neural networks, using anatomical references extracted directly from the same image to optimize segmentation. This method seeks to overcome the limitations of previous approaches by increasing the precision and robustness of thermographic image analysis. Our contribution focuses on demonstrating how this hybridization significantly improves segmentation compared to exclusively traditional or deep learning-based methods.
The remainder of this paper is structured as follows: Section 2 describes the proposed methodology, including data preprocessing, neural network architecture, and training procedures. Section 3 presents the experimental results and comparative analysis with existing methods. Finally, Section 4 concludes the paper with a discussion of findings, limitations, and future directions for research.
2. Materials and Methods
In this section, we describe the key features of thermal maps (according to anatomic breast) that are essential to identify the breast area limits, looking to develop a method with a high reproducibility, which is based on richness of the breast structures. Then, we describe out our hybridized approach, which integrates neural networks with traditional computer vision methods, to achieve a more robust segmentation by effectively combining their strengths.
2.1. Anatomic Breast Structure
In a previous work, we proposed a method based exclusively on traditional computer vision to segment breasts in thermal images [20]. This approach enables the evaluation of intra- and inter-breast temperatures, where variations in heterogeneity are often related to pathological angiogenesis (e.g., tumors) or other abnormal thermal asymmetries (e.g., mastitis). In thermal maps, temperature changes induce a contrast between anatomical regions, which are analized based on three classic thermal patterns to define breast boundaries: armpits are characterized by a high concentration of sweat glands, limited ventilation, and proximity to major blood vessels like the axillary artery; body is defined by constant metabolic activity and heat distribution through blood circulation, contributing to thermal regulation; and inframamary region which exhibits a V-shaped thermal contrast—referred to here as the ’inverse V region’—is characterized by skin-to-skin contact, lack of ventilation, sweat glands, and thermal insulation provided by adipose tissue, see Figure 1.
The thermal patterns of the body edges and armpits exhibit high, reproducible contrast under controlled conditions, such as the lower background temperature and the exposure of warm armpits when the arms are raised. While the inframammary region displays significant variability due to its V-shaped thermal contrast, which changes based on breast size, these patterns remain detectable. In contrast, the supramammary border is either virtually nonexistent or highly ambiguous, making it significantly more challenging to define.
Building upon this, by leveraging the identified patterns, we can partially segment the breast masks using state-of-the-art neural network models for segmentation. Furthermore, these results enable the refinement of the upper breast boundary through traditional computer vision techniques, enhancing the overall accuracy and robustness of the segmentation process.
2.2. Breast Segmentation
The proposed method consists of two main stages: (1) Multiclass segmentation of the expanded inframammary-lateral mask, including axillary markers, and (2) definition of the supramammary boundaries. These stages are detailed as follows.
The first stage involves supervised segmentation using a 2D dense multiscale U-Net [21]. This architecture is a variant of the traditional U-Net architecture, designed to enhance feature extraction and segmentation accuracy by incorporating two key innovations: dense connectivity and multi-scale convolutional blocks. The main components of the model are described below:
- Dense Double Convolutional Blocks: Each downsampling and upsampling operation includes a dense connection between intermediate layers, ensuring efficient reuse of features and promoting richer feature extraction.
- Multi-Scale Convolutional Bottleneck: At the bottleneck, the model employs a multi-scale convolutional block that processes input features with kernels of varying sizes (3x3, 5x5, and 7x7). This enables the model to capture features at different spatial scales, improving its ability to detect patterns of varying sizes in medical images.
- Encoder-Decoder Structure: The model retains the encoder-decoder architecture of the original U-Net, with symmetrical downsampling and upsampling paths. The skip connections ensure spatial details are preserved during the reconstruction process.
- Deep Supervision: By integrating dense connectivity and multi-scale processing, the model strengthens its ability to capture both local and global context, which is critical for medical image segmentation tasks.
- Efficient Regularization: Dropout layers are added in the downsampling path to reduce overfitting and improve generalization.
The output of this model is a multiclass segmentation mask, denoted that distinguishes between the background (), the breasts () extending from their lower boundary to the upper limit of the body with no constraints except for the lateral edge), and the armpits (), see Figure 2.
In the second stage, with the extracted contour from , where boundary pixels are identified based on their neighborhood connectivity, the inter-inframammary inflection point is detected through further analysis.
Pixels with incomplete connectivity within a neighborhood are marked as boundary points and organized into an ordered list of coordinates . This contour serves as the basis for further analysis, including curvature estimation and inflection point detection.
A localized approach is employed, analyzing curvature variations within a range of around each point on the contour. Each curvature point is evaluated to detect significant changes, but specifically, the inter-inframammary inflection point, denoted , is defined as the location where the curvature reaches a local maximum, marking a significant directional change along the contour [22].
Finally, the axillary regions () are treated as distinct objects (i.e. a connected component). The lowest pixel attribute within these regions is projected horizontally along the x-axis (image columns) to the nearest lateral edge of . Points and are then utilized to draw a straight line, which serves to define the supramammary boundary, resulting in a complete segmentation of the breasts, see Figure 3.
Validation Metrics
To evaluate the performance of the segmentation models, the Dice Similarity Coefficient (DSC) and the Intersection over Union (IoU) metrics were utilized. These metrics are particularly suitable for binary segmentation tasks, as they focus on the overlap between the predicted and ground truth regions, which in this study were carefully annotated by medical specialists. This ensures a reliable and clinically accurate benchmark for evaluating the models.
Multiclass validation was specifically employed during the training and validation stages of our multiclass masks to ensure the proper segmentation of distinct regions, such as the background, breast areas, and axillary regions. This approach provided a robust framework to evaluate the model’s ability to handle multiple classes simultaneously, thereby capturing the complexity of the segmentation task. Furthermore, it guided the training process by influencing backpropagation and weight adaptation, ensuring the model effectively learned the unique characteristics of each class.
The use of accuracy as a validation metric was avoided, as it tends to overestimate performance in segmentation tasks where the background dominates the image. Including the true negatives of the background in accuracy calculations could overshadow errors in the segmentation of the region of interest, leading to an overly optimistic evaluation of the model’s effectiveness.
2.3. Experimentation
The dataset consists of 180 thermographic images, evenly sourced from two Mexican institutions: 90 images were collected from the Jalisco Cancer Institute (IJC) and 90 from the Institute for Social Security and Services for Mexican State Workers (ISSSTE). Further information on the dataset can be found in [23]. All images were acquired under standardized conditions as outlined by the Glamorgan Protocol [24], a protocol specifically designed to regulate thermal imaging procedures for consistency and reliability. According to this protocol, subjects were first acclimated to room temperature for a period of 15 minutes, allowing for stabilization of skin temperature to counteract frictional heating caused by the removal of clothing covering the breast area. During the thermographic capture, participants were instructed to lift their arms and place their hands behind their neck with elbows fully extended. This posture was maintained throughout the imaging process to ensure unobstructed exposure of critical regions such as the armptis and inframammary areas, essential for accurate thermal analysis.
2.3.1. Data Partitioning and Justification
The dataset, comprising 180 images, was divided into three subsets: training (70%, 126 images), validation (15%, 27 images), and testing (15%, 27 images). This partitioning strategy ensures an adequate amount of data for training while reserving sufficient samples for validation and testing, which are crucial for evaluating the model’s performance and preventing overfitting.
The training set, comprising the majority of the data, allows the model to learn the underlying patterns and generalize effectively. The validation set is employed during training to fine-tune hyperparameters, monitor for overfitting, and ensure that the model performs well on unseen data by providing an early indication of potential overfitting. The testing set remains isolated throughout the training process and is used exclusively for the final evaluation, offering an unbiased assessment of the model’s performance on new, unseen data.
This 70%-15%-15% split is widely accepted in machine learning tasks with moderate dataset sizes, striking a balance between learning, optimization, and evaluation. Additionally, images were randomly shuffled before splitting to avoid any potential biases in the subsets, further supporting the generalization of the model.
2.3.2. Data Augmentation
Data augmentation was applied as a prepropocessing stage during training and validation to enhance the diversity of the dataset while preserving anatomical realism, especially given the coronal nature of breast images. Transformations were applied to account for normal variations in human acquisitions, including width and height shifts (), horizontal flips, rotations within , and zooming around the breast area (see Figure 4). These augmentations ensured that no abrupt or biologically implausible changes were introduced. Starting from the 126 training images, random variations were applied in each iteration, effectively simulating a larger dataset. Similarly, the 27 validation images were augmented to improve the robustness of hyperparameter tuning. The number of effective images processed by the network is proportional to the number of epochs ( for training and for validation), significantly improving generalization while preventing overfitting and maintaining clinical relevance. Starting with 126 base training images, augmentation expanded the dataset to simulate a total of 12,600 images over 100 epochs. Similarly, the validation dataset, initially comprising 27 images, generated 2,700 effective images over the same epochs. The dataset was processed in small batches of 8 images each, enabling efficient backpropagation during the training stages. This batch-wise approach allowed the optimizer, Adam, to iteratively adjust the model weights based on the gradient updates, ensuring a balance between computational efficiency and learning accuracy. By exposing the network to diverse augmented samples in each batch, the setup effectively minimized overfitting risks and enhanced generalization, ultimately optimizing the network’s capacity to learn meaningful patterns from the data.
3. Results and Discussion
Table 1 compares the performance of traditional computer vision methods, a Dense Multiscale U-Net, and our proposed hybrid approach for breast segmentation, evaluated using the DSC and IoU. While neural networks demonstrate high reproducibility and achieve metrics comparable to traditional computer vision methods, their primary challenge lies in accurately defining the superior breast boundary, which in some cases appears eroded or poorly delineated, see Figure 5. This limitation is particularly evident in the Dense Multiscale U-Net results, where DSC and IoU scores reached 0.972 and 0.922, respectively, trailing slightly behind traditional methods. In contrast, our hybrid approach achieved the highest performance across both metrics, with a DSC of 0.987 and an IoU of 0.963, surpassing the computer vision method (DSC: 0.983, IoU: 0.934). This improvement underscores the effectiveness of combining traditional anatomical priors with the adaptability of neural networks, allowing for better boundary delineation and superior overall segmentation accuracy.
The hybrid method successfully mitigates the limitations of standalone approaches: traditional methods, while precise, rely heavily on handcrafted features and lack generalization; neural networks, though robust, often struggle with anatomical nuances such as the superior breast boundary. By leveraging the strengths of both, our approach not only enhances segmentation performance but also ensures clinical relevance and scalability for diverse datasets.
These results validate the hybrid strategy as a powerful solution for breast segmentation, addressing critical challenges in anatomical complexity and advancing the field of medical image analysis.
4. Conclusions
We demostrated that the proposed hybrid method has a high performance in breast segmentation, by combining deep learning with anatomical boundary definitions to address the limitations of standalone approaches. By leveraging features such as the lowest axillary point and the inframammary inflection point, this approach outperformed both traditional computer vision methods and the 2D Dense Multiscale U-Net across all metrics.
The hybrid approach combines the adaptability and automation of neural networks with the precision of domain-specific anatomical priors, such as the lowest axillary point and the inframammary inflection point. This integration allowed for more accurate and reproducible delineation of the breast boundaries, even in cases where neural networks or traditional methods alone faced limitations. Notably, the hybrid method addressed the inherent variability in anatomical features, such as the axilla-breast boundary, where automated delineation showed reproducibility in many cases but required enhanced robustness in others.
The results emphasize the importance of leveraging domain knowledge in medical imaging to address the limitations of standalone methods. Traditional computer vision methods demonstrated high precision but struggled with generalization, while deep learning models provided robust automation yet faced challenges with subtle anatomical details. By bridging these gaps, the hybrid approach offers a clinically relevant and scalable solution, particularly for datasets with diverse anatomical variability.
Beyond breast segmentation, this study underscores the broader potential of hybrid strategies in medical image analysis. Integrating machine learning with anatomical priors can enhance performance in other complex segmentation tasks, paving the way for new advancements in radiology and related fields. Future work will focus on validating the scalability of this method across larger datasets and exploring its applicability to other anatomical regions and imaging modalities.
Author Contributions
This research was conceptualized by Francisco J Alvarez-Padilla and Jorge L Flores-Nunez, with Francisco leading the methodological development and overall direction of the study. Jorge provided critical scientific insights in the field of optics, contributing his expertise and providing access to the thermographic camera used in this work. The software development and implementation of neural network models were led by Juan R Alvarez-Padilla, whose extensive experience in deep learning was instrumental in achieving robust segmentation results. Mayelin V Argudin-Ferran was responsible to validate thermographic images acquisition under standardized conditions, ensuring the quality and consistency of the dataset. Validation of the results was conducted collaboratively by Francisco, Jorge, and Mayelin, while Francisco carried out the formal analysis. Data curation was managed by Mayelin, and the visualization of results was prepared by Juan. Writing of the original draft was led by Francisco, with Jorge, Juan and Mayelin contributing significantly to the review and editing phases. Supervision and project administration were undertaken by Francisco J. Alvarez-Padilla. All authors have reviewed and approved the final version of the manuscript.
Funding
This research received no external funding.
Institutional Review Board Statement
The study was conducted in accordance with the Declaration of Helsinki and was approved by the respective Ethics Committees of the medical institutions involved in this project: the Jalisco Cancer Institute and the Institute for Social Security and Services for State Workers (ISSSTE). Both institutions provided ethical approval for the study, including protocols for data anonymization and patient consent to participate in this research. Patient confidentiality and privacy were strictly maintained throughout the study.
Informed Consent Statement
All images in this study have been fully anonymized, ensuring that the identity of the patients remains protected. Nonetheless, informed consent was obtained from all participants in accordance with institutional and ethical guidelines.
Data Availability Statement
The data presented in this study are not publicly available due to internal privacy policies regarding their collection and use. However, the dataset can be made available upon reasonable request to the corresponding author, provided that the requesting party complies with ethical and privacy considerations outlined by the collaborating institutions.
Conflicts of Interest
The authors declare no conflicts of interest.
Abbreviations
The following abbreviations are used in this manuscript:
| AI | Artificial Intelligence |
| CNN | Convolutional Neural Network |
| CT | Computed Tomography |
| DSC | Dice Similarity Coefficient |
| GMM | Gaussian Mixture Models |
| IJC | Jalisco Cancer Institute |
| INEGI | Mexican National Institute of Statistics and Geography |
| IoU | Intersection over Union |
| ISSSTE | Institute for Social Security and Services for Mexican State Workers |
| MRI | Magnetic Resonance Imaging |
| PET | Positron Emission Tomography |
| SPECT | Single Photon Emission Tomography |
| WHO | World Health Organization |
References
- World Health Organization. Breast cancer. Global cancer statistics 2020, 71, 1–12. [Google Scholar]
- Instituto Nacional de Estadística y Geografía. Statistics of cancer in Mexican women. Mexican Health Statistics 2020, 45, 123–135. [Google Scholar]
- Smith, J.; Johnson, L. Research on optical densities in microscopy. Journal of Cellular Imaging 2021, 58, 89–97. [Google Scholar]
- Taylor, M.; Evans, P.; Garcia, D. Advances in MRI imaging techniques for breast cancer diagnosis. Radiology Advances 2020, 34, 204–215. [Google Scholar]
- Lee, H.; Martinez, R.; Brown, K. X-ray and CT applications in clinical imaging. Medical Physics Journal 2019, 49, 345–358. [Google Scholar]
- Williams, F.; Zhang, Y.; Patel, A. Ultrasound imaging techniques and applications. Journal of Medical Imaging 2018, 41, 278–285. [Google Scholar]
- Nakamura, T.; Li, W. Metabolic activity imaging using PET and SPECT. Nuclear Medicine Journal 2017, 28, 98–109. [Google Scholar]
- Anderson, R.; Kim, E.; Thompson, S. Recent advancements in thermography for breast cancer screening. Infrared Imaging Journal 2018, 15, 213–225. [Google Scholar]
- Miller, J.; Kumar, V.; Wang, H. Efficacy of thermography as a pre-diagnostic tool. Journal of Breast Imaging 2020, 12, 159–172. [Google Scholar]
- Otsu, N. A Threshold Selection Method from Gray-Level Histograms. IEEE Transactions on Systems, Man, and Cybernetics 1979, 9, 62–66. [Google Scholar] [CrossRef]
- Gonzalez, R.C.; Woods, R.E. Edge detection algorithms for clinical applications in thermography. Computer Vision Journal 2004, 22, 134–146. [Google Scholar] [CrossRef]
- Ng, E.Y.K.; Sudharsan, N.M. Traditional methods for thermographic breast segmentation. Medical Image Analysis 2015, 39, 77–89. [Google Scholar] [CrossRef]
- Fernandez, J.; Gutierrez, M. Clustering methods for thermographic image segmentation. Journal of Thermal Imaging 2010, 25, 145–159. [Google Scholar]
- Kass, M.; Witkin, A.; Terzopoulos, D. Active Contour Models: Applications in thermography. International Journal of Computer Vision 2013, 12, 321–331. [Google Scholar]
- Liu, Q.; Xu, L. Gaussian Mixture Models for thermographic segmentation. Pattern Recognition Letters 2015, 36, 227–234. [Google Scholar] [CrossRef]
- Smith, P.; Zhang, T. Decision tree-based segmentation of thermographic breast images. IEEE Transactions on Medical Imaging 2018, 37, 2568–2578. [Google Scholar]
- Ronneberger, O.; Fischer, P.; Brox, T. U-Net: Convolutional Networks for Biomedical Image Segmentation. In Proceedings of the Medical Image Computing and Computer-Assisted Intervention. Springer, 2015, pp. 234–241. [CrossRef]
- Badrinarayanan, V.; Kendall, A.; Cipolla, R. SegNet: A Deep Convolutional Encoder-Decoder Architecture for Image Segmentation. Computer Vision Research 2016, 44, 89–99. [Google Scholar] [CrossRef] [PubMed]
- Huang, Q.; Li, X.; Zhao, W. Advances in deep learning for breast thermography segmentation. Neural Processing Letters 2019, 50, 145–157. [Google Scholar]
- Alvarez-Padilla, F.J.; Flores-Nunez, J.L.; Alvarez-Padilla, J.R.; Gonzalez, F.J.; Oceguera-Villanueva, A.; Gutierrez-Quiroz, B.A. Breast segmentation in infrared thermography from characteristical inframammary shape. International Journal for Numerical Methods in Biomedical Engineering 2024, 40, e3843. [Google Scholar] [CrossRef]
- Guan, S.; Wang, Y.; Wu, Q.; Zhang, H. DenseUNet: A Robust Neural Network for Dense Multiscale Feature Learning in Medical Image Segmentation. IEEE Access 2020, 8, 79721–79733. [Google Scholar]
- Sato, Y.; Nakajima, S.; Shiraga, N.; Atsumi, H.; Yoshida, S.; Koller, T.; Gerig, G. and Kikinis, R. Three-dimensional multi-scale line filter for segmentation and visualization of curvilinear structures in medical images. Medical Image Analysis 1998, 2, 143–168. [Google Scholar] [CrossRef] [PubMed]
- Torres-Galván, J.C.; Guevara, E.; Kolosovas-Machuca, E.S.; Oceguera-Villanueva, A.; Flores, J.L.; González, F.J. Deep convolutional neural networks for classifying breast cancer using infrared thermography. Quantitative InfraRed Thermography Journal 2022, 19, 283–294. [Google Scholar] [CrossRef]
- Singh, D.; Singh, A.K. Role of image thermography in early breast cancer detection-Past, present and future. Computer Methods and Programs in Biomedicine 2020, 183, 105074. [Google Scholar] [CrossRef]
Figure 1.
(a) A coronal thermography image spanning from the neck to the lower abdomen, where the right breast (appearing on the left in the image) shows heterogeneous regions with higher temperatures compared to the left breast. (b) Thermography (a) with a jet colormap applied, enhancing thermal transition zones through color variations (notably red areas, denoted as hot points (here denoted as Hs). Additionally, the image is rotated 180 degrees (upside down, though still showing the neck) to better highlight the transitions observed in (c). (c) A 3D rendering of the thermography image where temperature intensities are visualized as a topographic relief. Hot points (Hs) appear as hills, providing a clear visual contrast, while cooler regions, such as the lower abdomen, resemble valleys.
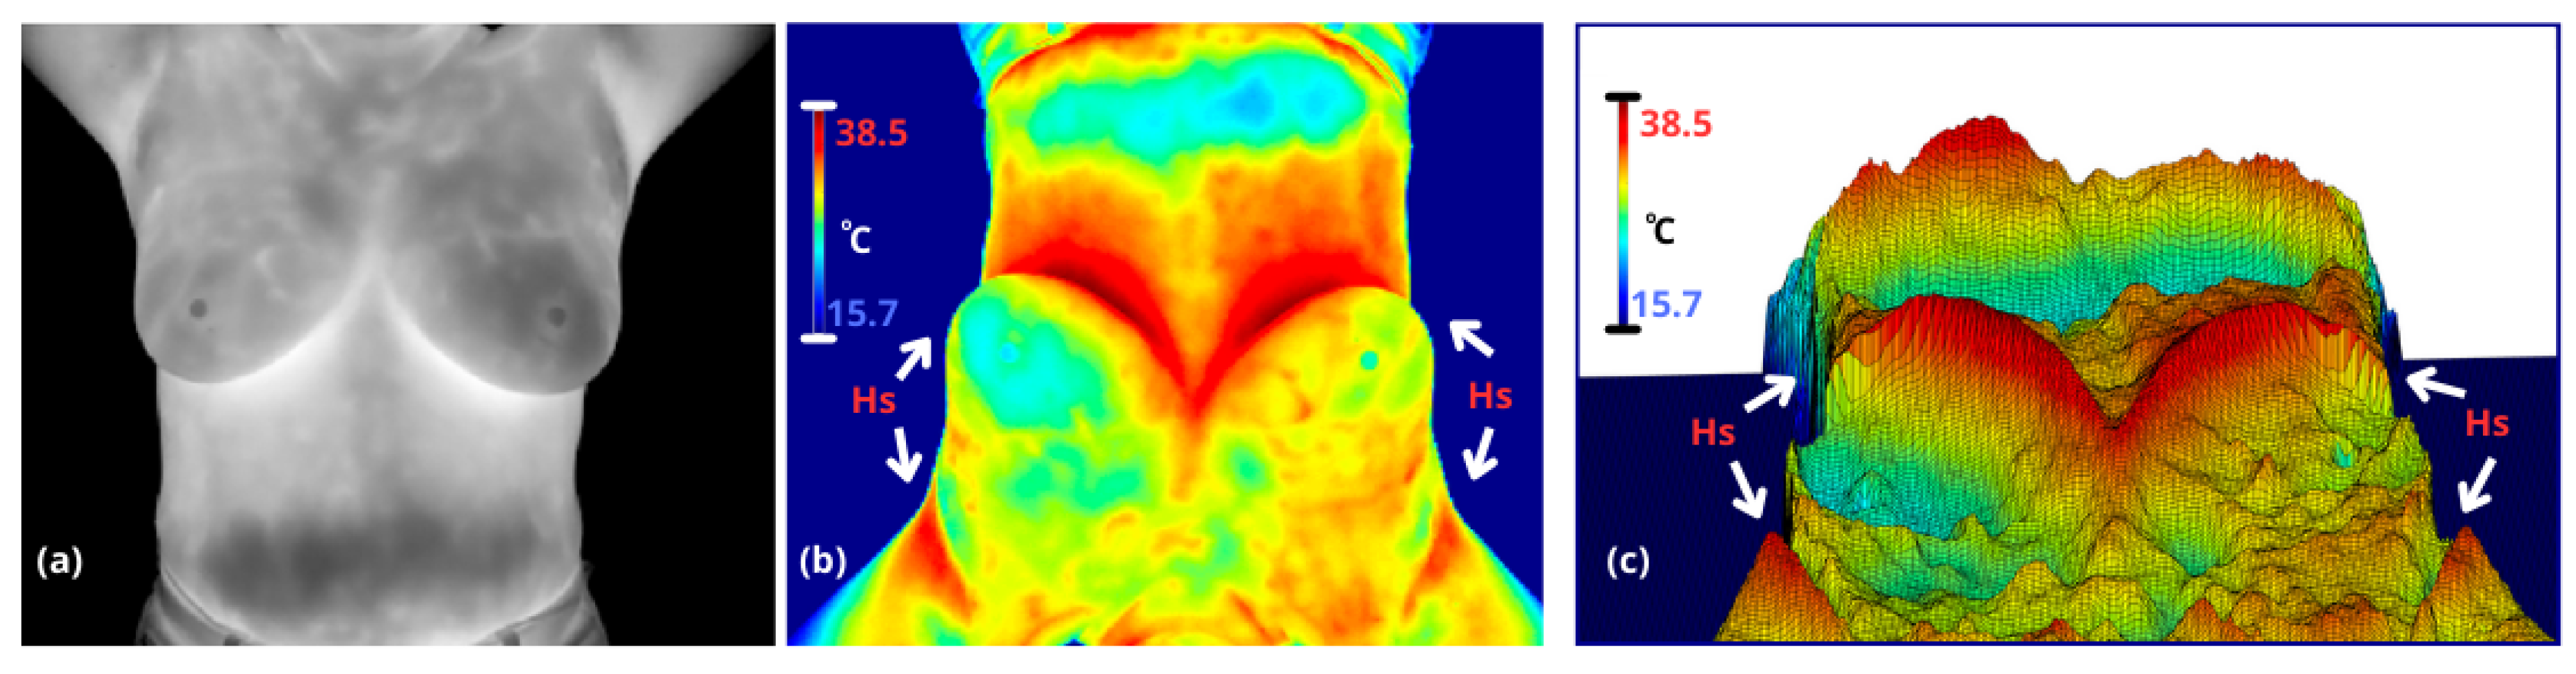
Figure 2.
(a) to (d) thermographic images obtained from the dataset used for training, and (e) to (h) are their corresponding masks, . In these masks, class 1 represents the background, marked in black ; class 2, , corresponds to the upper breast region up to the neck, marked in orange; and class 3 , shown in white, represents the axillary regions.
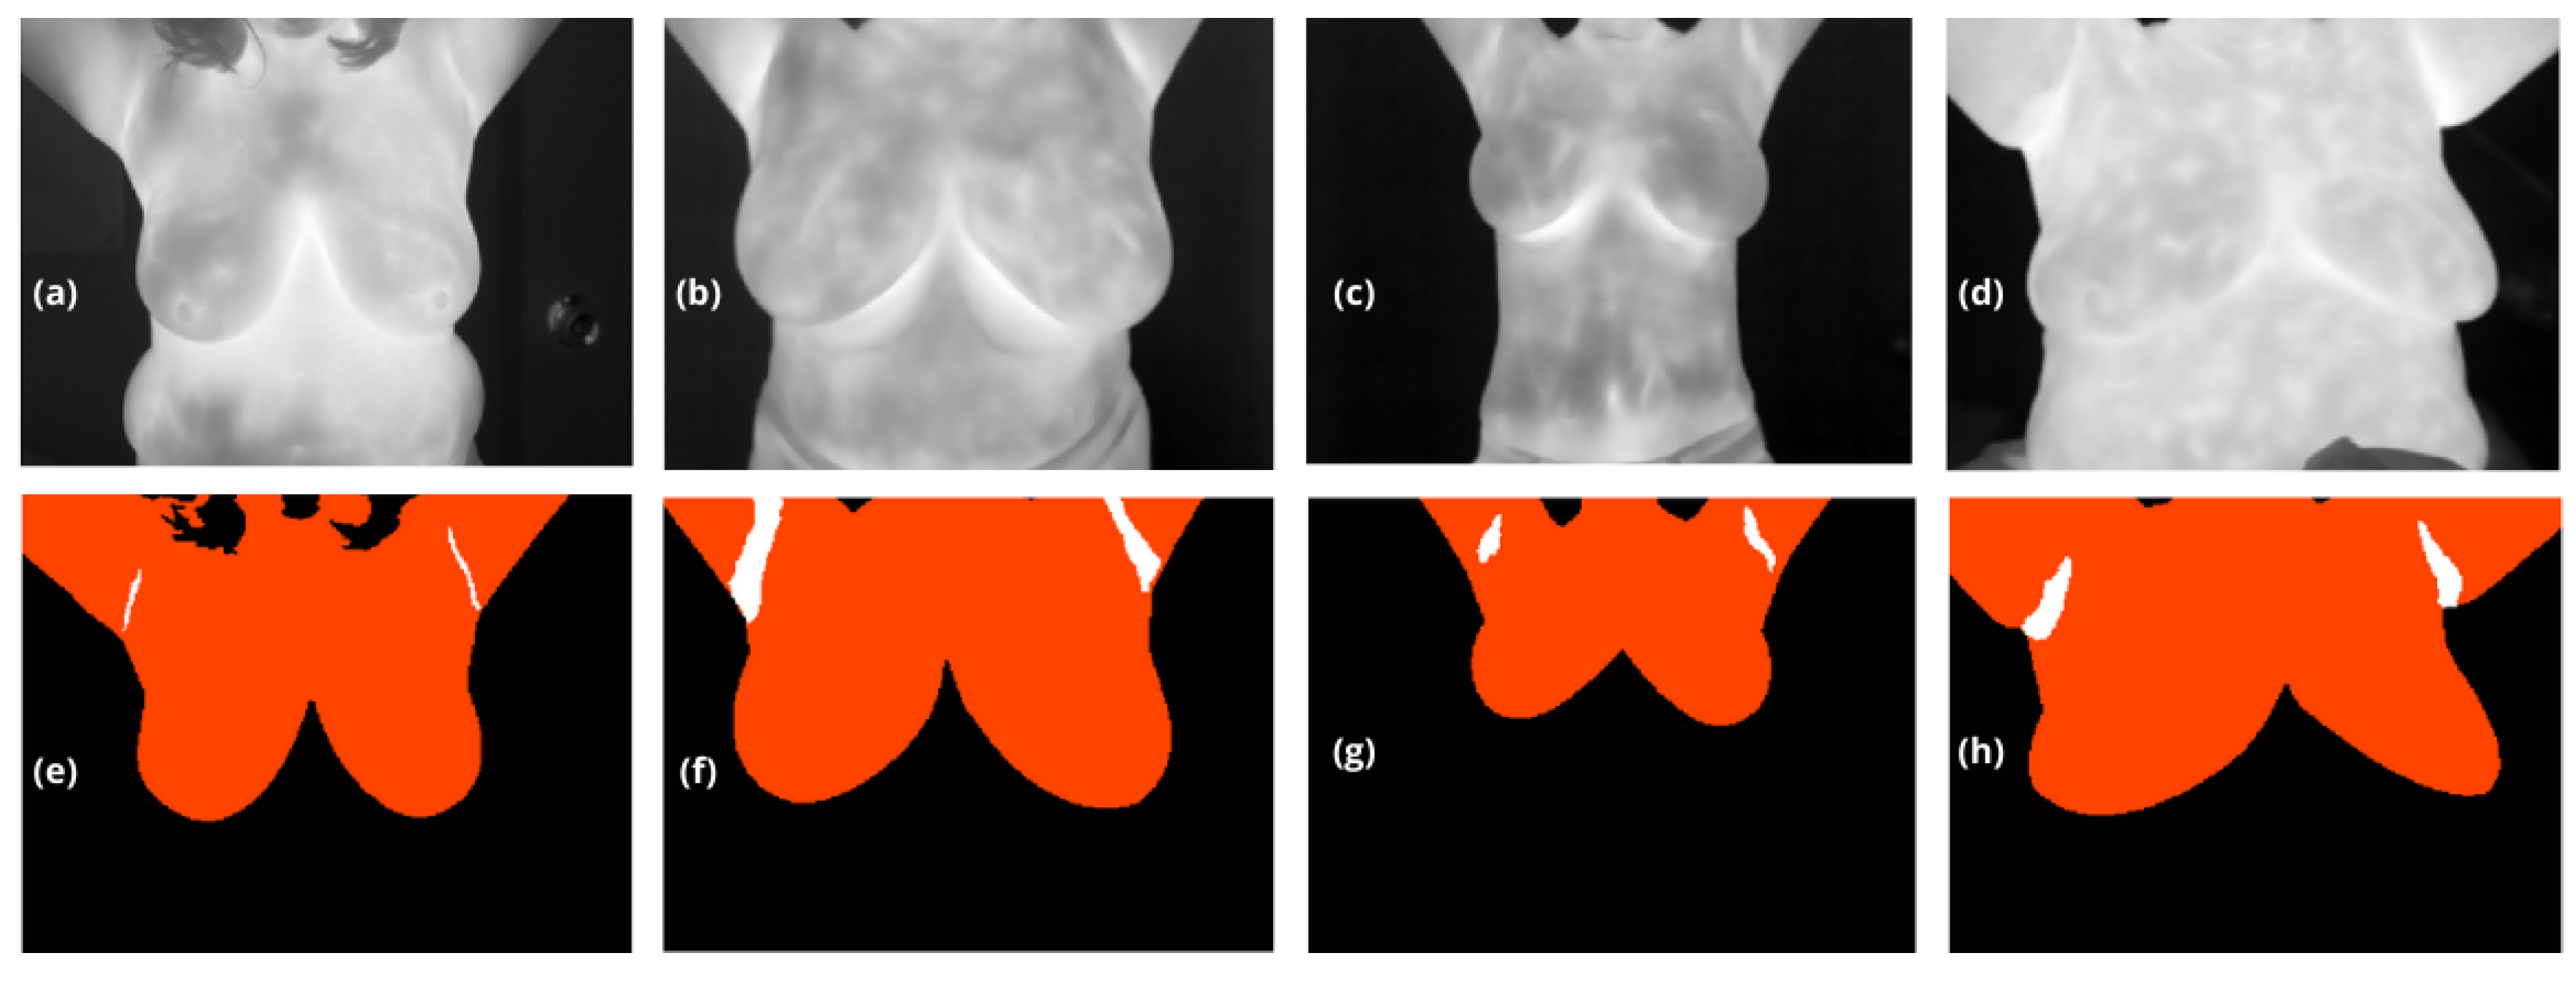
Figure 3.
(a) Displays the segmentation contours in yellow and in magenta. The different dashed rectangles represent the regions to be analyzed in the cropped images in (b): the right axilla in green, the left axilla in blue, and the inframammary bifurcation in purple. (b) Shows the both projections from the lower armpit pixels, right and left (marked with a magenta circle with a white border) to the nearest pixel on the yellow contour (marked with yellow circle with a magenta border), and the upper inflection point of the inframammary bifurcation (marked by a yellow circle with an orange border). (c) These points define the supramammary borders, marked in orange.
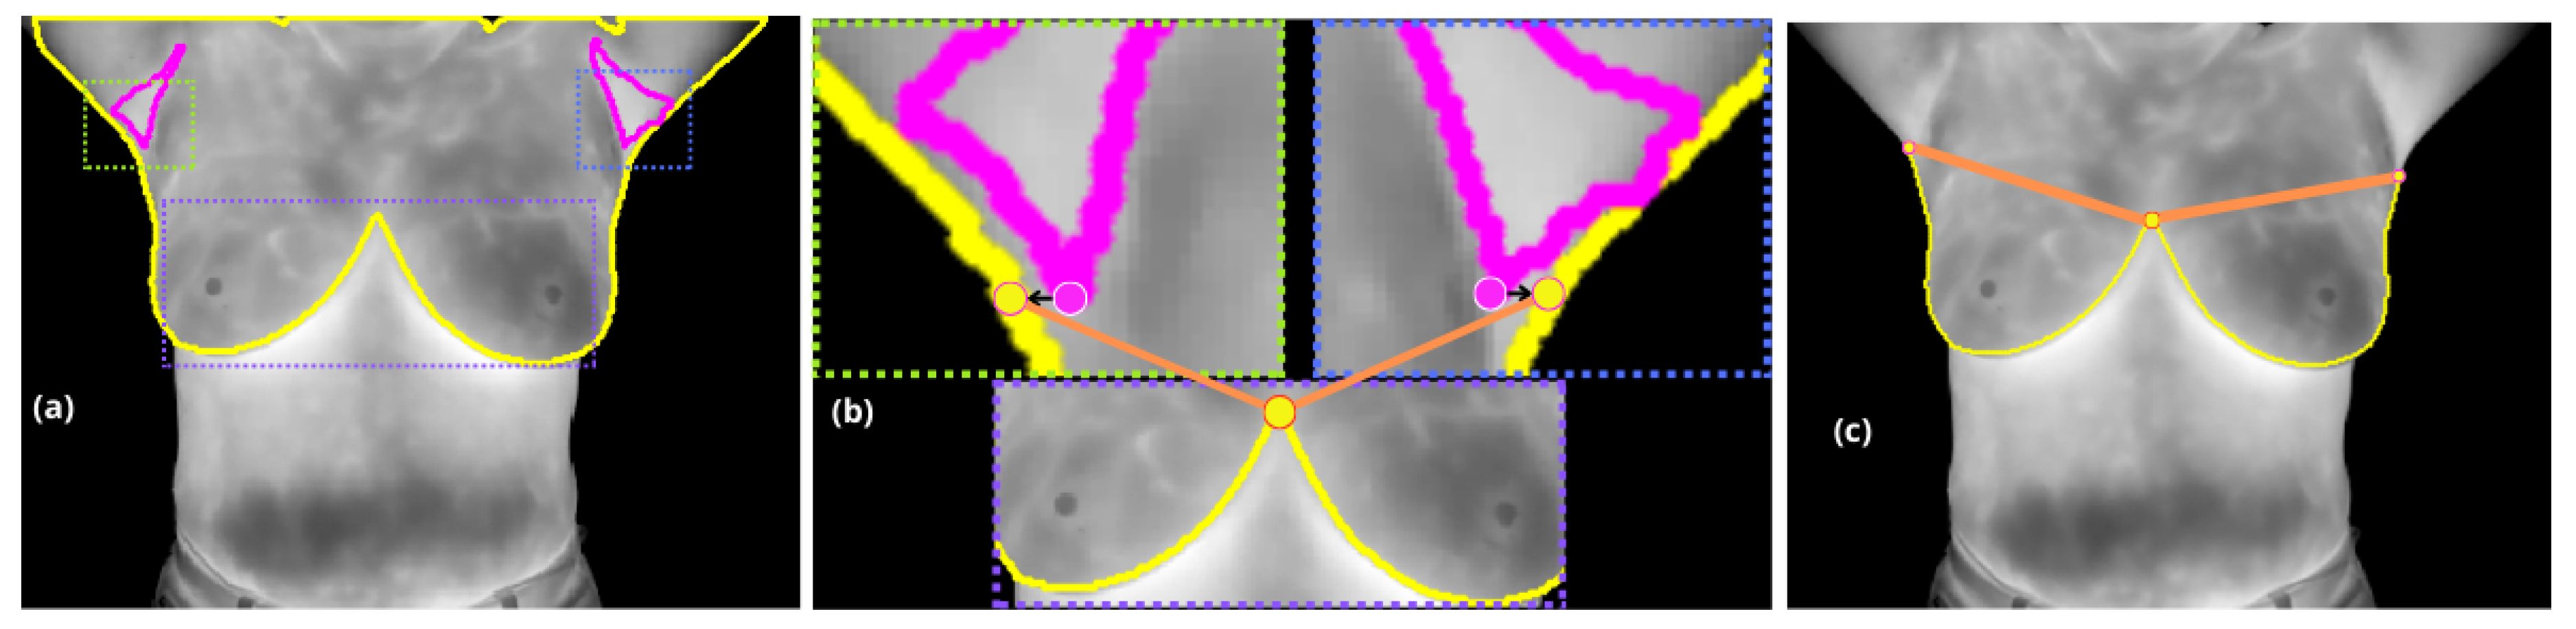
Figure 4.
(a) Reference coronal thermogram for data augmentation, showing breasts, armpits, neck, and abdomen; (b) horizontally flipped a); (c) vertical and horizontal shifts of 20%; (d) image rotated by ; and (e) a zoom of 70% vertically and 80% horizontally in the upper breast region.
Figure 4.
(a) Reference coronal thermogram for data augmentation, showing breasts, armpits, neck, and abdomen; (b) horizontally flipped a); (c) vertical and horizontal shifts of 20%; (d) image rotated by ; and (e) a zoom of 70% vertically and 80% horizontally in the upper breast region.
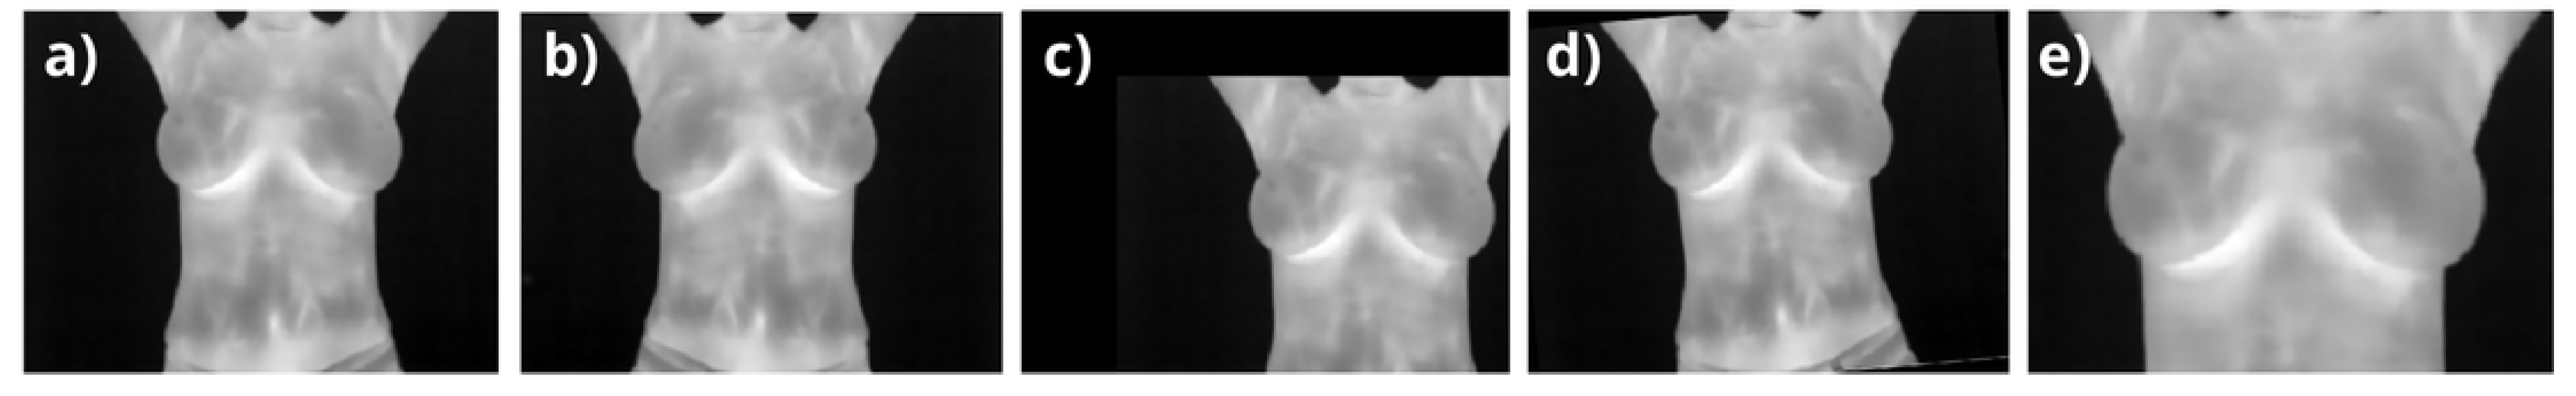
Figure 5.
Testing thermographic images (a-c) are shown without noise to evaluate internal information. In contrast, segmentation results for breast regions are overlaid in images (d-f), with blue contours representing the Computer Vision method, green contours the Dense Multiscale U-Net, yellow contours our hybrid method, and red contours the ground truth masks validated by oncologists. Images (d) and (e) display relatively consistent results across the three approaches, despite low inframammary contrast in (d) caused by collapsed breast volume. In (f), the left breast’s upper boundary (visible on the right) highlights a clear underestimation by the Dense Multiscale U-Net, where thermal patterns were not accurately interpreted.
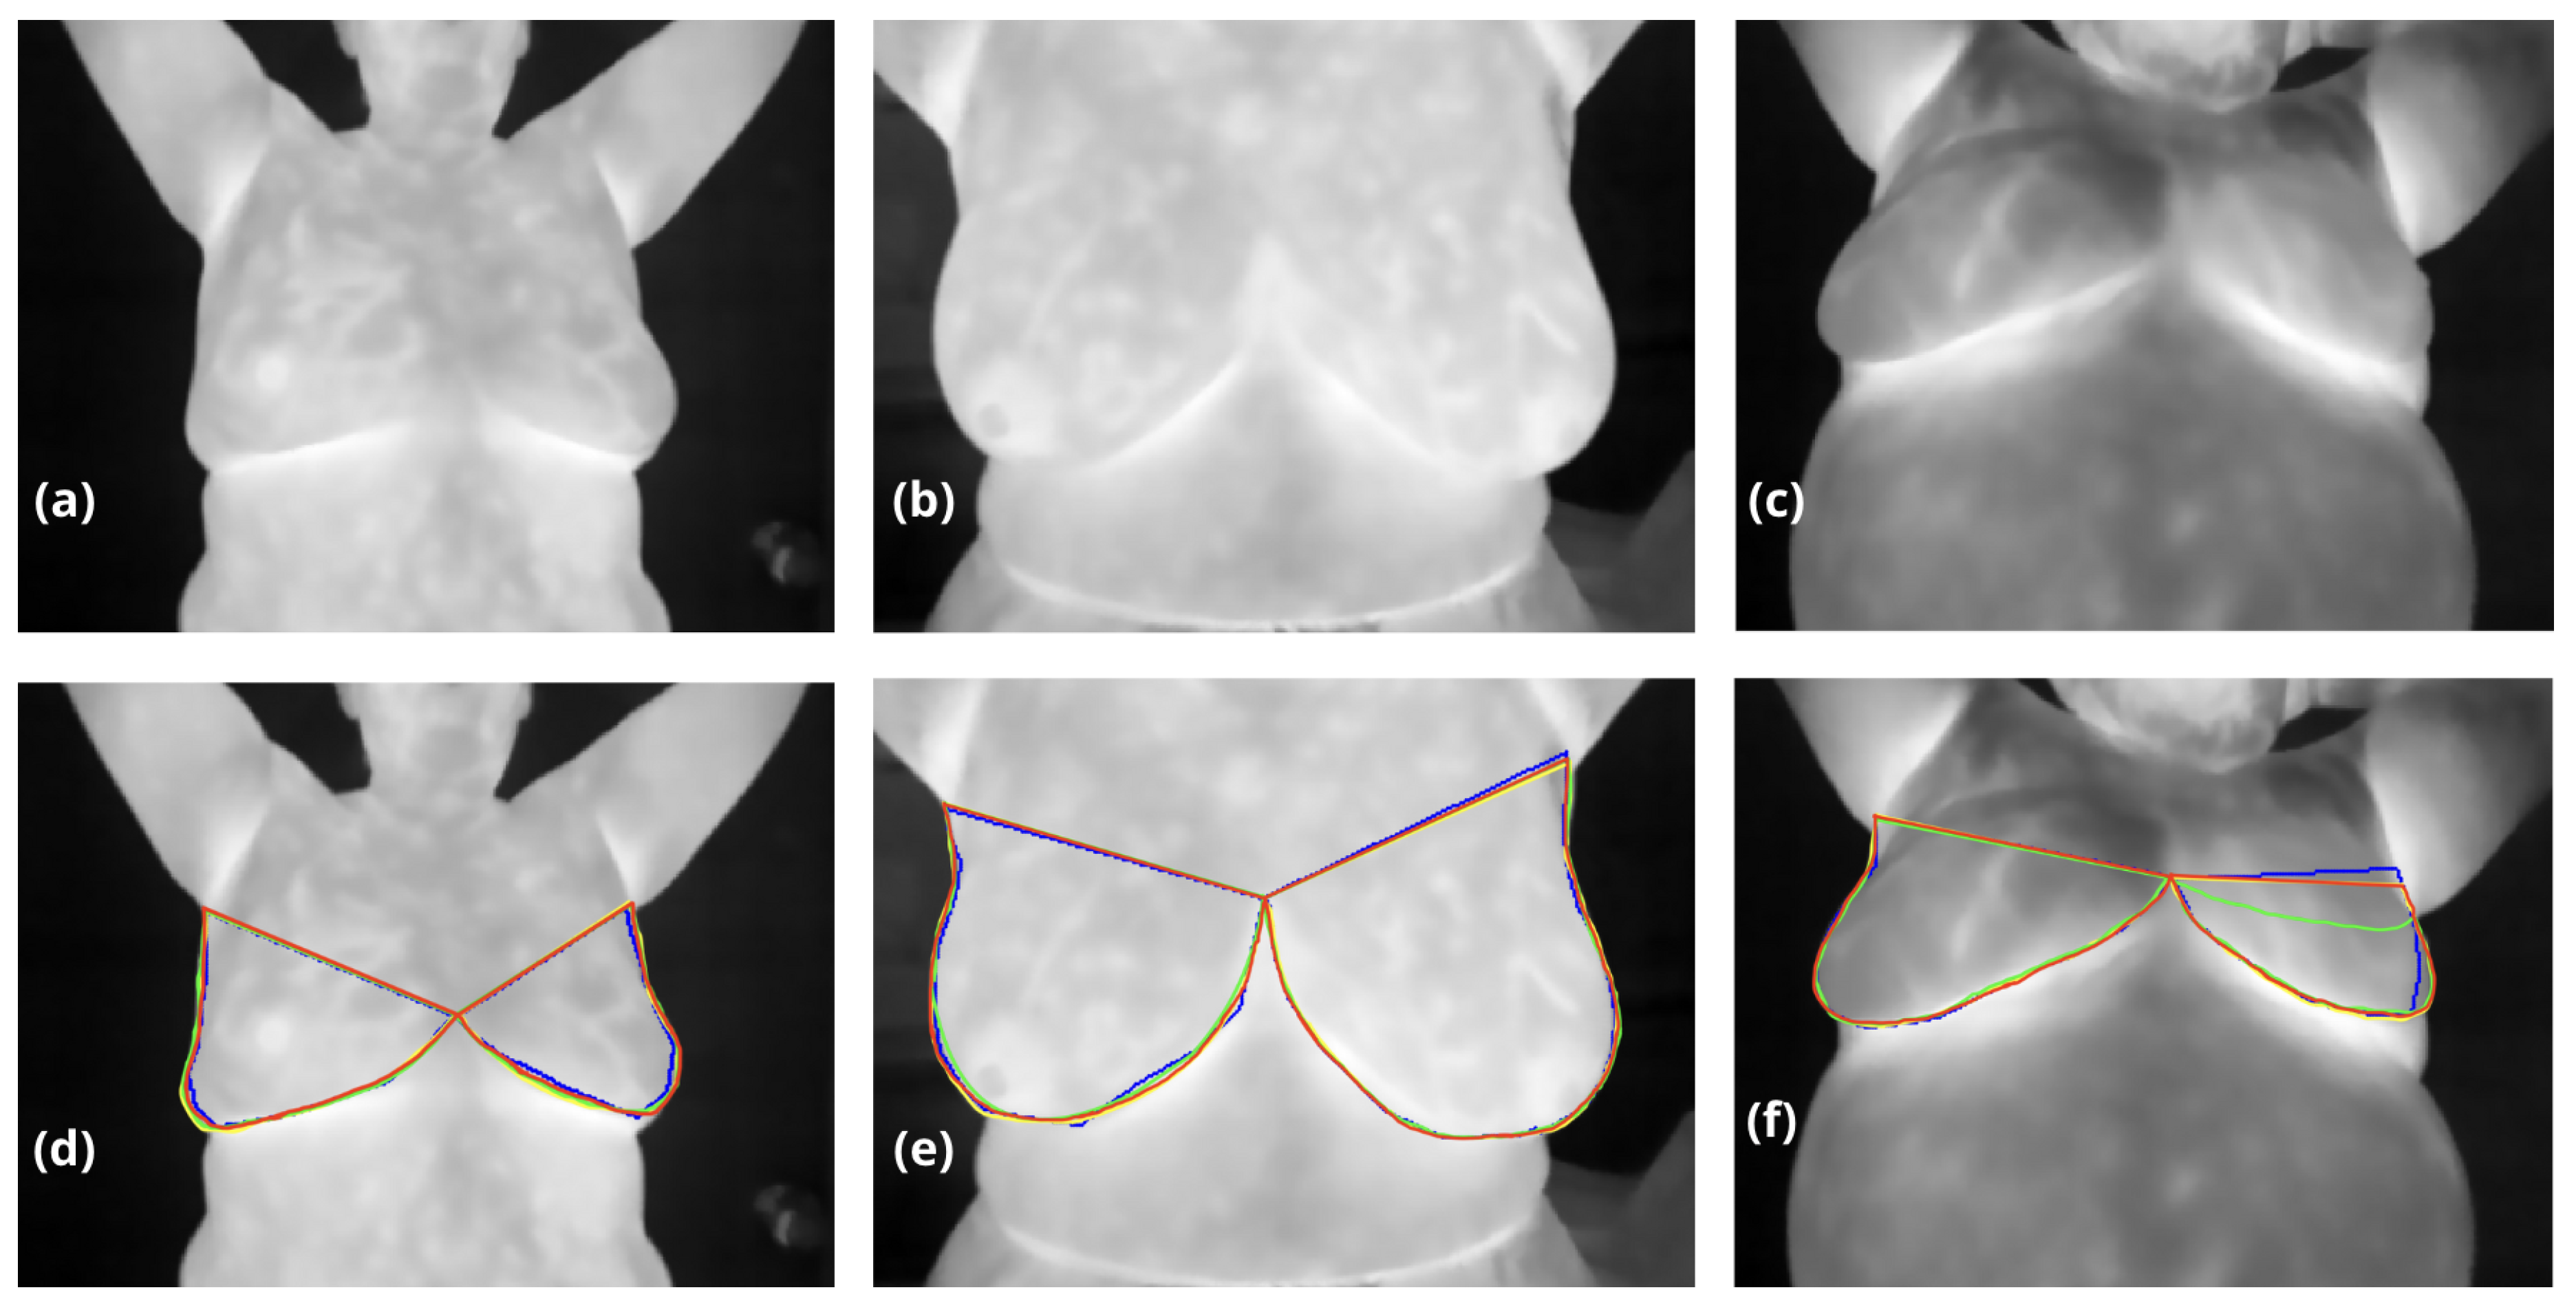

Table 1.
Comparison of breast segmentation methods: traditional vs hybrid approaches.
| Methods | DSC | IoU |
|---|---|---|
| Computer Vision method [20] | 0.983 | 0.934 |
| Dense Multiscale U-Net | 0.972 | 0.922 |
| Ours | 0.987 | 0.963 |
Disclaimer/Publisher’s Note: The statements, opinions and data contained in all publications are solely those of the individual author(s) and contributor(s) and not of MDPI and/or the editor(s). MDPI and/or the editor(s) disclaim responsibility for any injury to people or property resulting from any ideas, methods, instructions or products referred to in the content. |
© 2025 by the authors. Licensee MDPI, Basel, Switzerland. This article is an open access article distributed under the terms and conditions of the Creative Commons Attribution (CC BY) license (http://creativecommons.org/licenses/by/4.0/).
Copyright: This open access article is published under a Creative Commons CC BY 4.0 license, which permit the free download, distribution, and reuse, provided that the author and preprint are cited in any reuse.


