
Submitted:
05 December 2024
Posted:
06 December 2024
You are already at the latest version
Abstract
In clinical practice, identifying the location and extent of tumors and lesions is crucial for disease diagnosis and treatment. Artificial intelligence, particularly deep neural networks, offers precise and automated segmentation, yet its application is often hindered by limited data and high computational demands. Transfer learning helps mitigate these challenges by significantly reducing computational costs, although applying these models can still be resource-intensive. This study aims to present a flexible and computationally efficient architecture that leverages transfer learning and delivers highly accurate results across various medical imaging problems. We evaluated three datasets with varying similarities to ImageNet: ISIC 2018 (skin lesions), CBIS-DDSM (breast masses), and the Shenzhen & Montgomery CXR Set (lung segmentation). An ablation study on ISIC 2018 tested various pre-trained backbones, architectures, and loss functions. The optimal configuration—DeepLabV3+ with a pre-trained ResNet50 backbone and Log-Cosh Dice loss—was validated on the remaining datasets, achieving state-of-the-art results. Our findings demonstrate that computationally simpler architectures can deliver robust performance without extensive resources, establishing DeepLabV3+ with the ResNet50 as a baseline for future studies. Finally, we emphasize that in the medical domain, enhancing data quality is more critical for improving segmentation accuracy than increasing model complexity.
Keywords:
Semantic Segmentation
; Medical Image
; Transfer Learning
; U-Net
; DeepLabV3+
; ISIC 2018
; Shenzhen Hospital X-ray Set
; Montgomery County CXR Set
; CBIS-DDSM
1. Introduction
Semantic segmentation sets the foundation for analyzing medical images with high accuracy and effectiveness in this contemporary area. This technique classifies every pixel, enabling a more detailed and precise study of medical data. It enhances accuracy at the pixel level and provides detailed information about the distribution and precise positioning of objects, boundaries, and regions of interest [1]. These features have provided doctors with critical information and assisted them with various tasks, such as diagnosing and monitoring diseases, planning surgical interventions, evaluating the response to treatment, analyzing quantitatively anatomical structures, and mapping the anatomical regions [2,3,4].
All the achievements listed above are the aftermath of the deep learning revolution. Before this period, segmentation was a strenuous procedure due to the limitations of classical image processing techniques such as threshold, region-based, edge-based, watershed-based, and clustering-based methods. At that time, two or more techniques needed to be implemented and custom-synthesized to segment an image. However, this approach has limitations since it cannot be generalized to different problems. Deep neural networks offer the potential for concurrent precise segmentation and model generalization [5].
Scientists have directed their attention to these new deep-learning methods to improve the medical workflow. As a result, an enormous number of studies aim to enhance the architecture of deep learning neural networks. Their primary intention was to design a robust architecture that could be used in different problems and achieve high-accuracy results [6]. Most of these studies used U-Net as their baseline [7]. Many diligent review papers in the bibliography underscore the continuous advancements in medical image segmentation architectures and highlight the U-Net's foundational impact.
For instance, Azad et al. (2022) [8] discuss the U-Net model's practical aspects and meticulously organize its various variants into a taxonomy. It also proposes fair evaluations of some unique and prominent designs on well-known datasets, providing a comprehensive implementation library with trained models for future research.
Another significant work by Siddique et al. (2020) [6] examines the various developments in the U-Net architecture, highlighting its extensive adoption in medical imaging.
Even though significant progress has been made using deep learning methods, scientists still encounter several problems regarding data availability and computational resources. As Cui et al. (2023) [9] mention, the primary difficulties in applying artificial intelligence in medical imaging comprise the limited high-quality data, the shortage of accurate annotations, and the inconsistencies in medical images. Furthermore, on the computational aspect, training and testing a deep learning model demands a powerful GPU with high memory capacity, a tool whose cost is immense and thus inaccessible to everyone [9]. Therefore, developing an easy-to-use and computationally efficient model is essential as it can make semantic segmentation accessible and efficient, offering possibilities for advanced image analysis in many clinical tasks.
Transfer learning is an excellent method that alleviates these challenges since it significantly reduces the computational costs, even though applying these models can still be resource-intensive. Transfer learning is a deep learning technique where a model trained on a particular task with a vast amount of data, such as the ImageNet, is used to solve a different problem where data availability is limited. Using a pre-trained model, which has already learned to recognize general features, transfer learning can significantly reduce the computational resources and time required to train a new model. It allows the model to quickly adapt to new tasks, often achieving high performance with minimal training data. This is because the initial layers of the pre-trained model have learned to extract generic features, such as edges and textures in images, which are useful in various tasks [10,11,12].
Based on the above, this study aims to demonstrate a flexible and computationally efficient architecture that exploits the potential of transfer learning and yields high-accuracy results on different medical imaging and graded similarity problems from ImageNet. In this way, a segmentation task can succeed in an environment with limited resources, which is constantly met in clinical and research fields.
The subsequent sections are structured as follows: in Section 2, we analyze the workflow that was followed by addressing the datasets that were used in this paper and are publicly available, the deep learning architectures that were implemented, the required steps of data preprocessing, and the regulation of the model's hyper-parameters and the training's parameters, including loss-functions and evaluation metrics. In Section 3, we present the results of the paper for every dataset. Finally, in Section 4, we discuss the results and challenges we faced in this segmentation task using deep learning algorithms, and in Section 5, we conclude our ablation analysis.
2. Materials and Methods
2.1. Model Design
2.1.1. Pre-trained Models
Leveraging transfer learning requires appropriately pre-trained models to extract valuable information from a new dataset. These models are typically trained on the ImageNet dataset, which contains over a million images classified into 1,000 categories. Although these images represent everyday scenes and objects, they can still be instrumental in the medical domain, as they enable the pre-trained model to effectively extract fundamental features such as color and texture. [13].
Although many such models have been developed, most studies employ the VGG, ResNet, and DenseNet architectures with varying numbers of blocks. Their popularity stems from different advantages: VGG is appreciated for its simplicity; ResNet enables the use of deeper networks by addressing the vanishing gradient problem, reducing the risk of overfitting, and preserving essential information; and DenseNet is valued for its ability to reuse feature maps through dense connectivity [14].
In the context of this work, the used pre-trained models were the VGG19, ResNet50, and DenseNet121.
2.1.2. Architecture
Based on the U-Net taxonomy of Azad et al. (2022) [8], we decided to use three U-Net-based architectures and compare them with the DeepLabV3+ one, which has a different structure and information process. All of them benefit from being user-friendly while maintaining low computational resources. Moreover, plenty of studies have employed them in different tasks, a fact that highlights their popularity. Every structure is briefly analyzed below.
First, the simple U-Net architecture showcased the potential of deep learning algorithms in segmentation tasks. The feature that made this structure so celebrated is the skip connections, which transmit important spatial information from the encoder to the decoder (Figure 1) [7].
Secondly, the Attention U-Net is one of the most used variants of U-Net [15]. The groundbreaking feature of this structure is the addition of the attention mechanisms to the traditional U-Net, as it is depicted in Figure 2. Adding the attention gates to the skip connections, Attention U-Net selectively emphasizes the important regions of interest while suppressing the less important ones, enhancing the model's focus on target structures. Attention gates filter spatial information received from a specific layer of the encoder using information about the importance of the regions of the image, which is obtained from a deeper layer of the encoder. Hence, the model comprehends which regions of the medical image are the most important and acquires information only for these specific locations. The adaptive feature selection has improved segmentation performance, especially in scenarios with complex background noise or variability[15].
Furthermore, the Residual Attention U-Net, which, even though it shares the same structure as the Attention U-Net, has two significant differences: the ResNeXt block and the LSH Attention. The first one adds multiple paths on the ResNet block, which is called cardinality, to extract and understand more complex data features. The second one improves the attention mechanism to locate regions with the same traits, such as textures, colors, or shapes. In this way, the model groups similar parts instead of "looking" at each one individually. Both of these innovations are depicted in Figure 3 [16].
Finally, the last structure that was used was the DeepLabV3+. This architecture has an entirely different notion and structure. The two main differences between DeepLabV3+ and the U-Net variants are the introduction of the atrous convolutions and the Atrous Spatial Pyramid Pooling mechanism (ASPP). Both enable the model to receive high-level features from the image at various scales without diminishing spatial resolution. The ASPP mechanism applies atrous convolutions at different dilation rates to the feature maps. The structure of this architecture and the ASPP mechanism can be seen in Figure 4 [17].
2.2. Datasets
This study utilized three well-known, publicly accessible datasets of varying difficulty and graded deviation from ImageNet: ISIC 2018, CBIS-DDSM, and a combination of the Shenzhen Hospital CXR Set and Montgomery County CXR Set. These datasets were employed for segmentation tasks involving lesions and regions of interest in skin, breast, and lung, respectively.
We implemented these datasets in the order mentioned above due to the conclusions of the Matsouka et al. (2022) study. According to this work, every dataset has a factor of distance that points out how similar the features of its images are to those of ImageNet. The closer the similarity between the datasets, the greater the benefit of transfer learning during model training [18].
2.2.1. ISIC 2018
The datasets of ISIC 2018 were utilized first, as they showed the highest similarity to ImageNet. These RGB dermatoscopic images have been used in a great number of studies, and their use focuses on lesion segmentation and classification tasks [19,20]. Most of the dataset’s images include hair, bubbles, patches, and other elements negatively affecting segmentation accuracy. That is why most algorithms fail to effectively segment at least 10% of the images [19]. In Figure 5, a variety of these challenges is depicted. ISIC 2018 comprises 2694 training and 1000 testing images and their respective ground truth masks, while their analysis varies from 540x722 to 4499x6748 pixels.
2.2.2. CBIS-DDSM
The Curated Breast Imaging Subset of the DDSM (CBIS-DDSM) is a dataset containing a substantial number of mammography images, which can be accessed via The Cancer Imaging Archive (TCIA). These images are utilized for various tasks, including lesion detection, segmentation, and classification [21,22,23].
The challenge of this dataset lies in its original image size, which is significantly larger than the masses that constitute the regions of interest, characterized by subtle texture appearances in segmentation tasks. The image resolutions range from 753x1028 to 6871x5431, while the bounding box dimensions enclosing regions of interest vary from 126x124 to 962x936. Image examples are illustrated in Figure 6.
CBIS-DDSM provides 1301 training and 377 testing images of masses, along with their corresponding ground truth masks. Furthermore, these images are meticulously annotated and include views captured in both craniocaudal and mediolateral oblique orientations.
2.2.3. Shenzhen Hospital & Montgomery County Chest X-ray Sets
The Shenzhen and Montgomery CXR sets consist of images obtained from their respective regions in China and the United States and are publicly accessible. While these datasets are primarily used for classification tasks, their application has been extended to include lung segmentation tasks [24,25].
The Shenzhen dataset contains 662 CXR images with a resolution of approximately 3000x3000 pixels. Unlike the previously mentioned datasets, the Shenzhen dataset does not include corresponding ground truth masks. Instead, segmented masks created by students and teachers from the Department of Computer Engineering at the National Technical University of Ukraine were utilized as ground truth masks [24,25,26]. However, since 96 out of the 662 images lack segmentation masks, this study used only the remaining 566 images with available masks. On the other hand, Montgomery’s dataset included 138 CXR images with their ground truth masks. Image size varied from 1255x989 to 3001x3001 pixels. In this paper, we adopted the widely used methodology from the literature, in which the first dataset was utilized for training, and the second dataset was employed for testing the models [24,25,26]. Figure 7 presents representative examples of each dataset.
2.3. Implementation Details
All models were implemented using Python (version 3.11) as the programming language, TensorFlow (version 2.12.0) as the backend, and an open-source framework based on the Keras API (version 3.4.0). The computations were conducted in the Google Colab environment, leveraging its high RAM capacity and embedded GPUs.
The Adam optimizer was employed with a learning rate of 0.001, and the batch size was set to 32 for most architectures. However, for attention-based models, the constraints of the available computational resources necessitated a reduction in batch size to 8. The number of epochs was fixed at 50, supplemented by the early stopping feature (min_delta=0.001, patience=5) to prevent overfitting
2.4. Data Preprocessing
Each dataset consisted of high-resolution images that could not be processed in their original form due to computational constraints, making image resizing essential. The dimensions of the images and their corresponding masks were uniformly scaled down to a resolution of 256x256 pixels across all three databases. For the CBIS-DDSM dataset, the resizing process involved an additional step. The original high-resolution images were cropped to a lesion-centered size of 1025x1025 pixels. This intermediate size was chosen to preserve the detailed information of the lesions, ensuring that no critical diagnostic features are lost during cropping. This intermediate size was chosen to preserve the detailed information of the lesions, ensuring that no critical diagnostic features were lost during cropping. Afterward, the cropped images were resized to 256x256 pixels. Breast lesion-based cropping ensured the lesions remained distinct and detectable even after resizing—a critical requirement for segmentation tasks.
Next, data validation and preparation processes were conducted. During this procedure, the data were reviewed after the algorithm was appropriately trained. In cases where the results exhibited low values, a thorough visual inspection was performed on each image and its corresponding mask to ensure data quality and integrity. The accuracy of the data was verified in the databases of CXR and mammography images.
In contrast, some dermatoscopic images were found to have almost entirely white masks, indicating either the absence of annotated lesions or tumors or incorrect segmentation of the regions of interest. Additionally, some images included lesions or tumors that were indiscernible even to trained physicians. To maintain the accuracy and relevance of the data, these images and their corresponding masks were excluded from the training dataset. However, the testing dataset was left unaltered to ensure that the study results could be compared with other works most consistently and comprehensively.
This procedure was essential to ensure that the remaining dataset was comprised of data of sufficient quality for analysis and model training. Many studies tend to overlook the importance of data quality; hence, this paper incorporates this control procedure and highlights its critical role in achieving reliable results.
Examples of excluded images from the training set are depicted in Figure 8.
After excluding erroneous images and their corresponding masks, the total number of training images in the ISIC 2018 dataset was reduced to 2,480. To monitor the training process, 10% of these images were allocated for validation.
For the other two datasets, due to their smaller size, 20% of the training images were reserved for validation. This approach ensured an appropriate validation set for monitoring model performance across all datasets.
Finally, as part of this work, an effort was made to generate more precise masks using semi-automatic methods. This approach was applied exclusively to the ISIC 2018 dataset to utilize these newly generated masks instead of those initially provided by the database for model training.
The distinguishing feature of the generated masks lies in their higher accuracy, particularly in capturing the contours of lesions. In contrast, the masks provided by the ISIC dataset were created with less precision in these aspects. Figure 9 illustrates one of the newly generated masks and highlights the improvement in accuracy compared to the corresponding ISIC 2018 mask.
2.5. Loss Functions
Among a great variety of loss functions found in literature, we employed the most widely utilized ones to increase models' ability to learn with higher accuracy and effectiveness. These include Binary Cross-Entropy, Dice loss, a combined loss function of Binary Cross-Entropy and Dice loss with equal weighting, the Jaccard loss, and the Focal Tversky loss [28]. During training, the network attempted to minimize this loss function by modifying the model's parameters using backpropagation and gradient descent optimization procedures. Log-Cosh Dice loss was also included in the study due to its groundbreaking implementation in various works. This loss function is known for its resilience to outliers, smooth learning process, improved convergence, and ability to engender precise segmentation masks and smooth boundaries in the regions of interest. From a mathematical perspective, Log-Cosh Dice loss is represented by the following equation [28]:
2.6. Evaluation Metrics
In a segmentation task, there are many different metrics to evaluate a deep learning model, which are broadly classified into two categories: pixel-based and overlap-based metrics [12]. Among these, the Dice Coefficient stands out due to its capabilities and widespread use in the literature as the primary evaluation metric for segmentation tasks. It is particularly useful in tasks requiring a deeper understanding of the overlap between two images [29].
For this reason, we used the Dice Coefficient as the primary evaluation metric in this work. This overlap-based approach relies on its ability to measure the similarity between two images, emphasizing accurately predicted true positives—usually between the generated segmentation and the ground truth mask. The Dice Coefficient ranges from 0 to 1, where higher values indicate better model performance [30]. Using the confusion matrix, it can be mathematically described as [31]:
True Positives (TP) represent the correctly predicted overlap between the predicted segmentation and the ground truth mask. False Positives (FP) are areas predicted as part of the region but absent in the ground truth. Finally, False Negatives (FN) represent regions in the ground truth that the model failed to predict as part of the segmentation.
3. Results
The results presented in this section evaluate the model's performance and its capability of being generalized accurately in different segmentation tasks with graded deviation from the ImageNet.
3.1. Dermatoscopic Images
Starting our computational research, we determined which pre-trained model was more efficient and suitable for our segmentation task. This inspection was implemented in two of the desired architectures, U-Net and DeepLabV3+, and the results are presented in Table 1, where Binary Cross-Entropy was employed as a loss function. Segmentation accuracy was evaluated using the Dice Coefficient. The recurrent feature of the ResNet50 was more effective for this task since the use of ResNet50 enhanced the model's accuracy. Based on this, every architecture from now on is combined with a pre-trained ResNet50 model.
Subsequently, we analyzed how the selected architectures influenced the learning process, focusing on accuracy and computational efficiency. Specifically, Table 2 and Table 3 summarize the results, demonstrating that U-Net and DeepLabV3+ outperformed the Attention-based structures in these aspects. As in the previous stages, the Binary Cross-Entropy loss function was employed for this analysis.
The results indicated that U-Net and DeepLabV3+ have the potential to achieve high accuracy while maintaining low computational demands. However, since U-Net outperformed DeepLabV3+ regarding the Dice Coefficient, while DeepLabV3+ demonstrated superior efficiency in processing power requirements, extending our tests by introducing different loss functions was essential.
These new experimental settings enabled DeepLabV3+ to excel, achieving an accuracy of 0.902 with the Log-Cosh Dice loss function, which was approximately 2% below U-Net's highest value, as shown in Table 4. Ultimately, the combination of DeepLabV3+, a pre-trained ResNet50 backbone, and the Log-Cosh Dice loss resulted in a deep-learning model that successfully fulfills the objectives of this study
The effectiveness of the model compared to its U-Net counterparts was assessed qualitatively and quantitatively. Specifically, Figure 10 illustrates the qualitative comparison of the models. The performance is evaluated based on the segmentation of images from the testing dataset, classified into three categories according to their Dice Coefficient values: <0.4, 0.4-0.8, and >0.8.
These value ranges were determined experimentally through visual inspection. Images in the <0.4 category represent cases where segmentation was unsuccessful, those in the 0.4-0.8 range correspond to moderately segmented images, and images with a Dice Coefficient >0.8 are considered successfully segmented.
DeepLabV3+ significantly enhances segmentation performance in more images than U-Net, reducing the proportion of less successful segmentations.
Finally, Figure 11 shows a qualitative analysis of the two deep learning models, comparing them to the masks of selected images. The first column shows the original skin lesion image, while the second column shows the corresponding ground truth (GT) mask.
3.2. Mammography Images
Beyond the ability of a model to perform with high efficiency on a specific problem, it is necessary that the algorithm can be generalized to solve similar problems in a more general context with different databases and complexities. In this subsection, the model’s performance and ability to generalize have been investigated using the masses of the CBIS-DDSM dataset.
Based on the results of Table 5, the model of DeepLabV3+ with Log-Cosh Dice loss learned more accurately than the U-Net ones. These calculations confirmed the increased efficiency of DeepLabV3+ compared to the U-Net architecture, even on a database with a high degree of difficulty. Their difference was at the percentage of 4.4%.
These calculations are corroborated by the qualitative results of Figure 12, where DeepLabV3+ managed to enhance the number of successfully segmented images. Simultaneously, fewer images could not be segmented compared to the U-Net architecture with the best-performed loss function.
Figure 13 provides a qualitative inspection of DeepLabV3+ performance.
3.3. Lung X-ray Images
Finally, the generalization ability was also tested on the Shenzhen and Montgomery County CXR sets. In Table 6, DeepLabV3+ and U-Net were compared in terms of dice coefficient accuracy using the two most efficient loss functions. DeepLabV3+ performed slightly better than U-Net by 0.04%, and this time, Binary Cross-Entropy aided the model in learning with higher accuracy instead of Log-Cosh Dice loss.
Following up, Figure 14 presents no differences between the two best-performed models, which confirms the above results. As illustrated, both models were able to segment all the data in the test set successfully.
Likewise, we selected several images from the dataset to present their qualitative and quantitative results. Figure 15 depicts both models' ability to create high accuracy masks.
3.4 Comparison with state-of-the-art
The effectiveness of DeepLabV3+ is highlighted by comparing the results with the respective ones in the literature. This comparison with state-of-the-art models can be seen in Table 7. DeepLabV3+ may not exceed in terms of accuracy compared to the others. Still, it can be deduced that this model outperforms the trivial architectures as it was presented above. In contrast, its results can comfortably be compared to the transformer-based networks, which perform better than most conventional CNNs [32]. Hence, our approach is a trustworthy method that can be implemented in environments with less computational power and generate high-accuracy results.
Regarding the mammography database, no published studies follow the same approach as ours. Therefore, we will compare our results with those of recently published works, where the authors followed a similar method of extracting the results using the same amount of training and control data. The latter reason is particularly crucial, as many papers use different numbers of data depending on the purpose and goal of the task at hand.
Touazi et al. (2023) [41] , fill in these criteria. In their study, they were able to increase the Dice Coefficient metric to 0.75 by using Binary Cross-Entropy as a loss function and through a combined loss function, using weighted Focal Loss and Dice Loss at 50% each, to achieve a value of 0.9015. Compared to the above results, it can be seen that DeepLabV3+ using Binary Cross-Entropy shows equal results with the corresponding method while using Log-Cosh Dice Loss, the results are improved from those of Binary by 4.9% and show a deviation from the more efficient model by 12.5%. In any case, it is worth noting that the number of images used for testing by Touazi et al. is smaller than the number studied in this paper since they have selected in their study only the images in which a successful detection of the lesion has been performed using the YOLO V8 tool (59% of the images). The comparison of the results not only with the paper above but with related works, as depicted in Table 8, highlights the DeepLabV3+ architecture as one of the most reliable and efficient, which can achieve high results even on the most demanding databases.
As for the lung CXR images, it was noticed that models could be trained with high accuracy due to the dataset's simplicity. In contrast to the previous datasets, Binary Cross-Entropy achieves better results, indicating that its use is very profitable in the least demanding datasets. DeepLabV3+ performed slightly better this time than U-Net, achieving high values of Dice Coefficient, which can be compared to the respective state-of-the-art approaches as it deviates from the best model at a percentage of 0.2%. Specifically, Table 9 exhibits the DeepLabV3+ ability to successfully segment CXR images compared to other models that used fully supervised and self-supervised variants.
4. Discussion
Developing easy-to-use and computationally efficient models is necessary, making semantic segmentation accessible and efficient while offering advanced image analysis capabilities in many clinical tasks.
The DeepLabV3+ model is a state-of-the-art architecture that is easy to use for young investigators and requires low computational power. In the context of this study, by exploiting the pre-trained network knowledge transfer method, ResNet50, and the Log-Cosh Dice Loss function, the model showed excellent segmentation results on the dermatoscopic image problem and also when using different databases of graded "similarity" from ImageNet in an attempt to generalize the model.
By exploring a simple architecture that balances complexity and accuracy, our results are comparable to those of more efficient architectures, which require high computational power due to their complexity. In particular, when using three widespread databases in the research area, it was shown that the DeepLabV3+ model is among the four best worldwide.
At the same time, it was shown that, especially in segmentation problems in the medical field, it is necessary to have high-quality data to further improve the model's performance. The model's efficiency can reach state-of-the-art results by giving proper attention to the data set versus the architecture of the selected network. Finally, as for the problem with mammography images, the results were compared with those of the work with the most efficient architecture, showing excellent performance on such a complex problem.
The study constraints primarily stem from the computational power available. While using Google Colab initially enhanced the study's conditions, it also introduced a significant limitation due to restricted computing resources. Specifically, the image analysis was confined to a resolution of 256 x 256 pixels, which may have impacted the precision of the results. The use of higher resolution, such as 512 x 512, could not be supported. This weakness mainly affects data with very high resolution, such as the CBIS-DDSM database. The ISIC data or lung images depict the lesion or the region of interest with adequate resolution, enabling the more comfortable segmentation of such datasets since they do not lose crucial information during the resize at the preprocessing stage. In the mammography images, which are far more complex, both masses and fine texture details in regions of interest are depicted significantly smaller than the original image (approximately 6-8 times), which is the reason why resizing negatively affects the accuracy of the model as the necessary spatial information is dwindled. Understandably, valuable details and features will also be lost in such a dataset even if the images are processed at a higher resolution of 1024 x 1024. Therefore, different tools should be used that combine object detection with semantic segmentation.
5. Conclusions
This study has shown that we can rely on algorithms combining low computational power with high-accuracy results in various segmentation tasks. The DeepLabV3+ architecture outperformed U-Net and its variants regarding segmentation accuracy and computational resource economy, providing an initial framework for future research studies. Simultaneously, in the medical domain, it is preferable to implement data-driven rather than model-driven improvements since the data quality is crucial to enhance the performance of the model further and, generally, the clinical workflow.
Data Availability Statement
No new data were created. The original mammography data presented in the study are openly available in TCIA at 10.7937/K9/TCIA.2016.7O02S9CY, the dermatoscopic one at https://doi.org/10.1038/sdata.2018.161 and the lung one at https://data.lhncbc.nlm.nih.gov/public/Tuberculosis-Chest-X-ray-Datasets/index.html. Shenzhen Hospital CXR ground truth masks are available at https://www.kaggle.com/datasets/yoctoman/shcxr-lung-mask/data.
Acknowledgments
We acknowledge the use of ChatGPT [https://chat.openai.com/ accessed on 21 November 2024] to assist in proofreading the paper.
Conflicts of Interest
The authors declare no conflicts of interest.
References
- Kar, M.K.; Nath, M.K.; Neog, D.R. A Review on Progress in Semantic Image Segmentation and Its Application to Medical Images. SN Comput. Sci. 2021, 2, 1–30. [Google Scholar] [CrossRef]
- Gupta, M.; Mishra, A. A systematic review of deep learning based image segmentation to detect polyp. Artif. Intell. Rev. 2024, 57, 1–53. [Google Scholar] [CrossRef]
- Minaee, S.; Boykov, Y.Y.; Porikli, F.; Plaza, A.J.; Kehtarnavaz, N.; Terzopoulos, D. Image Segmentation Using Deep Learning: A Survey. IEEE Trans. Pattern Anal. Mach. Intell. 2021, PP, 1. [Google Scholar] [CrossRef] [PubMed]
- Alnasser, T.N.; Abdulaal, L.; Maiter, A.; Sharkey, M.; Dwivedi, K.; Salehi, M.; Garg, P.; Swift, A.J.; Alabed, S. Advancements in cardiac structures segmentation: a comprehensive systematic review of deep learning in CT imaging. Front. Cardiovasc. Med. 2024, 11, 1323461. [Google Scholar] [CrossRef]
- P. C. Bauer, Computational Social Science: Theory & Application. Accessed: Nov. 28, 2024. [Online]. Available: https://bookdown.org/paul/2021_computational_social_science/.
- Siddique, N.; Paheding, S.; Elkin, C.P.; Devabhaktuni, V. U-Net and Its Variants for Medical Image Segmentation: A Review of Theory and Applications. IEEE Access 2021, 9, 82031–82057. [Google Scholar] [CrossRef]
- Ronneberger, O.F.P.; Brox, T. U-net: Convolutional networks for biomedical image segmentation[C]. Medical image computing and computer-assisted intervention–MICCAI 2015: 18th international conference, Munich, Germany, October 5-9, 2015, proceedings, part III 18. Springer International Publishing, 2015: 234-241. [CrossRef]
- Azad, R.; Aghdam, E.K.; Rauland, A.; Jia, Y.; Avval, A.H.; Bozorgpour, A.; Karimijafarbigloo, S.; Cohen, J.P.; Adeli, E.; Merhof, D. Medical Image Segmentation Review: The Success of U-Net. IEEE Trans. Pattern Anal. Mach. Intell. 2024, 46, 10076–10095. [Google Scholar] [CrossRef] [PubMed]
- Cui, H.; Hu, L.; Chi, L. Advances in Computer-Aided Medical Image Processing. Appl. Sci. 2023, 13, 7079. [Google Scholar] [CrossRef]
- Yao, W.; Bai, J.; Liao, W.; Chen, Y.; Liu, M.; Xie, Y. From CNN to Transformer: A Review of Medical Image Segmentation Models. J. Imaging Informatics Med. 2024, 37, 1529–1547. [Google Scholar] [CrossRef] [PubMed]
- Rayed, E.; Islam, S.S.; Niha, S.I.; Jim, J.R.; Kabir, M.; Mridha, M. Deep learning for medical image segmentation: State-of-the-art advancements and challenges. Informatics Med. Unlocked 2024, 47. [Google Scholar] [CrossRef]
- Liu, X.; Song, L.; Liu, S.; Zhang, Y. A Review of Deep-Learning-Based Medical Image Segmentation Methods. Sustainability 2021, 13, 1224. [Google Scholar] [CrossRef]
- Aggarwal, C.C. Neural Networks and Deep Learning; Springer Nature: Dordrecht, GX, Netherlands, 2018. [Google Scholar]
- M. F. Uddin, N. M. F. Uddin, N. Tafshir, and M. M. Khan, "A Comparative Analysis Towards Melanoma Classification Using Transfer Learning by Analyzing Dermoscopic Images," Dec. 2023; 02, arXiv:arXiv:2312.01212. [Google Scholar] [CrossRef]
- Oktay et al., "Attention U-Net: Learning Where to Look for the Pancreas," May 20, 2018. arXiv:arXiv:1804.03999. [CrossRef]
- X. Chen, L. X. Chen, L. Yao, and Y. Zhang, "Residual Attention U-Net for Automated Multi-Class Segmentation of COVID-19 Chest CT Images," Apr. 12, 2020. arXiv:arXiv:2004.05645. [CrossRef]
- L.-C. Chen, Y. L.-C. Chen, Y. Zhu, G. Papandreou, F. Schroff, and H. Adam, "Encoder-Decoder with Atrous Separable Convolution for Semantic Image Segmentation," Aug. 22, 2018. arXiv:arXiv:1802.02611. [CrossRef]
- Matsoukas, C.; Haslum, J.F.; Sorkhei, M.; Soderberg, M.; Smith, K. "What Makes Transfer Learning Work For Medical Images: Feature Reuse & Other Factors," Jun. 09, 2022, arXiv: arXiv:2203.01825.
- N. Codella et al., "Skin Lesion Analysis Toward Melanoma Detection 2018: A Challenge Hosted by the International Skin Imaging Collaboration (ISIC)," Mar. 29, 2019. arXiv:arXiv:1902.03368. [CrossRef]
- Tschandl, P.; Rosendahl, C.; Kittler, H. The HAM10000 dataset, a large collection of multi-source dermatoscopic images of common pigmented skin lesions. Sci. Data 2018, 5, 180161. [Google Scholar] [CrossRef] [PubMed]
- CBIS-DDSM," The Cancer Imaging Archive (TCIA). Accessed: Nov. 28, 2024. [Online]. Available: https://www.cancerimagingarchive.net/collection/cbis-ddsm/.
- Lee, R.S.; Gimenez, F.; Hoogi, A.; Miyake, K.K.; Gorovoy, M.; Rubin, D.L. A curated mammography data set for use in computer-aided detection and diagnosis research. Sci. Data 2017, 4, 170177–170177. [Google Scholar] [CrossRef]
- Clark, K.; Vendt, B.; Smith, K.; Freymann, J.; Kirby, J.; Koppel, P.; Moore, S.; Phillips, S.; Maffitt, D.; Pringle, M.; et al. The Cancer Imaging Archive (TCIA): Maintaining and Operating a Public Information Repository. J. Digit. Imaging 2013, 26, 1045–1057. [Google Scholar] [CrossRef]
- Jaeger, S.; Karargyris, A.; Candemir, S.; Folio, L.; Siegelman, J.; Callaghan, F.; Xue, Z.; Palaniappan, K.; Singh, R.K.; Antani, S.; et al. Automatic Tuberculosis Screening Using Chest Radiographs. IEEE Trans. Med Imaging 2013, 33, 233–245. [Google Scholar] [CrossRef] [PubMed]
- Candemir, S.; Jaeger, S.; Palaniappan, K.; Musco, J.P.; Singh, R.K.; Xue, Z.; Karargyris, A.; Antani, S.; Thoma, G.; McDonald, C.J. Lung Segmentation in Chest Radiographs Using Anatomical Atlases With Nonrigid Registration. IEEE Trans. Med Imaging 2013, 33, 577–590. [Google Scholar] [CrossRef]
- Stirenko, S.; Kochura, Y.; Alienin, O.; Rokovyi, O.; Gordienko, Y.; Gang, P.; Zeng, W. Chest X-Ray Analysis of Tuberculosis by Deep Learning with Segmentation and Augmentation. In Proceedings of the 2018 IEEE 38th International Conference on Electronics and Nanotechnology (ELNANO), Kyiv, Ukraine, 24–26 April 2018; pp. 422–428. [Google Scholar]
- Rahman, T.; Khandakar, A.; Kadir, M.A.; Islam, K.R.; Islam, K.F.; Mazhar, R.; Hamid, T.; Islam, M.T.; Kashem, S.; Bin Mahbub, Z.; et al. Reliable Tuberculosis Detection Using Chest X-Ray With Deep Learning, Segmentation and Visualization. IEEE Access 2020, 8, 191586–191601. [Google Scholar] [CrossRef]
- Jadon, S. A survey of loss functions for semantic segmentation. In Proceedings of the 2020 IEEE Conference on Computational Intelligence in Bioinformatics and Computational Biology (CIBCB); 2020, Institute of Electrical and Electronics Engineers (IEEE); pp. 1–7.
- Xu, Y.; Quan, R.; Xu, W.; Huang, Y.; Chen, X.; Liu, F. Advances in Medical Image Segmentation: A Comprehensive Review of Traditional, Deep Learning and Hybrid Approaches. Bioengineering 2024, 11, 1034. [Google Scholar] [CrossRef] [PubMed]
- R. R. Shamir, Y. R. R. Shamir, Y. Duchin, J. Kim, G. Sapiro, and N. Harel, "Continuous Dice Coefficient: a Method for Evaluating Probabilistic Segmentations," Jun. 26, 2019. arXiv:arXiv:1906.11031. [CrossRef]
- Müller, D.; Soto-Rey, I.; Kramer, F. Towards a guideline for evaluation metrics in medical image segmentation. BMC Res. Notes 2022, 15, 1–8. [Google Scholar] [CrossRef]
- J. Wang, L. J. Wang, L. Wei, L. Wang, Q. Zhou, L. Zhu, and J. Qin, "Boundary-aware Transformers for Skin Lesion Segmentation," Oct. 08, 2021. arXiv:arXiv:2110.03864. [CrossRef]
- D. Jha, M. A. D. Jha, M. A. Riegler, D. Johansen, P. Halvorsen, and H. D. Johansen, "DoubleU-Net: A Deep Convolutional Neural Network for Medical Image Segmentation," Jun. 27, 2020. arXiv:arXiv:2006.04868. [CrossRef]
- Bencevic, M.; Galic, I.; Habijan, M.; Babin, D. Training on Polar Image Transformations Improves Biomedical Image Segmentation. IEEE Access 2021, 9, 133365–133375. [Google Scholar] [CrossRef]
- Ibtehaz, N.; Rahman, M.S. MultiResUNet : Rethinking the U-Net architecture for multimodal biomedical image segmentation. Neural Netw. 2020, 121, 74–87. [Google Scholar] [CrossRef]
- J. Chen et al., "TransUNet: Transformers Make Strong Encoders for Medical Image Segmentation," Feb. 08, 2021. arXiv:arXiv:2102.04306. [CrossRef]
- J. Wang et al., "ProMISe: Promptable Medical Image Segmentation using SAM," Sep. 28, 2024. arXiv:arXiv:2403.04164. [CrossRef]
- F. Tang, Q. F. Tang, Q. Huang, J. Wang, X. Hou, J. Su, and J. Liu, "DuAT: Dual-Aggregation Transformer Network for Medical Image Segmentation," Dec. 21, 2022. arXiv:arXiv:2212.11677. [CrossRef]
- Wang, H.; Cao, P.; Wang, J.; Zaiane, O.R. UCTransNet: Rethinking the Skip Connections in U-Net from a Channel-Wise Perspective with Transformer. Proc. Conf. AAAI Artif. Intell. 2022, 36, 2441–2449. [Google Scholar] [CrossRef]
- X. Huang, Z. X. Huang, Z. Deng, D. Li, and X. Yuan, "MISSFormer: An Effective Medical Image Segmentation Transformer," Dec. 19, 2021. arXiv:arXiv:2109.07162. [CrossRef]
- F. Touazi, D. F. Touazi, D. Gaceb, M. Chirane, and S. Herzallah, "Two-Stage Approach for Semantic Image Segmentation of Breast Cancer : Deep Learning and Mass Detection in Mammographic images".
- Kamran, S.A.; Hossain, K.F.; Tavakkoli, A.; Bebis, G.; Baker, S. Swin-SFTNet : Spatial Feature Expansion and Aggregation Using Swin Transformer for Whole Breast Micro-Mass Segmentation. 2023 IEEE 20th International Symposium on Biomedical Imaging (ISBI). LOCATION OF CONFERENCE, ColombiaDATE OF CONFERENCE; pp. 1–5.
- Rai, H.M.; Dashkevych, S.; Yoo, J. Next-Generation Diagnostics: The Impact of Synthetic Data Generation on the Detection of Breast Cancer from Ultrasound Imaging. Mathematics 2024, 12, 2808. [Google Scholar] [CrossRef]
- Wang, Y.; Wang, S.; Chen, J.; Wu, C. Whole mammographic mass segmentation using attention mechanism and multiscale pooling adversarial network. J. Med Imaging 2020, 7, 054503. [Google Scholar] [CrossRef]
- Liu, D.; Wu, B.; Li, C.; Sun, Z.; Zhang, N. TrEnD: A transformer-based encoder-decoder model with adaptive patch embedding for mass segmentation in mammograms. Med Phys. 2023, 50, 2884–2899. [Google Scholar] [CrossRef] [PubMed]
- Hatamizadeh, A.; Tang, Y.; Nath, V.; Yang, D.; Myronenko, A.; Landman, B.; Roth, H.R.; Xu, D. “UNETR: Transformers for 3D Medical Image Segmentation,” Oct. 09, 2021, arXiv: arXiv:2103.10504.
Figure 1.
U-Net architecture.
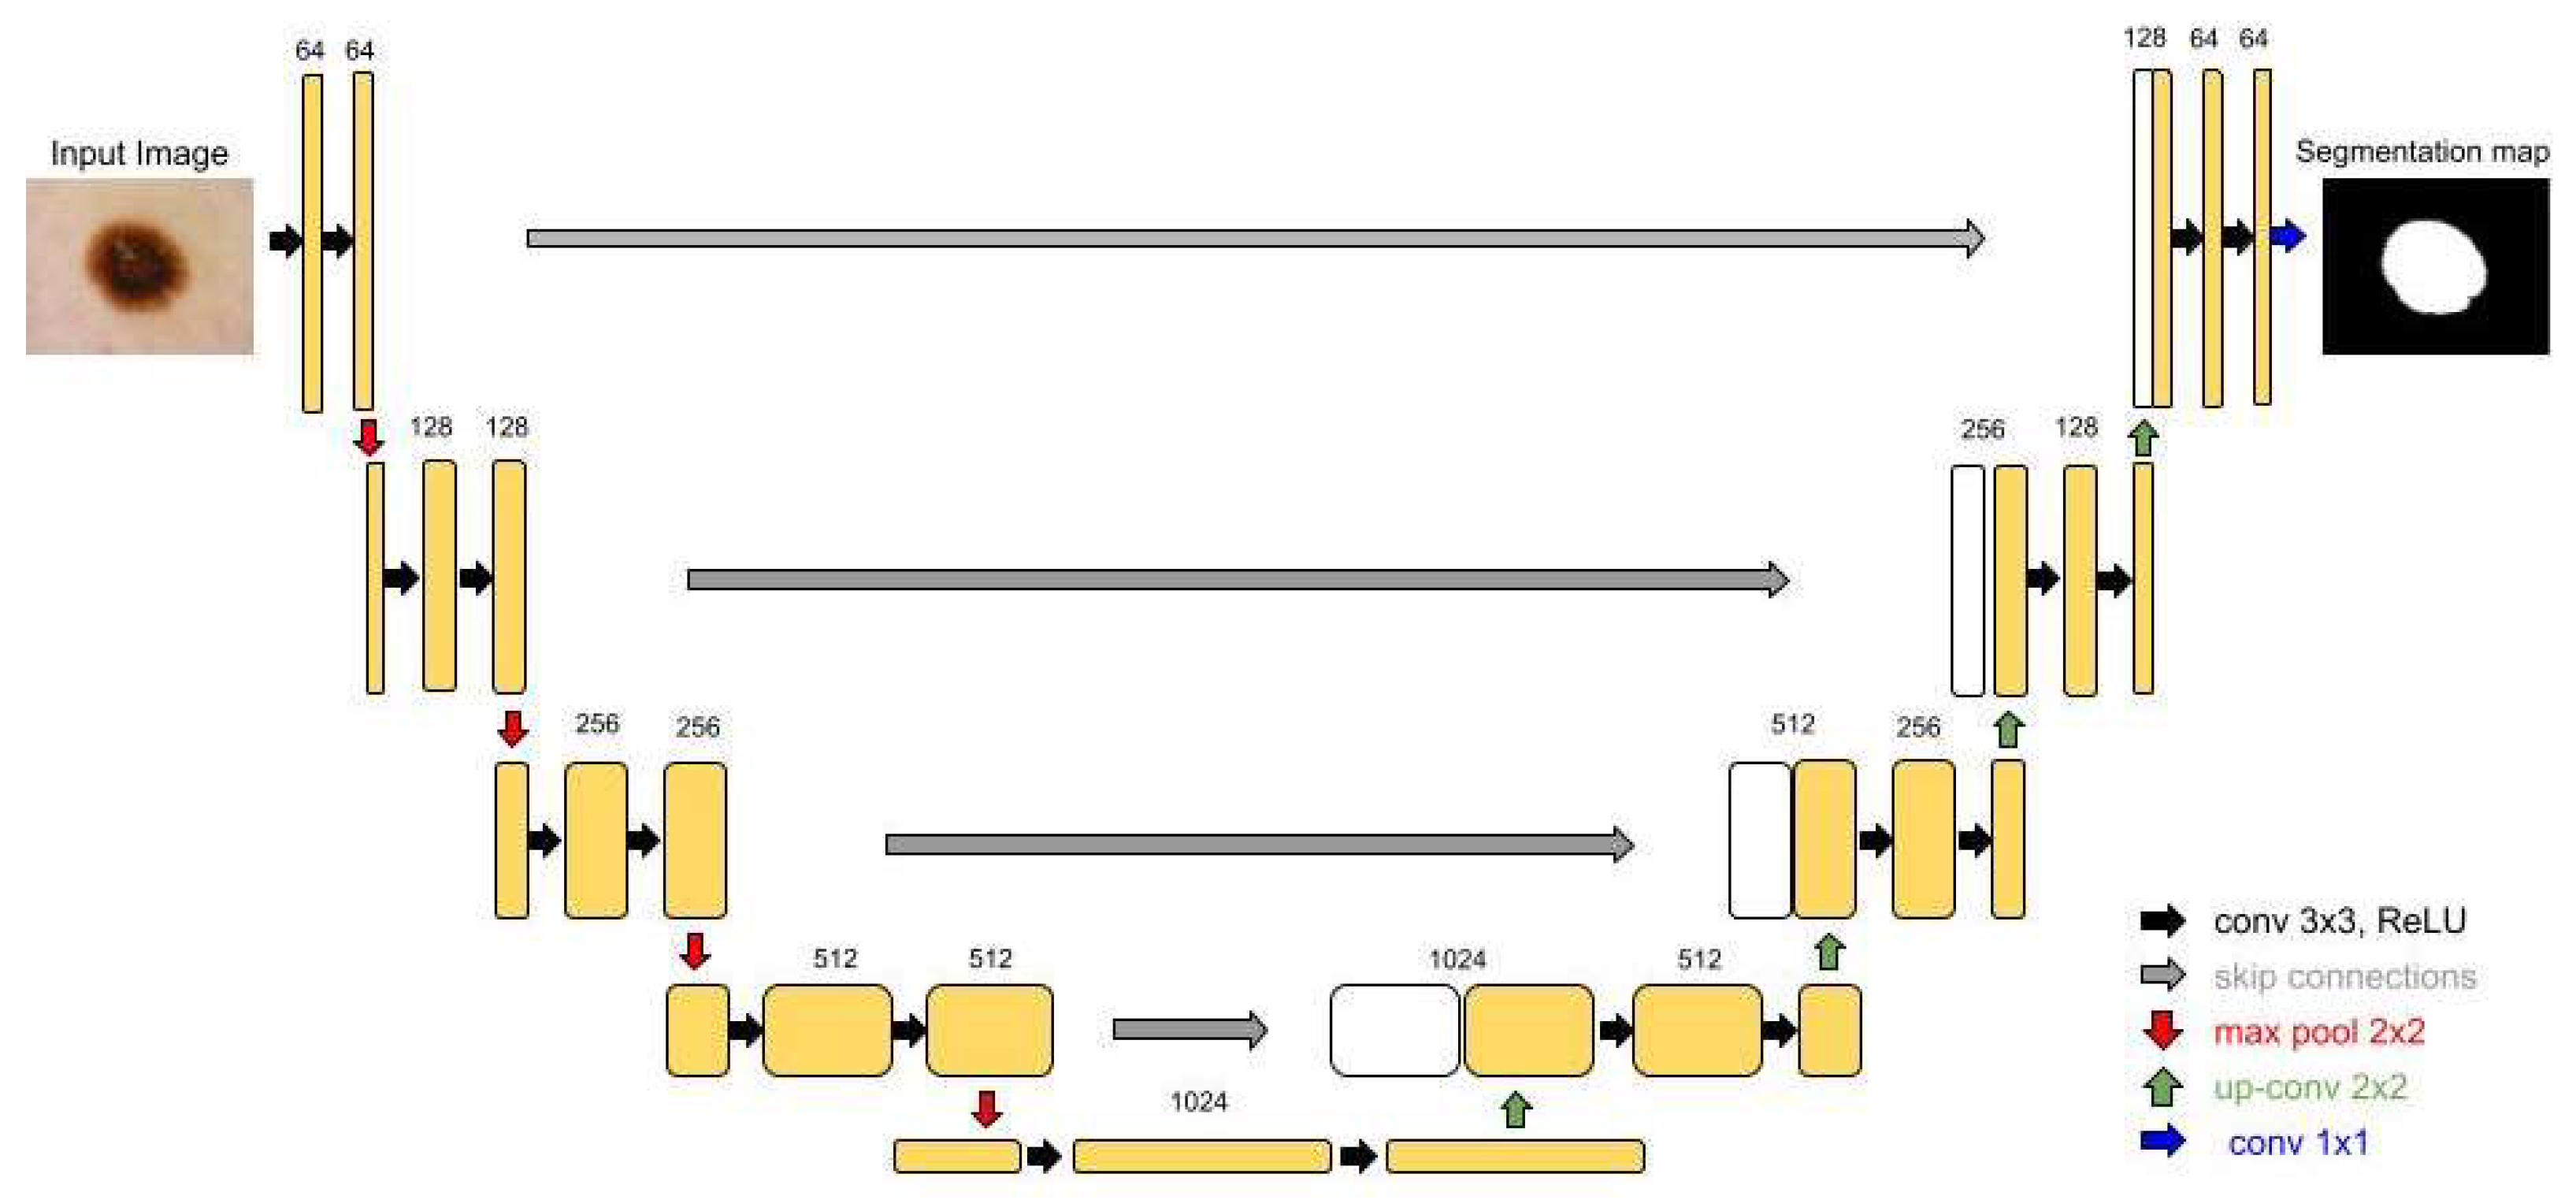
Figure 2.
Attention U-Net architecture.
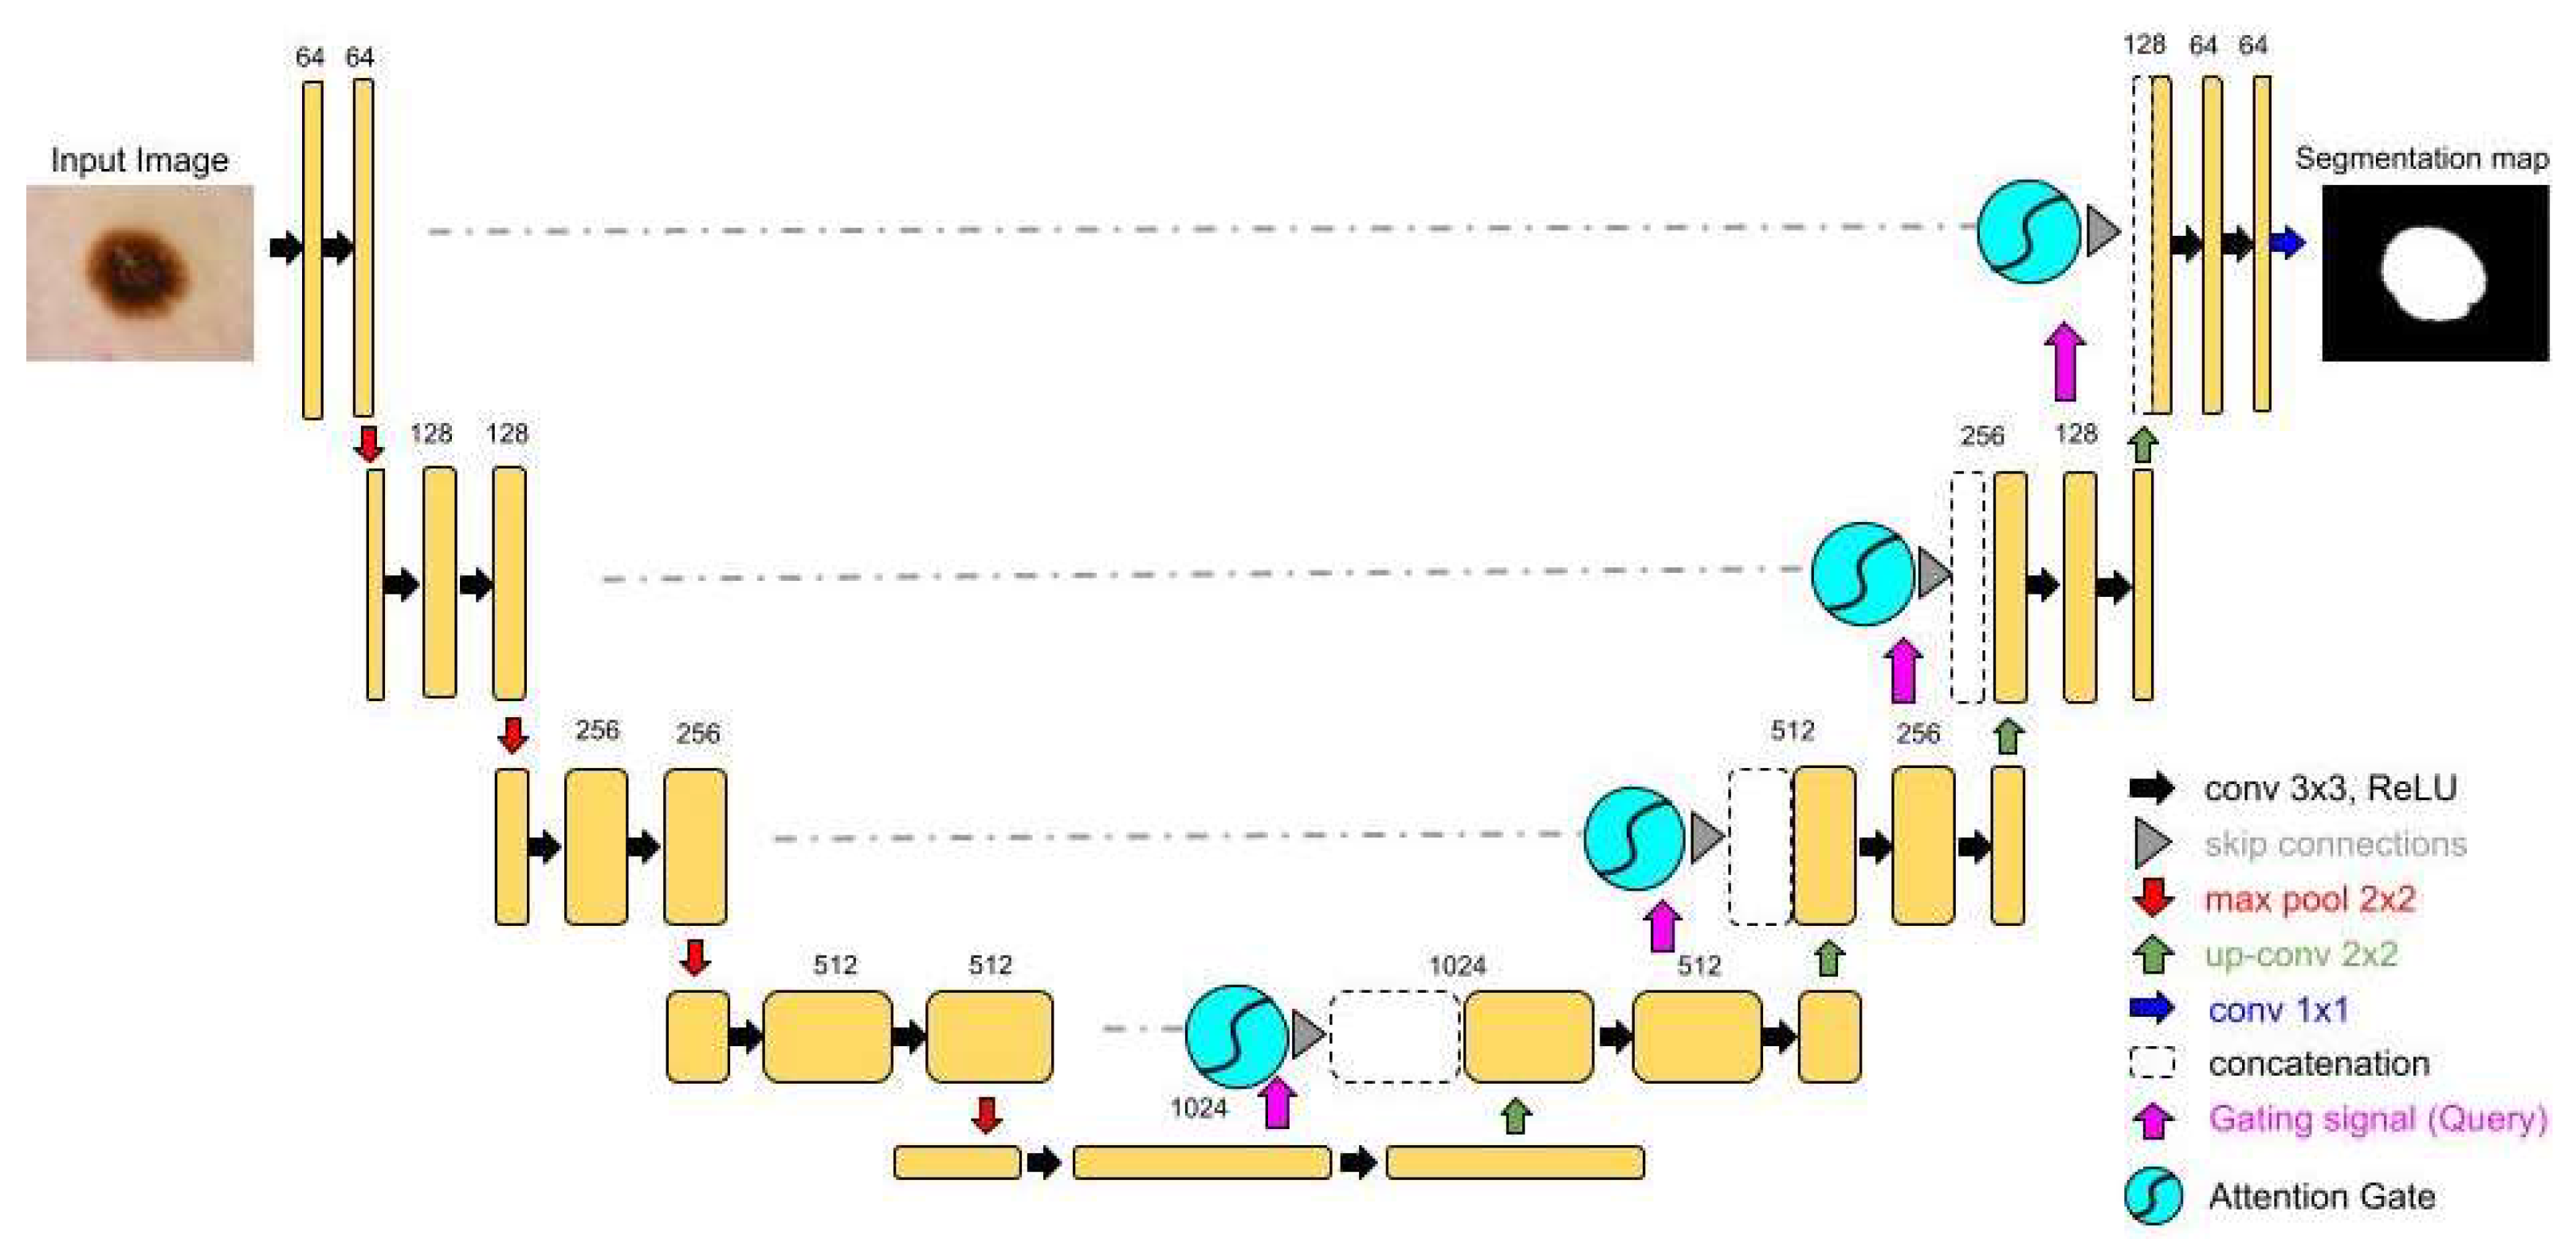
Figure 3.
(a) Residual Attention U-Net architecture; (b) ResNeXt block.
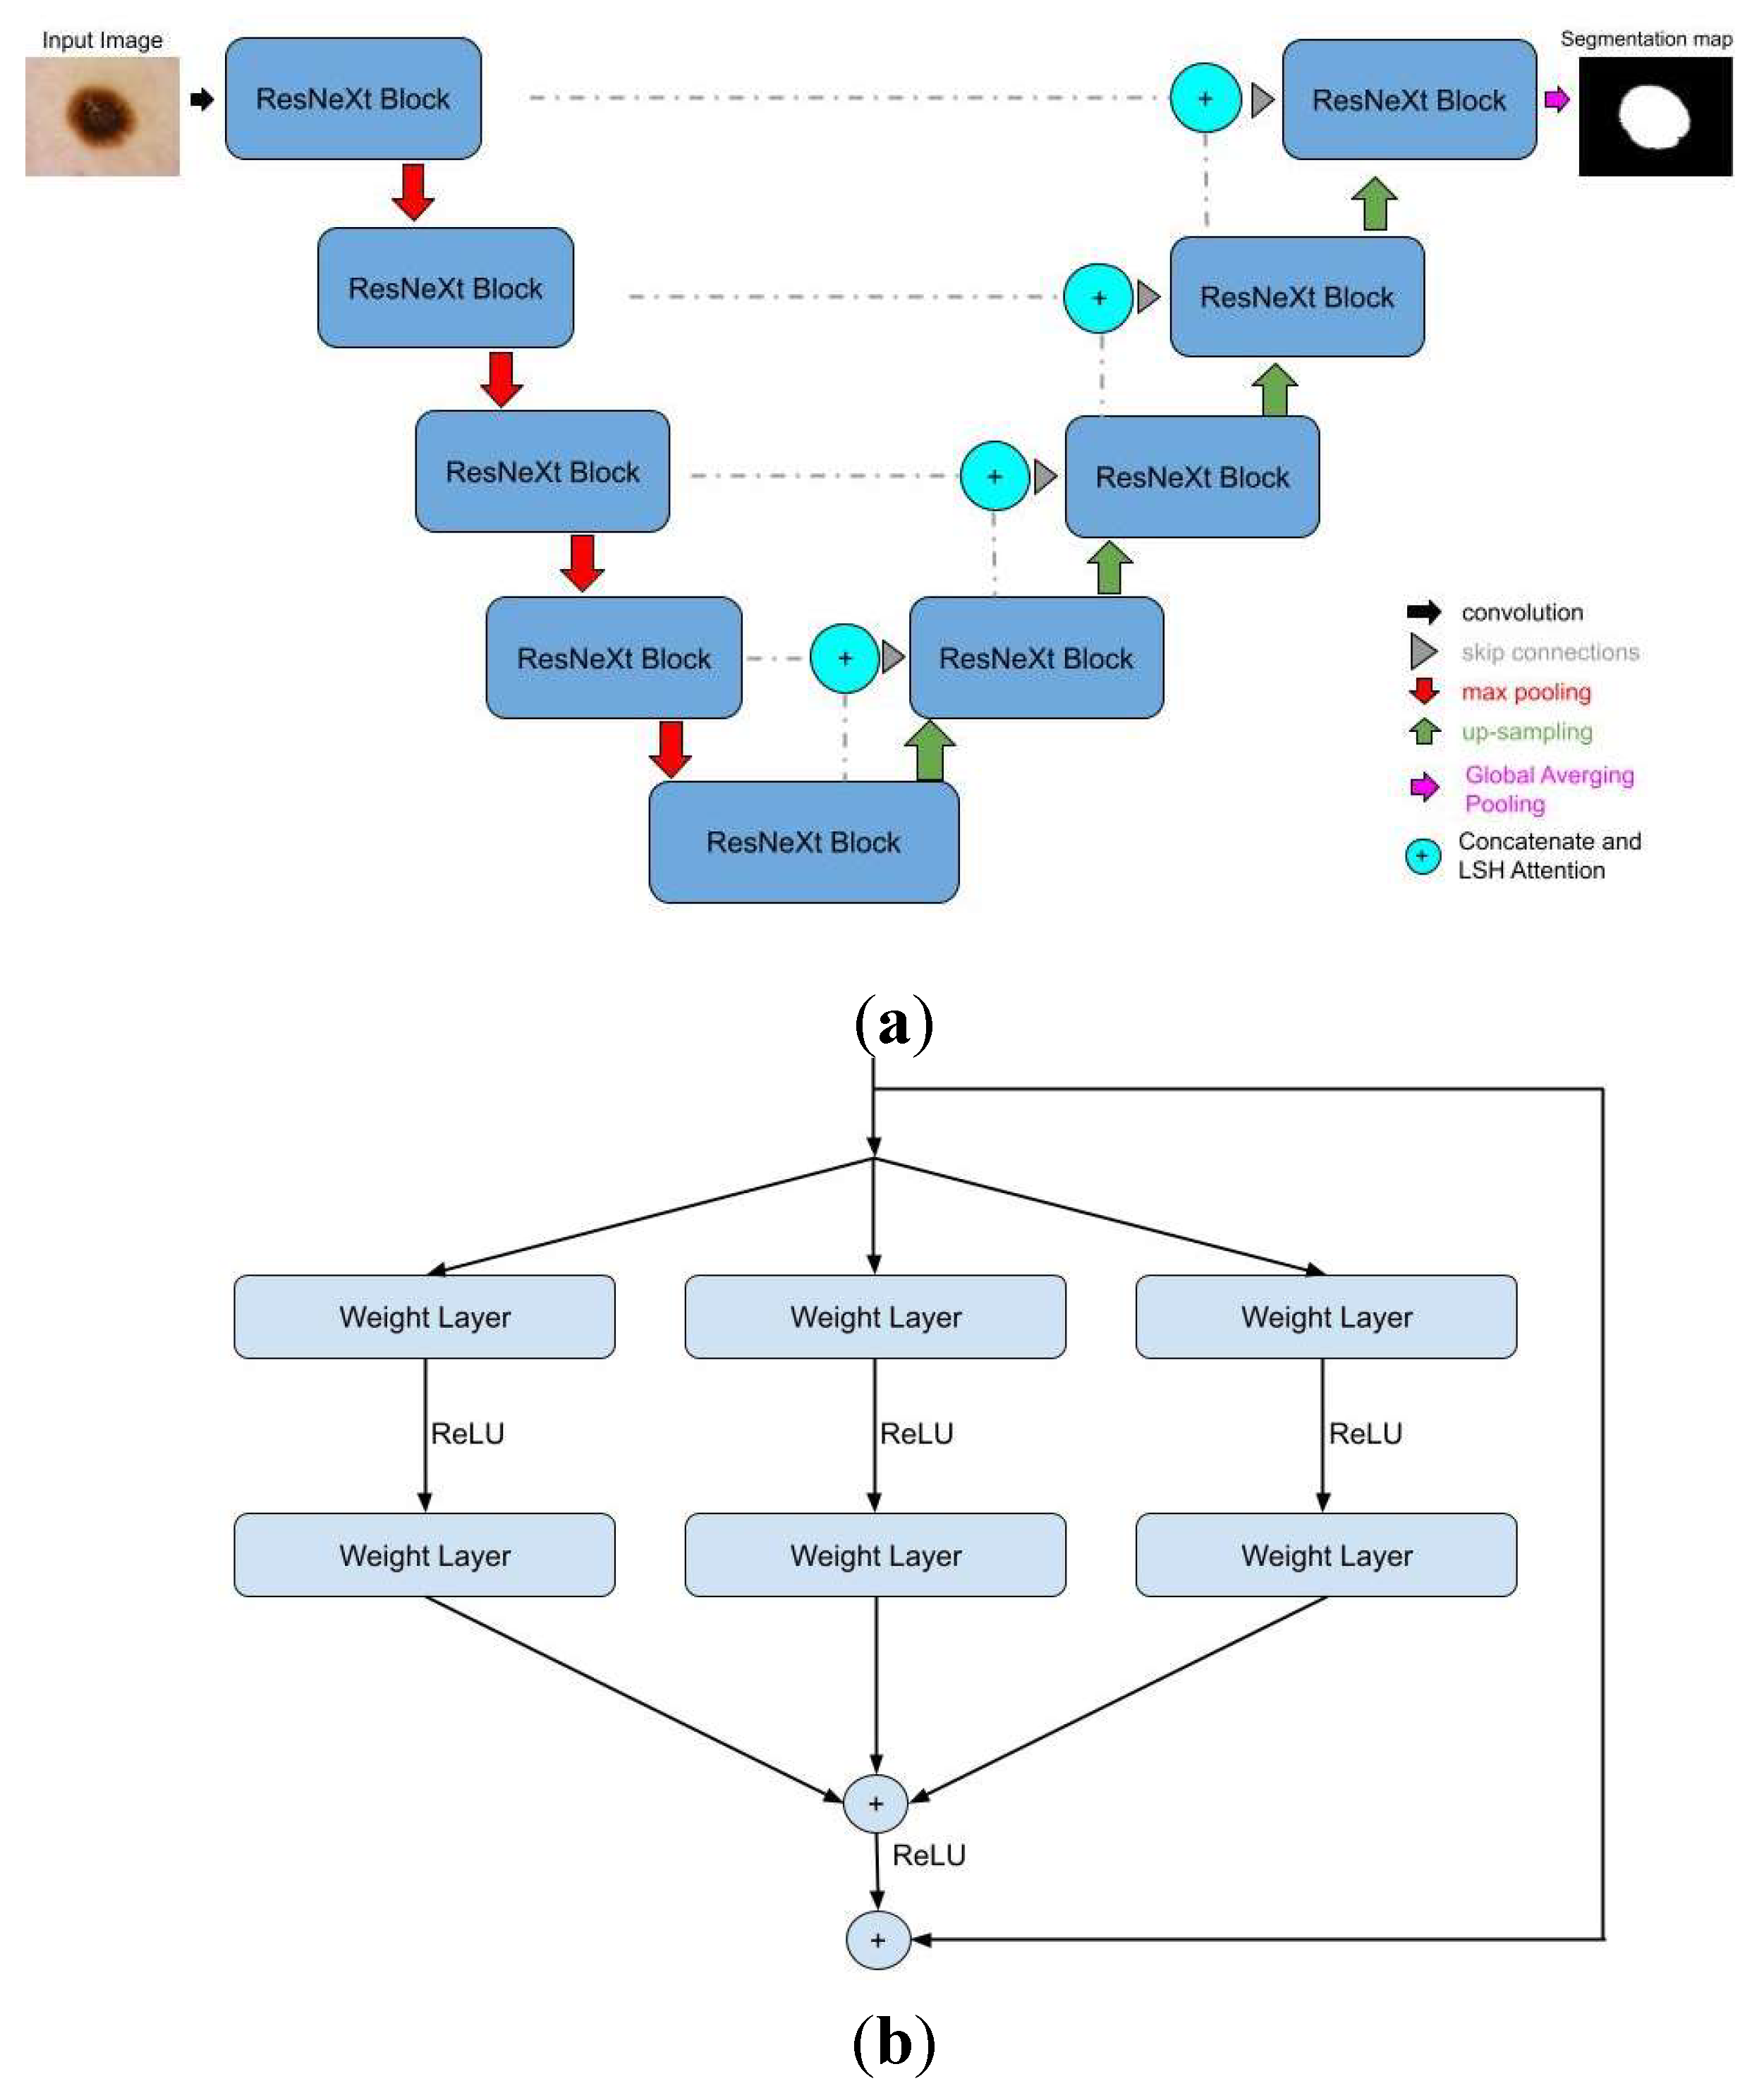
Figure 4.
(a) DeepLabV3+ architecture; (b) ASPP mechanism.
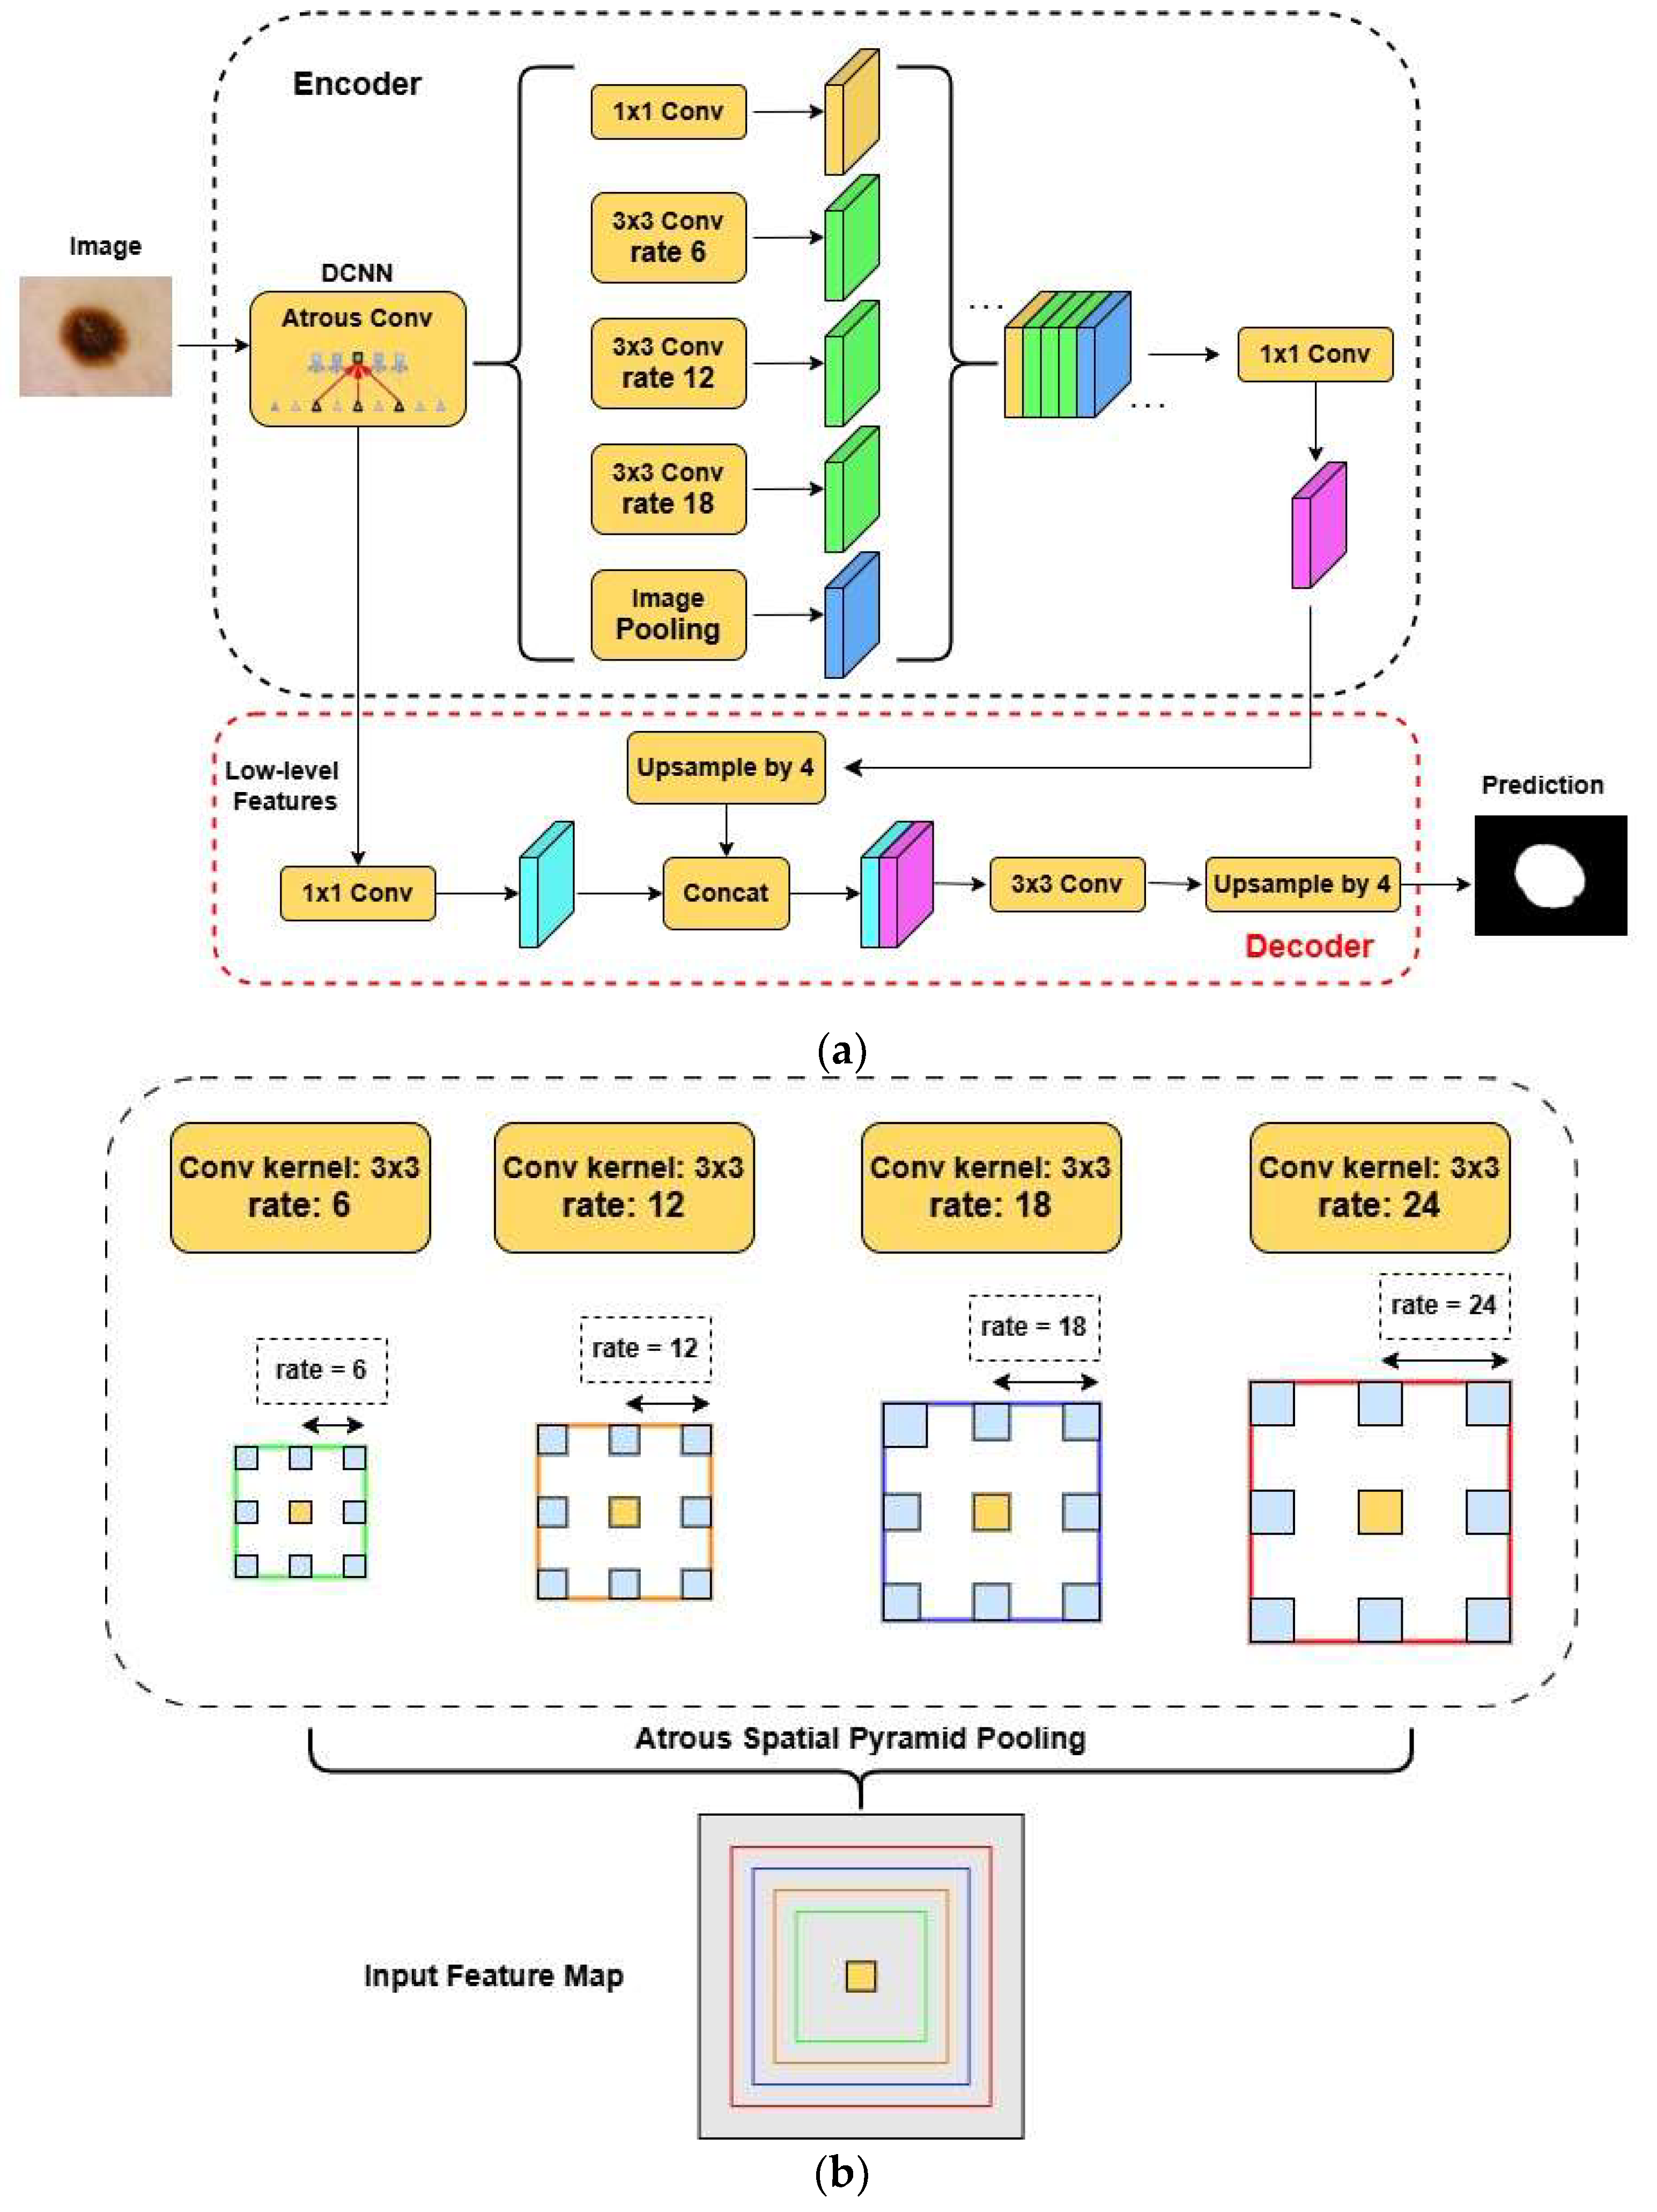
Figure 5.
Images from ISIC 2018 dataset.
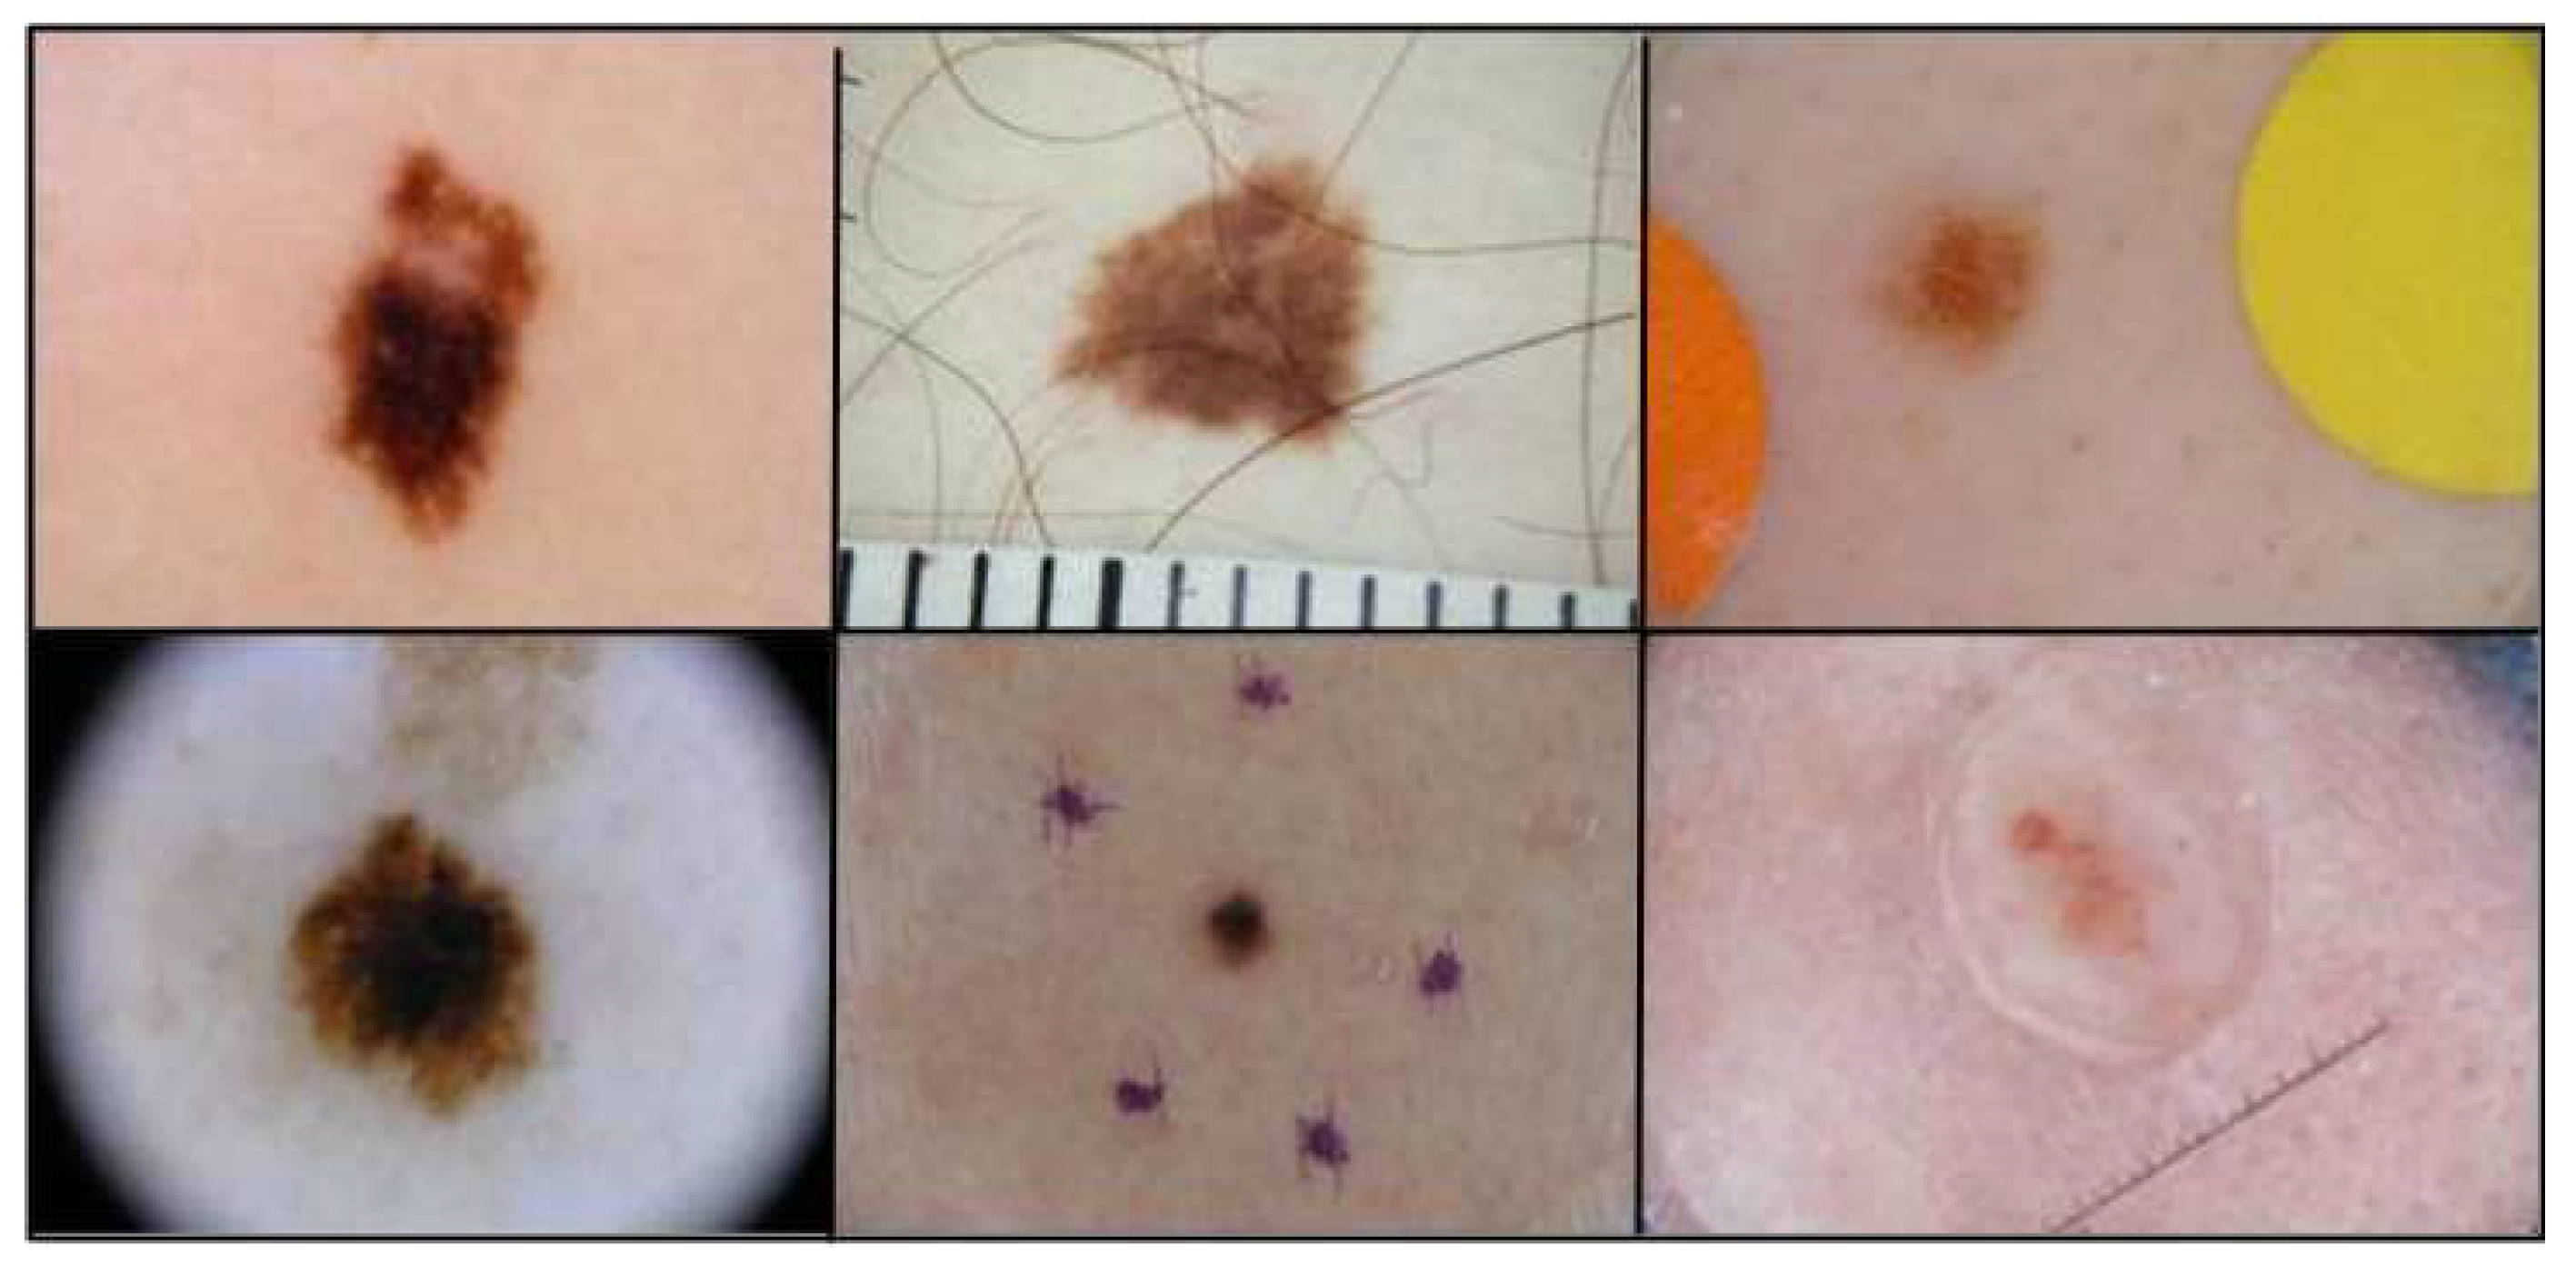
Figure 6.
Images from CBIS-DDSM dataset.
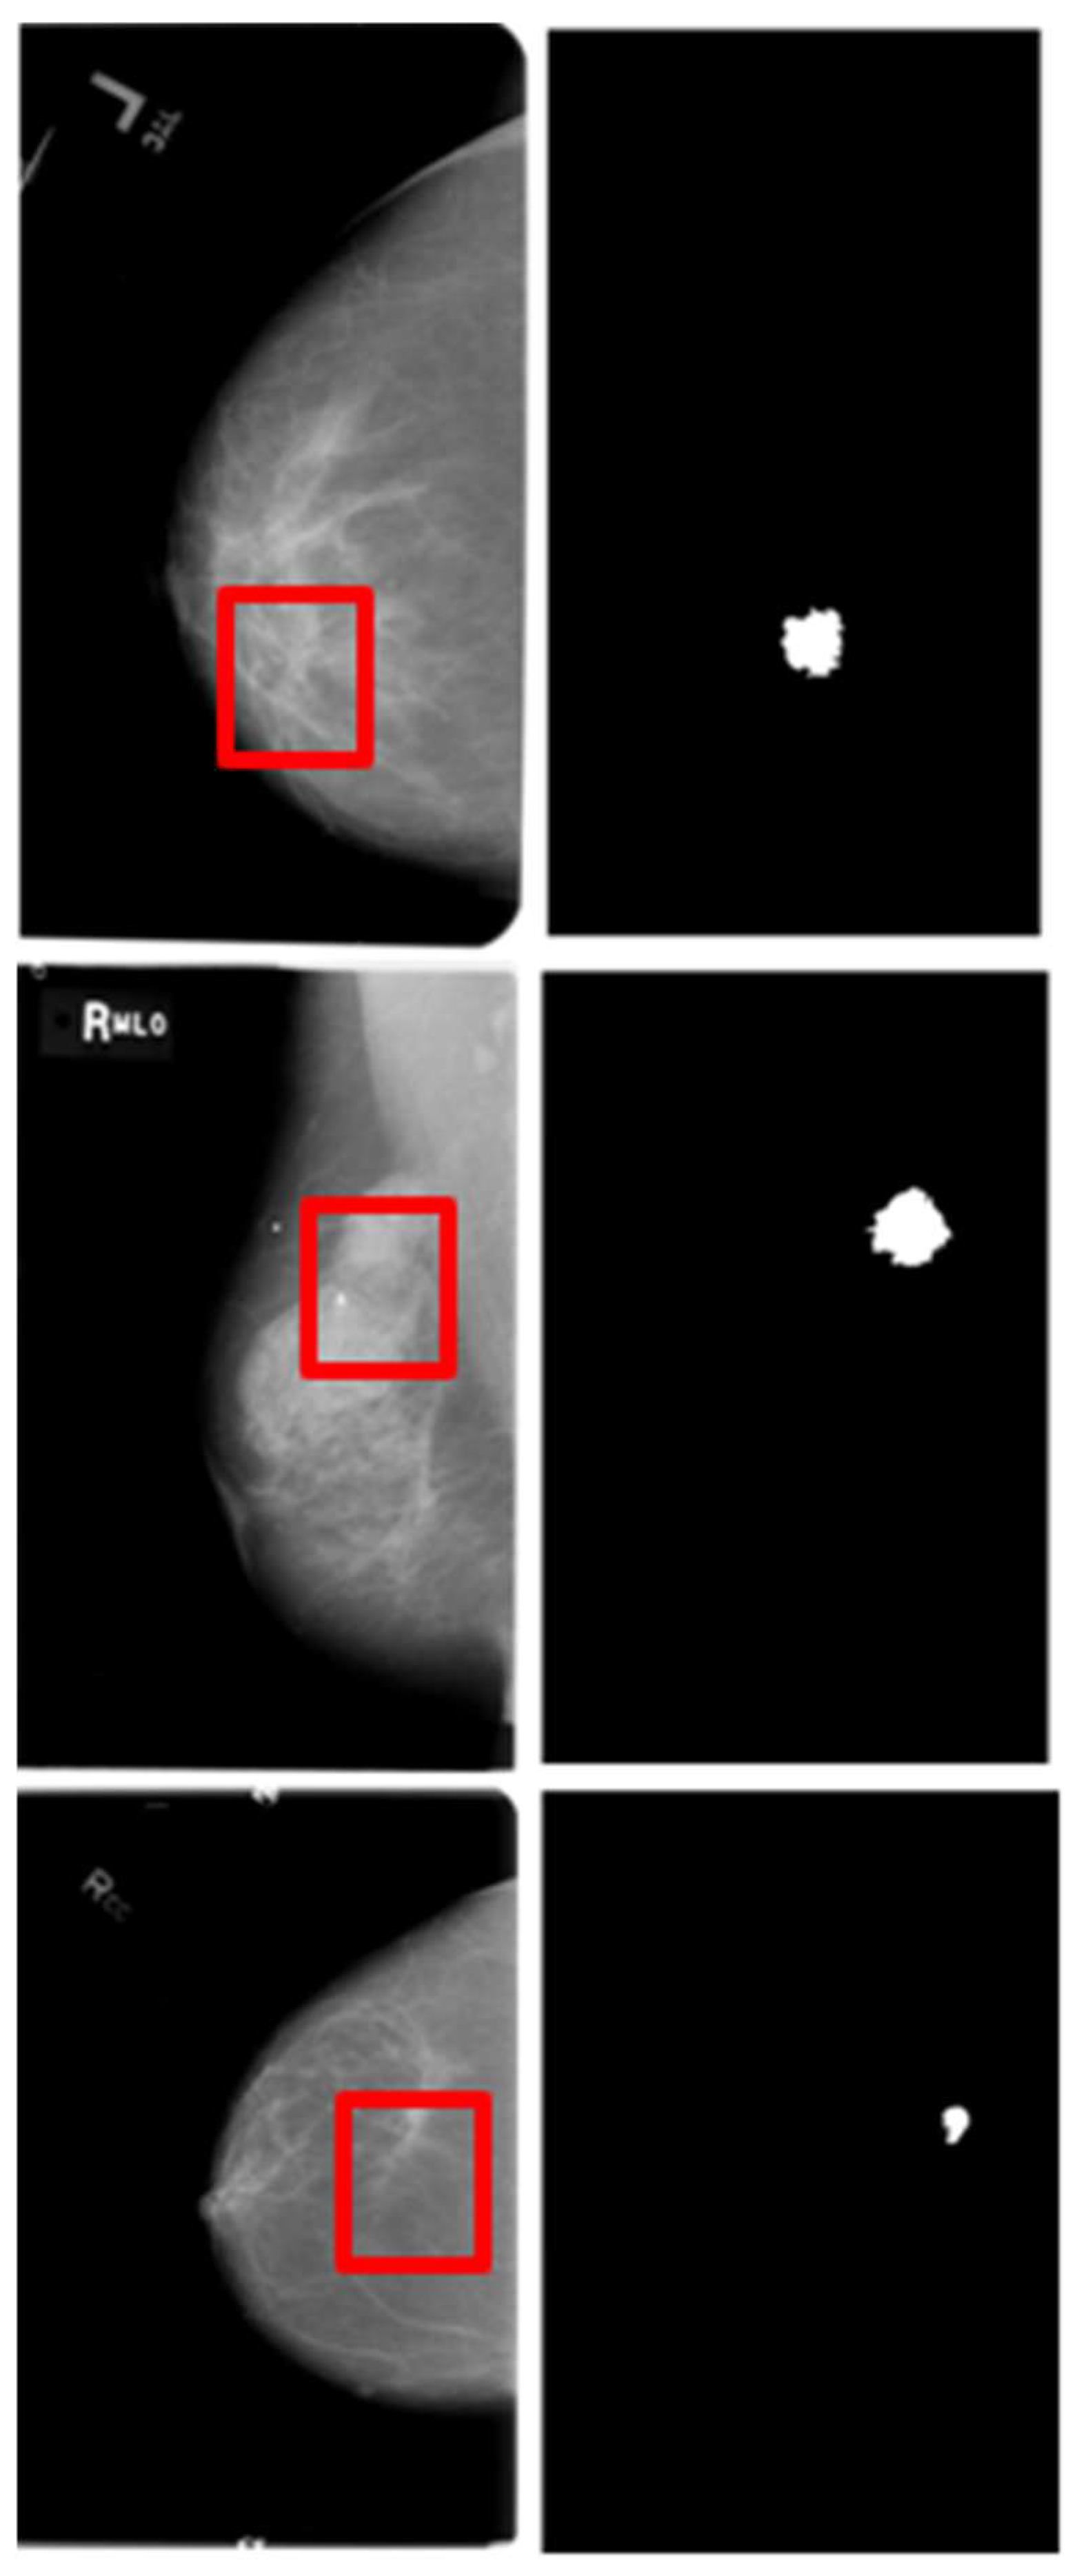
Figure 7.
Images from (a) Shenzhen Hospital CXR Set; (b) Montgomery County CXR Set.
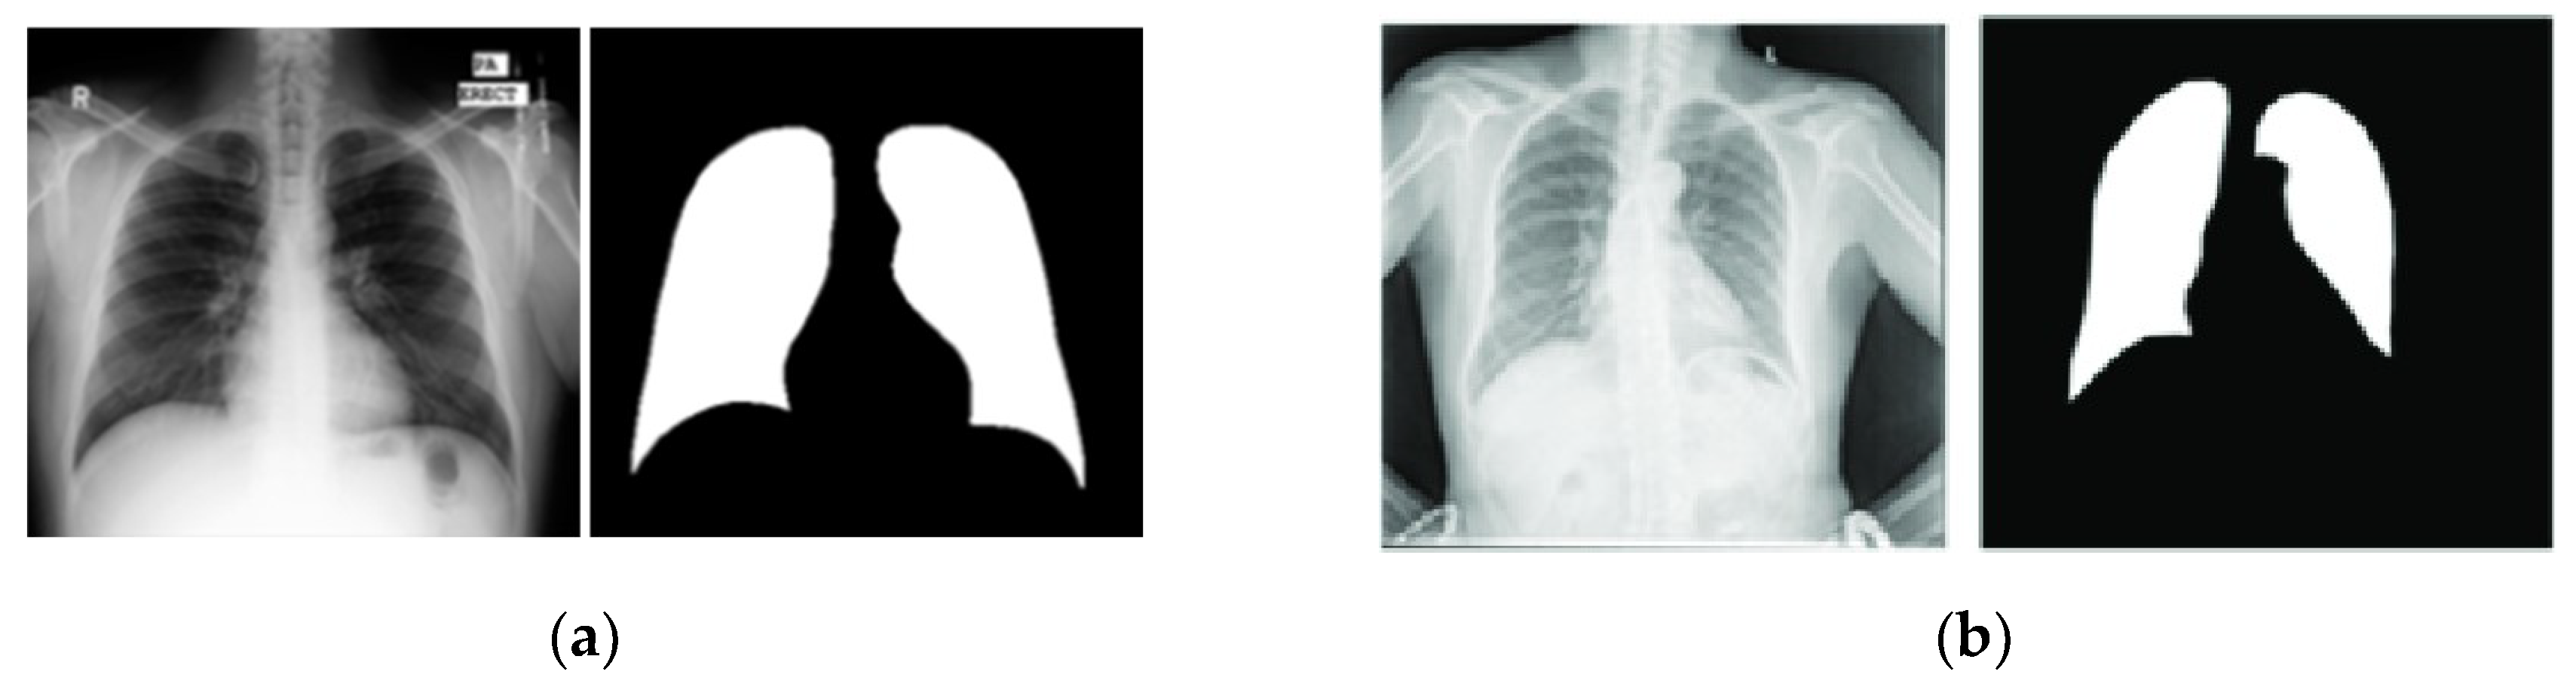
Figure 8.
Selected images with their respective masks, excluded from the ISIC 2018 data.
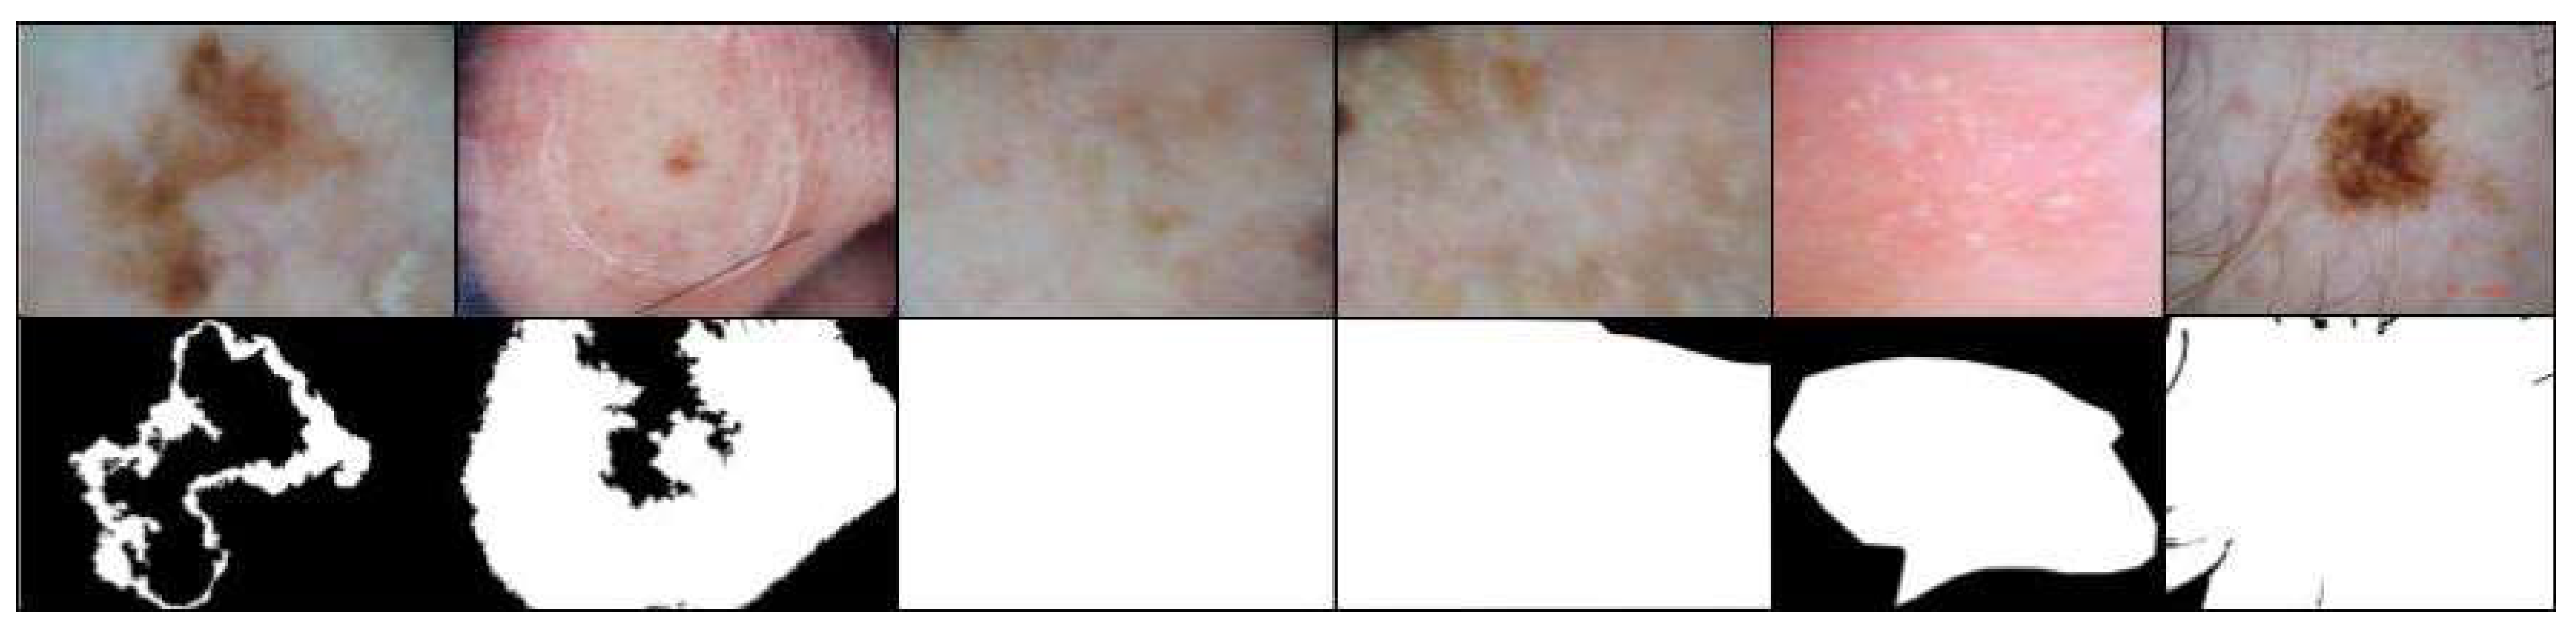
Figure 9.
(a) ISIC 2018 mask; (b) Mask created with semi-automatic methods.
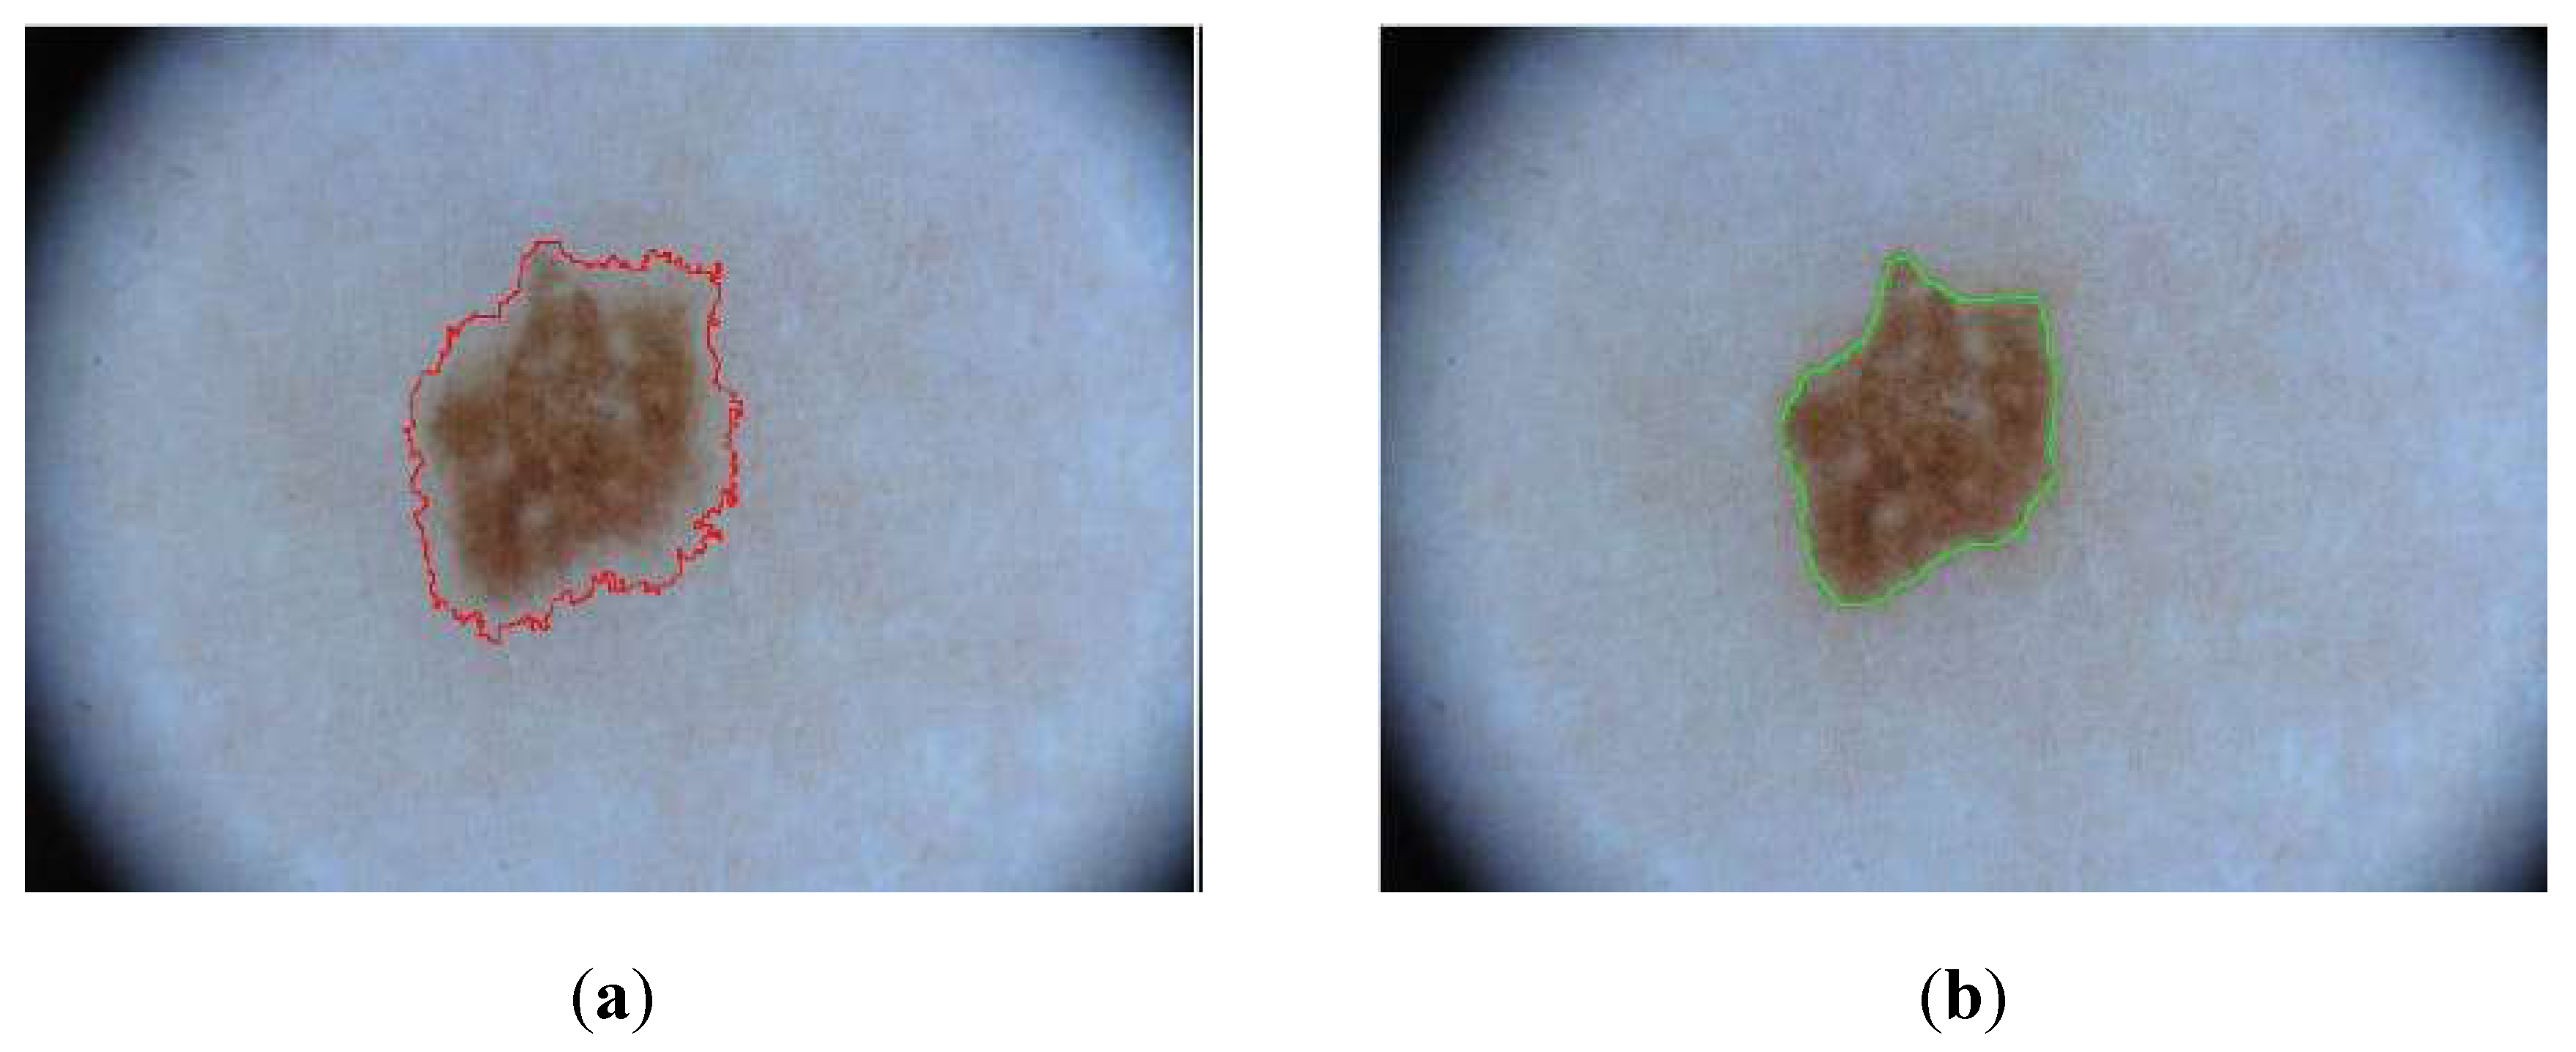
Figure 10.
Qualitative comparison of (a) U-Net and (b) DeepLabV3+ on the ISIC 2018 dataset.
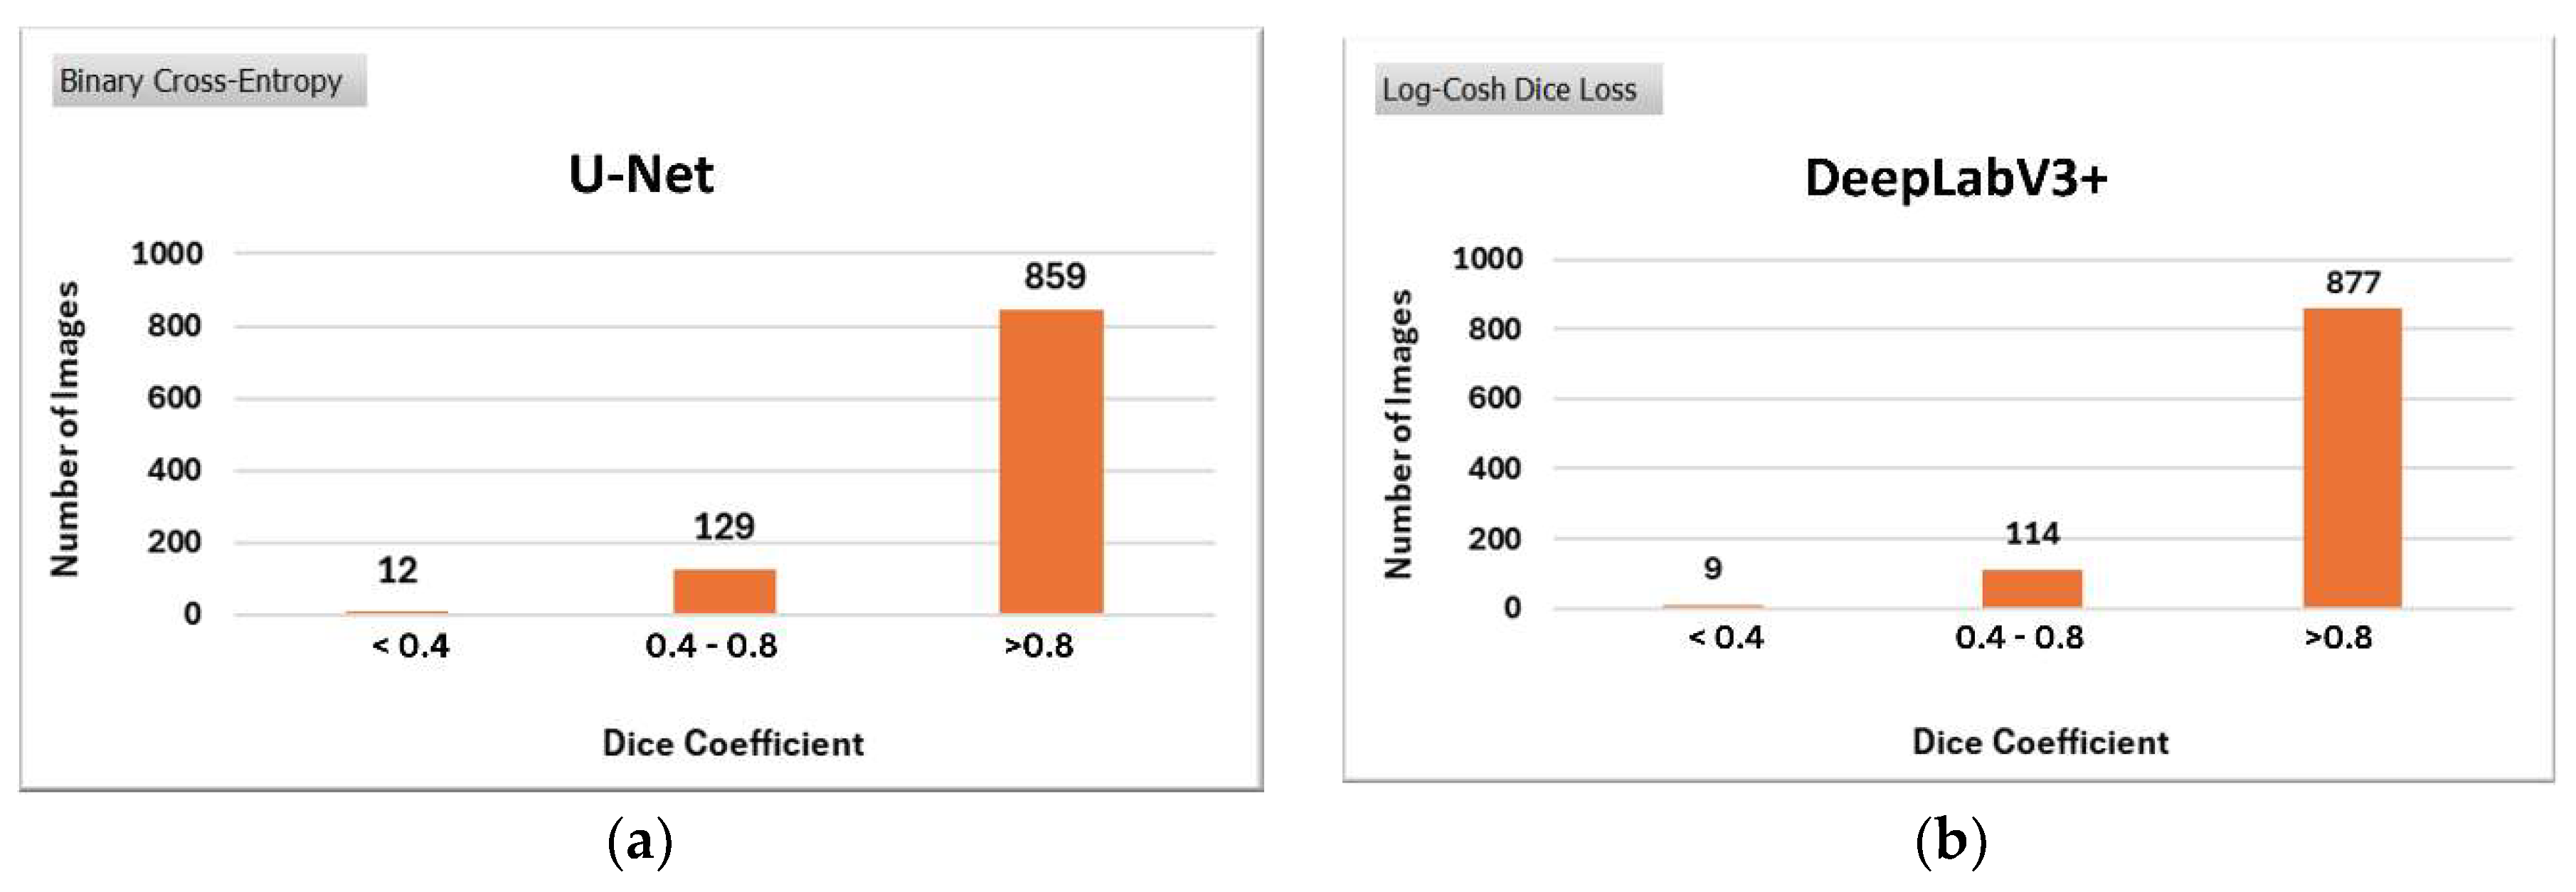
Figure 11.
Qualitative comparison of selected images from ISIC 2018.
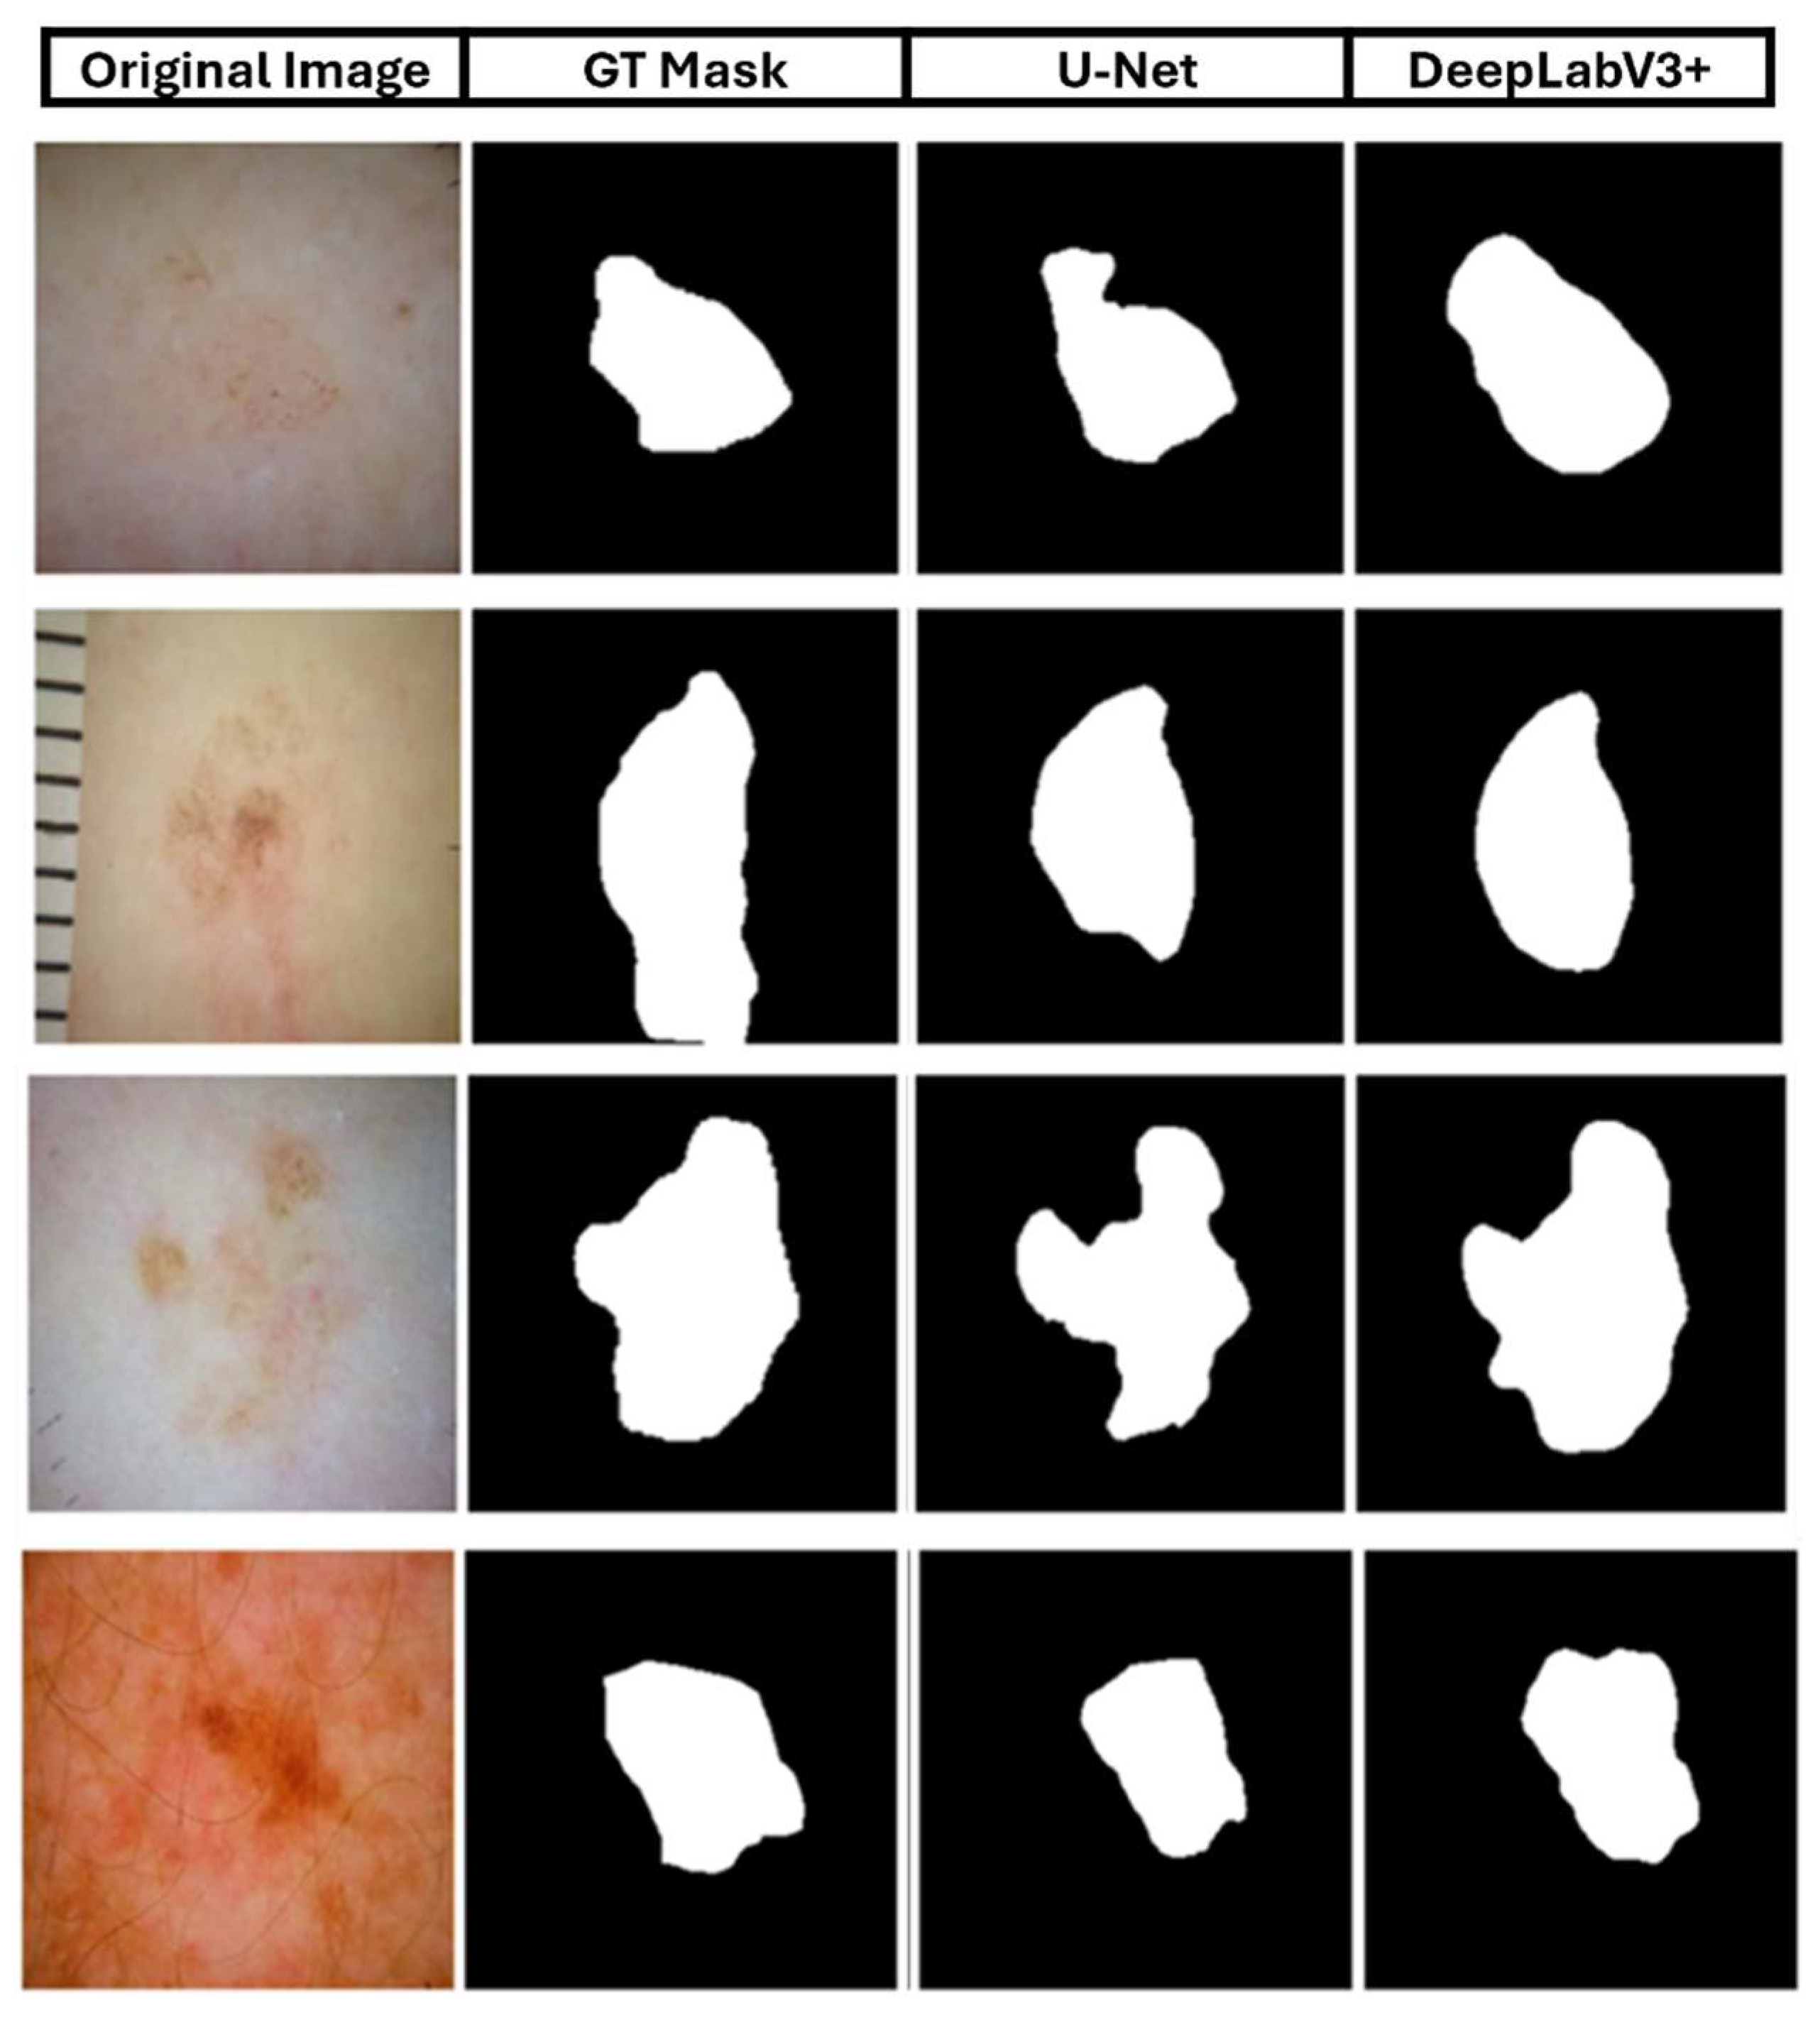
Figure 12.
Qualitative comparison of (a) U-Net and (b) DeepLabV3+ on the CBIS-DDSM dataset.
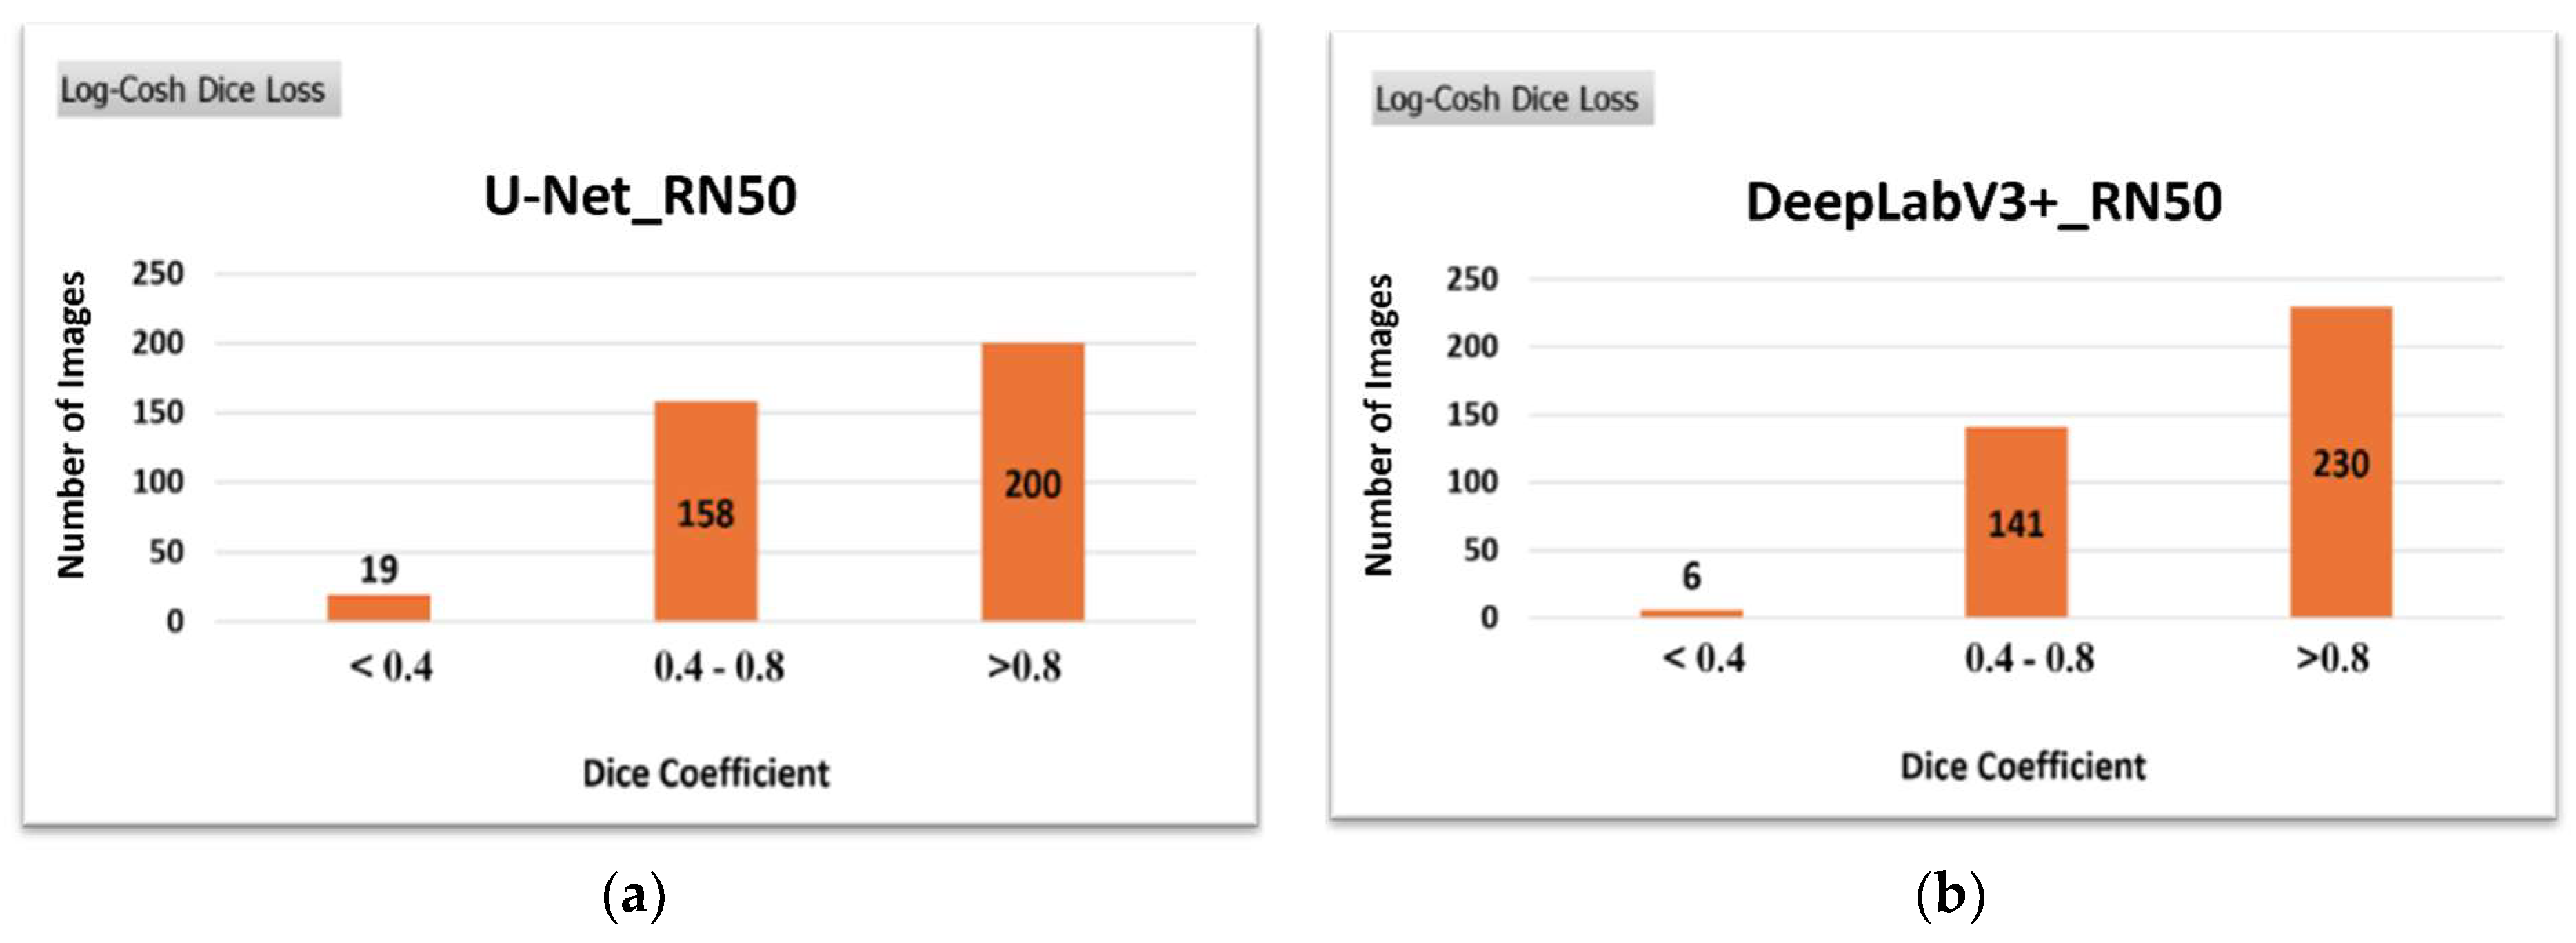
Figure 13.
Qualitative comparison of selected images from CBIS-DDSM.
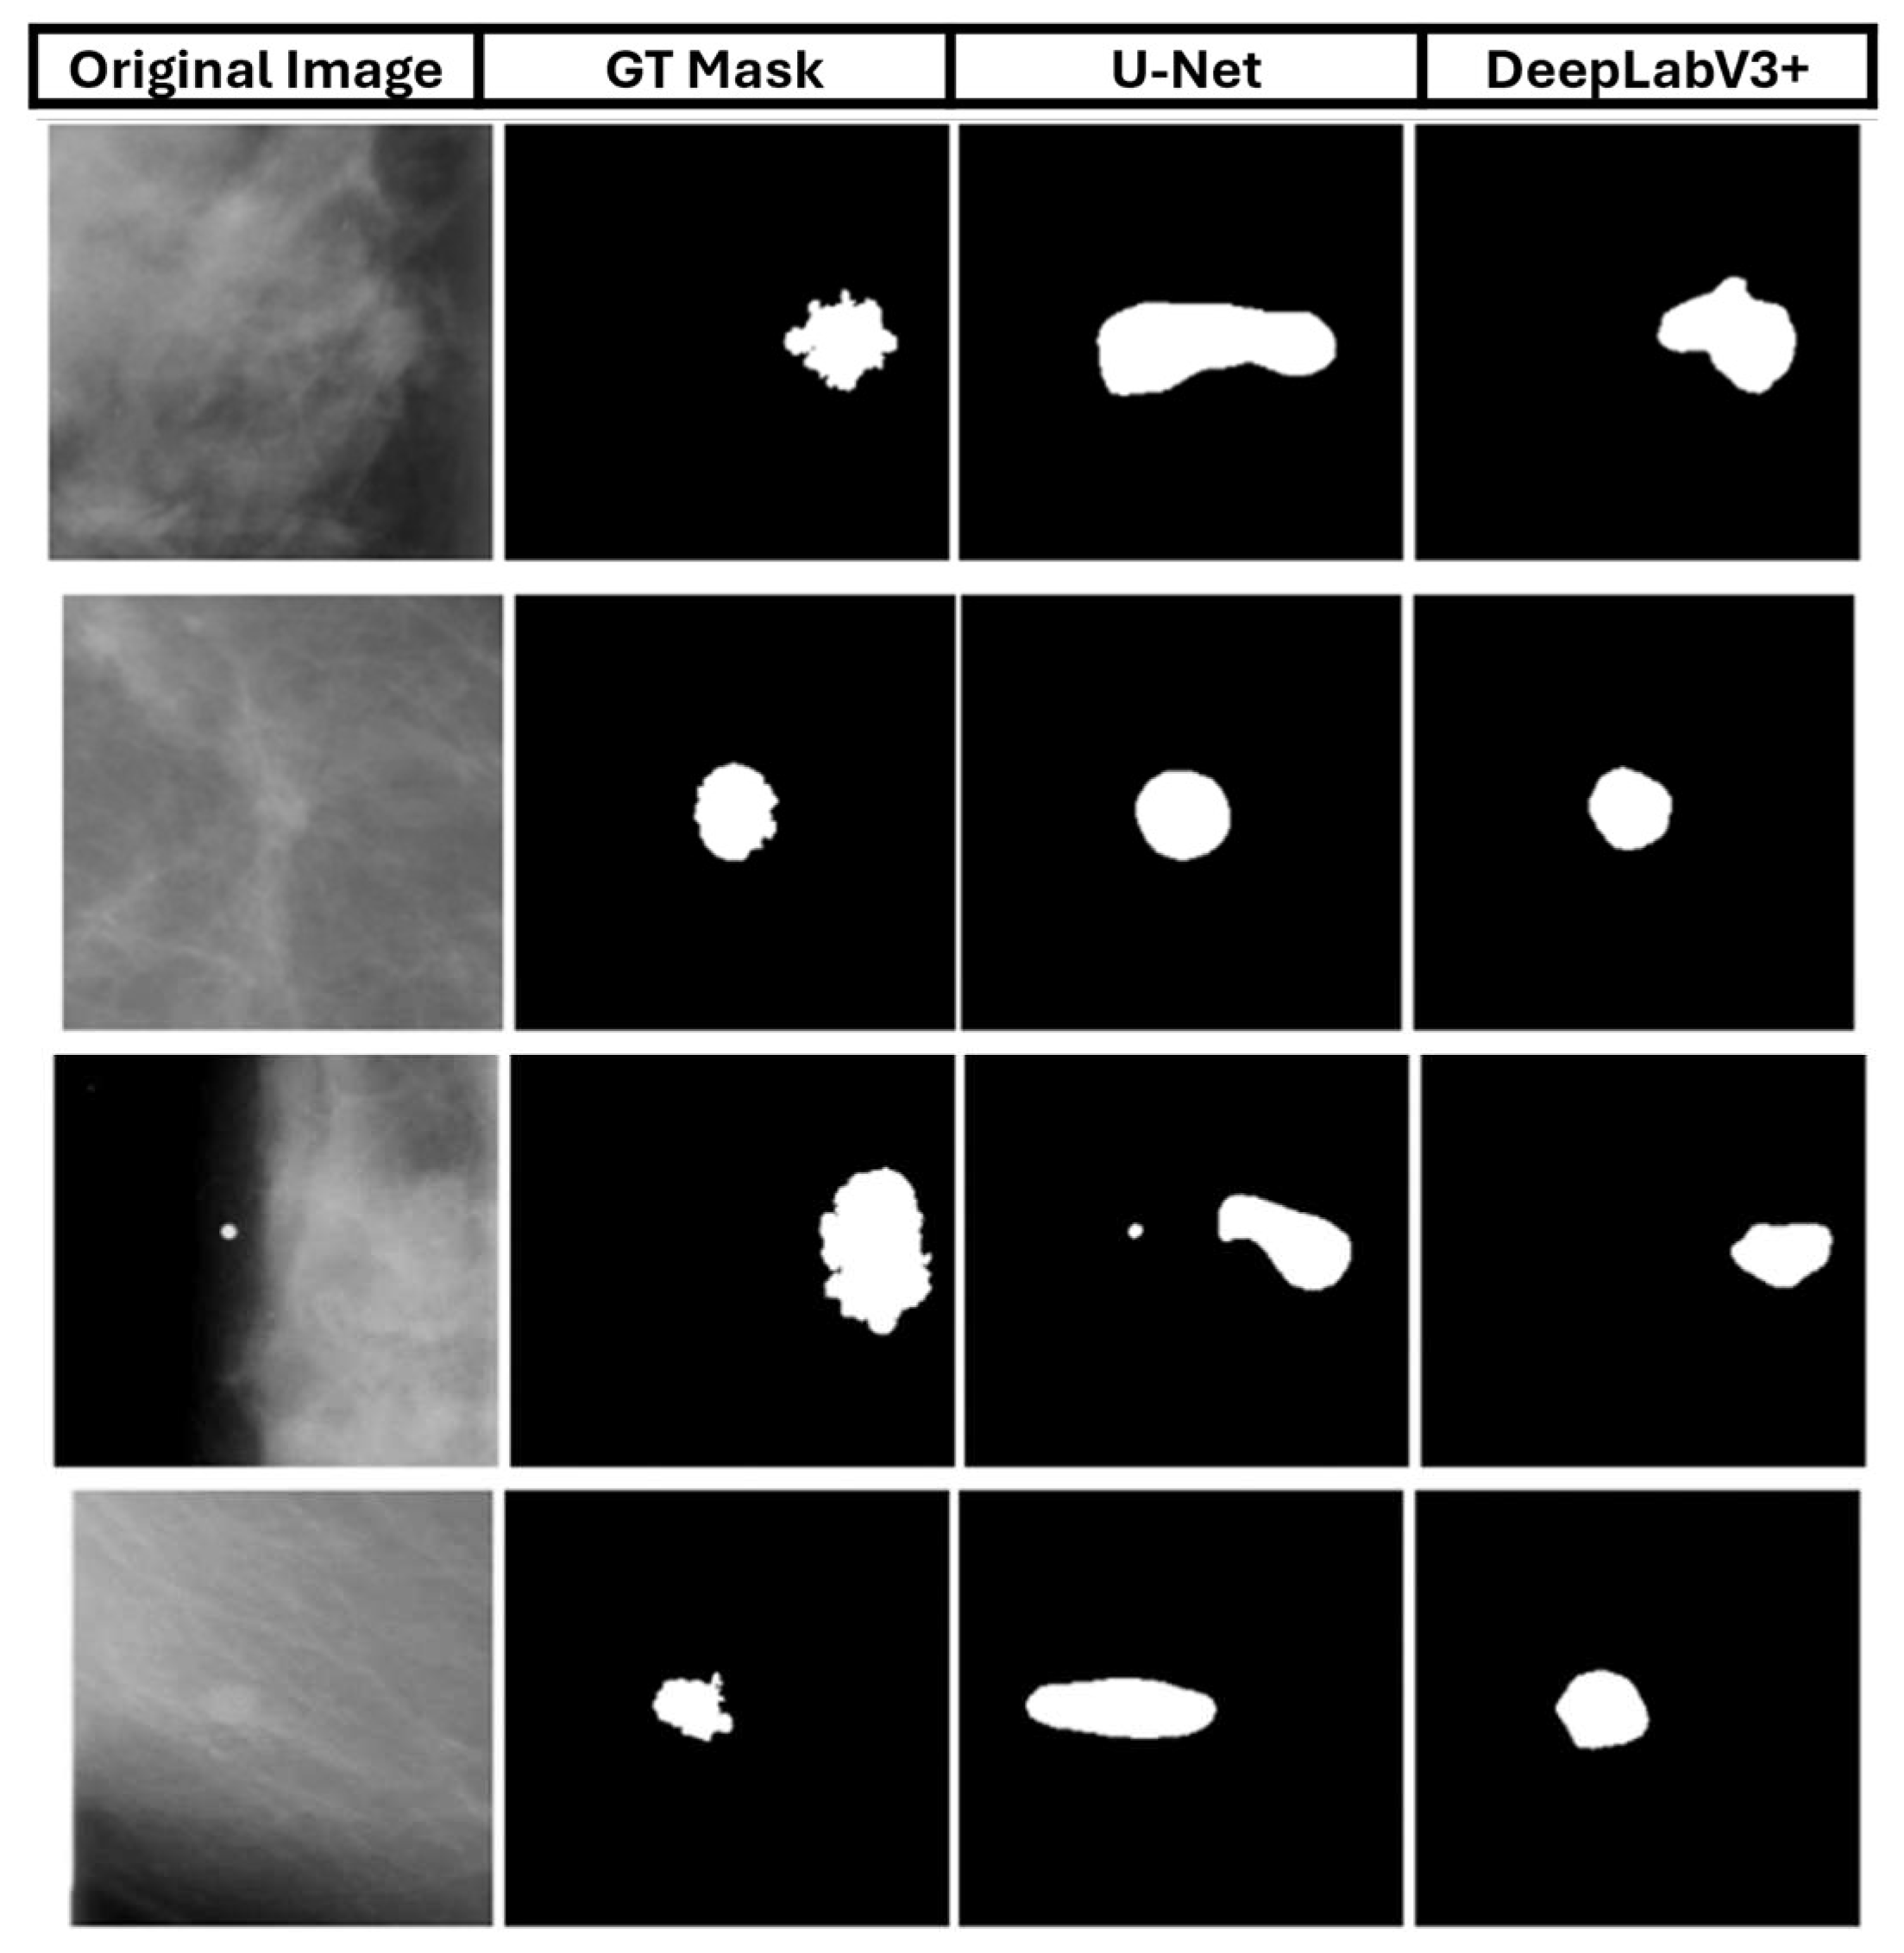
Figure 14.
Qualitative comparison of (a) U-Net and (b) DeepLabV3+ on the Montgomery dataset.
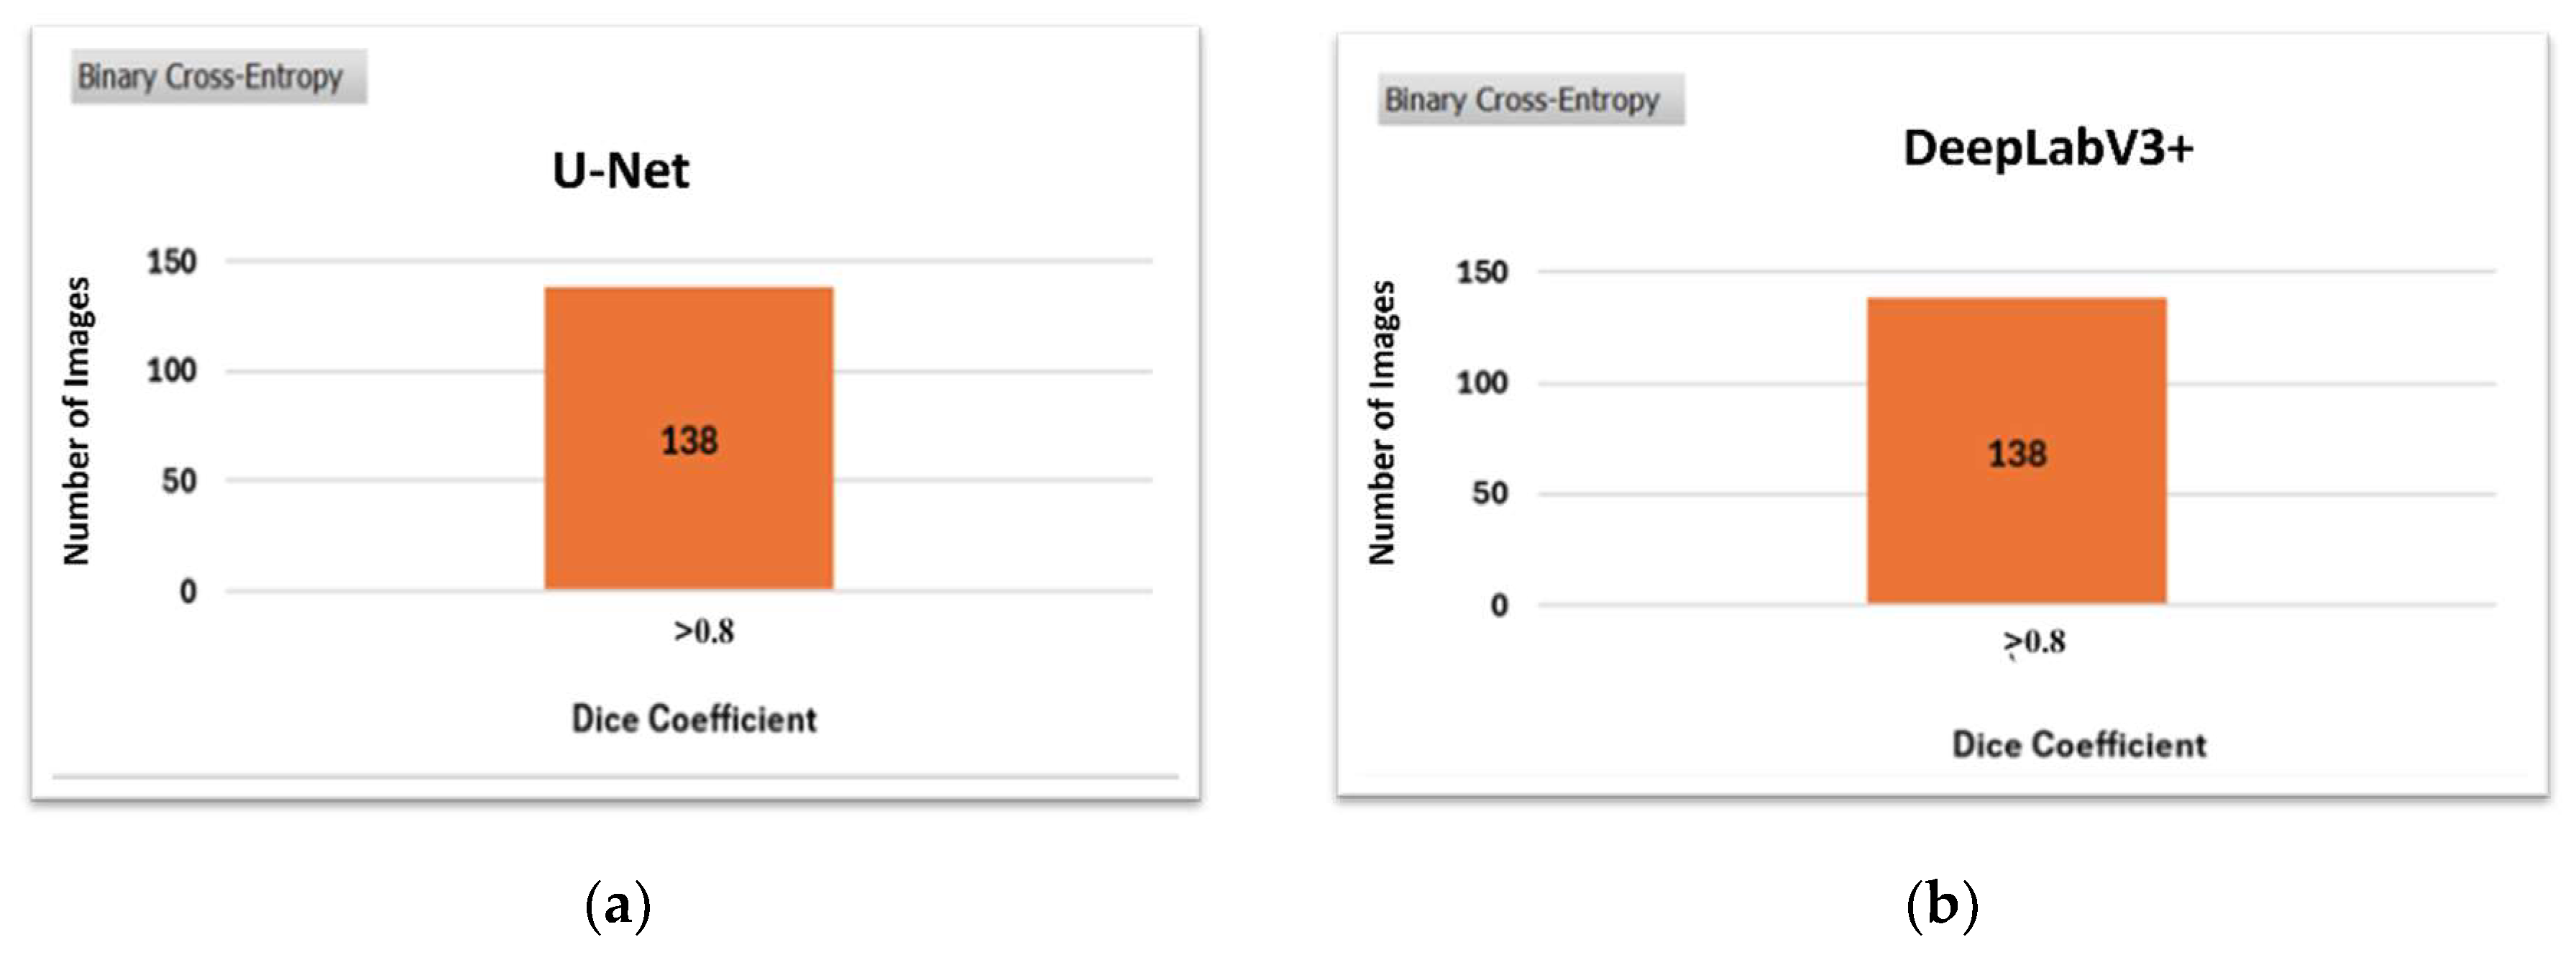
Figure 15.
Qualitative comparison of selected images from the Montgomery dataset.
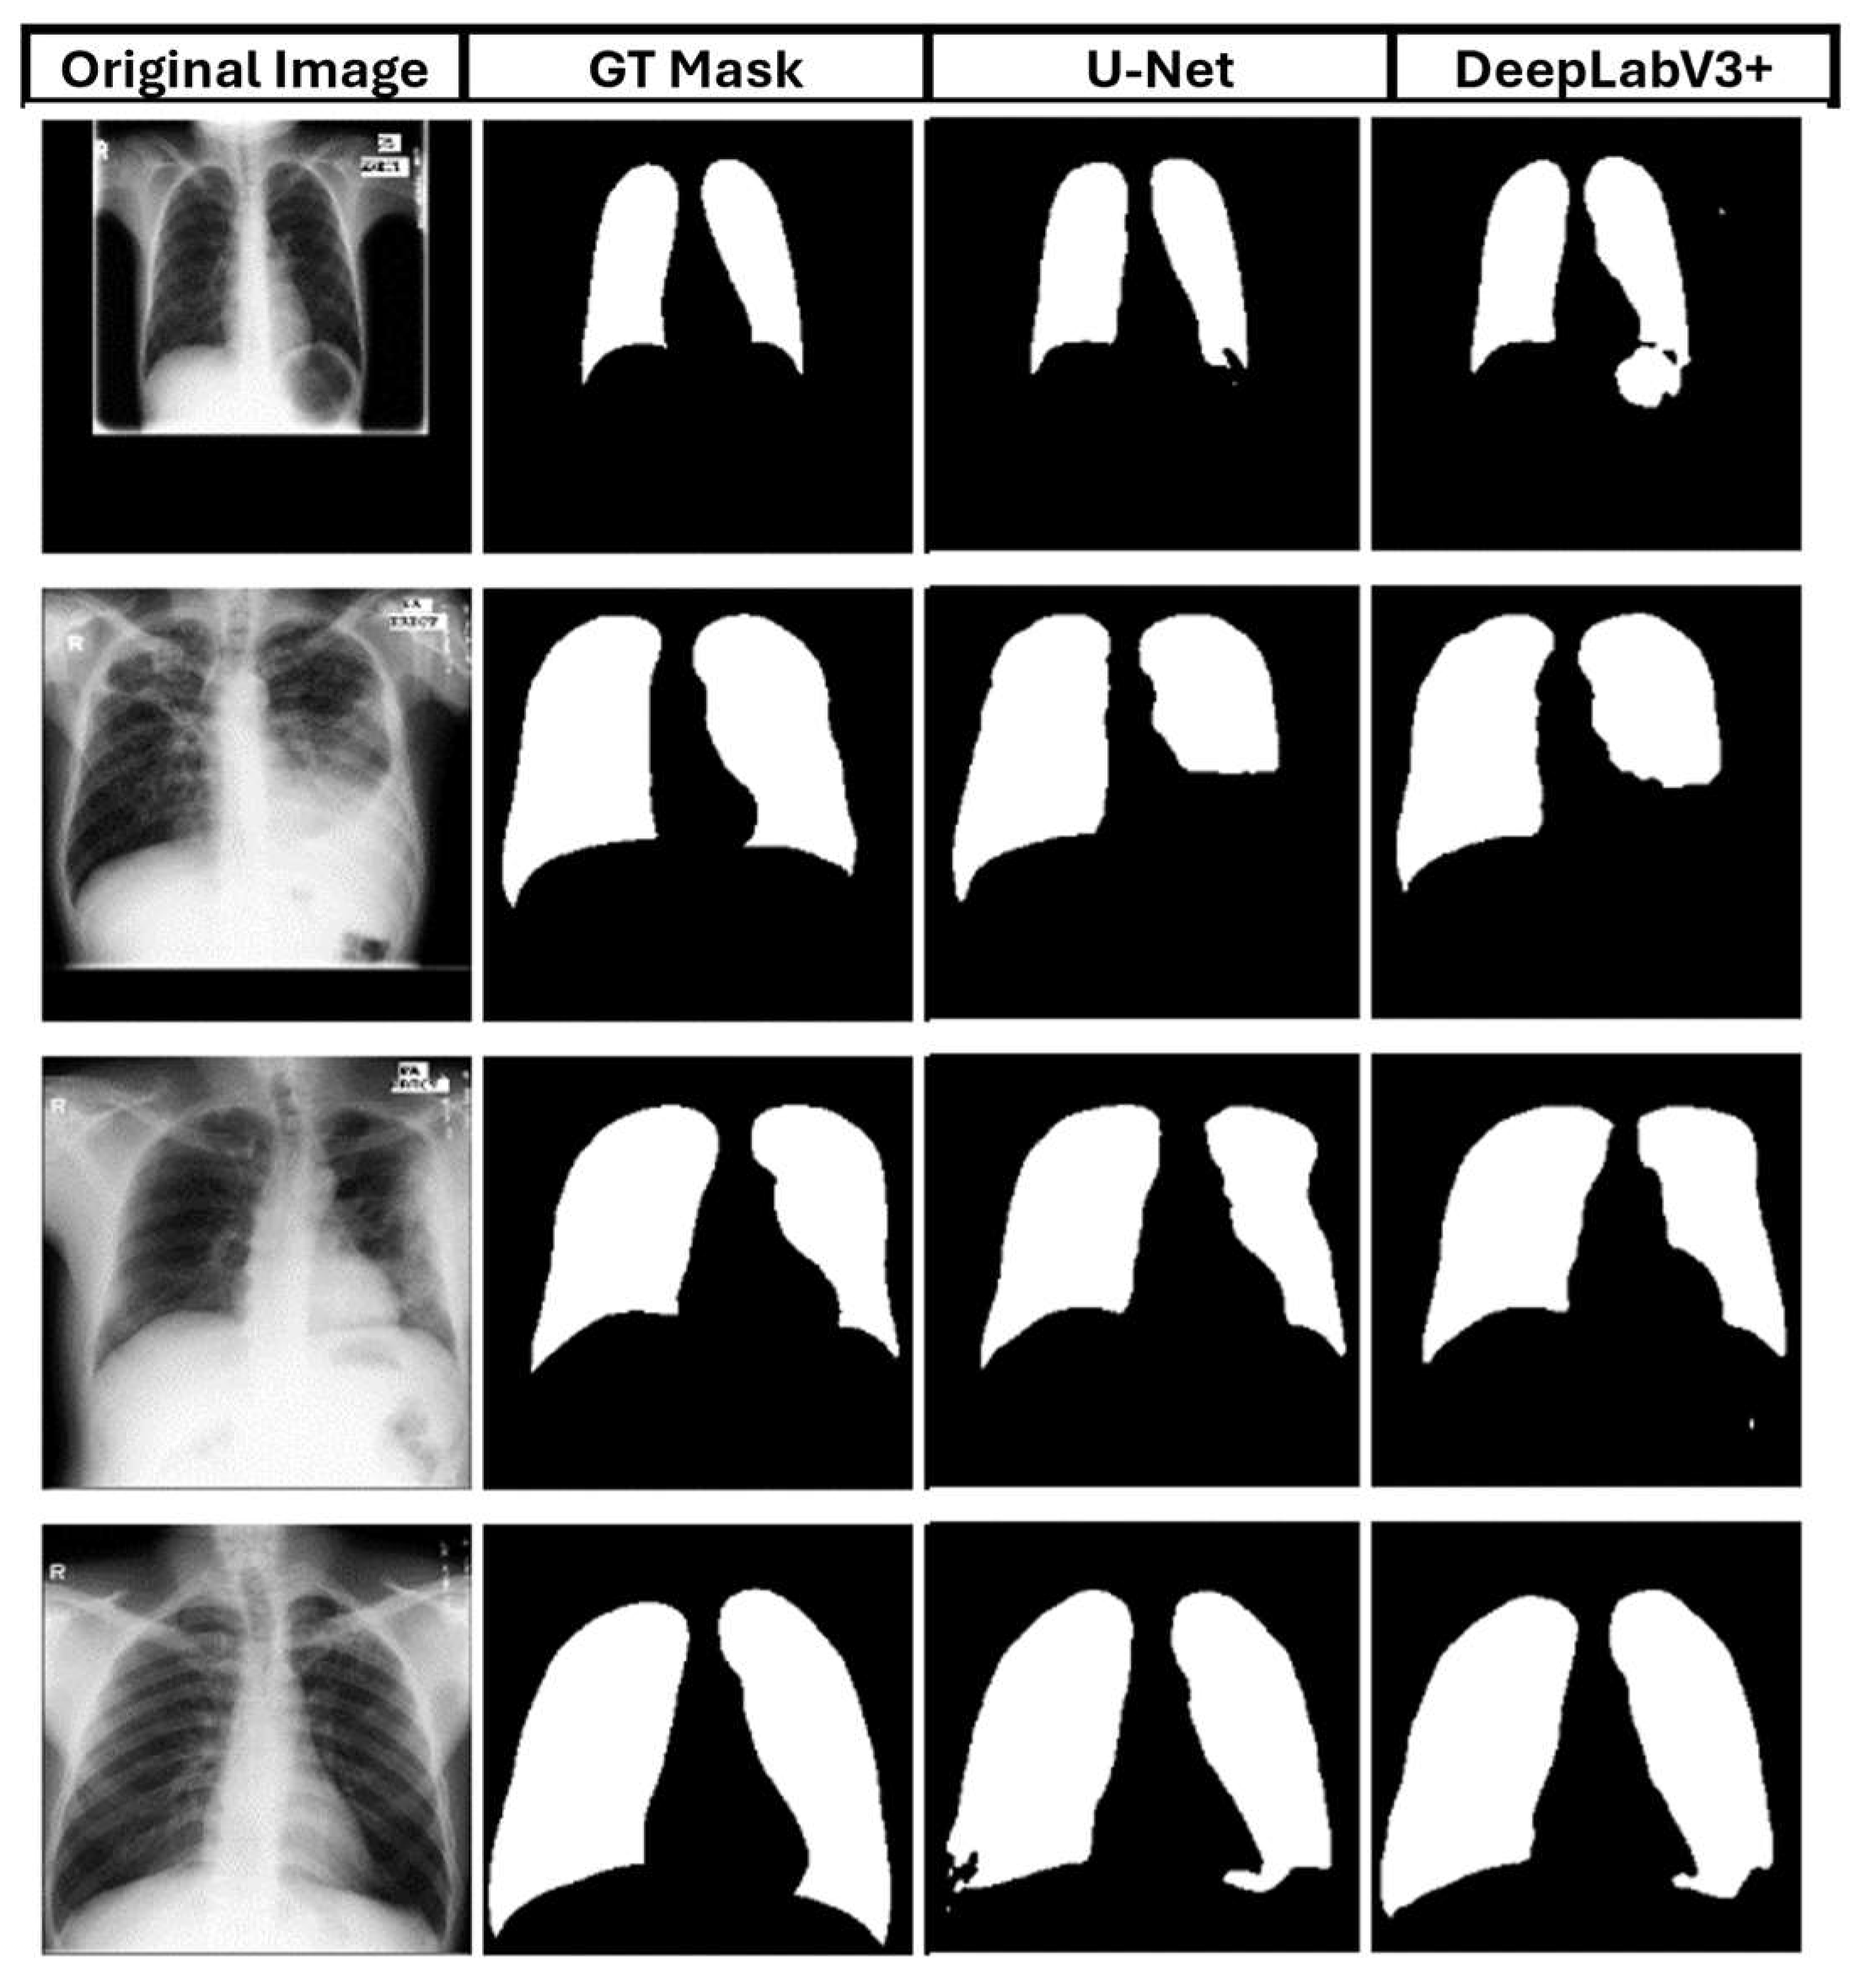

Table 1.
Pre-trained models' effectiveness on the learning process of two different architectures.
| VGG19 | ResNet50 | DenseNet121 | |
|---|---|---|---|
| U-Net | 0.717 | 0.878 | 0.848 |
| DeepLabV3+ | 0.815 | 0.860 | 0.853 |
Table 2.
Comparative results for the four architectures.
| U-Net | Attention U-Net | Residual Attention U-Net | DeepLabV3+ | |
|---|---|---|---|---|
| Dice Coefficient | 0.878 | 0.843 | 0.829 | 0.860 |
Table 3.
Total number of parameters for each architecture.
| DL Architectures | U-Net | Attention U-Net | Residual Attention U-Net | DeepLabV3+ |
|---|---|---|---|---|
| Parameters | 32.6 M | 52.9 M | 58.9 M | 17.8 M |
Table 4.
Different loss functions impact the U-Net and DeepLabV3+ learning processes.
| BCE 1 | Dice Loss | BCE + Dice Loss | Focal Tversky Loss | Log-Cosh Dice Loss | Jaccard Loss | |
|---|---|---|---|---|---|---|
| U-Net | 0.878 | 0.863 | 0.869 | 0.863 | 0.854 | 0.845 |
| DeepLabV3+ | 0.860 | 0.868 | 0.877 | 0.852 | 0.902 | 0.861 |
1 BCE = Binary Cross-Entropy.
Table 5.
Comparison of U-Net and DeepLabV3+ accuracy on the CBIS-DDSM dataset.
| U-Net BCE |
U-Net Log-Cosh Dice |
DeepLabV3+ BCE |
DeepLabV3+ Log-Cosh Dice |
|
|---|---|---|---|---|
| Dice Coefficient | 0.748 | 0.756 | 0.750 | 0.789 |
Table 6.
Comparison of U-Net and DeepLabV3+ accuracy on the Montgomery dataset.
| U-Net BCE |
U-Net Log-Cosh Dice |
DeepLabV3+ BCE |
DeepLabV3+ Log-Cosh Dice |
|
|---|---|---|---|---|
| Dice Coefficient | 0.9540 | 0.905 | 0.9544 | 0.951 |
Table 7.
Performance comparison on ISIC 2018.
| Model | Dice |
|---|---|
| DoubleU-Net [33] | 0.896 |
| Polar Res-U-Net++ [34] | 0.925 |
| MultiResUNet [35] | 0.869 |
| TransUNet [36] | 0.850 |
| ProMISe [37] | 0.921 |
| DuAT [38] | 0.923 |
| UCTransNet [39] | 0.890 |
| MISSFormer [40] | 0.866 |
| DeepLabV3+ (Our Approach) | 0.903 |
Disclaimer/Publisher’s Note: The statements, opinions and data contained in all publications are solely those of the individual author(s) and contributor(s) and not of MDPI and/or the editor(s). MDPI and/or the editor(s) disclaim responsibility for any injury to people or property resulting from any ideas, methods, instructions or products referred to in the content. |
© 2024 by the authors. Licensee MDPI, Basel, Switzerland. This article is an open access article distributed under the terms and conditions of the Creative Commons Attribution (CC BY) license (https://creativecommons.org/licenses/by/4.0/).
Copyright: This open access article is published under a Creative Commons CC BY 4.0 license, which permit the free download, distribution, and reuse, provided that the author and preprint are cited in any reuse.


