1. Introduction
Glyphosate, a widely used broad-spectrum herbicide, has become an integral part of modern agriculture due to its effectiveness in controlling weeds [
1]. As a patented antibiotic, concerns have emerged about its potential adverse impact on soil health and microbial communities [
2,
3]. Soil microorganisms are essential for ecosystem processes such as nutrient cycling, organic matter decomposition, and plant growth promotion [
4]. Disruptions of these microbial communities can have significant consequences for soil fertility and overall agricultural sustainability [
3,
5,
6].
Numerous studies have investigated the effects of glyphosate and its primary degradation product, AMPA, on soil microbial composition and health, yet the findings remain inconsistent. Some studies suggest that glyphosate has minimal or transient impacts on soil microbial communities [
7,
8]. These findings propose that microbial resilience, and adaptation may mitigate glyphosate’s effects under certain conditions. Conversely, other research reports more adverse impacts, including reduced microbial diversity, shifts in microbial community composition, and disruptions to key microbial processes such as nutrient cycling and organic matter decomposition [
2,
3,
6,
9]. The variability in these outcomes is often attributed to differences in experimental conditions, such as application rates, soil types, environmental factors, and the duration of study. Additionally, variations in the analytical methods used to assess microbial communities, such as culture-dependent techniques versus high-throughput sequencing, may further contribute to the lack of consensus.
These diverse findings highlight the complexity of glyphosate’s interactions with soil microbiomes and underscores the need for more comprehensive and standardized research. Such efforts are essential to accurately assess the long-term impacts of glyphosate and AMPA on soil health and to develop sustainable agricultural practices.
One promising approach is the application of microbial inoculants, which are formulations comprised of beneficial microorganisms designed to enhance microbial diversity and activity in soils. These inoculants can promote the degradation of glyphosate residues, stimulate microbial growth, and improve soil fertility to buffer the negative effects of glyphosate and supporting agricultural sustainability. Advances in microbiome research have provided valuable insights into the complex interactions between soil microorganisms and their environment [
10,
11] by enabling the identification of key microbial taxa and processes affected by glyphosate [
12,
13].
Building on this knowledge, PaleoPower, a novel microbial inoculant, was designed using community metabolic modeling and artificial intelligence (AI). This inoculant consists of a consortium of beneficial bacterial strains selected for their complementary metabolic functions to degrade glyphosate and enhance soil health. Unlike most glyphosate-degrading studies that focus on individual strains [
14,
15], PaleoPower represents an innovative approach that leverages microbial consortia to optimize soil resilience and functionality [
16].
In a previous study where PaleoPower was tested in corn grain and silage systems, significant glyphosate degradation activity and measurable improvements in soil quality and crop yield were demonstrated [
16]. Building on these promising results, the current study investigated the impact of PaleoPower on soil microbiome dynamics in a cotton field with detectable levels of residual glyphosate. By leveraging the insights from microbiome analyses, this study aimed to uncover the mechanisms by which PaleoPower mitigates the impact of glyphosate and AMPA, improves soil health, and promotes sustainable agricultural practices.
By integrating microbiome research, advanced computational tools, and field validation, this work represents a significant step forward in addressing glyphosate's challenges and developing innovative nonchemical solutions to enhance agricultural sustainability.
2. Materials and Methods
2.1. Composition and Preparation of PaleoPower
PaleoPower is a microbial inoculant developed using a consortium of eight bacterial strains (
Table 1), selected through an integrative approach combining genomic analysis, individual metabolic modeling [
17], and community-level interactions. Each strain was chosen for its potential ability, based on genomic annotation, to promote soil health, degrade glyphosate and its primary breakdown product, AMPA, and function cooperatively within a guild to optimize soil ecosystem functionality. Individual metabolic models were generated and refined using the KBase platform [
18], which integrates genome annotation, metabolic modeling, and community-level analysis tools. Detailed insights into the key metabolic pathways of each bacterial strain, including those responsible for glyphosate and AMPA degradation were provided. Community metabolic interactions were modeled using KBase’s integrated pipeline which supports flux balance analysis and interspecies interaction modeling [
18]. Community metabolic modeling revealed synergistic interactions among the strains that predicted enhanced nutrient cycling, organic matter decomposition, and cooperative glyphosate metabolism to validate the functionality of the PaleoPower consortium as a cohesive guild. Predictive functional analyses further validated their synergistic roles in nutrient cycling, organic matter decomposition, and glyphosate remediation.
2.1.1. Composition
Several of the selected bacterial strains possess key enzymes for glyphosate and AMPA degradation and were evaluated for their potential to improve soil quality through metabolic contributions and community stability.
Table 1 provides an overview of the strain composition, including strain IDs, biosafety levels, inoculum concentrations, and primary functional role. Together, these strains were designed to work as a cohesive microbial community, leveraging their complementary metabolic activities to enhance soil health and productivity
2.1.2. Co-Fermentation Process
The eight bacterial strains were co-fermented in a single batch culture to facilitate interspecies interactions and metabolic cross-feeding. Each strain was inoculated at the specified concentrations (
Table 1) into a standardized co-fermentation medium stabilized with 2% organic molasses (FEDCO, Inc., Clinton, ME, USA). The process was conducted under controlled conditions of optimal temperature, pH, and aeration to support growth and activity. This co-fermentation approach was critical for fostering the cooperative dynamics and production of postbiotics [
19] necessary for the consortium’s functionality in soil environments. After fermentation, the microbial consortium was determined to have a final viable cell count of approximately 5 billion CFU/mL. Before use, the suspension was thoroughly mixed to ensure an even distribution of the microbial community.
2.2. Application of PaleoPower and Soil Sampling in the Cotton Field
PaleoPower was applied to an approximately 5-acre area of a cotton field in Tanner, Alabama, at a concentration of 1.6 × 10⁸ CFU per square meter of soil. The microbial inoculant was diluted with water to achieve a final application volume of 10 gallons per acre. The diluted product was evenly sprayed over the unplanted field using standard agricultural spraying equipment to ensure uniform distribution across the soil surface. This application method facilitated maximum contact between the inoculant and the soil to promote consistent microbial colonization and activity throughout the treated area.
The 8.55 acres cotton field was managed under non-till traditional agricultural practices that included a pre-planting application of glyphosate for weed control. The soil was classified as silt loam or silty clay loam with a medium-textured profile commonly found in agricultural fields in the region.
Soil sampling was conducted at two time points: baseline samples were collected in April 2023 prior to planting and PaleoPower application, and post-harvest samples were obtained in October 2023 following the cotton harvest. Six randomly selected locations, spaced approximately 210–225 feet apart, were sampled to ensure representative field coverage. At each location, soil cores (6–8 inches in depth and 6–8 inches in diameter) were collected to account for field variability. Baseline, pre-treatment soils from untreated plots were retained and analyzed alongside post-harvest samples from treated plots to enable a comparative assessment of treated and untreated soils.
Each soil core was homogenized and divided into two equal subsamples. One subsample was designated for soil microbiome analysis, including DNA extraction and sequencing to evaluate microbial composition and diversity. The second subsample was allocated for glyphosate residue analysis using chemical extraction and quantification to measure glyphosate and its degradation products. This dual analysis approach ensured comprehensive evaluation of the effects of PaleoPower on both the soil microbial community and chemical residue dynamics.
2.3. Determination of Soil Glyphosate Levels
The analysis of glyphosate and its metabolite AMPA was conducted at Health Research Institute (HRI), Fairfield, IA, USA, using their ISO 17025-accredited method TM #8, which employs liquid chromatography-tandem mass spectrometry (LC-MS/MS) for detection and quantification. Sample preparation followed a modified protocol based on the method described by Chamkasem, Morris, and Harmon [
20] that was originally developed for the direct determination of glyphosate, glufosinate, and AMPA in milk. The protocol was adapted to ensure compatibility with soil matrices while maintaining high sensitivity and specificity for glyphosate and AMPA. LC-MS/MS analysis employed a modified version of the method described by Jensen et al. [
21], which was validated for the selective detection of glyphosate and AMPA in milk and urine. This modification enabled reliable quantitation of both compounds at sub-part-per-billion (ppb) levels in soil samples.
The method's limits of detection (LOD) and quantitation (LOQ) were determined as 0.02 ppb and 0.05 ppb for glyphosate, and 0.013 ppb and 0.05 ppb for AMPA, respectively. Measurements were categorized as "trace" when the values fell between the LOD and LOQ, while values below the LOD were reported as "not detected." Analytical values were traceable to ISO 17025-compliant calibrations, with all equipment and reference materials adhering to this standard. Measurement uncertainties were calculated and are available upon request. The effective glyphosate level was calculated following the Food and Agriculture Organization (FAO) guidelines, where the total glyphosate residue was expressed as the sum of the weight of glyphosate and 1.5 times the weight of AMPA.
2.4. Microbiome Analysis
2.4.1. 16S rRNA Gene Metagenomic Sequencing
Metagenomics 16S sequencing was performed by EzBiome (Gaithersburg, MD, USA). DNA concentration was measured using the QuantiFluor dsDNA System on a Quantus Fluorometer (Promega, Madison, WI, USA). The 16S rRNA Primers (V3-V4) within the ribosomal transcript were amplified using the primer pair containing the gene-specific sequences and Illumina (San Diego, CA, USA) adapter overhang nucleotide sequences. The primer sequences are: IlluminaF: CCTACGGGNGGCWGCAG and IlluminaR: GACTACHVGGGTATCTAATCC.
Amplicon PCR was performed to amplify DNA templates from input samples. Each 25 µL PCR reaction consisted of 12.5 ng of input DNA, 12.5 µL of 2x KAPA HiFi HotStart ReadyMix (Kapa Biosystems, Wilmington, MA, USA), and 5 µL of 1 µM of each primer. The PCR cycling conditions included an initial denaturation at 95°C for 3 minutes, followed by 25 cycles of denaturation at 95°C for 30 seconds, annealing at 55°C for 30 seconds, and extension at 72°C for 30 seconds, with a final elongation step at 72°C for 5 minutes. The PCR products were purified using Mag-Bind RxnPure Plus magnetic beads (Omega Biotek, Norcross, GA, USA).
A second PCR amplification was performed to add barcodes and sequencing adapters to the final PCR product. Each 25 µL reaction used the same master mix conditions as previously described. The cycling conditions were as follows: an initial denaturation at 95°C for 3 minutes, followed by 8 cycles of denaturation at 95°C for 30 seconds, annealing at 55°C for 30 seconds, and extension at 72°C for 30 seconds, with a final elongation step at 72°C for 5 minutes.
The libraries were normalized using the Mag-Bind® EquiPure Library Normalization Kit (Omega Bio-tek, Norcross, GA, USA) and subsequently pooled. The pooled library was evaluated for quality using an Agilent 2200 TapeStation and sequenced with a 2 × 300 bp paired end read setting on the MiSeq platform (Illumina, San Diego, CA, USA).
2.4.2. Sequence Processing and Quality Control
Raw sequencing data were analyzed using the QIIME 2 bioinformatics pipeline (version qiime2-amplicon-2023.9) [
22], an open-source platform widely used for microbiome analysis due to its robust and reproducible framework. Paired-end demultiplexed reads were processed with the DADA2 plugin [
23], which integrates quality filtering, denoising, and chimera removal in a single step to produce high-resolution amplicon sequence variants (ASVs). This method effectively corrects Illumina sequencing errors, ensuring accurate differentiation of microbial taxa at the strain level [
23].
Chimeric sequences, often generated during PCR amplification, were identified and removed using DADA2’s built-in algorithm, which compares sequences to a reference-free database constructed from the sample dataset itself. This step ensures the removal of spurious sequences while retaining true biological diversity [
23].
The output of this workflow included a feature table containing the frequency of each amplicon sequence variant (ASV) across samples and a set of representative sequences. These outputs were further used in downstream analyses, for taxonomic assignment and diversity assessments. Sequence quality metrics, including read length distributions and per-base quality scores, were visualized using QIIME 2's interactive visualization tools, enabling detailed quality assurance prior to further analyses.
For statistical analyses and ecological interpretation, ASVs were preferred over traditional operational taxonomic units (OTUs) due to their superior resolution and ability to retain fine-scale ecological information without arbitrary clustering thresholds [
24]. This approach allowed for a more accurate representation of the microbial community structure and dynamics, enhancing the reliability of diversity metrics and taxonomic profiling.
2.4.3. Alpha Diversity Analyses
Alpha diversity metrics, which quantify the richness and evenness of microbial communities within individual samples, were calculated using the qiime diversity alpha command. The analysis included the Chao1 index, Shannon diversity index, Simpson index, Faith’s phylogenetic diversity (Faith’s PD), and Pielou’s evenness. Rarefaction was performed at a depth of 25,000 sequences per sample to normalize sequencing effort and ensure comparability across samples while minimizing biases associated with unequal sequencing depths.
The Chao1 index was used to estimate species richness to incorporate the number of observed ASVs and account for rare taxa to predict undetected diversity [
25]. The Shannon diversity index combined richness and evenness, reflecting both the number of ASVs and their relative abundances, with higher values indicating more diverse and evenly distributed communities [
26]. The Simpson index was calculated to evaluate community dominance, quantifying the probability that two randomly selected individuals belong to the same ASV, with higher values indicating less diversity [
27]. Faith’s phylogenetic diversity measured the evolutionary diversity of microbial communities by calculating the total branch length of a phylogenetic tree encompassing all ASVs within a sample and offering insights into the phylogenetic breadth of the microbiome [
28]. Pielou’s evenness assessed the uniformity of ASV abundances by normalizing Shannon diversity by the logarithm of observed ASV richness, with values ranging from 0 to 1, where 1 represents complete evenness [
29].
These metrics provided a comprehensive assessment of microbial richness, evenness, and evolutionary diversity within the samples. Statistical comparisons of alpha diversity between groups (e.g., baseline and treated) were performed using non-parametric Wilcoxon rank-sum tests [
30], while group-level comparisons were evaluated using Kruskal-Wallis tests [
31]. Adjustments for multiple comparisons were applied using the Benjamini-Hochberg false discovery rate correction to control for Type I error [
32]. This approach enabled a detailed evaluation of the effects of treatment on microbial community diversity and structure.
2.4.4. Beta Diversity Analysis
Beta diversity was assessed to evaluate differences in microbial community composition between treated and untreated soil samples. A distance matrix was calculated using Euclidean distance based on integrated data, which included alpha diversity metrics (e.g., Chao1 richness, Shannon diversity, Faith’s phylogenetic diversity, and Pielou’s evenness), glyphosate concentrations (Effective Glyphosate and AMPA levels), and relative abundances of microbial taxa. Principal Coordinates Analysis (PCoA) was then performed to visualize patterns of community composition.
To evaluate the statistical significance of differences in microbial community composition between treated and untreated groups, a permutational multivariate analysis of variance (PERMANOVA) [
33] was performed. PERMANOVA was calculated in R [
34] using the
adonis2 function from the
vegan package v2.7.0 [
35].
The analysis utilized a Bray-Curtis dissimilarity matrix [
36] where 999 permutations were conducted with the treatment group as the explanatory variable. PERMANOVA provided key metrics, including the proportion of variance explained (R²), the F-statistic, and the p-value, to quantify effect sizes and determine the significance of group differences. Principal Coordinate Analysis (PCoA) was employed to visualize the results, with group-specific markers and sample labels enhancing interpretability. Principal Coordinate Analysis (PCoA) coordinates derived from the beta diversity analysis were plotted using R [
34] with the
ggpubr package [
37] for enhanced visualization and the
vegan package [
35] for distance matrix calculation and ordination.
2.4.5. Taxonomic Analysis
Taxonomic classification was performed using QIIME 2 (version qiime2-amplicon-2023.9) to assign taxonomy to amplicon sequence variants (ASVs) for each cohort. The Greengenes2 2024.09 database was employed as the reference taxonomy. Initially, a Naive Bayes classifier was trained on the Greengenes2 2024.09 reference sequences [
38] using the
feature-classifier fit-classifier-naive-bayes method in QIIME 2. Subsequently, the trained classifier was applied to the representative ASV sequences from each cohort using the
feature-classifier classify-sklearn method to assign taxonomic labels.
Taxonomic profiles were generated for each cohort, including Baseline, Untreated, and Treated groups, by calculating the relative abundance of taxa at different taxonomic levels from Phylum to Genus. ASV feature tables were collapsed to the desired taxonomic level using the qiime taxa collapse command, and relative abundances were normalized to account for differences in sequencing depth. For better interpretability, low-abundance taxa (<0.1%) were grouped under "Other." Phylum- and Genus-level profiles were highlighted to identify microbial shifts associated with treatment effects.
Statistical analyses were conducted to identify differentially abundant taxa across cohorts. The Linear Discriminant Analysis (LDA) Effect Size (LEfSe) algorithm [
39] was used to detect significant taxonomic enrichments, with taxa displaying LDA scores >2 and p-values <0.05 considered statistically significant. Kruskal-Wallis tests [
31] were applied to assess differences across multiple cohorts, with p-values adjusted using the Benjamini-Hochberg correction to control for false discovery rates [
32]. Taxonomic profiles were further visualized and refined in R (version 3.6.3) using the
ggplot2 and
ggpubr packages [
40]. These methods allowed for a comprehensive analysis of taxonomic distributions, enabling comparisons of microbial communities and insights into the effects of treatment on cohort-specific microbiomes.
2.4.6. Functional Analysis
Functional predictions of microbial communities were performed using PICRUSt2 (Phylogenetic Investigation of Communities by Reconstruction of Unobserved States) [
41] on the Galaxy platform (
https://usegalaxy.org, last accessed 12/11/2024) [
42,
43]. PICRUSt2 infers the metagenomic functional potential of microbial communities from 16S rRNA gene sequencing data by leveraging phylogenetic relationships and reference genome annotations. Representative amplicon sequence variants (ASVs) exported from QIIME 2 in BIOM format were used as input for PICRUSt2 analysis. ASV abundances were normalized first based on their predicted 16S rRNA gene copy numbers to reduce biases introduced by taxa with multiple gene copies. Functional predictions were then performed by mapping ASVs to closely related reference genomes and projecting the annotated functions of these genomes onto the observed taxa. Functional gene abundances were assigned to KEGG Orthology (KO) terms, enabling the reconstruction of metabolic and biosynthetic pathways using MetaCyc and KEGG pathway annotations [
41]. Outputs included predicted functional abundances at both the gene and pathway levels, which were downloaded for downstream statistical analyses.
To identify significant functional differences across cohorts (e.g., Baseline, Untreated, Treated), the Linear Discriminant Analysis Effect Size (LEfSe) algorithm [
44] was applied. LEfSe identifies features that differ significantly between groups while estimating their biological relevance using effect size scores. The predicted functional profiles from PICRUSt2 were reformatted and uploaded to Galaxy’s LEfSe workflow. Functional features, including KEGG pathways, were grouped by cohort, log-transformed, and analyzed using the Kruskal-Wallis test to detect significant differences between groups (p < 0.05).
Post-hoc pairwise Wilcoxon tests were performed to confirm specific group differences. Features with LDA (Linear Discriminant Analysis) scores >2 were considered biomarkers of functional variation.
The functional pathways identified through LEfSe were further interpreted in the context of experimental conditions and ecological relevance. For example, enriched pathways associated with glyphosate degradation and nutrient cycling were cross-referenced with existing literature to validate their potential roles in improving soil health.
2.5. Random Forest Modeling
Random Forest modeling [
45] was employed to analyze the study parameters and predict outcomes based on key features of the dataset. This machine learning approach is particularly effective for handling high-dimensional data with complex interactions between variables, as it builds an ensemble of decision trees to improve predictive accuracy and control overfitting. The dataset comprised multiple features, including soil properties, glyphosate levels, and microbial diversity, which were used as predictors. The target variable represented the desired outcome, such as glyphosate degradation or improved soil health. Data preprocessing steps included normalization, handling missing values, and splitting the dataset into training and testing subsets to ensure robust model validation. Feature importance metrics derived from the Random Forest helped identify the most influential predictors driving the outcomes to provide valuable insights into the mechanisms underlying the effectiveness of the PaleoPower soil inoculant. The final model's performance was evaluated using metrics like accuracy, precision, recall, and the F1-score that highlight its utility in guiding future optimization efforts.
2.6. Correlation Analysis
To evaluate the relationships between numerical variables in the dataset, a correlation analysis was performed that encompassed microbial diversity indices, microbial composition metrics, and environmental factors such as glyphosate levels. All numerical columns, including alpha diversity indices (Chao1, Shannon, Faith, Pielou, Simpson), environmental metrics (e.g., glyphosate and its metabolites), and relative abundances of microbial taxa were included in the analysis. Pearson correlation coefficients [
46] were calculated to quantify the linear relationships between variables, and a correlation matrix was generated using Python's
pandas library. Correlations were categorized based on their absolute coefficient values, with |r| > 0.7 indicating strong correlations, 0.5 ≤ |r| ≤ 0.7 indicating moderate correlations, and |r| < 0.5 indicating weak correlations. This analysis provided insights into potential associations between glyphosate exposure and microbial diversity, as well as co-variations among microbial taxa and diversity indices. All statistical analyses were conducted using Python (v3.9) [
47] with the
pandas [
48] and
NumPy [
49] libraries.
3. Results
3.1. Co-Fermentation Process of the 8 Bacteria Strains
The controlled co-fermentation of the eight selected bacterial strains in a standardized medium with 2% organic molasses demonstrated robust microbial growth and viability. Strict control of pH, temperature, and aeration was maintained during the co-fermentation process. The final product, as measured by flow cytometry, achieved a total viable cell count of 7.2 × 10⁹ cells per gram, including 4.05 × 10⁹ spores per gram. The presence of 7.21 × 10⁷ lactic acid bacteria per gram highlights the contribution of Lactiplantibacillus spp., which can enhance nutrient bioavailability and suppress pathogens. Additionally, there were 1.19 × 10⁷ injured cells per gram and 2.79 × 10⁷ dead cells. Residual organic molasses was measured at approximately 1.8%.
3.2. Soil Application and Sample Collection
PaleoPower was applied to the study area at a concentration of 1.6 × 10⁸ CFU per square meter of soil. To ensure even distribution across the soil surface, the microbial inoculant was diluted in water and sprayed at a rate of 10 gallons per acre over unplanted land. This application method successfully delivered a consistent microbial load by introducing a combination of live cells and spores into the soil. The uniform coverage provided by the 10 gal/acre dilution process ensured optimal contact with the soil to facilitate microbial colonization and activity across the treated area
Soil samples collected from a 5-acre cotton field in Tanner, Alabama provided sufficient material for both chemical and microbiome analyses to support successful evaluations of glyphosate residues and microbial community composition.
Paired soil cores (12 total per sampling event) were collected at two critical time points: baseline (April 2023) prior to planting and PaleoPower application, and post-harvest six months later (October 2023) following the cotton harvest. Similar samples were collected on untreated soil to provide a basis for comparison. The cores, measuring 6–8 inches in depth and diameter, captured the root zone, a key area for microbial activity and glyphosate residue accumulation. This systematic sampling and analytical approach provided high-quality data to evaluate the impact of PaleoPower treatment on soil microbial communities and chemical residue dynamics when compared to untreated soil from the same cotton field.
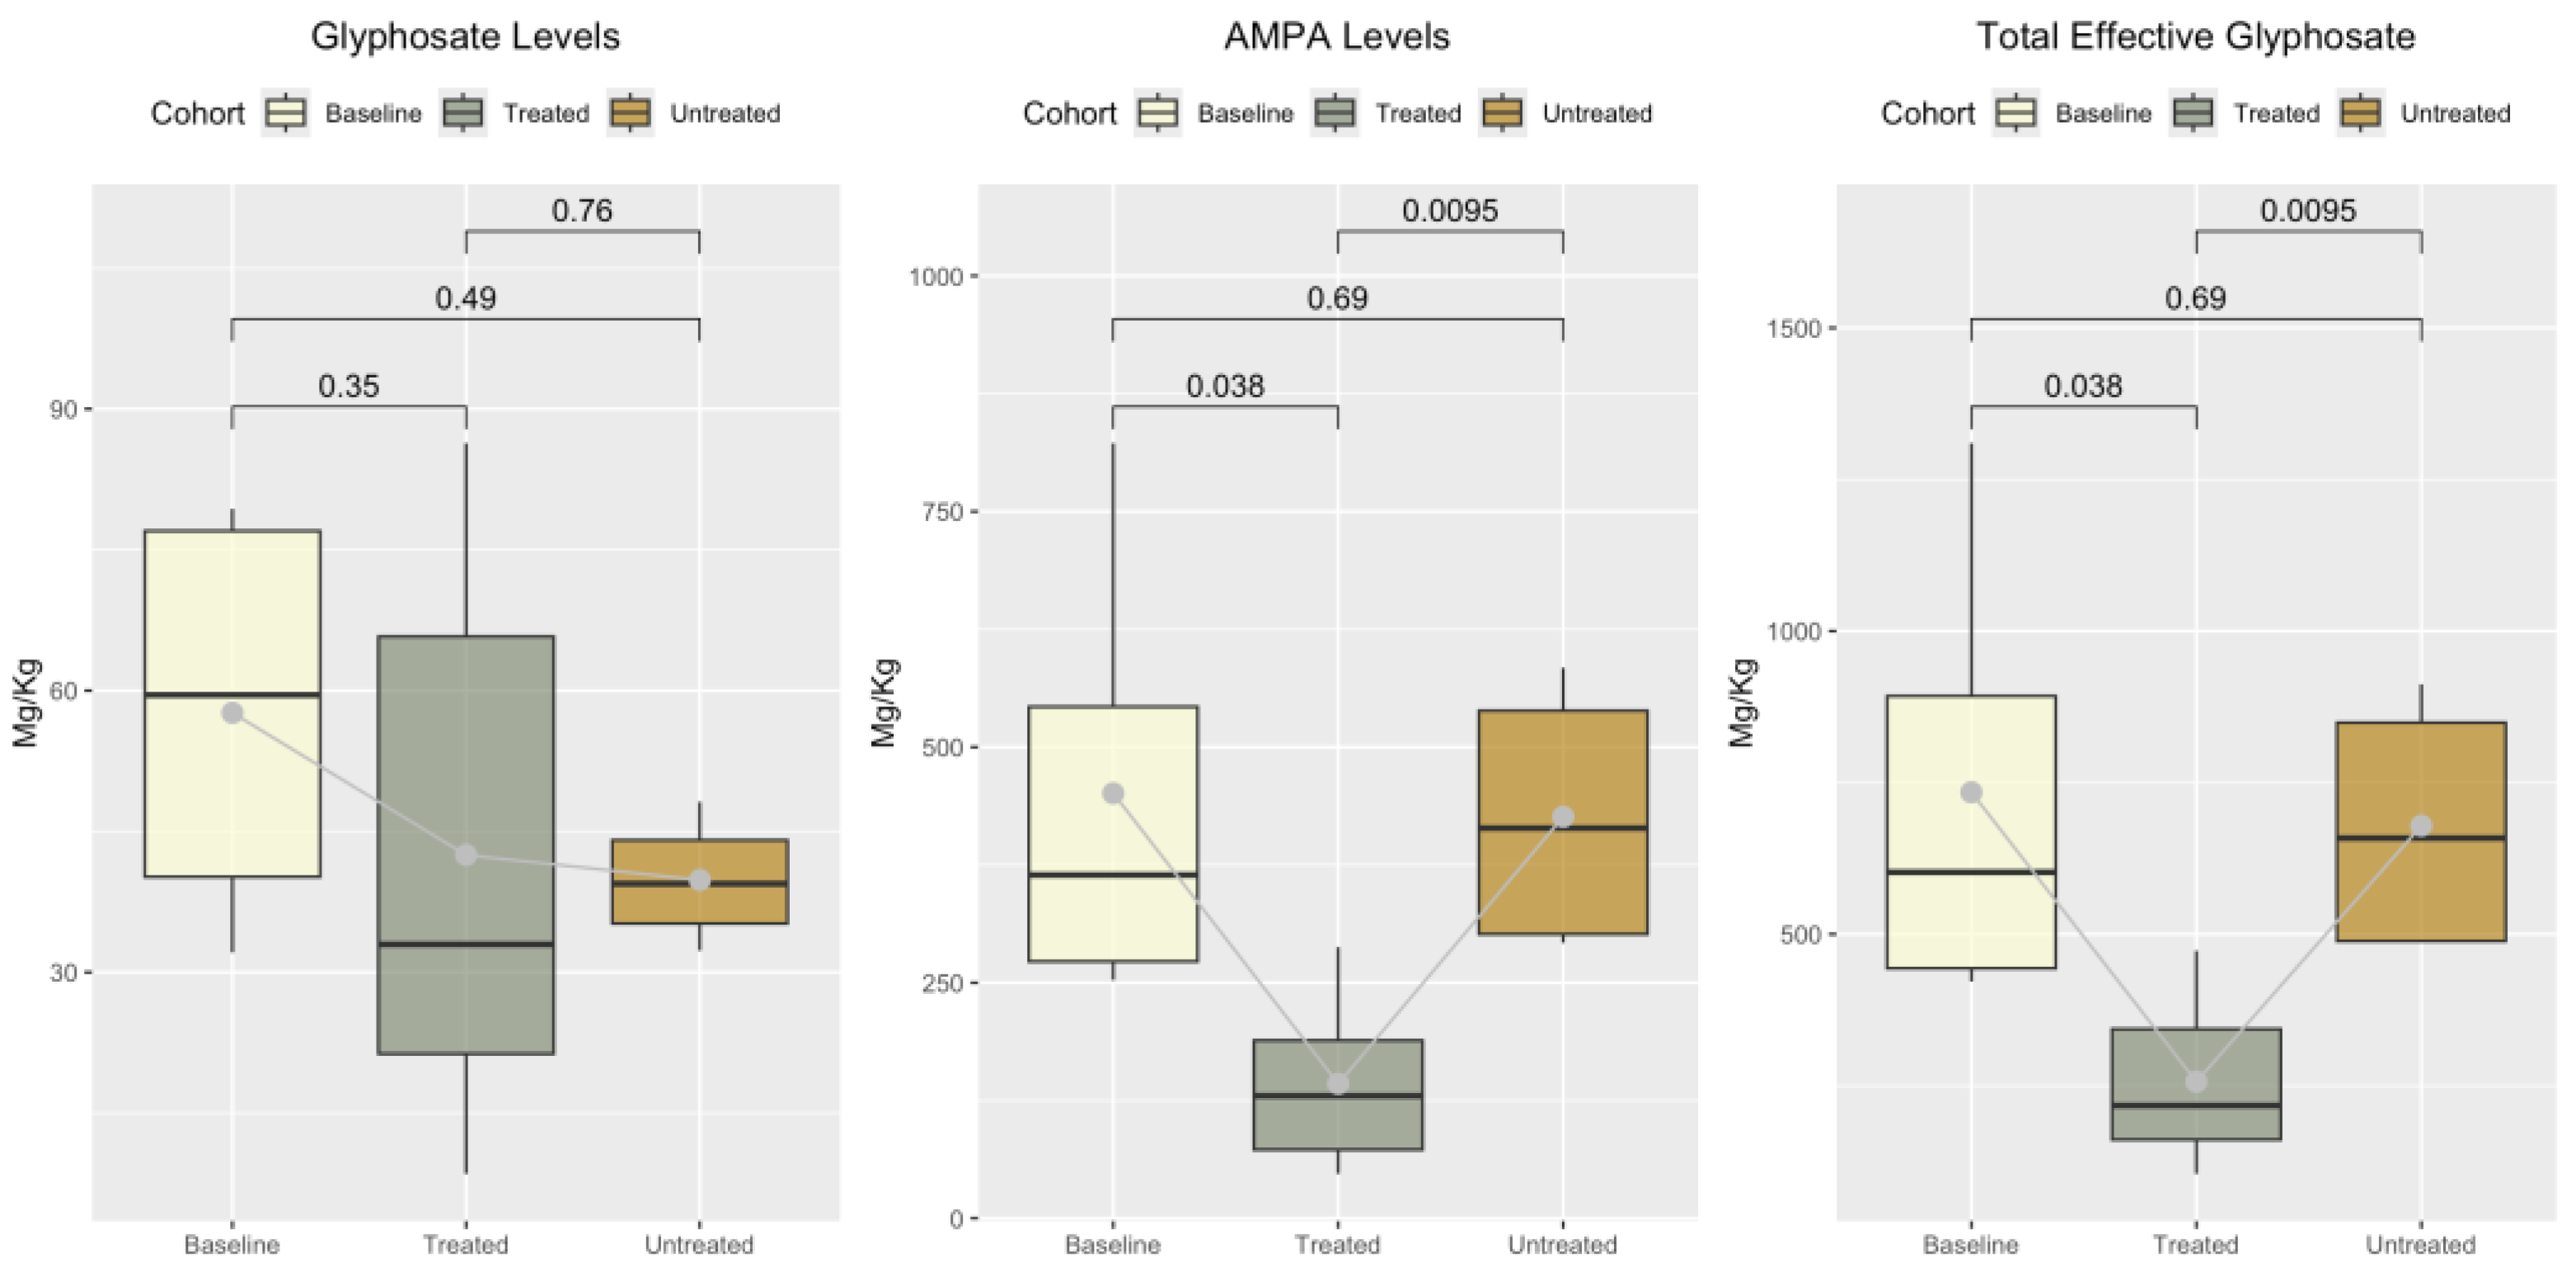
3.3. Glyphosate, Aminomethylphosphonic Acid (AMPA), and Total Effective Glyphosate (TEG) Levels Across Cohorts
The concentrations of glyphosate, AMPA, and TEG were measured across baseline, untreated, and treated cohorts. The untreated samples had residual glyphosate levels ranging from 32.3 to 48.15 µg/kg, AMPA levels between 292.27 and 584.09 µg/kg, and TEG levels from 486.56 to 912.28 µg/kg.
In the treated cohort, residual glyphosate concentrations ranged from 8.52 to 86.36 µg/kg, while AMPA levels varied from 47.21 to 287.75 µg/kg. TEG in the treated samples ranged from 104.74 to 472.75 µg/kg.
Baseline samples contained residual glyphosate levels ranging from 32.1 to 79.36 µg/kg, AMPA concentrations between 252.72 and 822.43 µg/kg, and TEG values ranging from 421.92 to 1309.86 µg/kg. These data are summarized in
Figure 1, which illustrates the distribution of glyphosate, AMPA, and TEG concentrations across the three cohorts.
3.4. Sequencing Run Validation and Metrics Summary
Positive and negative controls were included to validate the sequencing run. The EzPositive control (ENC3840) produced 72,602 sequences with a GC content of 52.5%, while the EzNegative control (ENC3841) generated only 168 sequences, with a higher GC content of 56.5%.
Among the experimental samples, the total number of sequences ranged from 60,826 (GM-2) to 76,984 (GM-1), with an average across all experimental samples of approximately 67,000 sequences. Percent duplicate reads were consistently high across samples, ranging from 84.42% (GM-6) to 87.18% (GM-4), indicative of sufficient sequencing depth and complexity of the metagenomic data. The GC content of the experimental samples was relatively uniform and ranged from 56% to 57%, reflecting the consistency of the microbial composition across the samples. Average sequence lengths across all samples were approximately 247 base pairs, with minor variations between 246.1 bp (GM-6) and 247.7 bp (M-2). These results are summarized in
Table 2.
3.5. Taxonomic Features of the Soil Microbiome
LEfSe analysis identified 206 taxonomic biomarkers across 24 bacterial orders, distinguishing between baseline and post-harvest microbiomes. Among these, 12 taxa exhibited the highest Differential Abundance (DA) scores, reflecting substantial shifts in the soil microbial community after treatment with PaleoPower. The results are summarized in
Figure 2 and
Table 3 and
Table 4.
The principal positive responders, or taxa showing increased relative abundance (RA) post-harvest, included Actinobacteria (+52.4%), Clostridia (+89.5%), Deltaproteobacteria (+28.5%), and Nitrospira (+22.4%). In contrast, taxa such as Chloroflexia (-102.2%), Spartobacteria (-103.7%), and Sphingobacteria (-66.4%) displayed notable declines in RA. These taxonomic shifts are summarized in
Table 3, highlighting the observed restructuring of the microbial community post-treatment with PaleoPower.
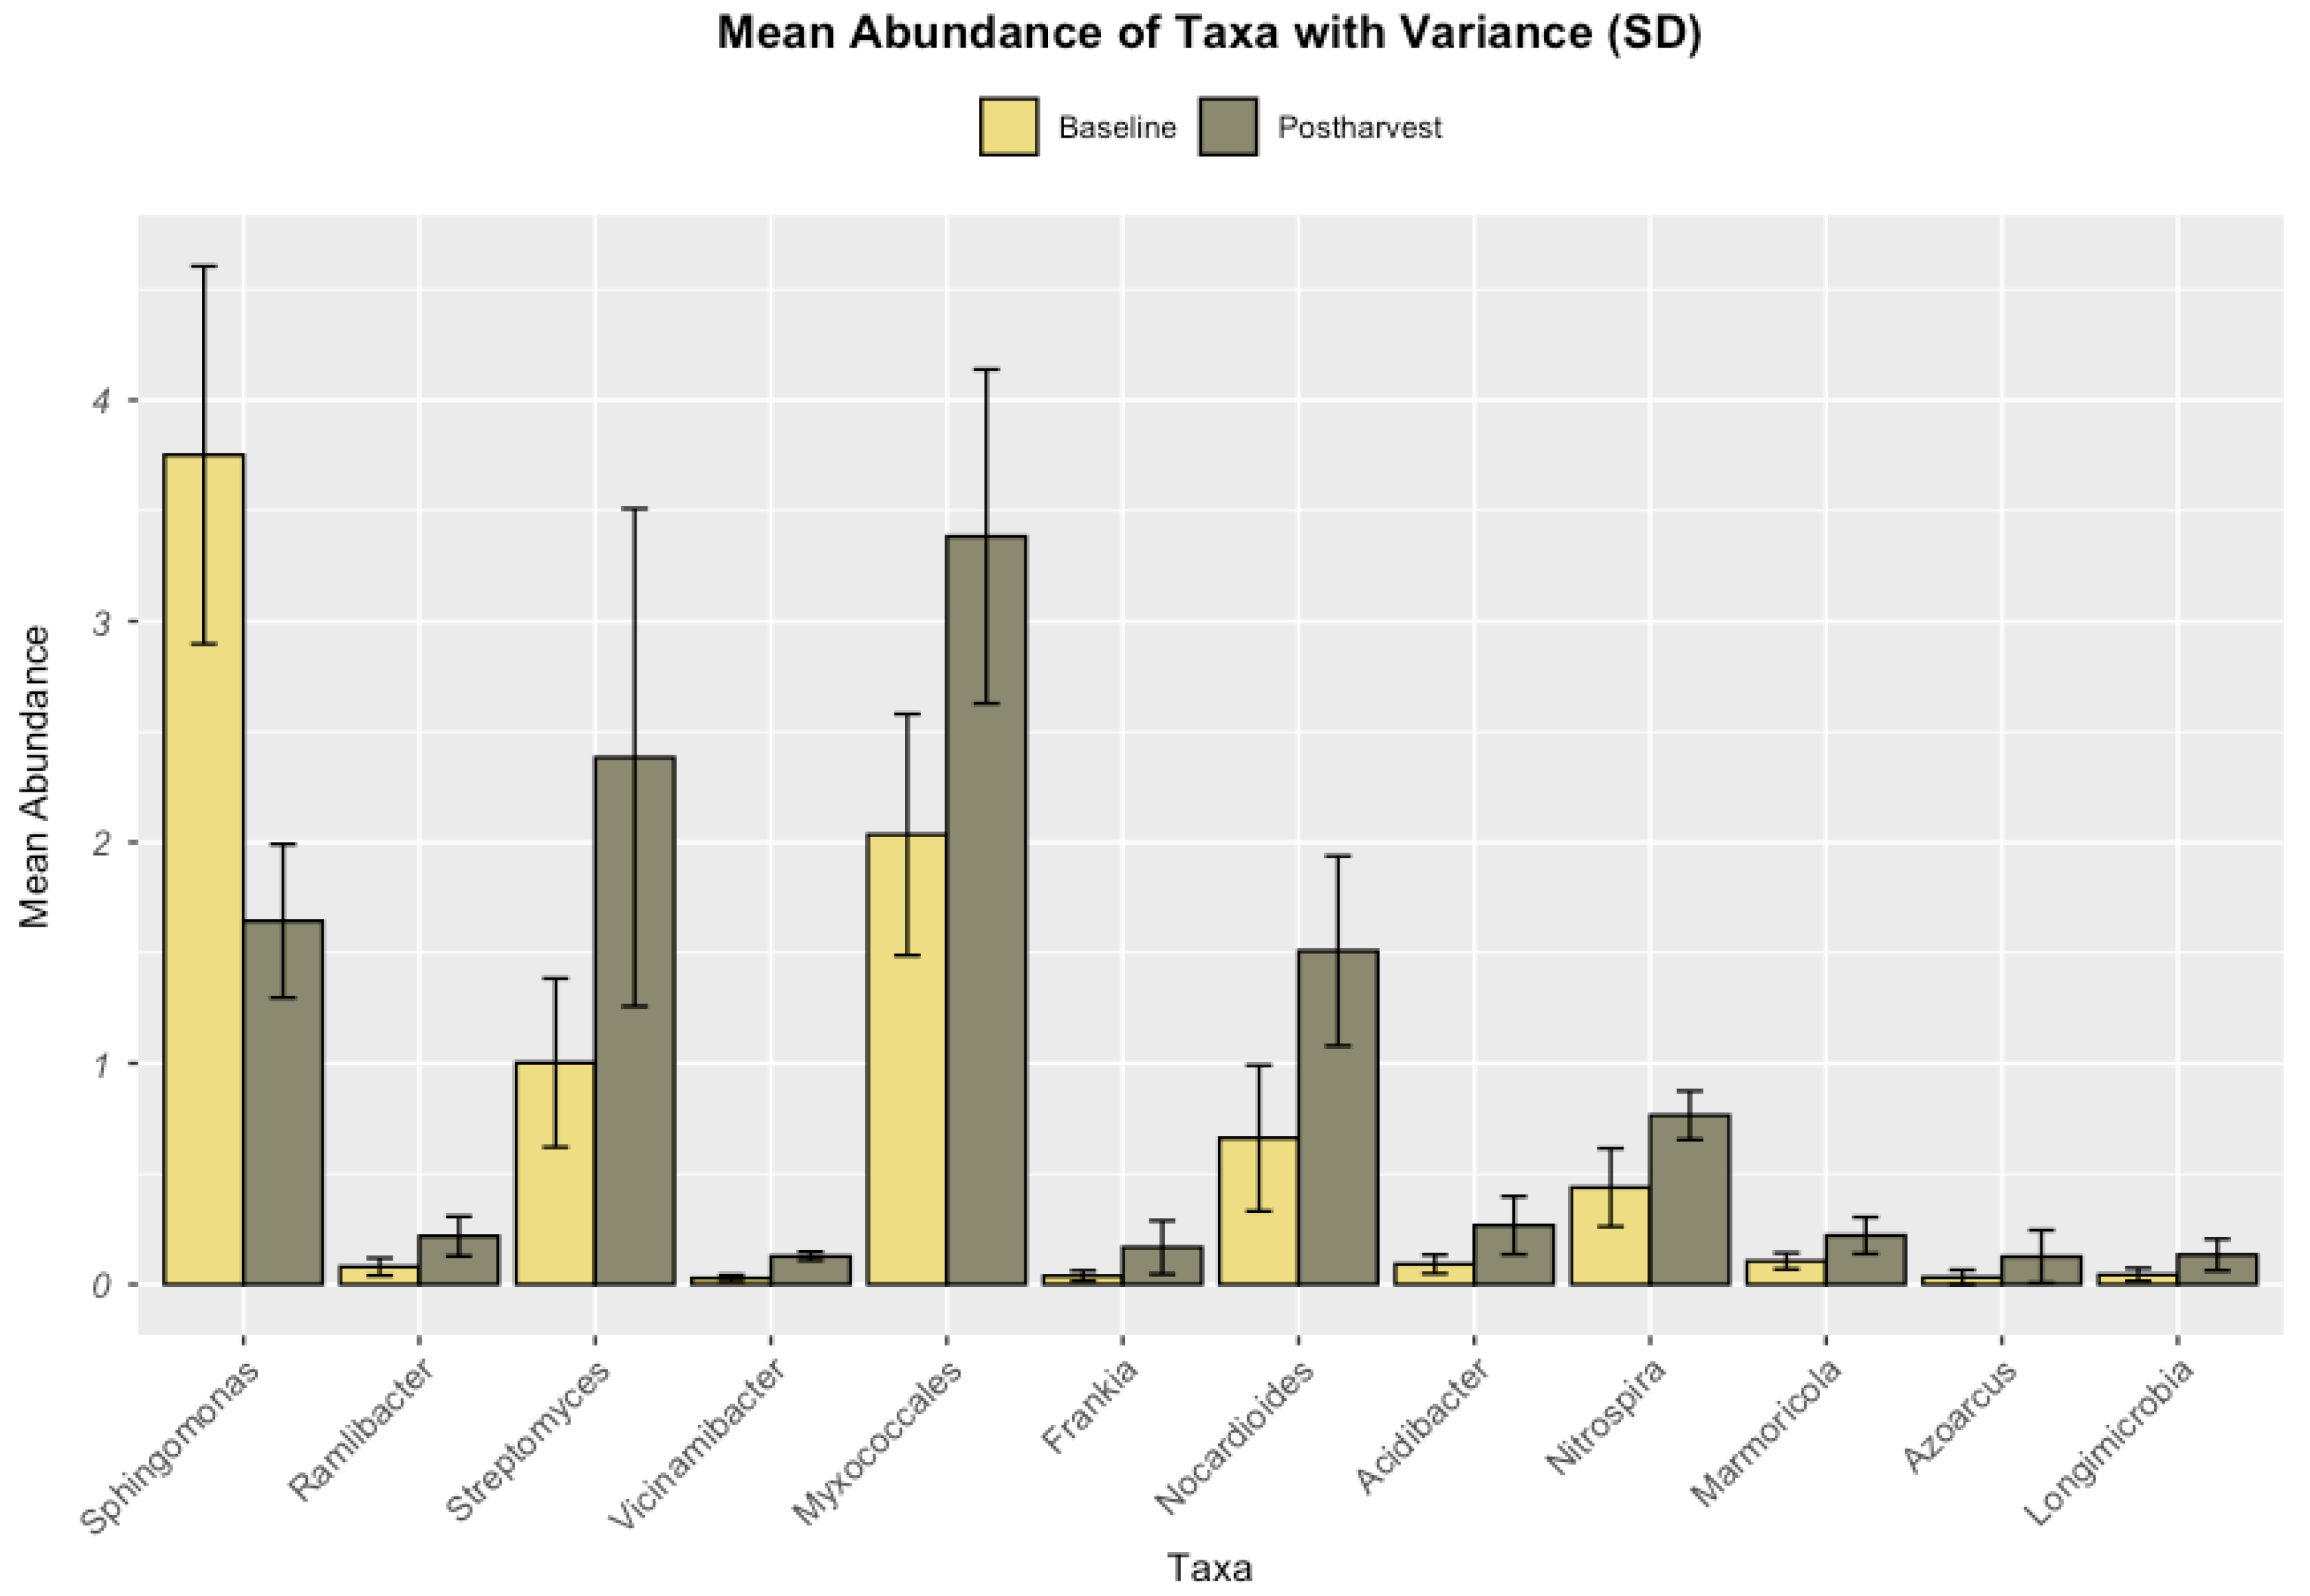
Table 4 highlights the key positive taxa identified post-treatment with PaleoPower, based on their LDA effect size and statistical significance. Taxa such as
Sphingomonas,
Ramlibacter, and
Streptomyces exhibited significant increases in relative abundance compared to untreated soils, suggesting enhanced functional contributions to nutrient cycling, pollutant degradation, and soil stability. The table also underscores the diversity of positively responding taxa across various taxonomic ranks, reflecting a broader microbial recovery and ecological balance promoted by the treatment.
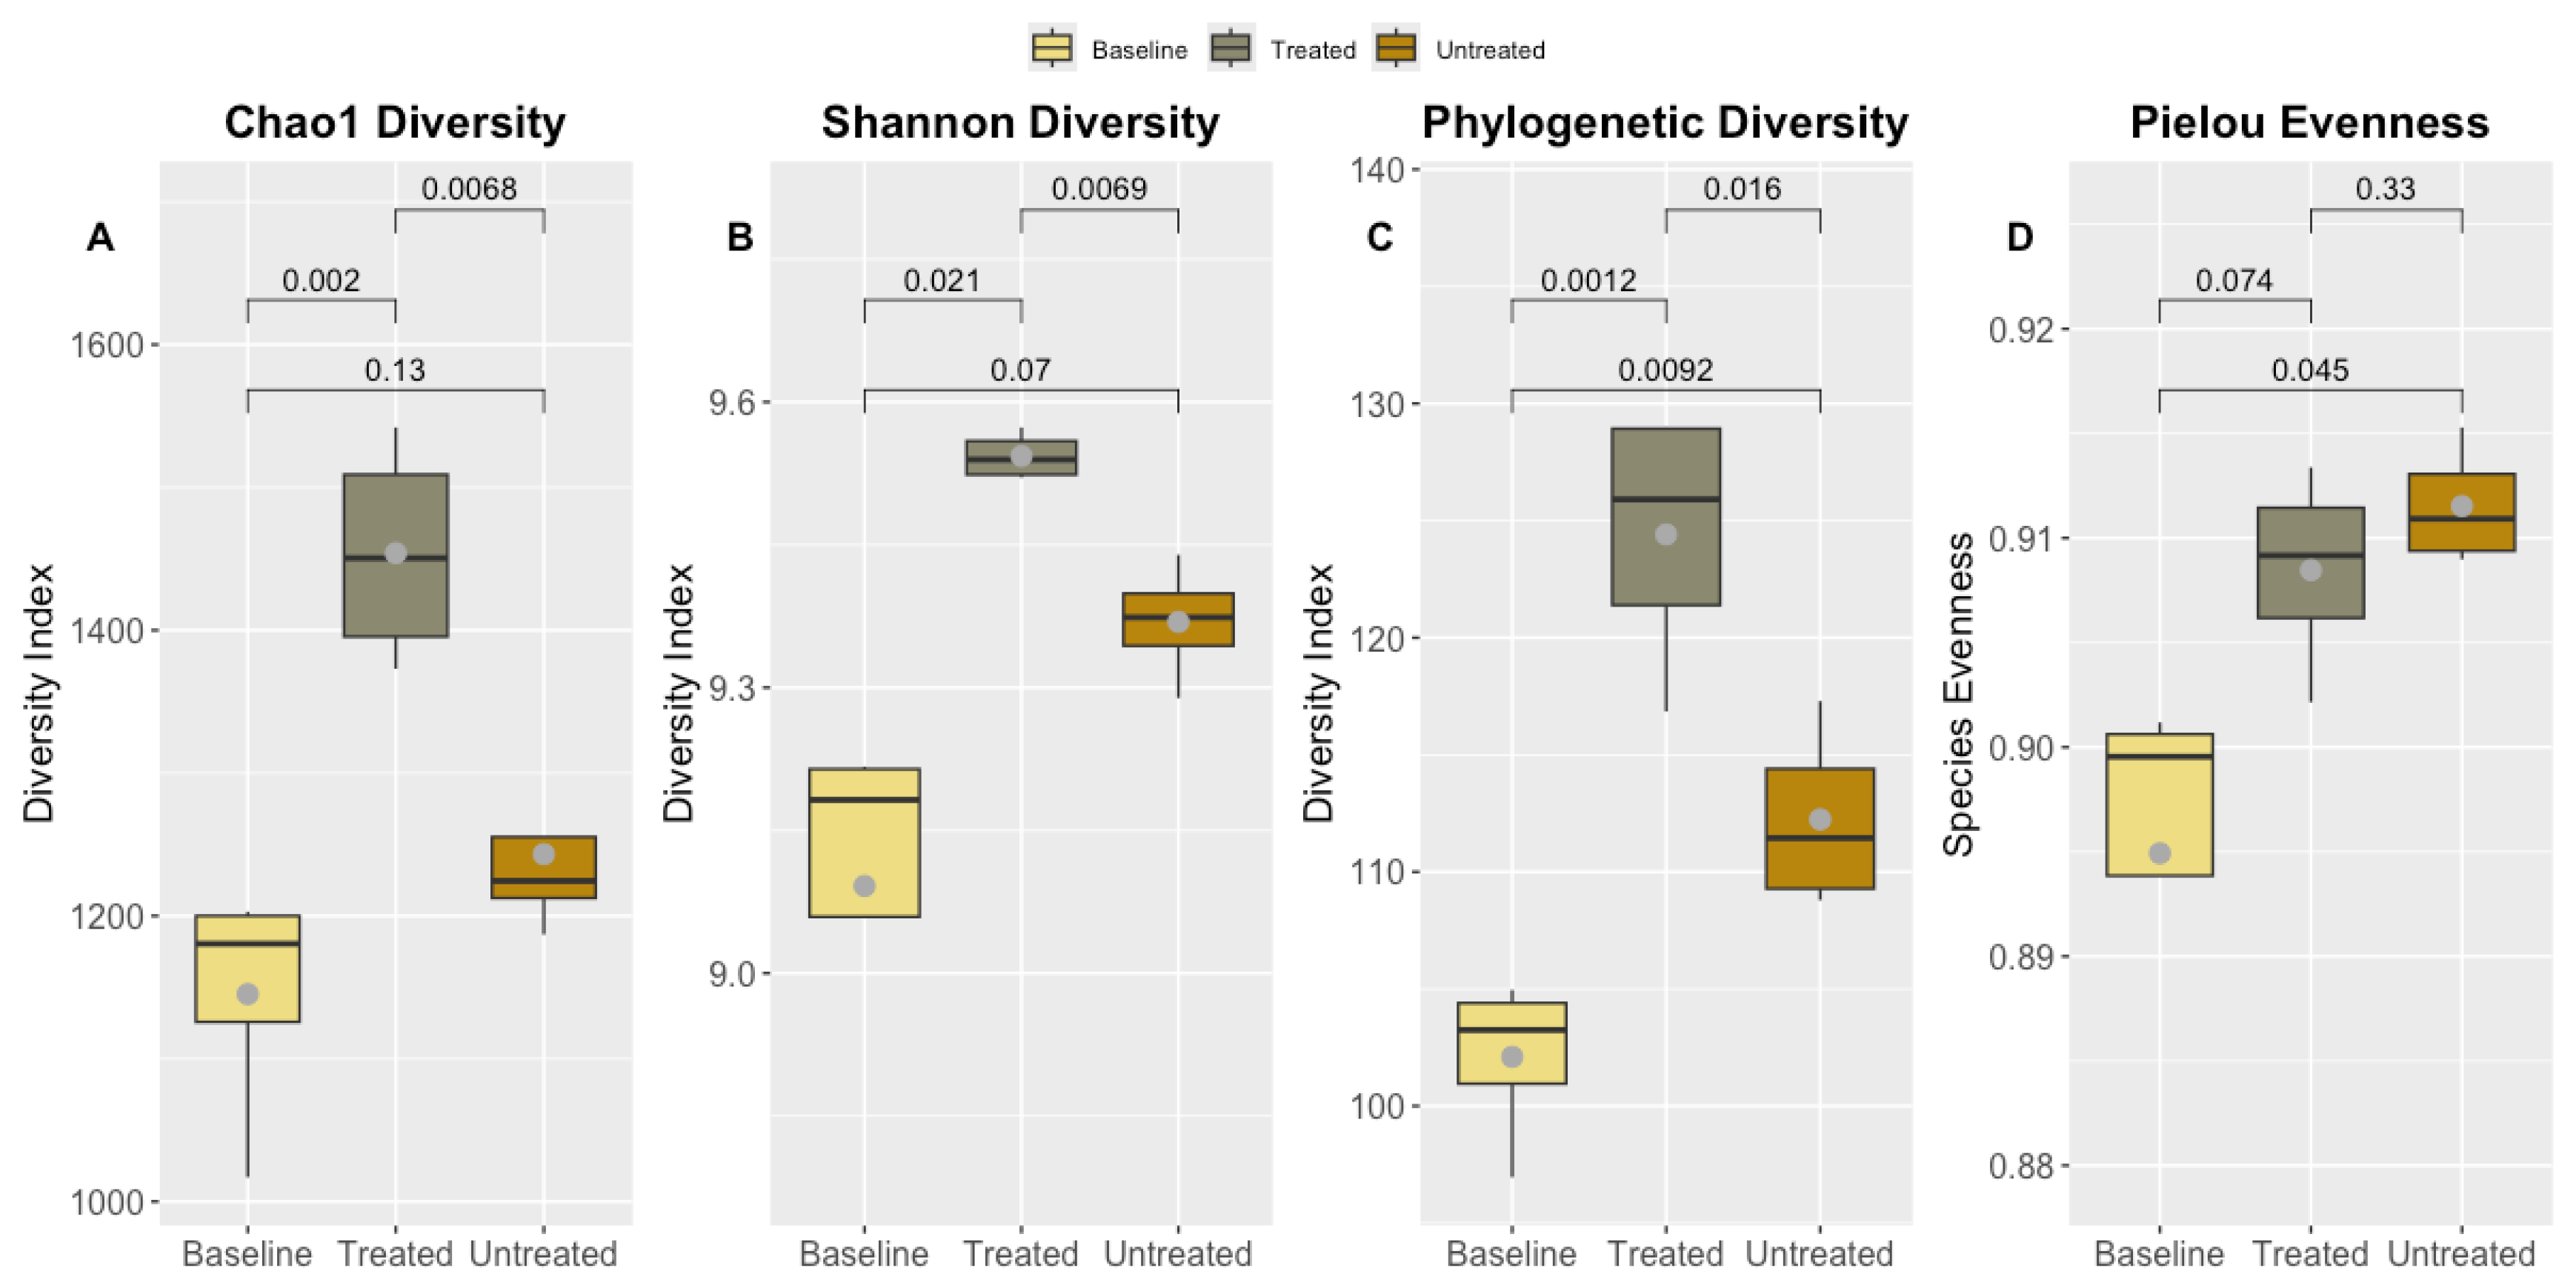
3.6. Alpha Diversity Metrics Across Baseline, Treated, and Untreated Cohorts
Alpha diversity metrics, including Chao1, Faith’s phylogenetic diversity, Pielou’s evenness, Shannon diversity, and Simpson index, were measured across baseline, treated, and untreated cohorts at different sampling times. In the baseline cohort (pre-harvest), Chao1 values ranged from 1,017 to 1,203, Faith’s phylogenetic diversity ranged from 96.95 to 104.96, Pielou’s evenness ranged from 0.879 to 0.901, Shannon diversity ranged from 8.79 to 9.22, and Simpson index values ranged from 0.995 to 0.997. For the treated cohort (post-harvest), Chao1 values ranged from 1,373 to 1,542, Faith’s phylogenetic diversity ranged from 116.85 to 128.98, Pielou’s evenness ranged from 0.902 to 0.913, Shannon diversity ranged from 9.52 to 9.57, and Simpson index values ranged from 0.998 to 0.999. In the untreated cohort (post-harvest), Chao1 values ranged from 1,187 to 1,337, Faith’s phylogenetic diversity ranged from 108.79 to 117.29, Pielou’s evenness ranged from 0.909 to 0.915, Shannon diversity ranged from 9.29 to 9.44, and Simpson index values ranged from 0.997 to 0.998. The distribution of these metrics across cohorts is shown in
Figure 3.
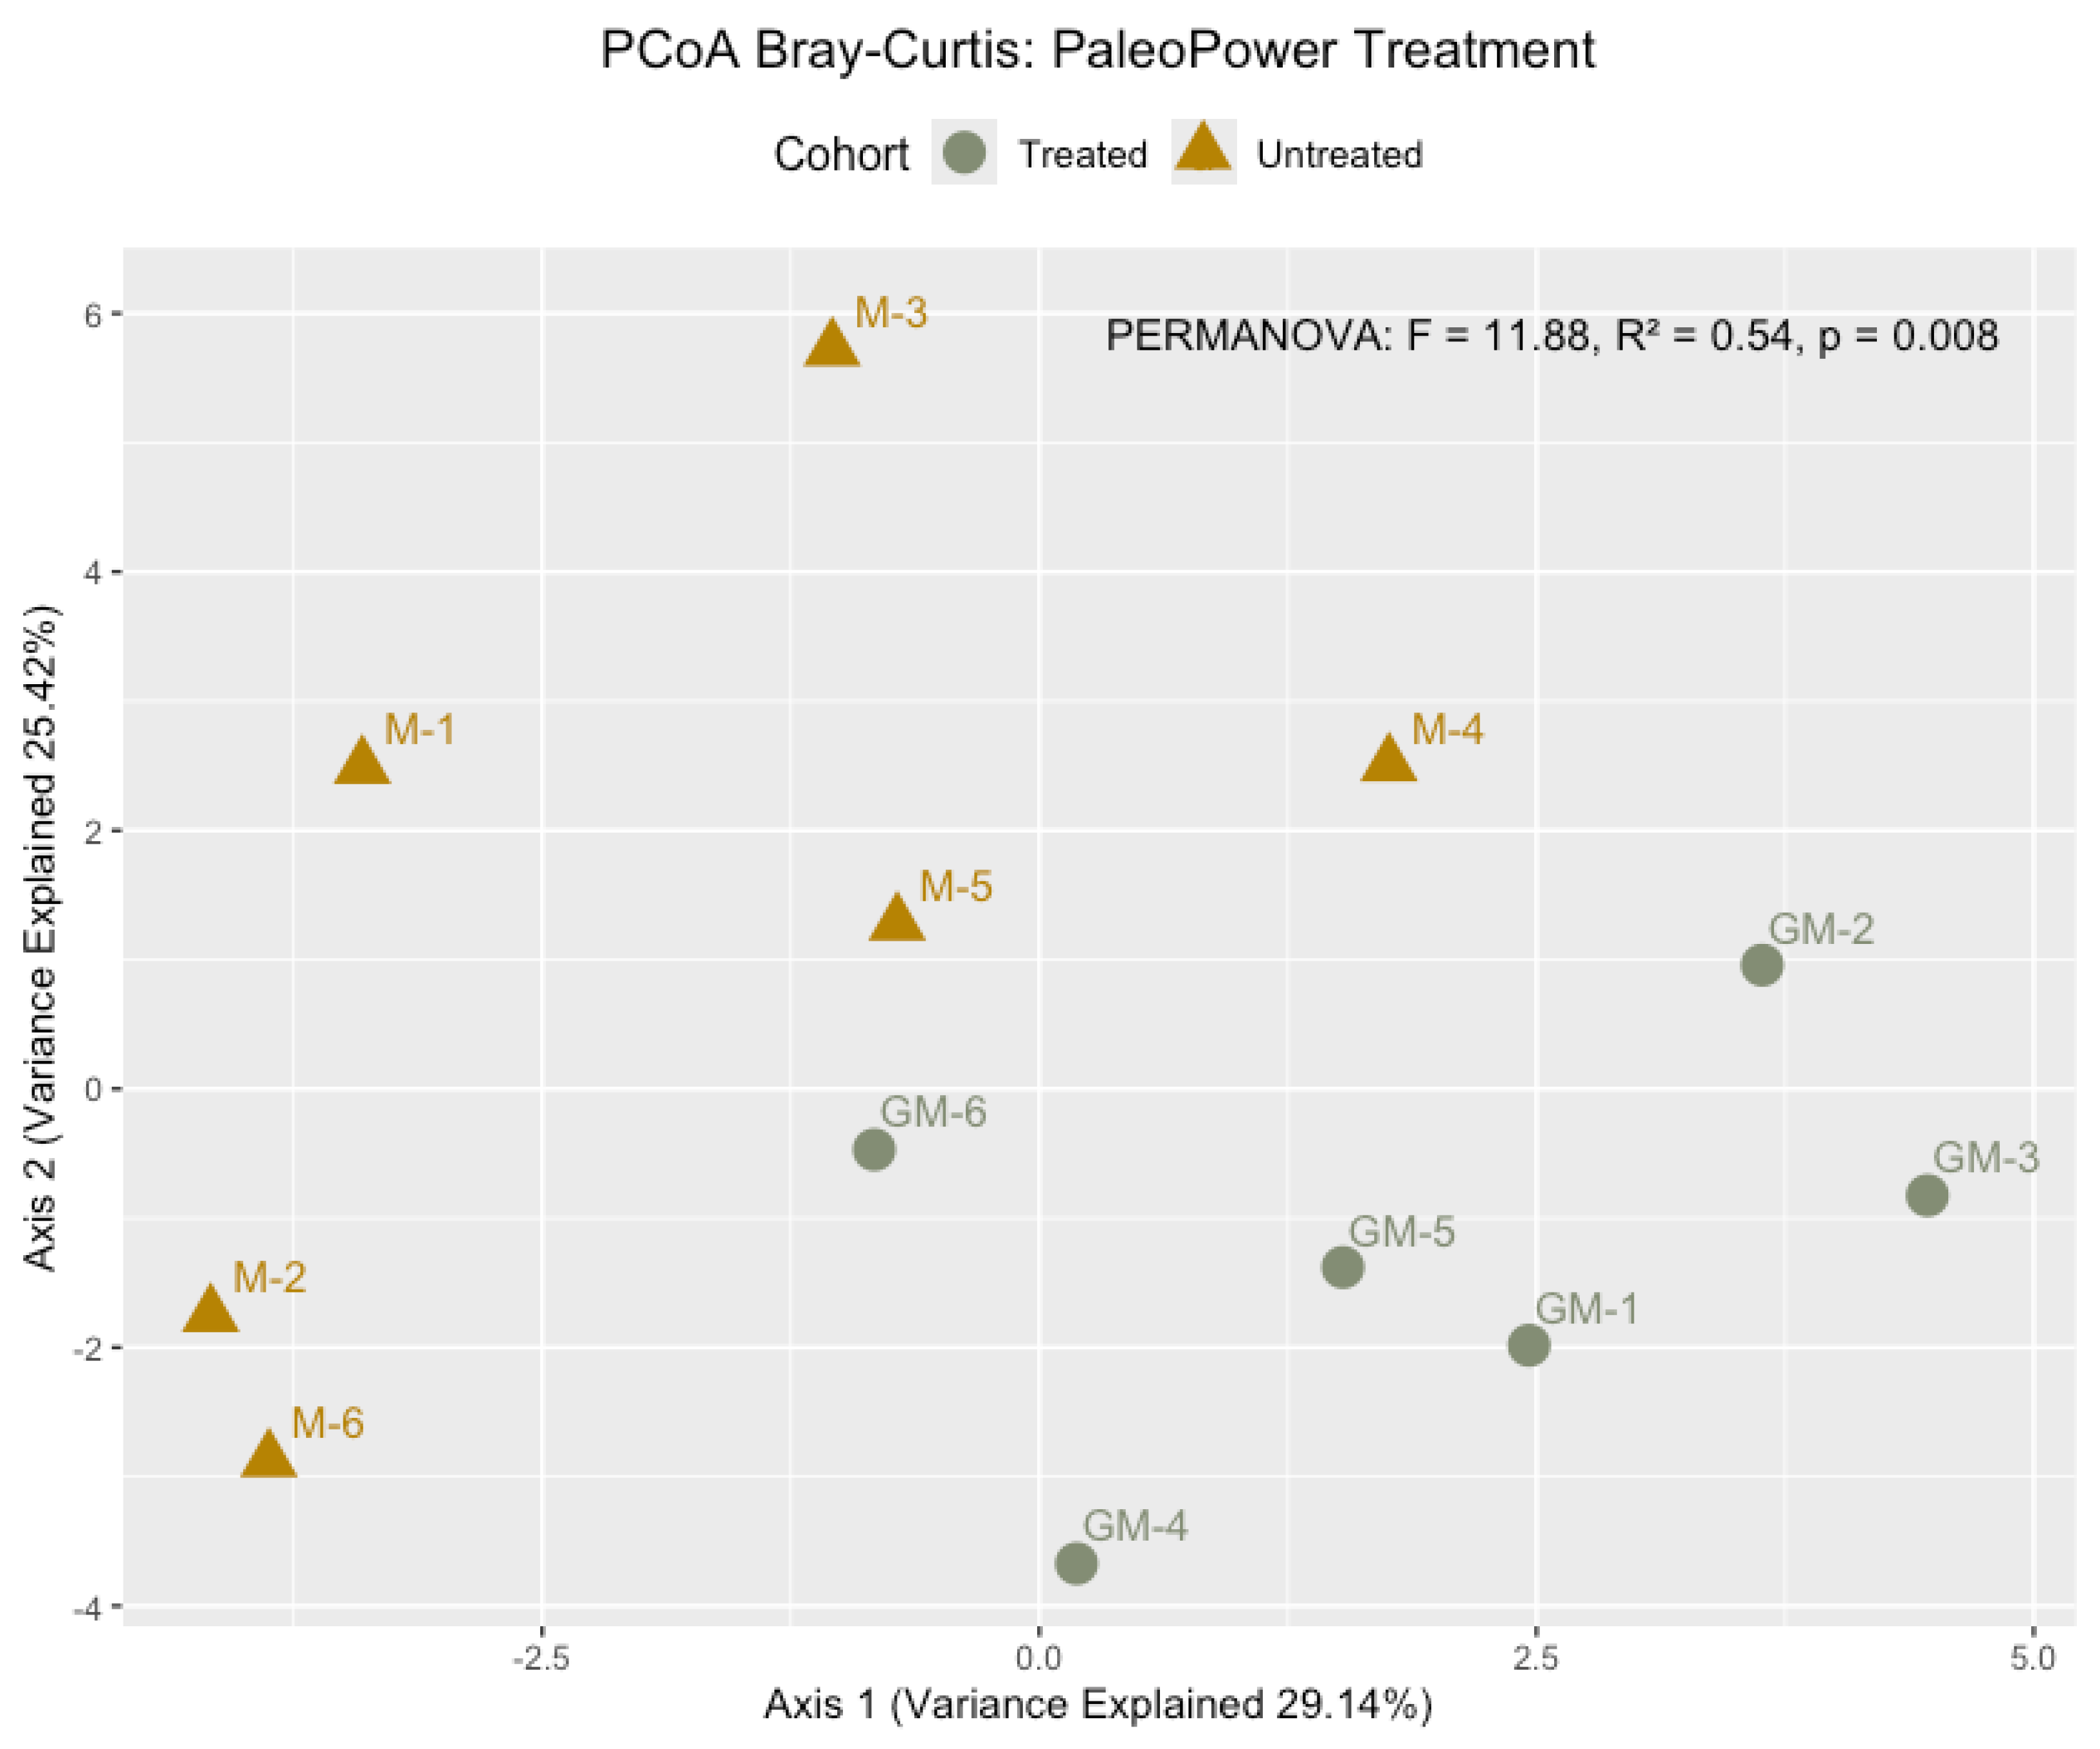
3.7. Beta Diversity Analysis of Glyphosate Levels and Treatment Effects on Microbial Community Composition
PERMANOVA analysis (p = 0.001), conducted using the adonis2 function in R, revealed significant differences in microbial community composition between untreated and PaleoPower-treated glyphosate-contaminated soils. These differences are illustrated in the Principal Coordinates Analysis (PCoA) plot (
Figure 4), which demonstrates distinct clustering of microbial communities based on glyphosate exposure and treatment. Untreated glyphosate-contaminated soils displayed a tightly clustered grouping, indicative of a homogenized microbial community dominated by glyphosate-resistant taxa. In contrast, PaleoPower-treated soils exhibited a more dispersed clustering pattern, suggesting increased microbial heterogeneity and a recovery of community complexity.
3.8. Random Forest Analysis of Microbial Taxa and Diversity Indices in Glyphosate Dynamics
Random Forest modeling was employed to evaluate the relationships between microbial taxa, diversity indices, and glyphosate degradation metrics, including glyphosate, AMPA, and TEG. Several microbial taxa emerged as significant predictors of glyphosate dynamics. Sphingomonas showed strong positive correlations with glyphosate (r = 0.85), AMPA (r = 0.83), and TEG (r = 0.86). Similarly, Mesorhizobium exhibited robust positive correlations with glyphosate (r = 0.88), indicating its association with glyphosate metabolism or ecological adaptation to the herbicide. In contrast, Nitrospira displayed strong negative correlations with glyphosate (r = -0.88), AMPA (r = -0.87), and TEG (r = -0.66), suggesting sensitivity to glyphosate or indirect ecological relationships associated with its degradation. Other taxa, such as Dokdonella and Arenimonas, showed moderate positive correlations with AMPA and TEG.
Diversity indices were also assessed for their predictive power in relation to glyphosate metrics. Metrics such as Faith’s Phylogenetic Diversity (Faith’s PD), and Chao1 were moderately positively correlated with glyphosate levels. Faith’s PD, which incorporates evolutionary relationships among taxa, provided unique insights into the disproportionate impact of glyphosate on phylogenetically distinct microbial groups. In contrast, Pielou’s Evenness exhibited weak correlations with glyphosate and AMPA, suggesting that these compounds primarily affect richness and phylogenetic diversity rather than community evenness.
The retraining of the Random Forest model improved its predictive performance for glyphosate levels, with the R² increasing from -0.055 to 0.24 and a reduction in mean squared error (MSE). Predictions for AMPA (R² = 0.13) and TEG (R² = 0.07) were less accurate, highlighting the need for further optimization of the model. Feature importance metrics confirmed the significant roles of Sphingomonas and Mesorhizobium as key contributors to glyphosate dynamics.
3.9. Correlation Analysis
Correlation analysis was performed to identify relationships between microbial taxa, diversity indices, and glyphosate degradation metrics, including glyphosate, AMPA, and TEG. Mesorhizobium demonstrated strong positive correlation with glyphosate (r = 0.88, respectively), indicating their association with glyphosate dynamics. In contrast, Nitrospira exhibited a strong negative correlation with AMPA (r = -0.87) and glyphosate (r = -0.88). Additional taxa, such as PAC000016_f_uc, showed strong positive correlations with AMPA (r = 0.86).
Alpha diversity indices demonstrated distinct patterns of correlation with glyphosate and its metabolites. Faith’s Phylogenetic Diversity (Faith’s PD) showed moderate positive correlations with AMPA (r = 0.39) and Effective Glyphosate (r = 0.40), highlighting its association with phylogenetic diversity. Chao1 and Observed Features exhibited weaker correlations with glyphosate-related metrics, while Pielou’s Evenness displayed minimal correlations with both glyphosate and AMPA, suggesting limited influence on species evenness.
The statistical robustness of these results was evaluated through Pearson [
46] and Spearman [
50]correlation tests, with significant correlations (p < 0.05) observed for key taxa and metrics. Notably, unclassified taxa such as
Demequinaceae_uc showed strong associations with AMPA and TEG (p < 0.001), indicating their potential involvement in downstream degradation processes.
3.10. Metabolic and Regulatory Adaptations Post-Harvest
The results presented in
Table 5 demonstrate significant post-harvest changes in key metabolic pathways and processes, categorized into Fundamental Processes, Phosphate Metabolism, and Homeostasis and Osmotic Stress. Among the fundamental processes, pathways such as Starch Sucrose Metabolism and Fatty Acid Biosynthesis showed modest increases of 2.3% and 2.6%, respectively, indicating enhanced carbohydrate processing and lipid synthesis. Remarkable changes were observed in the Oligogalacturonide Transport System Substrate-Binding Protein, which increased by 66.7%, and indicated improved oligosaccharide transport. N-Glycan Biosynthesis (High-Mannose Type) and Ribosome Biogenesis GTPase/Thiamine Phosphate Phosphatase increased by 9.1% and 7.6%, respectively to highlight improvements in glycosylation processes and protein synthesis.
In the Phosphate Metabolism category, substantial upregulation was observed, particularly in Methane Metabolism, which showed an astonishing 7150.9% increase, indicating a major metabolic shift in methane-related pathways. Similarly, pathways involving 1L-Myo-Inositol 1-Phosphate Cytidylyltransferase and Multiple Inositol-Polyphosphate Phosphatase increased by 65.7%, suggesting enhanced inositol phosphate metabolism. The 78.3% increase in 3,4-Dideoxy-4-Amino-D-Arabino-Heptulosonate 7-Phosphate Synthase indicates increased activity in secondary metabolic pathways, while the PhoR-PhoB Two-Component Regulatory System and Phosphate Acetyltransferase-Acetate Kinase Pathway showed increases of 9.6% and 7.8%, respectively, to indicate improved responses to phosphate availability and enhanced acetate metabolism.
The pathways associated with Homeostasis and Osmotic Stress also exhibited considerable changes. Sulfiredoxin increased by 225% and indicates a strong oxidative stress response, while the Manganese/Iron Transport System showed a modest 4.2% increase to indicate improved ion transport and homeostasis. Enhanced osmotic stress resistance was observed with an 18.1% increase in Ectoine Hydroxylase, while Anaerobic Nitric Oxide Reductase Transcription Regulator increased by 23.2% to demonstrate improved regulatory mechanisms under anaerobic conditions. Overall, these findings underscore the significant metabolic and regulatory adaptations of the soil microbiome that occur with reductions in residual glyphosate post-harvest, particularly in pathways associated with stress responses, phosphate metabolism, and fundamental biosynthetic processes.
4. Discussion
4.1. Multi-Functional Benefits of Co-Fermented Microbial Inoculant
The co-fermentation of eight bacterial strains in a standardized medium with 2% organic molasses resulted in a high-density microbial product with significant potential for sustainable agricultural applications. Careful regulation of pH, temperature, and aeration ensured uniform microbial growth and metabolic activity to achieve a total viable cell count of 7.2 × 10⁹ cells per gram, including 4.05 × 10⁹ spores per gram. The presence of spores enhances the product's shelf-life, stability, and resistance to environmental stresses during field applications.
Among the viable microbes, the presence of lactic acid bacteria is noteworthy. These bacteria contribute to enhanced nutrient bioavailability, organic matter decomposition, and suppression of pathogens through the production of antimicrobial compounds. This makes the inoculant a valuable tool for promoting a healthy soil microbiome.
Additionally, the product contained 1.19 × 10⁷ injured cells per gram and 2.79 × 10⁷ dead cells per gram, which serve as nutrient sources for postbiotics and metabiotics. These bioactive components, including peptides, enzymes, and short-chain fatty acids, have been shown to positively influence soil and plant health by modulating microbial communities, enhancing nutrient cycling, and improving plant resilience [
51,
52]. The presence of residual organic molasses amplifies the product's functionality as a prebiotic [
51] to provide substrates for beneficial microbes to stimulate microbial activity and ecosystem stability [
53,
54].
The combination of probiotics, postbiotics, and prebiotics underscores the multi-functionality of this microbial product. Its high cell density and bioactive byproducts provide a powerful solution for addressing soil degradation, improving nutrient cycling, and promoting sustainable agriculture. Moreover, the robust microbial concentration ensures that effective doses can be delivered across large-scale field applications, enhancing the practicality of its use in diverse agricultural systems. This aligns with the growing demand for innovative, eco-friendly solutions that enhance soil health and productivity while reducing reliance on chemical inputs [
55,
56].
4.2. Impact of PaleoPower Application on Indigenous Soil Microbial Communities and Glyphosate Residue Dynamics.
The application of PaleoPower to half of the study area at a concentration of 1.6 × 10⁸ CFU per square meter demonstrated an effective strategy for delivering a microbial inoculant to the soil. By diluting the product in water and spraying it at a rate of 10 gallons per acre over unplanted land, the application ensured uniform coverage and consistent microbial load distribution. This process facilitated optimal contact with the soil, allowing for successful colonization by both live cells and spores introduced through the inoculant. Uniform dispersal is critical with soil treatments to maximize microbial activity and interactions across the treated area and support basic ecosystem processes such as nutrient cycling, organic matter decomposition, and microbial competition with native taxa.
The systematic sampling of treated and untreated soil at multiple time points further enhanced the robustness of the study. Soil cores collected from the cotton field in Tanner, Alabama provided sufficient material for suitable analyses of both microbiome structure and function, and glyphosate residue dynamics. The soil, classified as silt loam or clay loam, is typical of agricultural systems and provides a medium-textured environment conducive to microbial colonization and activity [
57,
58]. Sampling occurred at two time points—baseline (April 2023) and post-harvest six months later (October 2023)—encompassing the
critical root zone where microbial processes and glyphosate residues are concentrated [
13,
59]. By targeting this depth (6–8 inches), the study was able to assess microbial responses to the PaleoPower treatment and quantify the persistence and degradation of glyphosate over the growing season.
The paired core strategy, with 12 cores collected per sampling event, accounted for field variability and provided sufficient replicates to support statistical analyses. This methodological rigor allowed for the identification of significant shifts in soil microbial communities and chemical residues post-treatment. Notably, the high-quality microbiome data enabled the evaluation of taxonomic and functional changes in soil microbial populations to include taxa associated with nutrient cycling, glyphosate degradation, and soil health improvements. Additionally, the chemical residue analysis provided insights into the fate of glyphosate and its degradation products under field conditions, particularly in relation to microbial activity stimulated by PaleoPower.
4.3. Impact of PaleoPower on Glyphosate Degradation and AMPA Reduction
The application of PaleoPower demonstrated a significant impact on glyphosate degradation and its recalcitrant byproduct, AMPA, in treated soils. Baseline samples, collected prior to treatment contained elevated levels of glyphosate (32.1–79.36 µg/kg), AMPA (252.72–822.43 µg/kg), and TEG (421.92–1309.86 µg/kg) to document the persistence of glyphosate residues and their degradation products due to prior herbicide applications.
In untreated soils, glyphosate concentrations remained stable (32.3–48.15 µg/kg), while AMPA levels (292.27–584.09 µg/kg) were especially high. This observation highlights the activity of autochthonous (native) bacteria that naturally possess enzymatic pathways for initial glyphosate breakdown [
60]; however, the persistence of AMPA in untreated soils underscores its recalcitrant nature and the slower rate of its further degradation in the absence of targeted interventions.
In contrast, soils treated with PaleoPower showed a more pronounced reduction in both glyphosate and AMPA levels. Glyphosate concentrations ranged from 8.52 to 86.36 µg/kg, while AMPA levels declined significantly to 47.21–287.75 µg/kg. The TEG in treated soils was reduced to 104.74–472.75 µg/kg, indicating enhanced microbial degradation activity. These reductions highlight PaleoPower's selective ability to increase the enzymatic capacity of the soil microbiome to accelerate glyphosate breakdown and facilitate the degradation of its recalcitrant byproduct, AMPA [
61,
62]
.
The observed results suggest a dual mechanism driving these improvements in treated soils. First, PaleoPower directly introduced a combination of live cells and spores that enhanced microbial diversity with organisms capable of producing key enzymes such as C-P lyases and oxidoreductases required for glyphosate and AMPA degradation [
7,
63]. Second, the inoculant likely stimulated the growth and activity of native glyphosate-tolerant and degrading bacteria to amplify the soil's natural enzymatic repertoire and improve functional diversity [
64,
65].
While autochthonous bacteria in untreated soils demonstrated a baseline capacity to degrade glyphosate to AMPA, the accelerated breakdown and reduced AMPA levels in treated soils underscore the additional benefit of the microbial inoculant. By enhancing the existing microbial community, PaleoPower provided a targeted and efficient approach to remediating glyphosate-contaminated soils, improving soil health, and facilitating recovery of the soil ecosystem.
4.4. Impact of PaleoPower on Soil Microbial Composition
The application of PaleoPower led to significant shifts in soil microbial composition, as evidenced by LEfSe analysis, which identified 206 taxonomic biomarkers across 24 bacterial orders. Among these, 12 taxa exhibited the highest Differential Abundance (DA) scores that highlight substantial changes in their relative abundance (RA) post-treatment (
Figure 2,
Table 3 and
Table 4). These changes reflect the selective impact of PaleoPower in enhancing specific bacterial groups while reshaping the broader microbial community structure, consistent with reported findings on other microbial inoculants in agricultural systems [
66,
67,
68].
Positive responders, which demonstrated significant increases in relative abundance post-harvest, included key taxa such as Actinobacteria (+52.4%), Clostridia (+89.5%), Deltaproteobacteria (+28.5%), and
Nitrospira (+22.4%) (
Table 3). Actinobacteria, known for their role in organic matter decomposition, antibiotic production, and carbon cycling, likely contributed to improved nutrient turnover and enhanced soil fertility. The sharp increase in Clostridia, a group involved in anaerobic organic matter breakdown and carbon cycling is consistent with its capacity to improve soil structure and nutrient bioavailability [
69,
70]. The rise of Deltaproteobacteria further supports enhanced nitrogen cycling processes, particularly denitrification pathways; while the increase in
Nitrospira, a key nitrite-oxidizing genus, indicates increased nitrification activity. affecting plant nitrogen availability [
71,
72].
In contrast, taxa such as Chloroflexia (-102.2%), Spartobacteria (-103.7%), and Sphingobacteria (-66.4%) exhibited notable reductions in relative abundance. These declines suggest a restructuring of the microbial community post-treatment that is likely due to competition with introduced and promoted taxa. Spartobacteria and Sphingobacteria, often associated with oligotrophic environments, may have been displaced by microbial groups better suited to the enriched nutrient and biological activity conditions facilitated by PaleoPower [
73,
74,
75].
Table 4 highlights the functional significance of key positive taxa that responded to PaleoPower treatment. For instance, Sphingomonas (LDA = 3.91), which increased significantly (2.86 treated vs. 1.29 untreated), is known for its ability to degrade environmental pollutants, including glyphosate and its recalcitrant byproducts such as AMPA, contributes to soil remediation [
76,
77]. Similarly, increases in
Ramlibacter, Streptomyces, and
Nocardioides are associated with enhanced organic matter decomposition, nitrogen fixation, and soil stabilization—functions crucial for long-term soil health and productivity [
78,
79,
80,
81]. Notably, the rise in Frankia, a genus of nitrogen-fixing bacteria [
82], and Nitrospira highlights the improvement in nitrogen cycling processes within the treated soils [
71,
83]. Other taxa, including
Myxococcus support improved ecosystem functionality [
66,
85] through their roles in predatory behavior, organic matter turnover, and pollutant degradation [
84].
Overall, these results indicate that PaleoPower successfully enhanced the growth and activity of both introduced strains and autochthonous, glyphosate-tolerant microbial groups, thereby expanding the enzymatic repertoire of treated soils. This dual action—via inoculation and stimulation of native functional microbes—promotes nutrient cycling, organic matter decomposition, and pollutant degradation to underscore the selective impact of PaleoPower in restoring microbial balance. These findings are consistent with prior studies that demonstrate the role of microbial inoculants in improving soil health and ecosystem stability [
86,
87]
.
4.5. Alpha Diversity Analysis
The integration of glyphosate and TEG levels with alpha diversity metrics provides insights into the relationship between microbial diversity and the remediation of glyphosate in treated and untreated cohorts compared to the baseline. The data reveal a clear association between glyphosate levels and alpha diversity metrics where the PaleoPower treatment shows notable improvements in both microbial diversity and glyphosate degradation.
4.5.1. Correlation Between Glyphosate and Alpha Diversity Metrics
At baseline, glyphosate levels ranged from 32.1 to 79.36 ppm, AMPA from 252.72 to 822.43 ppm, and TEG from 421.92 to 1,309.86 ppm. The alpha diversity metrics during this period showed moderate values for richness (Chao1: 1,017–1,221), diversity (Shannon: 8.78–9.38), and phylogenetic diversity (Faith’s PD: 96.95–108.79). These results suggest that higher glyphosate levels at baseline were associated with reduced microbial richness and diversity, consistent with reports that glyphosate can negatively affect microbial communities by inhibiting the shikimate pathway in certain microorganisms [
63,
77].
In the untreated cohort, post-harvest glyphosate levels remained relatively high, with glyphosate ranging from 32.3 to 48.15 ppm and TEG from 486.56 to 912.28 ppm. The alpha diversity metrics in this cohort improved slightly compared to the baseline (Chao1: 1,199–1,228; Shannon: 9.21–9.36; Faith’s PD: 104.21–113.44). These modest increases likely reflect natural microbial recovery processes following harvest but were insufficient to significantly reduce glyphosate levels. The persistence of high AMPA and TEG levels indicates that there is limited microbial degradation capacity without treatment.
In contrast, the treated cohort exhibited significantly lower glyphosate levels (8.52–86.36 ppm) and corresponding reductions in AMPA (47.21–287.75 ppm) and TEG (104.74–472.75 ppm). These reductions were accompanied by substantial increases in alpha diversity metrics. For example, Chao1 values ranged from 1,187 to 1,542, Shannon diversity from 9.29 to 9.57, and Faith’s PD from 109.45 to 128.98. The higher richness, evenness, and phylogenetic diversity in the treated cohort suggest that the microbial inoculant in PaleoPower enhanced the community’s ability to degrade glyphosate and its byproducts through functional redundancy and the increased abundance of glyphosate-tolerant or degrading microbes [
88,
89].
Glyphosate targets 5-enolpyruvylshikimate-3-phosphate synthase (EPSPS) and 3,4-Dideoxy-4-amino-d-arabino-heptulosonate 7-phosphate synthase (
Table 5) which are pivotal enzymes in the shikimate pathway. This pathway is responsible for the biosynthesis of aromatic amino acids, including phenylalanine, tyrosine, and tryptophan, as well as secondary metabolites like indole-3-acetic acid, lignin, alkaloids, and flavonoids that are essential for the growth and survival of plants, fungi, and many bacteria [
12,
90,
91]. By competitively binding to EPSPS, glyphosate inhibits its activity and prevents the formation of 5-enolpyruvylshikimate-3-phosphate (EPSP), a precursor for aromatic amino acids. This blockage results in the accumulation of upstream metabolites, such as shikimate, while downstream products become depleted to ultimately disrupt critical cellular functions that lead to cell death in susceptible organisms [
92,
93].
The shikimate pathway is absent in animals, making glyphosate selective for plants and microorganisms that possess this biochemical pathway. This selectivity has far-reaching consequences since many soil microbial communities and animal GI tract microbes rely on the shikimate pathway for survival and function. Soil microorganisms that are unable to withstand glyphosate's inhibitory effects are particularly vulnerable, which leads to shifts in community composition. This selective pressure often favors glyphosate-resistant microbes which may carry mutations in the EPSPS gene or possess alternative metabolic pathways that bypass the shikimate pathway altogether [
94]. Such adaptations allow resistant taxa to dominate glyphosate-contaminated soils, while susceptible groups, often involved in key ecological processes like organic matter decomposition and nutrient cycling, are suppressed [
59,
95]. This disruption not only impacts microbial diversity but also undermines the overall functionality and health of soil ecosystems.
Furthermore, glyphosate's influence extends beyond its direct inhibition of EPSPS. By altering the microbial community composition, glyphosate indirectly affects soil biogeochemical cycles and ecosystem services. For example, reduced production of aromatic amino acids in susceptible microbial taxa can impair the synthesis of enzymes and metabolites required for processes like lignin degradation, phosphate solubilization, and nitrogen fixation. Over time, these disruptions can lead to the depletion of soil organic matter and reduced nutrient availability that further compound the negative effects of glyphosate on soil health and productivity [
2,
9,
64].
Glyphosate’s targeting of the shikimate pathway leads to a reduction in microbial diversity so that susceptible taxa are suppressed while resistant taxa become dominant. This imbalance can result in the homogenization of soil microbial communities, characterized by reduced richness and evenness [
96]. Sensitive groups that are responsible for critical ecological functions such as nutrient cycling, organic matter decomposition, and pathogen suppression, may decline or disappear entirely. Conversely, glyphosate-resistant taxa, such as certain
Pseudomonas species, can proliferate, further to narrow the range of ecological functions performed by the soil microbiome [
97].
The resilience and recovery of microbial diversity following glyphosate exposure hinge on the restoration of functional diversity, which involves reestablishing a balance between microbial groups with complementary ecological roles. This recovery is often slow and incomplete without external interventions. Biostimulants and microbial inoculants, such as consortia of beneficial bacteria or fungi, can help mitigate glyphosate’s effects by reintroducing key taxa and enhancing microbial functionality [
69,
98]. These treatments promote the enrichment of beneficial microbes such as
Burkholderia and Gemmatimonadetes which are associated with nutrient solubilization and organic matter turnover, thereby counteracting the disruptions caused by glyphosate to foster a more diverse and resilient microbial community [
99].
Ultimately, addressing glyphosate's pervasive effects requires not only reducing its application but also degrading accumulated residual soil glyphosate and implementing strategies that actively rebuild microbial diversity and restore the functionality of soil ecosystems.
4.5.2. Treatment Effects on Microbial Diversity and Glyphosate Remediation
The treated cohort demonstrated a stronger inverse relationship between glyphosate levels and alpha diversity metrics compared to the untreated cohort. For example, in the treated group, glyphosate levels as low as 8.52 ppm were associated with the highest Shannon diversity (9.57) and Faith’s PD (128.98). This finding highlights the efficacy of the treatment in both reducing glyphosate residues and promoting microbial diversity. Previous studies have shown that treatments involving microbial soil inoculants can enhance glyphosate degradation by introducing or enriching glyphosate-degrading bacteria such as select members of the genera
Pseudomonas and Bacillus [
63,
77].
In contrast, the untreated cohort displayed weaker correlations between glyphosate levels and diversity metrics. This suggests that the native microbial community lacked the capacity to effectively degrade glyphosate and is consistent with studies showing that high glyphosate concentrations can suppress microbial diversity and favor glyphosate-resistant taxa at the expense of overall community function [
12,
59,
100].
4.5.3. Implications for Soil Health
The observed increases in microbial richness and diversity in the treated cohort are critical for restoring soil health and ecosystem functionality. High microbial diversity is associated with enhanced resilience, nutrient cycling, and the breakdown of xenobiotics like glyphosate [
101,
102]. The strong inverse relationship between glyphosate levels and alpha diversity metrics in the treated cohort further underscores the potential of microbial inoculants to mitigate the negative effects of glyphosate on soil microbial communities [
103].
4.6. Beta Diversity Analysis
The beta diversity analysis of microbial community composition revealed significant differences between untreated glyphosate-contaminated soils and those treated with PaleoPower, as indicated by PERMANOVA results (p = 0.008, F-statistic = 11.88, R² = 0.54). These differences, visualized through Principal Coordinates Analysis (PCoA) based on Bray-Curtis dissimilarity (
Figure 4), underscore the impact of glyphosate contamination on microbial community structure and the ability of PaleoPower treatment to mitigate this disruption and restore microbial diversity and functionality [
104].
The PERMANOVA analysis, grounded in Bray-Curtis dissimilarity, demonstrated that variance in microbial composition was strongly associated with both glyphosate levels and the application of PaleoPower (p = 0.008). This variance is consistent with the clustering patterns observed in
Figure 3, which highlight significant beta diversity differences between groups. Untreated glyphosate-contaminated soils were dominated by resistant taxa, such as members of the Pseudomonadota (e.g.,
Pseudomonas), while sensitive taxa, including Acidobacteriota and Actinomycetota, were markedly underrepresented in the microbiome.
In contrast, soils treated with PaleoPower exhibited a recovery of alpha diversity metrics, with increased richness and evenness. This recovery was accompanied by the enrichment of beneficial taxa, such as Burkholderia and members of Gemmatimonadetes which are associated with critical ecological functions like phosphate solubilization and organic matter decomposition. The distinct clustering in the PCoA plot reflects the divergence between untreated and treated glyphosate-contaminated soils to facilitate the restoration of microbial diversity and functionality in response to PaleoPower treatment.
4.6.1. Microbial Community Homogenization in Glyphosate-Contaminated Soils
Glyphosate-contaminated soils formed a tightly clustered group in the PCoA plot, indicative of a homogenized microbial community. This clustering reflects the dominance of glyphosate-resistant taxa such as
Pseudomonadota (e.g.,
Pseudomonas) and the underrepresentation of sensitive taxa such as
Acidobacteria and
Actinobacteria. Homogenization of microbial communities in glyphosate-contaminated soils is consistent with previous studies showing that glyphosate selectively suppresses sensitive microbial populations while favoring resistant taxa capable of metabolizing glyphosate as a carbon or phosphorus source [
2,
105]. This reduction in microbial diversity and complexity compromises key soil ecosystem functions such as nutrient cycling, organic matter decomposition, and pathogen suppression.
The reduction in microbial heterogeneity in untreated soils aligns with previous studies showing that glyphosate disrupts microbial communities to favor a narrow set of resistant taxa while reducing overall diversity and resilience [
106]. This community homogenization can exacerbate soil health degradation in contrast to diverse microbial assemblages that are better equipped to perform critical ecological functions and buffer against environmental disturbances [
101].
4.6.2. Recovery of Microbial Diversity and Functionality in Treated Soils
In contrast, glyphosate-contaminated soils treated with PaleoPower exhibited a more heterogeneous microbial community as reflected in the dispersed clustering observed in PCoA analyses. This pattern is consistent with the recovery of microbial complexity and diversity reported in other studies involving soil amendments or biostimulants [
107,
108,
109]. The enrichment of beneficial taxa such as Burkholderia and Gemmatimonadetes indicates that PaleoPower treatment facilitated the re-establishment of functionally significant microorganisms.
Burkholderia species are widely recognized for their role in phosphate solubilization [
110,
111], while Gemmatimonadetes contribute to the decomposition of organic matter and nutrient cycling [
112,
113].
This recovery in microbial diversity aligns with findings by Li et al. (2024) [
114] who reported that soil microbial inoculation enhanced both alpha diversity and functional resilience in agricultural soils degraded by chemical stressors. Additionally, the reduction of glyphosate residues in treated soils (
Section 3.4) suggests that inoculation with PaleoPower not only promoted microbial growth but also enhanced the activity of autochthonous glyphosate-tolerant and degrading bacteria to restor ecological balance.
4.6.3. Functional and Ecological Implications
The significant beta diversity differences (
p = 0.008) observed between untreated and treated soils highlight the dual impact of glyphosate exposure: suppression of sensitive taxa (e.g.,
Methylobacterium) [
115] and the dominance of glyphosate-resistant groups such as
Pseudomonas, which are known for their biodegradation capacity [
116,
117]. However, prolonged dominance of these resistant microbes can limit overall community functionality and stability [
118,
119]. In contrast, the PaleoPower treated soils had not only increased microbial diversity but also the recovery of taxa critical for ecological functions such as organic matter turnover, nutrient cycling, and pathogen suppression.
The observed recovery is consistent with prior studies on microbial inoculants, such as those reported by Griffiths and Philpott (2013) where biostimulants increased soil microbial heterogeneity and resilience following chemical perturbation [
120]. By promoting the growth of functionally diverse taxa, treatments like PaleoPower enhance soil ecosystem resilience and preserves key processes required for long-term agricultural sustainability [
109].
4.7. Correlation Analysis and Random Forest Evaluation of Microbial Taxa in Glyphosate Dynamics
Correlation analysis and Random Forest evaluation provided complementary insights into the relationships between microbial taxa, diversity indices, and glyphosate degradation metrics, such as glyphosate, AMPA, and TEG. While both approaches identified key microbial taxa and diversity metrics associated with glyphosate dynamics, their combined use revealed nuanced patterns of microbial responses and predictive relationships.
4.7.1. Key Microbial Predictors Identified in Correlation Analysis
Correlation analysis identified
Sphingomonas and
Mesorhizobium as strongly positively associated with glyphosate (r = 0.85 and r = 0.88, respectively), suggesting their ecological roles in glyphosate metabolism or tolerance mechanisms. These findings align with known functions of
Sphingomonas, a genus well-recognized for its capacity to degrade complex organic pollutants such as glyphosate through specialized enzymatic pathways [
121]. Similarly,
Mesorhizobium species have been shown to adapt to glyphosate by metabolizing it as a phosphorus source [
122,
123].
In contrast,
Nitrospira displayed strong negative correlations with glyphosate (r = -0.88) and AMPA (r = -0.87) to show its sensitivity to glyphosate exposure. The inhibition of
Nitrospira, a key nitrite-oxidizing bacterium, reflects the broader adverse impact of glyphosate on nitrification processes and nitrogen cycling within soil ecosystems [
124].
4.7.2. Random Forest Evaluation of Glyphosate Dynamics
Random Forest modeling supported the significance of
Sphingomonas and
Mesorhizobium as key predictors of glyphosate dynamics. These taxa emerged as the most important features in predicting glyphosate and AMPA concentrations to confirm their ecological and functional relevance [
121]. The strong correlations observed for these taxa were validated by their high feature importance scores in the Random Forest model, demonstrating their central roles in glyphosate degradation pathways [
122,
123].
Interestingly, Nitrospira, which showed a strong negative correlation with glyphosate and AMPA in the correlation analysis, also emerged as an important predictor in the Random Forest model. Its consistent negative relationship highlights the adverse impact of glyphosate on this critical taxon, emphasizing its ecological sensitivity and the broader consequences for soil nitrogen cycling.
4.7.3. Comparison Between Methods
The combination of correlation analysis and Random Forest evaluation allowed for a more robust assessment of microbial responses to glyphosate. Correlation analysis provided direct insights into linear relationships between microbial taxa and glyphosate metrics and identified Sphingomonas, Mesorhizobium, and Nitrospira as key taxa. In contrast, Random Forest modeling accounted for complex, nonlinear interactions and confirmed these taxa as significant predictors of glyphosate and AMPA dynamics. The improvement in the Random Forest model’s predictive performance (R² = 0.24 for glyphosate) underscores its utility in identifying influential microbial drivers in glyphosate-impacted soils.
While both methods identified similar key taxa, differences in their approaches provided complementary strengths. Correlation analysis emphasized direct associations, whereas Random Forest highlighted taxa with the greatest predictive power, even when relationships were not strictly linear. This dual approach enhances confidence in the findings and provides a comprehensive understanding of the microbial processes governing glyphosate degradation.
4.7.4. Diversity Metrics and Functional Implications
Alpha diversity indices, such as Faith’s Phylogenetic Diversity (Faith’s PD), identified moderate positive correlations with AMPA (r = 0.39) and effective glyphosate (r = 0.40) in the correlation analysis to suggest that glyphosate exposure disproportionately affects phylogenetic diversity. Similarly, Random Forest analysis underscored the role of diversity metrics and identified them as moderate contributors to glyphosate dynamics. These findings highlight the selective pressure of glyphosate on phylogenetically diverse taxa, which may drive compositional and functional shifts within the soil microbiome.
4.8. Metabolic and Regulatory Adaptations Post-Harvest
The analysis of metabolic pathways and regulatory processes revealed significant adaptations post-harvest, particularly in response to stress conditions, phosphate metabolism, and fundamental biosynthetic processes. These changes suggest that treatment with PaleoPower induced broad functional shifts in the soil microbiome, to facilitate improved nutrient cycling, stress resistance, and metabolic activity.
4.8.1. Fundamental Processes
The observed post-harvest increases in pathways associated with Starch Sucrose Metabolism (+2.3%) and Fatty Acid Biosynthesis (+2.6%) reflect enhanced carbohydrate processing and lipid synthesis, critical for microbial energy production and membrane stability. Notably, the Oligogalacturonide Transport System Substrate-Binding Protein exhibited a substantial 66.7% increase to indicate improved transport and utilization of oligosaccharides which are key energy sources derived from organic matter decomposition. Additionally, N-Glycan Biosynthesis (High-Mannose Type) (+9.1%) and Ribosome Biogenesis GTPase/Thiamine Phosphate Phosphatase (+7.6%) showed significant increases, suggesting enhanced protein synthesis and glycosylation processes essential for cell growth and enzymatic activity.
4.8.2. Phosphate Metabolism
Post-harvest soils exhibited dramatic changes in phosphate metabolism pathways. Methane Metabolism significantly increased (p = 0.016) to highlight a substantial microbial shift toward methane-related metabolic processes. This increase could indicate enhanced methanotrophic or methanogenic activity associated with microbial adaptation to nutrient availability or anaerobic microenvironments. Additionally, the pathways involving 1L-Myo-Inositol 1-Phosphate Cytidylyltransferase and Multiple Inositol-Polyphosphate Phosphatase increased by 65.7%, suggesting elevated inositol phosphate metabolism critical for phosphate storage and signaling. The 78.3 % increase in 3,4-Dideoxy-4-Amino-D-Arabino-Heptulosonate 7-Phosphate Synthase (+78.3%) points to heightened activity in shikimate and other secondary metabolic pathways which may play roles in microbial adaptation and environmental resilience.
Further upregulation in the PhoR-PhoB Two-Component Regulatory System (+9.6%) and the Phosphate Acetyltransferase-Acetate Kinase Pathway (+7.8%) indicates improved responses to phosphate availability and acetate production. These pathways are central to phosphate uptake and energy metabolism and underscore the soil microbiome’s enhanced ability to regulate phosphate homeostasis and optimize energy utilization when residual soil glyphosate is degraded.
4.8.3. Homeostasis and Osmotic Stress
Pathways associated with stress responses also showed considerable upregulation. Increased sulfiredoxin by 225% demonstrates a robust microbial oxidative stress response to environmental perturbations post-harvest. The 4.2% modest increase in the Manganese/Iron Transport System could have far-reaching impact on energy, photosynthesis, hormone, and stress defense with improved ion transport and metal homeostasis that are critical for enzymatic processes under stress conditions.
Enhanced osmotic stress resistance was evidenced by the upregulation of Ectoine Hydroxylase (+18.1%), a key enzyme in the biosynthesis of ectoine, a known osmoprotectant that stabilizes cellular components under high osmotic pressure. The 23.2% increase in Anaerobic Nitric Oxide Reductase Transcription Regulator reflects improved regulatory mechanisms under anaerobic conditions, highlighting microbial adaptability to variable oxygen availability in the reduced glyphosate, post-harvest soils.
4.9. Impact of Metabolic Shifts on Crops
The observed post-harvest metabolic shifts in the soil microbiome have significant implications for crop health, nutrient availability, and overall agricultural productivity. The upregulation of pathways such as
Starch Sucrose Metabolism (+2.3%) and
Fatty Acid Biosynthesis (+2.6%) reflects enhanced microbial carbohydrate processing and lipid synthesis which contribute to the breakdown of organic matter and the release of essential macro- and micro-nutrients [
125]. These processes improve soil fertility and ensure that critical nutrients are readily available for plant uptake. This is particularly important in nutrient-limited soils [
126].
The increase in
phosphate metabolism pathways, including
methane metabolism (+7150.9%) and
inositol phosphate metabolism (+65.7% highlights enhanced phosphate solubilization and cycling. Microbial conversion of insoluble phosphates into bioavailable forms improves root uptake and supports processes like root elongation, energy transfer, and photosynthesis [
127]. This is especially relevant in agricultural systems where phosphorus availability is a major yield-limiting factor.
In addition to nutrient cycling, the upregulation of stress response pathways, such as
sulfiredoxin (+225%) and
ectoine hydroxylase (+18.1%), suggests the microbial community's enhanced resilience to oxidative and osmotic stress. Microbial production of stress-protectant molecules like ectoine and sulfur-based antioxidants buffer soil ecosystems against environmental disturbances such as drought, salinity, and temperature fluctuations [
128,
129]. These stress-tolerant microbial populations not only stabilize soil structure and moisture but also indirectly protect plant roots from abiotic stress to improve plant resilience [
130].
Furthermore, pathways related to Oligogalacturonide Transport (+66.7%) and Ribosome Biogenesis (+7.6%) suggest improved microbial activity, functional diversity, and metabolic efficiency. This enrichment fosters beneficial plant-microbe interactions that facilitate nutrient uptake, pathogen suppression, and organic matter decomposition [
131]. For example, phosphate solubilizers and nitrogen-fixing bacteria can increase nutrient availability to crops and enhance plant vigor and root development [
132].
Glyphosate is a potent chelating agent that binds essential micronutrients like iron, copper, zinc and manganese to reduce their availability in soils [
93,
133]. This can lead to deficiencies in plants and affect photosynthesis, enzyme functions, and growth that are often seen in chlorotic and stunted development. Glyphosate-induced chelation in soils limits the availability of these micronutrients for microbes as well as plants and disrupts critical processes such as nitrogen fixation and organic matter decomposition [
9,
116].
The observed improvements in
iron and manganese transport systems (+4.2%) highlight enhanced micronutrient regulation in soil treated with PaleoPower. Micronutrients like iron and manganese are essential for plant enzymatic activity, chlorophyll synthesis, and overall crop productivity [
134]. Concurrently, enhanced
acetate metabolism (+7.8%) produces short-chain fatty acids that provide soil pH buffering capacity and promote root health by stimulating beneficial rhizosphere microbes [
135].
The observed metabolic and regulatory adaptations consistent with reduced levels of residual soil glyphosate post-harvest demonstrate the significant role of microbial processes in improving soil functionality and crop performance. Enhanced nutrient cycling, stress resilience, and beneficial plant-microbe interactions collectively foster healthier soil environments and support increased plant growth, root development, and yield potential. These findings align with previous studies that emphasize the importance of diverse and functional microbial communities in promoting agricultural sustainability, particularly under environmental stress and limited nutrition [
101,
125,
131].
4.10. Limitations of the Study
While the findings of this study underscore the potential benefits of using co-fermented microbial inoculants, such as PaleoPower, in agricultural systems, several limitations warrant consideration and highlight the need for further research to validate and expand upon the observed results across a wider range of conditions and experimental designs.
One notable limitation is that this study was conducted in a single soil type—a previously glyphosate-treated cotton field with a silt loam to silty clay loam soil texture. Some glyphosate-treated soils may select for microbial communities that are already tolerant to or capable of degrading glyphosate and its byproducts, such as AMPA. Thus, the observed microbial shifts may reflect the pre-existing adaptation of autochthonous bacteria rather than solely the effects of the microbial inoculant. This pre-selection of glyphosate-tolerant taxa, such as Burkholderia, Sphingomonas and Mesorhizobium, likely amplified the inoculant’s efficacy but may not fully represent its potential in soils with no history of glyphosate exposure or in more diverse agricultural settings.
Another important consideration is that the study's sample size was relatively small, with soil samples collected from six locations within the field at each time point, resulting in 12 paired cores per sampling event. Although this approach allowed for representative coverage of the study area, the limited sample size reduces the statistical power to generalize the findings. Moreover, the study was conducted in a single location and crop type to potentially restrict its applicability to other regions, soil types, and agricultural systems. Soils with different textures, nutrient profiles, and microbial baselines might respond differently to the same treatment and lead to inconsistent results. Similarly, soils with differing histories of glyphosate usage and baseline levels of glyphosate and AMPA residues may respond differently over a similar period as this study.
Reports from other studies on microbial inoculants have noted little to no changes in microbial community structure following treatment [
8,
12,
65,
136]. Such discrepancies could be attributed to differences in microbial inoculum composition, in soil type, application rates, environmental conditions, and experimental designs. For example, glyphosate is known to be more persistent in heavier clay soils that impede microbial dispersal and colonization, while sandy soils might allow for more rapid infiltration of the inoculant but reduce microbial retention. Similarly, suboptimal application rates or environmental conditions, such as drought or extreme temperatures, could limit the efficacy of microbial inoculants. These variables highlight the complex interplay of biotic and abiotic factors that influence the success of soil microbial treatments.
Finally, the study focused primarily on glyphosate-contaminated soils, leaving unanswered questions about the performance of the inoculant in non-contaminated or organically managed fields. The baseline microbial community structure and diversity in such systems could lead to vastly different outcomes. Additionally, the field-scale application was conducted with one concentration of the inoculant (1.6 × 10⁸ CFU/m²), which may not represent the full range of potential application rates. Further studies should investigate how varying concentrations affect microbial community dynamics and soil health outcomes to optimize the application for diverse agricultural systems.
Although this study provides valuable insights into the potential benefits of microbial inoculants, the limitations discussed above emphasize the need for broader investigations. Future studies should incorporate larger sample sizes, diverse soil types, multiple field conditions, and varying application rates to better understand the generalizability of these findings. Long-term studies would be valuable for assessing the sustainability and cumulative impacts of the microbial inoculants in PaleoPower on soil health, crop productivity, and environmental resilience.
5. Conclusions
The results of this study highlight the multi-functional benefits of co-fermented microbial inoculants when applied to agricultural soils as part of a broader sustainable farming strategy. The high-density microbial product developed through the controlled co-fermentation of eight bacterial strains demonstrated its capacity to enhance nutrient cycling, organic matter decomposition, and soil health. With a viable cell count of 7.2 × 10⁹ cells per gram that includes 4.05 × 10⁹ spores per gram, this inoculant offers extended shelf-life, stability, and resistance to environmental stress to ensure its suitability for large-scale field applications.
The field application of PaleoPower at a concentration of 1.6 × 10⁸ CFU per square meter further underscores its practical utility in improving soil microbial composition and functionality. Uniform dispersal across the study area allowed for consistent microbial colonization and activity to support glyphosate degradation and the reduction of its recalcitrant byproduct, AMPA. Treated soils exhibited significant reductions in glyphosate and AMPA concentrations, increased microbial diversity and richness metrics. Thus, emphasizing the dual impact of the PaleoPower inoculant in both enhancing microbial diversity and stimulating the activity of native glyphosate-degrading microbes.
Key metabolic shifts observed by degrading glyphosate and AMPA (post-harvest) include substantial upregulation of phosphate metabolism pathways, stress-response mechanisms, and biosynthetic processes that reveal the functional recovery and resilience of the treated soil microbiome. Enhanced phosphate solubilization, carbohydrate processing, and lipid biosynthesis collectively improved nutrient availability, while increased oxidative and osmotic stress tolerance supported the overall health and resilience of the soil microbial community.
The enrichment of beneficial taxa, such as Sphingomonas, Nitrospira, and Burkholderia, further demonstrated the selective impact of the PaleoPower microbial inoculant in restoring ecosystem functionality. These taxa are known for their roles in pollutant degradation, nitrogen cycling, and phosphate solubilization; process that are essential for long-term soil health and crop productivity. The observed improvements in microbial alpha and beta diversity highlight the role of microbial inoculants in restoring soil ecological balance and buffering against environmental stressors.
The application of PaleoPower represents a significant innovation in the field of sustainable agriculture. Unlike conventional microbial inoculants that often target single strains or limited functionalities, PaleoPower leverages a co-fermented consortium of eight bacterial strains specifically selected through advanced genomic and community metabolic modeling. This integrative approach enables a synergistic interaction between strains, optimizing glyphosate degradation, nutrient cycling, and soil health restoration.
This study demonstrates the efficacy of this novel strategy, with treated soils exhibiting enhanced microbial diversity, significant reductions in glyphosate and AMPA residues, and upregulation of critical metabolic pathways, such as methane metabolism (+7,150.9%) and oxidative stress responses (+225%). These findings highlight the dual-action potential of PaleoPower to not only directly degrade persistent agricultural pollutants but also stimulate native microbial communities, fostering a resilient and balanced soil ecosystem.
By combining advanced AI-driven selection methodologies and field validation, PaleoPower sets a new benchmark for microbial inoculants, addressing the limitations of traditional single-strain approaches. These results underscore its potential as a scalable and eco-friendly solution to mitigate the environmental impact of glyphosate while promoting agricultural sustainability.
Author Contributions
For research articles with several authors, a short paragraph specifying their individual contributions must be provided. The following statements should be used “Conceptualization, J.D and R.C.; M.C.; methodology, J.D., R.C., M.C., and D.H.; validation, J.D. and D.H. ; formal analysis, R.C. investigation, J.D.; resources, J.D. M.C., and D.H.; data curation, X.X.; writing—original draft preparation, R.C.; writing—review and editing, R.C., J.D. M.C., and D.H.; project administration, R.C. and J.D.; funding acquisition, R.C. All authors have read and agreed to the published version of the manuscript.”
Funding
All costs related to the project were covered by funds provided by Ancient Organics Bioscience, Inc.
Data Availability Statement
The microbiome sequence data generated during this study will be made available in the GenBank database under the appropriate accession numbers upon publication.
Acknowledgments
We extend our sincere gratitude to Seed2Shirt for their generous support and permission to conduct this study. Our heartfelt thanks go to Steve Kazemi for his invaluable efforts in preparing the soil microbial inoculant. We are especially grateful to Gissel Garcia, Ph.D., for her meticulous and objective review of this manuscript, which greatly improved its quality and clarity. We also acknowledge Nur Hasan for his commitment to ensuring the microbiome data met the highest standards, and HRI for their efficient processing of the glyphosate data, which was essential to the success of this study.
Conflicts of Interest
R.C. and M.C. declare a potential conflict of interest as principals of Ancient Organics Bioscience, Inc., the company responsible for developing the PaleoPower microbial inoculant used in this study. To ensure the integrity and objectivity of the research, all activities related to soil preparation, inoculant application, sample collection, and data generation were conducted by independent third parties. These measures were implemented to minimize bias and ensure an unbiased evaluation of the product's performance. The remaining authors declare no conflict of interest. The funders had no role in the development or application of the microbial inoculant, soil preparation, the design of the soil sampling protocol, sample collection, or the generation of data related to glyphosate, AMPA analyses, microbiome composition, or genetic analyses.
References
- Valavanidis, A. Glyphosate, the most widely used herbicide. Scientific Reviews 2018. [Google Scholar]
- Van Bruggen, A.H.; Finckh, M.; He, M.; Ritsema, C.; Harkes, P.; Knuth, D.; Geissen, V. Indirect effects of the herbicide glyphosate on plant, animal and human health through its effects on microbial communities. Frontiers in Environmental Science 2021, 9, 763917. [Google Scholar] [CrossRef]
- de Mesquita, C.P.B.; Solon, A.J.; Barfield, A.; Mastrangelo, C.F.; Tubman, A.J.; Vincent, K.; Porazinska, D.L.; Hufft, R.A.; Shackelford, N.; Suding, K.N. Adverse impacts of Roundup on soil bacteria, soil chemistry and mycorrhizal fungi during restoration of a Colorado grassland. Applied Soil Ecology 2023, 185, 104778. [Google Scholar] [CrossRef]
- Nabi, M. Role of microorganisms in plant nutrition and soil health. In Sustainable Plant Nutrition; Elsevier: 2023; pp. 263–282.
- Zhou, W.; Li, M.; Achal, V. A comprehensive review on environmental and human health impacts of chemical pesticide usage. Emerging Contaminants 2024, 100410. [Google Scholar] [CrossRef]
- Singh, R.; Shukla, A.; Kaur, G.; Girdhar, M.; Malik, T.; Mohan, A. Systemic analysis of glyphosate impact on environment and human health. ACS omega 2024, 9, 6165–6183. [Google Scholar] [CrossRef]
- Aslam, S.; Arslan, M.; Nowak, K.M. Microbial activity, community composition and degraders in the glyphosate-spiked soil are driven by glycine formation. Science of the Total Environment 2024, 907, 168206. [Google Scholar] [CrossRef]
- Grenier, V.; Laur, J.; Gonzalez, E.; Pitre, F.E. Glyphosate has a negligible impact on bacterial diversity and dynamics during composting. Environmental Microbiology 2023, 25, 2897–2912. [Google Scholar] [CrossRef]
- Van Bruggen, A.H.; He, M.M.; Shin, K.; Mai, V.; Jeong, K.; Finckh, M.; Morris Jr, J. Environmental and health effects of the herbicide glyphosate. Science of the total environment 2018, 616, 255–268. [Google Scholar] [CrossRef]
- Islam, W.; Noman, A.; Naveed, H.; Huang, Z.; Chen, H.Y. Role of environmental factors in shaping the soil microbiome. Environmental Science and Pollution Research 2020, 27, 41225–41247. [Google Scholar] [CrossRef]
- Philippot, L.; Chenu, C.; Kappler, A.; Rillig, M.C.; Fierer, N. The interplay between microbial communities and soil properties. Nature Reviews Microbiology 2024, 22, 226–239. [Google Scholar] [CrossRef]
- Kepler, R.M.; Epp Schmidt, D.J.; Yarwood, S.A.; Cavigelli, M.A.; Reddy, K.N.; Duke, S.O.; Bradley, C.A.; Williams Jr, M.M.; Buyer, J.S.; Maul, J.E. Soil microbial communities in diverse agroecosystems exposed to the herbicide glyphosate. Applied and environmental microbiology 2020, 86, e01744–e01719. [Google Scholar] [CrossRef]
- Li, W.; Wang, K.-B.; Wang, P.; Yang, P.; Xu, S.; Tong, J.; Zhang, Y.; Yang, Y.; Han, L.; Ye, M. Impact of Glyphosate on Rhizosphere Soil Bacterial Communities And Degradation Mechanisms in Large-Leaf Tea Plantations. Available at SSRN 493 7346.
- Mohy-Ud-Din, W.; Akhtar, M.J.; Bashir, S.; Asghar, H.N.; Nawaz, M.F.; Chen, F. Isolated bacterial strains efficiently degrade glyphosate under different environmental conditions. Pak. J. Bot 2024, 56, 765–774. [Google Scholar] [CrossRef] [PubMed]
- Epiktetov, D.O.; Sviridov, A.V.; Tarlachkov, S.V.; Shushkova, T.V.; Toropygin, I.Y.; Leontievsky, A.A. Glyphosate-Induced Phosphonatase Operons in Soil Bacteria of the Genus Achromobacter. International Journal of Molecular Sciences 2024, 25, 6409. [Google Scholar] [CrossRef] [PubMed]
- Harle, D.; McNeill, M.J.; Huber, D.M.; Maney, M.; Cano, R.J.; Carlin, M. Saga of Soggy Sauerkraut. HortScience 2024, 59, 1618–1628. [Google Scholar] [CrossRef]
- Heirendt, L.; Arreckx, S.; Pfau, T.; Mendoza, S.N.; Richelle, A.; Heinken, A.; Haraldsdóttir, H.S.; Wachowiak, J.; Keating, S.M.; Vlasov, V. Creation and analysis of biochemical constraint-based models using the COBRA Toolbox v. 3.0. Nature protocols 2019, 14, 639–702. [Google Scholar] [CrossRef]
- Arkin, A.P.; Cottingham, R.W.; Henry, C.S.; Harris, N.L.; Stevens, R.L.; Maslov, S.; Dehal, P.; Ware, D.; Perez, F.; Canon, S. KBase: the United States department of energy systems biology knowledgebase. Nature biotechnology 2018, 36, 566–569. [Google Scholar] [CrossRef]
- MERİÇ, Ç.S. A Step Beyond Prebiotics and Probiotics:“Postbiotics” Composition, Activities and Effects on Health. Current Debates in Health Sciences, 55.
- Chamkasem, N.; Morris, C.; Harmon, T. Direct Determination of Glyphosate, Glufosinate, and AMPA in milk by Liquid chromatography/tandem mass spectrometry. Journal of Regulatory Science 2015, 3, 20–26. [Google Scholar] [CrossRef]
- Jensen, P.K.; Wujcik, C.E.; McGuire, M.K.; McGuire, M.A. Validation of reliable and selective methods for direct determination of glyphosate and aminomethylphosphonic acid in milk and urine using LC-MS/MS. Journal of Environmental Science and Health, Part B 2016, 51, 254–259. [Google Scholar] [CrossRef]
- Bolyen, E.; Rideout, J.R.; Dillon, M.R.; Bokulich, N.A.; Abnet, C.C.; Al-Ghalith, G.A.; Alexander, H.; Alm, E.J.; Arumugam, M.; Asnicar, F. Reproducible, interactive, scalable and extensible microbiome data science using QIIME 2. Nature biotechnology 2019, 37, 852–857. [Google Scholar] [CrossRef]
- Callahan, B.J.; McMurdie, P.J.; Rosen, M.J.; Han, A.W.; Johnson, A.J.A.; Holmes, S.P. DADA2: high-resolution sample inference from Illumina amplicon data. Nature methods 2016, 13, 581–583. [Google Scholar] [CrossRef] [PubMed]
- Nearing, J.T.; Douglas, G.M.; Comeau, A.M.; Langille, M.G. Denoising the Denoisers: an independent evaluation of microbiome sequence error-correction approaches. PeerJ 2018, 6, e5364. [Google Scholar] [CrossRef] [PubMed]
- Chao, A. Nonparametric estimation of the number of classes in a population. Scandinavian Journal of statistics 1984, 265–270. [Google Scholar]
- Shannon, C.E. A mathematical theory of communication. ACM SIGMOBILE mobile computing and communications review 2001, 5, 3–55. [Google Scholar] [CrossRef]
- Simpson, E. Measurement of Diversity. Nature 1949, 163. [Google Scholar] [CrossRef]
- Faith, D.P. Phylogenetic pattern and the quantification of organismal biodiversity. Philos Trans R Soc Lond B Biol Sci 1994, 345, 45–58. [Google Scholar] [CrossRef]
- Pielou, E.C. The measurement of diversity in different types of biological collections. Journal of theoretical biology 1966, 13, 131–144. [Google Scholar] [CrossRef]
- Rosner, B.; Glynn, R.J.; Lee, M.L.T. The Wilcoxon signed rank test for paired comparisons of clustered data. Biometrics 2006, 62, 185–192. [Google Scholar] [CrossRef]
- Daniel, W.W. Kruskal–Wallis one-way analysis of variance by ranks. Applied nonparametric statistics 1990, 226–234. [Google Scholar]
- Benjamini, Y.; Hochberg, Y. Controlling the false discovery rate: a practical and powerful approach to multiple testing. Journal of the Royal statistical society: series B (Methodological) 1995, 57, 289–300. [Google Scholar] [CrossRef]
- Anderson, M.J. Permutational multivariate analysis of variance (PERMANOVA). Wiley statsref: statistics reference online 2014, 1-15.
- Wickham, H.; Çetinkaya-Rundel, M.; Grolemund, G. R for data science; " O'Reilly Media, Inc.": 2023.
- Oksanen, J.; Simpson, G.; Blanchet, F.; Kindt, R. vegan: Community Ecology Package. R package version 2.7-0. 2024.
- Bray, J.R.; Curtis, J.T. An ordination of the upland forest communities of southern Wisconsin. Ecological monographs 1957, 27, 326–349. [Google Scholar] [CrossRef]
- Kassambara, A. ggpubr:'ggplot2'based publication ready plots. R package version 2018, 2. [Google Scholar]
- DeSantis, T.Z.; Hugenholtz, P.; Larsen, N.; Rojas, M.; Brodie, E.L.; Keller, K.; Huber, T.; Dalevi, D.; Hu, P.; Andersen, G.L. Greengenes, a chimera-checked 16S rRNA gene database and workbench compatible with ARB. Applied and environmental microbiology 2006, 72, 5069–5072. [Google Scholar] [CrossRef] [PubMed]
- Segata, N.; Izard, J.; Waldron, L.; Gevers, D.; Miropolsky, L.; Garrett, W.S.; Huttenhower, C. Metagenomic biomarker discovery and explanation. Genome biology 2011, 12, 1–18. [Google Scholar] [CrossRef] [PubMed]
- Wickham, H.; Bryan, J. R packages; " O'Reilly Media, Inc.": 2023.
- Douglas, G.M.; Maffei, V.J.; Zaneveld, J.R.; Yurgel, S.N.; Brown, J.R.; Taylor, C.M.; Huttenhower, C.; Langille, M.G.I. PICRUSt2 for prediction of metagenome functions. Nature biotechnology 2020, 38, 685–688. [Google Scholar] [CrossRef]
- Wee, S.K.; Yap, E.P.H. GALAXY Workflow for Bacterial Next-Generation Sequencing De Novo Assembly and Annotation. Current Protocols 2021, 1, e242. [Google Scholar] [CrossRef]
- The Galaxy platform for accessible, reproducible, and collaborative data analyses: 2024 update. Nucleic Acids Research 2024, gkae410.
- Segata, N.; Waldron, L.; Ballarini, A.; Narasimhan, V.; Jousson, O.; Huttenhower, C. Metagenomic microbial community profiling using unique clade-specific marker genes. Nature methods 2012, 9, 811–814. [Google Scholar] [CrossRef]
- Cutler, A.; Cutler, D.R.; Stevens, J.R. Random forests. Ensemble machine learning: Methods and applications 2012, 157-175.
- Pearson, E.S. The test of significance for the correlation coefficient. Journal of the American Statistical Association 1931, 26, 128–134. [Google Scholar] [CrossRef]
- VanRossum, G.; Drake, F.L. The python language reference; Python Software Foundation Amsterdam, The Netherlands: 2010; Volume 561.
- Team, T.P.D. pandas-dev/pandas: Pandas. Zenodo, February 2020.
- Harris, C.R.; Millman, K.J.; Van Der Walt, S.J.; Gommers, R.; Virtanen, P.; Cournapeau, D.; Wieser, E.; Taylor, J.; Berg, S.; Smith, N.J. Array programming with NumPy. Nature 2020, 585, 357–362. [Google Scholar] [CrossRef]
- Spearman, C. The proof and measurement of association between two things. 1961.
- Vassileva, M.; Flor-Peregrin, E.; Malusá, E.; Vassilev, N. Towards better understanding of the interactions and efficient application of plant beneficial prebiotics, probiotics, postbiotics and synbiotics. Frontiers in plant science 2020, 11, 1068. [Google Scholar] [CrossRef] [PubMed]
- Prajapati, N.; Patel, J.; Singh, S.; Yadav, V.K.; Joshi, C.; Patani, A.; Prajapati, D.; Sahoo, D.K.; Patel, A. Postbiotic production: harnessing the power of microbial metabolites for health applications. Frontiers in Microbiology 2023, 14, 1306192. [Google Scholar] [CrossRef] [PubMed]
- Kouhounde, S.; Adéoti, K.; Mounir, M.; Giusti, A.; Refinetti, P.; Otu, A.; Effa, E.; Ebenso, B.; Adetimirin, V.O.; Barceló, J.M. Applications of probiotic-based multi-components to human, animal and ecosystem health: concepts, methodologies, and action mechanisms. Microorganisms 2022, 10, 1700. [Google Scholar] [CrossRef] [PubMed]
- Khani, N.; Noorkhajavi, G.; Reziabad, R.H.; Rad, A.H.; Ziavand, M. Postbiotics as potential detoxification tools for mitigation of pesticides. Probiotics and Antimicrobial Proteins 2024, 16, 1427–1439. [Google Scholar] [CrossRef]
- Ptaszek, M.; Canfora, L.; Pugliese, M.; Pinzari, F.; Gilardi, G.; Trzciński, P.; Malusà, E. Microbial-based products to control soil-borne pathogens: methods to improve efficacy and to assess impacts on microbiome. Microorganisms 2023, 11, 224. [Google Scholar] [CrossRef]
- Beleri, P.S. Microbial solutions to soil health: The role of biofertilizers in sustainable agriculture. Environmental Reports 2023. [Google Scholar] [CrossRef]
- Al-Kaisi, M.M.; Lal, R.; Olson, K.R.; Lowery, B. Fundamentals and functions of soil environment. In Soil health and intensification of agroecosytems; Elsevier: 2017; pp. 1–23.
- Akinrinde, E.A. Soils: Nature, Fertility Conservation and Management. AMS Publishing, Ibadan 2004.
- Newman, M.M.; Hoilett, N.; Lorenz, N.; Dick, R.P.; Liles, M.R.; Ramsier, C.; Kloepper, J.W. Glyphosate effects on soil rhizosphere-associated bacterial communities. Science of the Total Environment 2016, 543, 155–160. [Google Scholar] [CrossRef]
- Sviridov, A.; Shushkova, T.; Ermakova, I.; Ivanova, E.; Epiktetov, D.; Leontievsky, A. Microbial degradation of glyphosate herbicides. Applied biochemistry and microbiology 2015, 51, 188–195. [Google Scholar] [CrossRef]
- Helander, M.; Saloniemi, I.; Saikkonen, K. Glyphosate in northern ecosystems. Trends in plant science 2012, 17, 569–574. [Google Scholar] [CrossRef]
- Zobiole, L.H.S.; Kremer, R.J.; de Oliveira Jr, R.S.; Constantin, J. Glyphosate effects on photosynthesis, nutrient accumulation, and nodulation in glyphosate-resistant soybean. Journal of Plant Nutrition and Soil Science 2012, 175, 319–330. [Google Scholar] [CrossRef]
- Chen, Y.; Chen, W.-J.; Huang, Y.; Li, J.; Zhong, J.; Zhang, W.; Zou, Y.; Mishra, S.; Bhatt, P.; Chen, S. Insights into the microbial degradation and resistance mechanisms of glyphosate. Environmental Research 2022, 215, 114153. [Google Scholar] [CrossRef] [PubMed]
- Lancaster, S.H.; Hollister, E.B.; Senseman, S.A.; Gentry, T.J. Effects of repeated glyphosate applications on soil microbial community composition and the mineralization of glyphosate. Pest Management Science: formerly Pesticide Science 2010, 66, 59–64. [Google Scholar] [CrossRef] [PubMed]
- Aslam, S.; Arslan, M.; Nowak, K.M. Dynamics of Microbial Activity, Community Composition and Degraders in Soil Microcosms Treated with Glyphosate and its Three Degradation Products. Community Composition and Degraders in Soil Microcosms Treated with Glyphosate and its Three Degradation Products.
- Vishwakarma, K.; Kumar, N.; Shandilya, C.; Mohapatra, S.; Bhayana, S.; Varma, A. Revisiting Plant-Microbe Interactions and Microbial Consortia Application for Enhancing Sustainable Agriculture: A Review. Frontiers in microbiology 2020, 11, 560406–560406. [Google Scholar] [CrossRef] [PubMed]
- O'Callaghan, M.; Ballard, R.A.; Wright, D. Soil microbial inoculants for sustainable agriculture: Limitations and opportunities. Soil Use and Management 2022, 38, 1340–1369. [Google Scholar] [CrossRef]
- Sekhon, K.K.; Keshani. Microbial Inoculum Improvement for Soil Health. In Advancements in Microbial Biotechnology for Soil Health; Springer: 2024; pp. 49–65.
- Prasad, S.; Malav, L.C.; Choudhary, J.; Kannojiya, S.; Kundu, M.; Kumar, S.; Yadav, A.N. Soil microbiomes for healthy nutrient recycling. Current trends in microbial biotechnology for sustainable agriculture 2021, 1–21. [Google Scholar]
- Min, X.; Yang, L.; Jing, M.; Lulu, L.; Chao, C.; Gang, Y.; Chun, S.; Jun, W.; Zhang, X.; Peng, G. Biochar regulates biogeochemical cycling of iron and chromium in a soil-rice system by stimulating Geobacter and Clostridium. Pedosphere 2024, 34, 929–940. [Google Scholar]
- Hu, J.; Zhao, Y.; Yao, X.; Wang, J.; Zheng, P.; Xi, C.; Hu, B. Dominance of comammox Nitrospira in soil nitrification. Science of the Total Environment 2021, 780, 146558. [Google Scholar] [CrossRef]
- Nowka, B.; Daims, H.; Spieck, E. Comparison of oxidation kinetics of nitrite-oxidizing bacteria: nitrite availability as a key factor in niche differentiation. Applied and environmental microbiology 2015, 81, 745–753. [Google Scholar] [CrossRef]
- Song, M.; Wang, Y.; Jiang, L.; Peng, K.; Wei, Z.; Zhang, D.; Li, Y.; Zhang, G.; Luo, C. The complex interactions between novel DEHP-metabolising bacteria and the microbes in agricultural soils. Science of the Total Environment 2019, 660, 733–740. [Google Scholar] [CrossRef]
- Akinola, S.A.; Ayangbenro, A.S.; Babalola, O.O. Metagenomic insight into the community structure of maize-rhizosphere bacteria as predicted by different environmental factors and their functioning within plant proximity. Microorganisms 2021, 9, 1419. [Google Scholar] [CrossRef]
- Cheng, H.; Yuan, M.; Duan, Q.; Sun, R.; Shen, Y.; Yu, Q.; Li, S. Influence of phosphorus fertilization patterns on the bacterial community in upland farmland. Industrial Crops and Products 2020, 155, 112761. [Google Scholar] [CrossRef]
- Asaf, S.; Numan, M.; Khan, A.L.; Al-Harrasi, A. Sphingomonas: from diversity and genomics to functional role in environmental remediation and plant growth. Critical Reviews in Biotechnology 2020, 40, 138–152. [Google Scholar] [CrossRef] [PubMed]
- Singh, S.; Kumar, V.; Gill, J.P.K.; Datta, S.; Singh, S.; Dhaka, V.; Kapoor, D.; Wani, A.B.; Dhanjal, D.S.; Kumar, M. Herbicide glyphosate: toxicity and microbial degradation. International journal of environmental research and public health 2020, 17, 7519. [Google Scholar] [CrossRef] [PubMed]
- Guo, Z.; Han, J.; Zhang, Y.; Wang, H. Mineralization mechanism of organic carbon in maize rhizosphere soil of soft rock and sand mixed soil under different fertilization modes. Frontiers in Plant Science 2023, 14, 1278122. [Google Scholar] [CrossRef] [PubMed]
- Pan, Y.; Kang, P.; Qu, X.; Zhang, H.; Li, X. Response of the soil bacterial community to seasonal variations and land reclamation in a desert grassland. Ecological Indicators 2024, 165, 112227. [Google Scholar] [CrossRef]
- Al-Tammar, F.K.; Khalifa, A.Y. An update about plant growth promoting Streptomyces species. J. Appl. Biol. Biotechnol 2023, 1–10. [Google Scholar] [CrossRef]
- Nam, J.H.; Thibodeau, A.; Qian, Y.L.; Qian, M.C.; Park, S.H. Multidisciplinary evaluation of plant growth promoting rhizobacteria on soil microbiome and strawberry quality. AMB Express 2023, 13, 18. [Google Scholar] [CrossRef]
- Sellstedt, A.; Richau, K.H. Aspects of nitrogen-fixing Actinobacteria, in particular free-living and symbiotic Frankia. FEMS Microbiology Letters 2013, 342, 179–186. [Google Scholar] [CrossRef]
- Li, C.; Hu, H.-W.; Chen, Q.-L.; Chen, D.; He, J.-Z. Comammox Nitrospira play an active role in nitrification of agricultural soils amended with nitrogen fertilizers. Soil Biology and Biochemistry 2019, 138, 107609. [Google Scholar] [CrossRef]
- Petters, S.; Groß, V.; Söllinger, A.; Pichler, M.; Reinhard, A.; Bengtsson, M.M.; Urich, T. The soil microbial food web revisited: Predatory myxobacteria as keystone taxa? The ISME journal 2021, 15, 2665–2675. [Google Scholar] [CrossRef]
- Singh, D.P.; Singh, H.B.; Prabha, R. Microbial inoculants in sustainable agricultural productivity; Springer: 2016; Volume 2.
- Busby, P.E.; Soman, C.; Wagner, M.R.; Friesen, M.L.; Kremer, J.; Bennett, A.; Morsy, M.; Eisen, J.A.; Leach, J.E.; Dangl, J.L. Research priorities for harnessing plant microbiomes in sustainable agriculture. PLoS biology 2017, 15, e2001793. [Google Scholar] [CrossRef] [PubMed]
- Trivedi, P.; Leach, J.E.; Tringe, S.G.; Sa, T.; Singh, B.K. Plant–microbiome interactions: from community assembly to plant health. Nature reviews microbiology 2020, 18, 607–621. [Google Scholar] [CrossRef] [PubMed]
- Zhang, W.; Chen, W.-J.; Chen, S.-F.; Liu, M.; Ghorab, M.A.; Mishra, S.; Bhatt, P.; Chen, S. Complete biodegradation of glyphosate with microbial consortium YS622: Structural analysis, biochemical pathways, and environmental bioremediation. Journal of Environmental Chemical Engineering 2024, 12, 114344. [Google Scholar] [CrossRef]
- Behera, L.; Datta, D.; Kumar, S.; Kumar, S.; Sravani, B.; Chandra, R. Role of microbial consortia in remediation of soil, water and environmental pollution caused by indiscriminate use of chemicals in agriculture: Opportunities and challenges. New and Future Developments in Microbial Biotechnology and Bioengineering 2022, 399–418. [Google Scholar]
- Duke, S.O.; Powles, S.B. Glyphosate: a once-in-a-century herbicide. Pest Management Science: formerly Pesticide Science 2008, 64, 319–325. [Google Scholar] [CrossRef]
- Funke, T.; Han, H.; Healy-Fried, M.L.; Fischer, M.; Schönbrunn, E. Molecular basis for the herbicide resistance of Roundup Ready crops. Proceedings of the National Academy of Sciences 2006, 103, 13010–13015. [Google Scholar] [CrossRef]
- Samsami, H.; Maali-Amiri, R. Global insights into intermediate metabolites: Signaling, metabolic divergence and stress response modulation in plants. Plant Physiology and Biochemistry 2024, 108862. [Google Scholar] [CrossRef]
- Duke, S.O. Glyphosate: uses other than in glyphosate-resistant crops, mode of action, degradation in plants, and effects on non-target plants and agricultural microbes. Reviews of Environmental Contamination and Toxicology Volume 255: Glyphosate 2021, 1-65.
- Hertel, R.; Gibhardt, J.; Martienssen, M.; Kuhn, R.; Commichau, F.M. Molecular mechanisms underlying glyphosate resistance in bacteria. Environmental microbiology 2021, 23, 2891–2905. [Google Scholar] [CrossRef]
- Newman, M.M.; Lorenz, N.; Hoilett, N.; Lee, N.R.; Dick, R.P.; Liles, M.R.; Ramsier, C.; Kloepper, J.W. Changes in rhizosphere bacterial gene expression following glyphosate treatment. Science of the Total Environment 2016, 553, 32–41. [Google Scholar] [CrossRef]
- Lamb, E.G.; Kennedy, N.; Siciliano, S.D. Effects of plant species richness and evenness on soil microbial community diversity and function. Plant and Soil 2011, 338, 483–495. [Google Scholar] [CrossRef]
- Cuhra, M. Evolution of glyphosate resistance: Is the rhizosphere microbiome a key factor. J. Biol. Phys. Chem 2018, 18, 78–93. [Google Scholar] [CrossRef]
- Nakatani, A.S.; Fernandes, M.F.; de Souza, R.A.; da Silva, A.P.; dos Reis-Junior, F.B.; Mendes, I.C.; Hungria, M. Effects of the glyphosate-resistance gene and of herbicides applied to the soybean crop on soil microbial biomass and enzymes. Field Crops Research 2014, 162, 20–29. [Google Scholar] [CrossRef]
- Luo, D.; Shi, J.; Li, M.; Chen, J.; Wang, T.; Zhang, Q.; Yang, L.; Zhu, N.; Wang, Y. Consortium of Phosphorus-Solubilizing Bacteria Promotes Maize Growth and Changes the Microbial Community Composition of Rhizosphere Soil. Agronomy 2024, 14, 1535. [Google Scholar] [CrossRef]
- Motta, E.V.; Raymann, K.; Moran, N.A. Glyphosate perturbs the gut microbiota of honey bees. Proceedings of the National Academy of Sciences 2018, 115, 10305–10310. [Google Scholar] [CrossRef]
- Larkin, R.P. Soil health paradigms and implications for disease management. Annual Review of Phytopathology 2015, 53, 199–221. [Google Scholar] [CrossRef]
- Thomas, G.V.; Krishnakumar, V.; Prabhu, S. New Paradigms in Soil Health Management for Sustainable Production of Plantation Crops. In Soil Health Management for Plantation Crops: Recent Advances and New Paradigms; Springer: 2024; pp. 487–533.
- JADHAV, P.S.; INAMDAR, R.R.; KAMBLE, A.A.; GHANGAONKAR, N.M. RECENT TRENDS IN BIOTECHNOLOGY: NANOTECHNOLOGY. Frontiers in Chemical, Biological and Pharmaceutical Sciences Volume III ISBN: 978-93-95847-85-8, 79.
- Vidanaarachchi, R. Pattern Recognition for Complex Heterogeneous Time-Series Data: An Analysis of Microbial Community Dynamics. The Australian National University (Australia), 2021.
- Zabaloy, M.C.; Allegrini, M.; Hernandez Guijarro, K.; Behrends Kraemer, F.; Morrás, H.; Erijman, L. Microbiomes and glyphosate biodegradation in edaphic and aquatic environments: recent issues and trends. World Journal of Microbiology and Biotechnology 2022, 38, 98. [Google Scholar] [CrossRef]
- Arango, L.; Buddrus-Schiemann, K.; Opelt, K.; Lueders, T.; Haesler, F.; Schmid, M.; Ernst, D.; Hartmann, A. Effects of glyphosate on the bacterial community associated with roots of transgenic Roundup Ready® soybean. European Journal of Soil Biology 2014, 63, 41–48. [Google Scholar] [CrossRef]
- Kumar, P.; Singh, R.P. Microbial Diversity and Multifunctional Microbial Biostimulants for Agricultural Sustainability. In Climate Resilience and Environmental Sustainability Approaches; Springer: 2021; pp. 141–184.
- Goss-Souza, D.; Mendes, L.W.; Borges, C.D.; Baretta, D.; Tsai, S.M.; Rodrigues, J.L. Soil microbial community dynamics and assembly under long-term land use change. FEMS Microbiology Ecology 2017, 93, fix109. [Google Scholar] [CrossRef]
- Schlatter, D.; Kinkel, L.; Thomashow, L.; Weller, D.; Paulitz, T. Disease suppressive soils: new insights from the soil microbiome. Phytopathology 2017, 107, 1284–1297. [Google Scholar] [CrossRef]
- Correa Deza, M.A.; Salva, S.; Grillo-Puertas, M.; Font, G.M.; Gerez, C.L. Effect of culture parameters on the heat tolerance and inorganic polyphosphate accumulation by Lacticaseibacillus rhamnosus CRL1505, a multifunctional bacterium. World J Microbiol Biotechnol 2023, 39, 182. [Google Scholar] [CrossRef]
- Salsabila, N.; Fitriatin, B.N.; Hindersah, R. The Role of Phosphate-Solubilizing Microorganisms in Soil Health and Phosphorus Cycle: A Review. International Journal of Life Science and Agriculture Research 2023, 2, 281–287. [Google Scholar] [CrossRef]
- Gao, Y.; Wang, X.; Mao, Z.; Yang, L.; Jiang, Z.; Chen, X.; Aubrey, D. Changes in Soil Microbial Community Structure Following Different Tree Species Functional Traits Afforestation. Forests 2021, 12, 1018–2021. [Google Scholar] [CrossRef]
- Zhang, C.; Tayyab, M.; Abubakar, A.Y.; Yang, Z.; Pang, Z.; Islam, W.; Lin, Z.; Li, S.; Luo, J.; Fan, X. Bacteria with different assemblages in the soil profile drive the diverse nutrient cycles in the sugarcane straw retention ecosystem. Diversity 2019, 11, 194. [Google Scholar] [CrossRef]
- Li, C.; Chen, X.; Jia, Z.; Zhai, L.; Zhang, B.; Grüters, U.; Ma, S.; Qian, J.; Liu, X.; Zhang, J. Meta-analysis reveals the effects of microbial inoculants on the biomass and diversity of soil microbial communities Nature Ecology & Evolution 2024, 1-15.
- Palberg, D.; Kaszecki, E.; Dhanjal, C.; Kisiała, A.; Morrison, E.N.; Stock, N.; Emery, R.N. Impact of glyphosate and glyphosate-based herbicides on phyllospheric Methylobacterium. BMC Plant Biology 2024, 24, 119. [Google Scholar] [CrossRef] [PubMed]
- Kremer, R.J.; Means, N.E. Glyphosate and glyphosate-resistant crop interactions with rhizosphere microorganisms. European Journal of Agronomy 2009, 31, 153–161. [Google Scholar] [CrossRef]
- Dennis, P.G.; Kukulies, T.; Forstner, C.; Orton, T.G.; Pattison, A.B. The effects of glyphosate, glufosinate, paraquat and paraquat-diquat on soil microbial activity and bacterial, archaeal and nematode diversity. Scientific reports 2018, 8, 2119. [Google Scholar] [CrossRef]
- Shade, A.; Peter, H.; Allison, S.D.; Baho, D.L.; Berga, M.; Bürgmann, H.; Huber, D.H.; Langenheder, S.; Lennon, J.T.; Martiny, J.B. Fundamentals of microbial community resistance and resilience. Frontiers in microbiology 2012, 3, 417. [Google Scholar] [CrossRef]
- Philippot, L.; Griffiths, B.S.; Langenheder, S. Microbial community resilience across ecosystems and multiple disturbances. Microbiology and Molecular Biology Reviews 2021, 85. [Google Scholar] [CrossRef]
- Griffiths, B.S.; Philippot, L. Insights into the resistance and resilience of the soil microbial community. FEMS microbiology reviews 2013, 37, 112–129. [Google Scholar] [CrossRef]
- Dash, D.M.; Osborne, W.J. A systematic review on the implementation of advanced and evolutionary biotechnological tools for efficient bioremediation of organophosphorus pesticides. Chemosphere 2023, 313, 137506. [Google Scholar] [CrossRef]
- Ibijbijen, J.; Maldani, M.; Messaoud, B.B.; Nassiri, L. Assessment of the resistance of four nitrogen-fixing Bacteria to glyphosate. Atlas Journal of Biology 2018, 546–550. [Google Scholar] [CrossRef]
- Ahemad, M.; Khan, M.S. Effects of pesticides on plant growth promoting traits of Mesorhizobium strain MRC4. Journal of the Saudi Society of Agricultural Sciences 2012, 11, 63–71. [Google Scholar] [CrossRef]
- Rana, A.; Kumar, R.; Jangra, P.; Chahar, M.; Singh, A.P.; Kumar, A.; Sehrawat, S.K.; Dhaka, R.K. Microbial biomarkers for detection of environmental pollution. In Biomarkers in Environmental and Human Health Biomonitoring; Elsevier: 2024; pp. 127–147.
- Bender, S.F.; Wagg, C.; van der Heijden, M.G. An underground revolution: biodiversity and soil ecological engineering for agricultural sustainability. Trends in ecology & evolution 2016, 31, 440–452. [Google Scholar]
- Brown, R.W.; Chadwick, D.R.; Bending, G.D.; Collins, C.D.; Whelton, H.L.; Daulton, E.; Covington, J.A.; Bull, I.D.; Jones, D.L. Nutrient (C, N and P) enrichment induces significant changes in the soil metabolite profile and microbial carbon partitioning. Soil Biology and Biochemistry 2022, 172, 108779. [Google Scholar] [CrossRef]
- Richardson, A.E.; Barea, J.-M.; McNeill, A.M.; Prigent-Combaret, C. Acquisition of phosphorus and nitrogen in the rhizosphere and plant growth promotion by microorganisms. 2009.
- Timmis, K.; Hallsworth, J.E. This is the Age of Microbial Technology: Crucial roles of learned societies and academies. Microbial Biotechnology 2024, 17, e14450. [Google Scholar] [CrossRef]
- Tiedje, J.M.; Bruns, M.A.; Casadevall, A.; Criddle, C.S.; Eloe-Fadrosh, E.; Karl, D.M.; Nguyen, N.K.; Zhou, J. Microbes and climate change: a research prospectus for the future. MBio 2022, 13, e00800–e00822. [Google Scholar] [CrossRef]
- Dimkpa, C.; Weinand, T.; Asch, F. Plant–rhizobacteria interactions alleviate abiotic stress conditions. Plant, cell & environment 2009, 32, 1682–1694. [Google Scholar]
- Mendes, R.; Garbeva, P.; Raaijmakers, J.M. The rhizosphere microbiome: significance of plant beneficial, plant pathogenic, and human pathogenic microorganisms. FEMS microbiology reviews 2013, 37, 634–663. [Google Scholar] [CrossRef]
- Glick, B.R. Plant growth-promoting bacteria: mechanisms and applications. Scientifica 2012, 2012, 963401. [Google Scholar] [CrossRef]
- Eker, S.; Ozturk, L.; Yazici, A.; Erenoglu, B.; Romheld, V.; Cakmak, I. Foliar-applied glyphosate substantially reduced uptake and transport of iron and manganese in sunflower (Helianthus annuus L.) plants. Journal of agricultural and food chemistry 2006, 54, 10019–10025. [Google Scholar] [CrossRef]
- Alloway, B.J. Micronutrients and crop production: An introduction. In Micronutrient deficiencies in global crop production; Springer: 2008; pp. 1–39.
- Fierer, N. Embracing the unknown: disentangling the complexities of the soil microbiome. Nature Reviews Microbiology 2017, 15, 579–590. [Google Scholar] [CrossRef]
- Schlatter, D.C.; Yin, C.; Hulbert, S.; Burke, I.; Paulitz, T. Impacts of repeated glyphosate use on wheat-associated bacteria are small and depend on glyphosate use history. Applied and environmental microbiology 2017, 83, e01354–e01317. [Google Scholar] [CrossRef] [PubMed]
|
Disclaimer/Publisher’s Note: The statements, opinions and data contained in all publications are solely those of the individual author(s) and contributor(s) and not of MDPI and/or the editor(s). MDPI and/or the editor(s) disclaim responsibility for any injury to people or property resulting from any ideas, methods, instructions or products referred to in the content. |
© 2025 by the authors. Licensee MDPI, Basel, Switzerland. This article is an open access article distributed under the terms and conditions of the Creative Commons Attribution (CC BY) license (http://creativecommons.org/licenses/by/4.0/).