1. Introduction
As the cornerstone of urban development, business development is increasingly crucial in the process of urbanization. The retail industry has gradually evolved into an indispensable component of business development and a significant indicator of urban prosperity and overall competitiveness. Since the initiation of economic reforms and opening up policies, the retail sector has consistently emerged as one of the most fiercely competitive industries in the market due to transformations in residents' consumption patterns and capacities, robust promotion by foreign retail enterprises, as well as continuous enhancements in circulation infrastructure and developmental environment [
1].
Recently, the retail industry has emerged as a pivotal driver of domestic demand-led consumption and optimization of urban industrial structure. In China, the rapid development of urban retail commercial outlets has significantly contributed to urban economic growth. However, challenges such as inadequate planning for commercial outlet construction, suboptimal layout of retail outlets, and an imbalanced structure of commercial establishments have resulted in substantial resource wastage and diminished economic efficiency.
It is crucial to analyze the spatial coupling relationship between different types of retail business and the spatial distribution of the population for developing spatially reasonable retail business. This can enhance residents' convenience, optimize urban planning for a seamless transition between old and new governance, and revamp business outlet layouts for enterprises. The research findings can be utilized to augment residents' living convenience, optimize urban planning strategies for governments, and modernize retail outlet layouts for enterprises.
Nighttime light remote sensing is a technique employed to observe and document nocturnal illumination on the Earth's surface using satellite or other remote sensing technologies. Given that urban areas are primarily responsible for generating artificial night lights, the luminosity values derived from nighttime light remote sensing images can indirectly reflect the intensity of human activities occurring on the Earth's surface. Presently, this technology finds widespread application in monitoring socio-economic parameters associated with human activities, such as population dynamics, economic growth, and power consumption patterns. Nighttime light remote sensing data serve as a robust tool for analyzing urban agglomeration and studying evolutionary processes within urban systems [
2,
3,
4,
5], investigating economic and industrial development in cities [
6],as well as exploring hierarchical patterns within urban systems [
7].
POI (points of interest) data refers to geospatial entities closely intertwined with human activities, such as shopping malls, communities, and companies. It is typically represented as a point and encompasses comprehensive attribute information including type, longitude and latitude coordinates, region, name, and address. Point of interest data represents a novel generation of geospatial big data that surpasses traditional datasets in terms of broader coverage, enhanced accuracy, faster update speed, and more convenient accessibility. Its extensive applications span various research domains encompassing urban industrial spatial patterns [
8,
9], delineation of urban functional areas [
10], identification of urban centers (boundaries) [
11], and analysis of business agglomerations [
9,
12].
Nighttime light remote sensing images and POI data are closely associated with human activities, serving as a common data source for investigating urban spatial structures. Nighttime light remote sensing data exhibits characteristics such as abundant data volume, continuous spatiotemporal coverage, wide scope, independence, and objectivity [
13]. On the other hand, POI data possesses attributes like rich information content, rapid update speed, and low acquisition cost. These two types of data complement each other and exhibit spatial coupling. Consequently, some researchers have explored the integrated application of nighttime light remote sensing and POI data to extract urban built-up areas [
11] or study urban economic development [
14,
15,
16]. However, there is still a lack of overall integration in terms of the spatial coupling relationship between these two types of data.
Nighttime light remote sensing data can effectively capture the light intensity generated by group activities and reflect the degree of population aggregation; however, it may blur specific regional characteristics. On the other hand, POI data provides accurate geographic location information but lacks important indicators such as economic and commercial development scale. Therefore, this study aims to leverage the advantages of both datasets by utilizing nighttime light remote sensing data to represent group activity information and incorporating POI data for analyzing business behavior. Previous studies have mostly used methods that analyze the topological relationships of data to study urban coupling relationships, combining nighttime light remote sensing and POI data. However, these methods can only conduct qualitative analysis. This study establishes a model for measuring coupling degree and coupling coordination degree through calculations, and quantitatively examines the spatial coupling relationship between various retail business outlets and group activities in the central urban area of Chengdu city. This research will offer valuable insights for optimizing cities' commercial spatial structure and scientifically planning enterprise outlet layouts.
2. Study Area and Data
2.1. Study Area
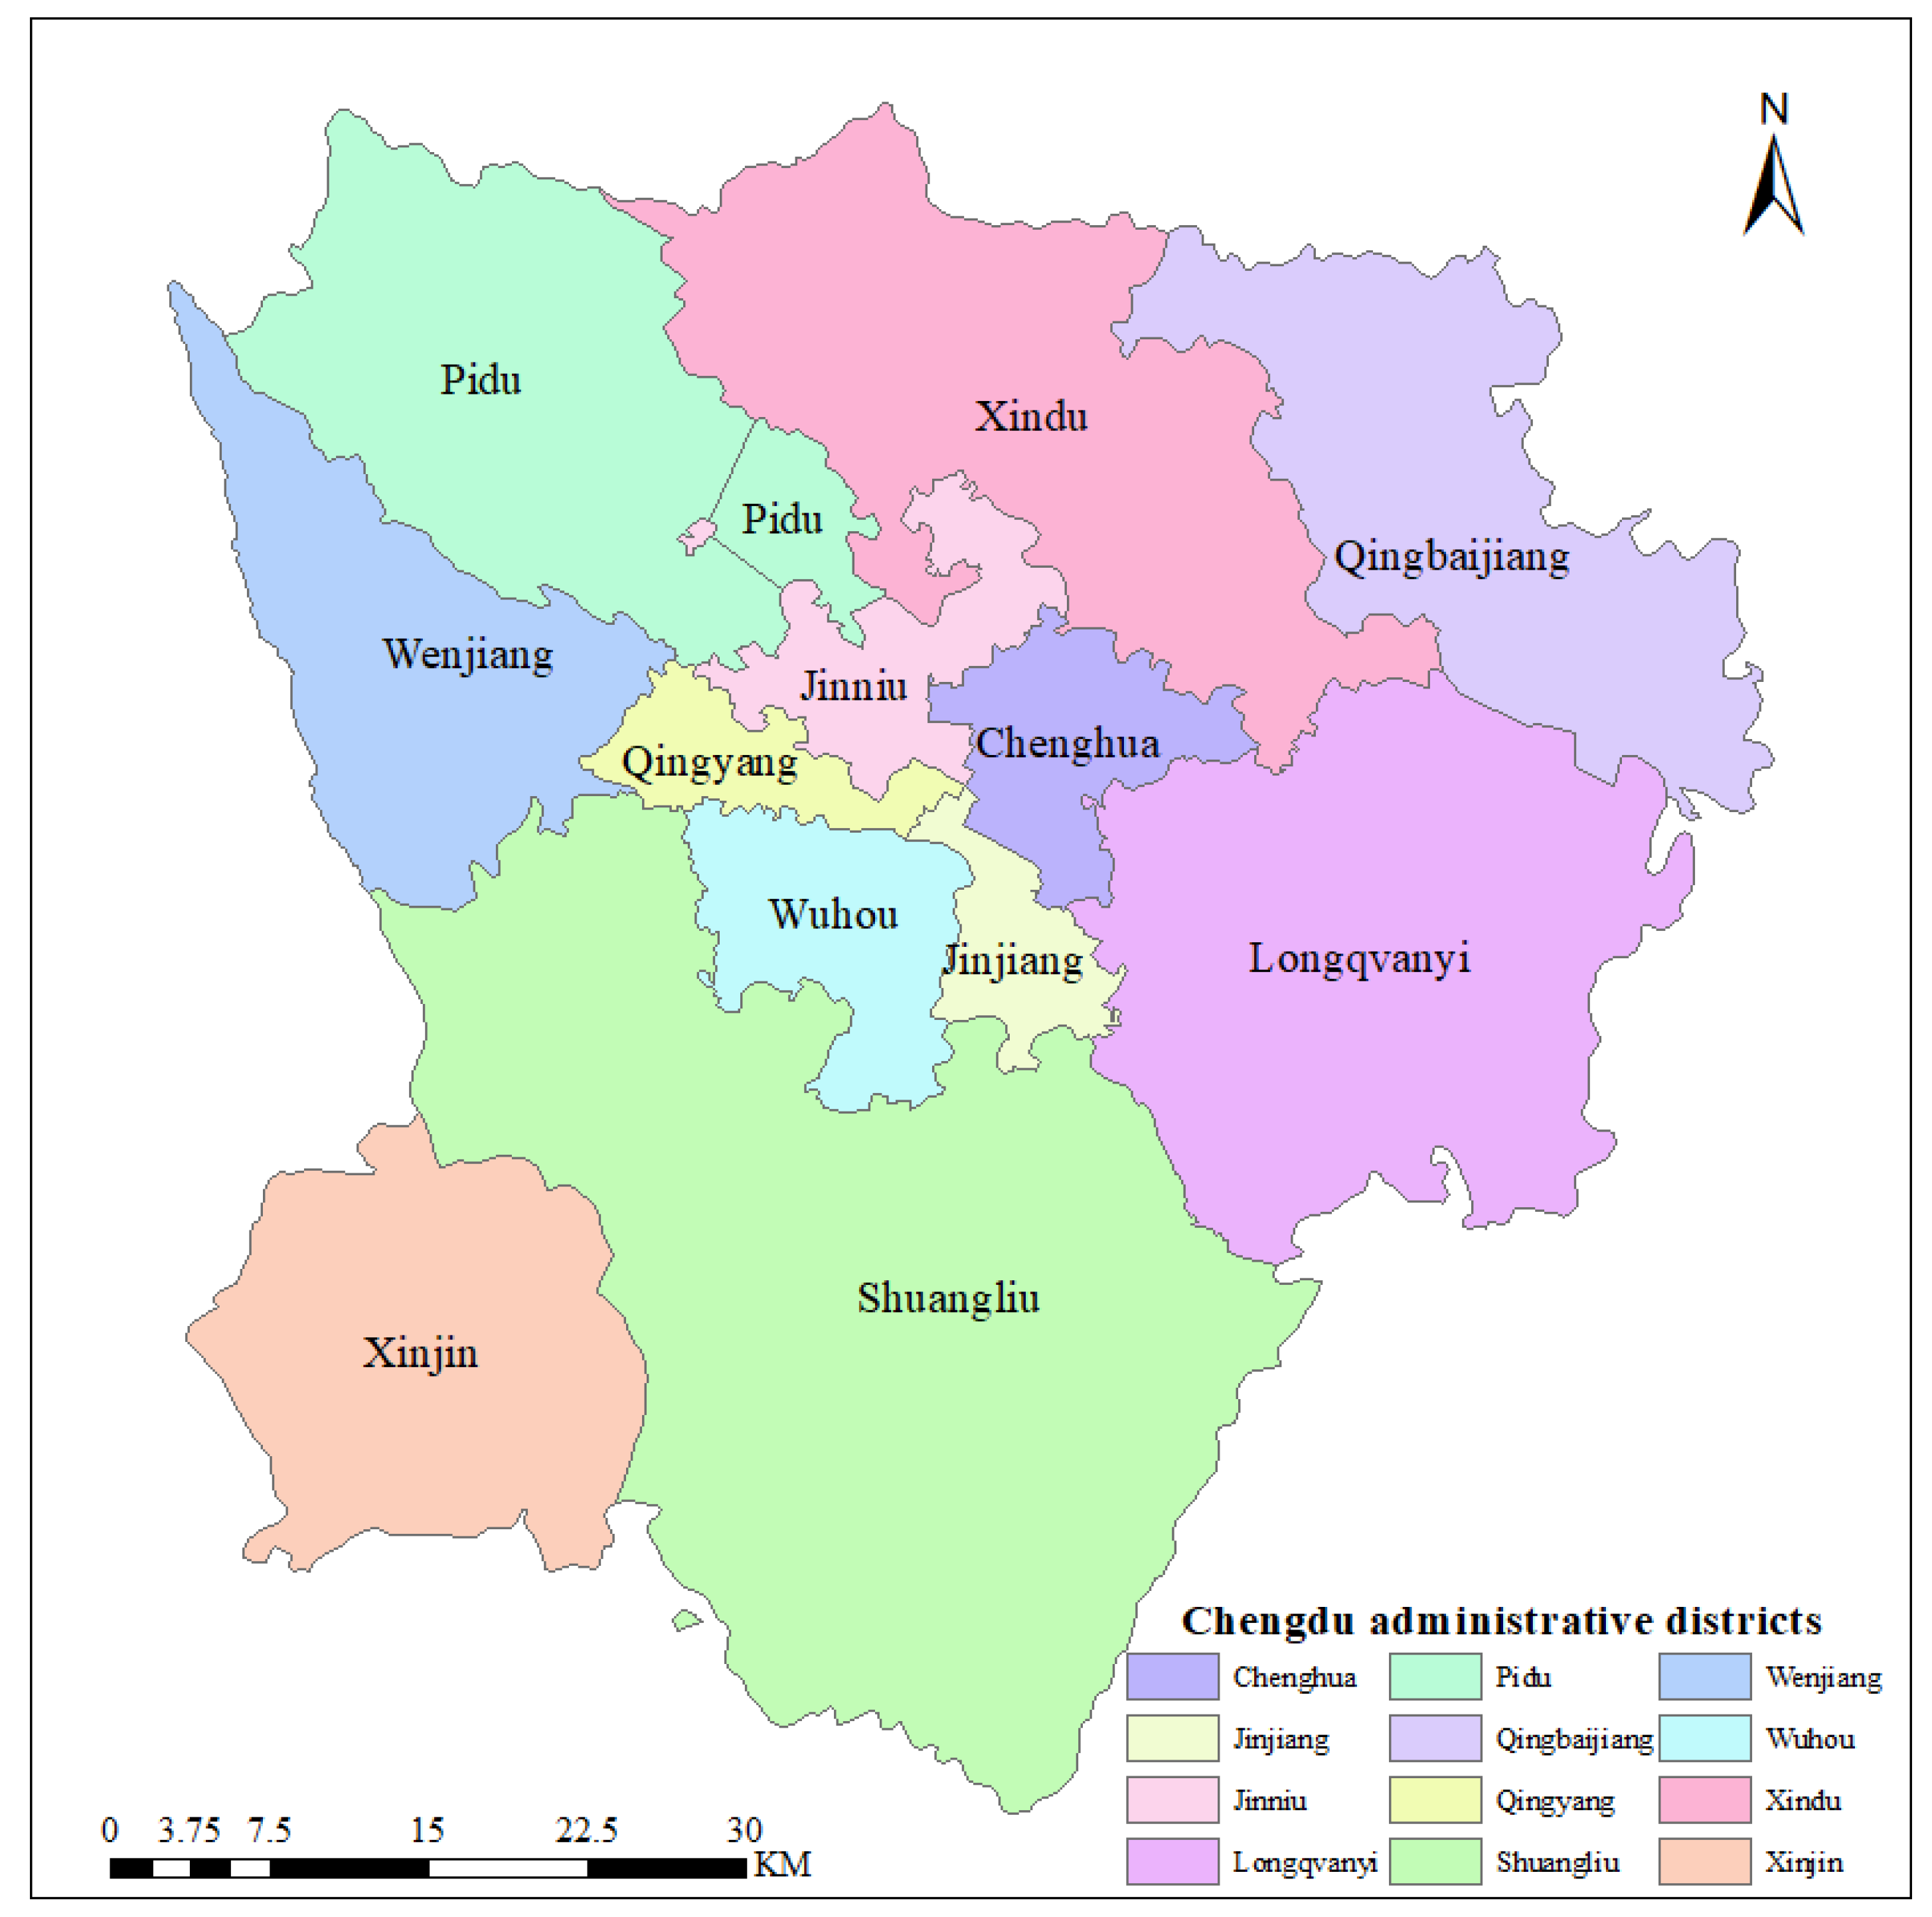
Chengdu, the capital of Sichuan Province, is located within a geographical range spanning from 102°54' to 104°53'E and 30°05' to 31°26'N (
Figure 1). The commercial space in Chengdu is predominantly concentrated within the central urban area, including 12 administrative districts named Jinjiang, Qingyang, Jinniu, Wuhou, Chenghua, Xindu, Pidu, Wenjiang, Shuangliu, Longquanyi, Qingbaijiang, and Xinjin. The central urban area of Chengdu had reached a total land area of 4,006 square kilometers by the end of 2021 [
17]. Meanwhile, the permanent population of Chengdu's central main urban area was recorded as 15,419,400, according to the seventh census data in 2021. In the 2023 national ranking of city business attractiveness, Chengdu leads among emerging first-tier cities in five dimensions: concentration of commercial resources, urban connectivity, citizen engagement, lifestyle diversity, and future adaptability. The city center of Chengdu serves as a hub for various retail industries, making it an ideal subject for empirical research that holds significant representativeness and persuasive power in analyzing the commercial spatial layout of domestic cities.
2.2. Nighttime Light Remote Sensing Data
The nighttime light remote sensing data utilized in this study was acquired by the NPP-VIIRS (National Polar-orbiting Partnership-Visible infrared Imaging Radiometer) sensor, which provides a comprehensive and cost-free data resource. The spatial resolution of the data is approximately 740 m. As an innovative source, NPP-VIIRS nighttime light remote sensing data has gained widespread adoption in urban studies [
18].
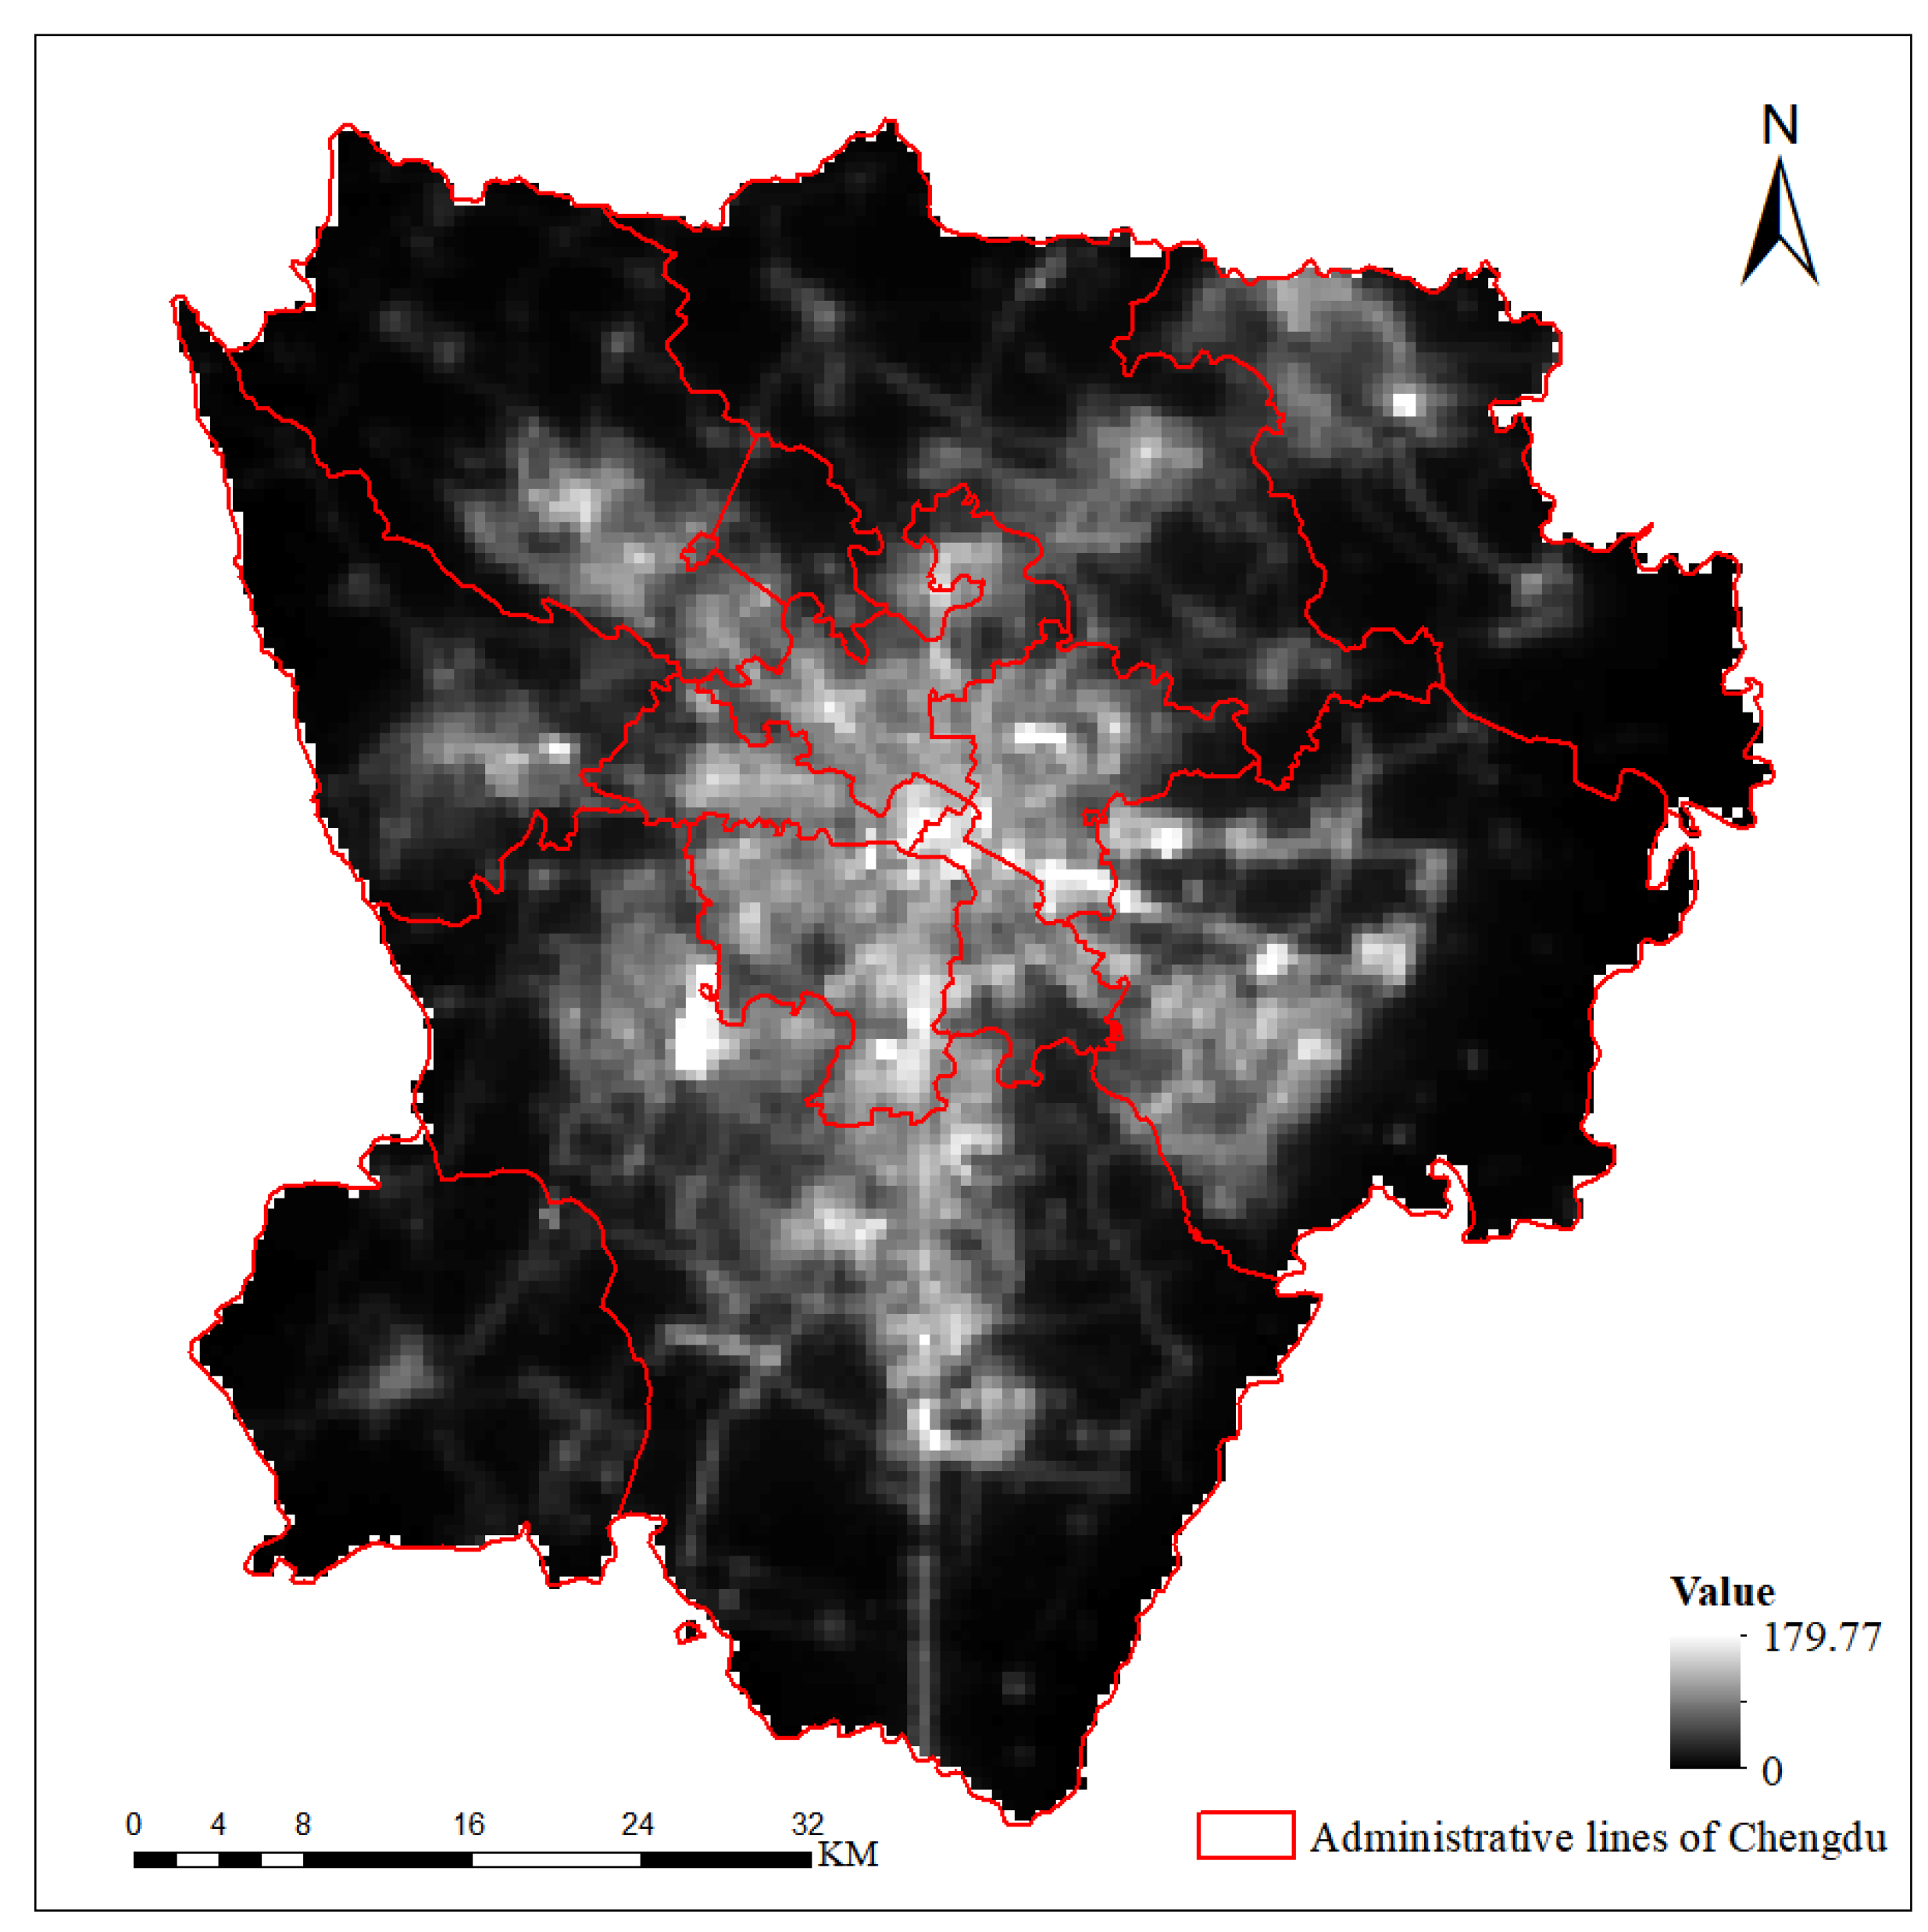
The transit time of the NPP/VIIRS satellite occurs around midnight, which may result in data gaps in certain areas and time periods due to cloud occlusion. In this study, we utilized the monthly NPP-VIIRS data in 2023 as our primary research data source. After excluding the abnormal data (February, March, October, and November), the effective data are used to synthesize the annual average image, and the same data in 2022 is used as the reference data for correction.
Data preprocessing was implemented on the nighttime light remote sensing data because the original monthly NPP-VIIRS nighttime light data downloaded from the official website of NOAA/NGDA exhibits issues such as projection distortion, negative values, excessively high values, and unstable light sources. In this study, we initially acquired the monthly NPP-VIIRS data for 2022 and 2023 in the central urban area of Chengdu through image clipping, reprojection, resampling, and removal of erroneous images. Subsequently, a series of processes were employed including elimination of negative values and synthesis of annual mean images to address unstable light sources and background noise as well as eliminate extremely high values. Finally, we synthesized the annual average nighttime light remote sensing data in 2023, by utilizing the monthly nighttime light remote sensing data in 2022 as correction data. The three fundamental steps undertaken are listed as follows.
Step 1: Negative value elimination and annual average image synthesis. After loading all qualified nighttime light images, it was observed that certain monthly data in the central urban area of Chengdu exhibited negative values. However, theoretically, the brightness value of the night light should be non-negative. Therefore, it is imperative to rectify pixels with a negative value. This compensation process involves utilizing the annual average image from the previous year, which can be obtained through formula (1).
where
represents the monthly night light value of NPP-VIIRS,
denotes the nighttime light value derived from the average annual image of the previous year and
represents the number of qualified monthly images of that year.
Step 2: Elimination of unstable light sources and background noise. Unstable light sources such as fire, gas, combustion, and volcanoes are essentially transient light sources. When the light of a particular location does not exist in the previous year, it is considered an unstable light source. Firstly, all annual average images are converted to integers to eliminate weak background lighting values. Then, a binary image is generated based on the results. The 2022 image data is utilized as the benchmark for calculation in this study, and the raster calculator is employed to generate results based on the Formula. Finally, the obtained outcomes are multiplied by the initial image to mitigate the influence of unstable light sources.
where the DN represents the stable light source in the mean image of the year to be corrected (the year after the reference image), while DN
J-1 refers to the stable light source in the reference image, and DN
J encompasses all light sources in the mean image of the year to be corrected.
Step 3: Elimination of extremely high value. The maximum nighttime light value is assumed to represent the peak illumination in the central area of a major urban center, as referenced in literature [
16]. Taking into account economic development principles, it is expected that the maximum nighttime light value in 2023 will not be lower than that of 2022. After removing negative and unstable sources of light, we obtained a stable annual average image (
Figure 2).
2.3. POI Data
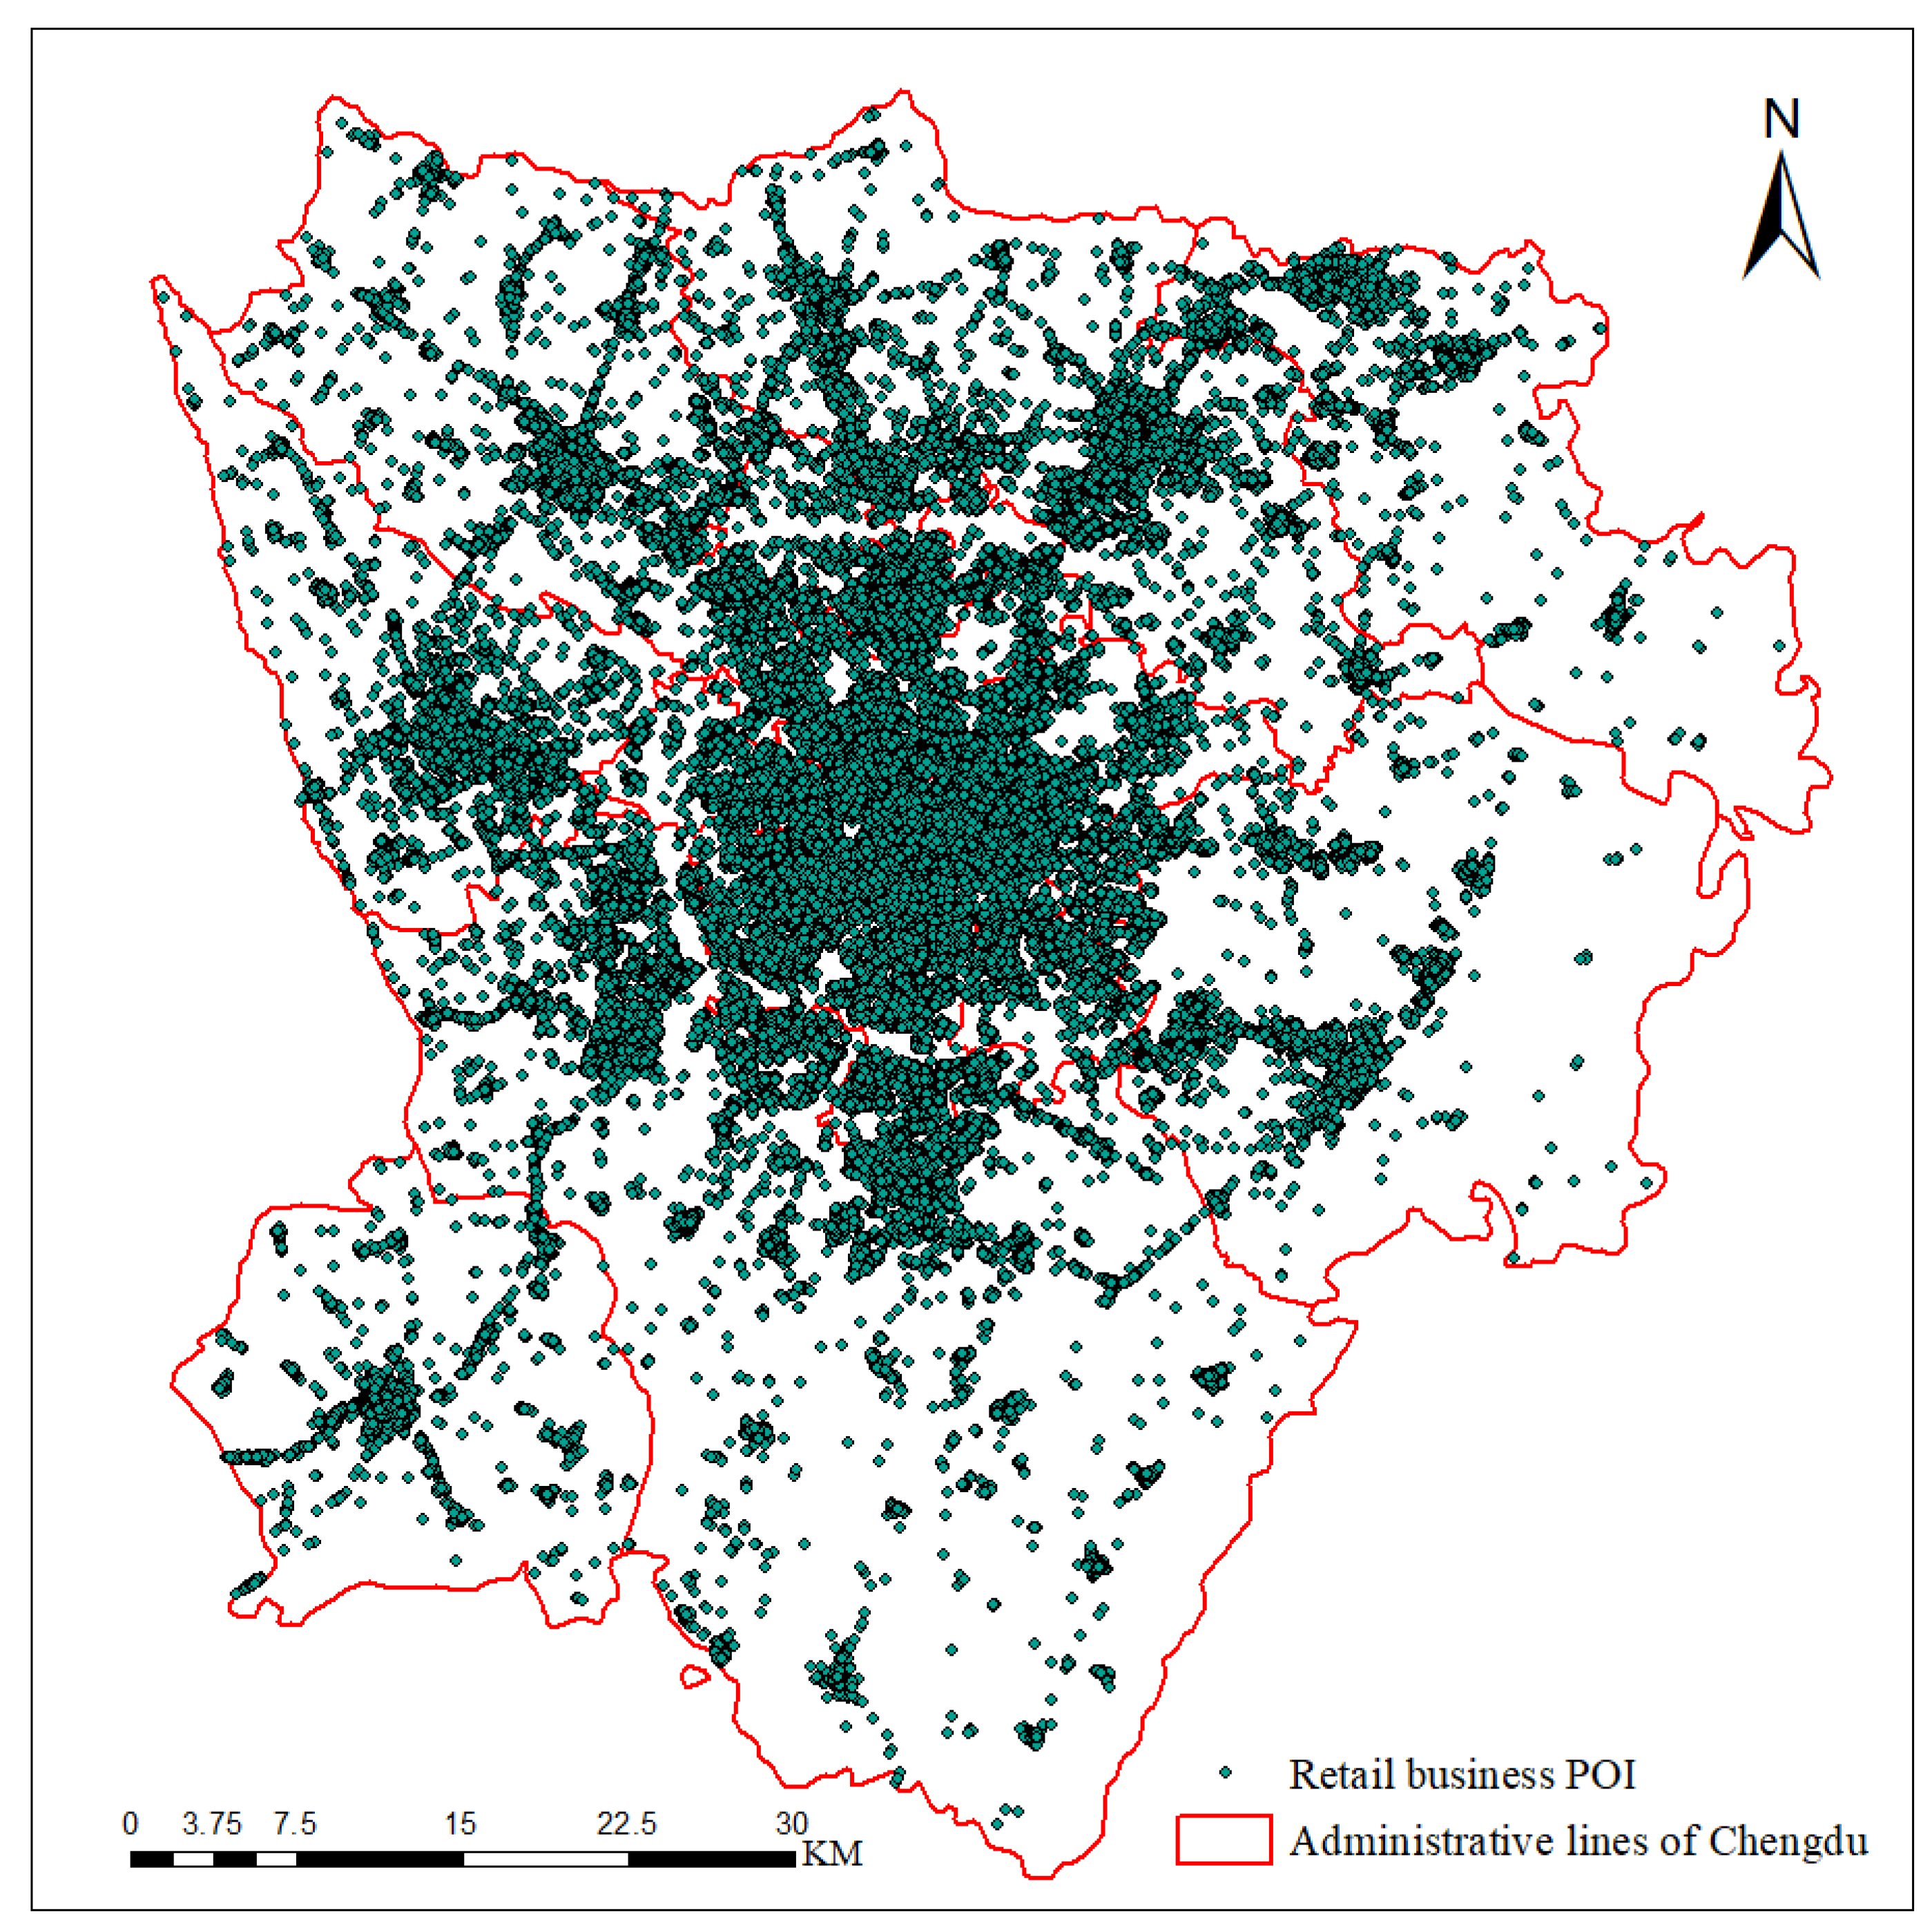
The POI data utilized in this study was obtained from the Gaode map open platform (
https://lbs.amap.com/, updated in December of 2023) using web crawling based on the amap_poi tool (
https://github.com/Civitasv/AMapPoi). Finally, a total of 176711 records from 15 subcategories were selected as the POI data for the retail industry based on Gaode map's shopping service category under its POI classification, adhering to China's retail format classification standard (GB/T18106-2004) and considering regional data comprehensiveness and integrity.
To ensure research accuracy and data quality, it is imperative to process and screen the POI data. The specific steps involved are as follows:
Step 1: Data cleaning. In the extracted POI data, some attribute values may be missing or duplicated due to errors in the crawling operation, necessitating data cleansing. Subsequent spatial geocoding and inverse coding matching were performed, resulting in the removal of duplicate entries and elimination of low recognition points through telephone queries, ultimately yielding 176711 valid data.
Step 2: Data classification. The retail POI data in the shopping service category has been selected based on classification standards provided by Gaode Map Open Platform, encompassing a total of 15 above-mentioned subcategories.
Step 3: Data format conversion and reprojection. The data format of the acquired POI data changed from CSV format to the shapefile file format and transformed into the Lambert projection coordinate system (
Figure 3).
3. Methodology
The spatial relationship between the POI data of retail commerce in the central urban area of Chengdu and night light brightness was visualized using various methods, including kernel density analysis, variable normalization, data gridding, and two-factor mapping.
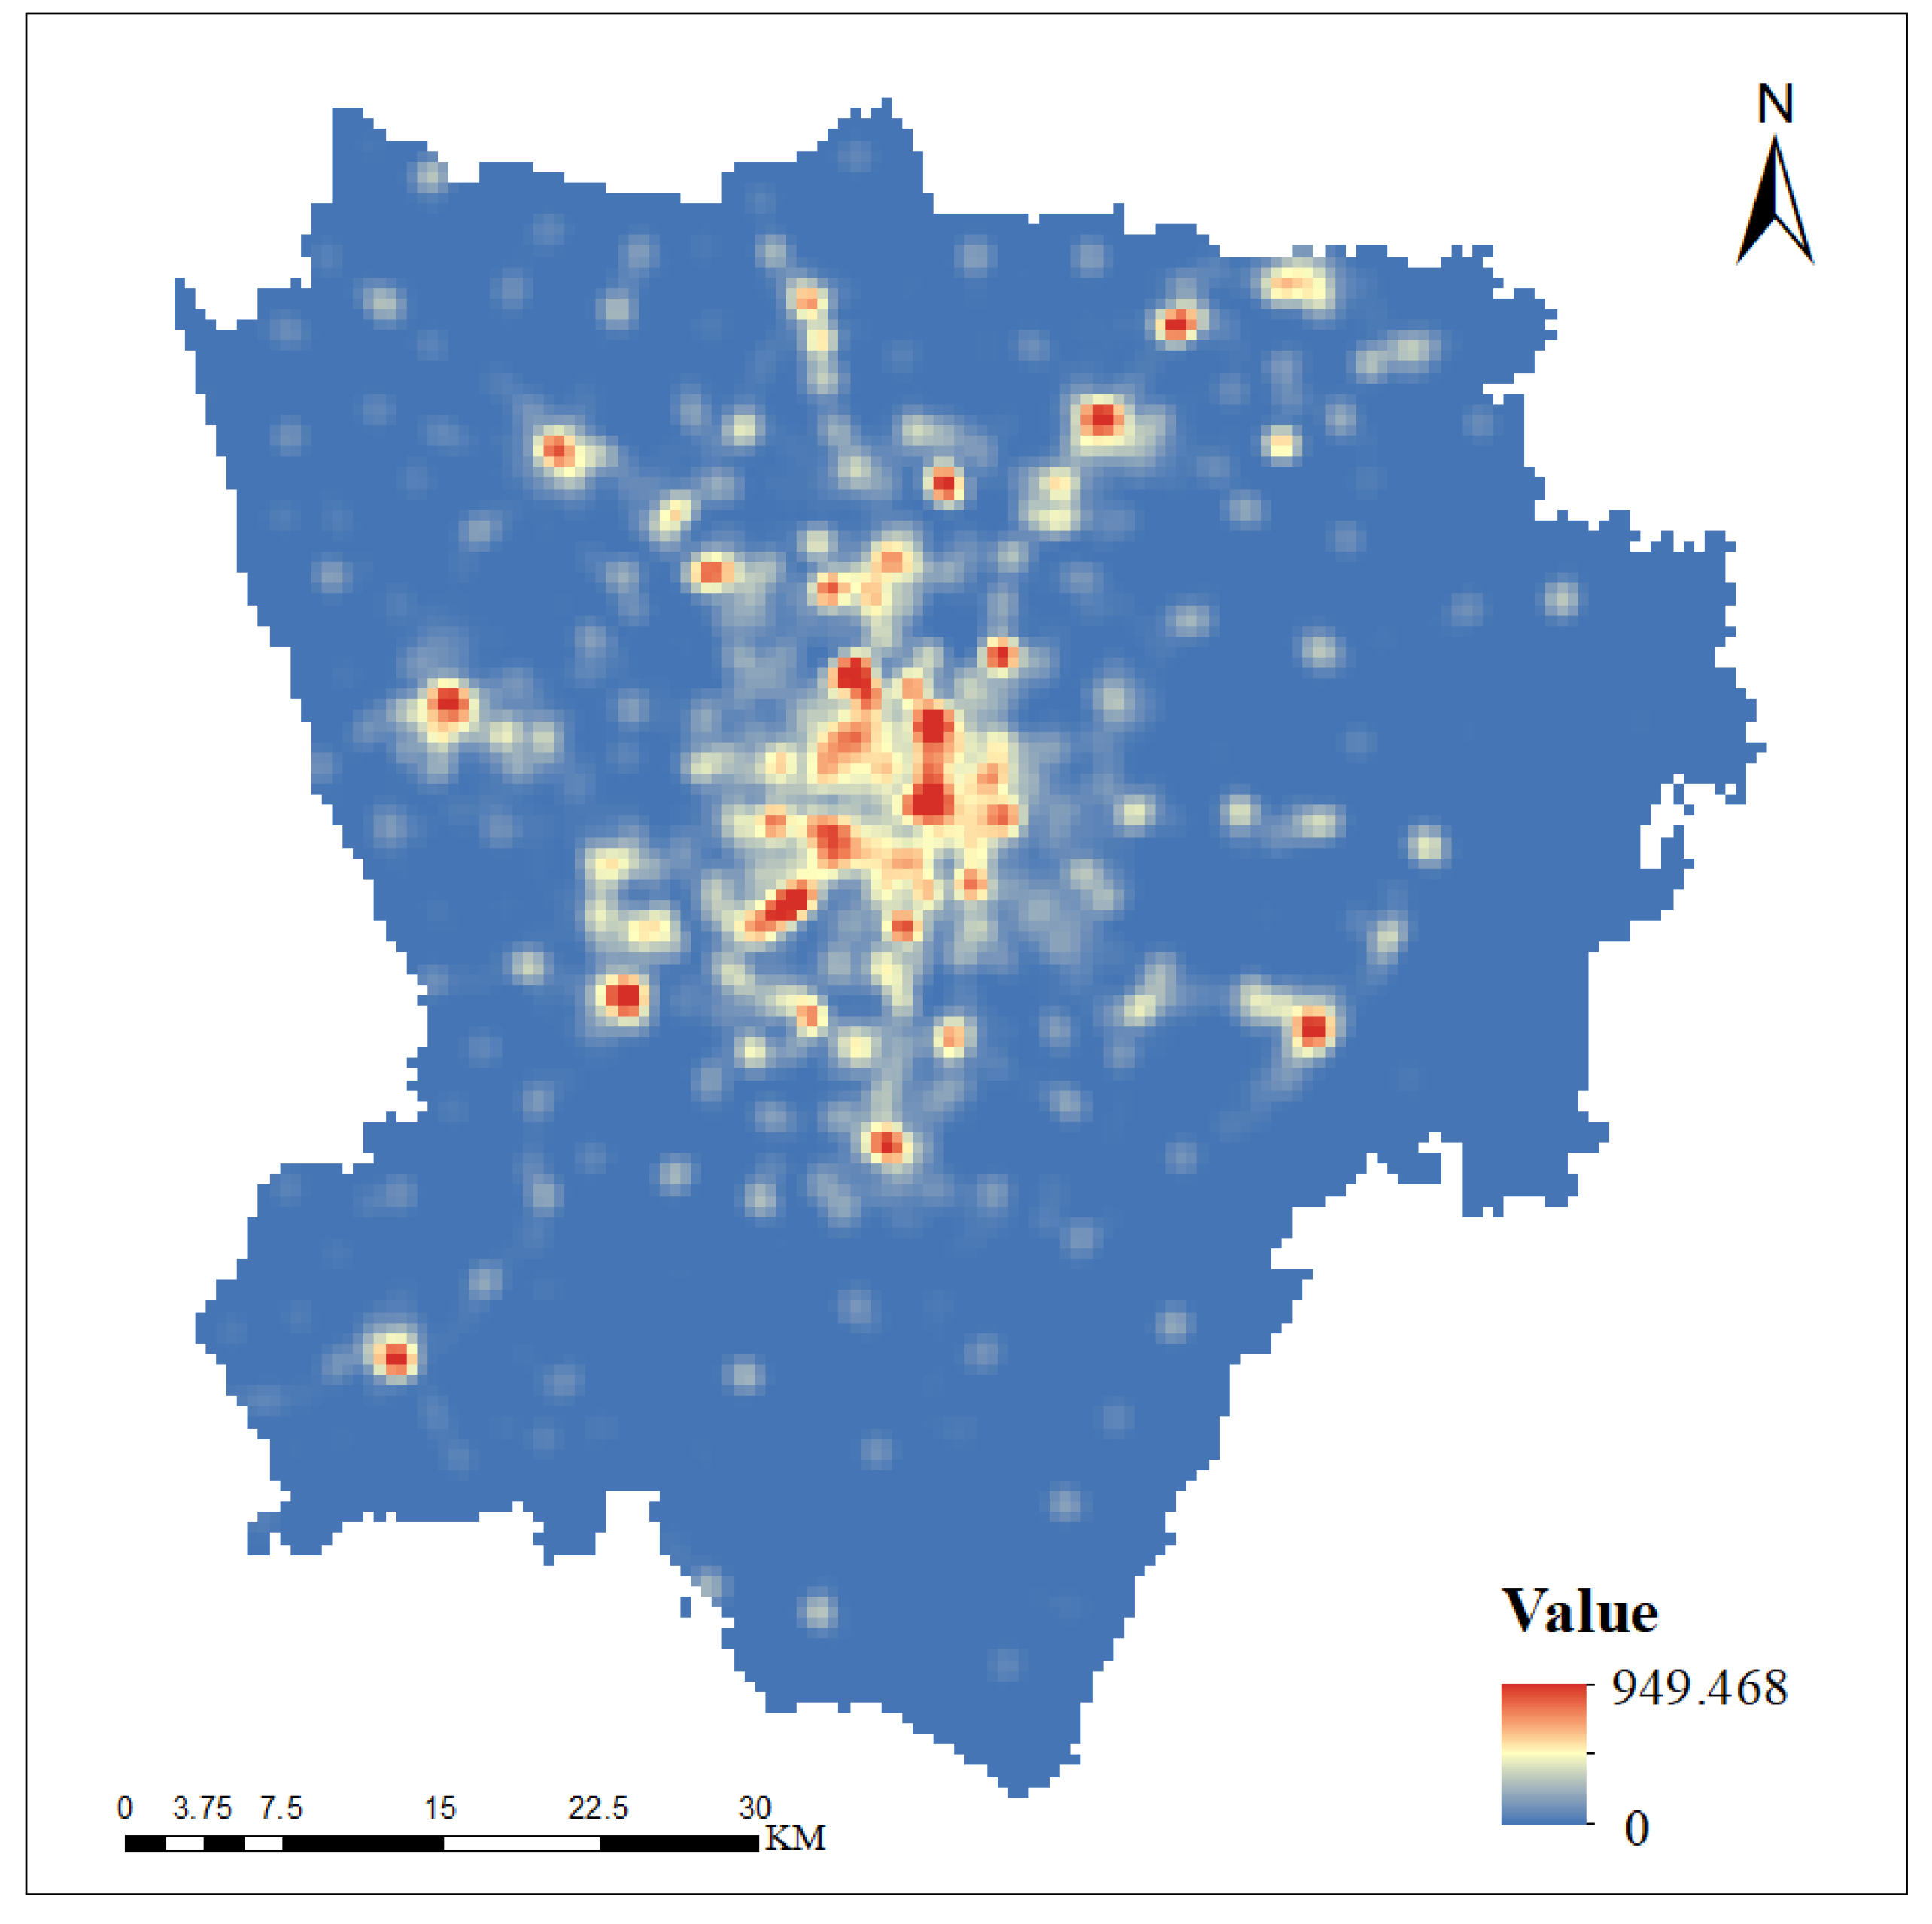
3.1. Kernel Density Analysis
The kernel density analysis method is employed to calculate the spatial density of a specific type of service industry in its surrounding neighborhood, facilitating the examination of agglomeration patterns within the study area. This method essentially involves computing the value per unit area based on point elements, subsequently fitting each point or line into a smooth conical surface, and ultimately generating a continuous density surface (
Figure 4). The kernel density estimation can be broadly elucidated as assigning weights to individual events throughout the analysis process, by leveraging a clustering algorithm for data density function. Greater weight is assigned to service industries located closer to the central point, while those situated further away receive comparatively lower weightage. The calculation formula can be expressed as follows:
where
is the kernel density calculation function of a retail enterprise outlet;
represents the kernel function while
indicates the distance between point
and
.
refers to the bandwidth parameter and
signifies the number of POI points within a specific range. To determine an appropriate bandwidth for kernel density estimation, it is essential to consider both spatial dispersion and regional research scale. This study effectively addresses these requirements by adopting Silverman's rule of thumb [
19] to calculate an optimal bandwidth value.
where SD is the weighted standard distance, which is calculated by considering the regional scale and geographical characteristics of Chengdu's main urban area;
represents the weighted median distance and
denotes the total number of POI points. To match the spatial data of subsequent operations, a output cell size of 500 m is selected.
3.2. Construction of Unified Coupling Model
The coupling degree is a measure of the degree of close connection between two things. Analyzing the coupling relationship between business distribution and group activity level distribution to test the degree of interaction and influence between them in space. The nighttime light remote sensing image brightness value is used to replace the group activity level distribution, the dispersion standardization formula is used to normalize the POI kernel density data and nighttime light remote sensing image brightness value, and the coupling degree model between commercial space and population size is constructed for analysis. See the coupling degree and coupling coordination degree model in document [
18] for the specific model:
When
,
where
is the coupling degree, indicating the strength of the coupling relationship between systems;
and
are normalized night light brightness and POI kernel density data, respectively. The range of Coupling degree
is [0,1],
The higher the value of
, the higher the coupling degree between the two datasets; on the contrary, the lower the degree of coupling between them. That is, the coupling degree C quantifies the level of concordance between the brightness of nocturnal illumination and the density value of POI, with lower values indicating a weaker correspondence and higher values indicating a stronger correspondence.
Where
is a comprehensive evaluation index, reflecting the complementary relationship between subsystems;
is the weight of the
subsystem. Here, it is considered that the nighttime light brightness is as important as the POI kernel density value, that is,
is equal to 0.5.
where
represents the coupling coordination, reflects the benign coupling degree in the coupling interaction relationship, and describes the coordination quality of the relationship.
The coupling coordination degree D is classified as follows: "Lower" indicates a situation characterized by both low levels of night light brightness and POI kernel density, referred to as "low-low"; "Low" corresponds to the combined levels of "low-medium" and "medium-low"; "Medium" corresponds to the combined levels of "low-high", "high-low", and "medium-medium"; "High" corresponds to the combined levels of "medium-high" and "high-medium"; while finally, “Higher” represents the highest level denoted as “high-high”.
4. Results and Discussion
4.1. Overall Spatial Coupling Relationship
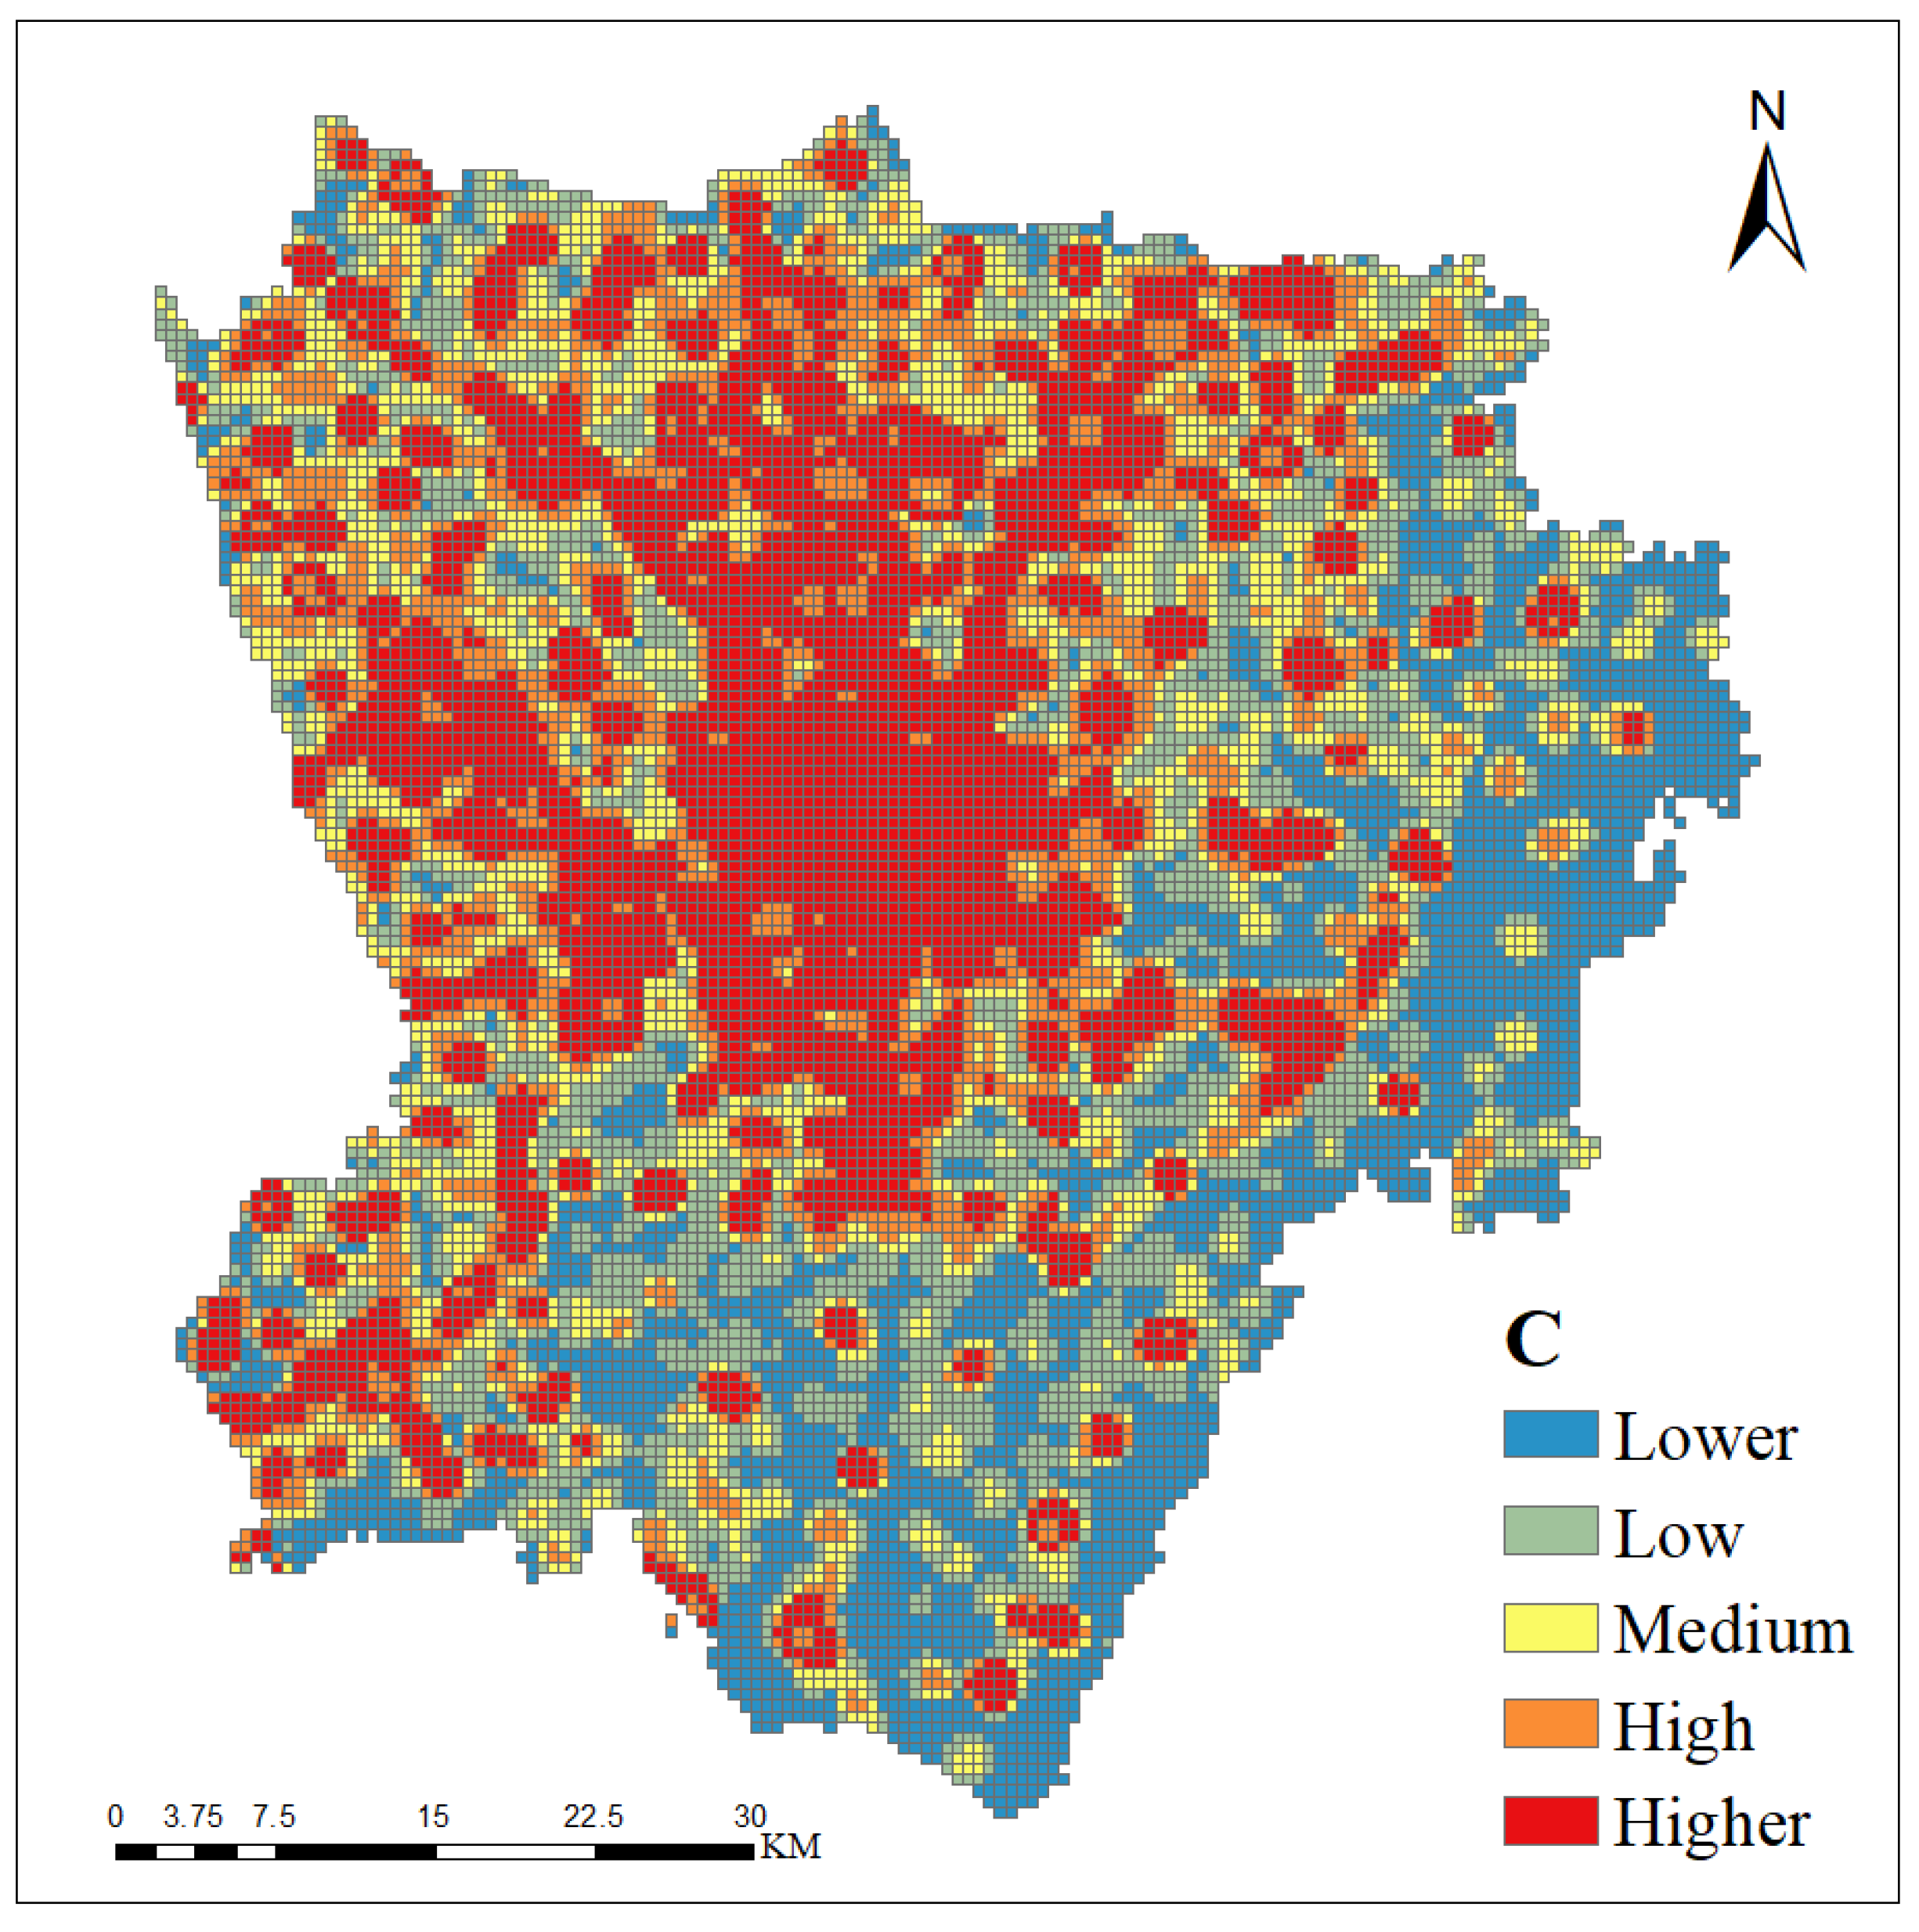
The visualization of the spatial relationship between nighttime light remote sensing data and POI data in the central urban area of Chengdu in 2023 is presented, and the resulting visual analysis examines the similarities and differences in coupling between the spatial distribution of retail enterprises and group activity level.
Results illustrate that the coupling degree C ranges from 0 to 1, while the coupling coordination degree D ranges from 0 to 0.810366. The classification follows a natural breakpoint classification method and is categorized into five levels as presented in
Table 1. This conforms to the definition of the two concepts, and the total strength of the interaction must be greater than the strength of the benign interaction.
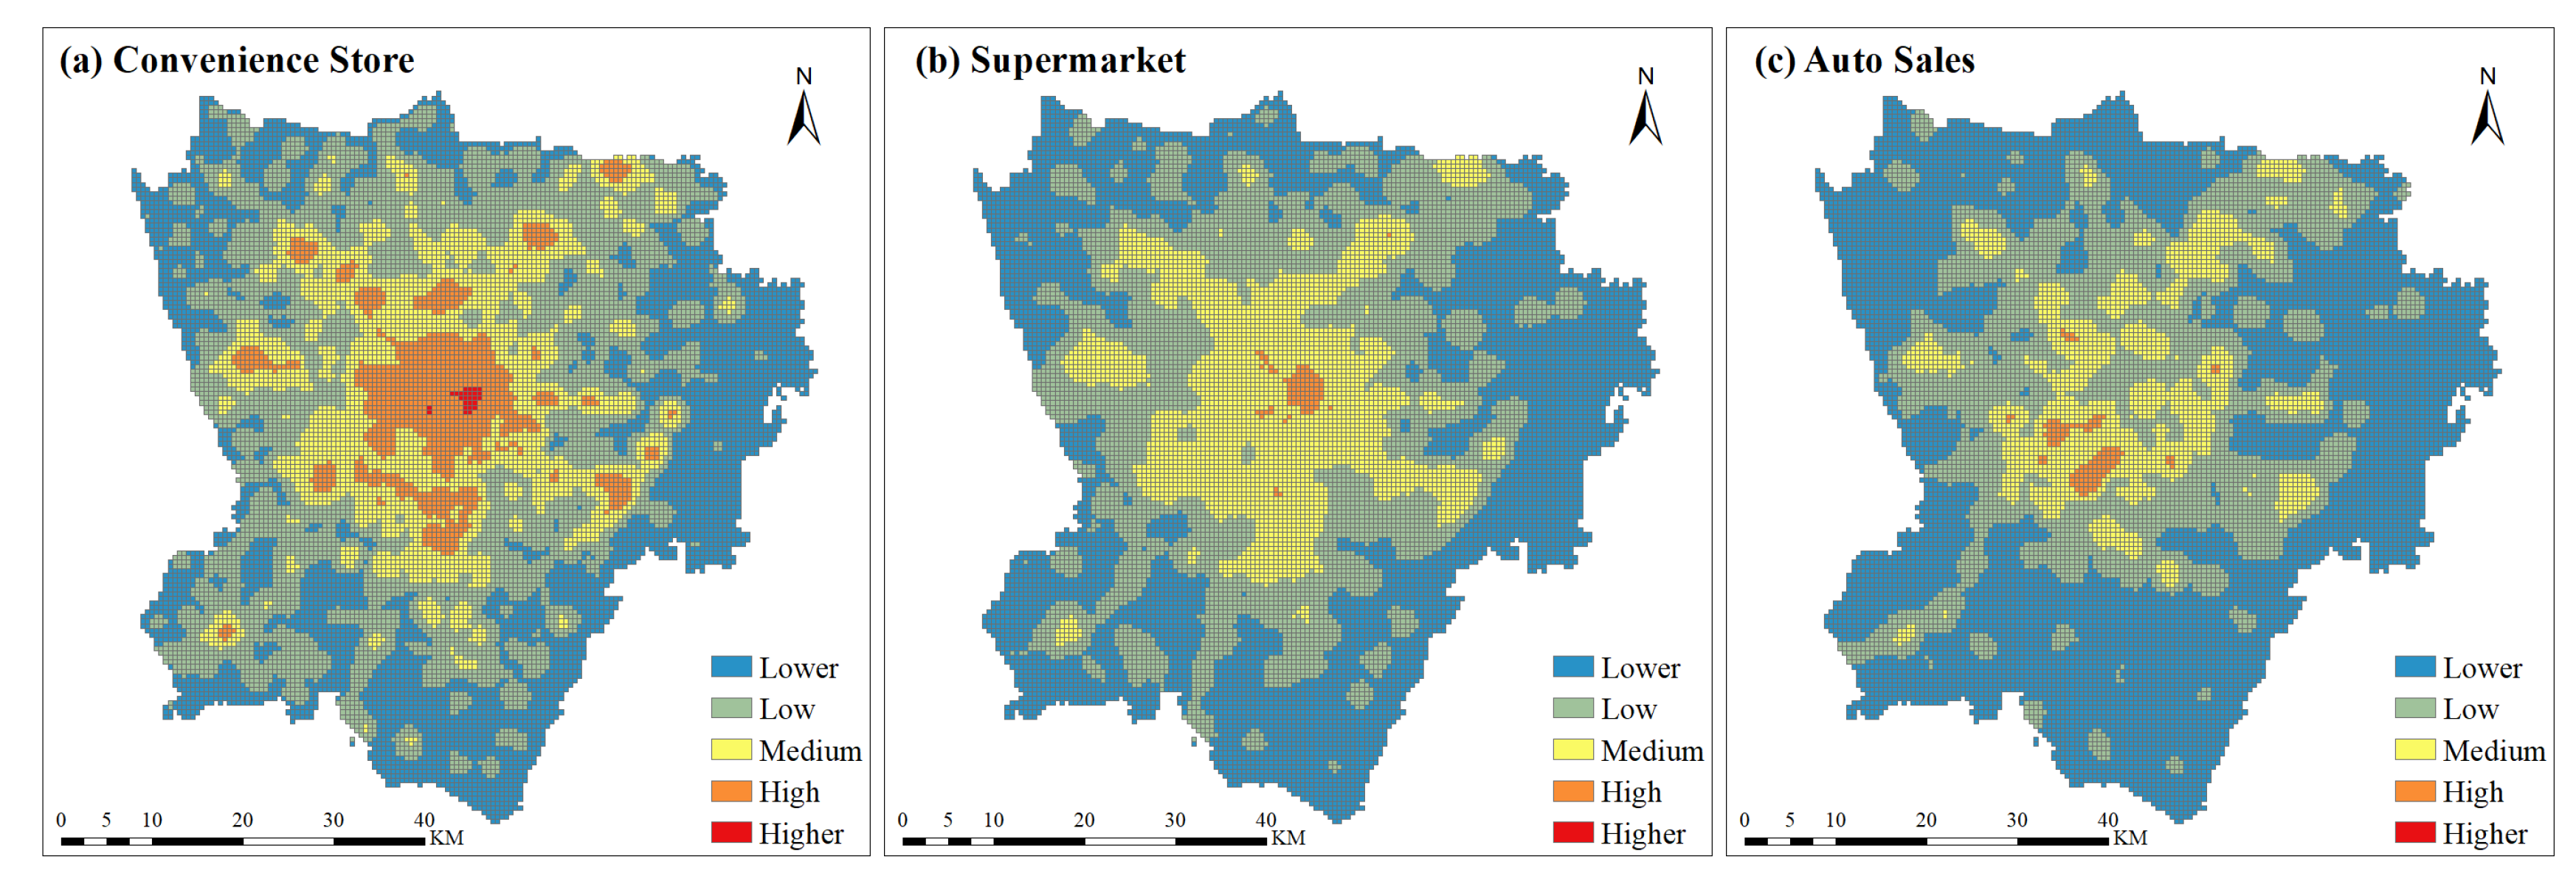
As shown in
Figure 5, the coupling degree in the central region of the study area is higher and gradually decreases towards the periphery. Consequently, multiple highly coupled centers exist within the region, with significantly higher coupling degrees observed in the northern and western areas compared to their southern and eastern counterparts.
Table 2 presents statistical data on coupling degrees. It shows that regions characterized by medium or above levels of night light brightness and retail POI kernel density accounted for 63.50% of the total study area, while areas exhibiting lower coupling degrees constituted 19.40%. These findings suggest that despite considering the spillover effect of nighttime light remote sensing data, a mismatch between retail commercial activity intensity and group activity level distribution persists in Chengdu.
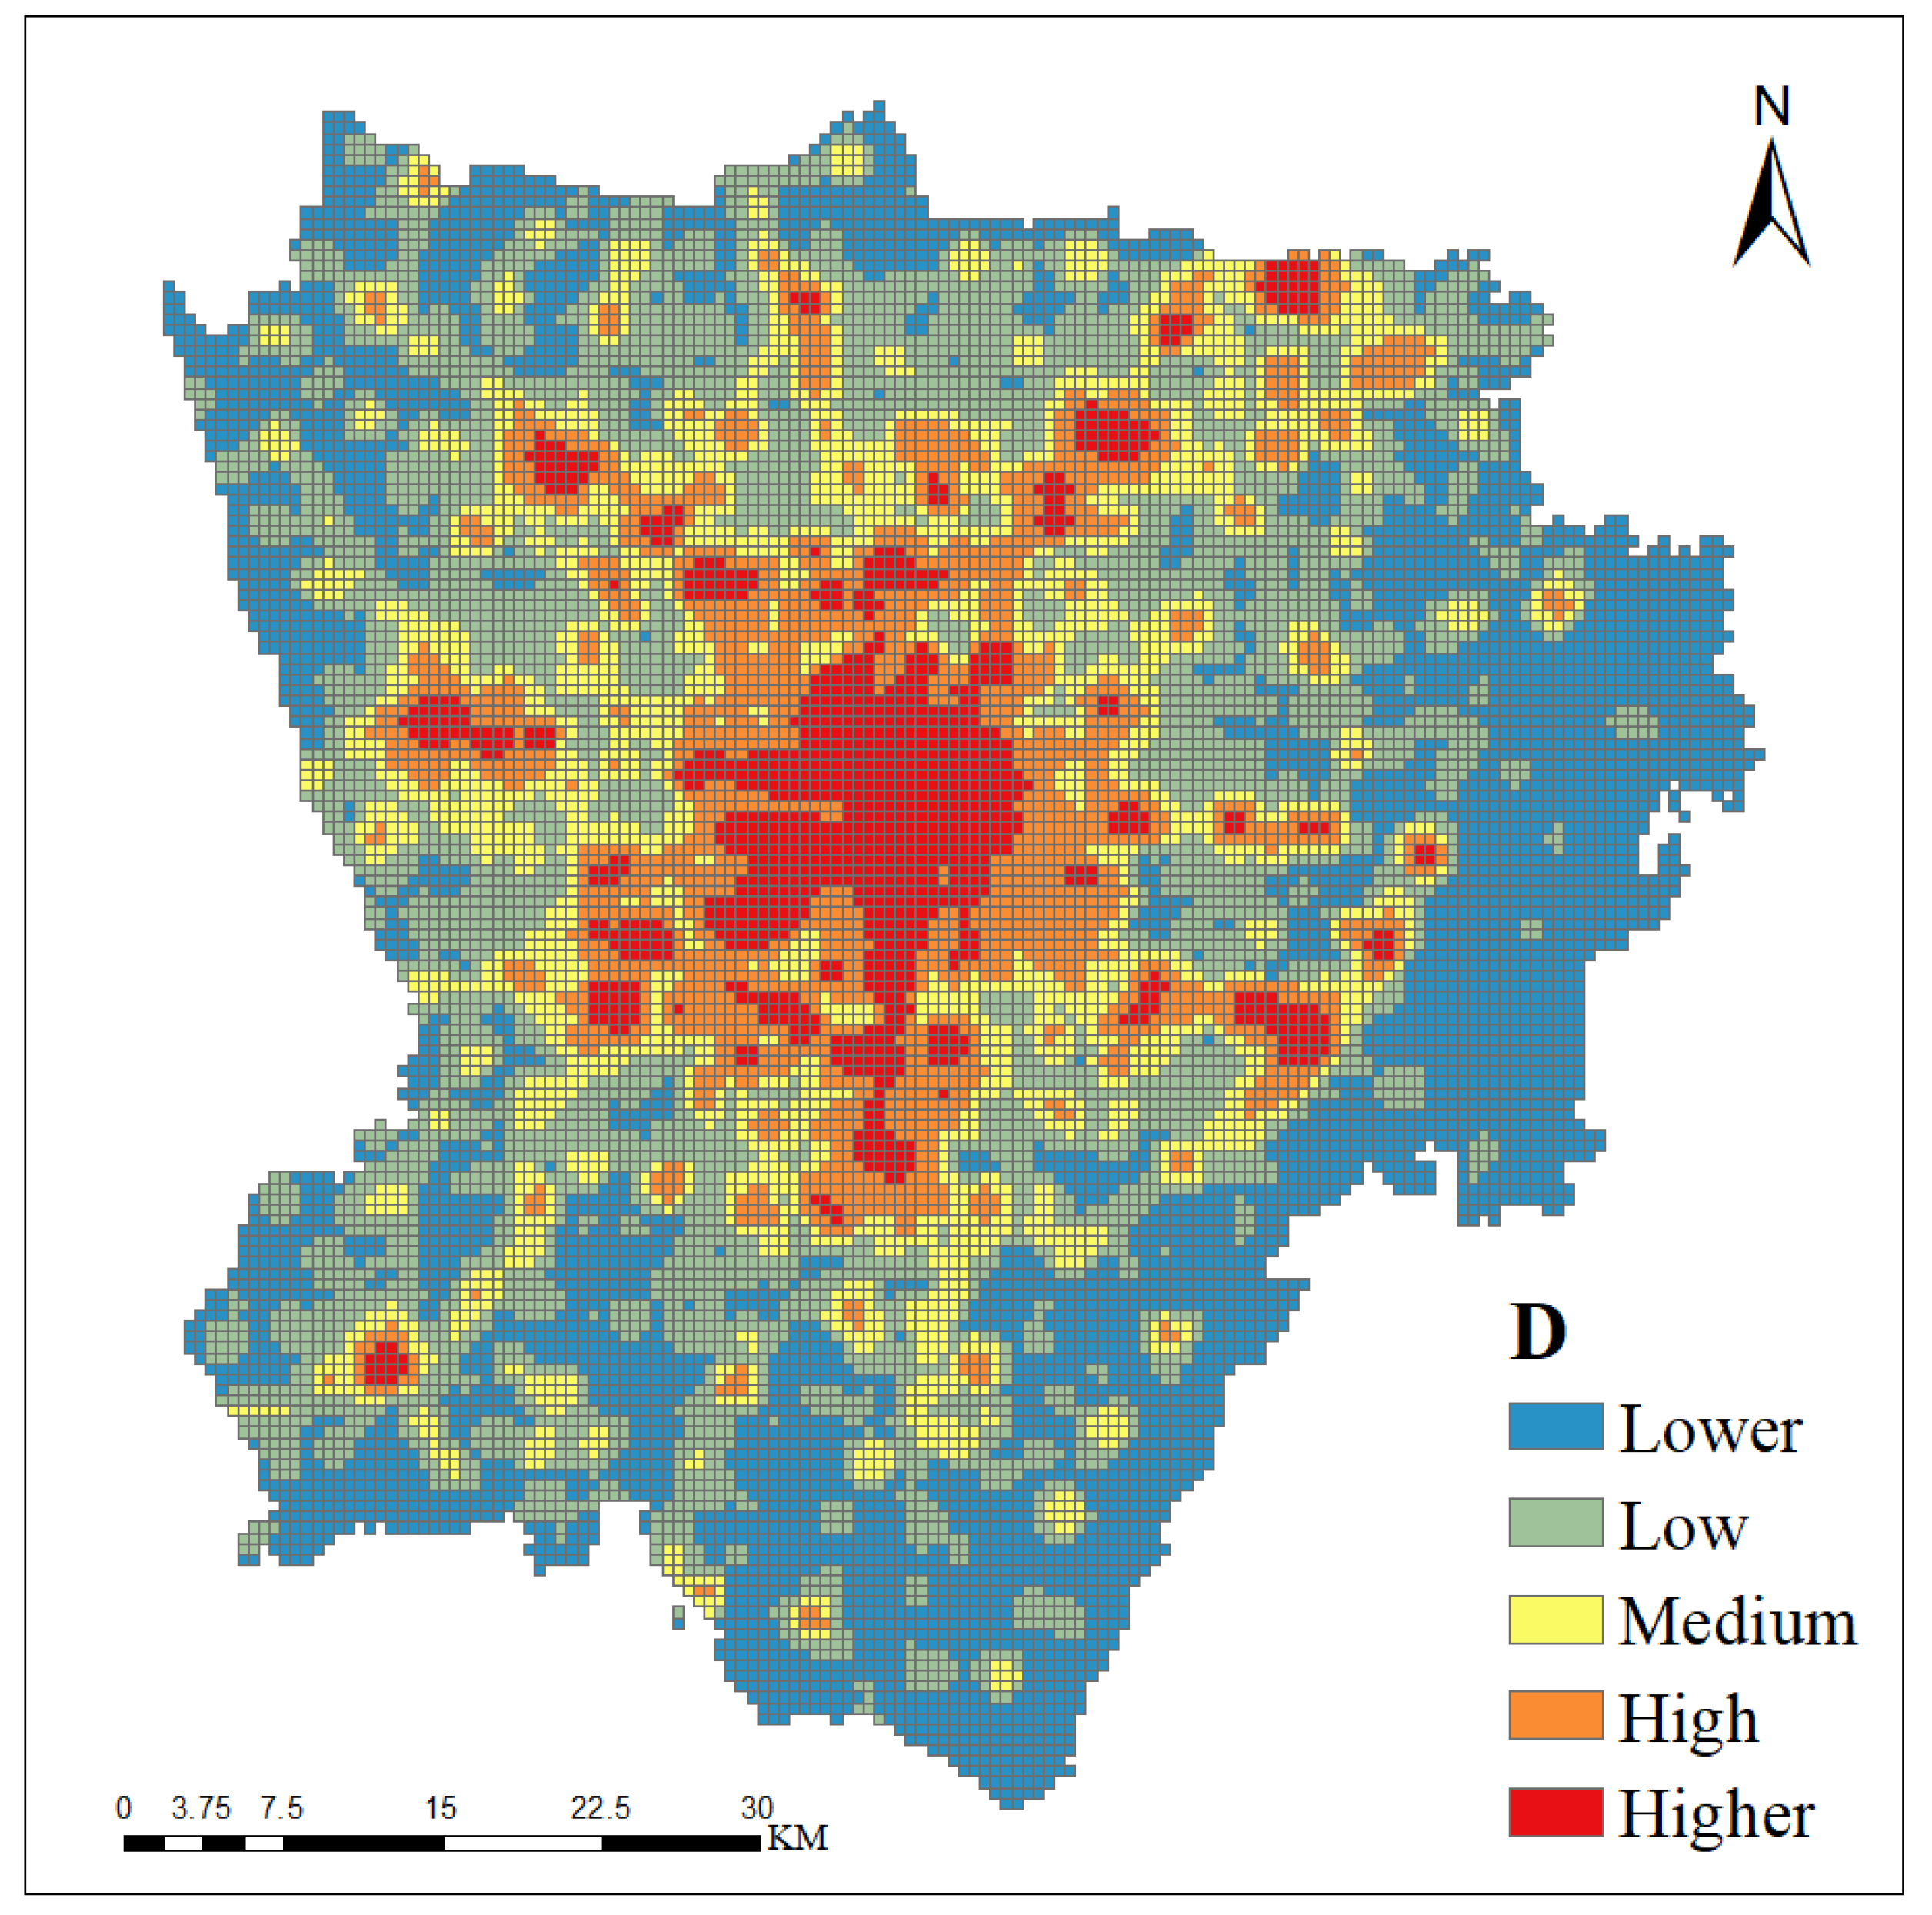
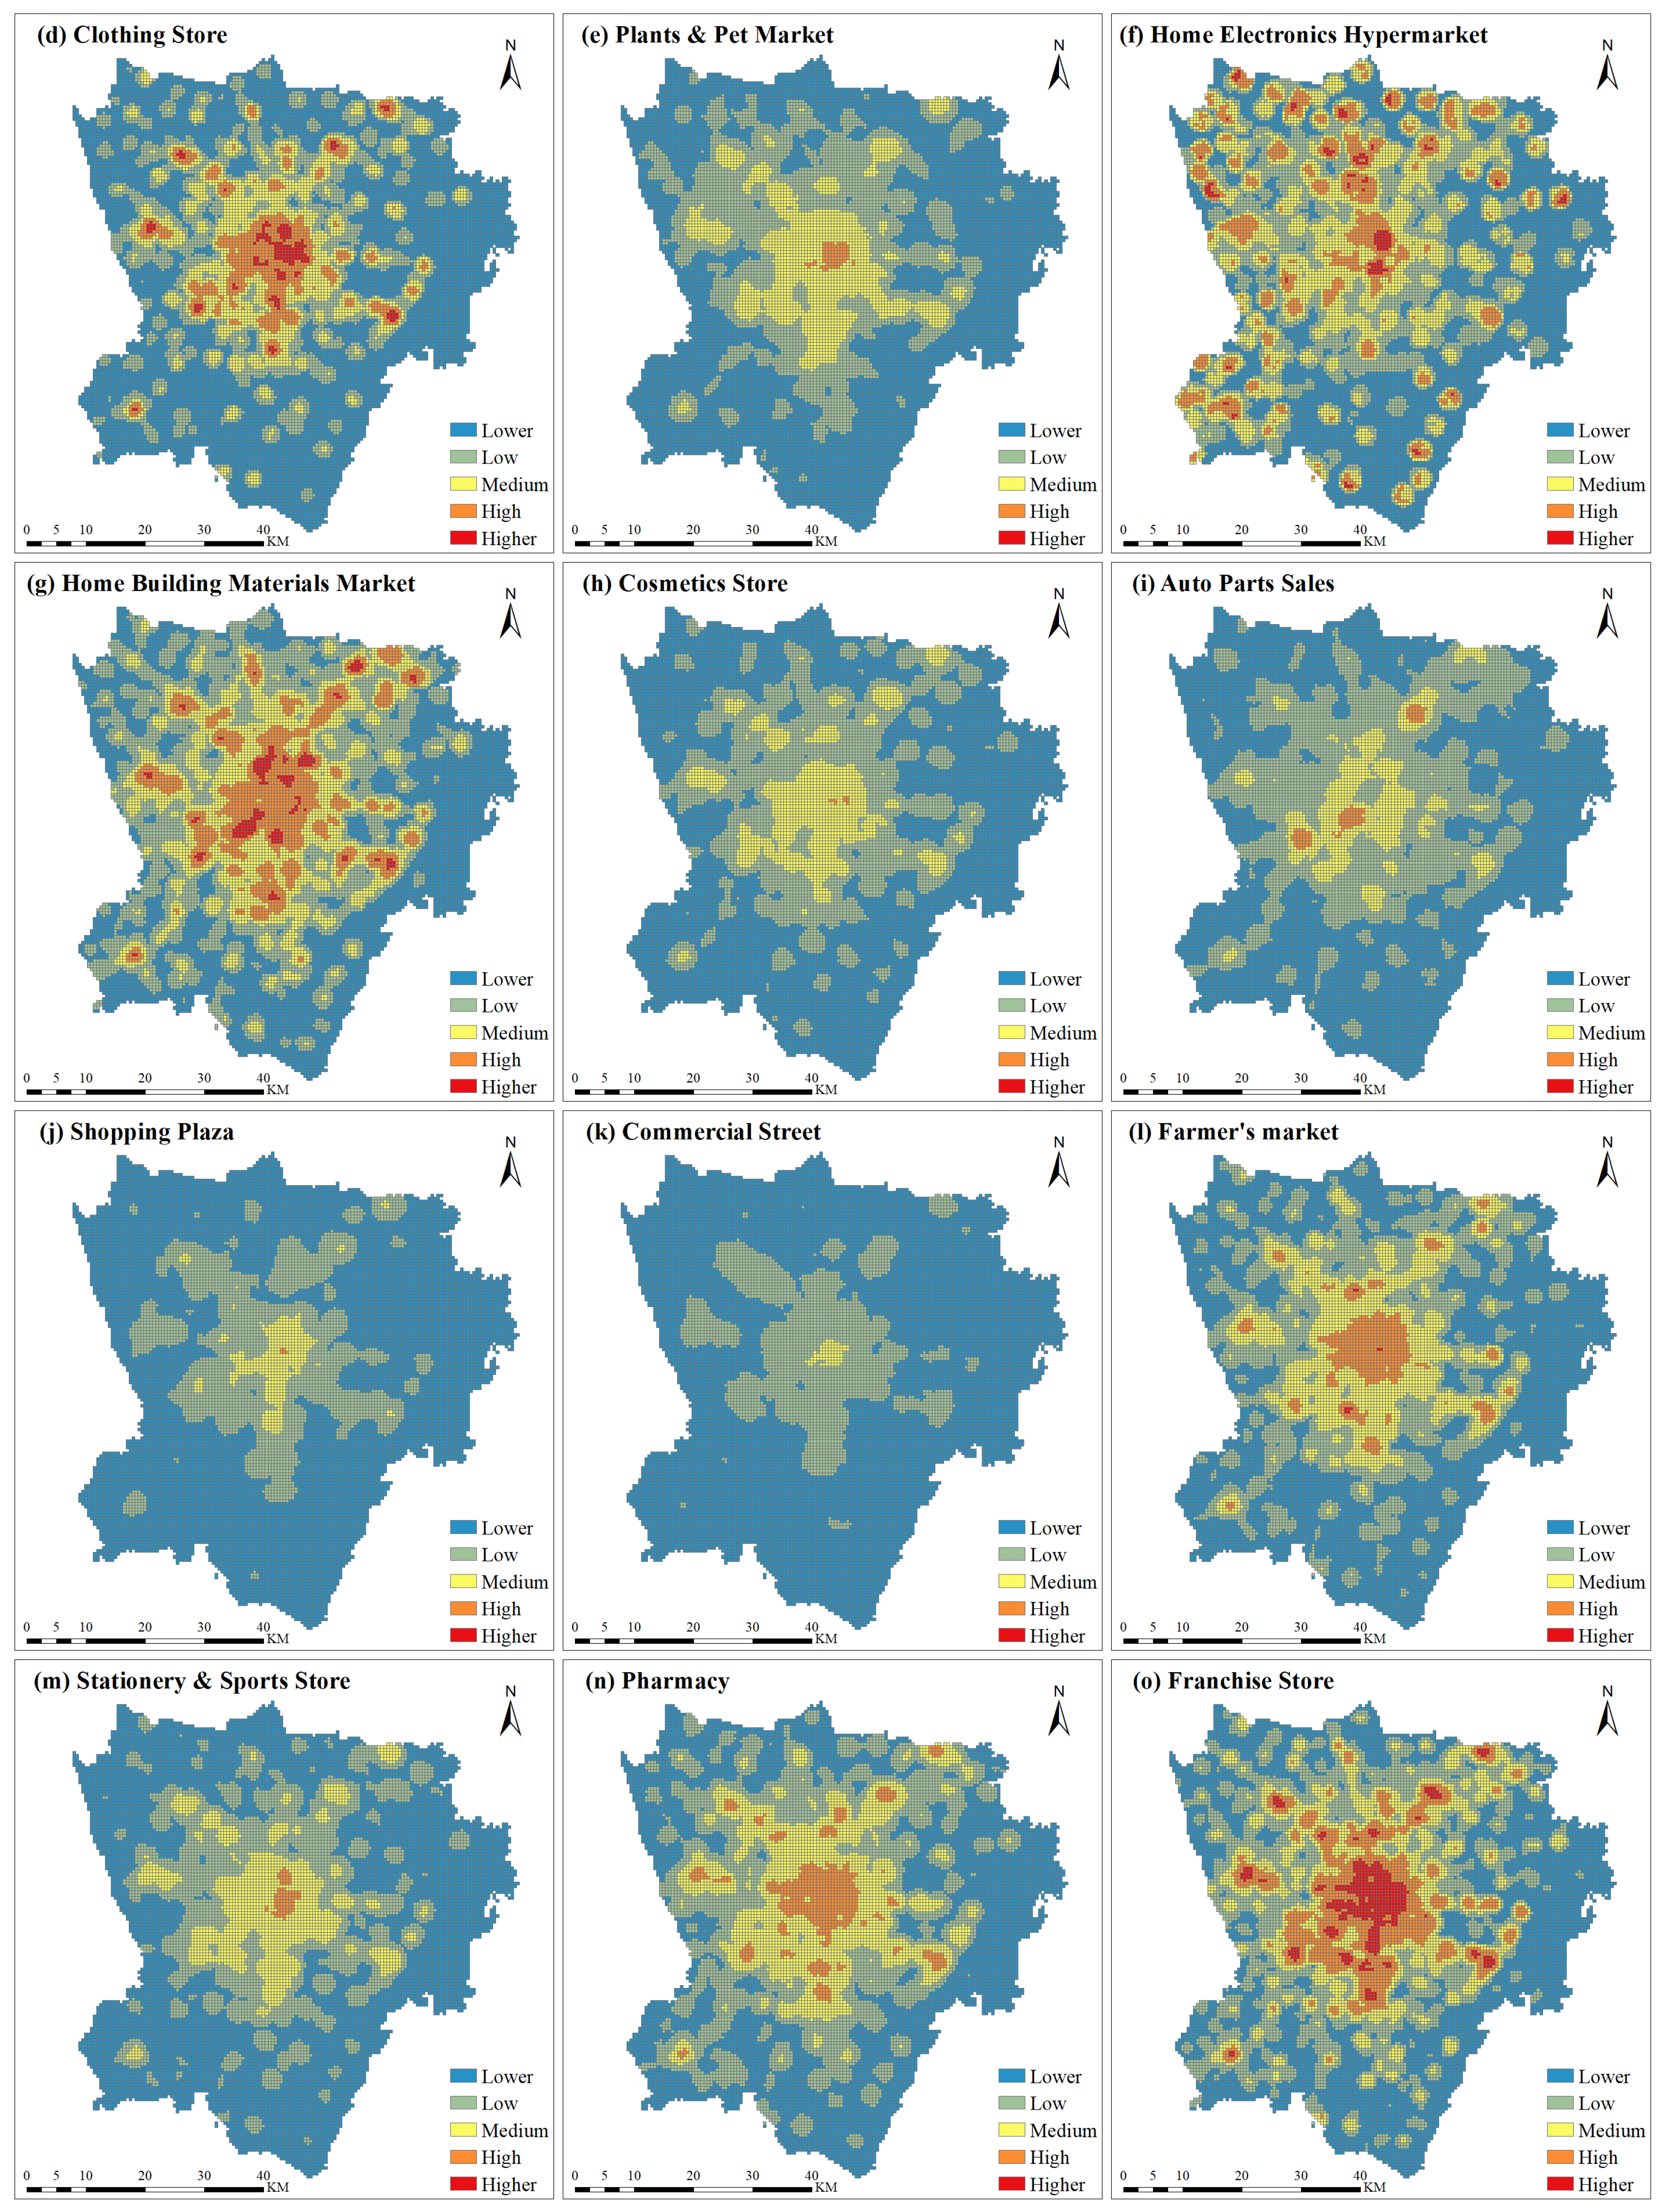
As shown in
Figure 6, areas with higher coupling coordination degrees are more concentrated in the central area of the study region, compared to the coupling degree diagram. The coupling coordination degree gradually diminishes from the center towards the periphery. According to
Table 2, statistical analysis of coupling coordination degree data reveals that medium and above levels of coupling coordination degrees for night light brightness and retail POI kernel density account for 79.90% of the total study area. This indicates that in Chengdu, there is a moderate or higher level of coupling coordination between retail commercial activities and group activity level in most areas. The proportion of the coupling coordination degree at the medium and above level is higher than that of the coupling degree. This implies that despite their high interdependence, they are able to achieve superior overall performance through effective coordination mechanisms for maintaining stability and promoting growth. There is still a relatively underdeveloped portion covering 14.2% of the total study area - referred to as "low-low" level - characterized by low night light brightness and retail POI kernel density; this may be attributed to reciprocal causation between these two conditions.
4.2. Spatial Coupling Relationship Among Administrative Regions
As shown in
Table 3, the top five districts in the order of coupling degree between the night light brightness and POI kernel density in Chengdu from high to low in the higher level are Wuhou, Jinniu, Qingyang, Jinjiang, and Chenghua. The top five districts in the order of coupling coordination degree are Wuhou, Qingyang, Jinniu, Jinjiang, Chenghua.
The districts with the highest proportion of areas at the higher levels of coupling degree and coupling coordination are both Wuhou, with respective percentages of 82.73% and 51.3%. Similarly, Wuhou also has the highest proportion of areas at the medium and above levels for both coupling degree and coupling coordination, with percentages of 98.79% and 99.66% respectively. A high coupling degree implies that in Wuhou, there is a strong match between retail commercial development and group activity level, with a minimal likelihood of oversupply or insufficient supply, indicating a more mature and comprehensive overall construction. However, it also suggests that group activity level is susceptible to fluctuations in retail commercial activities. A high degree of coupling coordination suggests that retail commercial activities are capable of sensitively and effectively responding to the novel changes in group activities, and that the entire system possesses high economic stability and strong resilience against risks.
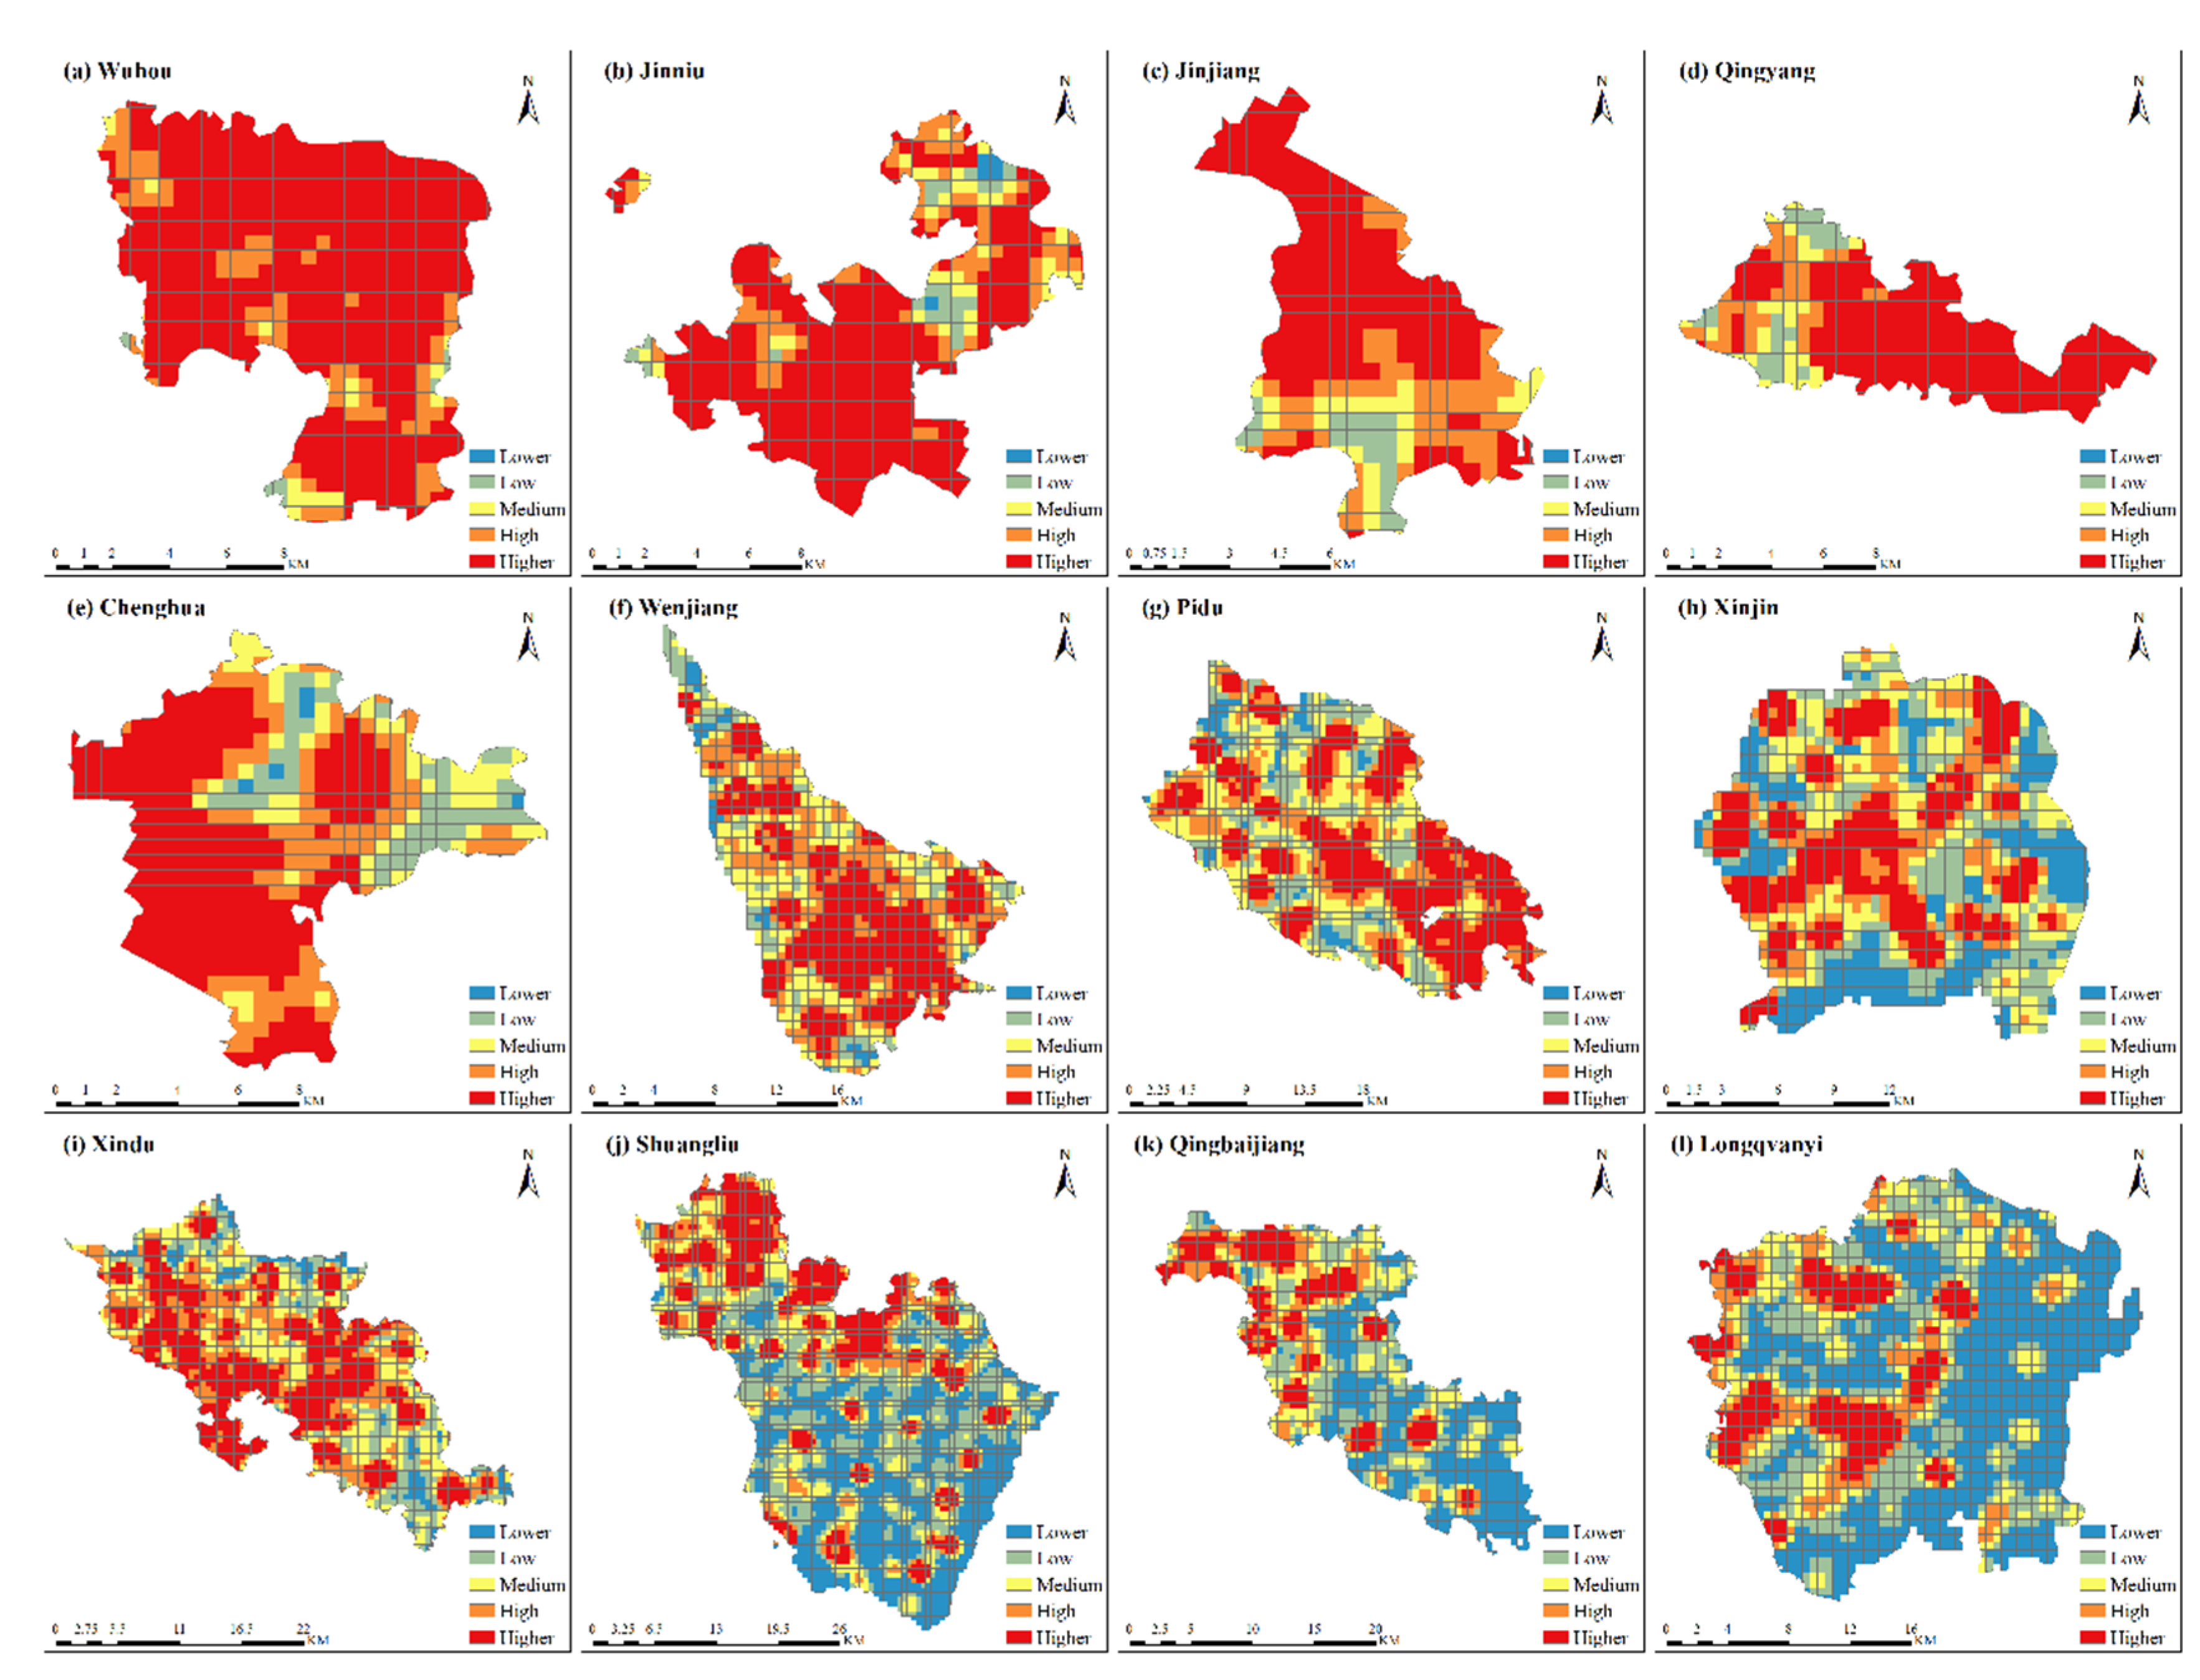
The night light brightness and POI kernel density coupling degree of 12 administrative regions in Chengdu in 2023 was mapped by two-factor combinations, and the visual night light remote sensing and POI kernel density coupling map of 12 administrative districts in Chengdu was obtained (
Figure 7).
As shown in
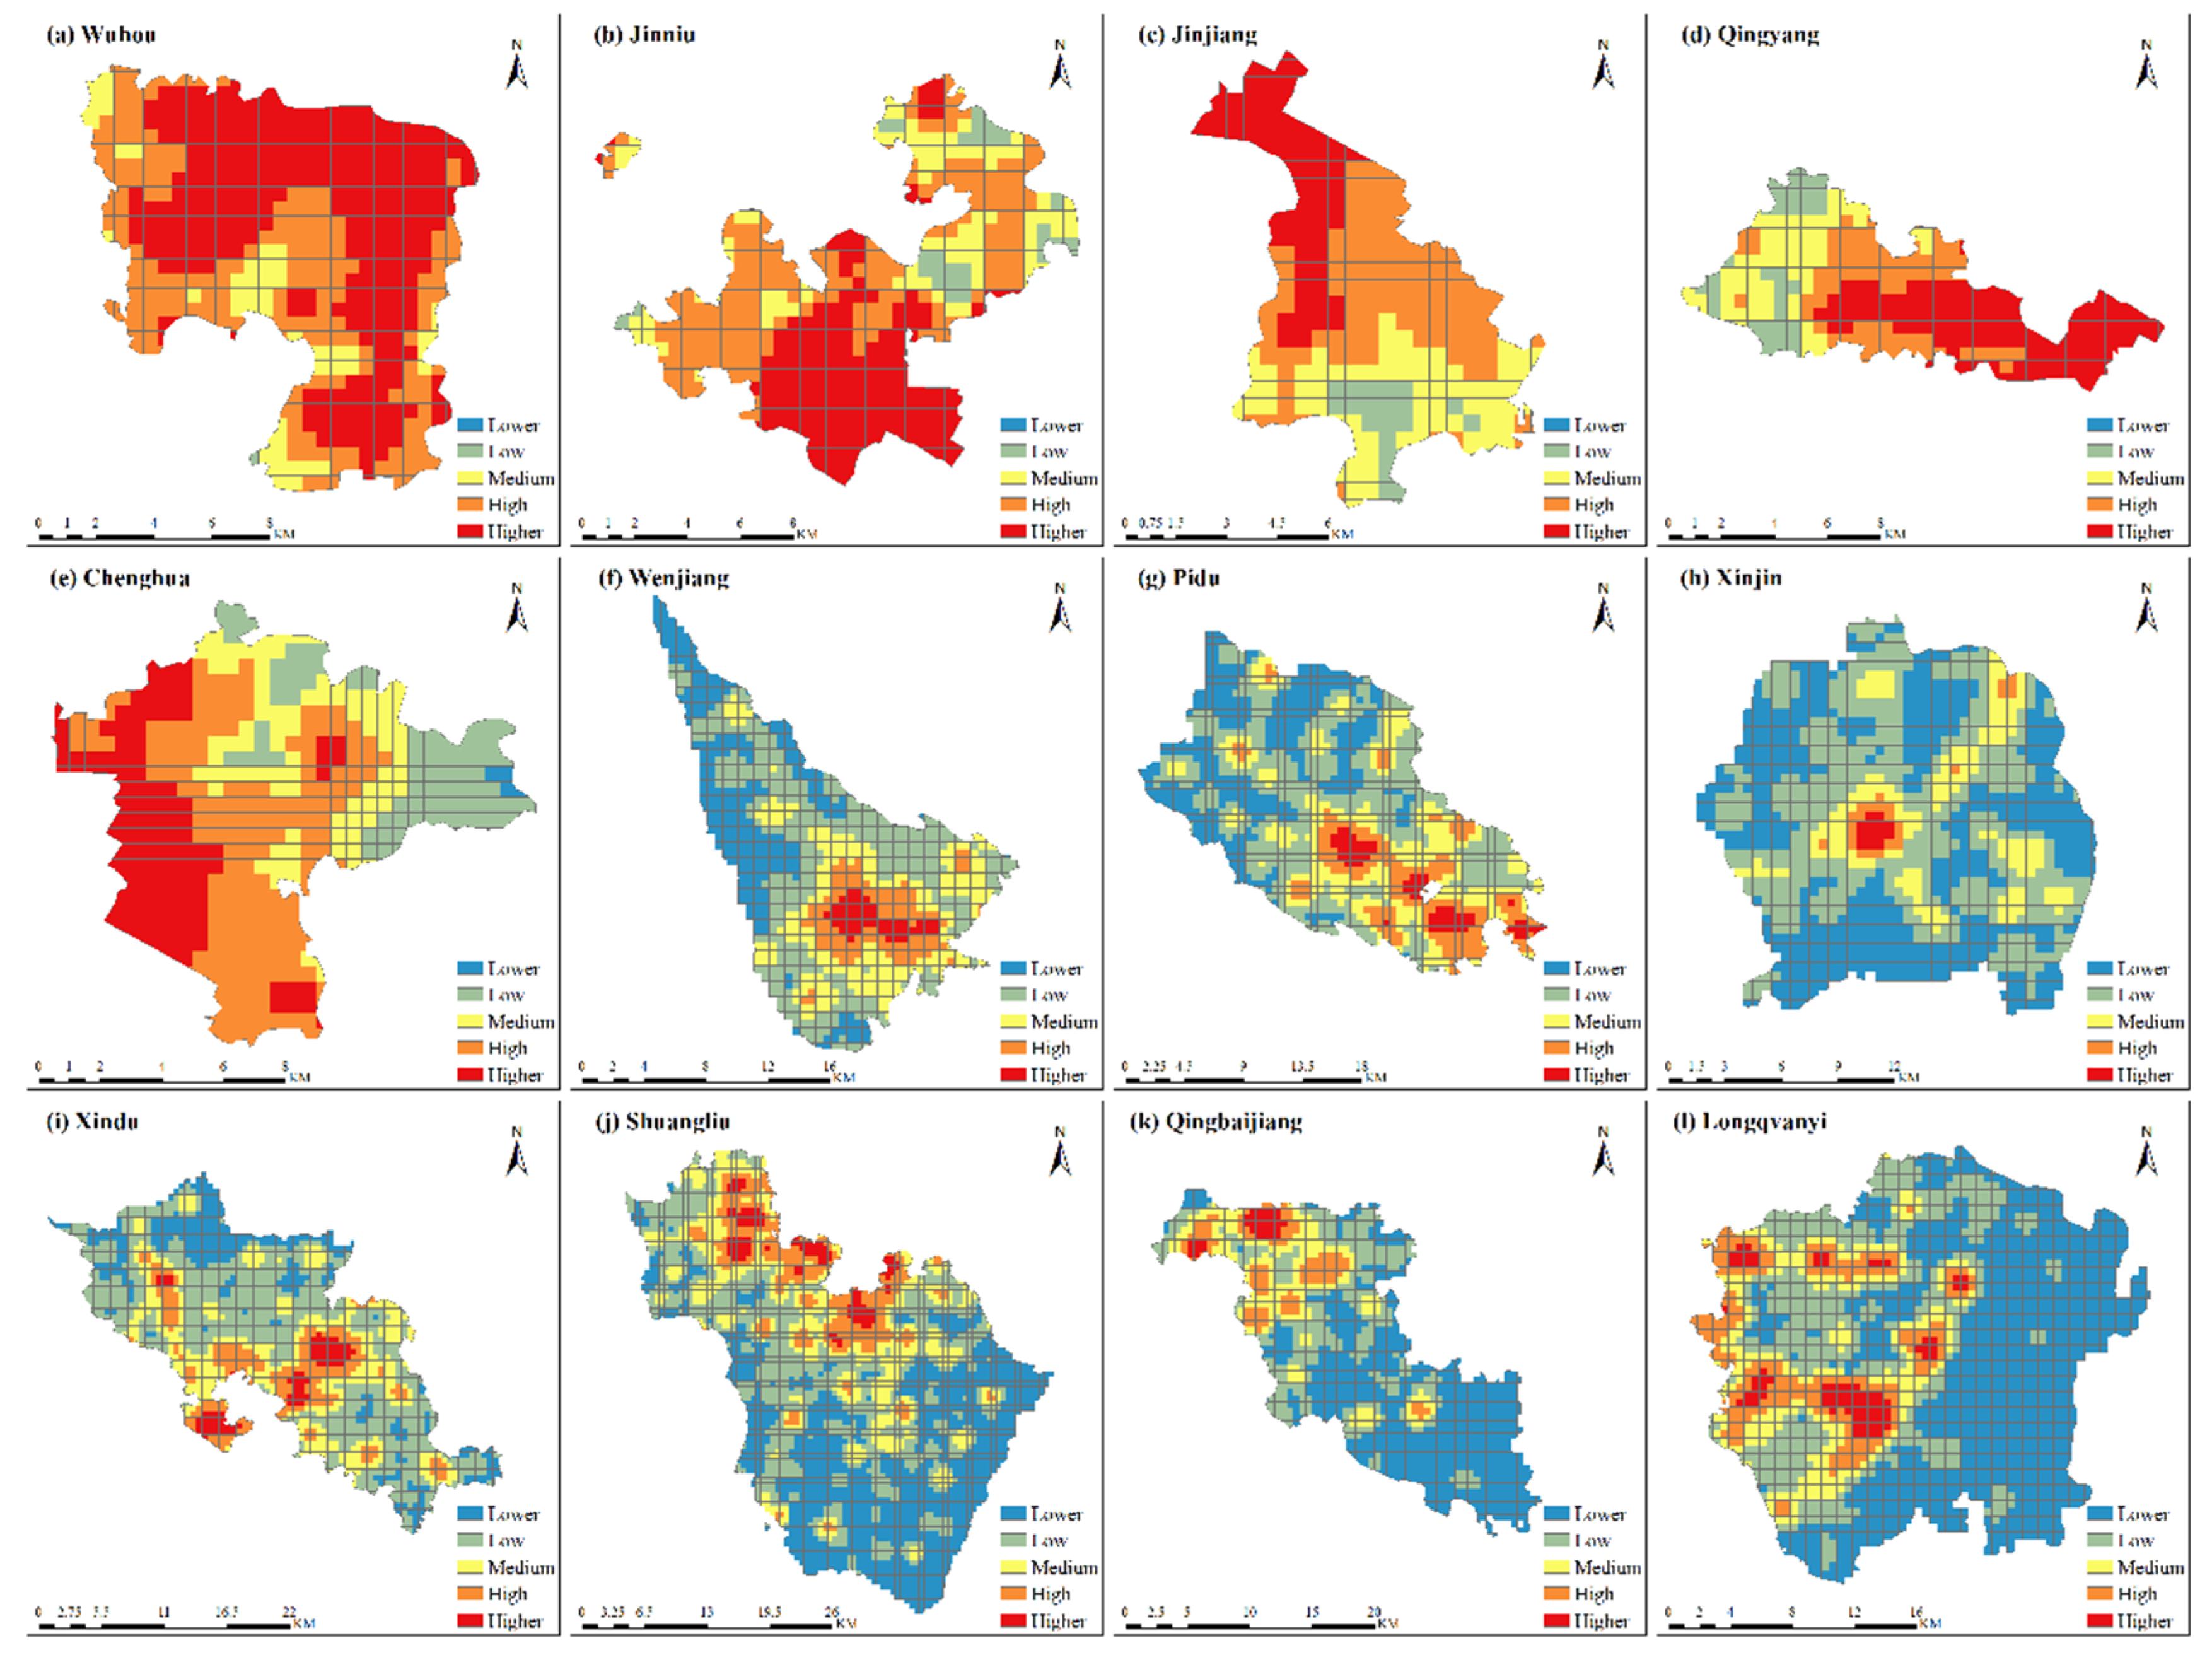
Figure 7, the distribution of coupling degree in each region is similar to that in the central urban area of Chengdu, which is composed of several centers with higher coupling degree and zones with decreasing coupling degree from the center to the surrounding areas .The coupling coordination degree of night light brightness and POI kernel density in 12 administrative districts of Chengdu in 2023 was mapped by two-factor combinations, and the visual relationship between the coupling coordination degree of night light remote sensing and POI kernel density in 12 administrative districts of Chengdu was obtained (in
Figure 8).
As shown in
Figure 8, in most areas, many centers with higher coupling degrees become decremental zones under the coupling coordination degree, with only a few centers maintaining their central status in the coupling coordination degree. The well-developed Wuhou, mentioned earlier, exhibits a little difference in the levels of coupling and coupling coordination within the same geographic space.
4.3. Spatial Pattern of Retail Format
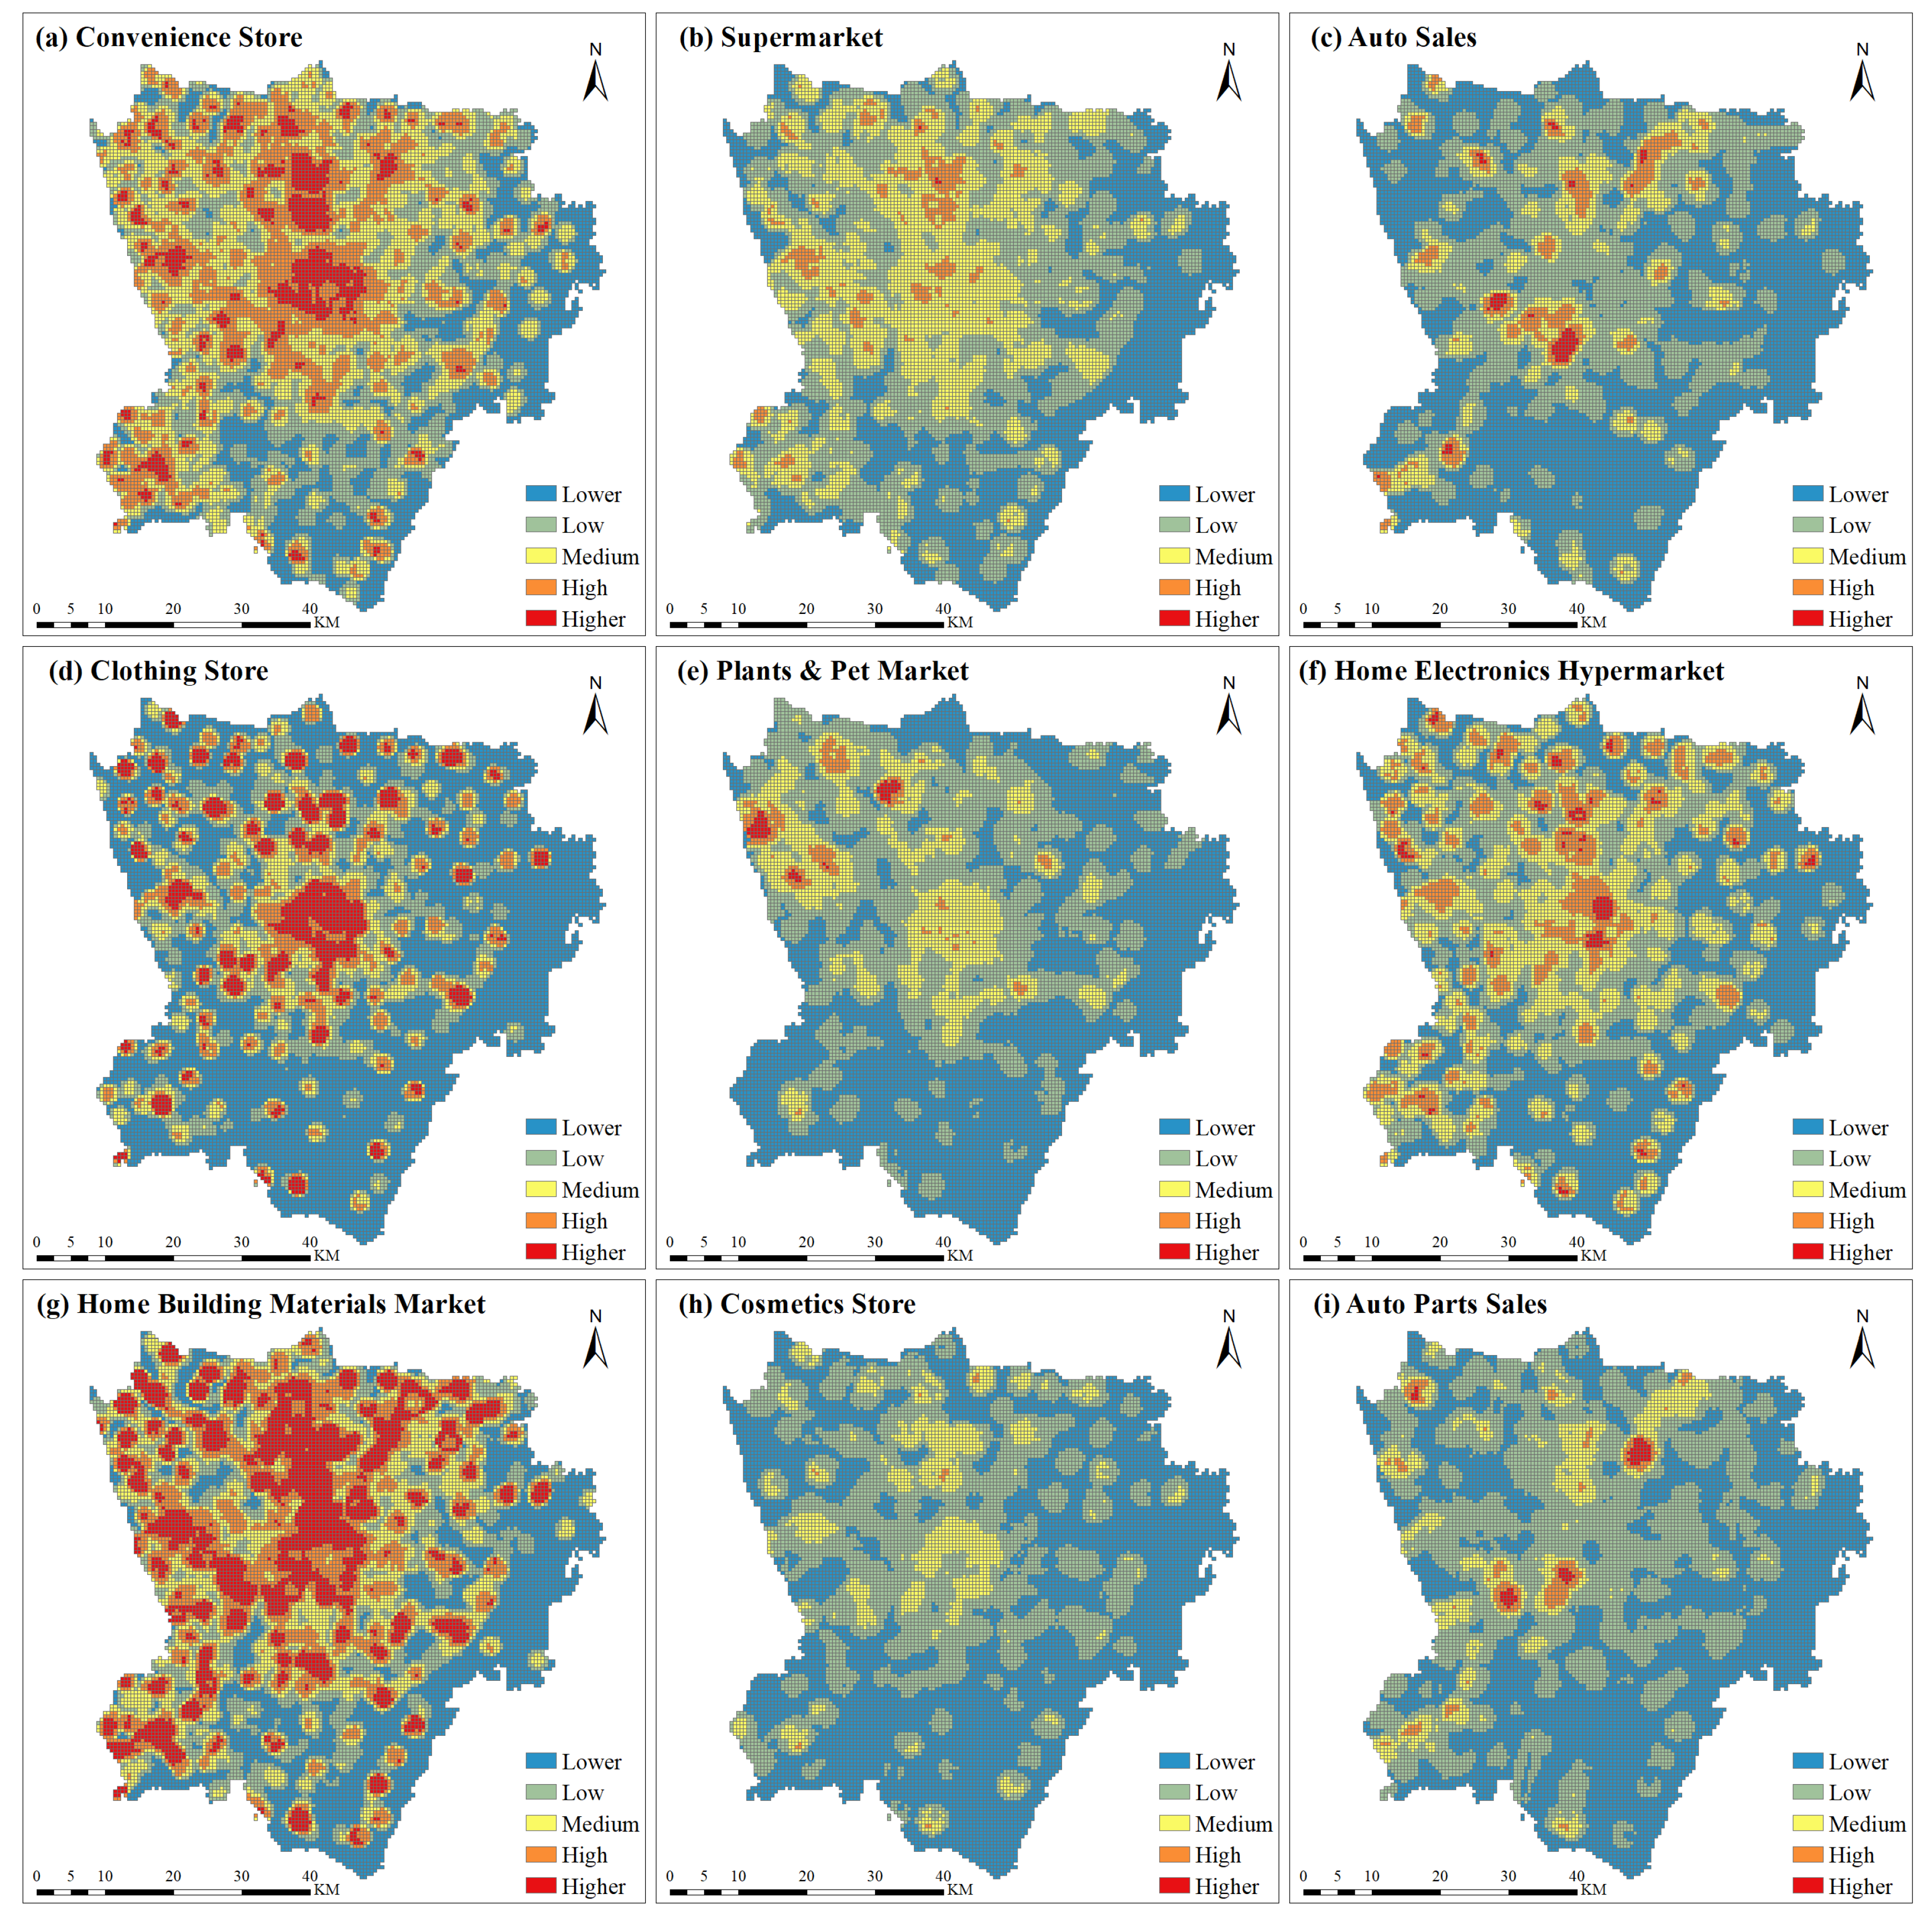
As shown in
Table 4, the top five retail categories in terms of the proportion of areas with medium and above coupling degrees are home building materials market, convenience store, franchise store, pharmacy and farmer's market, and the coupling degree of the top three categories is relatively close, all exceeding 55%, and there is a significant gap from the other categories. This indicates that these three types of retail businesses are better aligned with the needs of group activities compared to other categories, and fluctuations in the group activity level may also have a greater impact on the operations of these three types of retail businesses.
The top five retail categories in terms of the proportion of areas with medium and above coupling coordination degrees are home building materials market, franchise store, convenience store, pharmacy, and farmer's market. Although there have been slight changes in the rankings compared to the proportion of coupling, these five retail categories still remain in the top five. This indicates that retail business categories that better align with group activity demands will have more development opportunities. Furthermore, after market mechanisms, multiple stores within the same highly coupled and coordinated retail category still need to operate in a 'concentrated' manner geographically, which also demonstrates the close relationship between group activities and these retail businesses.
Commercial streets, shopping plaza and auto parts sales in the medium and above level coupling degree of the area accounted for less than 10% of the total area. Considering that retail places in commercial streets, shopping plaza, auto parts sales have a larger space than retail categories such as home building materials market, convenience store and franchise store to carry more commercial activity intensity in a single POI data, their low coupling degree may not mean that there is a mismatch, which is also a factor to be considered in future research using POI data. Commercial streets, shopping plaza in the medium and above level coupling coordination degree of the area accounted for close to 0% of the total area. Due to the business characteristics of these two retail categories, where the majority of group activities and transactions occur on days off, the representativeness of the collected data needs to be improved. Therefore, the low coupling coordination between these two categories cannot be interpreted as a low level of commercial development.
As shown in
Figure 9, the coupling distribution of the above-mentioned retail categories whose areas with medium and above horizontal coupling degree account for a large proportion of the total area is similar to that of Chengdu's downtown area. This indirectly indicates that the coupling degree development of Chengdu's downtown area is related to the coupling degree development of these retail industries. The distribution of retail categories whose regions with medium and above level coupling degrees account for a small proportion of the total region has its characteristics, which may be related to the narrow consumer groups targeted by some retail categories. If the demographic characteristics of a certain area do not match the user profile of one of these retail categories, it will inevitably result in a mismatch state, and this mismatch comes more from the operator's consideration of business efficiency.
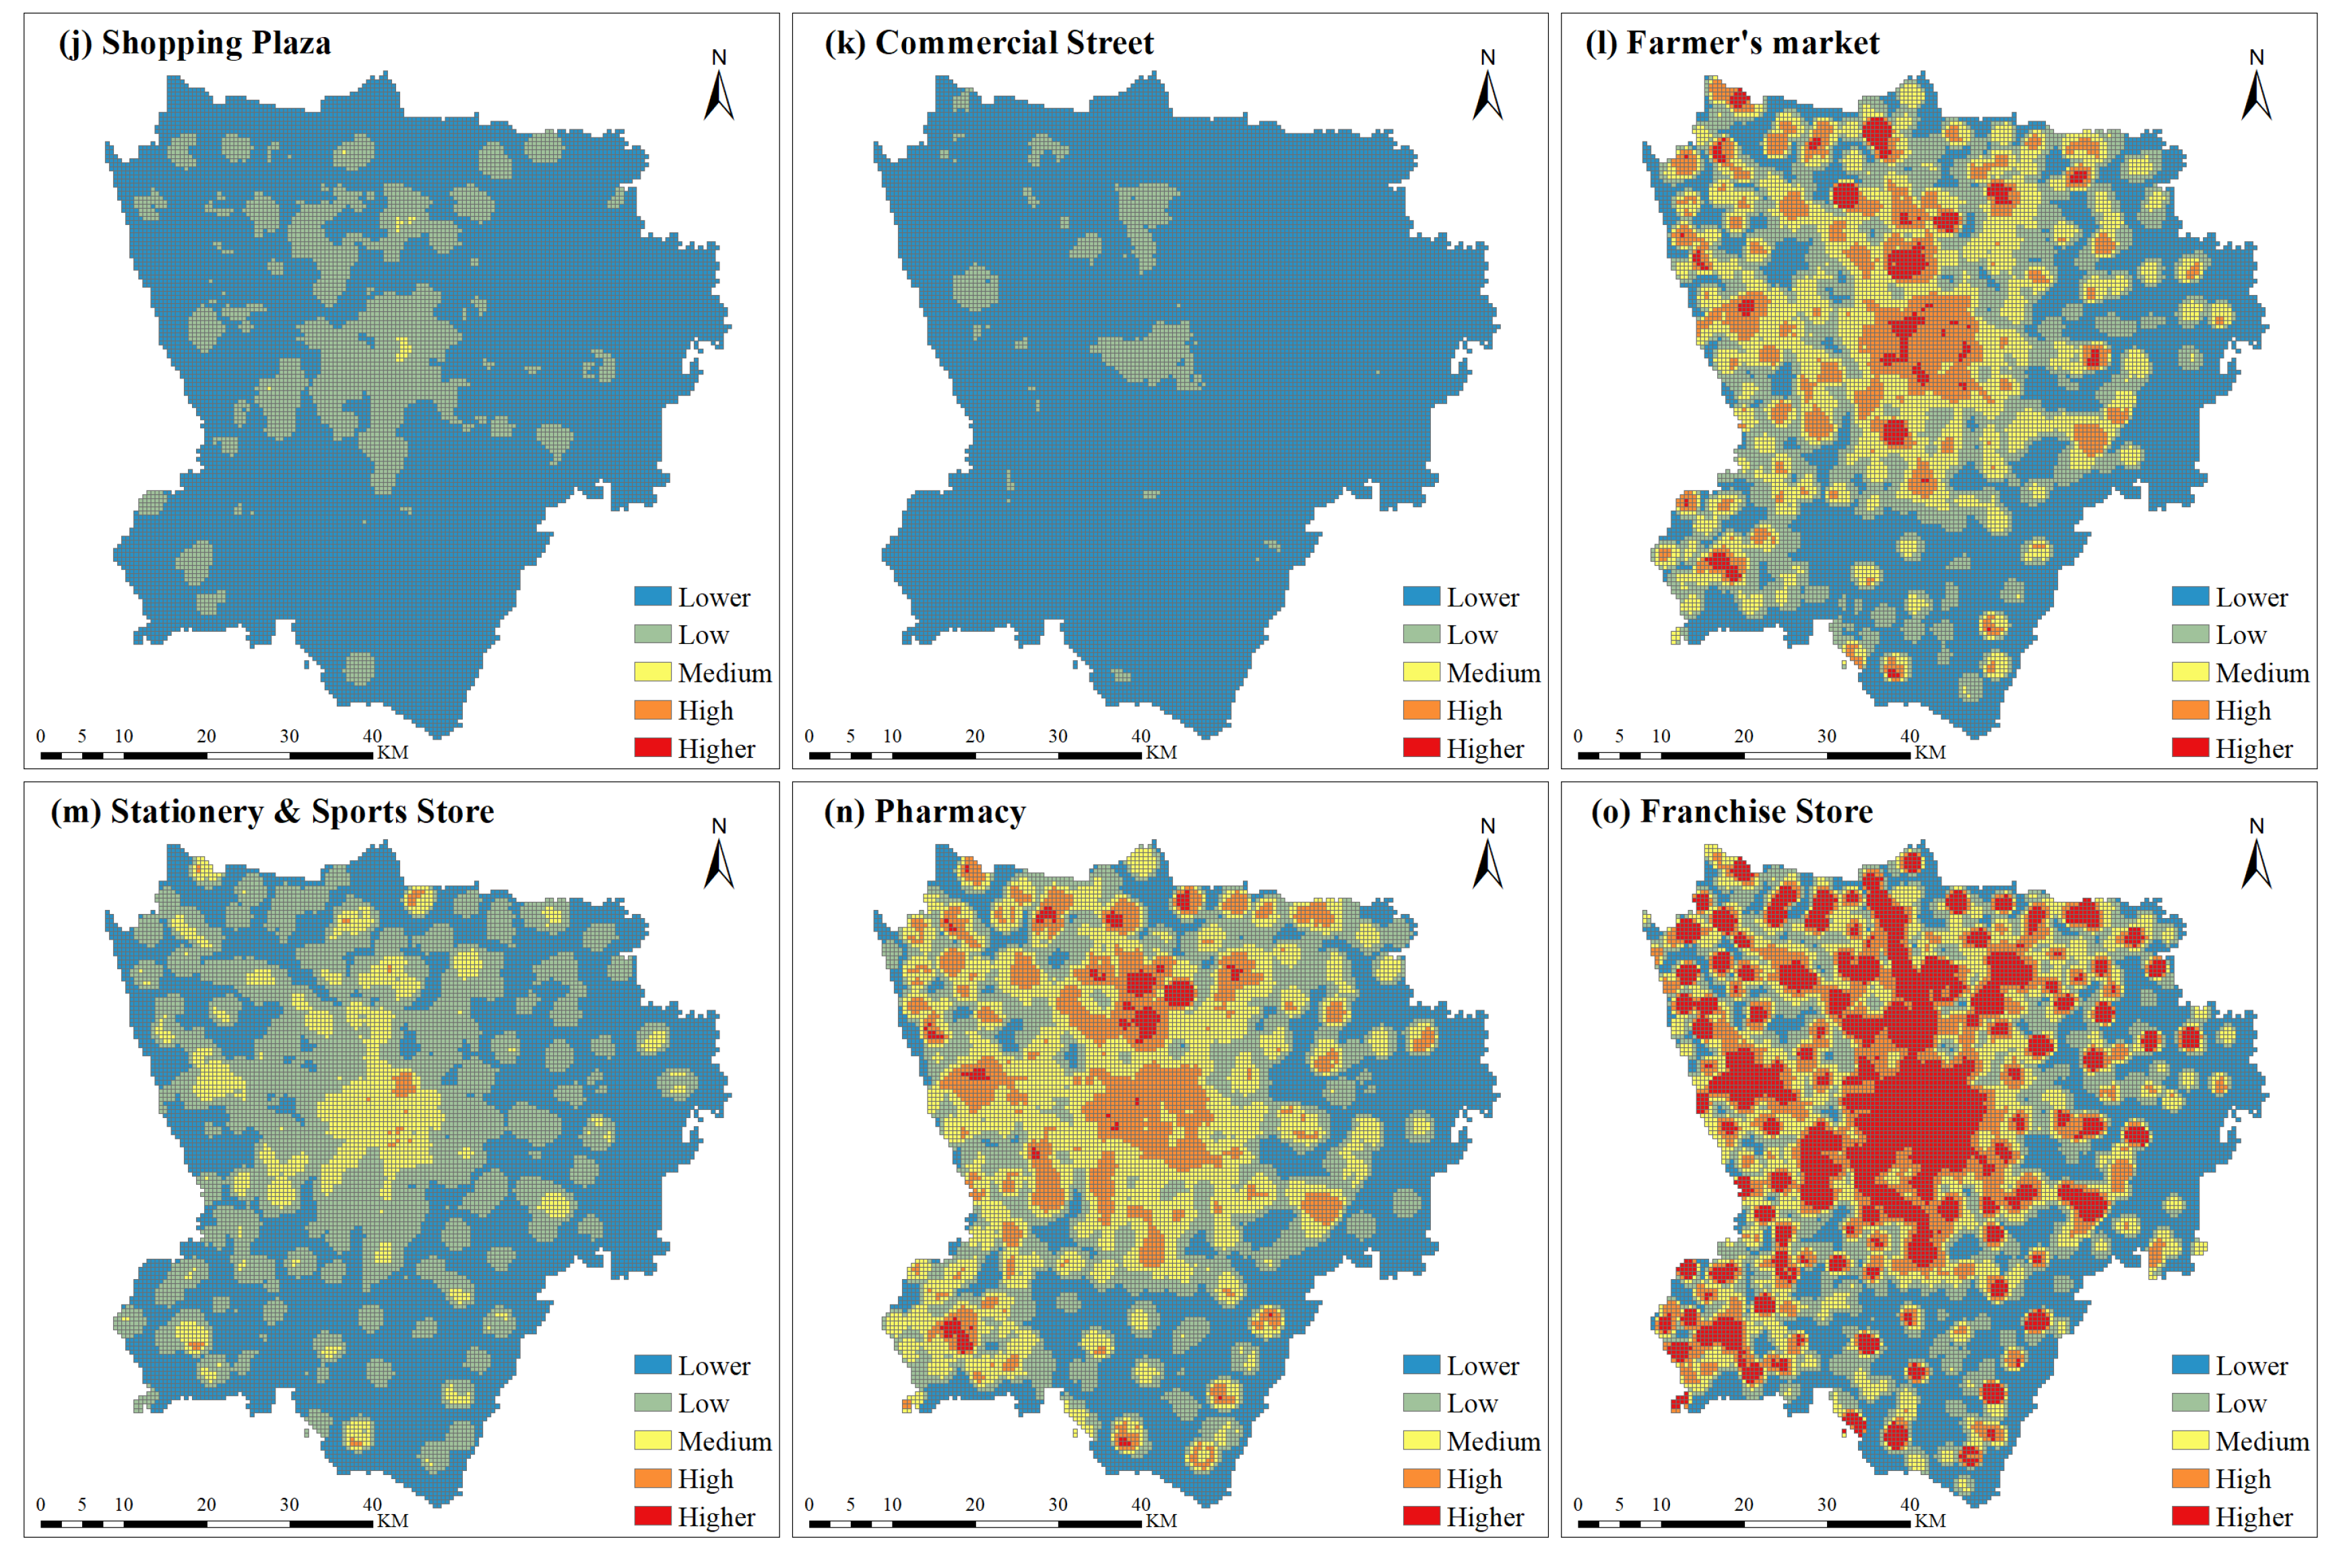
According to
Figure 10, the distribution of coupling coordination degree of all retail categories is basically as follows: the center has the highest level of coupling coordination degree, and the coupling coordination degree from the center to the outside gradually decreases, and some categories also form sub-centers with relatively high coupling coordination degree around them. In general, it is similar to the coupling degree distribution in Chengdu city center. However, the distribution of retail categories with a small proportion of the area at the medium and above levels of coupling coordination differs from the distribution of those with a small proportion of the area at the medium and above levels of coupling degree. In the coupling degree distribution, there was a big difference in the distribution trend among these categories. In the coupling coordination degree distribution, the distribution trend of these categories is similar, only the degree of development is different. This shows that the coupling coordination degree and coupling degree are more affected by the retail category, and the coupling coordination degree is more affected by the geographical location. The closer the city center is, the more policy concerns, social resources, and people flow it has, so that any retail category can get more development opportunities.
5. Conclusions
The activities of retail enterprises are not evenly distributed in spatial distribution and remain related to the dynamics of group activities. Taking the main urban area of Chengdu as the research area, this study uses POI and nighttime light remote sensing data to study the spatial pattern of urban retail enterprises and their coupling relationship with group activities. The main findings are listed as follows.
First, the spatial distribution of retail enterprises in the urban area of Chengdu presents the characteristics of multi-center agglomeration of "one piece, three belts". That is, the central urban areas of five administrative districts in the central urban area of the first circle are the core to extend to the northwest, northeast, and due south, and it shows the characteristics of polycentric aggregation outside the second circle. In terms of the degree of aggregation, the kernel density values of the five administrative regions in the central urban area are significantly higher than those in other regions.
Second, the spatial pattern of retail enterprises in the central urban area of Chengdu matches the group activities, but there are also areas with poor coupling of various types of retail formats. This kind of retail enterprise layout is multi-centered in space, similar to the pattern of large cities such as Shanghai and Beijing.
Finally, policy implications and suggestions are listed as follows:
First, retail enterprises should fully understand the spatial layout rules of the acceptance industry, adjust measures to local conditions, raise the enthusiasm of participating in the spatial layout planning of commercial enterprises, improve the pattern from bottom to top, fill the commercial gap, and enhance the coupling relationship.
Second, the decision-making department should reasonably use top-level design means such as infrastructure construction and relevant preferential policies to consciously guide the relocation of the business combination of urban business centers, optimize the layout from top to bottom, enrich the business types, and expand the coupling range.
Author Contributions
Conceptualization, L.J.; methodology, L.J.; software, L.J.; validation, T.Z.; formal analysis, B.W.; investigation, B.W.; resources, B.W.; data curation, B.W.; writing—original draft preparation, L.J.; writing—review and editing, T.Z.; visualization, B.W.; supervision, T.Z.; project administration, J.Z.; funding acquisition, J.Z.; writing—review and editing, C.W. All authors have read and agreed to the published version of the manuscript.
Funding
This research was funded by Joint Funds of the National Natural Science Foundation of China, grant number U23A2018.
Institutional Review Board Statement
Not applicable.
Informed Consent Statement
Not applicable.
Data Availability Statement
The original contributions presented in the study are included in the article/supplementary material, further inquiries can be directed to the corresponding author.
Conflicts of Interest
The authors declare no conflicts of interest.
References
- Mitchell, A.; Kirkup, M. Retail development and urban regeneration: A case study of castle vale. Int. J. Retail & Distrib. Manage. 2003, 31, 451–458. [Google Scholar]
- Zhang, H.; Liang, C.; Pan, Y. Spatial expansion of built-up areas in the beijing–tianjin–hebei urban agglomeration based on nighttime light data: 1992–2020. Int. J. Environ. Res. Public Health 2022, 19, 3760. [Google Scholar] [CrossRef] [PubMed]
- Xie, Y.; Weng, Q. Updating urban extents with nighttime light imagery by using an object-based thresholding method. Remote Sens. Environ. 2016, 187, 1–13. [Google Scholar] [CrossRef]
- Chen, Y.; Liu, X.; Li, X. Analyzing parcel-level relationships between urban land expansion and activity changes by integrating landsat and nighttime light data. Remote Sens. 2017, 9, 164. [Google Scholar] [CrossRef]
- Chai, C.; He, Y.; Yu, P.; Zheng, Y.; Chen, Z.; Fan, M.; Lin, Y. Spatiotemporal evolution characteristics of urbanization in the xiamen special economic zone based on nighttime-light data from 1992 to 2020. Land 2022, 11, 1264. [Google Scholar] [CrossRef]
- Ustaoglu, E.; Bovkır, R.; Aydınoglu, A.C. Spatial distribution of gdp based on integrated nps-viirs nighttime light and modis evi data: A case study of turkey. Environ. Dev. Sustain. 2021, 23, 10309–10343. [Google Scholar] [CrossRef]
- Wu, B.; Yu, B.; Yao, S.; Wu, Q.; Chen, Z.; Wu, J. A surface network based method for studying urban hierarchies by night time light remote sensing data. Int. J. Geogr. Inf. Sci. 2019, 33, 1377–1398. [Google Scholar] [CrossRef]
- Zheng, D.; Li, C. Research on spatial pattern and its industrial distribution of commercial space in mianyang based on poi data. J. Data Anal. Inf. Process. 2020, 8, 20. [Google Scholar] [CrossRef]
- Lu, C.; Pang, M.; Zhang, Y.; Li, H.; Lu, C.; Tang, X.; Cheng, W. Mapping urban spatial structure based on poi (point of interest) data: A case study of the central city of lanzhou, china. ISPRS Int. J. Geoinf. 2020, 9, 92. [Google Scholar] [CrossRef]
- Hu, Y.; Han, Y. Identification of urban functional areas based on poi data: A case study of the guangzhou economic and technological development zone. Sustainability 2019, 11, 1385. [Google Scholar] [CrossRef]
- Zhang, J.; Yuan, X.-D.; Lin, H. The extraction of urban built-up areas by integrating night-time light and poi data—a case study of kunming, china. IEEE Access 2021, 9, 22417–22429. [Google Scholar]
- Xue, B.; Xiao, X.; Li, J. Identification method and empirical study of urban industrial spatial relationship based on poi big data: A case of shenyang city, china. Geogr. Environ. Sustain. 2020, 1, 152–162. [Google Scholar] [CrossRef]
- Li, X.; Elvidge, C.; Zhou, Y.; Cao, C.; Warner, T. Remote sensing of night-time light. Int. J. Remote Sens. 2017, 38, 5855–5859. [Google Scholar] [CrossRef]
- Wei, J.; Zhong, Y.; Fan, J. Estimating the spatial heterogeneity and seasonal differences of the contribution of tourism industry activities to night light index by poi. Sustainability 2022, 14, 692. [Google Scholar] [CrossRef]
- Zhou, L.; Shi, Y.; Zheng, J. Business circle identification and spatiotemporal characteristics in the main urban area of yiwu city based on poi and night-time light data. Remote Sens. 2021, 13, 5153. [Google Scholar] [CrossRef]
- Zhou, Y.; He, X.; Zhu, Y. Identification and evaluation of the polycentric urban structure: An empirical analysis based on multi-source big data fusion. Remote Sens. 2022, 14, 2705. [Google Scholar] [CrossRef]
- Statistics, C.M.B.O.; Chengdu, N.S.O.I. Chengdu statistical yearbook 2022; China Statistics Press: 2023.
- Zheng, Y.; Shao, G.; Tang, L.; He, Y.; Wang, X.; Wang, Y.; Wang, H. Rapid assessment of a typhoon disaster based on npp-viirs dnb daily data: The case of an urban agglomeration along western taiwan straits, china. Remote Sens. 2019, 11, 1709. [Google Scholar] [CrossRef]
- Silverman, B.W. Density estimation for statistics and data analysis; Routledge: 2018.
|
Disclaimer/Publisher’s Note: The statements, opinions and data contained in all publications are solely those of the individual author(s) and contributor(s) and not of MDPI and/or the editor(s). MDPI and/or the editor(s) disclaim responsibility for any injury to people or property resulting from any ideas, methods, instructions or products referred to in the content. |
© 2025 by the authors. Licensee MDPI, Basel, Switzerland. This article is an open access article distributed under the terms and conditions of the Creative Commons Attribution (CC BY) license (http://creativecommons.org/licenses/by/4.0/).