Submitted:
01 July 2024
Posted:
03 July 2024
You are already at the latest version
Abstract
Urbanization is a dynamic process. At different stages of urbanization, polices of managing car-bon emissions should be adjusted. In this paper, two types of nighttime light data and statistical data of 68 cities in China from 2002 to 2021 are used to establish an urban development evalua-tion system comprising population, economy, construction, and society subsystems. Then, cities were categorized into expanding, contracting, and stable types to understand the uncertainty of urbanization's impact on carbon emissions. The main conclusions are as follows: (1) Integrated nighttime light data is used to extract built-up area boundaries, achieving an overall accuracy ranging from 68.75% to 98.4%, with kappa coefficients ranging between 0.60 and 0.94. (2) Ex-panding cities were concentrated in the eastern coastal regions, while contracting cities were mainly located in inland cities with traditional industries. Urban agglomerations in the Beijing-Tianjin-Hebei region, Yangtze River Delta region, and Chengdu-Chongqing metropolitan demonstrate synchronized characteristic of urbanization development. (3)Economy and con-struction have a greater impact on carbon emissions than population and society. For expanding cities, the focus of carbon emission governance should prioritize rational land use planning. Conversely, for contracting cities, emphasis should be placed on adjusting economic structures.
Keywords:
Spatial-temporal analysis of urbanization
; Nighttime light data
; Carbon emissions
; City classi-fication
1. Introduction
The Urbanization is a socio-economic process. It is a global issue which is related to human development. Nearly 4% of the global land has been urbanized, with over 50% of the population live in urban areas. The UN stated in its 2019 report that 101 countries are expected to have more than 80 per cent of their population residing in urban areas by 2050.
It is crucial to study the relationship between carbon emissions and urbanization development of China. On the one hand, the government needs to coordinate the relationship between urbanization process and carbon emissions. Since the 1990s, the proportion of the national urban population increased by 30.94%. Rapid urbanization is related to energy consumption and environmental degradation, while also affecting human health by changing the lifestyle of residents [1,2]. The report from the C40 Cities Climate Leadership Group states that urban areas generate more than four-fifths of global greenhouse gas emissions. The total emissions from urban areas are increasing at an annual rate of 1.8% [3], China has become one of the leading countries in global carbon emissions with the development of population and economic [4]. In China, especially in the rapidly developing cities, the problem of carbon emissions is notably pronounced [5,6]. In response to the global climate change crisis, China has announced a reduction of carbon intensity by over 60% from 2005 levels by 2030 [7].
On the other hand, the mechanisms of the impact of urbanization on carbon emissions remain unclear at the theoretical level. Currently, three predominant conclusions have been drawn regarding the relationship between carbon emissions and urbanization: (1) The relationship between carbon emissions and urbanization is positively correlated [8,9,10], and this correlation may be either unidirectional or bidirectional [11,12]. (2) The relationship between carbon emissions and urbanization is negatively correlated [13]. (3) The relationship between carbon emissions and urbanization exhibits an inverted U-shaped curve [14], and this relationship changes with the progress of urbanization [15]. Therefore, in order to study the relationship between carbon emissions and urbanization, it is necessary to understand the concept of urbanization from multiple dimensions.
Urbanization is related to population migration, changes in land use, and changes in production methods, therefore, its impact on carbon emissions is multifaceted [16,17]. The alteration in population structure and the increase in population density in urban areas are direct influencing factors for carbon emissions [18,19]. The rise in consumption levels in urban areas, coupled with an increased demand for energy, contributes to an increase in carbon emissions [20,21]. In the latter phases of industrialization, the refinement of industrial structures and technological advancements serves as instrumental factors in managing the escalation of carbon emissions [21,22]. The transformation of economic structure has enabled the service industry to drive carbon emissions more than other industries [23]. Additionally, the expansion of urban construction land can influence carbon emissions by altering aspects such as urban transportation and green spaces [24,25,26]. Most studies often focus only on individual factors of urbanization on carbon emissions, thus neglecting the role played by multiple aspects of urbanization [27,28].
Conventional data is subject to long update cycles and other limitations, making it difficult to examine the spatiotemporal characteristics of urbanization over long time series. Compared with traditional methods, remote sensing technology has timeliness and wide spatial coverage. As a remote sensing data source that captures and records faint light radiation from the Earth’s surface at night in real-time, nighttime light data (NTL) can reflect human activities accurately to some extent [29]. NTL observations have proven to be effective in tracking light sources generated by human activities. This capability aids in assessing the spatiotemporal changes in socio-economic activities and urbanization processes [30,31]. Numerous studies have used NTL to reveal the external features of cities, such as extracting city boundaries [32,33], detecting city centers and their spatial structures [34]. At the same time, NTL have the advantages of large scale and long time series, and are widely used to display the spatiotemporal dynamic changes of cities or urban agglomerations [35,36]. In addition, due to the inconsistent energy statistics system in China, researchers use parameters obtained from remote sensing inversion to model and obtain carbon emission estimation results at the urban scale. In recent years, NTL has been proven to have high feasibility and effectiveness in estimating carbon emissions [37,38,39].
Based on existing research, in order to deeply understand the relationship between the urbanization process and carbon emissions, and provide suggestions for the government to deal with the problem of carbon emission, this article presents a methodology for establishing an evaluation system for urbanization development by integrating remote sensing data and statistical data, and explores the key factors affecting carbon emissions under different urbanization development models.
Section 2 provides an overview of the data sources, introduces the construction of the urban development evaluation system, and methods of analyzing influencing factors of carbon emissions. Section3 presents the evaluation results of 68 cities and analyzes the factors influencing carbon emissions. Section4 discusses the results and summarizes the limitations of the study along with suggestions for future work. Section5 presents the main conclusions of the experiment.
2. Materials and Methods
This experiment is divided into four parts, including data preprocessing, establishment of urbanization development evaluation system, urban classification, and analysis of factors affecting carbon emissions. The flowchart is shown as the Figure 1.
2.1. Study Area
In order to promote sustainable development and fulfill international environmental responsibilities, China established three batches of urban low-carbon pilot projects including 81 cities — from 2010 to 2020 to undertake low-carbon initiatives. As shown in Figure 2, these pilot cities have different geographical locations, scales, and functions. The data in some cities is incomplete, so this paper selects 68 of them as the focus of research (Appendix A, Table A1).
2.2. Data Sources
The carbon emission data at the city level used in this study is from the China Emission Accounts and Datasets (CEADs). CEADs has compiled carbon accounting inventories covering China and other developing countries, with the aim of establishing a cross-validated multi-scale carbon emissions accounting methodology, and creating a regionally and locally unified, detailed carbon accounting data platform [40,41,42].
The urban statistical data and the energy data are sourced from the China Urban Statistical Yearbook (2003-2022) and the China Energy Statistical Yearbook (2003-2022). The nighttime light data is sourced from the Geophysical Data Center of National Oceanic and Atmospheric Administration (NOAA).
The MODIS land cover type product MCD12Q1 is selected for the accuracy evaluation of built-up area extraction. MCD12Q1 is a MODIS land cover type product that provides annual global distribution of land cover types with a resolution of 500 meters.
The carbon emission data can be obtained from https://www.ceads.net.cn/ . The urban statistical data can be obtained from http://www.stats.gov.cn/ . The nighttime light data can be obtained from https://eogdata.mines.edu/products/vnl/ . MODIS land cover type product can be obtained from https://ladsweb.modaps.eosdis.nasa.gov .
2.3. Urban Development Evaluation System
Different dimensions of urbanization have varying influences on the carbon of urban ecosystems [43]. Currently, most scholars believe that urbanization development can be subdivided into population, economic, social, land and ecological urbanization [44]. Some scholars have also described the complexity of urbanization from the perspectives of population, building structure, and greenness [45]. In order to analyze the process of urbanization from multiple dimensions, we need to consider the different impacts of culture and nature on urbanization development based on existing research.
This paper establishes an evaluation system for urbanization development composed of population subsystem, economic subsystem, construction subsystem, and society subsystem. The primary indicator of the evaluation system is the overall score of urban development. Population, economy, urban construction, and society subsystems constitute the secondary indicators of the evaluation system. Each subsystem contains 2-4 tertiary indicators. Figure 3 shows the composition of the urbanization development evaluation system The following is an explanation of the selection of indicators.
For population subsystem, population size and employment numbers are selected as two indicators. The change in urban population is an intuitive standard for measuring the development of population systems. In addition, the number of employed people in cities is also related to the development of the city.
For economic subsystem, this paper chooses GDP to represent the scale of economic, and the proportion of the tertiary industry to describe the urban economic structure. In addition, the retail sales of goods can reflect the purchasing power of urban residents and is an important manifestation of urban economic vitality. The government investment reflect the support from government for urban development.
For construction subsystem, built-up area and perimeter are selected. Additionally, this paper also calculate the fractal dimension and compactness. The built-up area concentrates most of the city’s population, has relatively complete infrastructure and public services. The spatial structure of a city, including its composition, shape, and compactness, is an external manifestation of urban development [46]. Compactness index (CI) is usually used to reflect the shape characteristics of a region. Fractal dimension (D) can reflect the tortuosity and complexity of the shape. Since the accessibility of urban transportation can also reflect the development status of the city, road density is also selected as an indicator when constructing the urban construction subsystem.
The calculation for fractal dimension and compactness index is as follows:
represents the perimeter of the built-up area, and represents the area of the built-up area
For the society subsystem, this article chooses virescence area as the environmental evaluation factor and nighttime light intensity as the human activity evaluation factor. This is because urban development needs to be built on the basis of social sustainability, which requires human interaction and sustainable development of the environment.
The multi-index evaluation method is used to establish an urban development evaluation system, which combines various indicators by measuring the impact of each one on the city, thereby forming an evaluation system.
Firstly, this paper employs normalization of evaluation indicators to eliminate the influence of different units and dimensions among various indicators. The standardized data results lie within the range of [0,1].
It is important to determine the weight of evaluation indicators. The most common methods for determining the weights of indicators are subjective weighting and objective weighting. This paper uses the information entropy method, which belongs to the objective weighting method, to determine the weight of the evaluation indicators for the universality of the evaluation system.
After establishing the evaluation system, a 5-year cycle is adopted to calculate the rate of change in urban scores. Based on this rate of change, cities are classified into three categories: contracting city (), stable city , expanding city.
The process of establishing the urbanization development evaluation system is shown in Table 1.
2.4. Using Nighttime Light Images to Extract Built-up Areas
In order to obtain the perimeter of the built-up area in a long time series to construct the construction subsystem, this paper uses integrated nighttime light data to extract the boundaries of urban built-up areas.
Currently, there are two types of night light data widely used.
DMSP/OLS data are provided by NOAA. There are 34 images from 1992 to 2013. The spatial resolution of the image is about 1 km, and the gray level of the data is 0-63.
Because different sensors on the DMSP satellite have varying radiation performance and detection capabilities, there are some limitations in the DMSP/OLS data. So the first step is preprocessing the DMSP/OLS data, as shown in Figure 4.
Firstly, the imagery is extracted using Chinese vector data as a boundary. The extracted image is then converted to the Albers projection and resampled to a resolution of 1 km.
As the data is sourced from multiple satellites, it’s necessary to minimize differences among the data through mutual calibration. Generally, Hegang City in Heilongjiang is used as the reference area, and the F162006 image is used as the reference image. This is done to establish correspondences between the other 33 images and the reference image. The mutually corrected images still have discontinuity problems, so the images need to be further corrected for continuity. In a long time series of DMSP/OLS data, bright pixel values in the image from the previous year may become non-bright values or exhibit different DN values at the same location in the image from the subsequent year. To address this unusual fluctuation, it is necessary to conduct interannual correction on the pixels after continuity correction.
The National Polar-orbiting Partnership (NPP) satellite system, which became operational in 2011, was jointly developed by NASA, NOAA, and the U.S. Air Force. The Visible Infrared Imaging Radiometer Suite (VIIRS) is an essential sensor carried on the NPP satellite. VIIRS data has higher spatial resolution than DMSP/OLS data. The paper calculates the average values of data for the periods of January to March and September to December for each year from 2013 to 2021, synthesizes the annual data, and resamples the image to 1km for subsequent research.
NPP-VIIRS images contain a significant amount of faint light, and unlike DMSP/OLS data, there is no saturation effect in NPP-VIIRS data, with significant fluctuations in DN values. In order to make the NPP-VIIRS data and the DMSP/OLS data comparable, the noise and outliers of the NPP-VIIRS data need to be eliminated. Current research mostly uses 0.3 as the threshold, and assigns pixels with a DN value less than 0.3 μW/(cm2ꞏsr) in the image to 0, effectively eliminating noise [47]. As for the removal of outliers, it is usually assumed that the DN values for other cities will not exceed those of Beijing, Shanghai, Guangzhou, and Shenzhen [48]. Therefore, the maximum pixel values for these four cities in the corresponding years are recorded, and this maximum value is used as the threshold. Pixels exceeding this threshold are assigned the threshold value.
To obtain a long-term sequence of nighttime light images, NPP/VIIRS data and DMSP/OLS data need to be integrated. DMSP/OLS and NPP/VIIRS both released images for 2013. Therefore, a function relationship between the DN values of the two types of images for 2013 is established. By fitting the optimal curve, the paper explores the correlation between the two datasets, facilitating the integration of NPP/VIIRS and DMSP/OLS data.
Using the DN value range of 0-63 from DMSP/OLS data as a mask (excluding pixel values of 1 and 2), the pixel values at corresponding positions are extracted from NPP/VIIRS data. These values undergo a logarithmic transformation, and the average is calculated. Different functions are then applied for fitting. The results show that the power function provides the best fit.

Table 3.
Fitting results of DMSP/OLS data and NPP/VIIRS data.
| Fit method | Formula | Meaning | R-squared(R2) |
|---|---|---|---|
| Exponential function | is the DN value of DMSP/OLS images. is the corresponding DN value of NPP/VIIRS images | 0.8200 | |
| Linear function | 0.9830 | ||
| Logarithmic function | 0.7510 | ||
| Power function | 0.9836 |
This paper uses mutation detection method to extract built-up areas. Real urban areas should maintain the integrity of their geometric shapes. The larger the light value, the greater the probability of belonging to an urban area. As the segmentation threshold increases, the polygon patches representing urban built-up areas gradually get smaller along the edges. When the segmentation threshold reaches a point, the polygon patches no longer shrink along the edges. Instead, they break and split from the inside into many smaller polygon patches, causing a sudden increase in the perimeter of the polygon representing the urban built-up area. This point is considered the threshold for extracting the urban built-up area [49]. The extracted urban built-up area is compared with the MODIS land cover type product MCD12Q1. The confusion matrix and the Kappa coefficient are used to evaluate the extraction effect. After obtaining the perimeter and area of the built-up area, the fractal dimension and compactness index can be further calculated.
2.5. Influence Factor of CO2
The process of urban carbon emissions is complex and influenced by various factors. As for factors influencing carbon emissions,existing studies commonly select indicators such as population size, economic development, urban infrastructure, residential energy demand, urban transportation and so on [50,51].
Carbon emissions of pilot cities are taken as the dependent variable. The independent variables are the evaluation scores of population, economy, construction, and society subsystems. The Extreme Gradient Boosting(XGBoost) model is used in this experiment to investigate the impact of selected factors on carbon emissions.
XGBoost is an ensemble learning algorithm based on decision trees. In the recent years, it has a wide range of applications in the field of machine learning. It can quickly train and predict large-scale data sets, and has strong robustness and universality.
It uses the following formula for regression trees. represents the regression tree function. is the model’s predicted value. represents the number of decision trees. represents theth sub-model. is theth input sample. represents the space of regression trees. represents the score of leaf node .
Based on the predicted value of the above regression tree, the objective function of the model can be obtained. represents the total amount of data of the th regression tree imported. represents all regression trees established. represents the loss function of the objective function.
represents the regularization term of the objective function, its specific definition is as follows. represents the number of leaf nodes in the regression tree, represents the score of the leaf nodes of the regression tree. represent the regularization penalty coefficients.
The objective function is as follows:
In order to optimize the results and improve the prediction accuracy of the model, a second-order Taylor expansion is performed on the objective function of t predictions to approximate the original objective. After removing the constant terms, the formula is as follows. represents the first gradient of the sample predicted value, and represents the second gradient of the sample predicted value.
Next, defining as the set of samples in each leaf node, the objective function can be expressed as follows:
When the structure of the tree is fixed, the optimal value of the loss function during iterations can be computed.
Bringing into the objective function to obtain the optimal value of the objective function under the current tree structure.
To enhance the interpretability of model predictions, this paper uses the Shapley Additive Explanation (SHAP) algorithm to analyze and interpret the model. The SHAP algorithm is generally used to calculate the impact of features on the predictive model results, measuring the contribution of each feature to the model prediction by calculating SHAP values. It not only provides global explanations for machine learning models but also offers local explanations by computing SHAP values for each sample feature.
The model’s baseline score is , the sample is denoted as , the feature of the sample is, the contribution of the feature’s boundary is , the weight of the edge is and the model’s prediction for this sample is , then the SHAP value for the th feature of the th sample is given by the following equation:
At the same time, SHAP values must satisfy the following conditions:
3. Results
3.1. Extraction of Built-up Areas
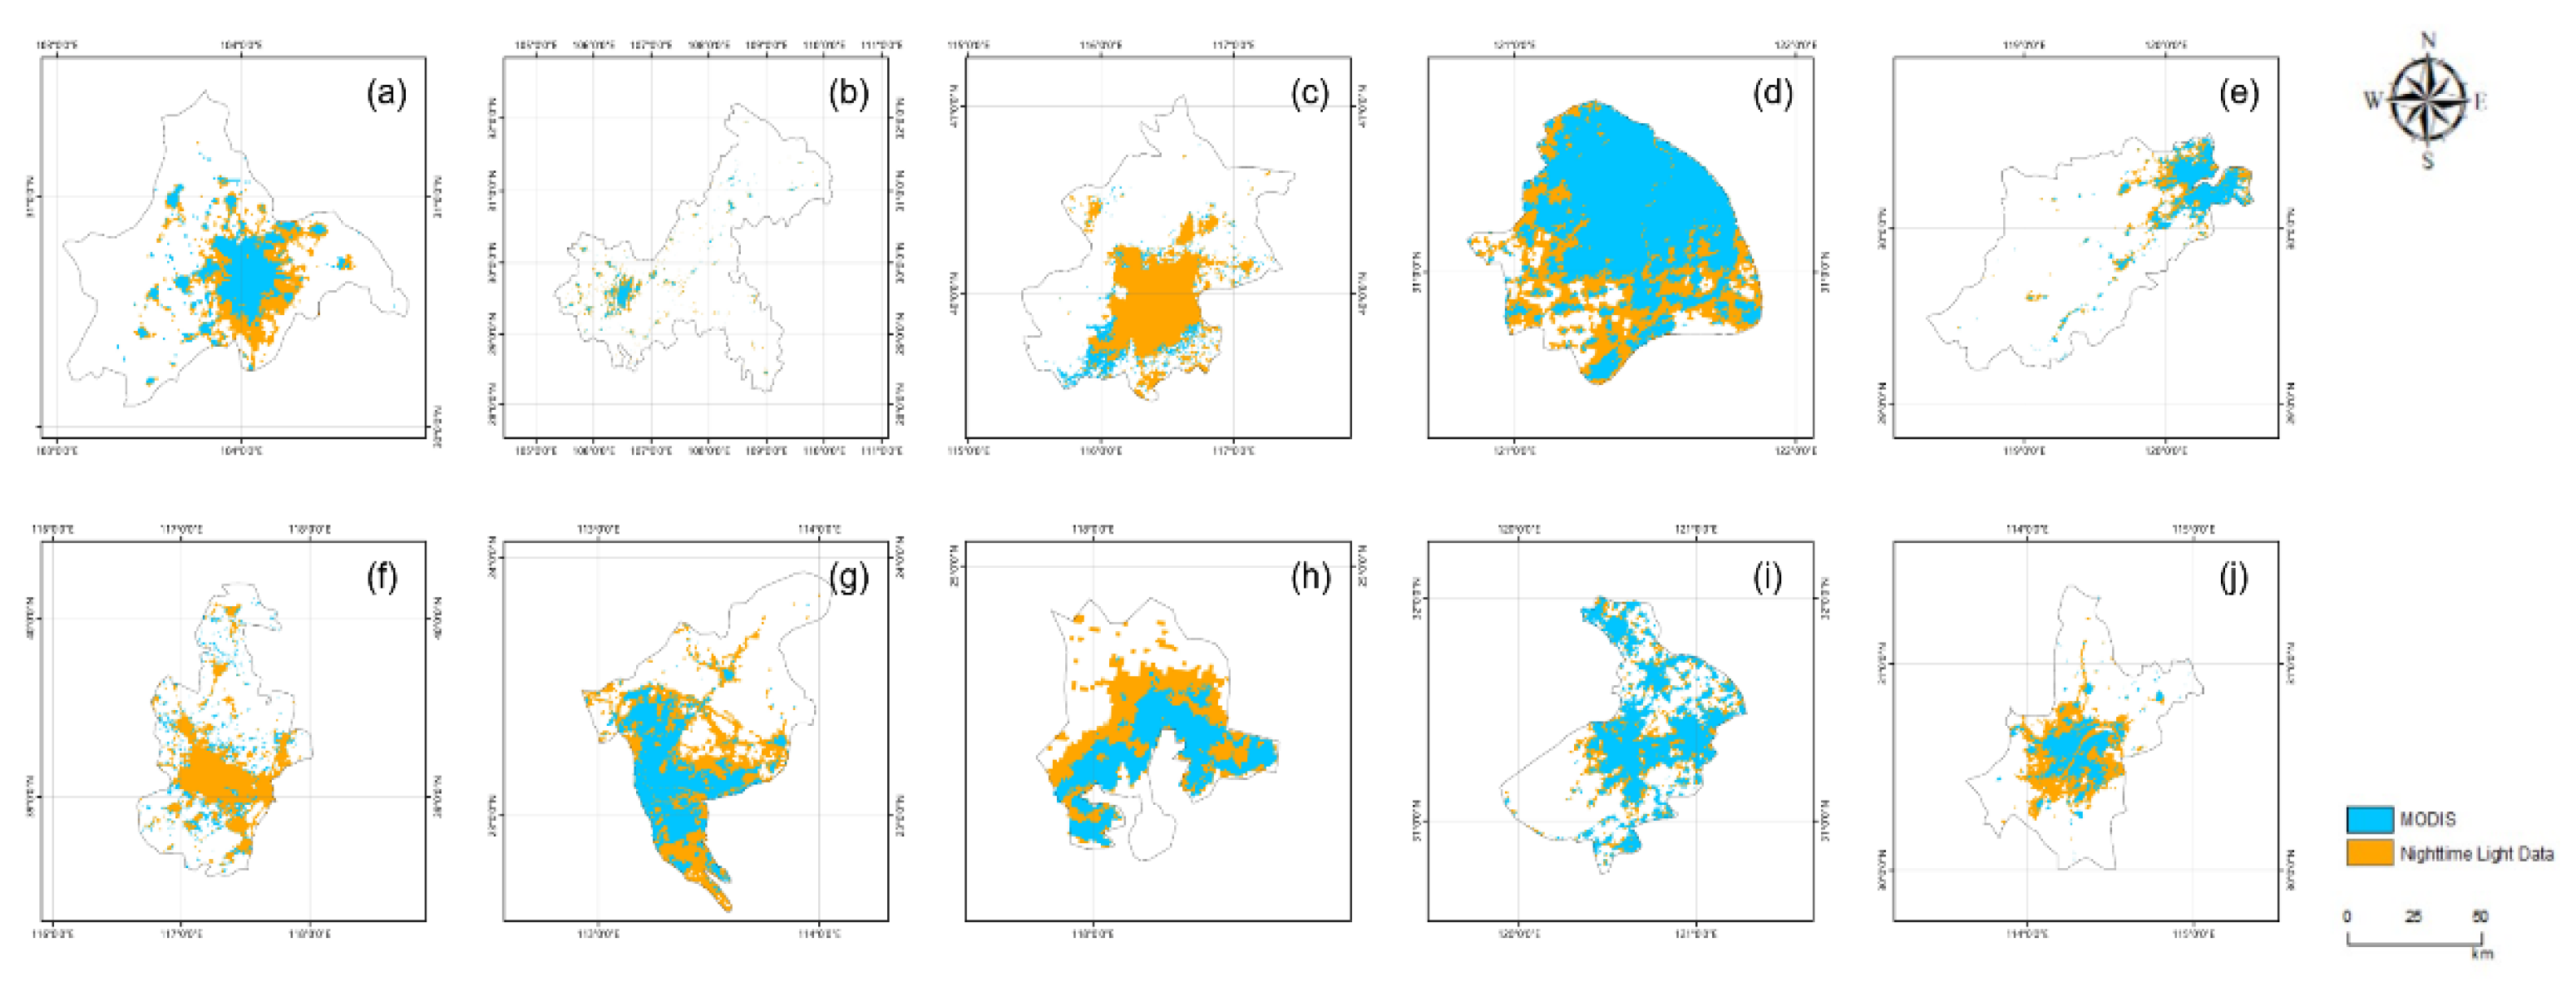
After extracting the boundaries of built-up areas, this paper selects ten cities including Chengdu and Chongqing as samples, and conduct accuracy assessment. The overall accuracy of urban area extraction ranges from a maximum of 98.40% to a minimum of 72.46%. The Kappa coefficient ranges from a maximum of 0.94 to a minimum of 0.61, with most Kappa coefficients above 0.7(Table 4). Therefore, it can be concluded that the extraction results using integrated nighttime light images meets the experimental requirements.
Figure 5.
Extraction results of urban areas(2010).
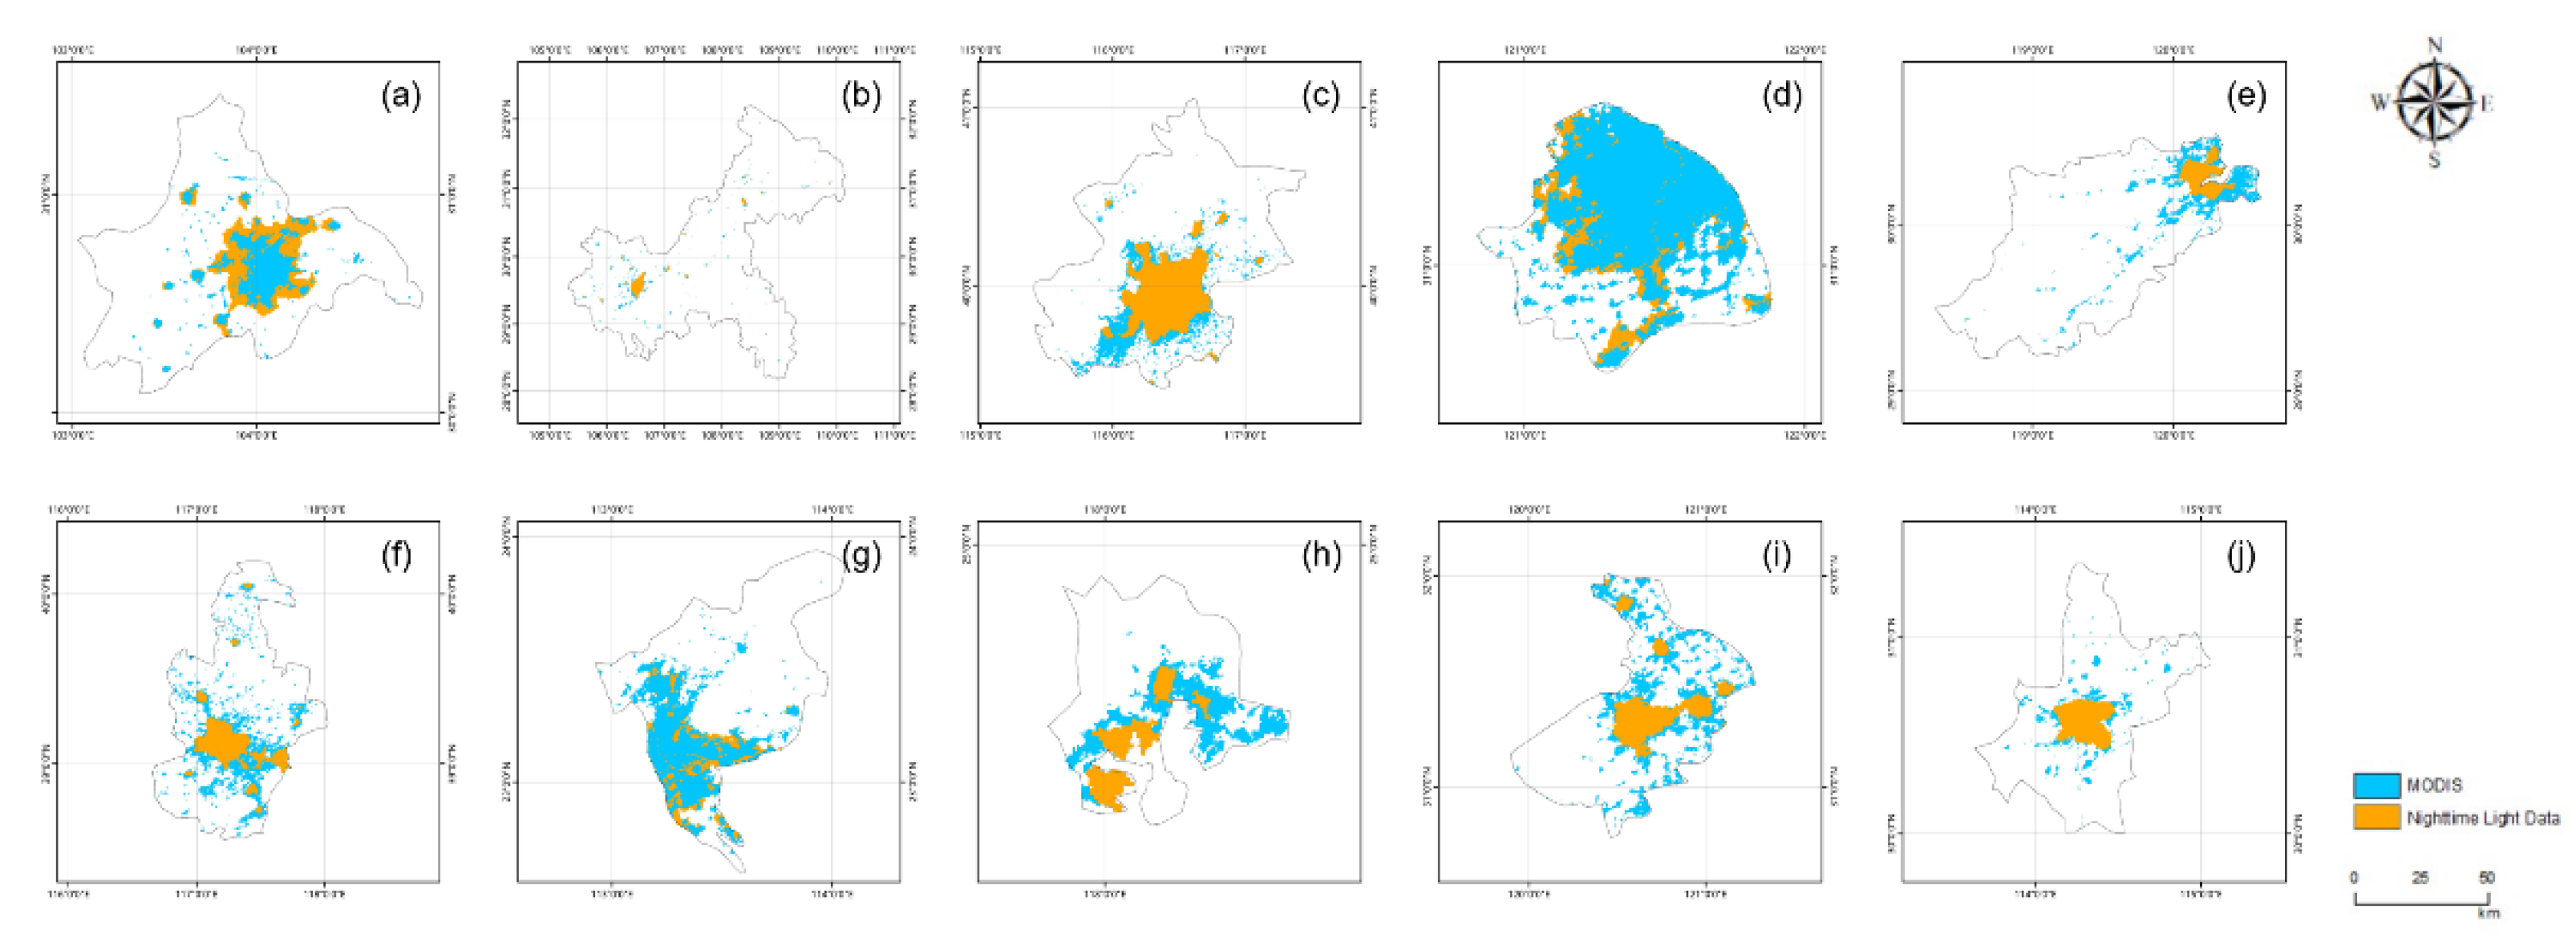
Figure 6.
Extraction results of urban areas(2020).
3.2. Urban Classification
Firstly, this article uses Pearson correlation coefficients to measure the degree of correlation between 13 indicators and carbon emissions, obtains a correlation coefficient matrix as Figure 7. Overall, there is a high correlation between various indicators and carbon emissions. Therefore, when using the urban development evaluation system constructed by these 13 indicators to analyze the factors affecting carbon emissions, the results are reliable.
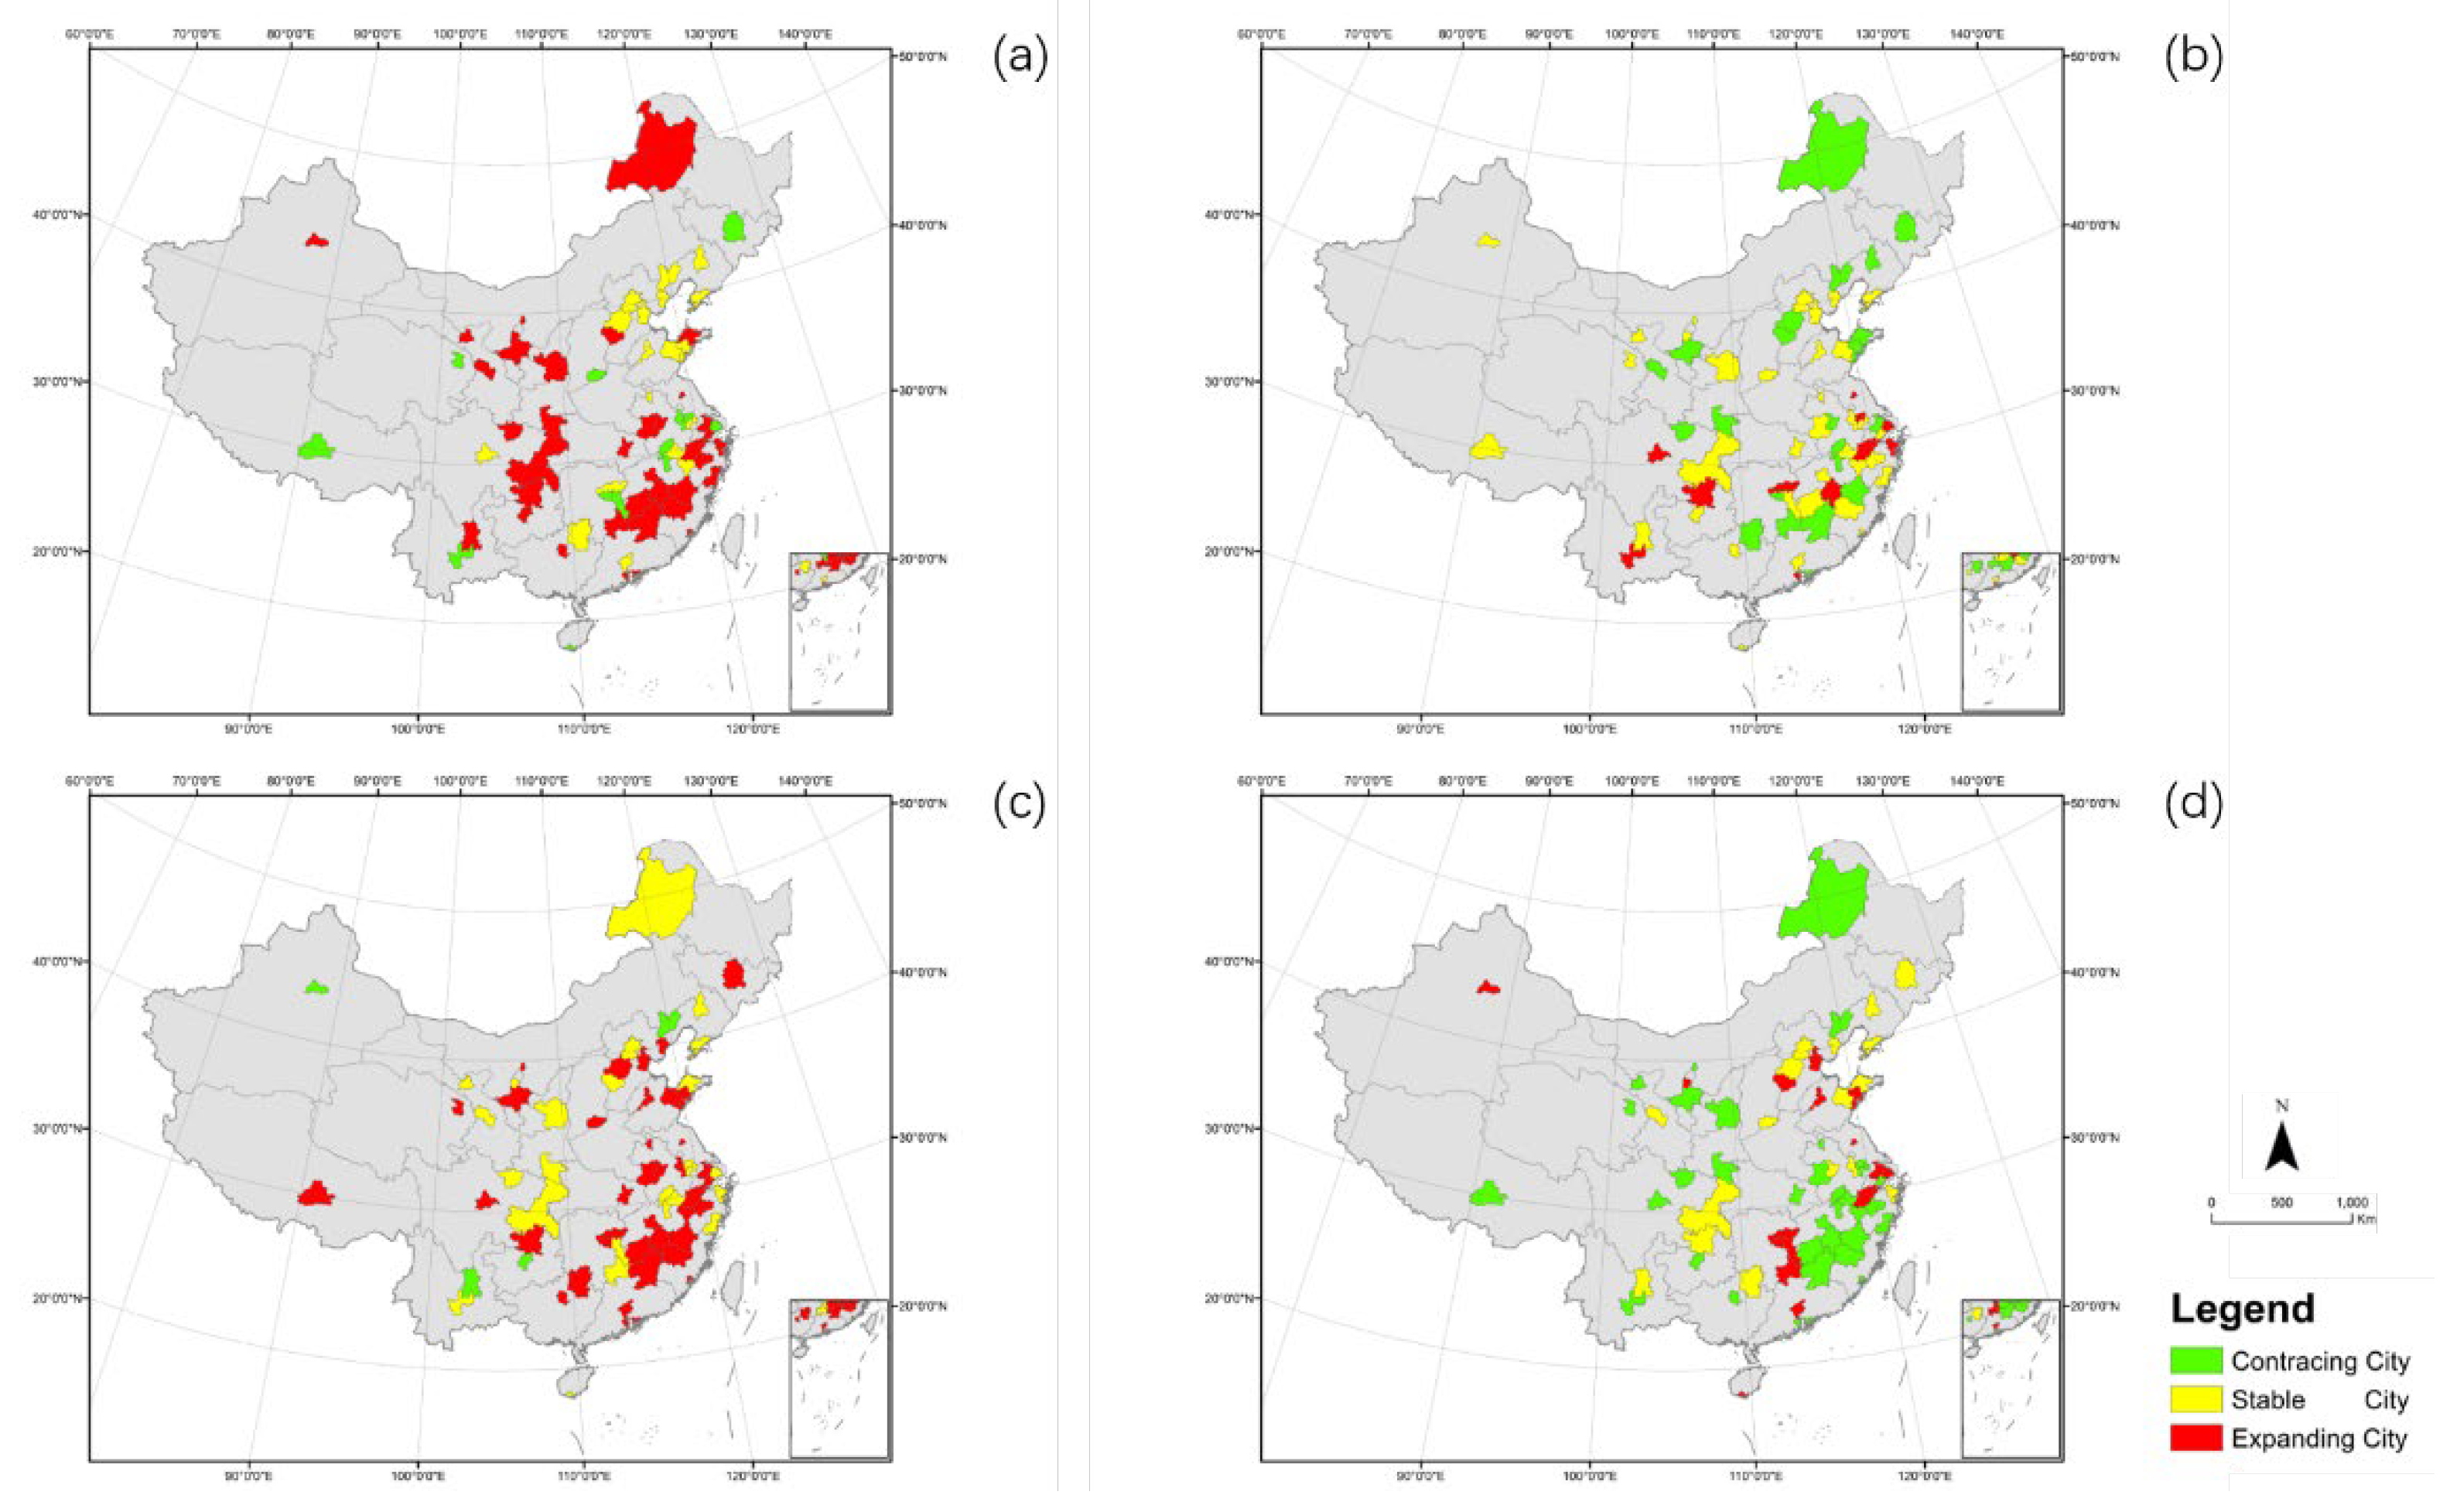
According to the urban development evaluation system established, with a time interval of 5 years, the paper calculate the subsystem scores and overall development scores for 68 cities, and categorize them. The following will provide a detailed analysis of the classification results.
Table 5 shows the number of cities of each type in four periods. In the first period (2002-2006), the development of 20 cities was stable. And in the fourth stage (2018-2021), it increased to 38. The number of expanding cities initially increases and then decreases, while it is opposite for contracting cities. In general, the development of urbanization will experience a period of fluctuations, and gradually reach a stable state.
From a geographical perspective, the development of cities located in the southeast region are synchronous and exhibit a clustered distribution pattern. From the Figure 8, it can be seen that cities with significant development fluctuations have a scattered distribution, such as super large cities like Beijing and Chongqing. Over the past 20 years, the development of heavy industrial cities, which are located in the northeast and northwest regions, has been in a stable state.
In the meantime, we classified cities based on the scores of each subsystem and counted their numbers(Table 6).
- From the Figure 9, it can be seen that the changes in the population subsystem have phased characteristics. In the first period (2002-2006), more than half of the population subsystems were expanding. In the second period (2007-2011) and the third period (2012-2016), the development status of the population subsystem was mainly stable. In the fourth period (2017-2021), the population subsystem experienced contraction in the most of cities. Cities with expanding population subsystems have shown a trend of moving from inland to eastern regions, with cities with contracting population subsystems becoming more concentrated. From a geographical perspective, the development of the population subsystem also exhibits a pronounced characteristic of clustering, which mainly occurs in the southeast region. For example, cities such as Fuzhou, Ganzhou, and Ji’an in Jiangxi Province share similar patterns of population subsystem changes, while cities in adjacent areas such as Zhuzhou and Chenzhou in Hunan Province, as well as Nanping and Sanming in Fujian Province, show similar trends.
Figure 9.
Changes of population subsystem in four periods (a)2002-2006;(b)2007-2011;(c)2012-2016; (d)2017-2021.
Figure 9.
Changes of population subsystem in four periods (a)2002-2006;(b)2007-2011;(c)2012-2016; (d)2017-2021.
As shown in the Figure 10, from 2002 to 2006, the cities with expanding economic subsystem were mainly located in the coastal areas and the border areas. From 2007 to 2011, the economic subsystem of most cities experienced a concentrated expansion. After this period, cities with contracting economic subsystems gradually concentrated northward, while expanding cities gradually moved southward. Cities dominated by heavy industry, mainly in the inland and northeastern regions, have a significant contraction in their economic subsystems.
In the first period (2002-2006), the construction subsystems of 49 cities experienced contraction, while in the second period (2007-2011), the number of expanding construction subsystem is 39. In the third period (2012-2016), the number of three types of cities gradually balanced. In regions with developed economies and transportation, their construction subsystems develop earlier and will also reach a balanced state earlier. Therefore, in the fourth period (2017-2021), the construction subsystems of most cities are stable. In addition, as shown in the Figure 11, the changes in the construction subsystem have clustering characteristics, especially in cities in the southeast region, where the changes are basically synchronous in the four stages.
As Figure 12 shows, from 2002 to 2016, the society subsystem of the city was mainly expanding, with a number of 44, 27, and 56 respectively. Since 2017, the number of contracting society subsystems has begun to increase. It can be seen that in the first three periods, the expanding society subsystem gradually spreads from south to north. In the last five years, the contracting society subsystem gradually spreads to inland areas. The development of society subsystems in cities located in the southeast region has been in a relatively settled state of expansion.
3.3. Influence Factor of CO2
he correlation coefficients between carbon emissions and population, economy, construction, and society subsystems are 0.7703, 0.8578, 0.8511, and 0.7532, indicating a strong correlation between them (Table 7).
Next, we use Bayesian methods to find the optimal parameters for XGBoost model (Table 8). From the table, the R-squared value of the regression model is 0.8403 and the mean square error (MSE) is 0.0023, indicating that the XGBoost model has good regression performance. Figure 13 shows the comparison between the predicted results of the model and the actual values.
Figure 14 displays the explanation of XGBoost model results using the SHAP model.In the two types of cities, the economic subsystem and the construction subsystem have the main contribution to carbon emissions, while the contribution values of the population subsystem and the society subsystem are small. For expanding cities, the contribution of the construction subsystem is greater than that of the economic subsystem. This situation is opposite in contracting cities.
4. Discussion
4.1. Urbanization Development
International research on urban expansion is usually based on urbanization and has rich content. The research theory on urban shrinkage was formed in the late 20th century and has been growing since 2005. China’s urban development started relatively late, and the number of studies using urban expansion and contraction theories only began to increase in the past decade.
China has a vast area and various types of cities. Although urban development started late, it achieved tremendous success in a very short period of time. Evaluating the development of Chinese cities has unique significance and important reference value for research in the field of cities all around.
From 2002 to 2021, the development of most cities in China remained stable. In the early 21st century, the country proposed economic transformation, and there was a significant contraction in the development of resource-based cities located in inland areas, such as the Northeast Industrial Zone. On the other hand, the Pearl River Delta and the Yangtze River Delta are developing rapidly with their superior geographical location. In 2008, the Chinese government proposed a policy named Four Trillion Plan to address the global financial crisis and promote stable economic growth. Therefore, in the next five years, the economic subsystems of cities across the country will generally expand, and the direction of population subsystem expansion will also shift towards the east and south. In 2016, China started to establish the Chengdu-Chongqing metropolitan area. Since then, cities in the southwest region have formed new development zones centered around Chengdu and Chongqing.
Cities with closer geographical locations will exhibit similarities in their development patterns. This situation is particularly evident in the southeastern region of China. For example, Jiangxi Province and Fujian Province are adjacent and have similar geographical conditions, with agriculture and service industries as their main industries. Influenced by historical and cultural factors, the close interaction between the two populations also drives the flow of technology and economy. Therefore, in the past two decades, the urbanization development in this region has shown synchronous and cluster characteristics.
There is an imbalance in the development of population, economy, construction, and society subsystems for most cities. And there are tight connections among the four subsystems. The mobility of population in urban areas is strong and closely related to the local economy. In the meantime, a large number of people gather in cities, promoting economic development in urban areas and increasing social vitality. When population and economic development reach a certain level, it will drive the construction of cities. The level of urban construction will also affect local population mobility and economic development. In addition, there are interdependent relationships within each subsystem. For example, the society subsystem is mainly measured by urban greening rate and population activity. The former reflects the impact of natural environment on society, while the latter reflects the impact of human activities on society. There is a mutually restrictive relationship between human activities and the natural environment. Therefore, the expansion of society subsystems can be explained as the exploration of coordinated development between humans and nature in urban space.
In China, cities develop in a complex model, characterized by a mixed functional composition [52,53]. From the perspective of the city, the subsystems mutually constrain each other, fostering collective development. From the perspective of urban agglomerations, cities with similar geographical locations or conditions will exhibit synchronicity in their development process. In future research on urban development, we should not only pay attention to the operation of various indicators within the city, but also to the expansion and contraction of urban agglomerations at the macro scale.
4.2. Urbanization and Carbon Emissions
It can be seen that economic development and urban construction are the two major factors influencing carbon emissions through the analysis of 68 cities in China.
The development of urbanization has promoted economic growth, which will change the production structure and consumption patterns. In the early stages of urban development, the core of economic development activities initiated by the government was the rapid growth of the total economic output, which often came at the cost of sacrificing the ecological environment [54]. Since the beginning of this century, China has vigorously advocated economic transformation and accelerated the development of new energy economy. Green technology innovation can directly reduce carbon emissions, such as using hydrogen and wind energy to replace traditional fossil fuels, which not only improves energy utilization efficiency but also saves energy extraction costs.
The impact of land use on carbon emissions has always been a concern in academia. Current studies have suggested that there are differences in carbon sink and source capacity among diverse land use types, and the transition from one land use type to another will lead to changes in carbon emissions [55,56]. The expansion of construction land will also consume more energy, such as expanding transportation networks and building commercial areas. High energy consumption leads to high carbon emissions. In recent years, the expansion rate of urban construction land in China has slowed down, and the government is taking care of environmental issues within cities. The use of low-energy building materials also contributes to low-carbon emissions reduction.
For expanding cities, economic factors have a greater impact on carbon emissions than construction factors. For contracting cities, the impact of construction factors is greater than that of economic factors. Therefore, for the former, we should accelerate economic transformation and encourage the development of new energy economy more. For the latter, attention should be paid to the rational planning of urban land. In addition, every urban planner and government needs to pay attention to the relationship between the natural environment and urban residents, and promote their coordinated development. Clearly, the main factors influencing carbon emissions vary depending on the development status of cities. This study shows that an understanding of different aspects of a city’s development is a prerequisite for proposing effective policies to reduce carbon emissions. Study on the relationship between urbanization processes and carbon emissions can not only provide new insights for urban planning but also offer reasonable insights for responding to global climate change. In the future, continuously refining urban development indicators and exploring a closer connection with urban carbon emissions will be our key research topics.
4.3. Limitations and Future Research Directions
The time series chosen for this study is relatively long, and the administrative planning of some sample cities has been adjusted over the past 20 years. In the future, this research method can be used to select urban clusters or areas with uniform statistical research for urban development research.
In the construction of urban evaluation system. When selecting indicators in the experiment, on one hand, the scientificalness of the indicators should be considered, and on the other hand, the accessibility of the indicators should also be considered. This study introduced nighttime lighting data, enriching the dimensions of indicator selection. In the future, more sources of remote sensing data can be utilized to measure the development of cities from different perspectives.
5. Conclusion
This paper selected low-carbon cities in China as samples and established an urbanization development evaluation system by integrating population, economy, construction, and social information to classify cities. Next, quantify the carbon emissions of cities and explore the influence of different factors on carbon emissions in diverse types of cities. The main findings can be summarized as follows:
(1) Cities with significant development fluctuations are scattered, and these cities undertake important economic and social functions, such as Beijing and Chongqing. Cities located in border areas exhibit distinct cluster characteristics in their development.
For the population subsystem, most cities first experienced expansion and gradually reached stability over a period of 20 years, followed by contraction. The development of the population subsystem has obvious clustering, for example, the urban agglomeration located in the southeast region has obvious synchronicity in its development.
For the economic subsystem, the period from 2007 to 2011 was the most vigorous period of urban expansion in China. Subsequently, the development of economic subsystems gradually showed a north-south differentiation, mainly reflected in the contraction of traditional industrial cities in the north, while cities in the south continued to expand, such as the Chengdu-Chongqing metropolitan area and the Yangtze River Delta urban agglomeration.
For the construction of subsystems, the overall development trend is to first shrink, then expand, and finally reach stability. Most of the regions where subsystems were built and expanded earlier were economically and more developed, and these regions also achieved stability earlier.
For society subsystems, most cities exhibit a phenomenon of alternating expansion and contraction. From a geographical perspective, cities with expanding society subsystems are showing a trend of spreading from south to north, while cities with shrinking society subsystems are developing from coastal areas to inland areas.
(2) Economy and construction are the two major factors influencing carbon emissions. The influence of population and society on carbon emissions is smaller than the impact of economy and construction, but it is also necessary to allocate resources reasonably and achieve balanced development between people and society. In expanding cities, the impact of construction on carbon emissions is greater than the economy. Therefore, it is important to pay attention to the rational planning of urban construction land to prevent disorderly expansion. In contracting cities, the impact of the economy on carbon emissions is greater than that of construction. As a result, it is important to adjust the economic structure and advocate for investment in new energy.
Author Contributions
Conceptualization, J.Q.,Y.G.,and T.Y.; methodology, J.Q.; validation, J.Q. and A.R.; formal analysis, J.Q.; resources, W.Y.,R.D.,A.R. and Z,W.; writing—original draft preparation, J.Q.; writing—review and editing, J.Q.,Y.G.,C.Z.and T.Y.; visualization, J.Q. and A.R.; supervision, Y.G and S.G,.; project administration, Y.G and S.G.; funding acquisition, Y.G and S.G. All authors have read and agreed to the published version of the manuscript.
Funding
This research was funded by Beijing Central Axis Protection Foundation, grant number 2023DYKT005.
Data Availability Statement
The data source has been declared in the article
Acknowledgments
Supported by Beijing Central Axis Protection Foundation(2023DYKT005). The authors appreciate the valuable comments from the editor and reviewers.
Conflicts of Interest
The authors declare no conflict of interest. The funders had no role in the design of the study; in the collection, analyses, or interpretation of data; in the writing of the manuscript; or in the decision to publish the results.
Appendix A
Table A1.
68 sample cities selected for this paper.
| Number | City | Number | City | Number | City |
|---|---|---|---|---|---|
| 1 | Huai’an | 24 | Chengdu | 47 | Qinhuangdao |
| 2 | Hulun Buir | 25 | Beijing | 48 | Qingdao |
| 3 | Fuzhou | 26 | Changzhou | 49 | Ningbo |
| 4 | Chizhou | 27 | Baoding | 50 | Nanping |
| 5 | Chongqing | 28 | Ankang | 51 | Lu’an |
| 6 | Changsha | 29 | Zunyi | 52 | Liuzhou |
| 7 | Yinchuan | 30 | Zhuzhou | 53 | Lhasa |
| 8 | Xining | 31 | Zhongshan | 54 | Jingdezhen |
| 9 | Wuhan | 32 | Zhenjiang | 55 | Jinhua |
| 10 | Urumqi | 33 | Yuxi | 56 | Jinchang |
| 11 | Tianjin | 34 | Yantai | 57 | Jilin |
| 12 | Shijiazhuang | 35 | Yan’an | 58 | Jiaxing |
| 13 | Shenyang | 36 | Xiangtan | 59 | Ji’an |
| 14 | Shanghai | 37 | Xiamen | 60 | Huangshan |
| 15 | Nanjing | 38 | Wuzhong | 61 | Huaibei |
| 16 | Nanchang | 39 | Wuhai | 62 | Guilin |
| 17 | Lanzhou | 40 | Wenzhou | 63 | Guangyuan |
| 18 | Kunming | 41 | Weifang | 64 | Ganzhou |
| 19 | Jinan | 42 | Suzhou | 65 | Dalian |
| 20 | Hefei | 43 | Shenzhen | 66 | Chenzhou |
| 21 | Hangzhou | 44 | Sanya | 67 | Chaoyang |
| 22 | Guiyang | 45 | Sanming | 68 | Jincheng |
| 23 | Guangzhou | 46 | Quzhou |
References
- Çetin, M.; Ecevit, E. Urbanization, Energy Consumption and CO2 Emissions in Sub-Saharan Countries: A Panel Cointegration and Causality Analysis. 2015; 3. [Google Scholar] [CrossRef]
- Li, X.; Song, J.; Lin, T.; Dixon, J.; Zhang, G.; Ye, H. Urbanization and health in China, thinking at the national, local and individual levels. Environ. Heal. 2016, 15, S32. [Google Scholar] [CrossRef] [PubMed]
- Effects of land use and transportation on carbon sources and carbon sinks: A case study in Shenzhen, China. Landscape and Urban Planning.
- Yang, M.; Guo, X.; Wu, L. Combined Land-Use and Transportation Demand Modeling Based on Equitableness. 2008 Workshop on Power Electronics and Intelligent Transportation System (PEITS). LOCATION OF CONFERENCE, ChinaDATE OF CONFERENCE; pp. 505–510.
- Dhakal, S. Urban energy use and carbon emissions from cities in China and policy implications. Energy Policy 2009, 37, 4208–4219. [Google Scholar] [CrossRef]
- Zhang, X.-P.; Cheng, X.-M. Energy consumption, carbon emissions, and economic growth in China. Ecol. Econ. 2009, 68, 2706–2712. [Google Scholar] [CrossRef]
- Wang, Y.; Luo, X.; Chen, W.; Zhao, M.; Wang, B. Exploring the spatial effect of urbanization on multi-sectoral CO2 emissions in China. Atmospheric Pollut. Res. 2019, 10, 1610–1620. [Google Scholar] [CrossRef]
- Hao, Y.; Zhang, Z.-Y.; Liao, H.; Wei, Y.-M.; Wang, S. Is CO2 emission a side effect of financial development? An empirical analysis for China. Environ. Sci. Pollut. Res. 2016, 23, 21041–21057. [Google Scholar] [CrossRef]
- Sadorsky, P. The effect of urbanization on CO2 emissions in emerging economies. Energy Econ. 2014, 41, 147–153. [Google Scholar] [CrossRef]
- Wang, S.; Fang, C.; Guan, X.; Pang, B.; Ma, H. Urbanisation, energy consumption, and carbon dioxide emissions in China: A panel data analysis of China’s provinces. Appl. Energy 2014, 136, 738–749. [Google Scholar] [CrossRef]
- Parikh, J.; Shukla, V. Urbanization, energy use and greenhouse effects in economic development. Glob. Environ. Chang. 1995, 5, 87–103. [Google Scholar] [CrossRef]
- Gam, I.; Ben Rejeb, J. Electricity demand in Tunisia. Energy Policy 2012, 45, 714–720. [Google Scholar] [CrossRef]
- Mishra, V.; Sharma, S.; Smyth, R. Are fluctuations in energy consumption per capita transitory? Evidence from a panel of Pacific Island countries. Energy Policy 2009, 37, 2318–2326. [Google Scholar] [CrossRef]
- Martínez-Zarzoso, I.; Maruotti, A. The impact of urbanization on CO2 emissions: Evidence from developing countries. Ecol. Econ. 2011, 70, 1344–1353. [Google Scholar] [CrossRef]
- Shafiei, S.; Salim, R.A. Non-renewable and renewable energy consumption and CO2 emissions in OECD countries: A comparative analysis. Energy Policy 2014, 66, 547–556. [Google Scholar] [CrossRef]
- Pan, W. What type of mixed-use and open? A critical environmental analysis of three neighborhood types in China and insights for sustainable urban planning. Landsc. Urban Plan. 2021, 216, 104221. [Google Scholar] [CrossRef]
- Li, H.; Peng, J.; Yanxu, L.; Yi’na, H. Urbanization impact on landscape patterns in Beijing City, China: A spatial heterogeneity perspective. Ecol. Indic. 2017, 82, 50–60. [Google Scholar] [CrossRef]
- Liddle, B.; Lung, S. Age-structure, urbanization, and climate change in developed countries: revisiting STIRPAT for disaggregated population and consumption-related environmental impacts. Popul. Environ. 2010, 31, 317–343. [Google Scholar] [CrossRef]
- Qi, X.; Han, Y.; Kou, P. Population urbanization, trade openness and carbon emissions: an empirical analysis based on China. Air Qual. Atmosphere Heal. 2020, 13, 519–528. [Google Scholar] [CrossRef]
- Gurney, K.R.; Romero-Lankao, P.; Seto, K.C.; Hutyra, L.R.; Duren, R.; Kennedy, C.; Grimm, N.B.; Ehleringer, J.R.; Marcotullio, P.; Hughes, S.; et al. Climate change: Track urban emissions on a human scale. Nature 2015, 525, 179–181. [Google Scholar] [CrossRef] [PubMed]
- Wang, C.-H.; Chen, N.; Chan, S.-L. A gravity model integrating high-speed rail and seismic-hazard mitigation through land-use planning: Application to California development. Habitat Int. 2017, 62, 51–61. [Google Scholar] [CrossRef]
- Aunan, K.; Wang, S. Internal migration and urbanization in China: Impacts on population exposure to household air pollution (2000–2010). Sci. Total. Environ. 2014, 481, 186–195. [Google Scholar] [CrossRef]
- Dong Xiaofeng, Yang Chunzhi, & Liu Xingguang. (2017). The Exploration of China New Urbanization Theory. Urban Studies, 24(1), 26–34.
- Zhou, C.; Wang, S.; Wang, J. Examining the influences of urbanization on carbon dioxide emissions in the Yangtze River Delta, China: Kuznets curve relationship. Sci. Total. Environ. 2019, 675, 472–482. [Google Scholar] [CrossRef] [PubMed]
- Wu, W.; Tan, W.; Wang, R.; Chen, W.Y. From quantity to quality: Effects of urban greenness on life satisfaction and social inequality. Landsc. Urban Plan. 2023, 238. [Google Scholar] [CrossRef]
- Wang, C.; Wang, F.; Zhang, X.; Zhang, H. Influencing mechanism of energy-related carbon emissions in Xinjiang based on the input-output and structural decomposition analysis. J. Geogr. Sci. 2016, 27, 365–384. [Google Scholar] [CrossRef]
- Baiocchi, G.; Minx, J.; Hubacek, K. The Impact of Social Factors and Consumer Behavior on Carbon Dioxide Emissions in the United Kingdom. J. Ind. Ecol. 2010, 14, 50–72. [Google Scholar] [CrossRef]
- Xu, Q.; Dong, Y.-X.; Yang, R. Urbanization impact on carbon emissions in the Pearl River Delta region: Kuznets curve relationships. J. Clean. Prod. 2018, 180, 514–523. [Google Scholar] [CrossRef]
- Elvidge, C.D.; Ziskin, D.; Baugh, K.E.; Tuttle, B.T.; Ghosh, T.; Pack, D.W.; Erwin, E.H.; Zhizhin, M. A Fifteen Year Record of Global Natural Gas Flaring Derived from Satellite Data. Energies 2009, 2, 595–622. [Google Scholar] [CrossRef]
- Addison, D.; Stewart, B. Nighttime Lights Revisited: The Use of Nighttime Lights Data as a Proxy for Economic Variables; World Bank: Washington, DC, United States, 2015. [Google Scholar]
- Yin, Z.; Li, X.; Tong, F.; Li, Z.; Jendryke, M. Mapping urban expansion using night-time light images from Luojia1-01 and International Space Station. Int. J. Remote. Sens. 2019, 41, 2603–2623. [Google Scholar] [CrossRef]
- Addison, D.; Stewart, B. Nighttime Lights Revisited: The Use of Nighttime Lights Data as a Proxy for Economic Variables; World Bank: Washington, DC, United States, 2015. [Google Scholar]
- Wang, L.; Jia, Y.; Li, X.; Gong, P. Analysing the Driving Forces and Environmental Effects of Urban Expansion by Mapping the Speed and Acceleration of Built-Up Areas in China between 1978 and 2017. Remote. Sens. 2020, 12, 3929. [Google Scholar] [CrossRef]
- Chen, Z.; Yu, B.; Song, W.; Liu, H.; Wu, Q.; Shi, K.; Wu, J. A New Approach for Detecting Urban Centers and Their Spatial Structure With Nighttime Light Remote Sensing. IEEE Trans. Geosci. Remote. Sens. 2017, 55, 6305–6319. [Google Scholar] [CrossRef]
- Ye, Y.; Yun, G.; He, Y.; Lin, R.; He, T.; Qian, Z. Spatiotemporal Characteristics of Urbanization in the Taiwan Strait Based on Nighttime Light Data from 1992 to 2020. Remote. Sens. 2023, 15, 3226. [Google Scholar] [CrossRef]
- Lu, C.; Li, L.; Lei, Y.; Ren, C.; Su, Y.; Huang, Y.; Chen, Y.; Lei, S.; Fu, W. Coupling Coordination Relationship between Urban Sprawl and Urbanization Quality in the West Taiwan Strait Urban Agglomeration, China: Observation and Analysis from DMSP/OLS Nighttime Light Imagery and Panel Data. Remote. Sens. 2020, 12, 3217. [Google Scholar] [CrossRef]
- Sun, Y.; Zheng, S.; Wu, Y.; Schlink, U.; Singh, R.P. Spatiotemporal Variations of City-Level Carbon Emissions in China during 2000–2017 Using Nighttime Light Data. Remote. Sens. 2020, 12, 2916. [Google Scholar] [CrossRef]
- Wu, K.; Wang, X. Aligning Pixel Values of DMSP and VIIRS Nighttime Light Images to Evaluate Urban Dynamics. Remote. Sens. 2019, 11, 1463. [Google Scholar] [CrossRef]
- Zheng, Q.; Weng, Q.; Wang, K. Developing a new cross-sensor calibration model for DMSP-OLS and Suomi-NPP VIIRS night-light imageries. ISPRS J. Photogramm. Remote. Sens. 2019, 153, 36–47. [Google Scholar] [CrossRef]
- Shan, Y.; Guan, D.; Liu, J.; Mi, Z.; Liu, Z.; Liu, J.; Schroeder, H.; Cai, B.; Chen, Y.; Shao, S.; et al. Methodology and applications of city level CO2 emission accounts in China. J. Clean. Prod. 2017, 161, 1215–1225. [Google Scholar] [CrossRef]
- Shan, Y.; Guan, Y.; Hang, Y.; Zheng, H.; Li, Y.; Guan, D.; Li, J.; Zhou, Y.; Li, L.; Hubacek, K. City-level emission peak and drivers in China. Sci. Bull. 2022, 67, 1910–1920. [Google Scholar] [CrossRef] [PubMed]
- Shan, Y.; Liu, J.; Liu, Z.; Shao, S.; Guan, D. An emissions-socioeconomic inventory of Chinese cities. Sci. Data 2019, 6, 190027. [Google Scholar] [CrossRef] [PubMed]
- Peng, J.; Tian, L.; Liu, Y.; Zhao, M.; Hu, Y.; Wu, J. Ecosystem services response to urbanization in metropolitan areas: Thresholds identification. Sci. Total Environ. 2017, 607–608, 706–714. [Google Scholar] [CrossRef] [PubMed]
- Friedmann, J. Four Theses in the Study of China’s Urbanization. Int. J. Urban Reg. Res. 2006, 30, 440–451. [Google Scholar] [CrossRef]
- Tian, Y.; Tsendbazar, N.-E.; van Leeuwen, E.; Fensholt, R.; Herold, M. A global analysis of multifaceted urbanization patterns using Earth Observation data from 1975 to 2015. Landsc. Urban Plan. 2022, 219. [Google Scholar] [CrossRef]
- Lemoine-Rodríguez, R.; Inostroza, L.; Zepp, H. The global homogenization of urban form. An assessment of 194 cities across time. Landsc. Urban Plan. 2020, 204, 103949. [Google Scholar] [CrossRef]
- Zhao, M.; Zhou, Y.; Li, X.; Zhou, C.; Cheng, W.; Li, M.; Huang, K. Building a Series of Consistent Night-Time Light Data (1992–2018) in Southeast Asia by Integrating DMSP-OLS and NPP-VIIRS. IEEE Trans. Geosci. Remote Sens. 2019, 58, 1843–1856. [Google Scholar] [CrossRef]
- Li, X.; Xu, H.; Chen, X.; Li, C. Potential of NPP-VIIRS Nighttime Light Imagery for Modeling the Regional Economy of China. Remote. Sens. 2013, 5, 3057–3081. [Google Scholar] [CrossRef]
- Imhoff, M.L.; Lawrence, W.T.; Elvidge, C.D.; Paul, T.; Levine, E.; Privalsky, M.V.; Brown, V. Using nighttime DMSP/OLS images of city lights to estimate the impact of urban land use on soil resources in the United States. Remote. Sens. Environ. 1997, 59, 105–117. [Google Scholar] [CrossRef]
- Raza, M.Y.; Lin, B. Decoupling and mitigation potential analysis of CO2 emissions from Pakistan's transport sector. Sci. Total. Environ. 2020, 730, 139000. [Google Scholar] [CrossRef]
- Zhao, Y.; Ma, S.; Fan, J.; Cai, Y. Examining the Effects of Land Use on Carbon Emissions: Evidence from Pearl River Delta. Int. J. Environ. Res. Public Heal. 2021, 18, 3623. [Google Scholar] [CrossRef] [PubMed]
- He, X.; Zhou, Y. Urban spatial growth and driving mechanisms under different urban morphologies: An empirical analysis of 287 Chinese cities. Landsc. Urban Plan. 2024, 248. [Google Scholar] [CrossRef]
- Zhou, C.; Wang, S.; Wang, J. Examining the influences of urbanization on carbon dioxide emissions in the Yangtze River Delta, China: Kuznets curve relationship. Sci. Total. Environ. 2019, 675, 472–482. [Google Scholar] [CrossRef] [PubMed]
- Tao, Y.; Li, F.; Wang, R.; Zhao, D. Effects of land use and cover change on terrestrial carbon stocks in urbanized areas: a study from Changzhou, China. J. Clean. Prod. 2015, 103, 651–657. [Google Scholar] [CrossRef]
- Di Vittorio, A.V.; Simmonds, M.B.; Nico, P. Quantifying the effects of multiple land management practices, land cover change, and wildfire on the California landscape carbon budget with an empirical model. PLOS ONE 2021, 16, e0251346. [Google Scholar] [CrossRef]
- Lin, Q.; Zhang, L.; Qiu, B.; Zhao, Y.; Wei, C. Spatiotemporal Analysis of Land Use Patterns on Carbon Emissions in China. Land 2021, 10, 141. [Google Scholar] [CrossRef]
Figure 1.
The flowchart illustrating four parts of research.
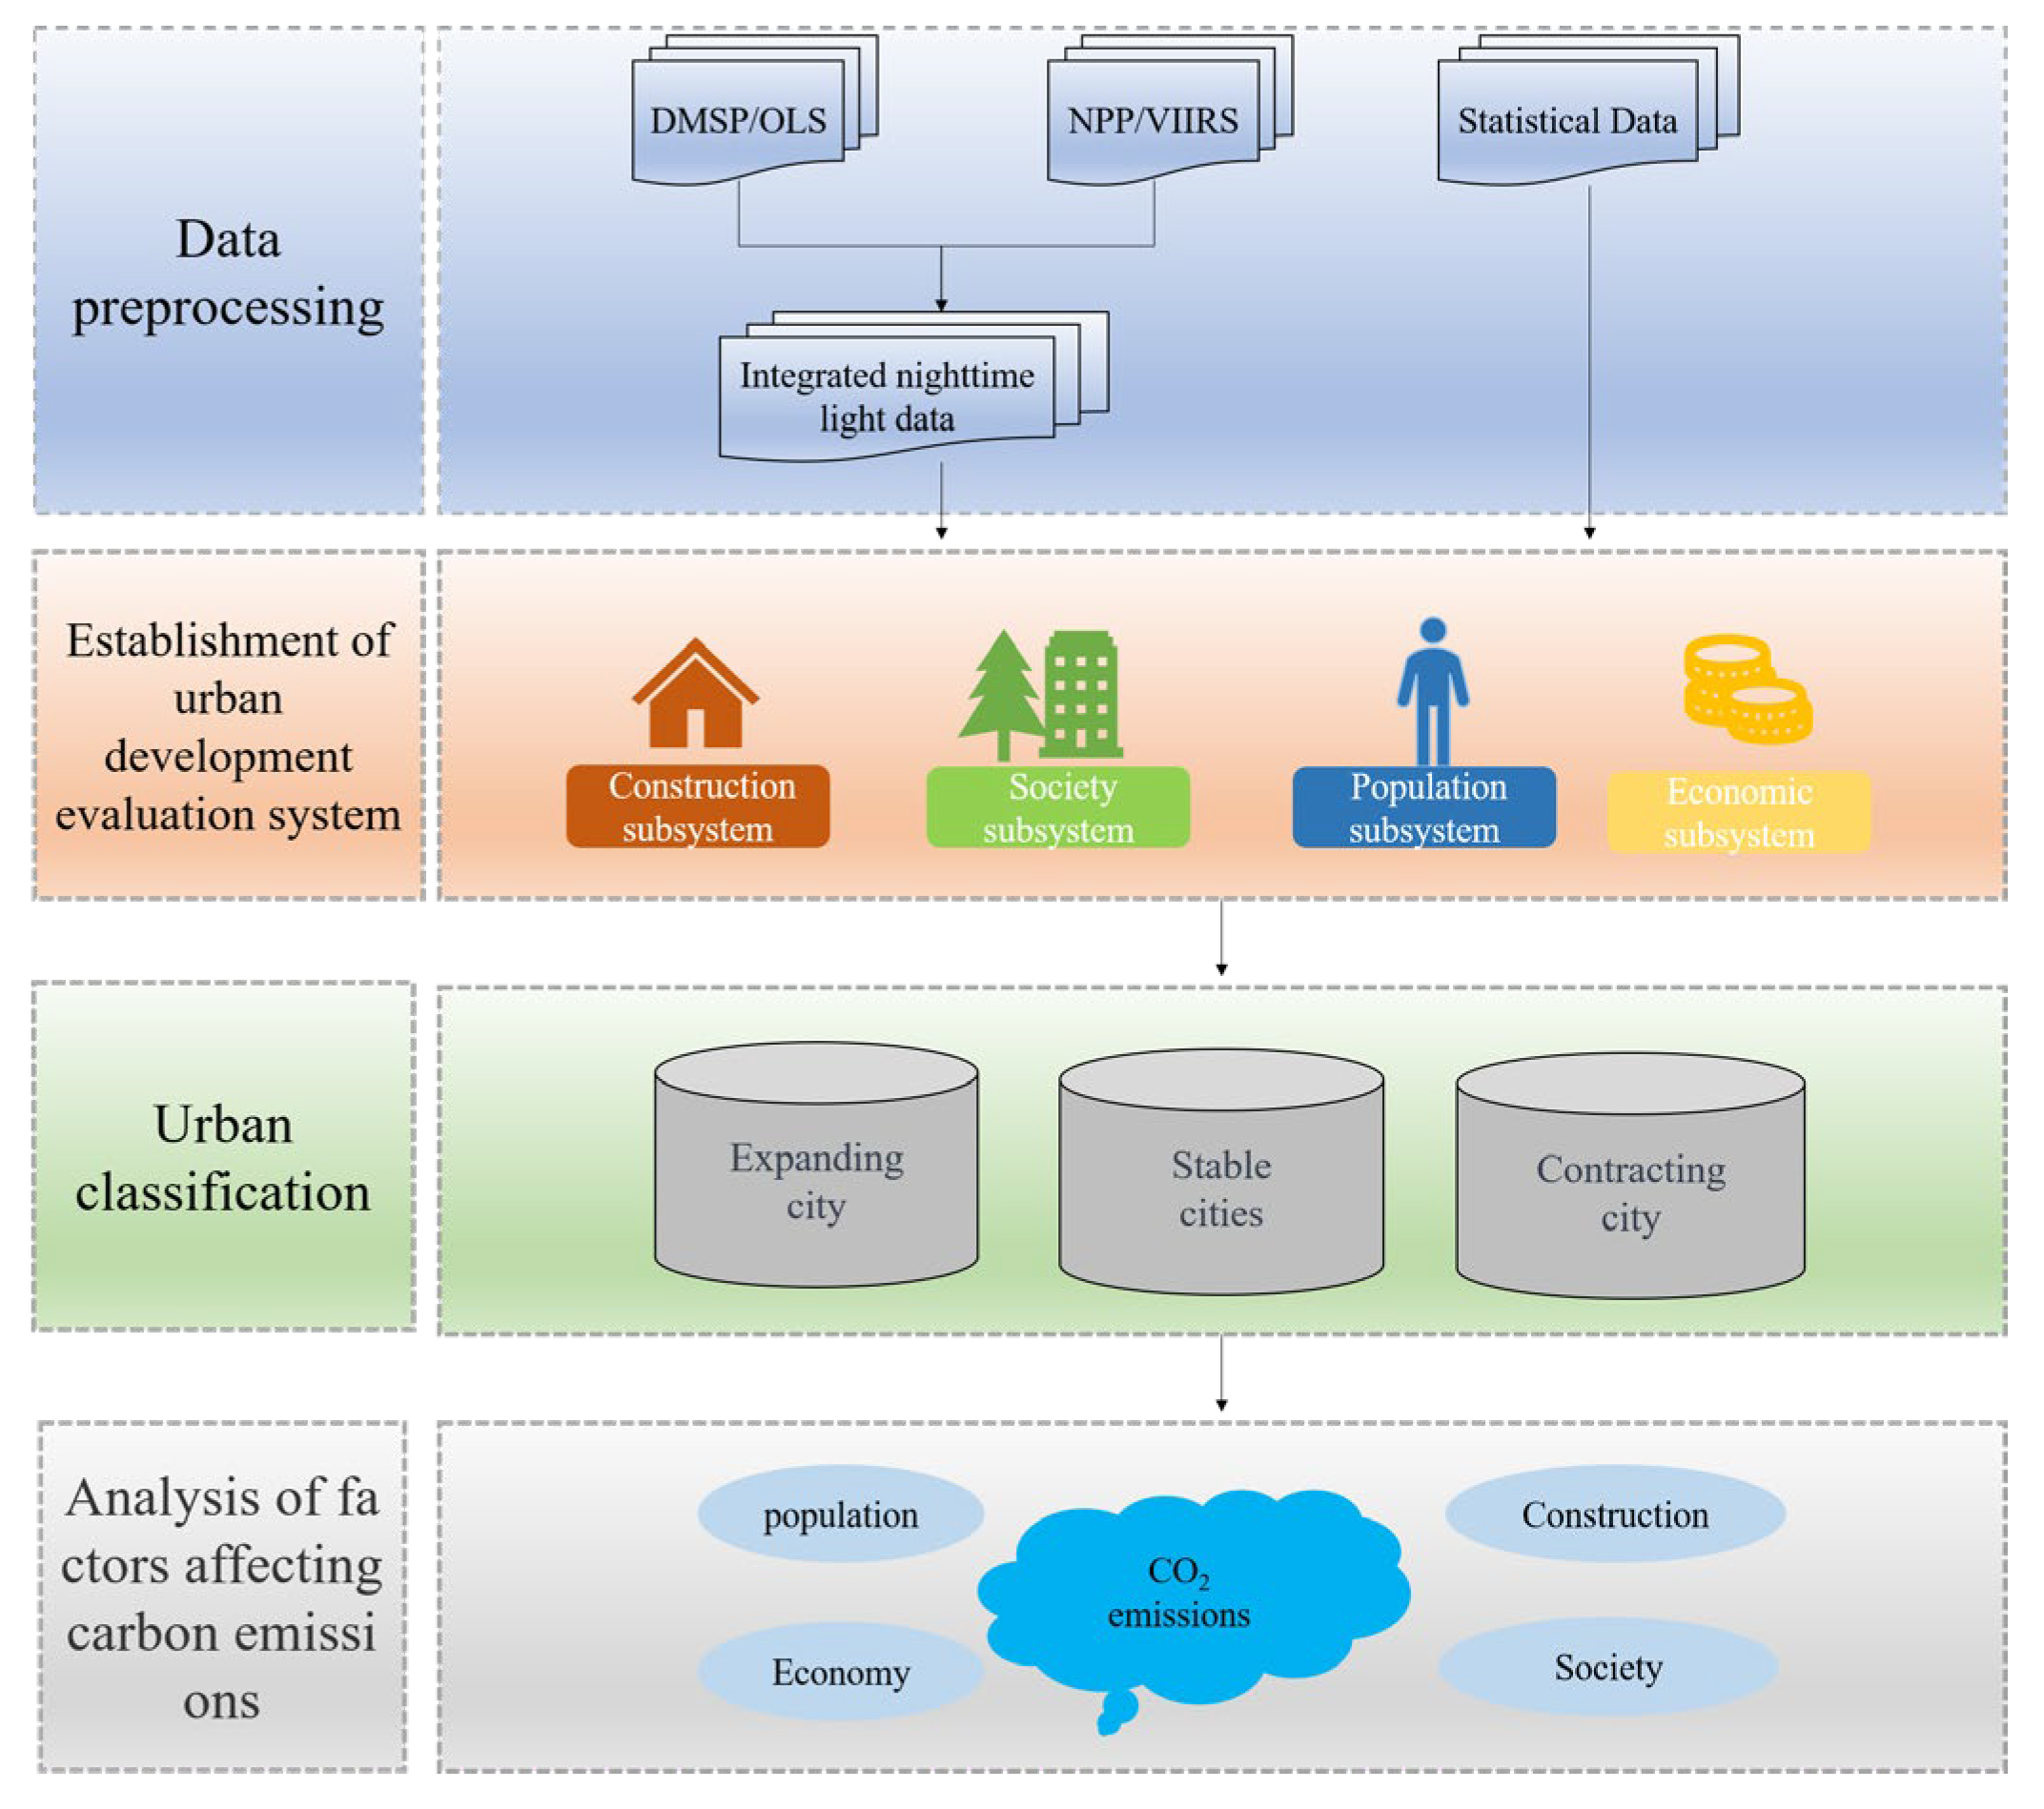
Figure 2.
China’s low-carbon pilot cities.
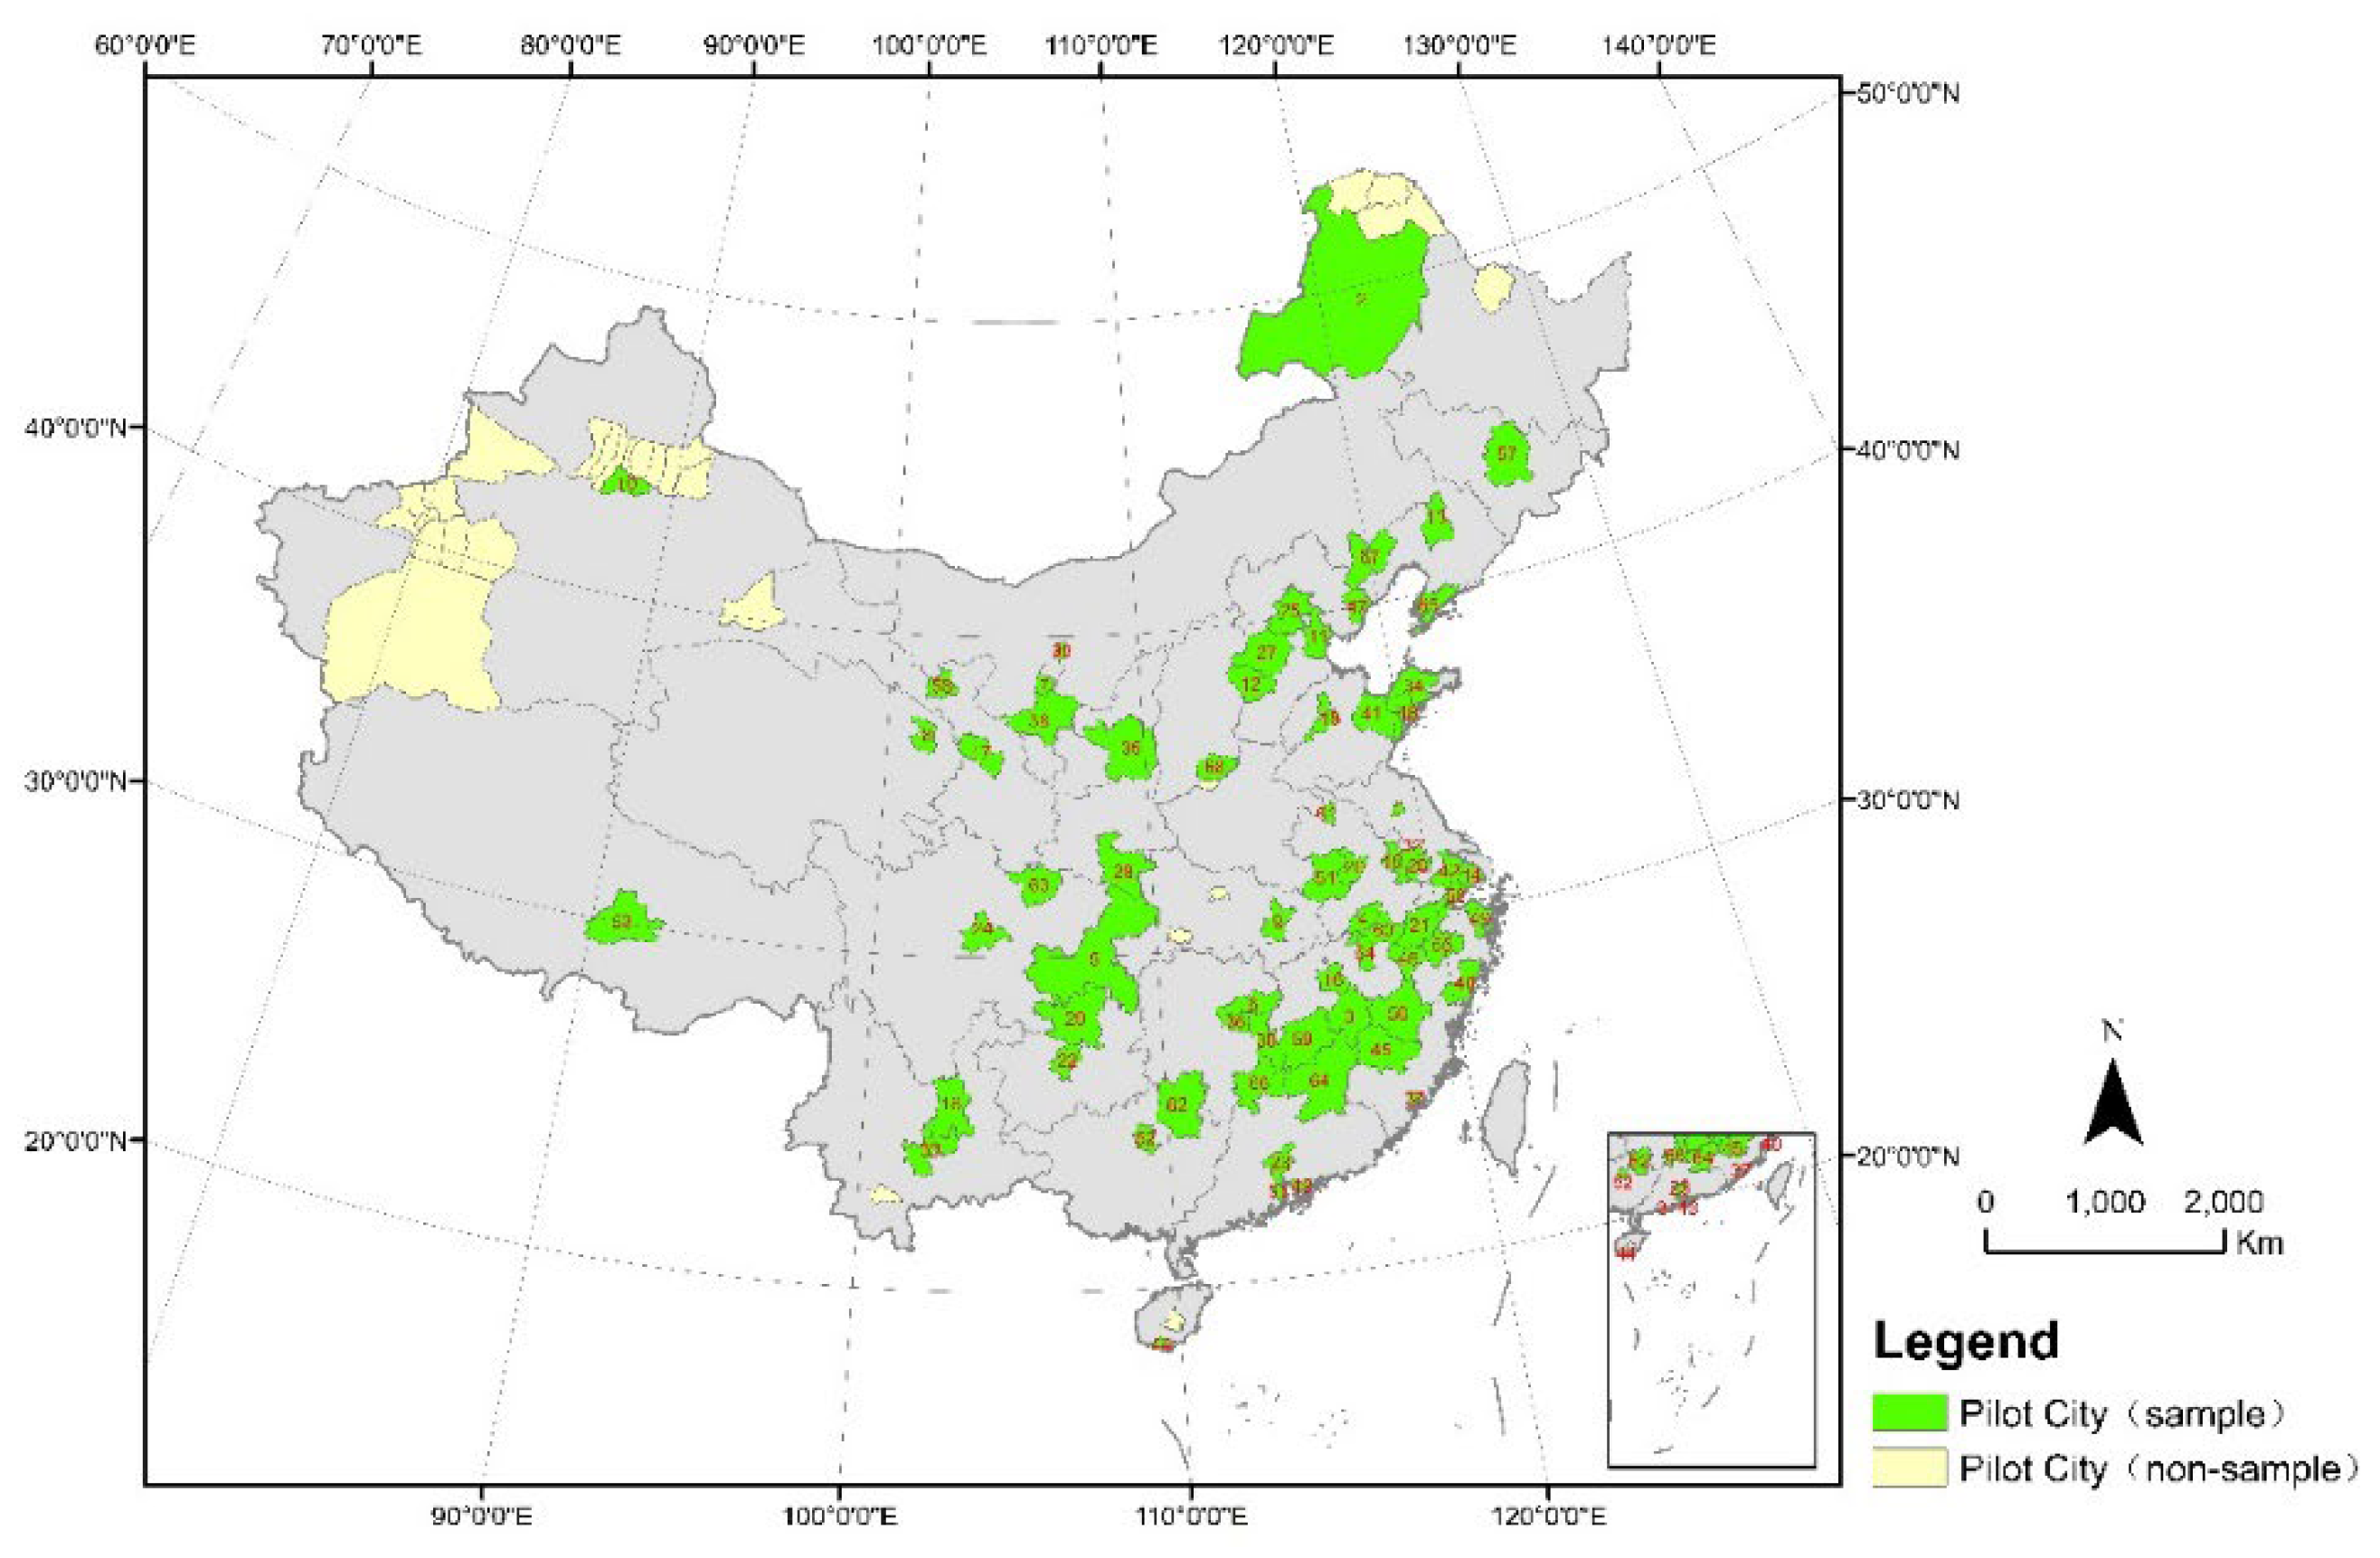
Figure 3.
The evaluation system for urbanization development.
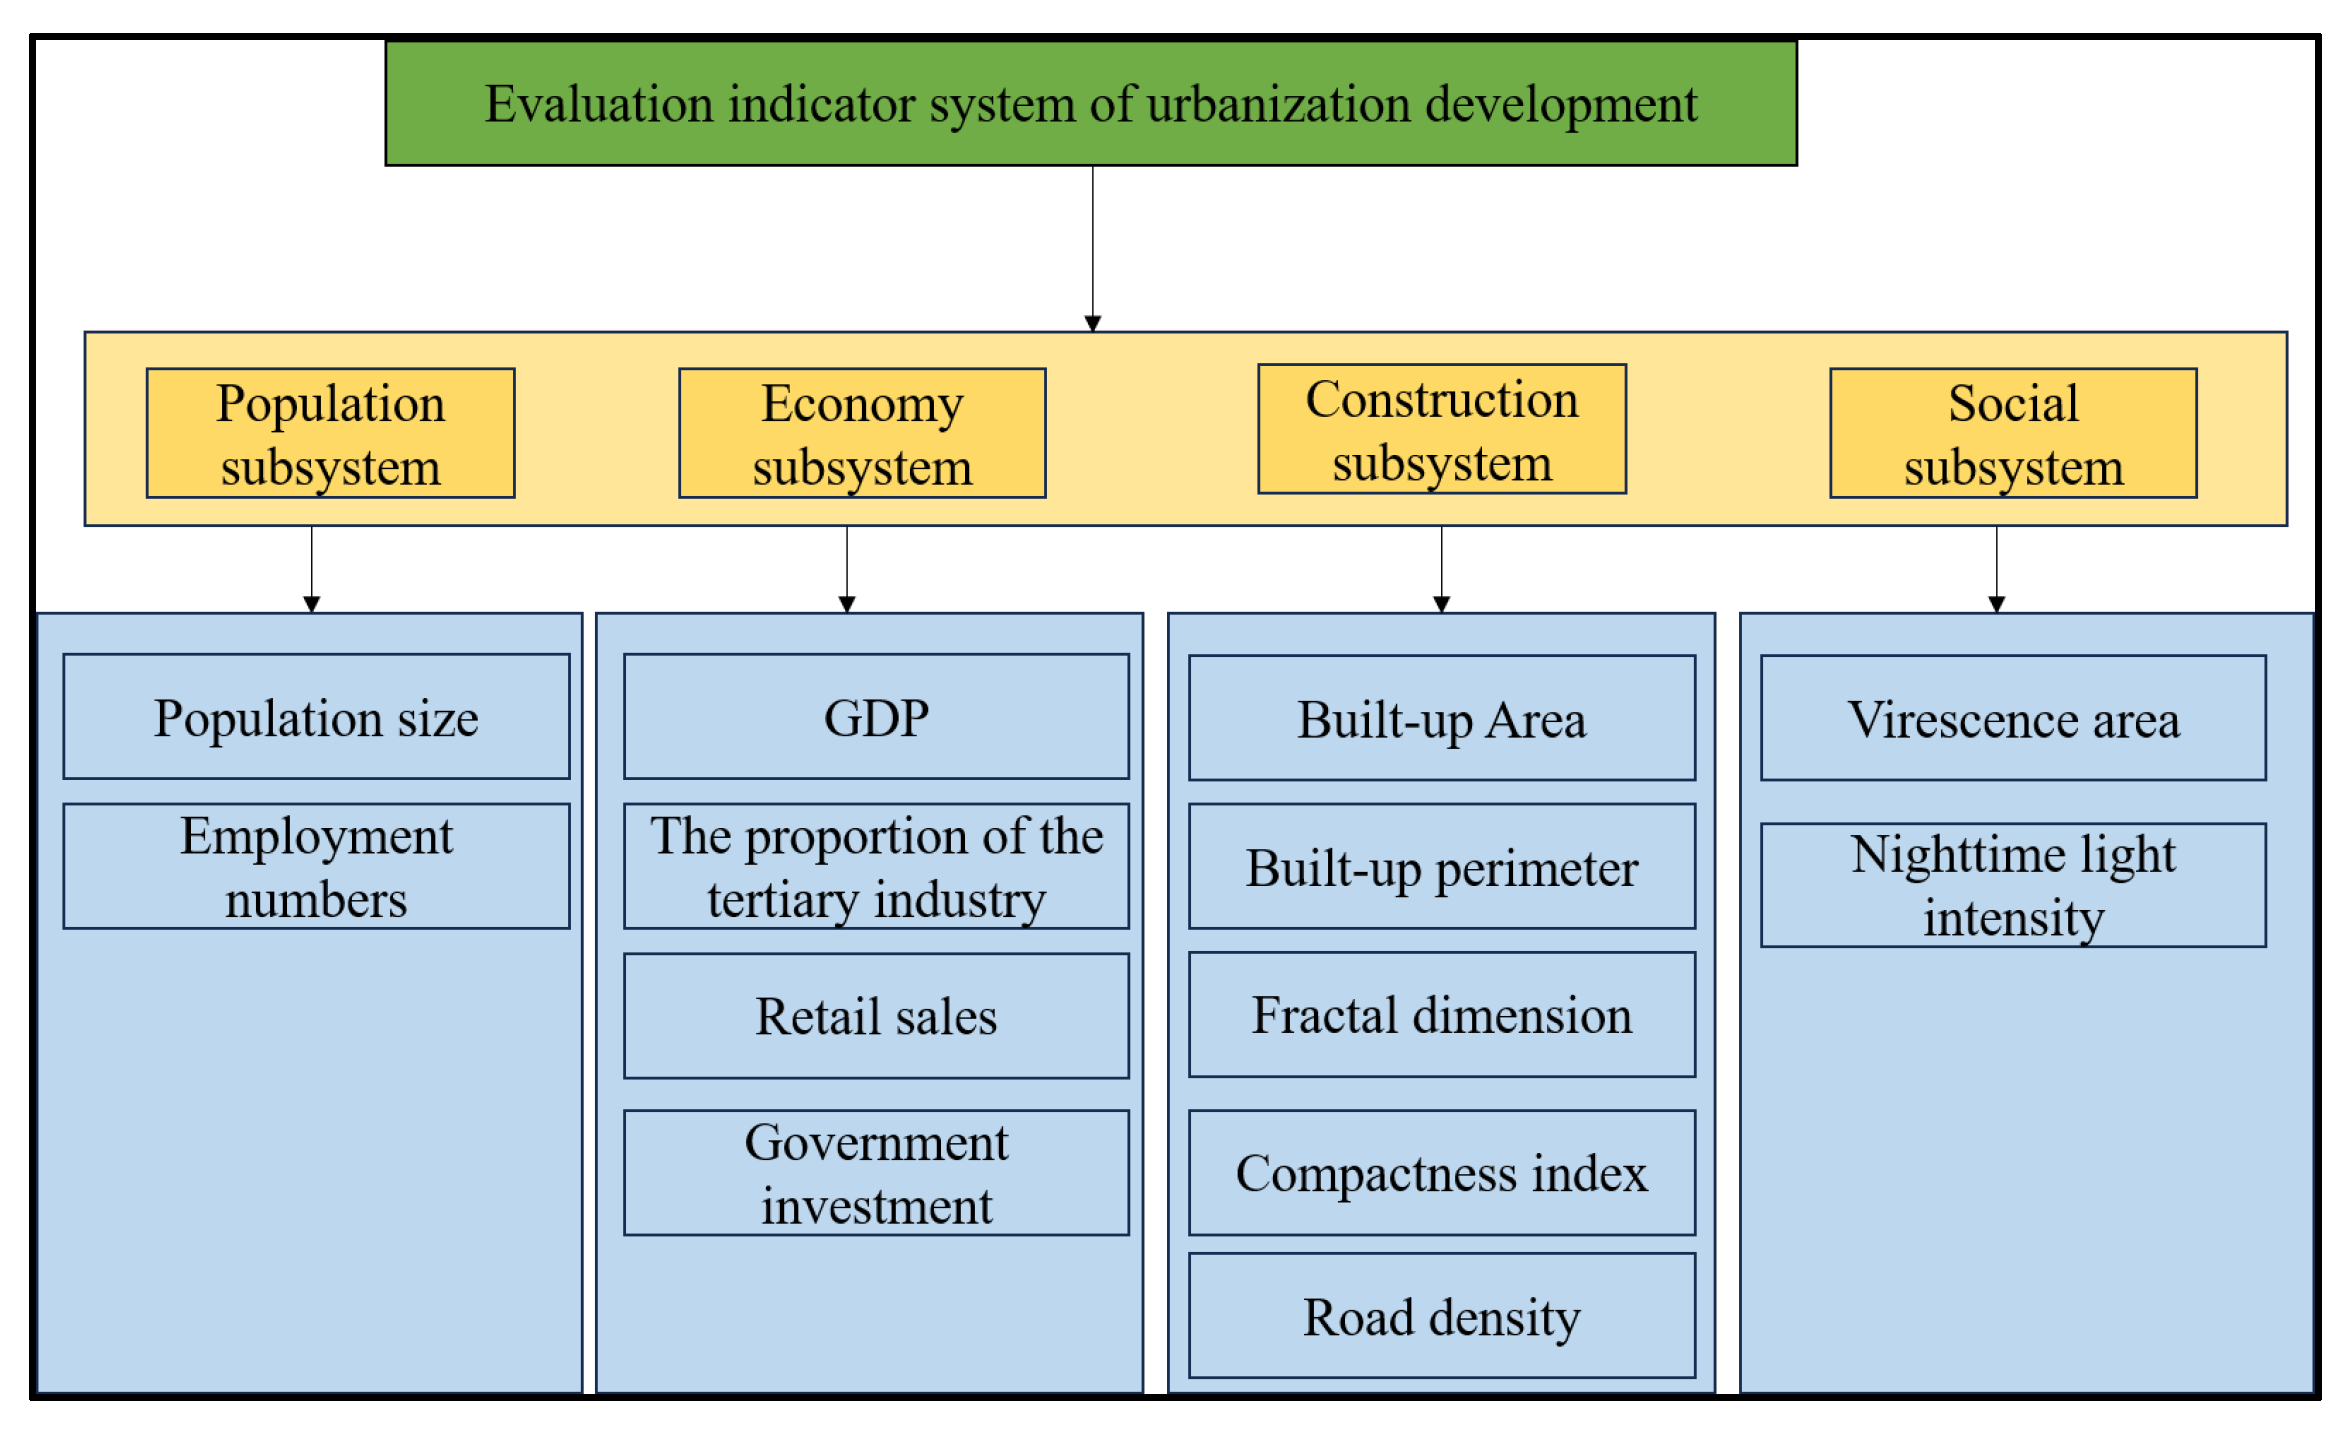
Figure 4.
Preprocessing of DMSP/OLS data.
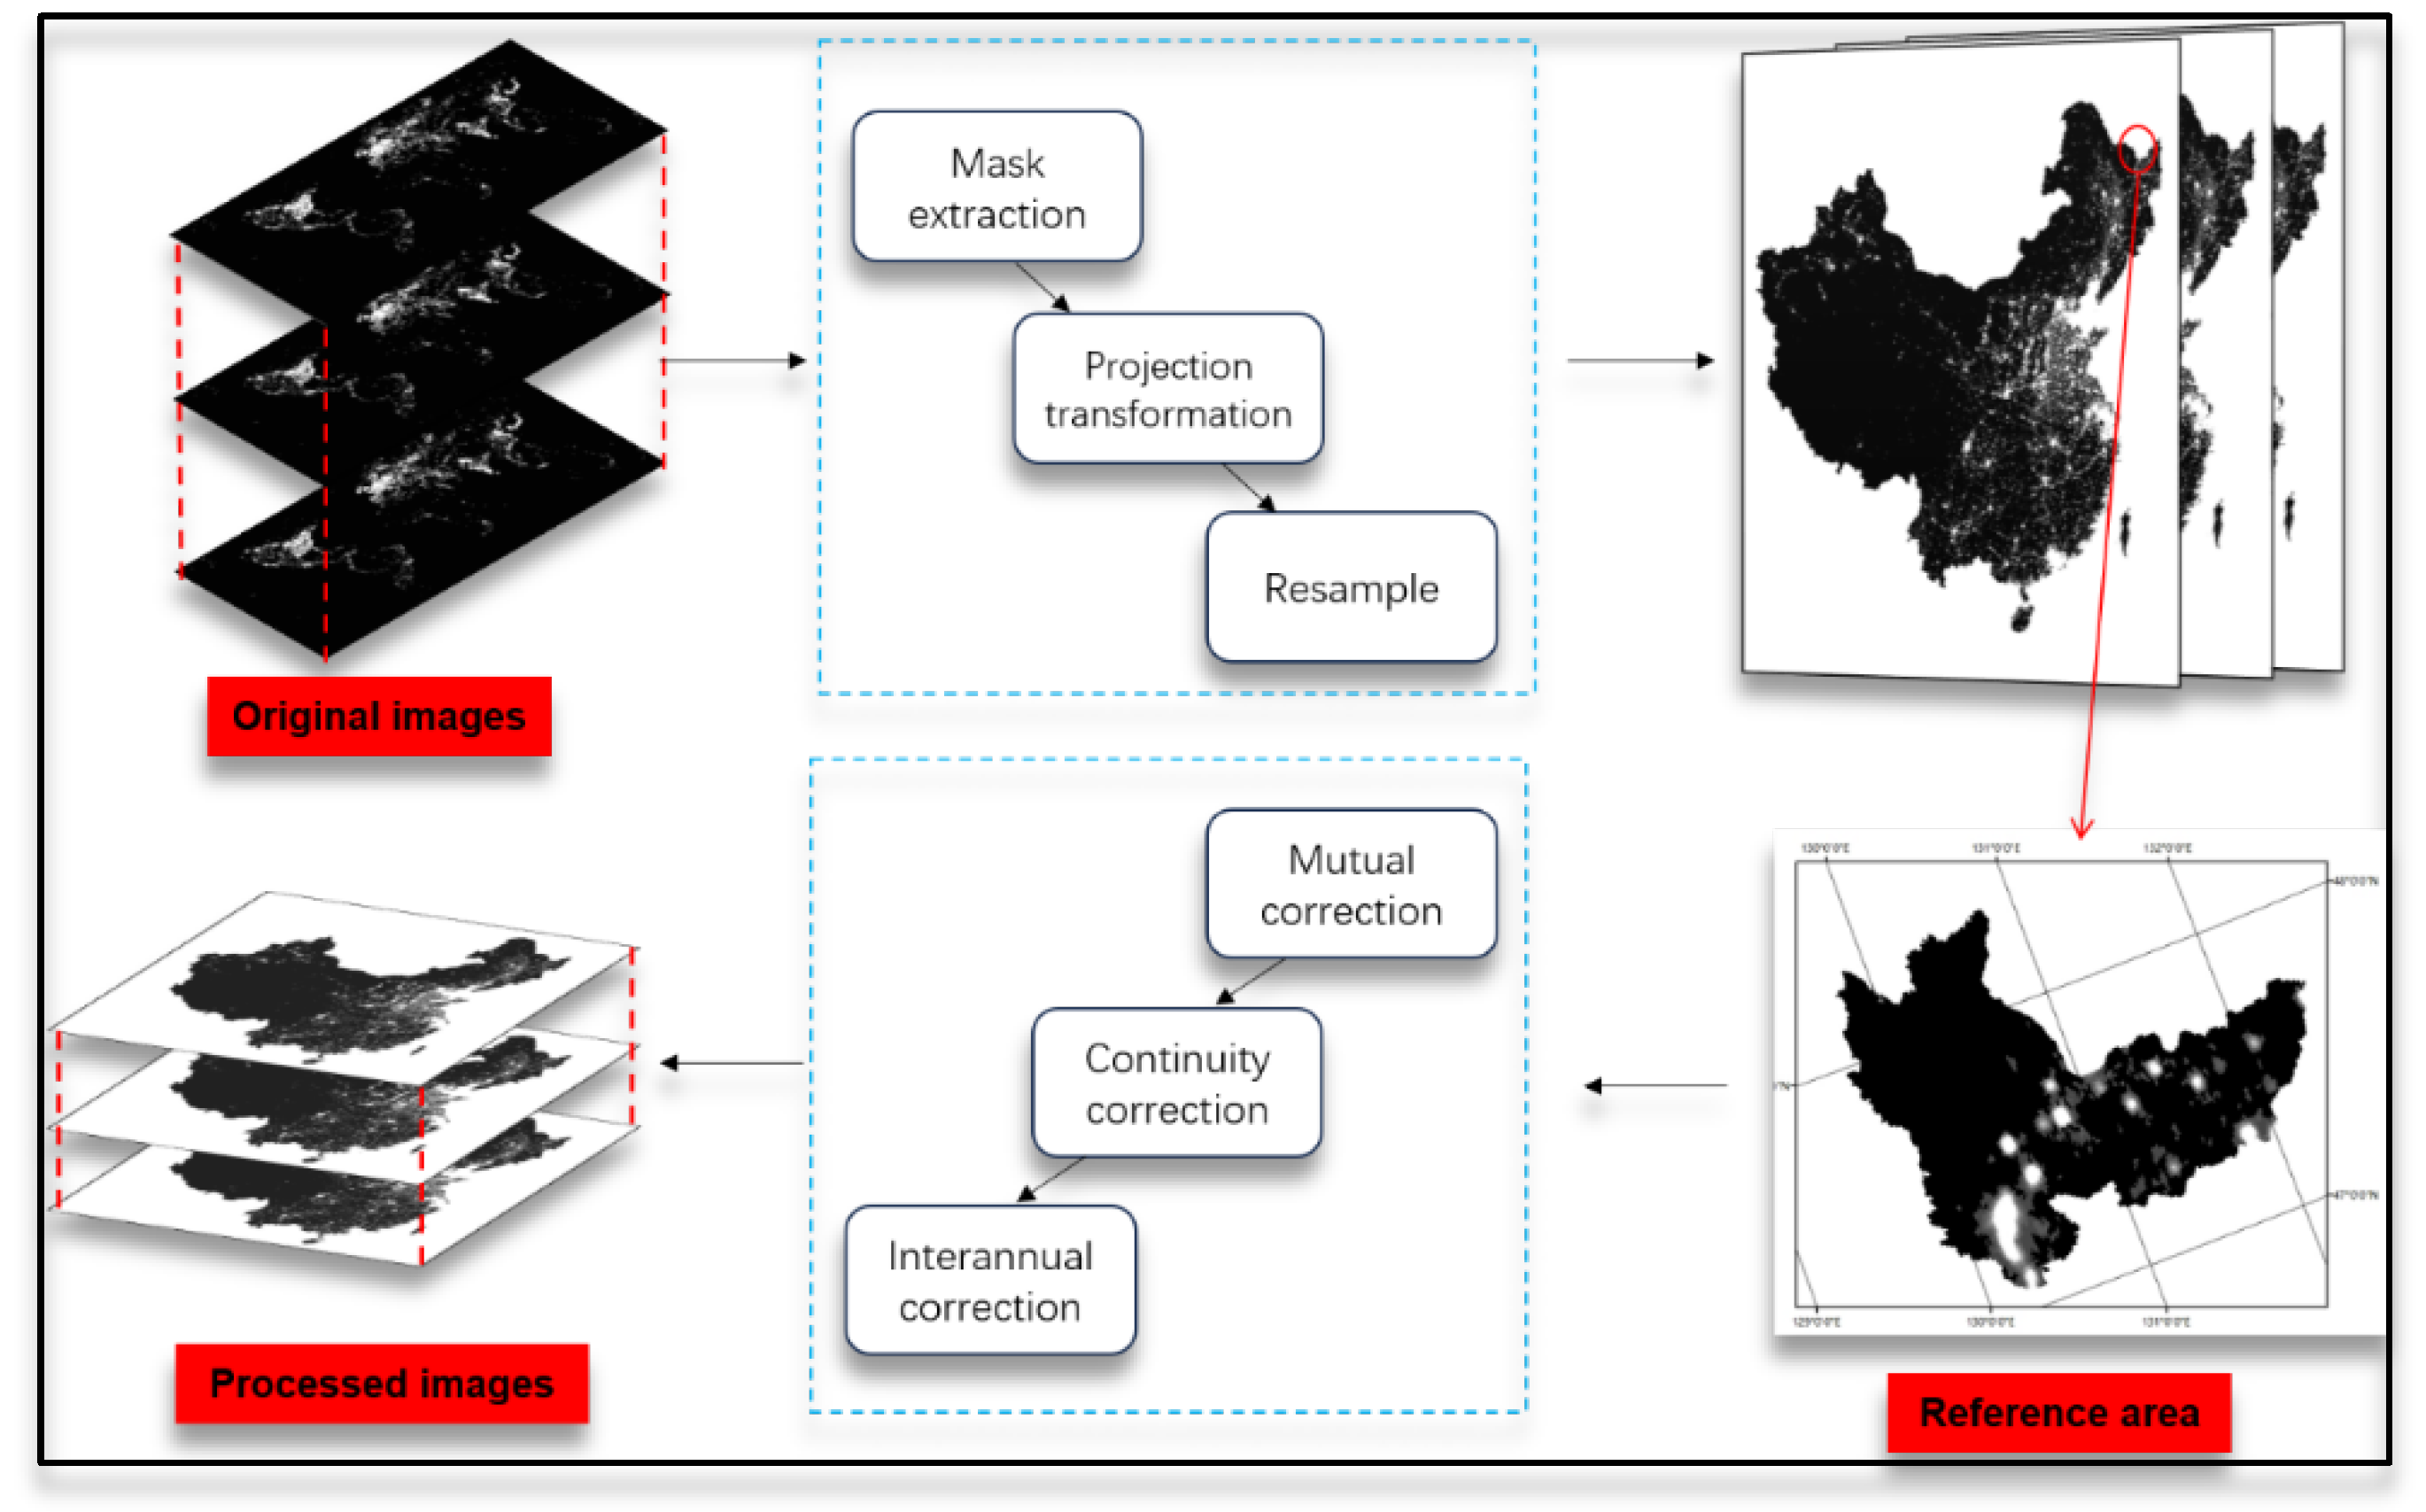
Figure 7.
The correlation coefficient between 13 indicators and carbon emissions.
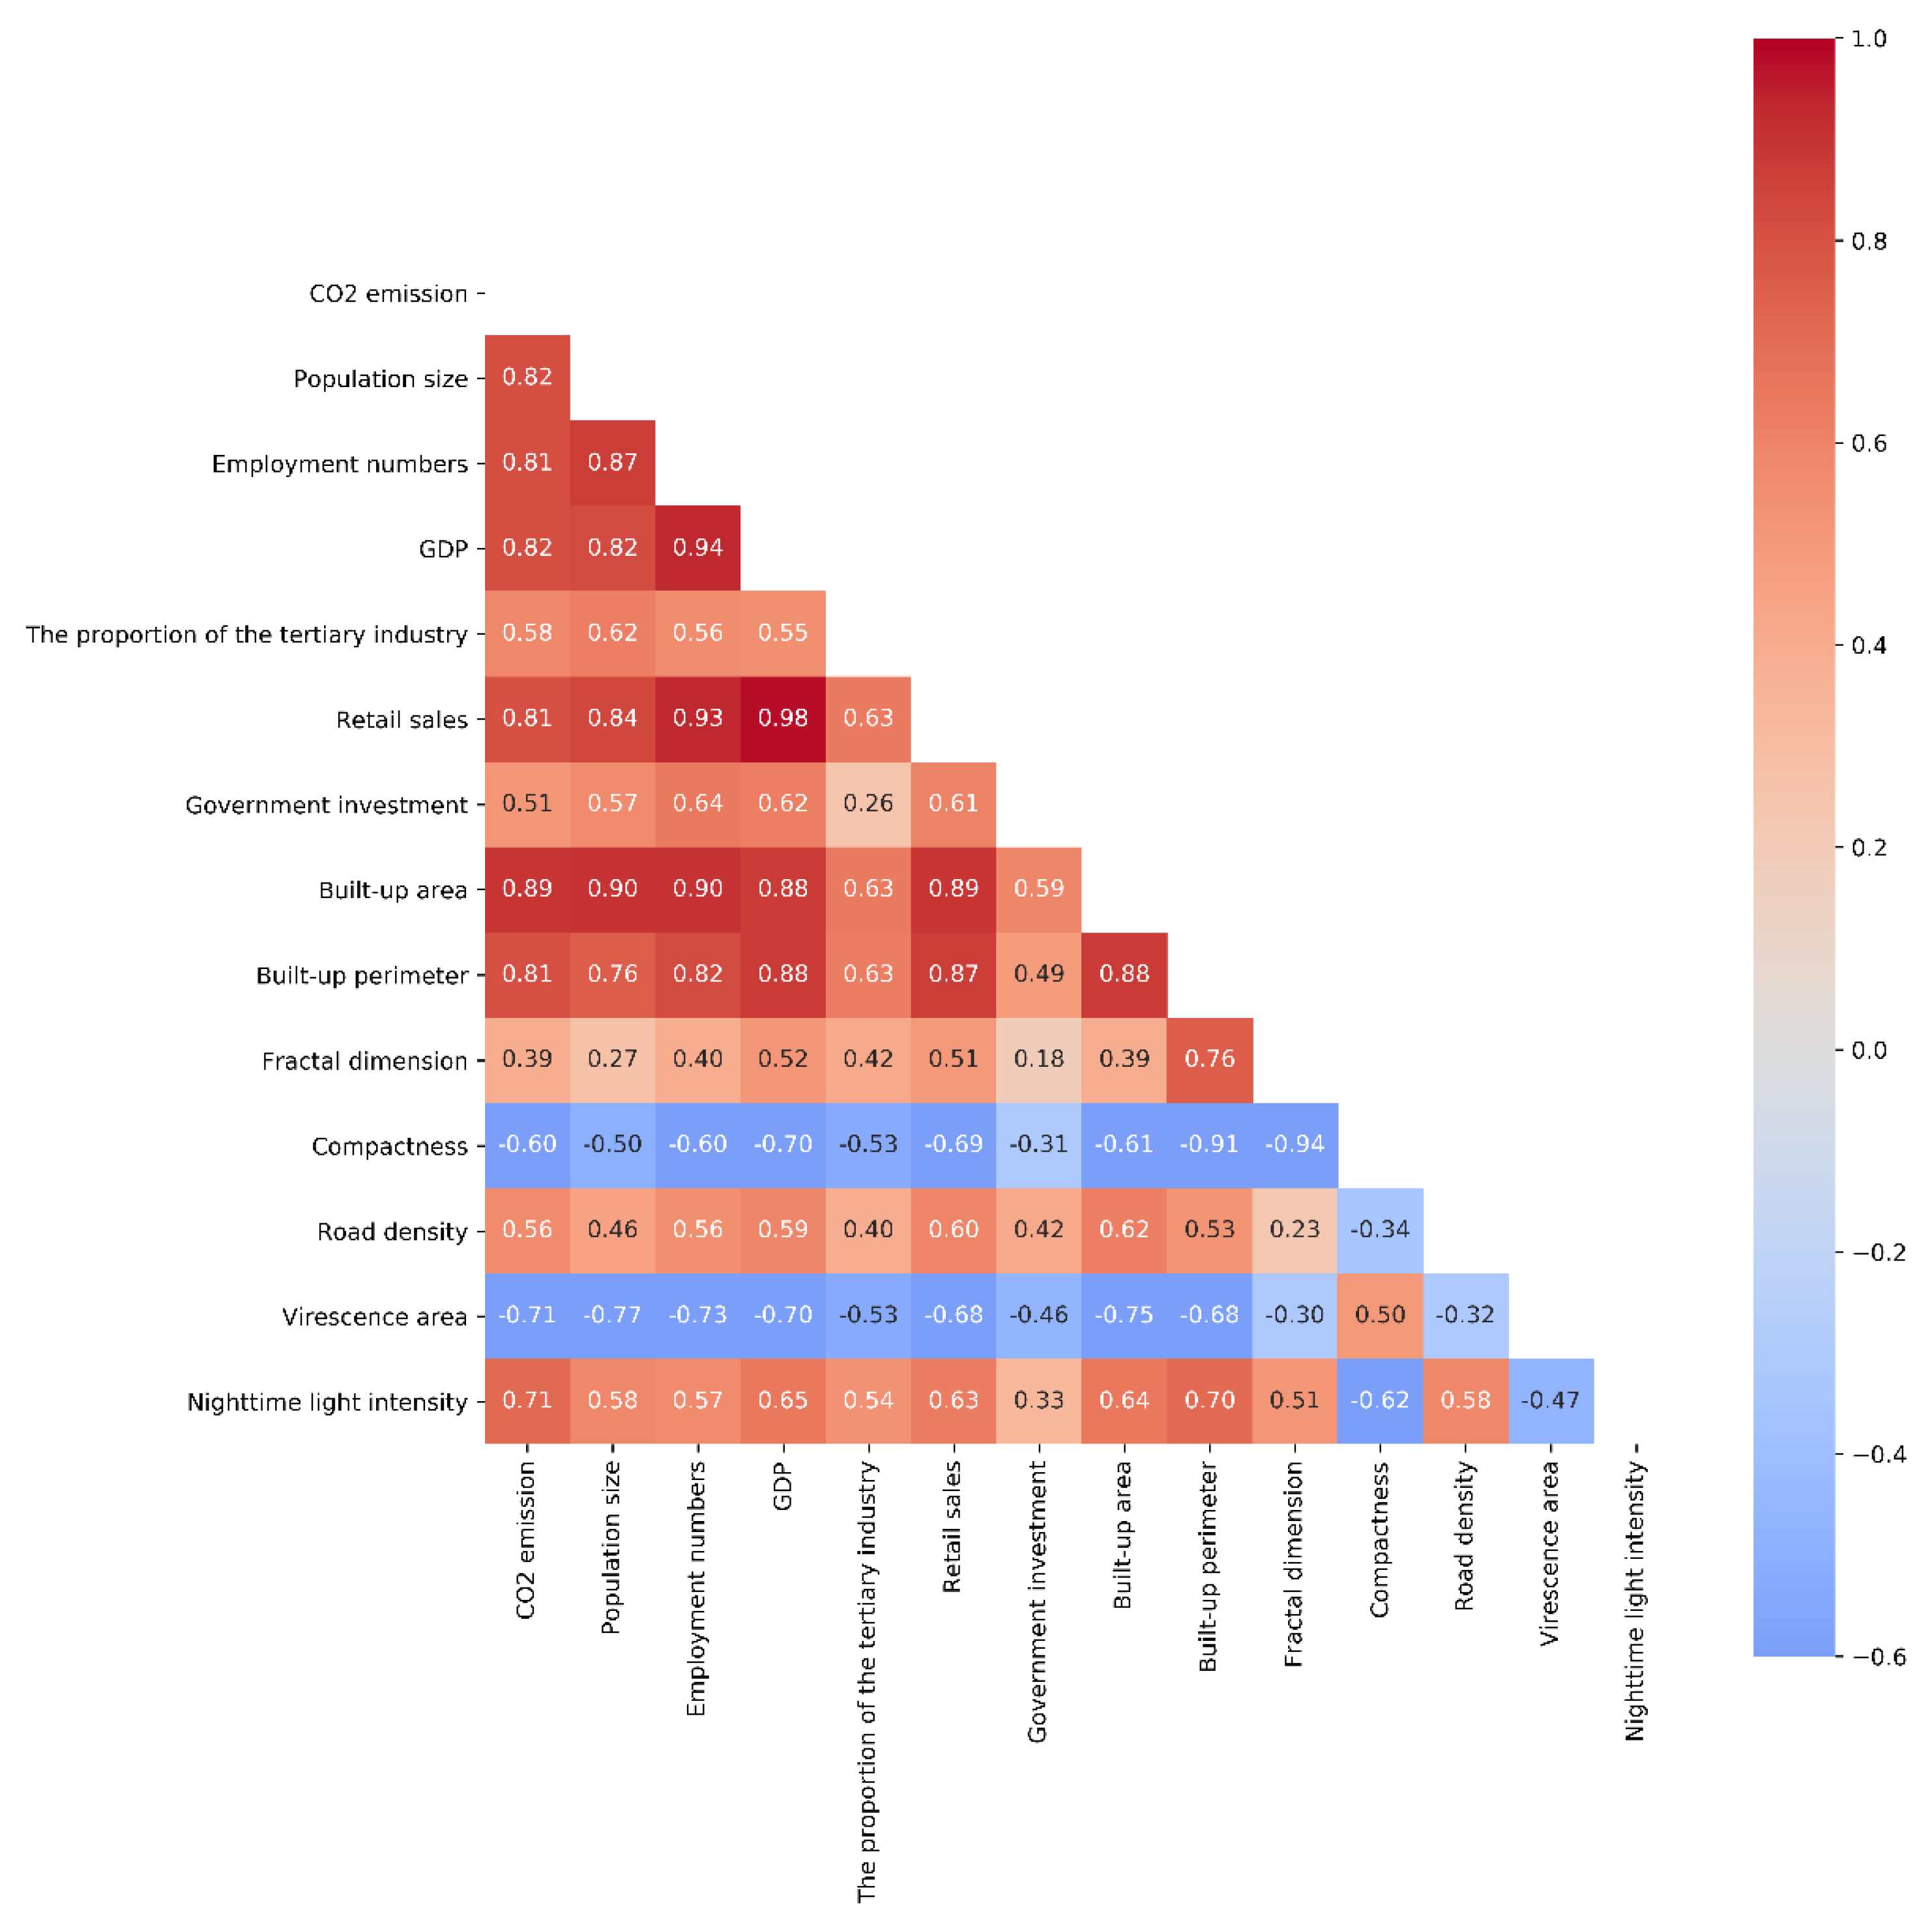
Figure 8.
Changes of urban development in four periods. (a)2002-2006;(b)2007-2011;(c)2012-2016; (d)2017-2021.
Figure 8.
Changes of urban development in four periods. (a)2002-2006;(b)2007-2011;(c)2012-2016; (d)2017-2021.
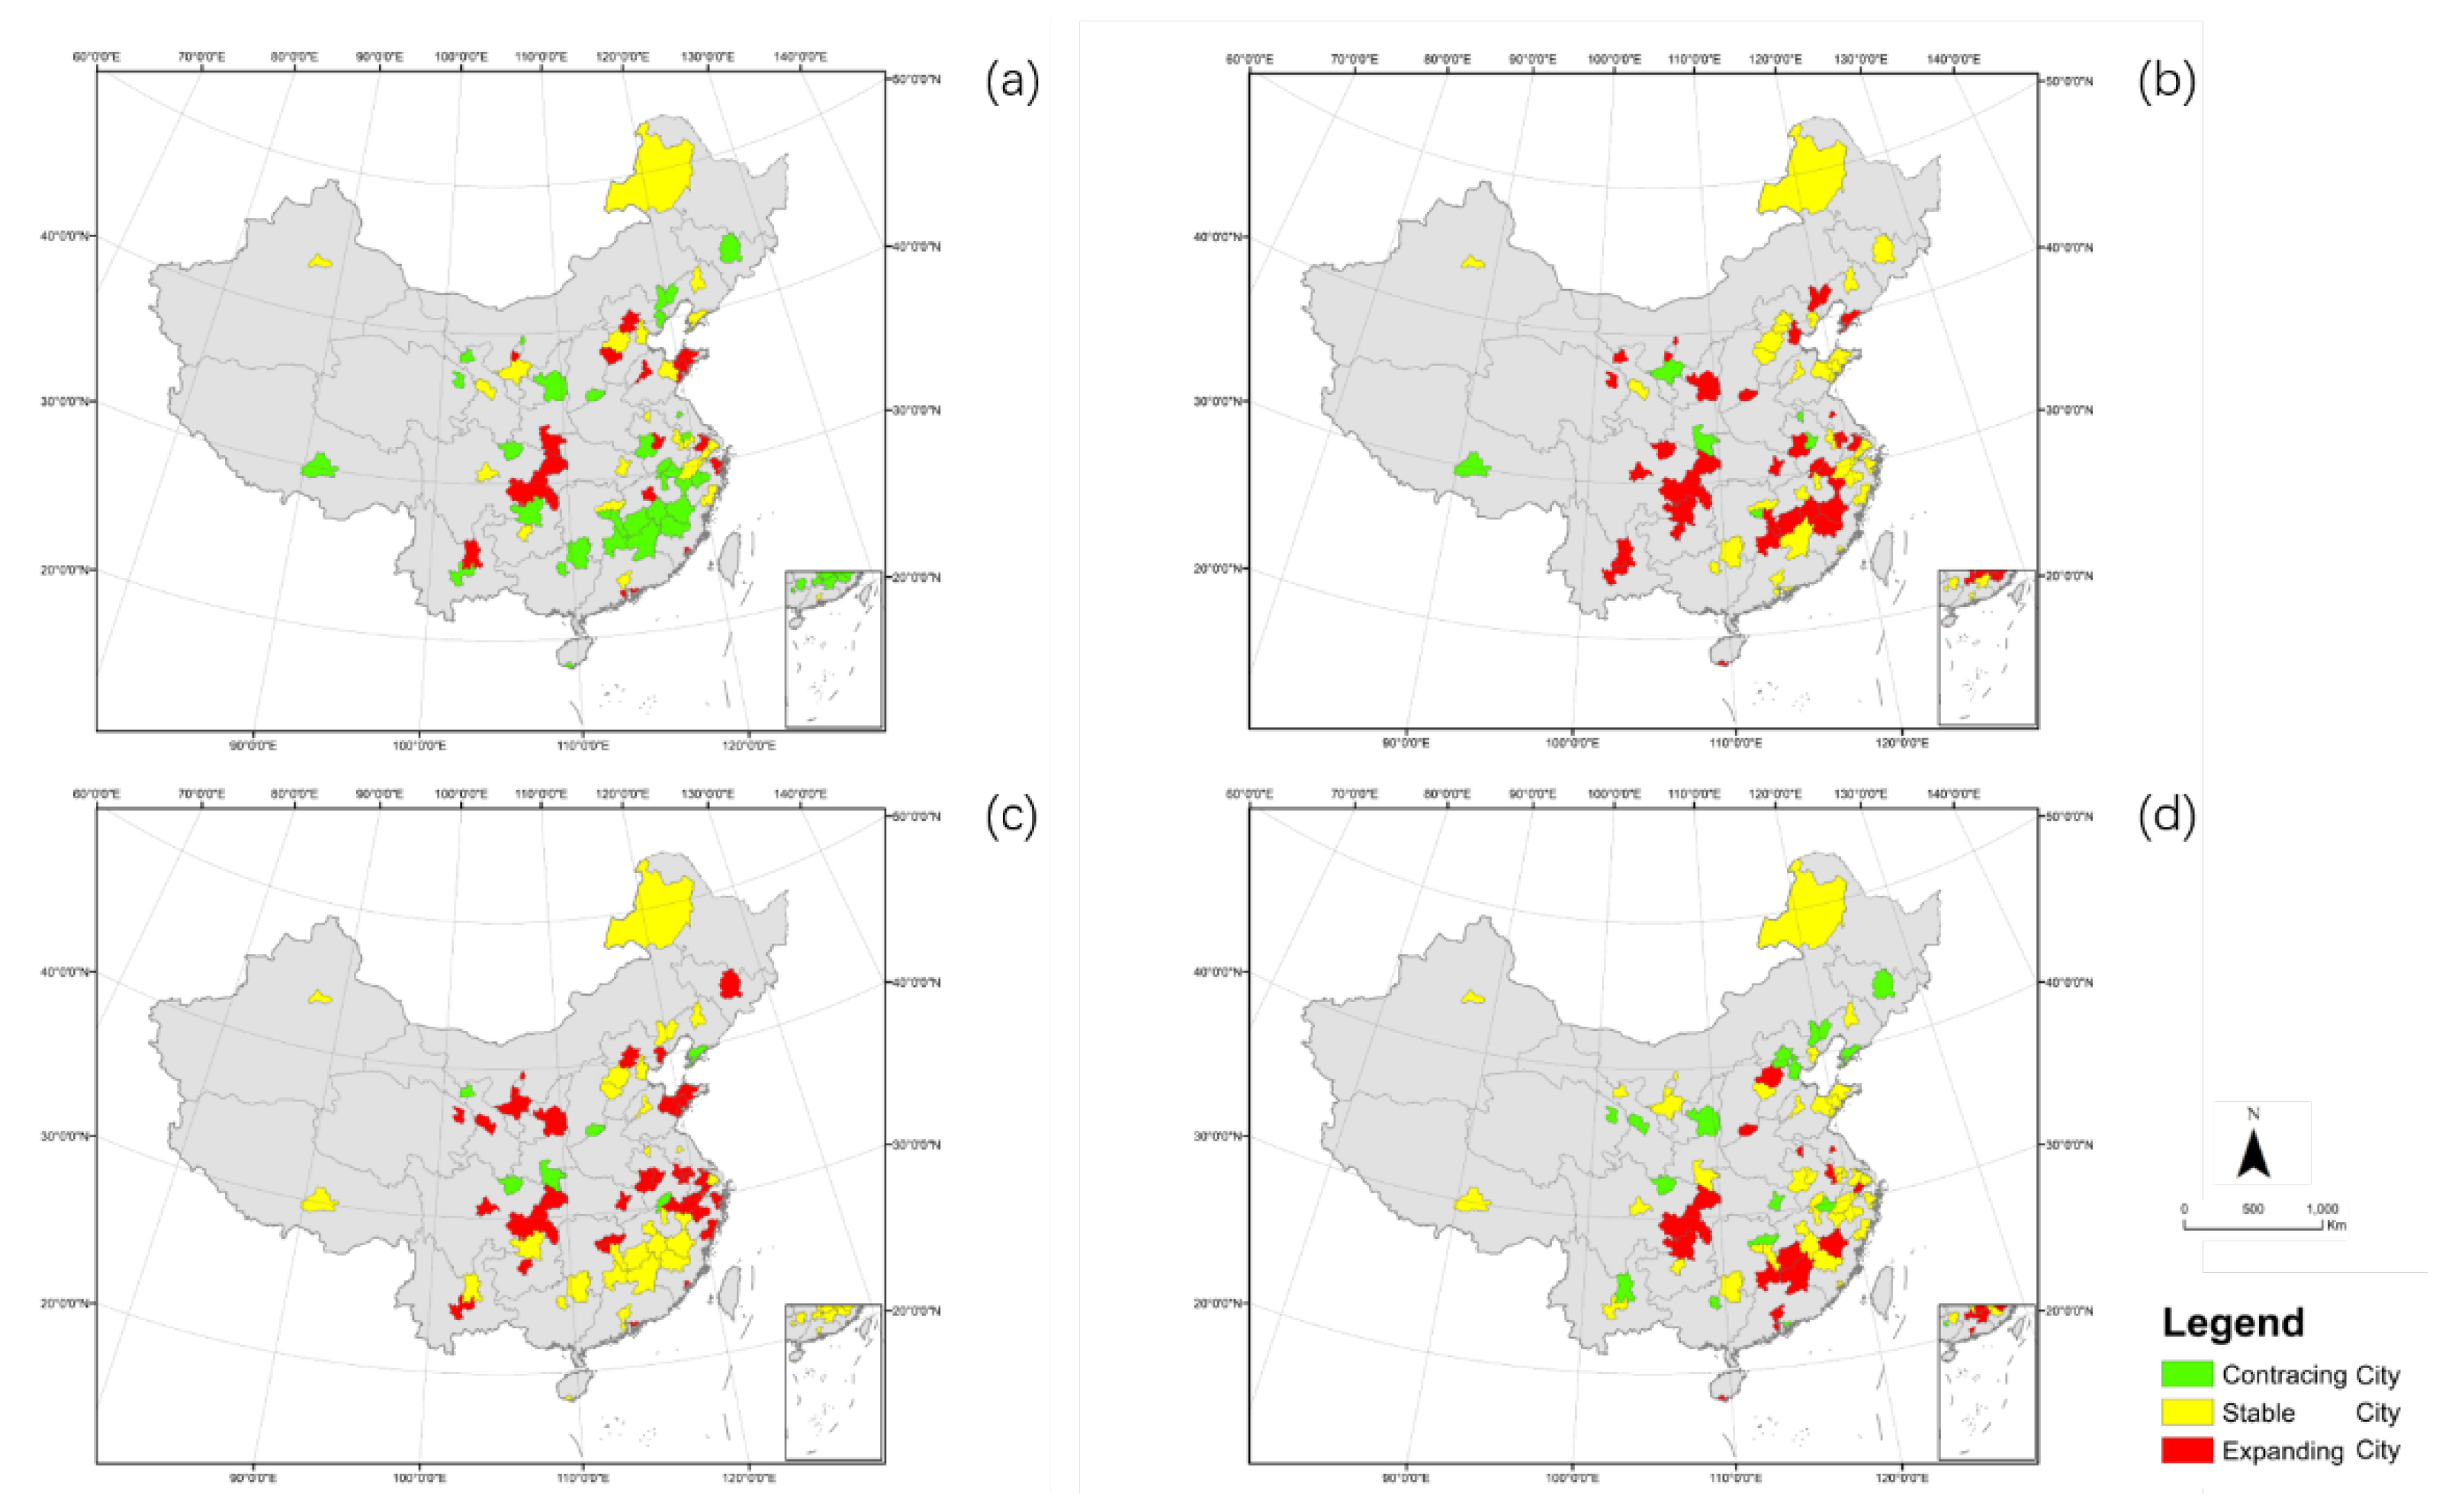
Figure 10.
Changes of economy subsystem in four periods (a)2002-2006;(b)2007-2011;(c)2012-2016; (d)2017-2021.
Figure 10.
Changes of economy subsystem in four periods (a)2002-2006;(b)2007-2011;(c)2012-2016; (d)2017-2021.
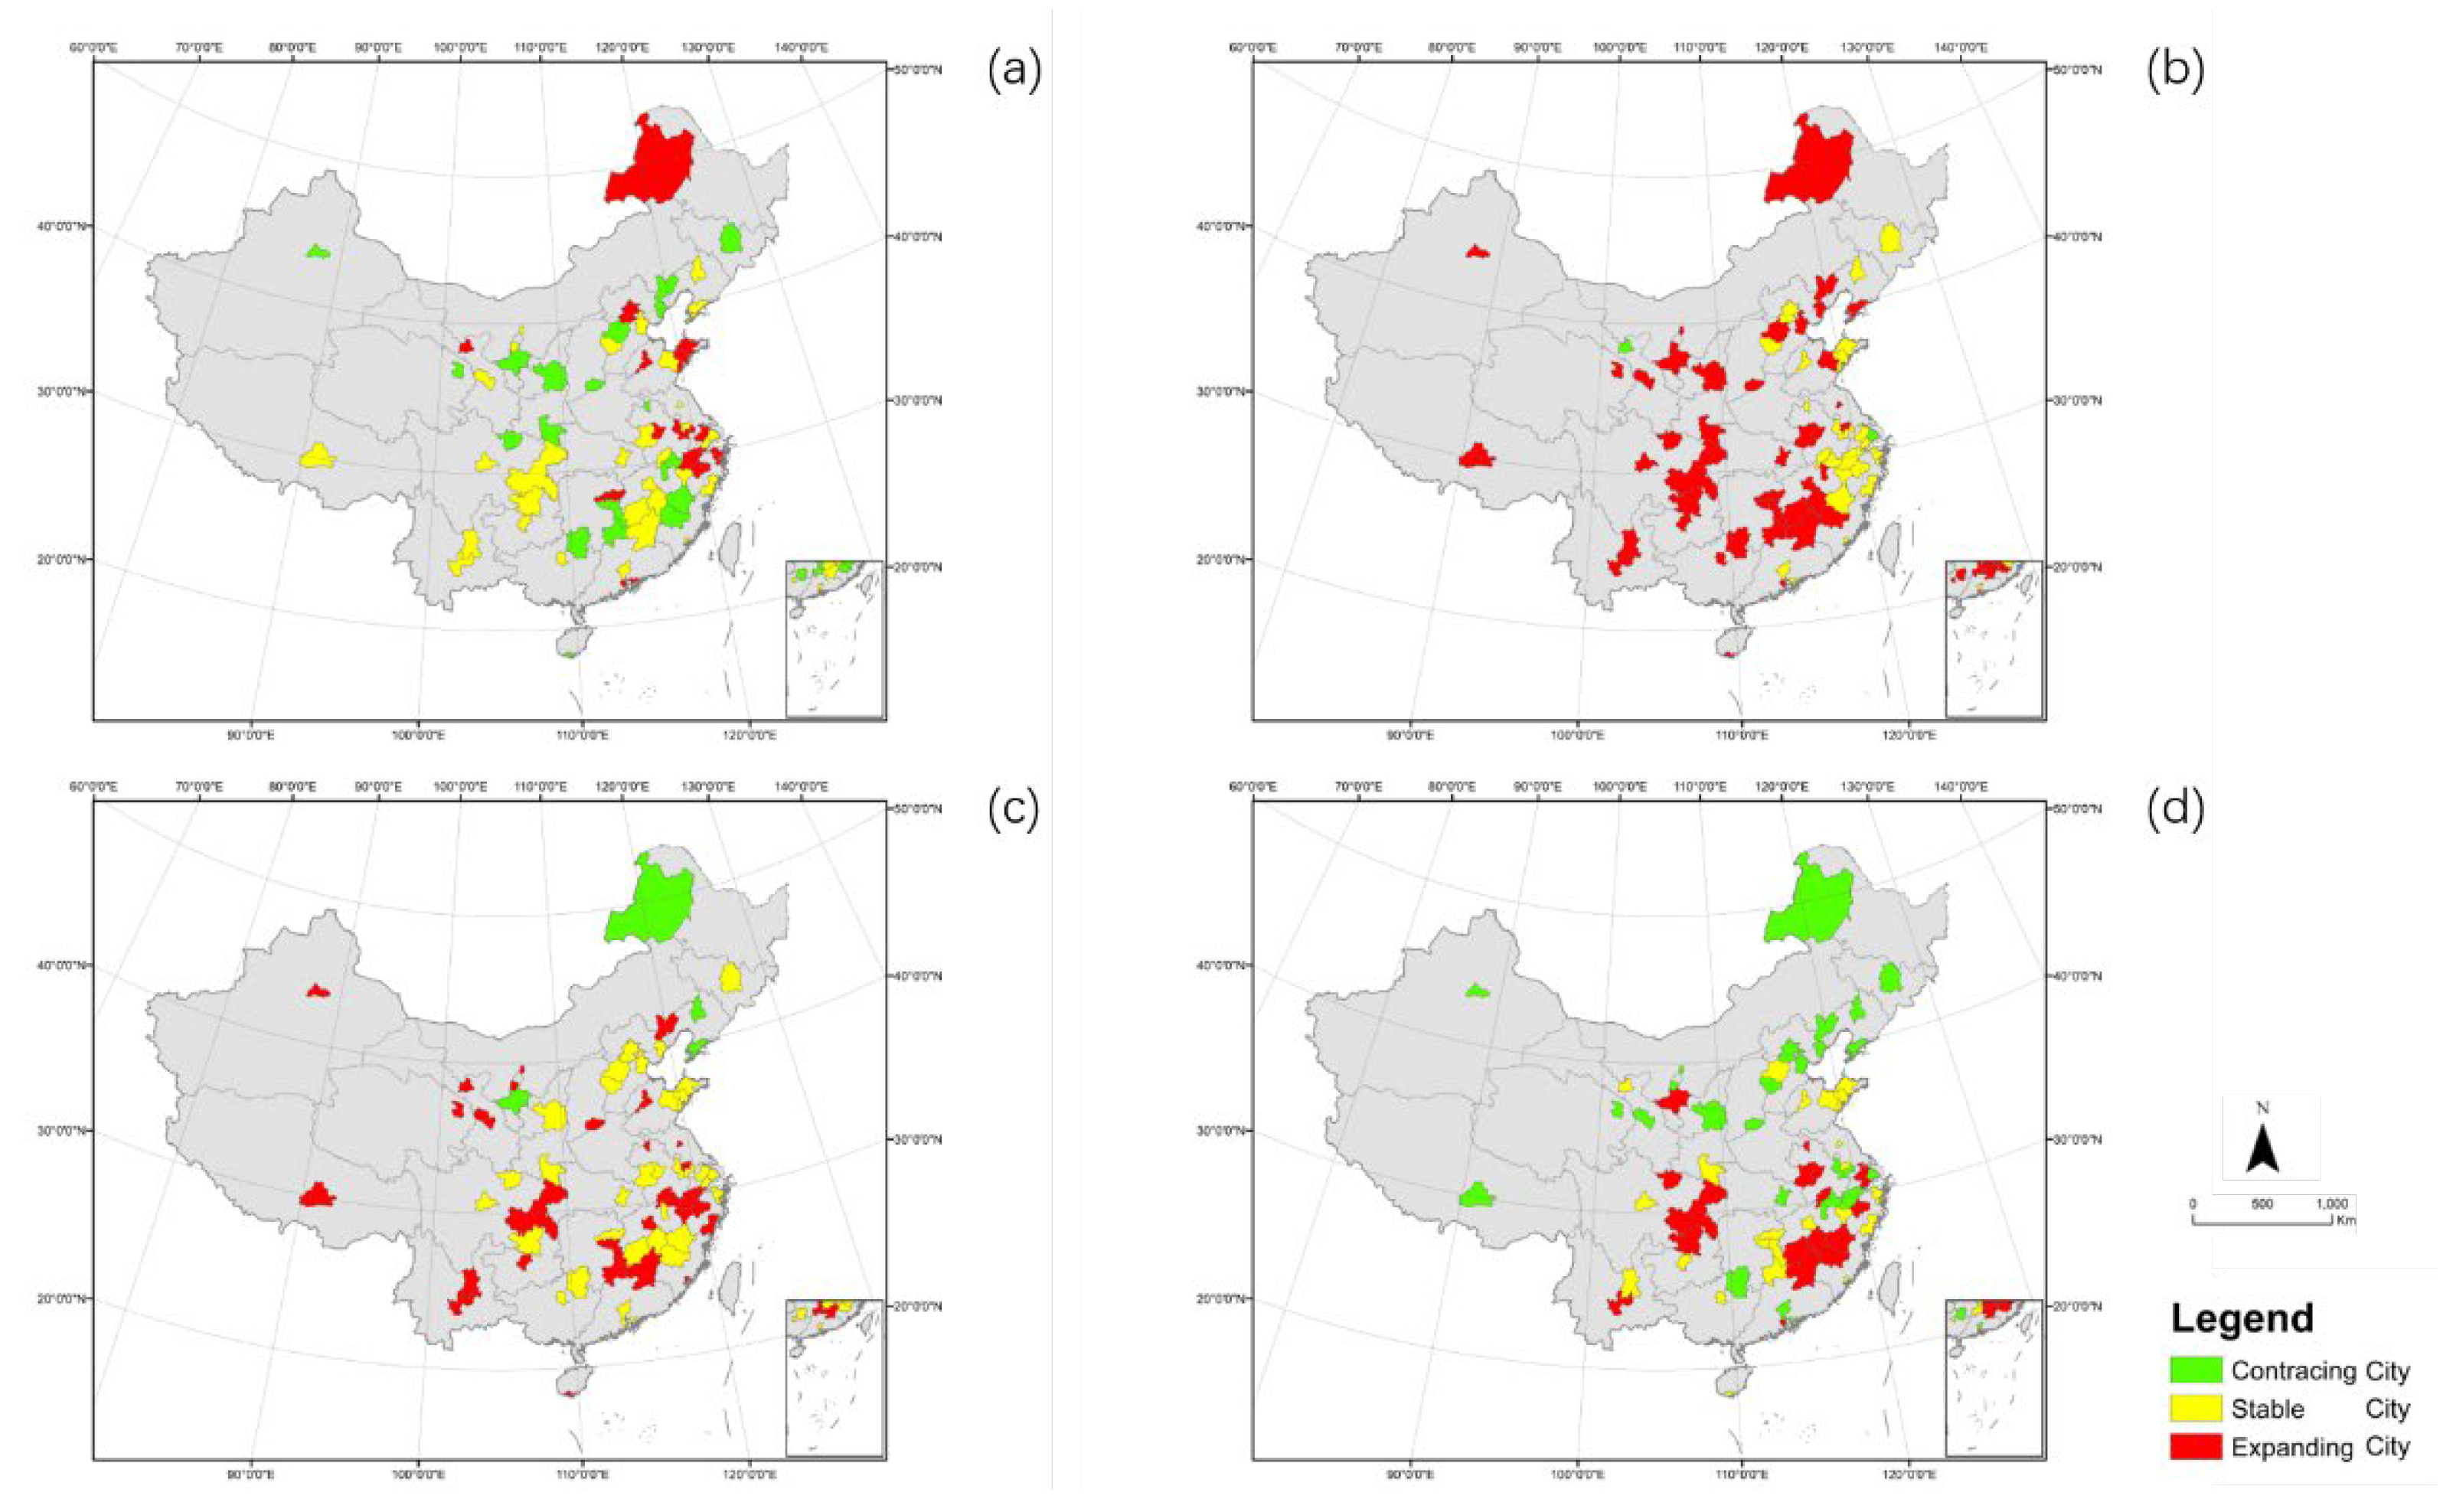
Figure 11.
Changes of construction subsystem in four periods (a)2002-2006;(b)2007-2011;(c)2012-2016; (d)2017-2021.
Figure 11.
Changes of construction subsystem in four periods (a)2002-2006;(b)2007-2011;(c)2012-2016; (d)2017-2021.
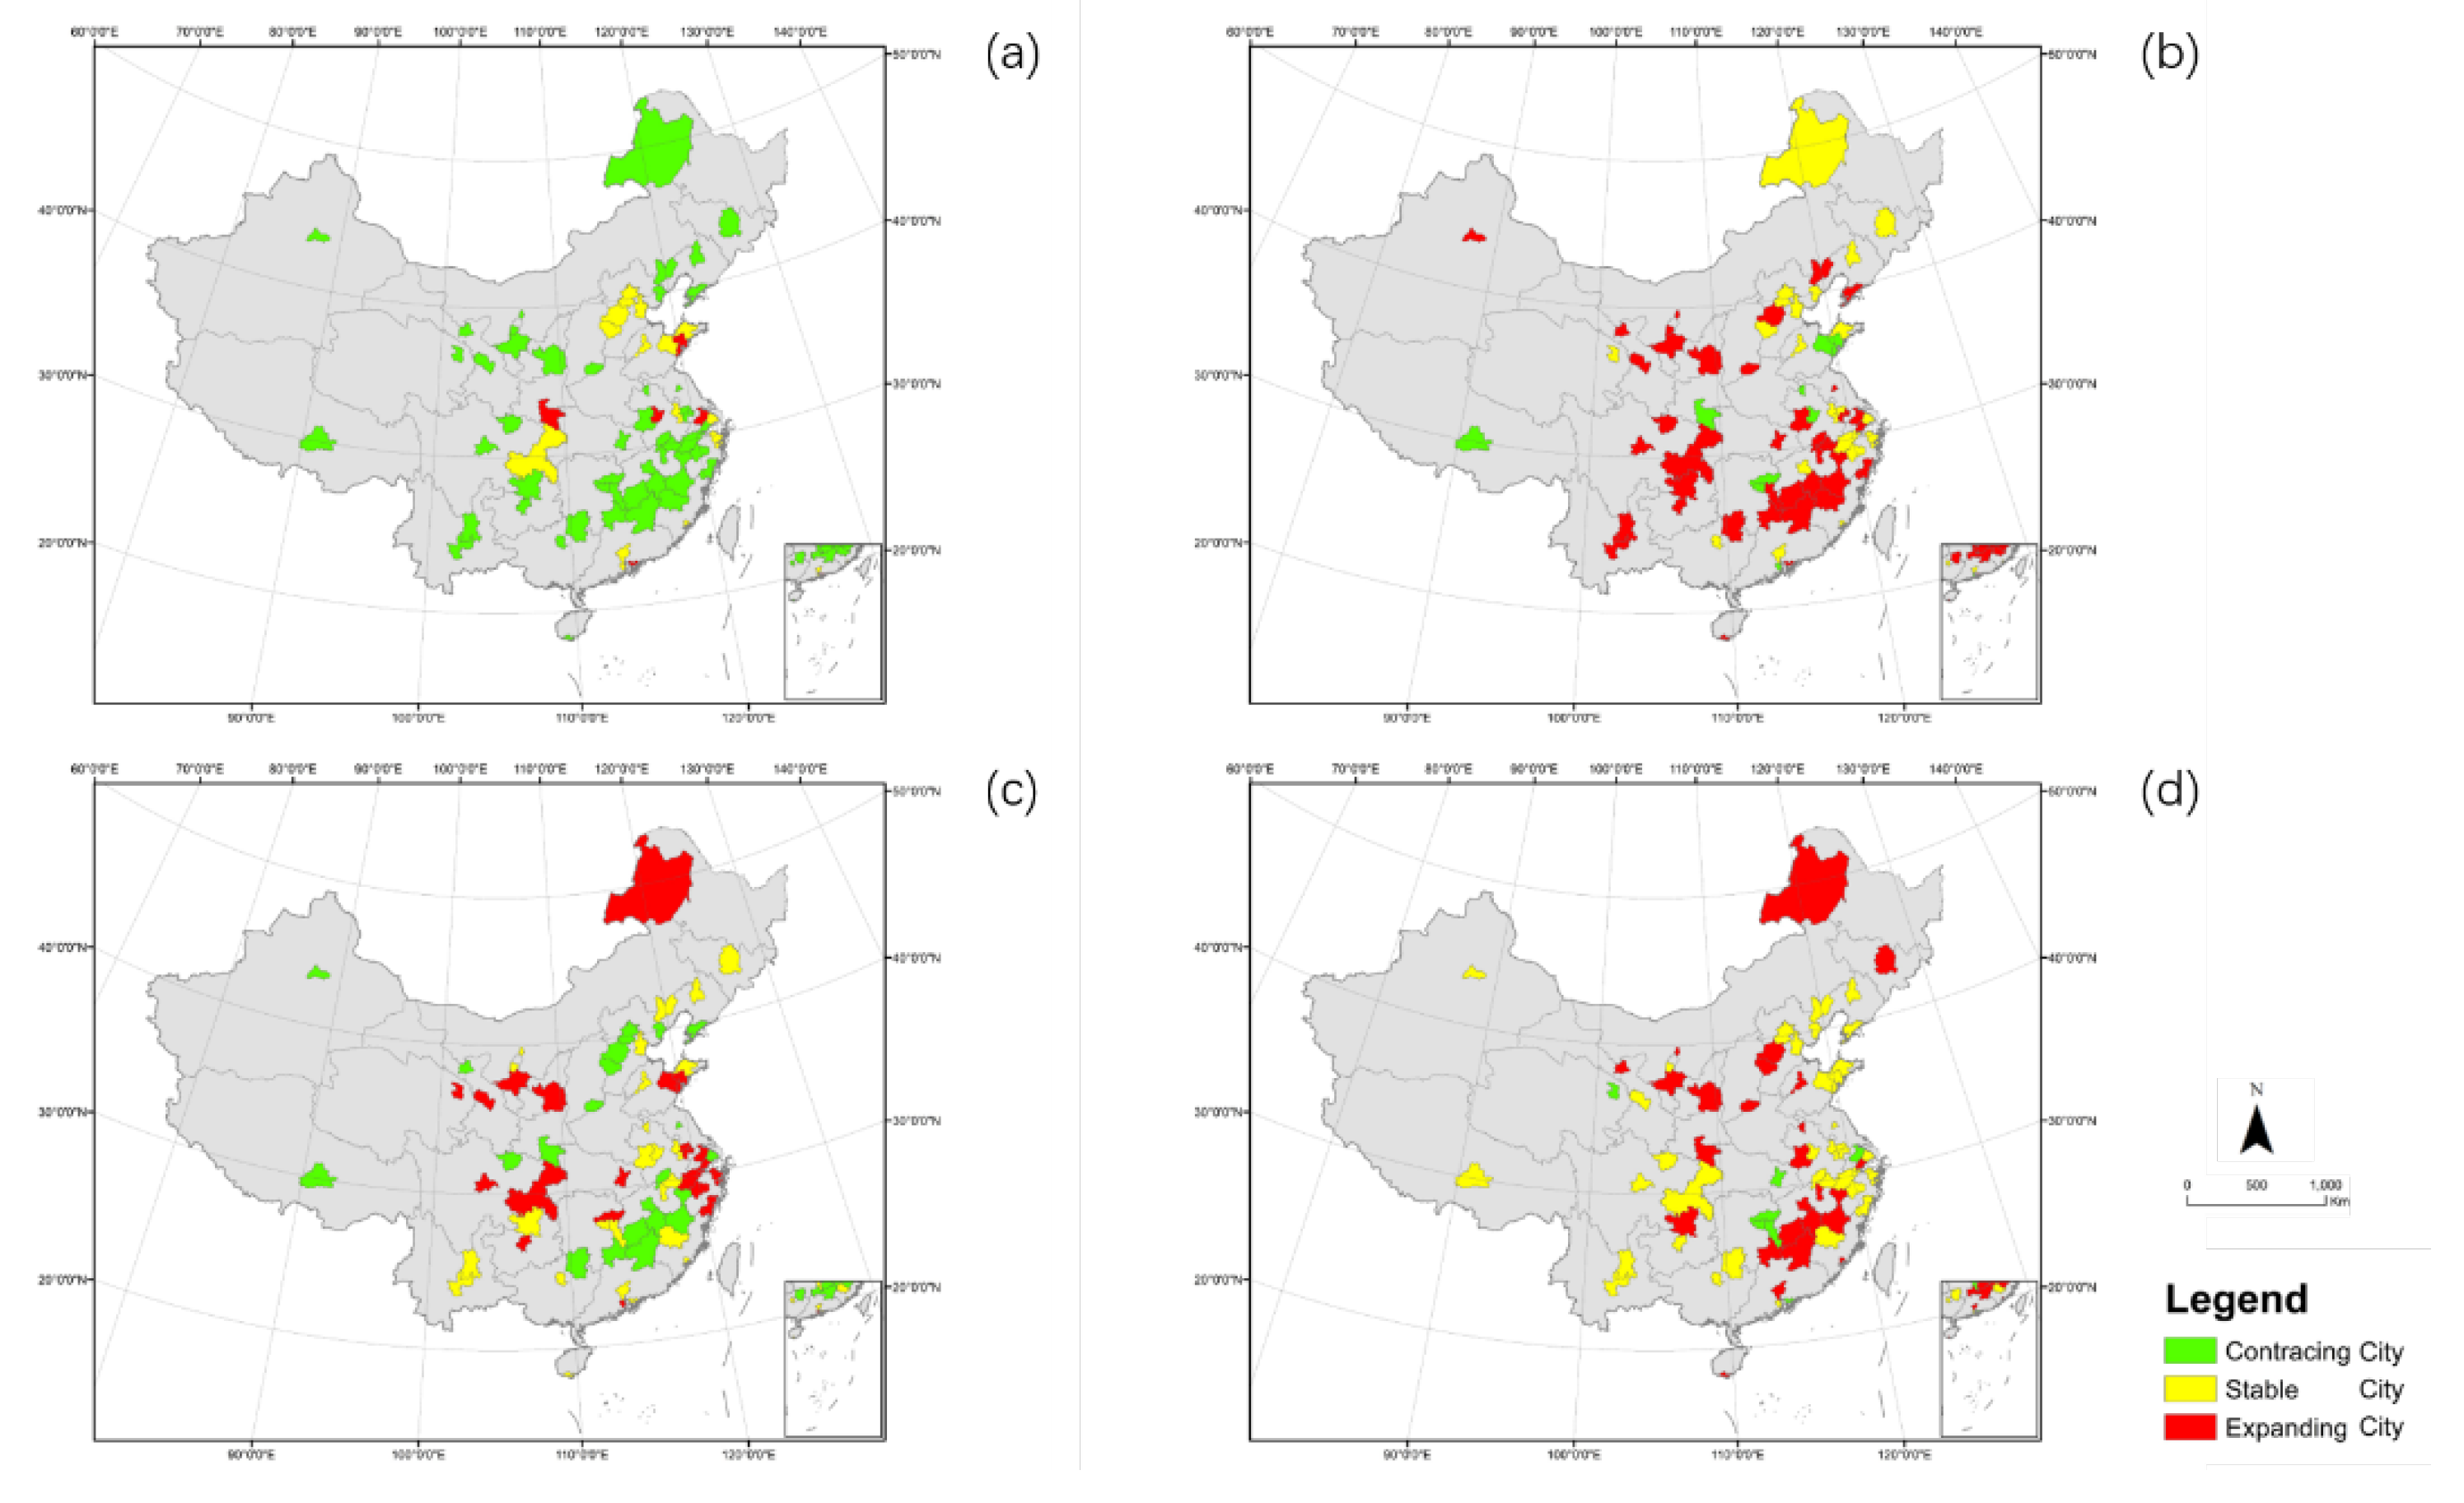
Figure 12.
Changes of society subsystem in four periods (a)2002-2006;(b)2007-2011;(c)2012-2016; (d)2017-2021.
Figure 12.
Changes of society subsystem in four periods (a)2002-2006;(b)2007-2011;(c)2012-2016; (d)2017-2021.
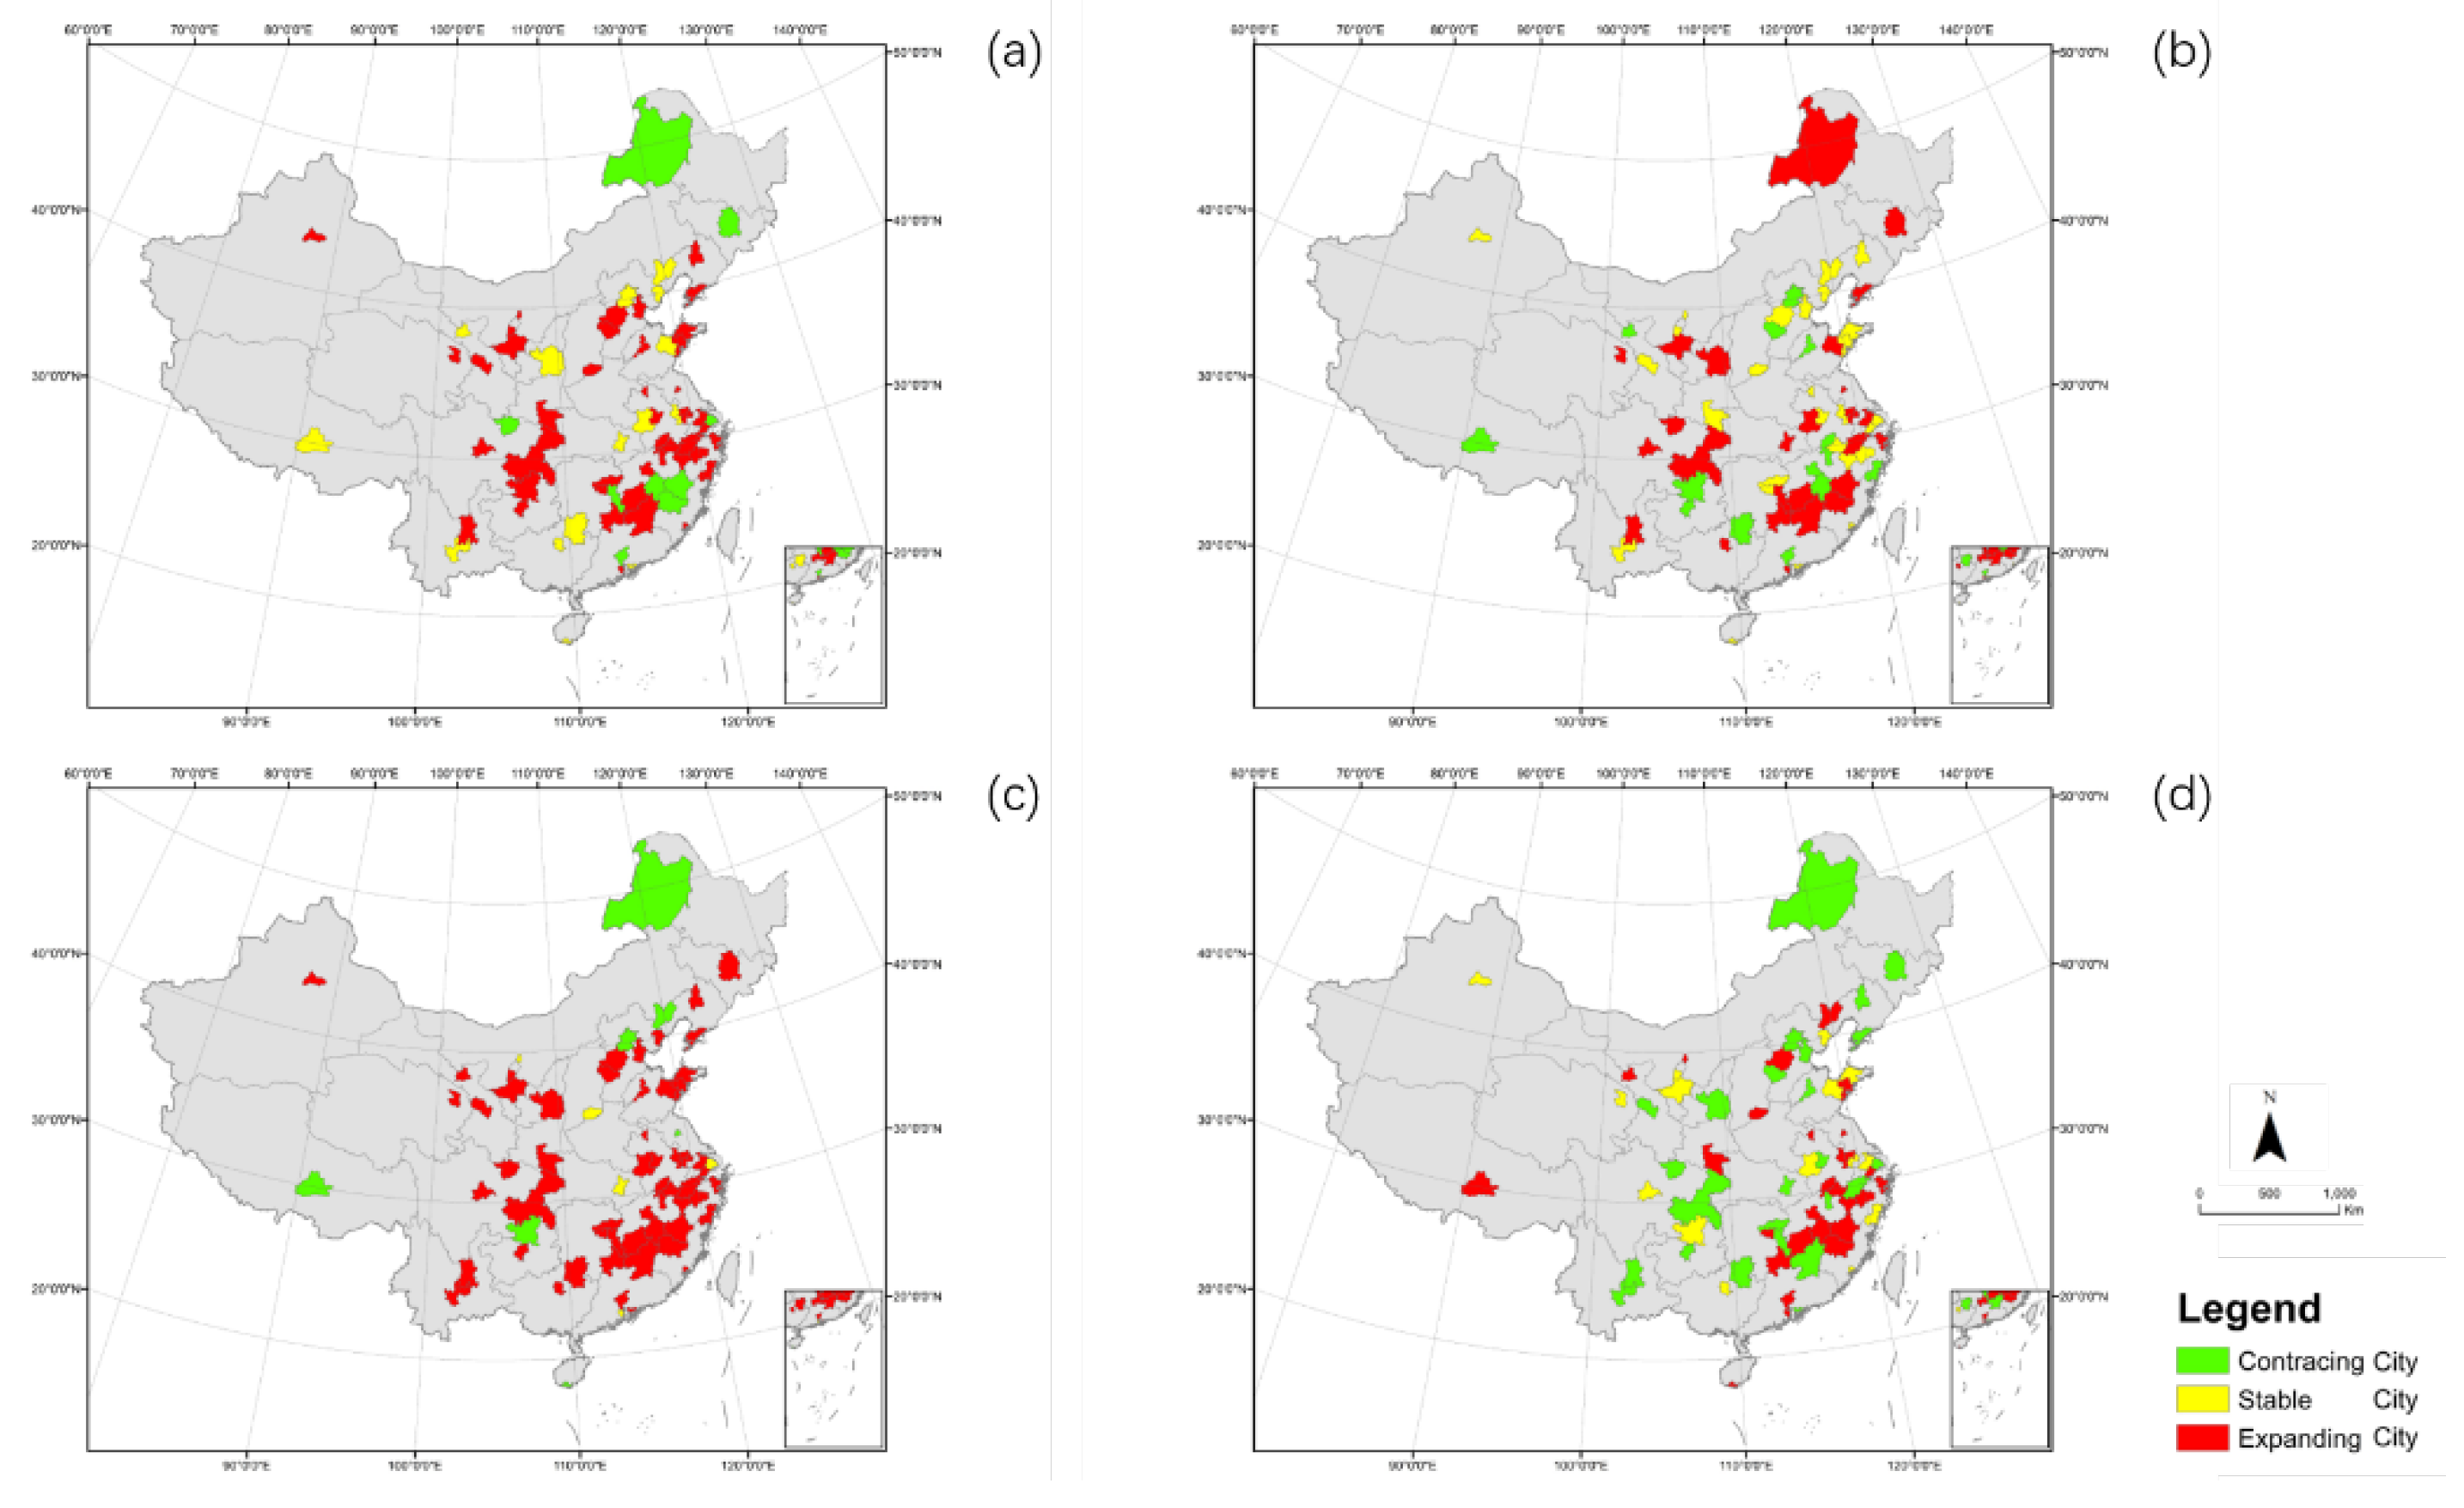
Figure 13.
Comparison of predictive value and true value.
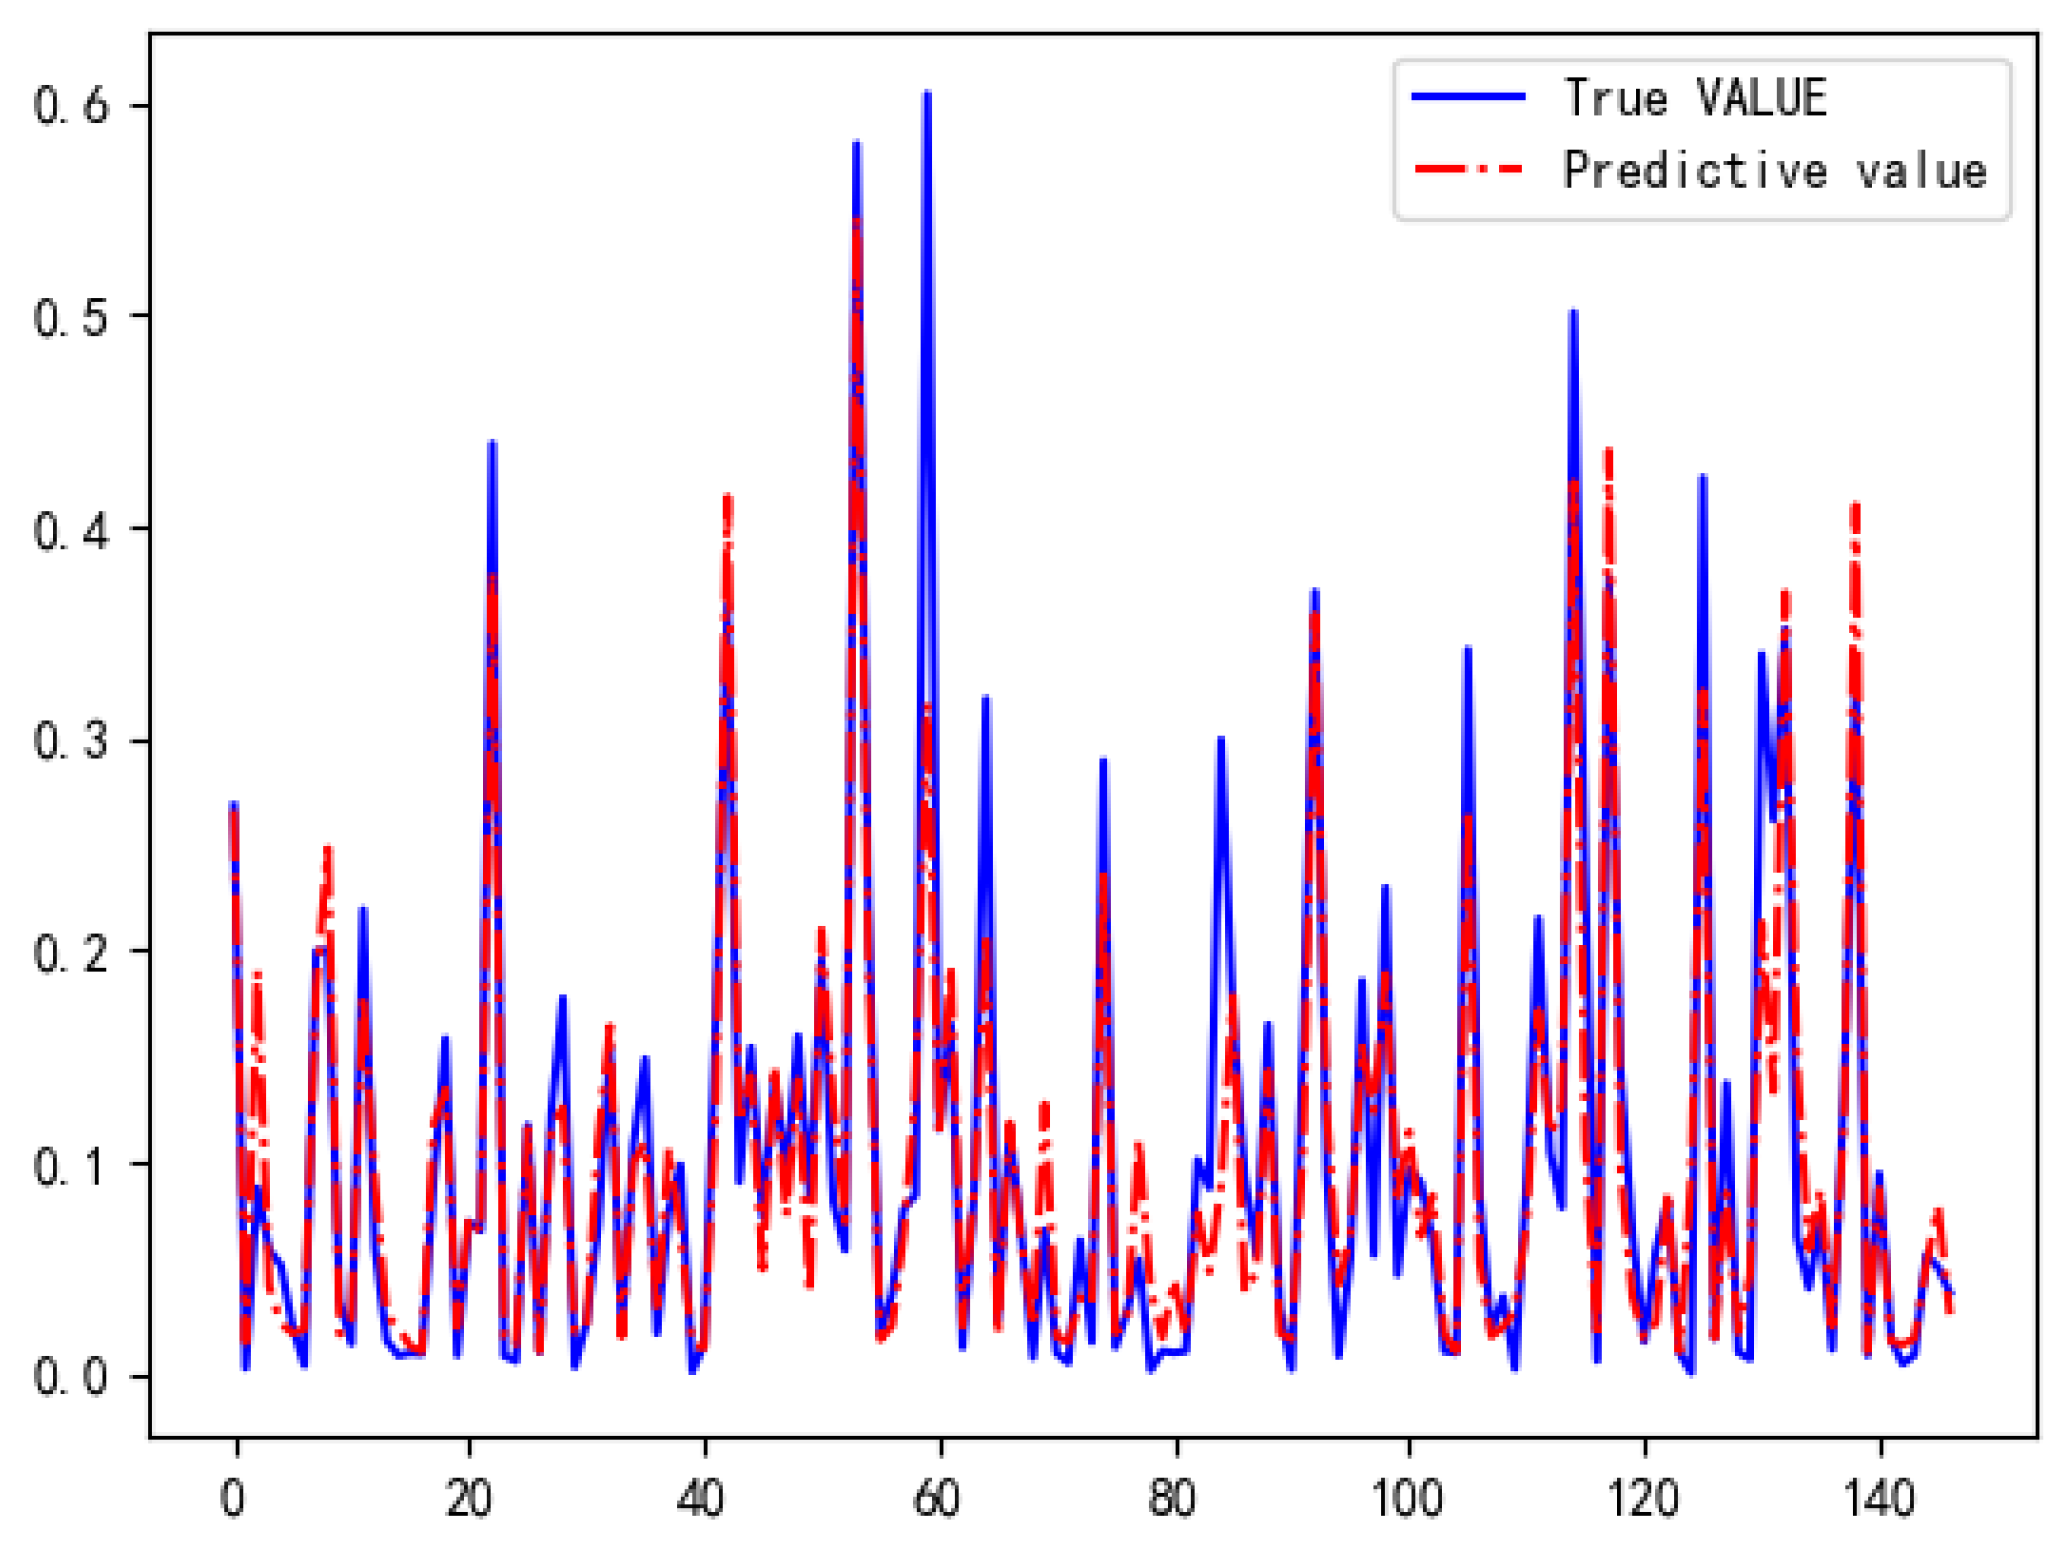
Figure 14.
The contribution value of subsystems to carbon emissions.
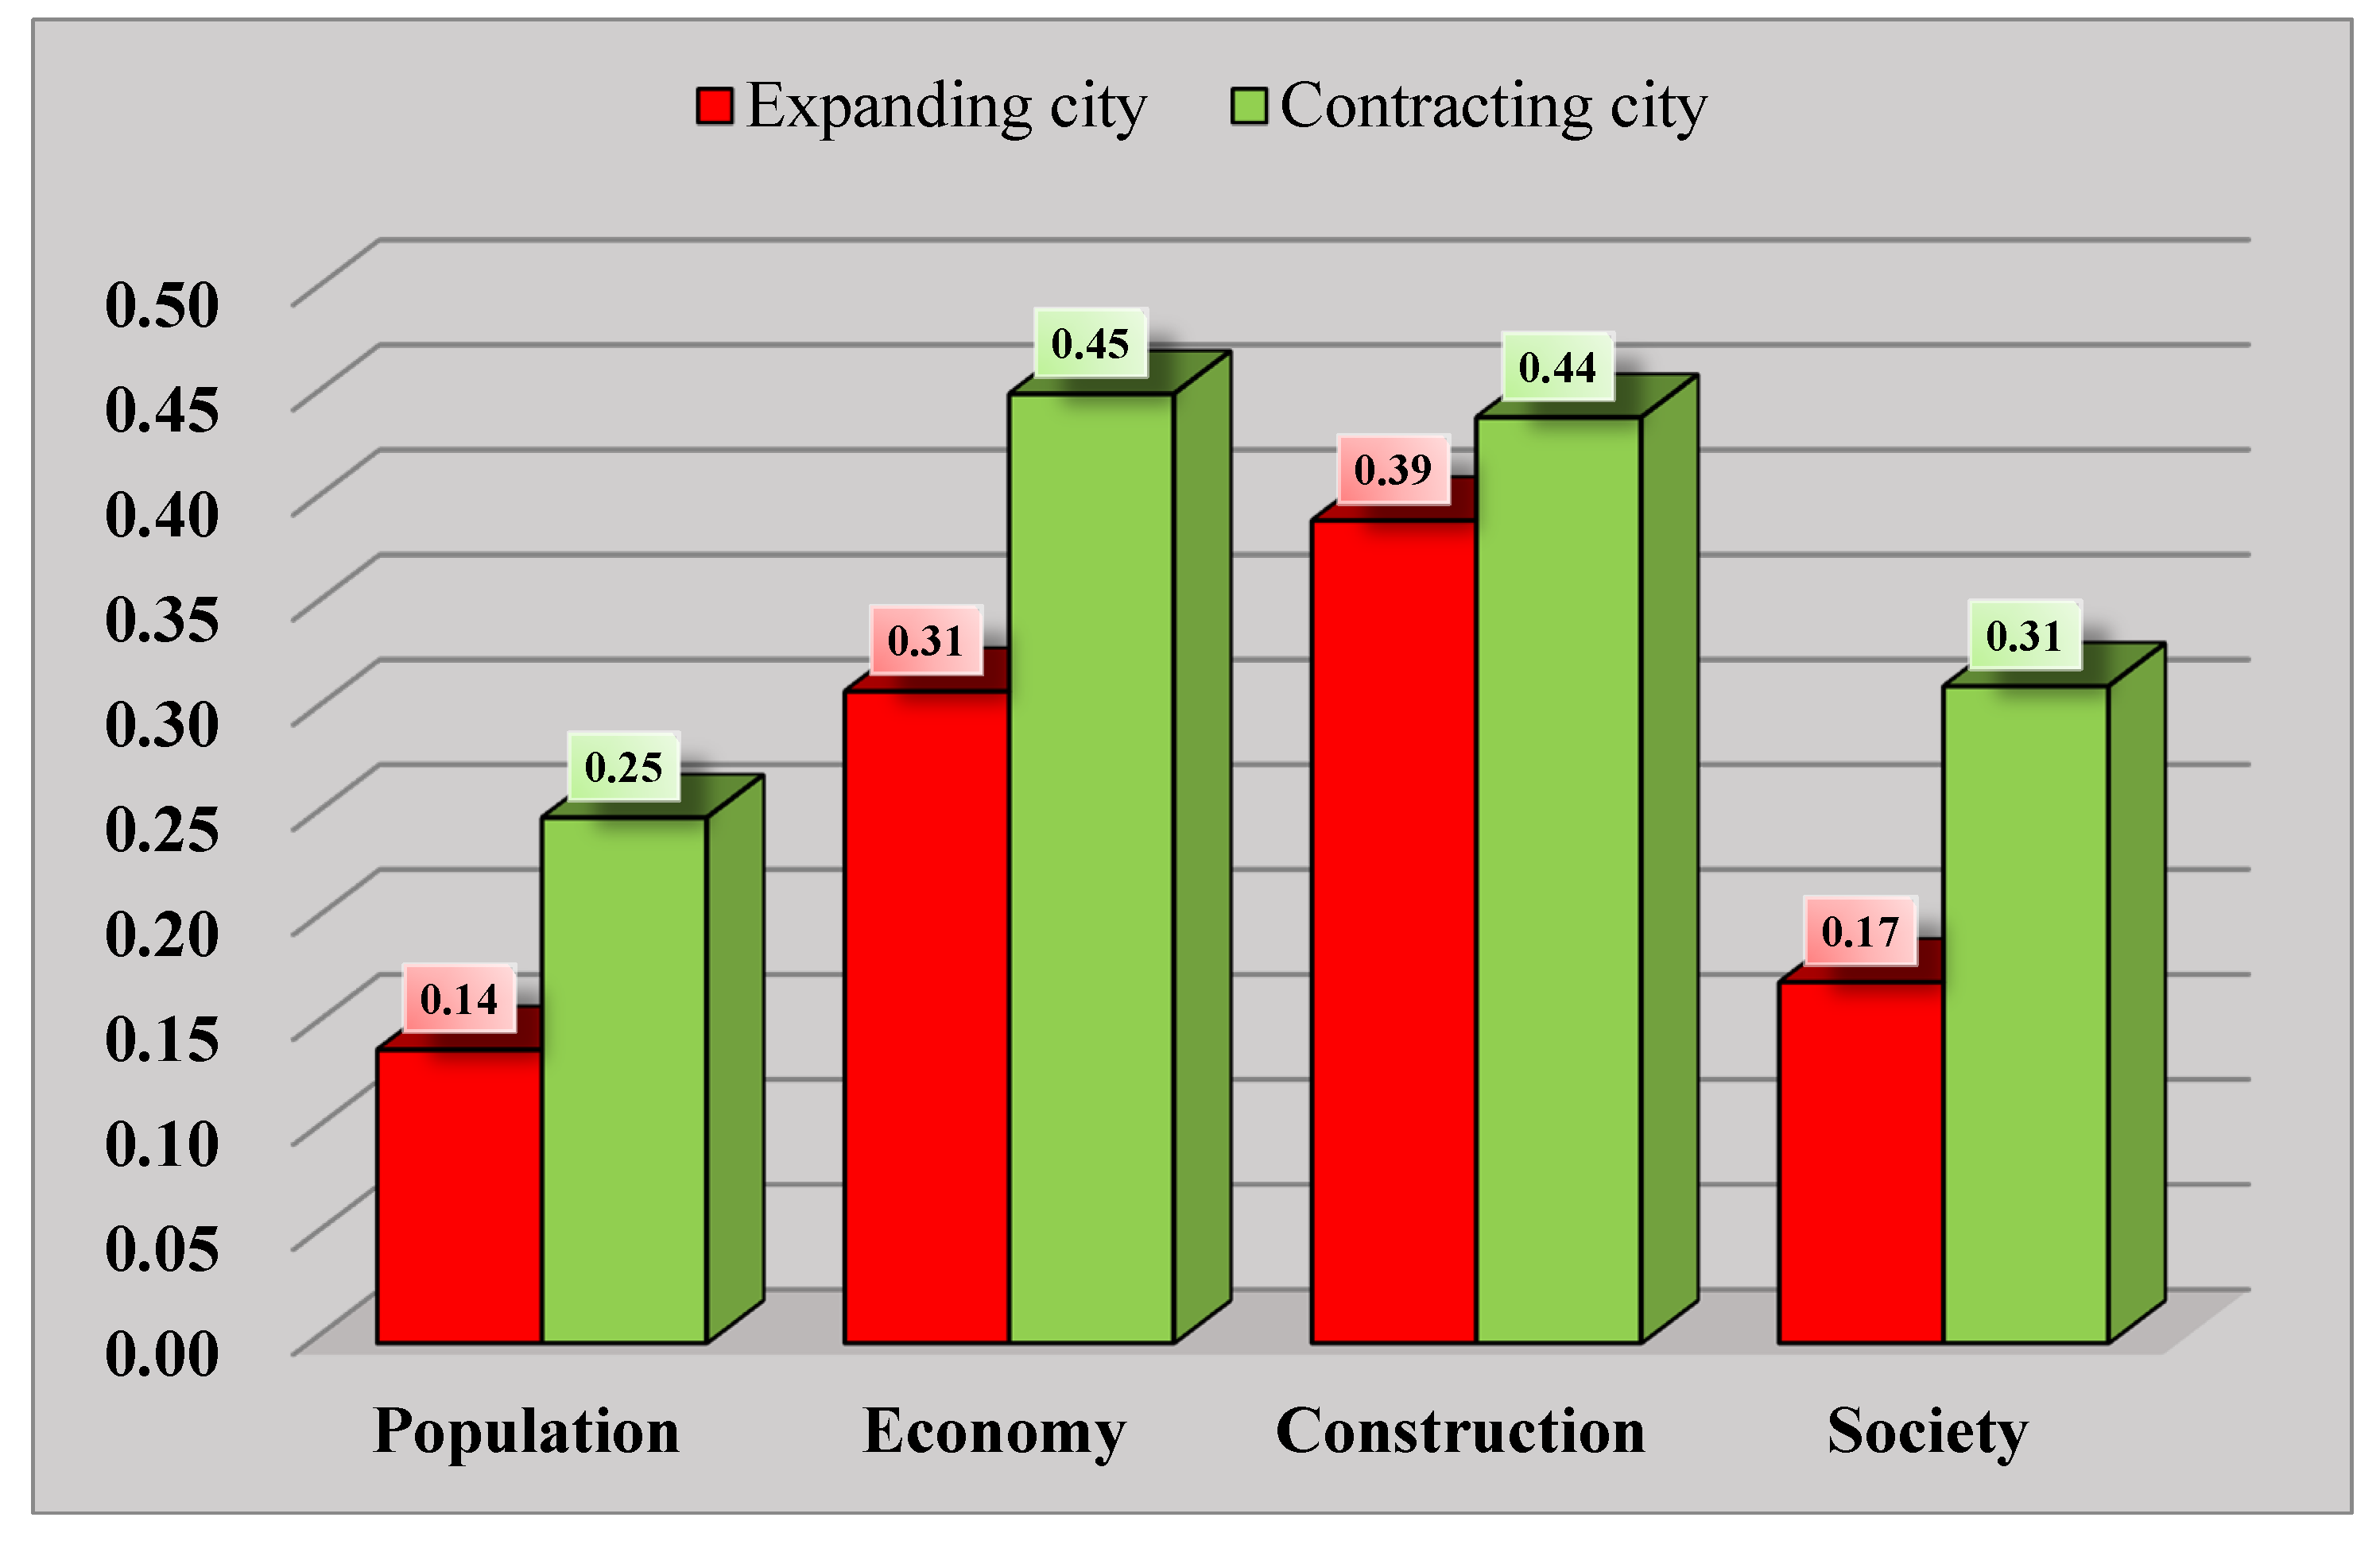
Table 1.
The establishment of urban development evaluation system.
| Method | Step | Formula | Meaning |
|---|---|---|---|
| Min-Max Normalization |
is the standardized data for city year. andis the minimum and maximum values in the data of 68 cities in year t. |
||
| Information Entropy Method | The proportion of city indicatorto all cities |
is the standardized data for city indicator . is the weight of indicator in city . is the entropy value of indicator . is the number of sample cities. is the number of indicators. is the score of city. |
|
| Entropy value of indicator | |||
| Information utility value of the entropy value of indicator | |||
| Weight of indicator | |||
| Score for the development of city | |||
| Urban development change rate |
is the change rate of period in city. and are the scores of city in the early and late stages of period . |
Table 2.
Calculation for mutual correction, continuity correction and interannual correction.
| Step | Formula | Meaning | |
|---|---|---|---|
| Mutual correction |
is the DN value of the pixel to be corrected. is the DN value of the pixel after correction are the parameters obtained from quadratic regression |
||
| Continuity correction |
is the DN value of pixel in the corrected image of year . and are the DN value of pixel in the original image acquired by different sensors in the year . |
||
| Interannual correction | ,,are the DN value of pixel of the original data from the same year’s image after mutual correction and continuity correction in the years | ||
Table 4.
Evaluation of the precision of urban area extraction results.
| Number | City | Time | Overall accuracy | The Kappa coefficient |
|---|---|---|---|---|
| (a) | Chengdu | 2010 | 89.51% | 0.81 |
| 2020 | 86.84% | 0.82 | ||
| (b) | Chongqing | 2010 | 98.40% | 0.75 |
| 2020 | 97.38% | 0.83 | ||
| (c) | Beijing | 2010 | 89.16% | 0.91 |
| 2020 | 88.68% | 0.94 | ||
| (d) | Shanghai | 2010 | 82.33% | 0.89 |
| 2020 | 72.46% | 0.60 | ||
| (e) | Hangzhou | 2010 | 91.86% | 0.66 |
| 2020 | 93.57% | 0.93 | ||
| (f) | Tianjin | 2010 | 84.79% | 0.72 |
| 2020 | 85.59% | 0.87 | ||
| (g) | Guangzhou | 2010 | 89.01% | 0.94 |
| 2020 | 75.82% | 0.76 | ||
| (h) | Xiamen | 2010 | 77.11% | 0.61 |
| 2020 | 69.75% | 0.69 | ||
| (i) | Suzhou | 2010 | 78.64% | 0.64 |
| 2020 | 82.79% | 0.89 | ||
| (j) | Wuhan | 2010 | 93.01% | 0.85 |
| 2020 | 82.65% | 0.73 |
Table 5.
The number of cities with different development types.
| 2002-2006 | 2007-2011 | 2012-2016 | 2017-2021 | |
|---|---|---|---|---|
| Contracting City | 31 | 6 | 6 | 15 |
| Stable City | 21 | 30 | 29 | 38 |
| Expanding City | 16 | 32 | 33 | 15 |
Table 6.
The number of different types of cities divided by subsystem scores.
| 2002-2006 | 2007-2011 | 2012-2016 | 2017-2021 | ||
|---|---|---|---|---|---|
| Population $$$subsystem | Contracting City | 13 | 22 | 4 | 35 |
| Stable City | 18 | 35 | 25 | 17 | |
| Expanding City | 37 | 11 | 39 | 16 | |
| Economy$$$subsystem | Contracting City | 21 | 2 | 4 | 27 |
| Stable City | 31 | 23 | 34 | 23 | |
| Expanding City | 16 | 43 | 30 | 18 | |
| Construction$$$subsystem | Contracting City | 49 | 9 | 21 | 7 |
| Stable City | 14 | 20 | 25 | 35 | |
| Expanding City | 4 | 39 | 22 | 26 | |
| Society $$$subsystem | Contracting City | 9 | 14 | 7 | 25 |
| Stable City | 15 | 27 | 5 | 15 | |
| Expanding City | 44 | 27 | 56 | 28 |
Table 7.
Pearson correlation coefficient.
| Population | Economy | Construction | Society | |
|---|---|---|---|---|
| Correlation coefficient | 0.7703 | 0.8578 | 0.8511 | 0.7532 |
Table 8.
Results of Bayesian model.
| Parameter | Value | Measurement | Value |
|---|---|---|---|
| Max depth | 4 | R-squared | 0.8403 |
| Number of estimators | 275 | MSE | 0.0023 |
| Learning rate | 0.02 | Explained variance | 0.8425 |
| MAE | 0.0296 |
Disclaimer/Publisher’s Note: The statements, opinions and data contained in all publications are solely those of the individual author(s) and contributor(s) and not of MDPI and/or the editor(s). MDPI and/or the editor(s) disclaim responsibility for any injury to people or property resulting from any ideas, methods, instructions or products referred to in the content. |
© 2024 by the authors. Licensee MDPI, Basel, Switzerland. This article is an open access article distributed under the terms and conditions of the Creative Commons Attribution (CC BY) license (http://creativecommons.org/licenses/by/4.0/).
Copyright: This open access article is published under a Creative Commons CC BY 4.0 license, which permit the free download, distribution, and reuse, provided that the author and preprint are cited in any reuse.


