Preprint
Review

This version is not peer-reviewed.

Feature of Nonlinear Electromagnetic Properties and Local Atomic Structure of Metals in two Systems of Nanocomposites Cox(MgF2)100-x and (CoFeZr)x(MgF2)100-x

Submitted:

03 January 2025

Posted:

06 January 2025

You are already at the latest version

Abstract

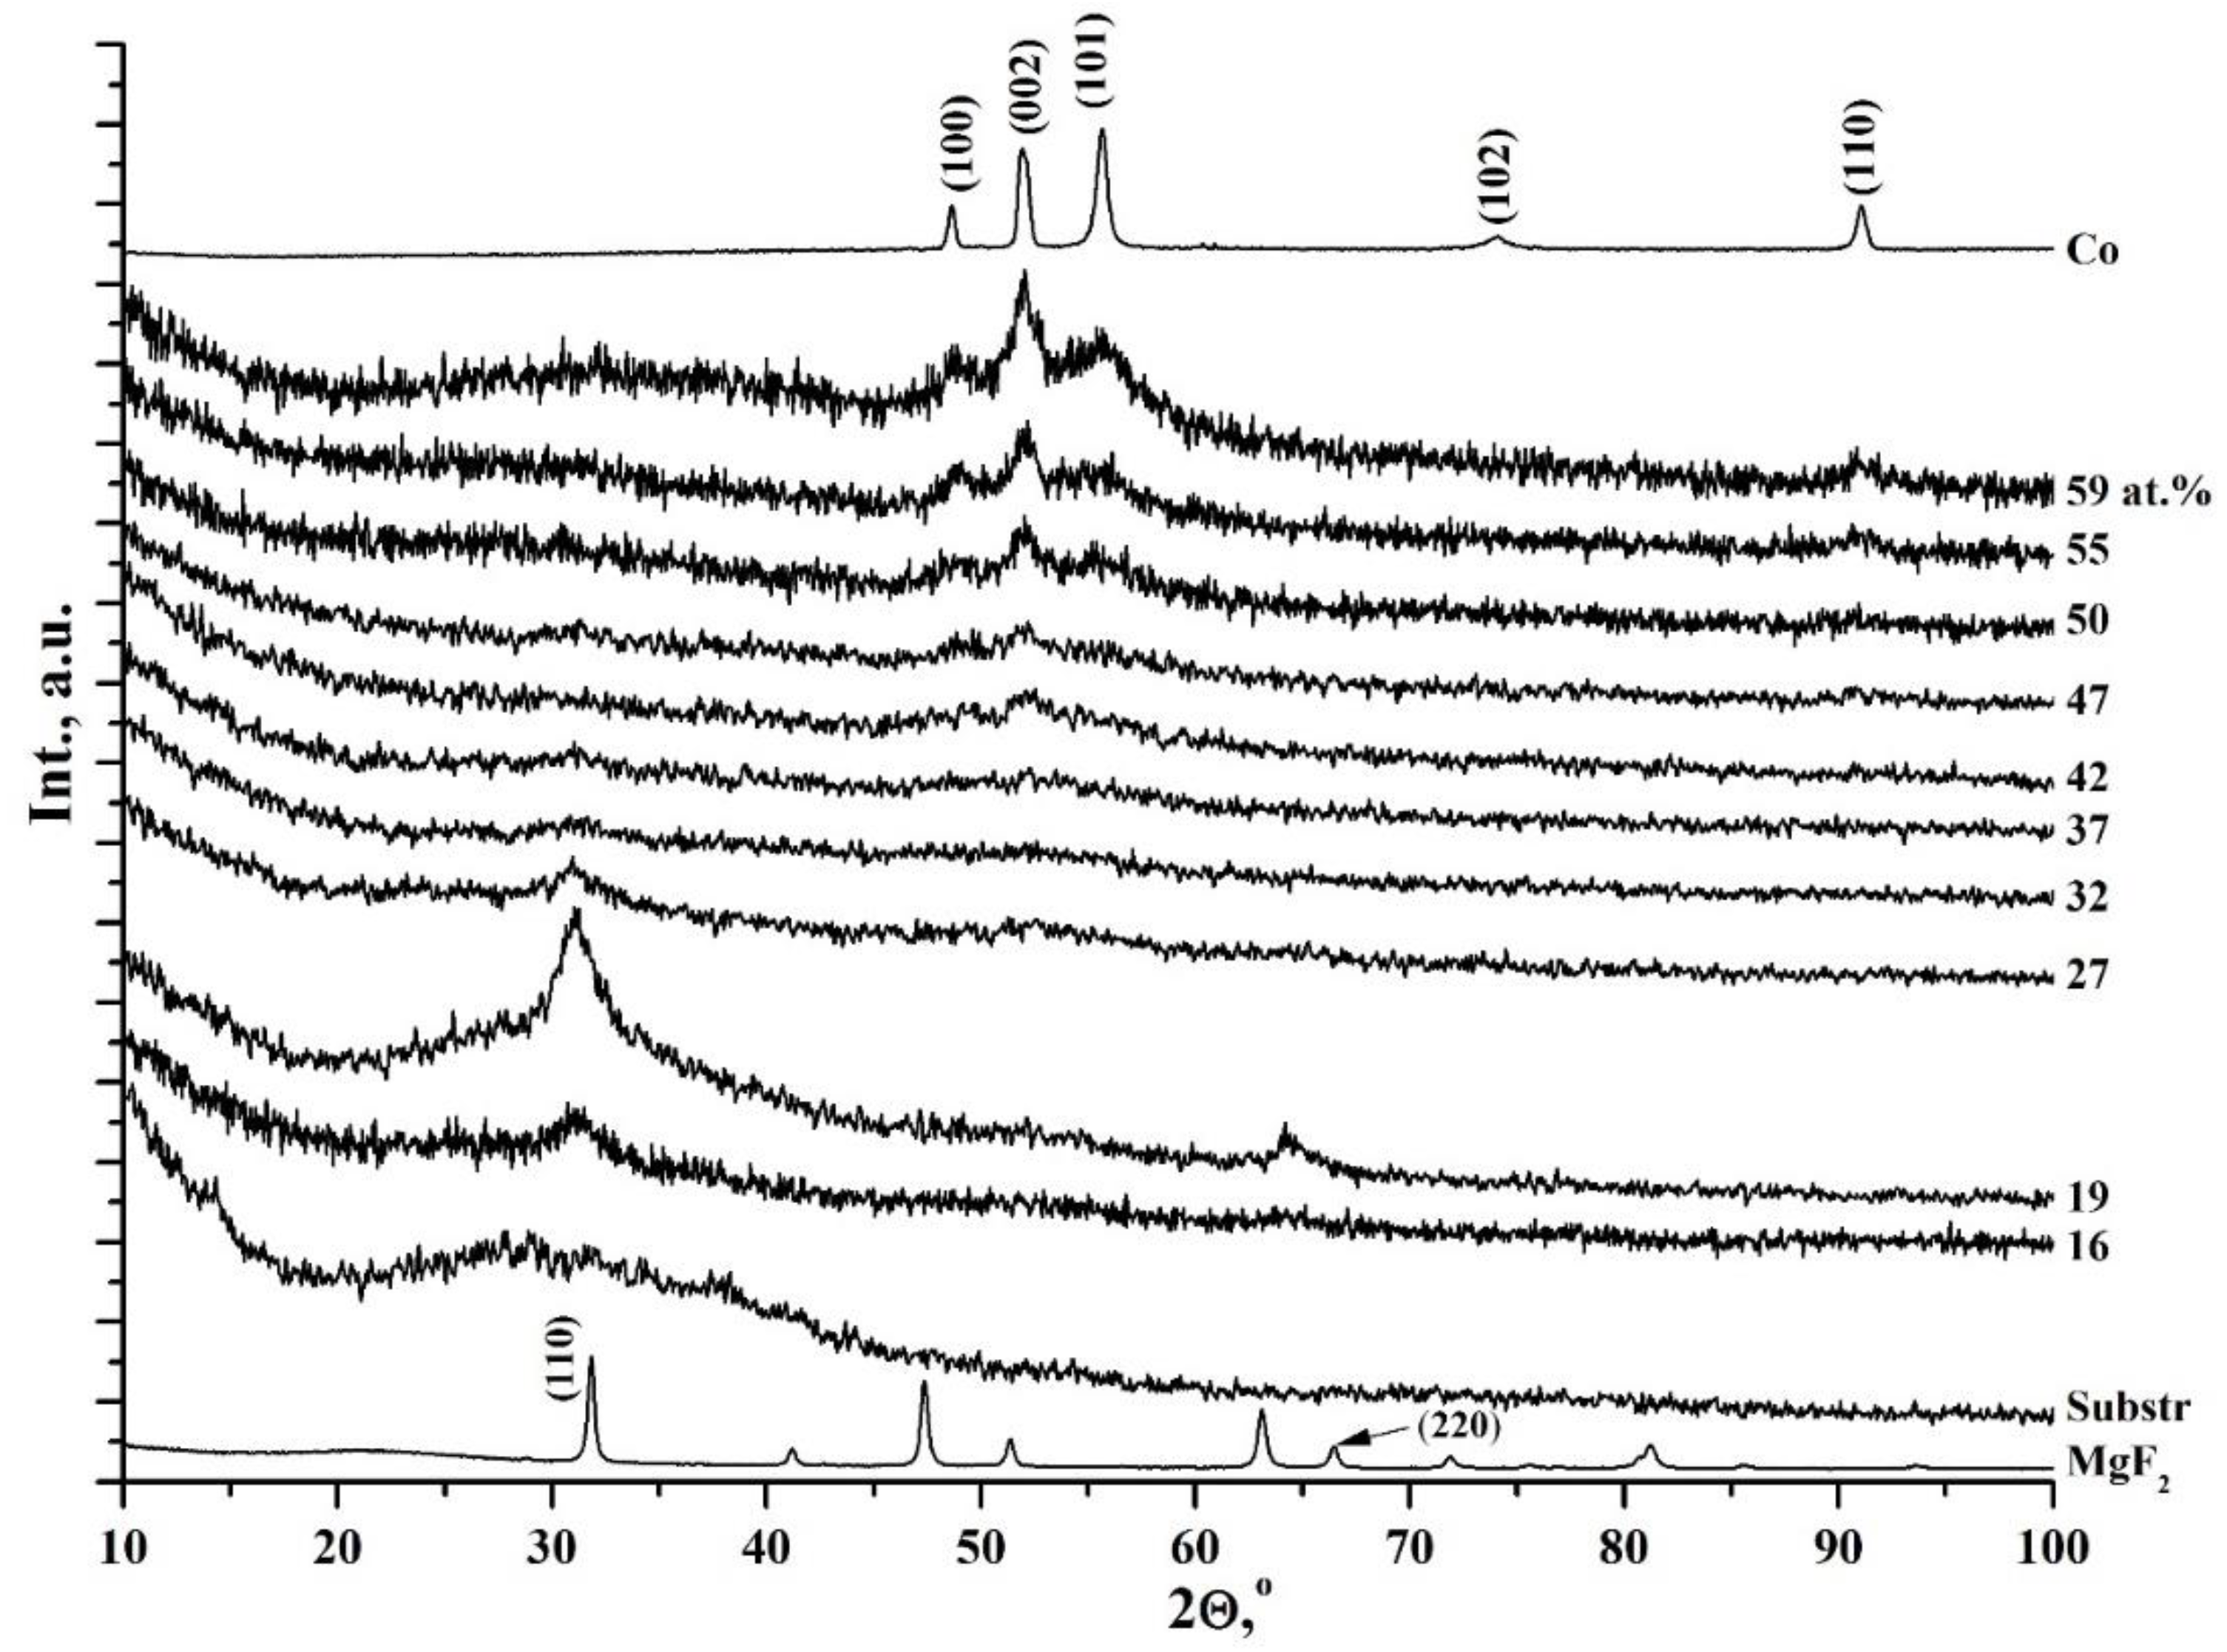
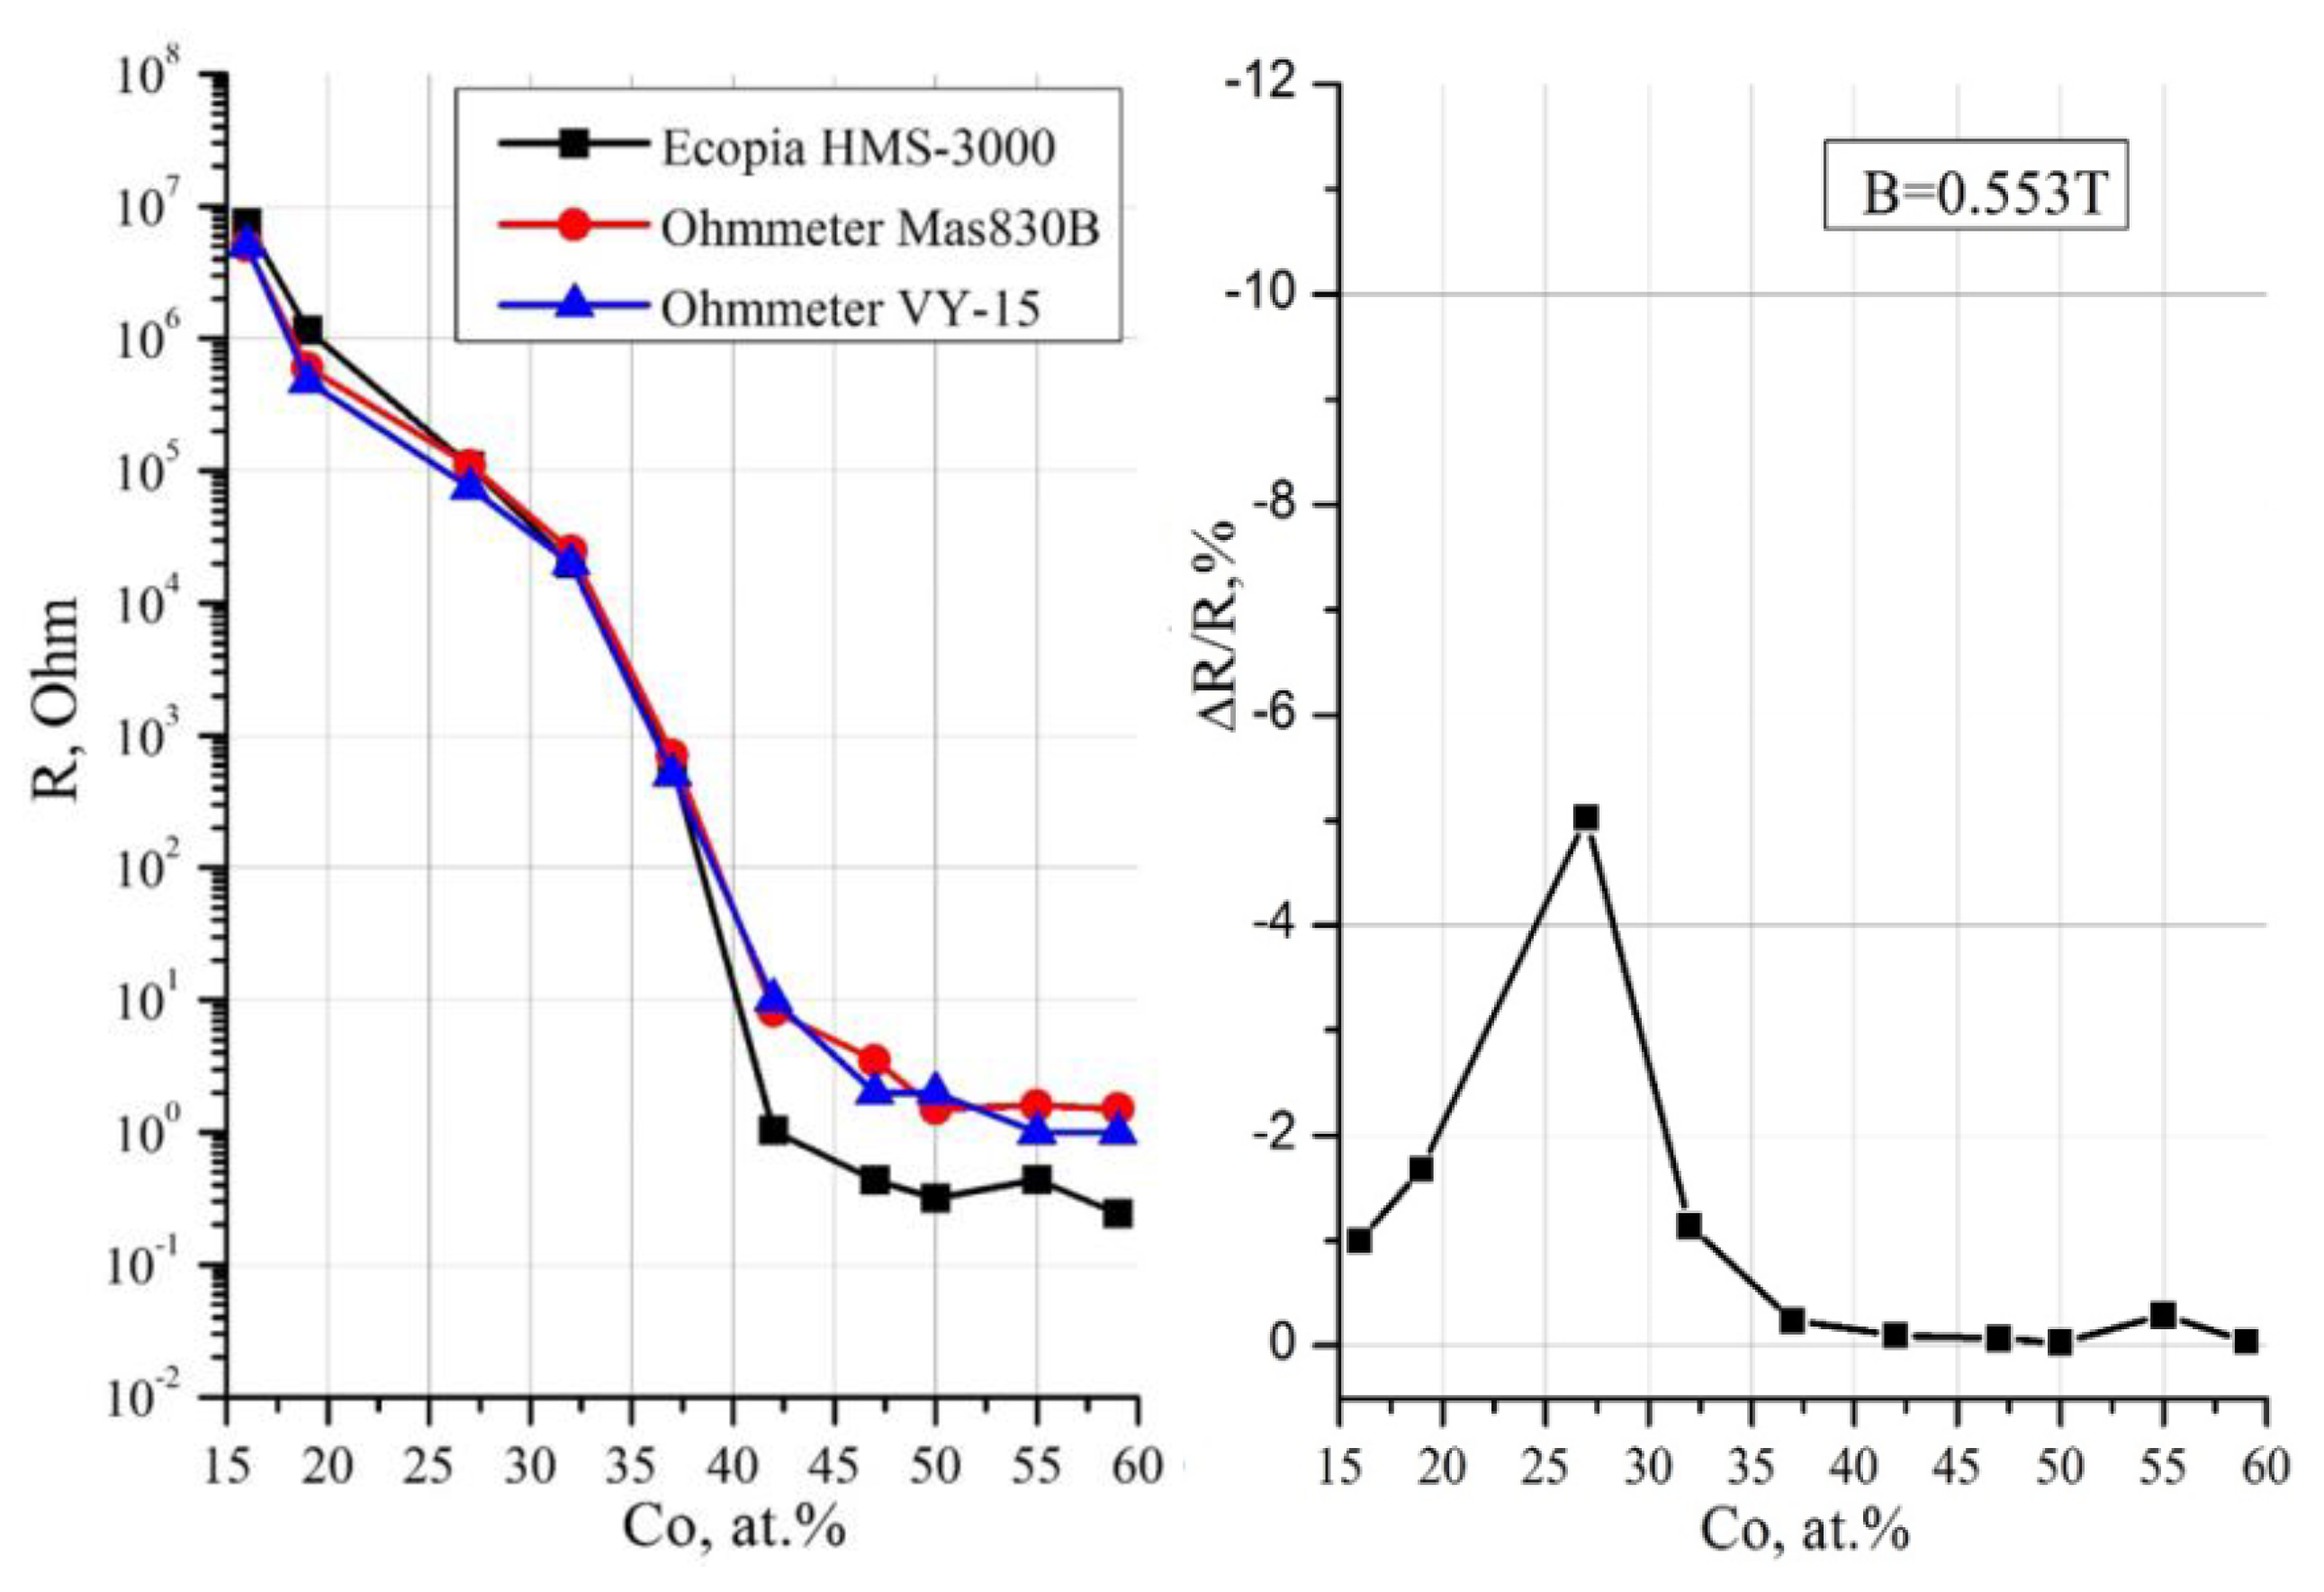
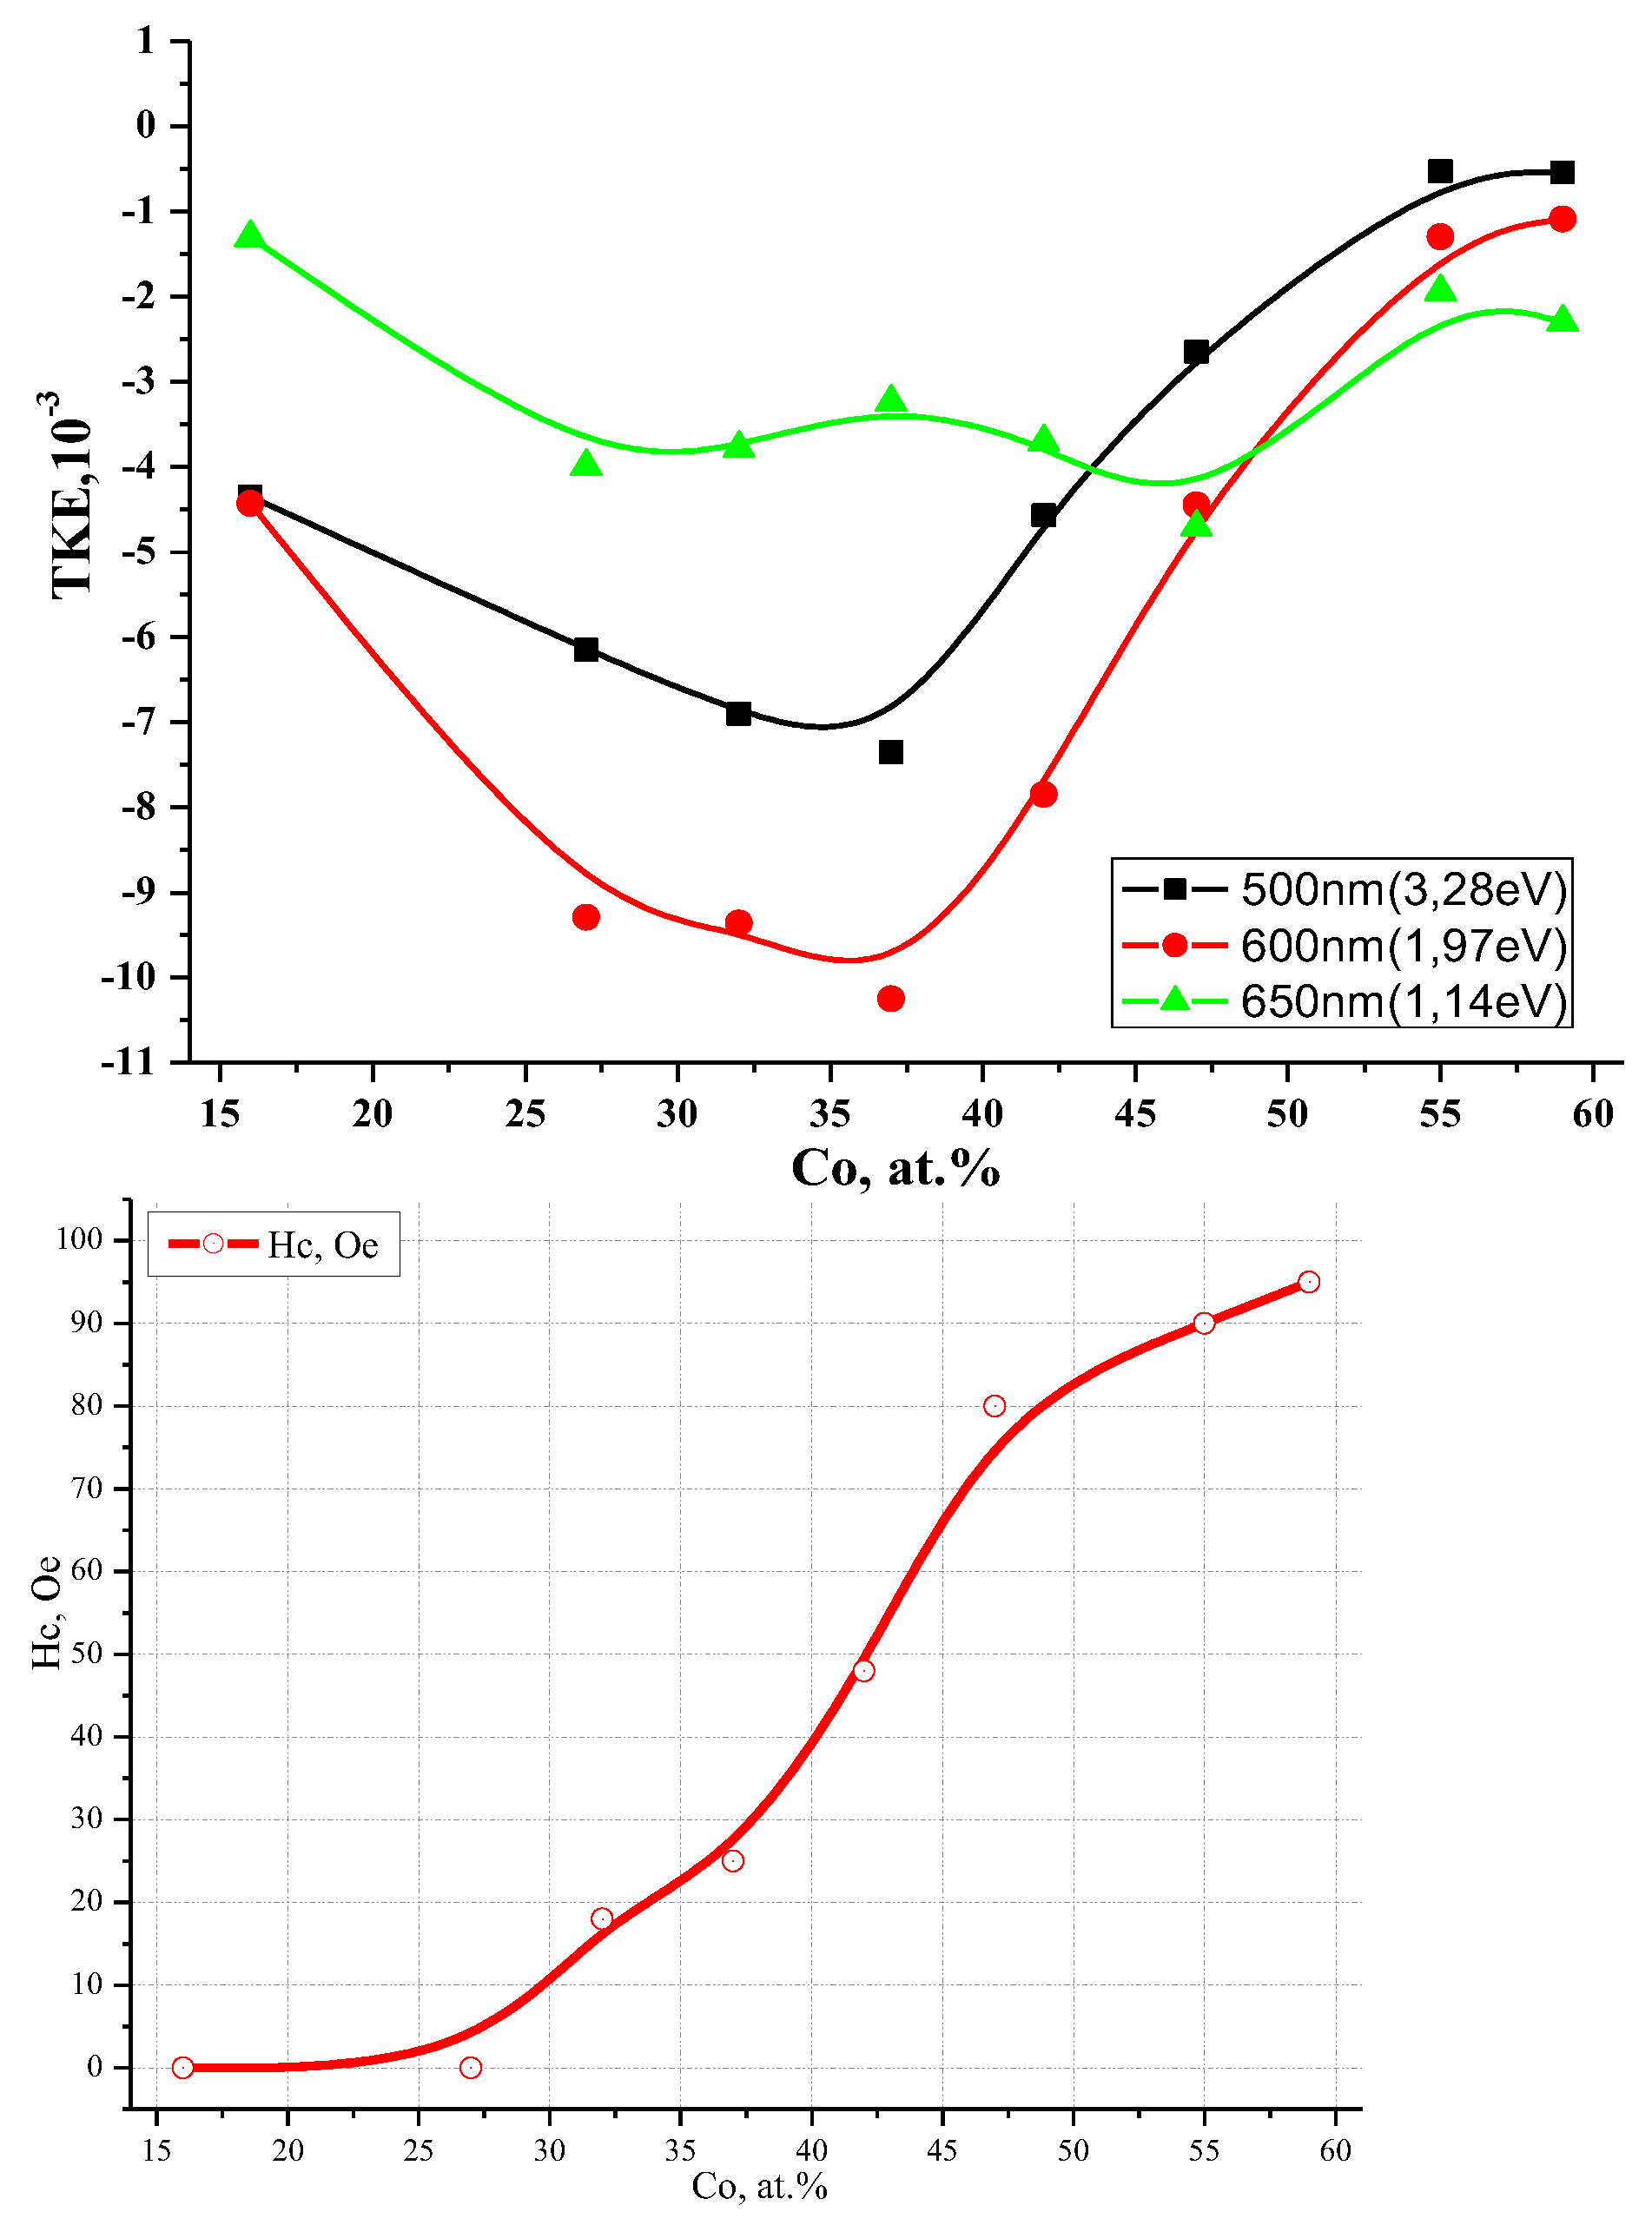
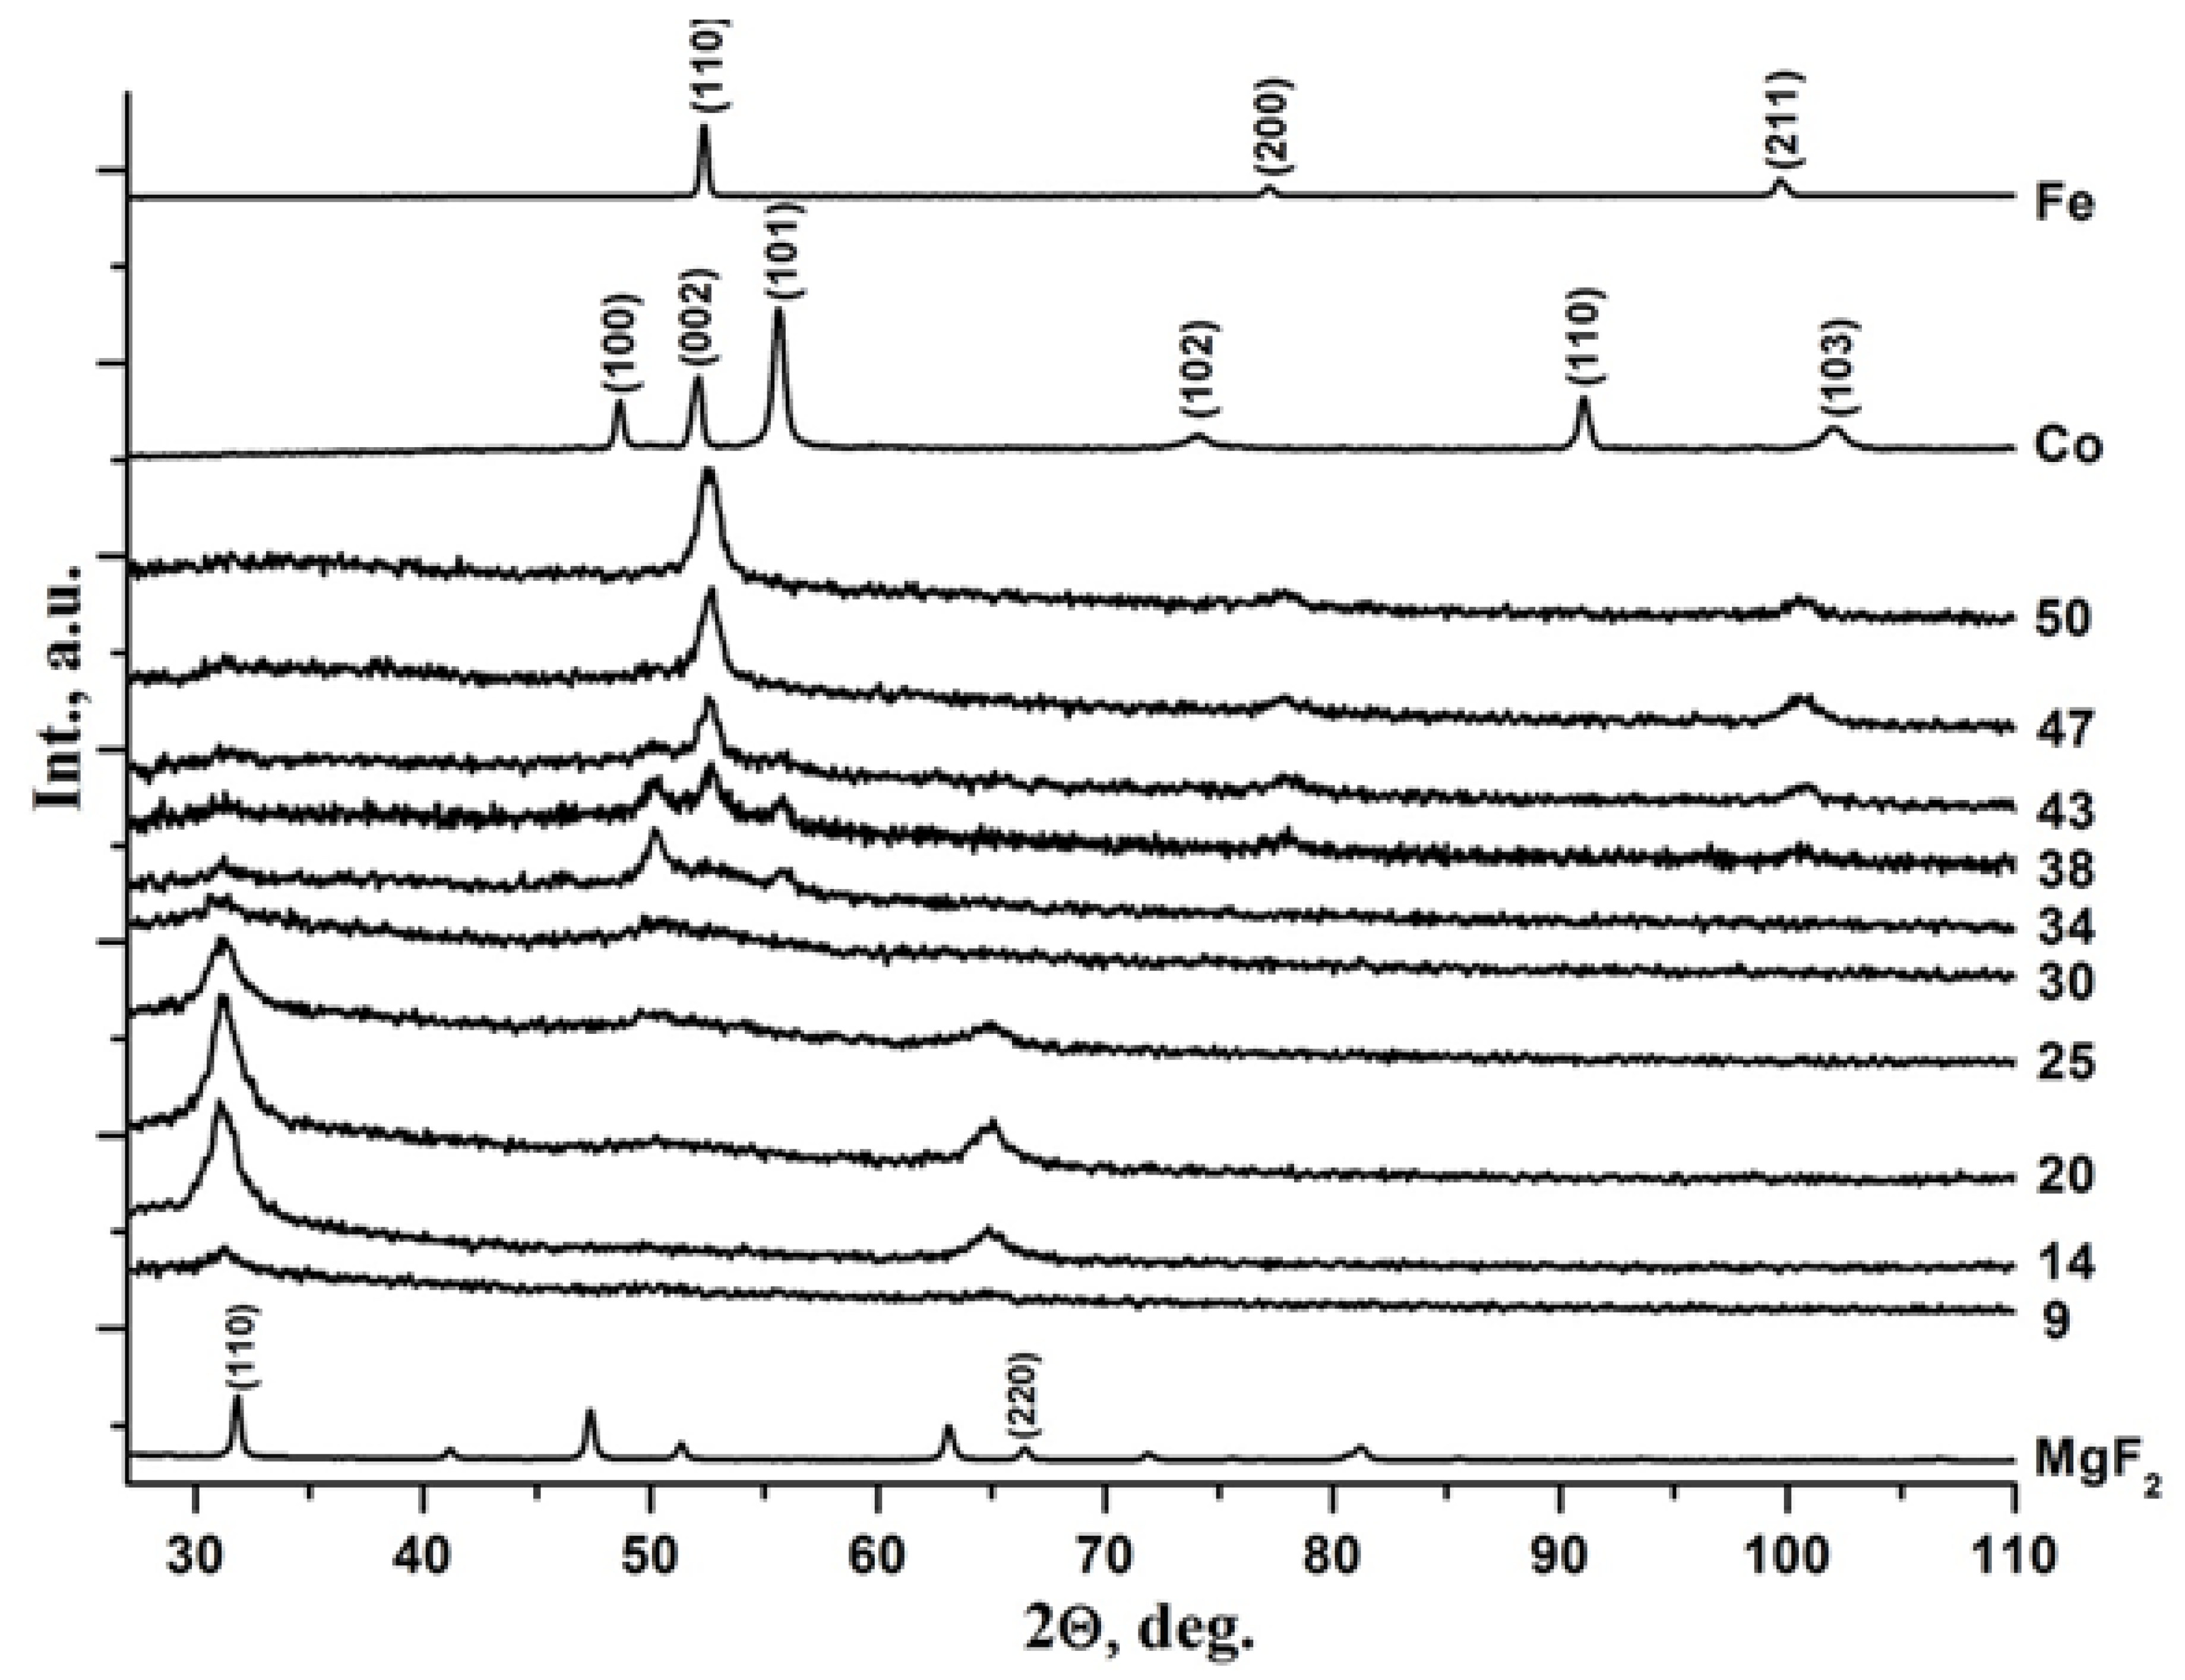
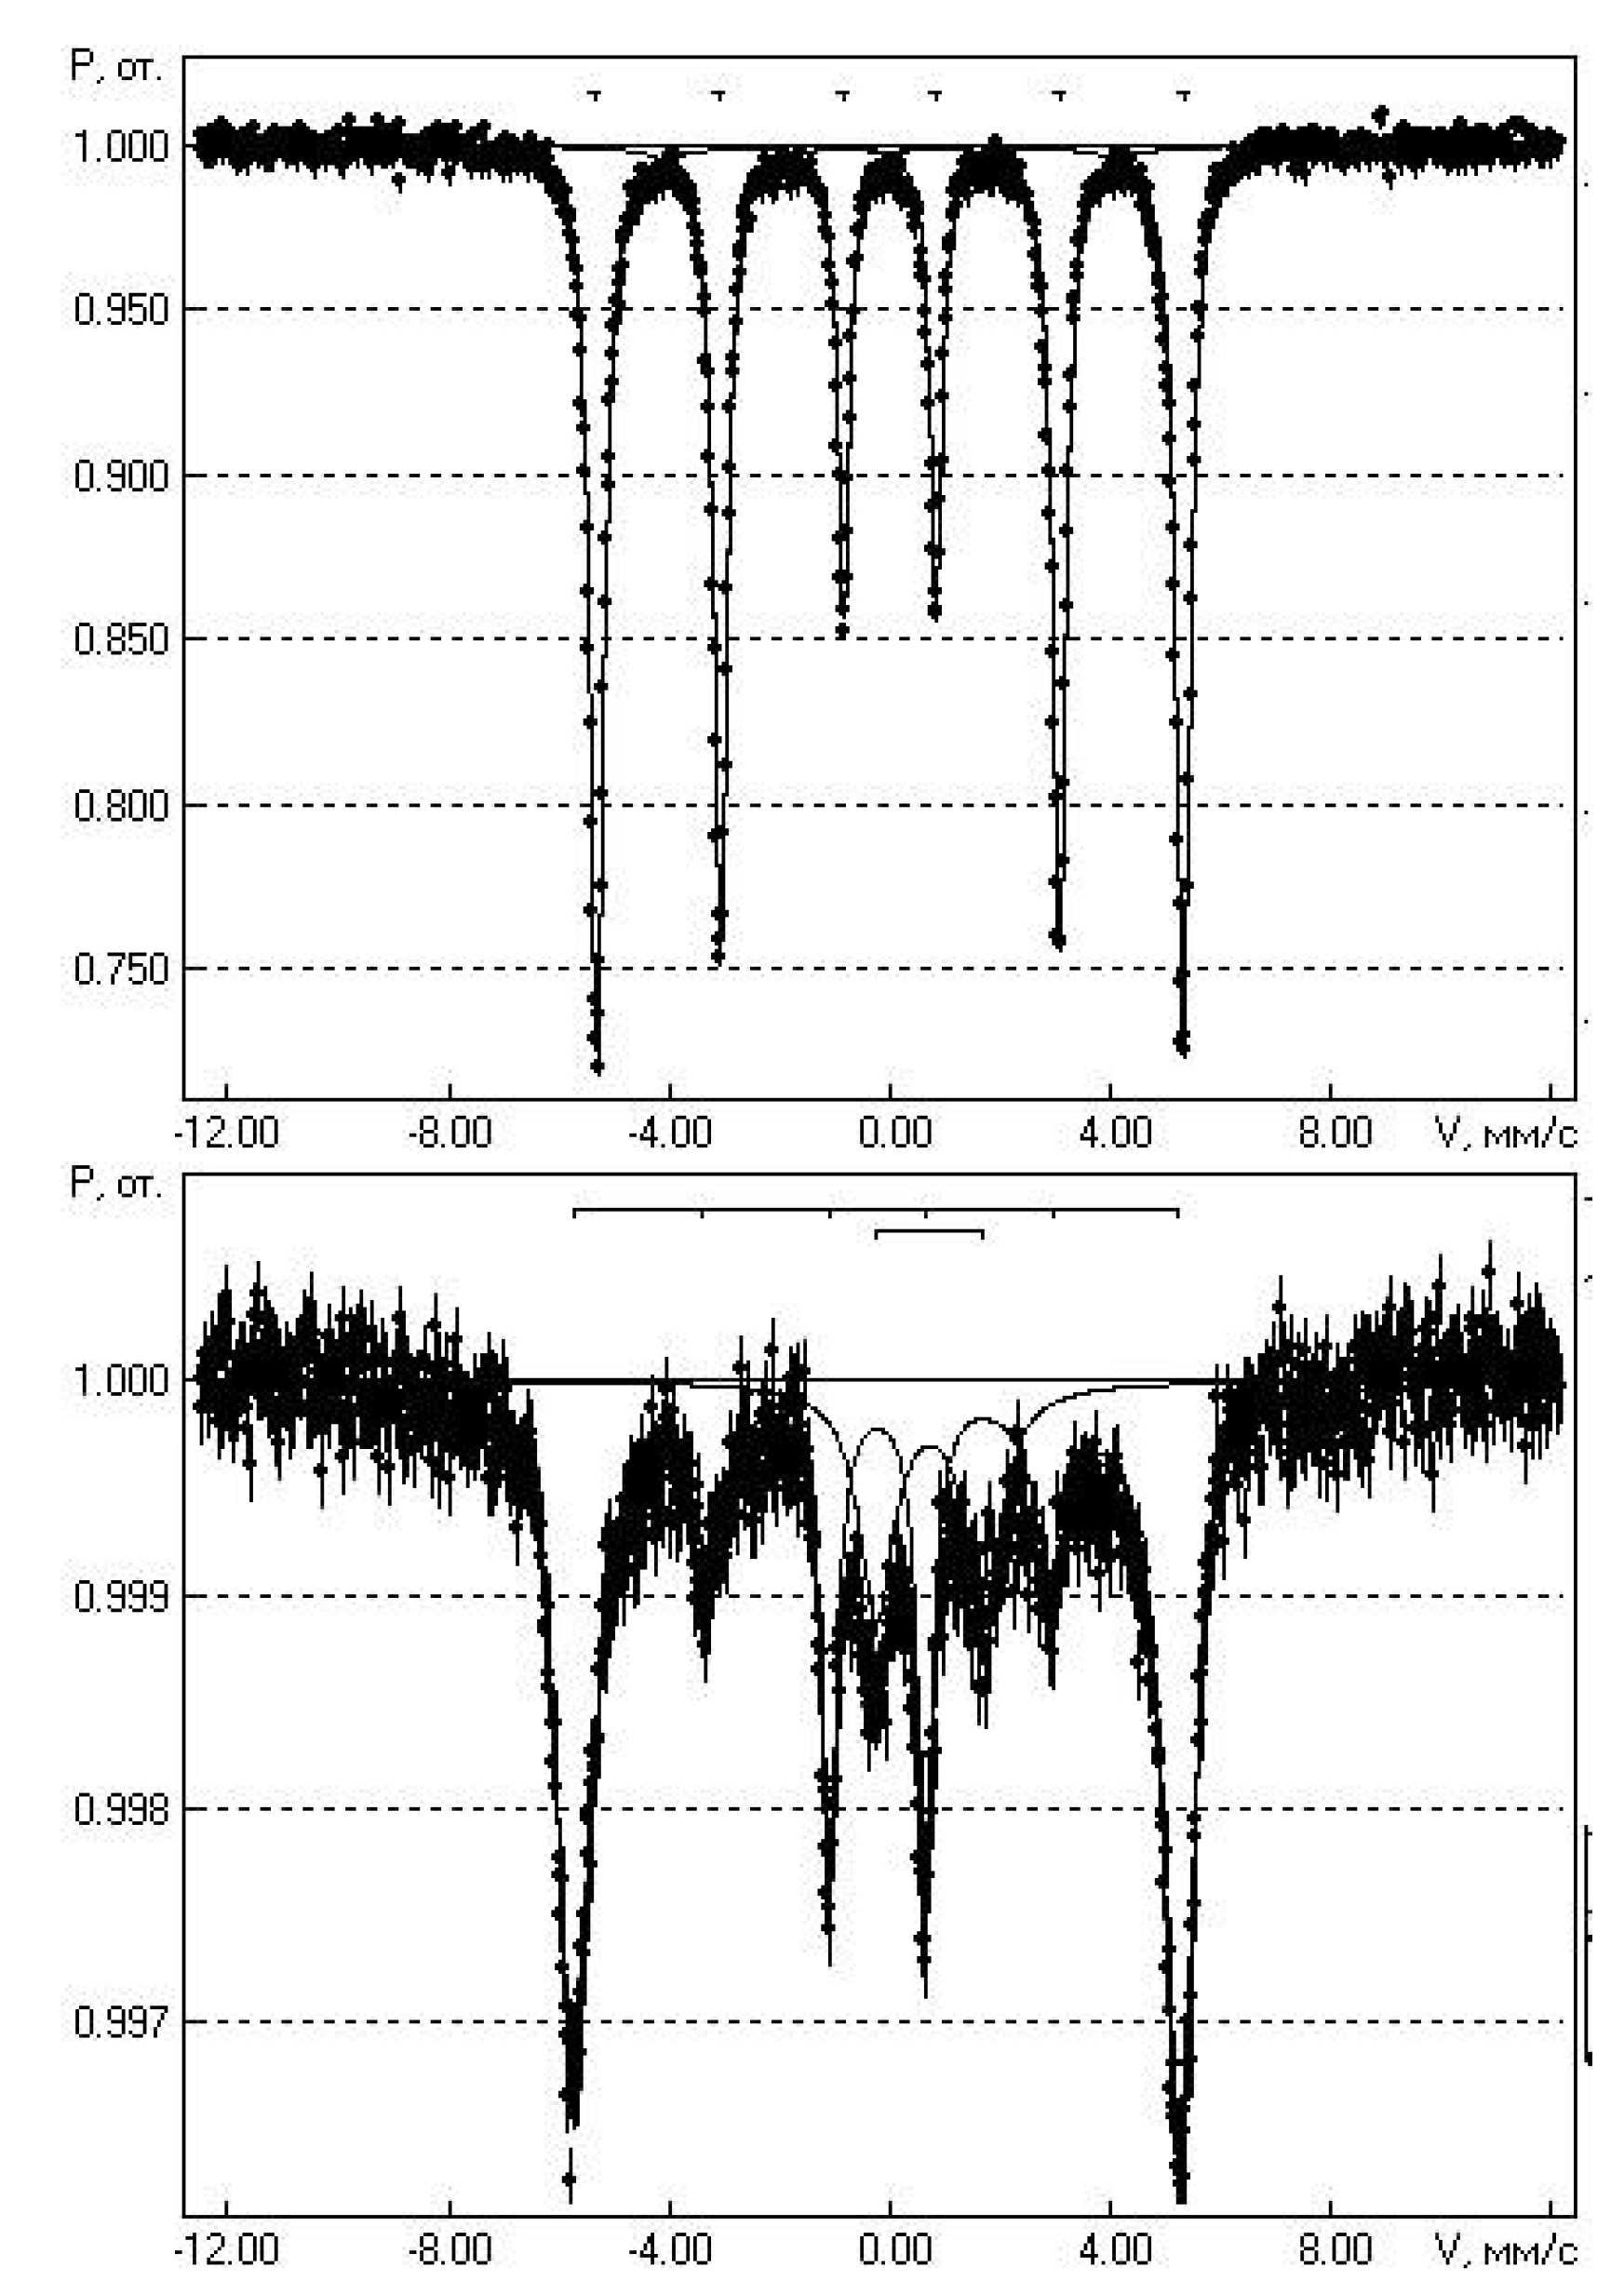
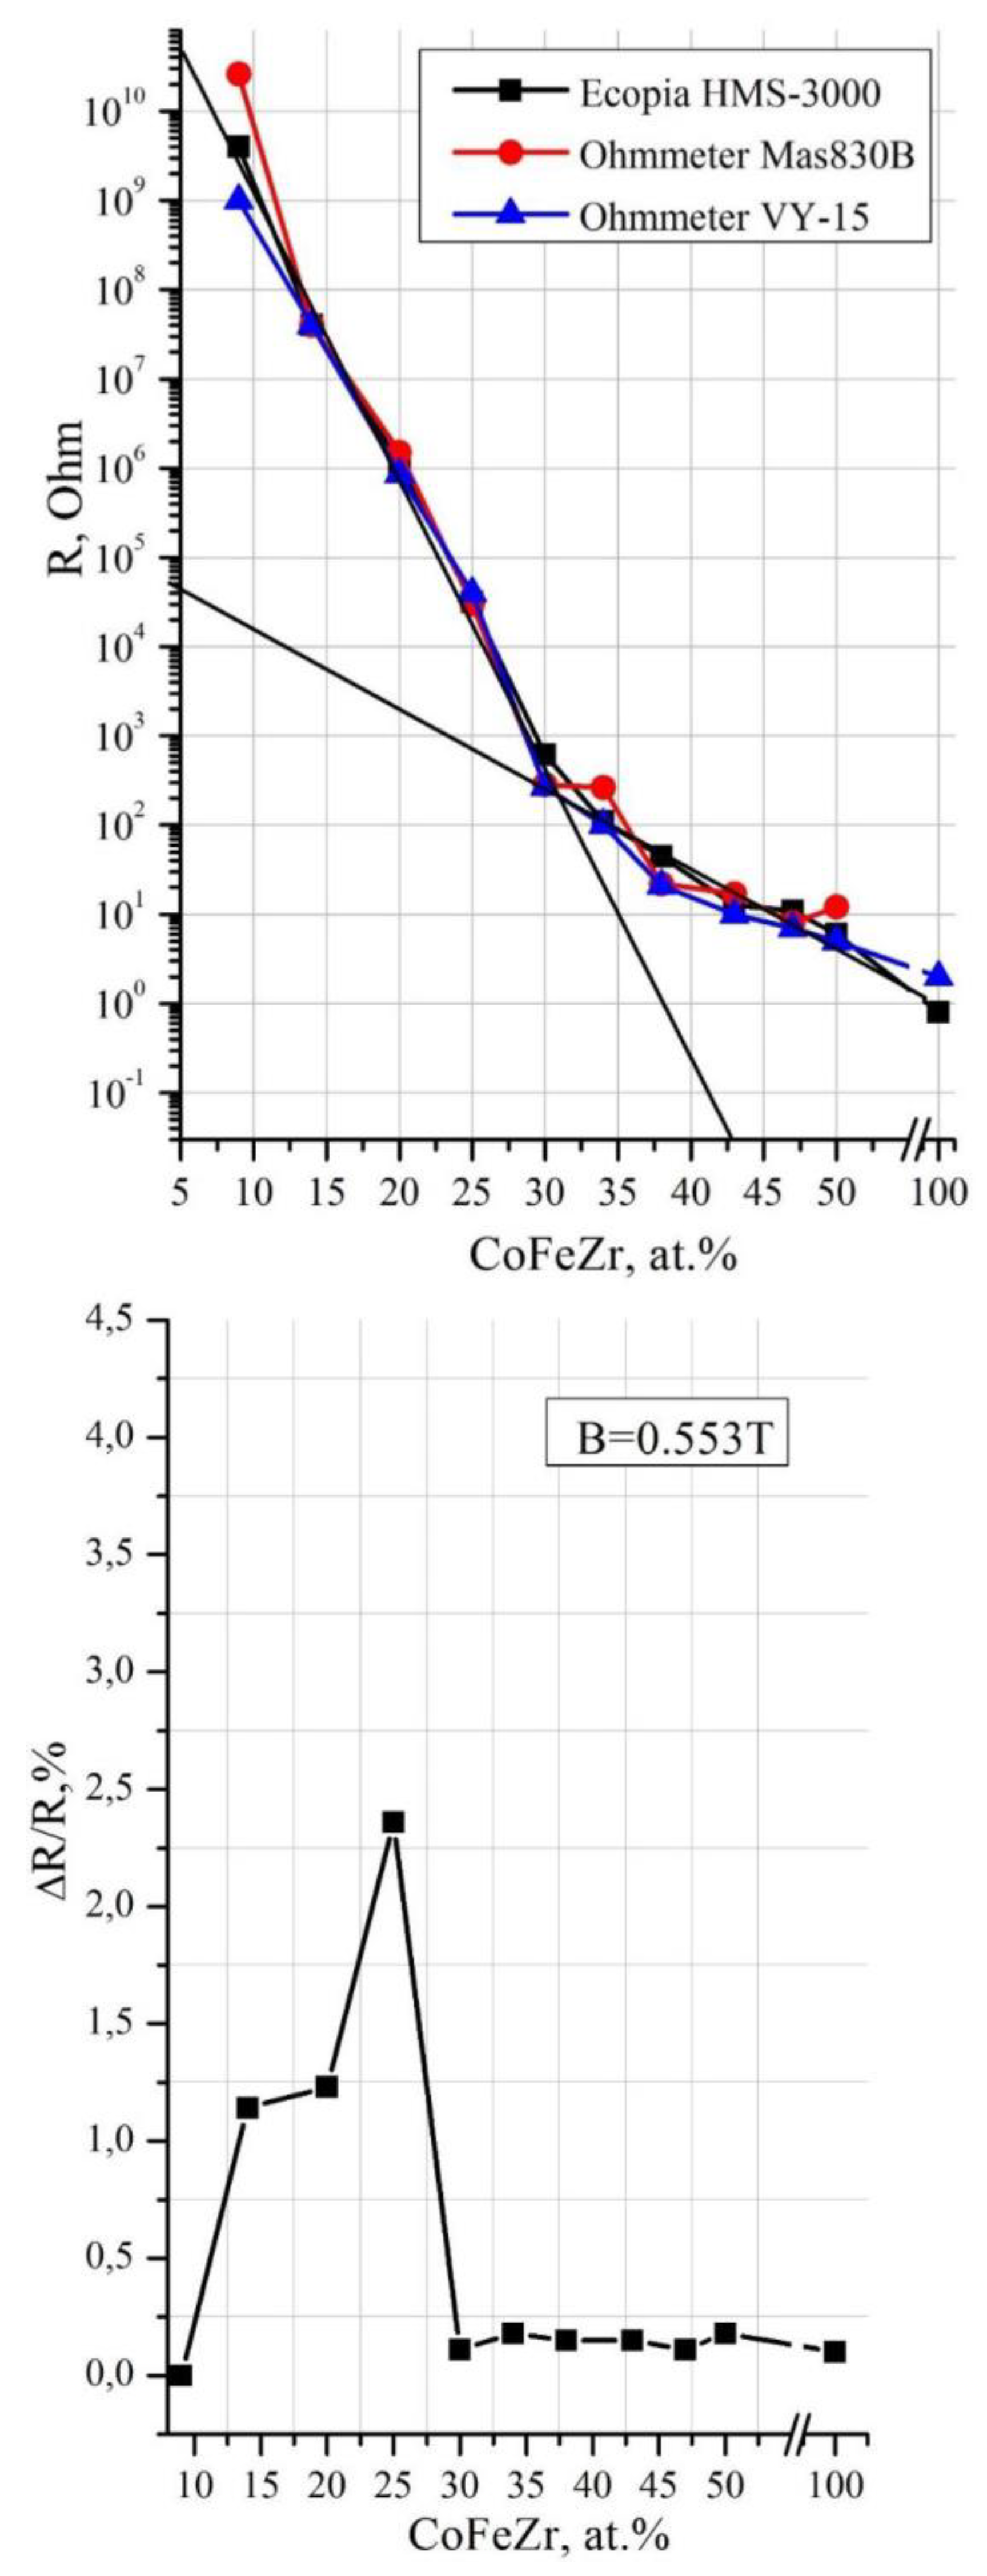
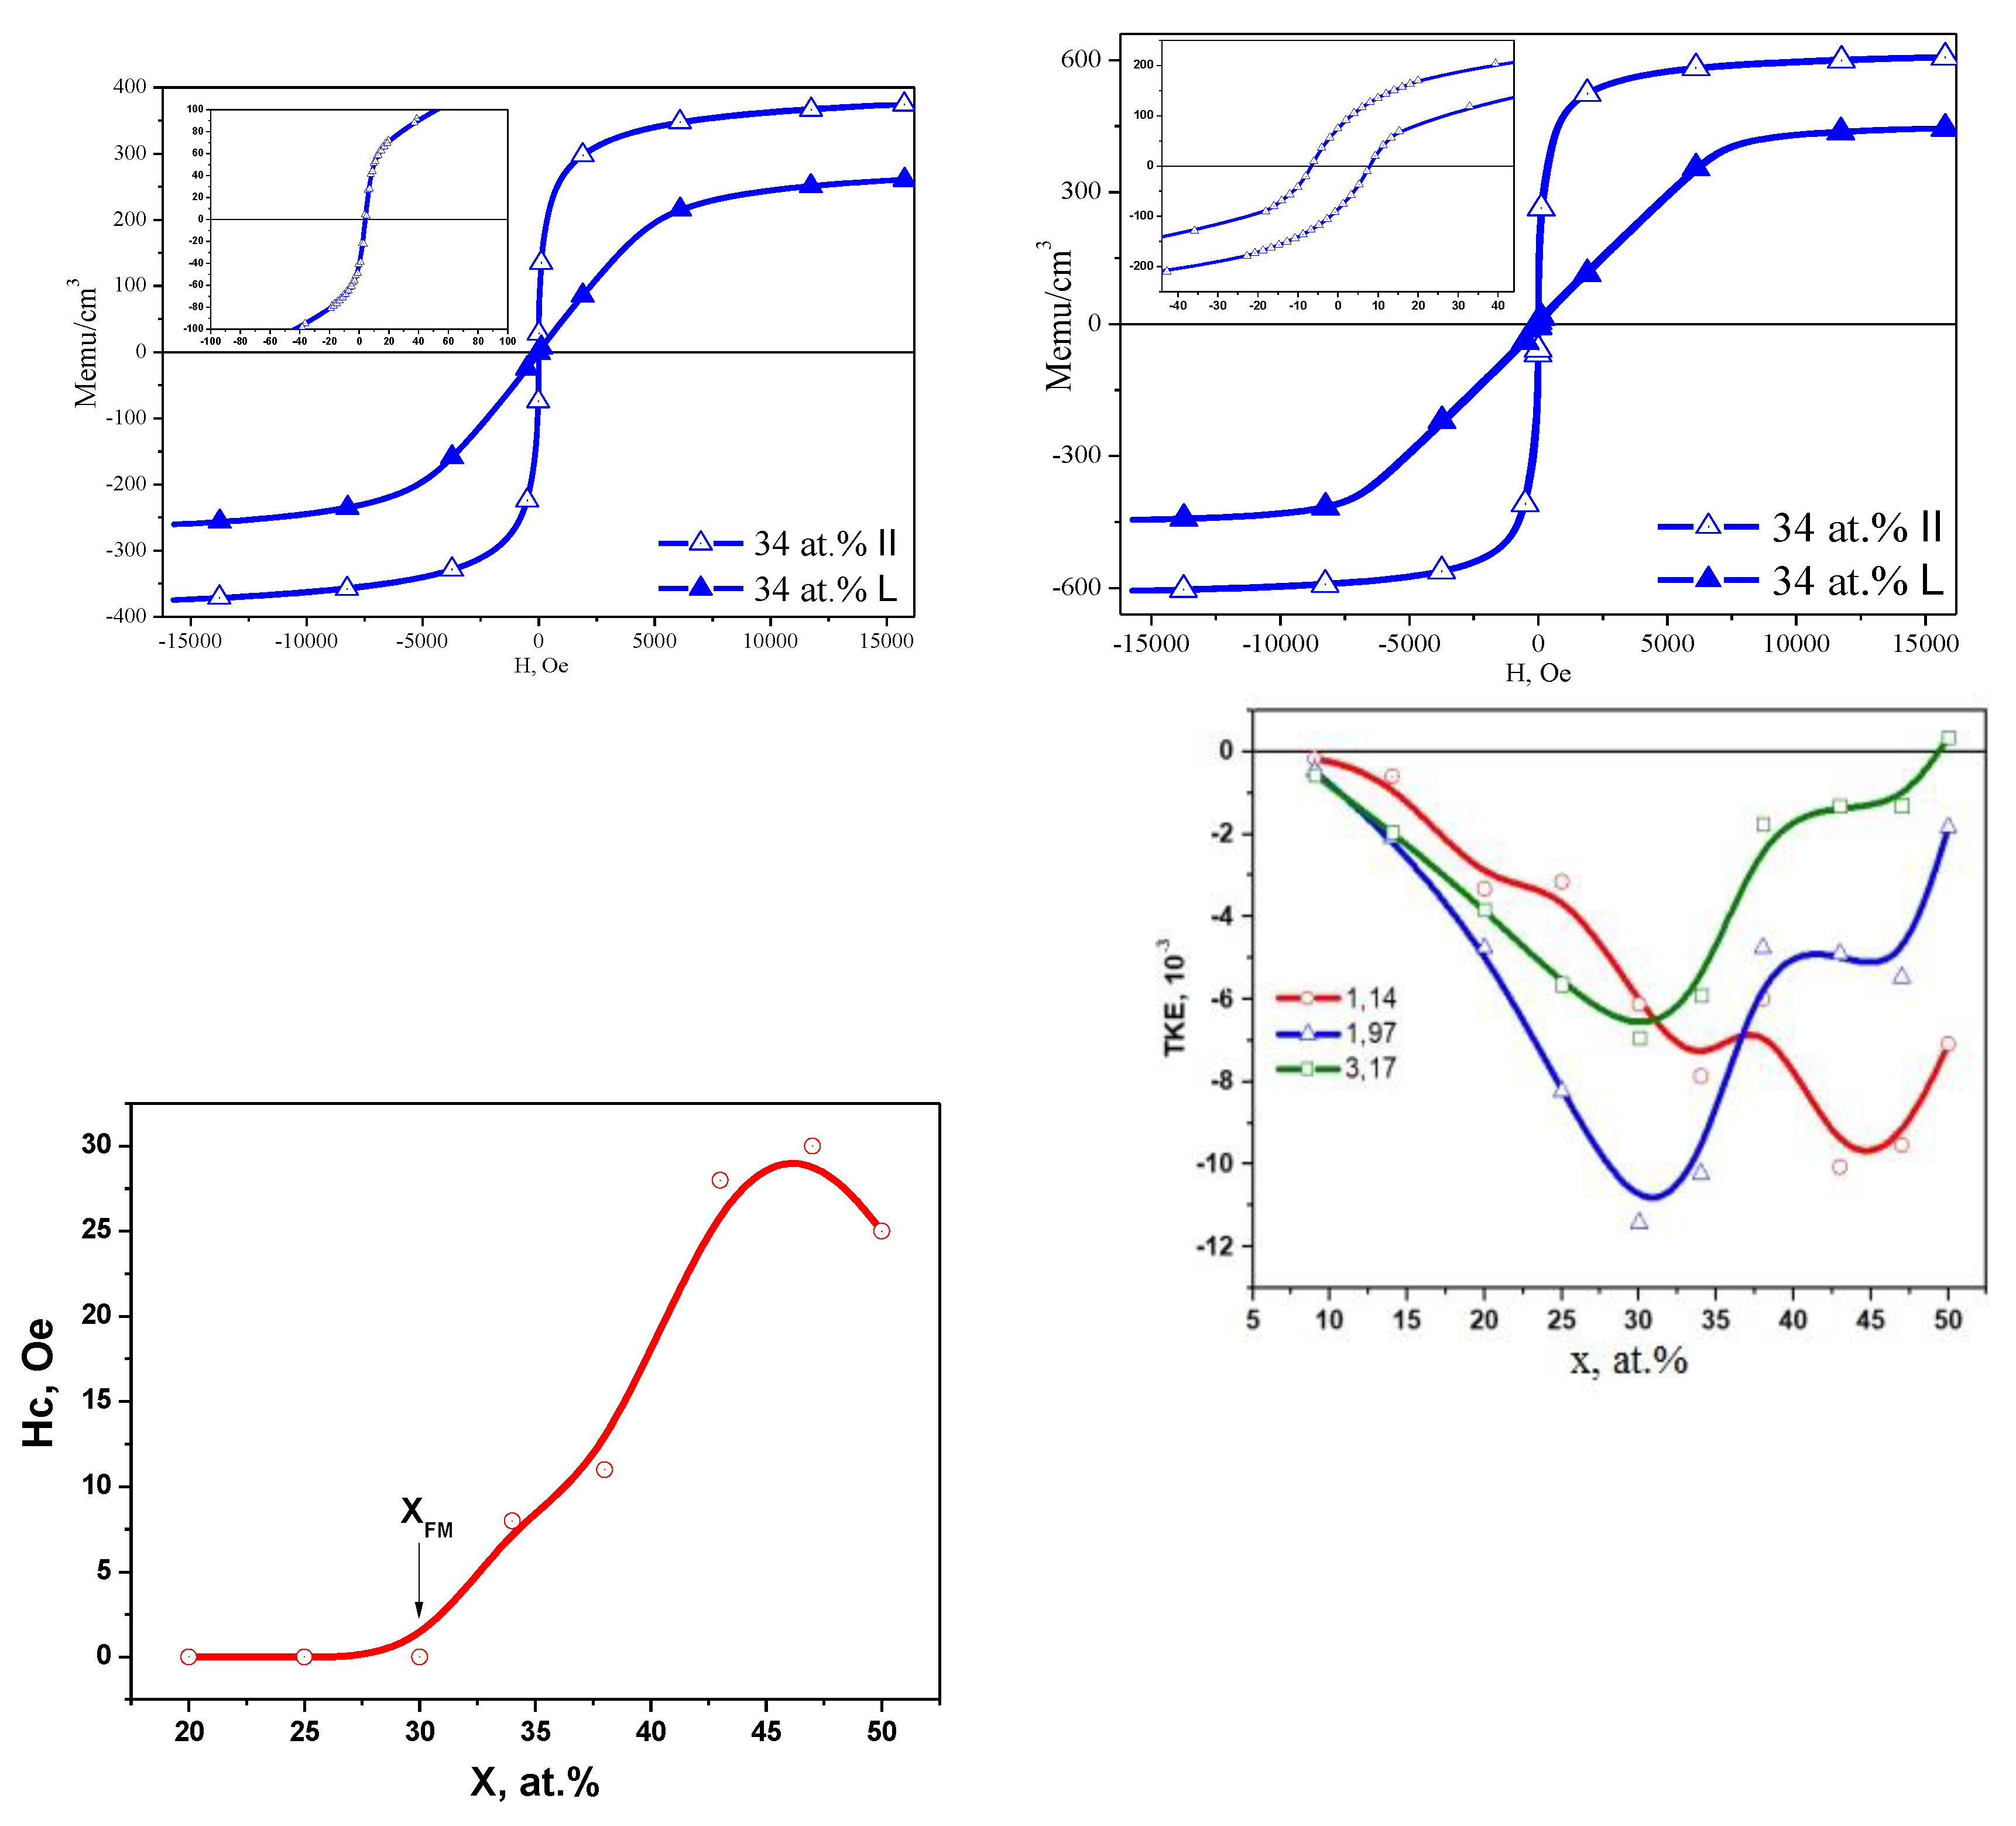
The article presents a comparative analysis of the results of complex studies of two nanocomposite systems: metal-dielectric Cox(MgF2)100-x and alloy-dielectric (CoFeZr)x(MgF2)100-x, obtained by ion-beam sputtering of composite targets in a wide range of compositions. Section 3 of this paper provides a mini-review of the investigations results about the features of the influence of the atomic composition and structural-phase state in the two systems on their nonlinear electroresistive, magnetoresistive, magneto-optical properties, published by us separately in each of the two systems in 2019-2023. In the metal-dielectric system Cox(MgF2)100−x, the formation of the hexagonal Co nanocrystals coincides with the achievement of the electric and magnetic percolation thresholds at xper=37 at.% and is accompanied by a transition from the superparamagnetic to the ferromagnetic state, which, with an increase of the metal content (>42 at.%), acquires a hard magnetic character with a coercive force of up to 95 Oe. In the alloy-dielectric system (CoFeZr)x(MgF2)100−x, the formation of the hexagonal CoFeZr nanocrystals coincides with the values of the electric and magnetic percolation thresholds at xper=34 at.%. Below this value, the nanocomposites exhibit superparamagnetic properties, and at high values of x > 34 at.%, they become soft magnets and remain so far beyond the percolation threshold and after the phase transition of nanocrystals from the hexagonal hcp to the cubical bcc structure at x = 43 at.%, with a maximum value of the coercive force Hc ≤30 Oe. One of the reasons for the significant decrease in Hc compared to the first system may be the formation of the paramagnetic phase FeF2 at the interphase boundaries of CoFeZr nanocrystals with the dielectric matrix MgF2, detected by the Mössbauer spectroscopy. Further in Section 4 for the first time, the concentration dependences of the oscillating fine structure of XANES K-absorption edges of Co atoms in the first system and Co and Fe atoms in the second system are presented, which undergoes changes at the percolation thresholds in each of the two systems and thus confirms the nonlinear nature of the electromagnetic properties changes in each of the two systems at the atomic level.

Keywords: 
;  ;  ;  ;  ;  

1. Introduction

Intensive studies of various materials containing 3d metals and possessing giant magnetoresistance (GMR) began in the last century, but still arouse unflagging interest in the scientific community [1,2,3,4,5,6]. Among such materials, a special place is occupied by composite nanogranulated metal-dielectric films [7,8], in which GMR is the result of spin-dependent electron tunneling, i.e. represents tunnel magnetoresistance (TMR) [7,8,9,10].
An important parameter affecting the properties of granular composites is the size of the metal granules, which is controlled by the conditions of production and the content of the metal component (x) and can vary from 0 to 100 at.%. For composites with a small x value, the metal granules are isolated from each other in the matrix volume, and therefore such media are close in their properties to dielectrics. On the other hand, for compositions with a large x value, the metallic conductivity mode is realized. In this case, the size and number of granules per unit volume increase so much that conductive clusters and metal channels are formed from chains or networks contacting each other and penetrating the entire material, which ensures a predominantly metallic type of conductivity [10,11].
A branched conductive network and a magnetic closed structure arise in composites upon reaching the so-called percolation threshold xper. For granular composites, the concept of the percolation threshold xper is associated with such a value of the metal component concentration at which a “conductive network” of contacting metal particles is formed throughout the entire volume of the sample. It can be said that the percolation region is an intermediate state during the transition from a non-conducting to an electrically conductive state, where metal granules begin to contact each other. In this region, all the unique physical properties inherent in granular metal-dielectric composites are most clearly manifested [7,8,9,10].
It has been experimentally established that for a large number of granular composites, the percolation threshold corresponds to x values ​​of about 50-60 at.% [10].
Granular composites can be obtained by various methods, but the most universal is ion sputtering [10,11]. The formation of a granular structure occurs on the surface of the substrate, where atoms or atomic complexes knocked out of the target are deposited. The separation of the condensing medium into two components – dielectric and metallic – is achieved as a result of the self-organization process, the driving force of which is the tendency to decrease entropy during the implementation of a non-stationary process, which is condensation from the gas phase [11].
Oxide dielectrics SiO2, Al2O3, MgO, HfO2, ZrO2, etc. are most often used as matrices for granular composites. Most metals used in these matrices, such as Fe, Co, Au, Cu, etc., form granules ranging in size from one to several tens of nanometers. In this size range, ferromagnetic granules become single-domain with a possible transition of the material to a superparamagnetic state.
In addition, technologies for producing composites with oxygen-free dielectrics have recently been implemented. For example, in [12], when studying the magnetotransport properties in (Fe51Co49)32(MgF2)68 films with the Fe51Co49 alloy distributed in the MgF2 dielectric matrix, a giant magnetoresistance of 13.3% at 10 kOe at room temperature was found. In [13], the frequency dependence of the tunnel-type magnetodielectric effect in superparamagnetic Cox(MgF2)1-x nanostructures was demonstrated with an exact change in x in the range from 0.06 to 0.2.
In [14,15] the electrical and magnetoresistive properties of Cox(MgF2)1-x thin films were investigated in a wide range of metallic phase concentrations (14 ≤ x, at.% ≤ 62) in the initial state and after thermal annealing in vacuum. The percolation threshold for this system is set in the range of x=30-36 at.% Co. The magnetoresistive effect of the studied samples reached 7% in a field of 10 kOe at a cobalt concentration of x=25 at.%. When heating the samples to 250°C, the magnetoresistance value increased in composites containing cobalt up to the percolation threshold, and decreased in composites above the percolation threshold. It was found that the MgF2 matrix is ​​resistant to thermal heating up to 250°C, while an increase in temperature to 350°C leads to the disappearance of the magnetoresistive effect.
Thus, by now a large number of original works and a monograph [10] have accumulated, which present various nonlinear effects in granular metal-dielectric composites.
The aim of our work is to show how the nonlinear regularities of the influence of composition and phase transformations manifest themselves not only in the nonlinear electromagnetic properties of film nanocomposites metal-dielectric of two systems Cox(MgF2)100-x and (CoFeZr)x(MgF2)100-x, but also in the fine structure of X-ray absorption spectra of Co K-edge and Fe K-edge XANES (X-ray absorption near edge structure), i.e., at the atomic level.
Section 3 of this paper provides a mini-review of the investigations results about the features of the influence of the atomic composition and structural-phase state in the two systems on their nonlinear electroresistive, magnetoresistive, magneto-optical properties, published by us separately in each of the two systems in 2019-2023. Further in Section 4 for the first time, the concentration dependences of the oscillating fine structure of XANES K-absorption edges of Co atoms in the first system and Co and Fe atoms in the second system are presented, which undergoes changes at the percolation thresholds in each of the two systems and thus confirms the nonlinear nature of the electromagnetic properties changes in each of the two systems at the atomic level.

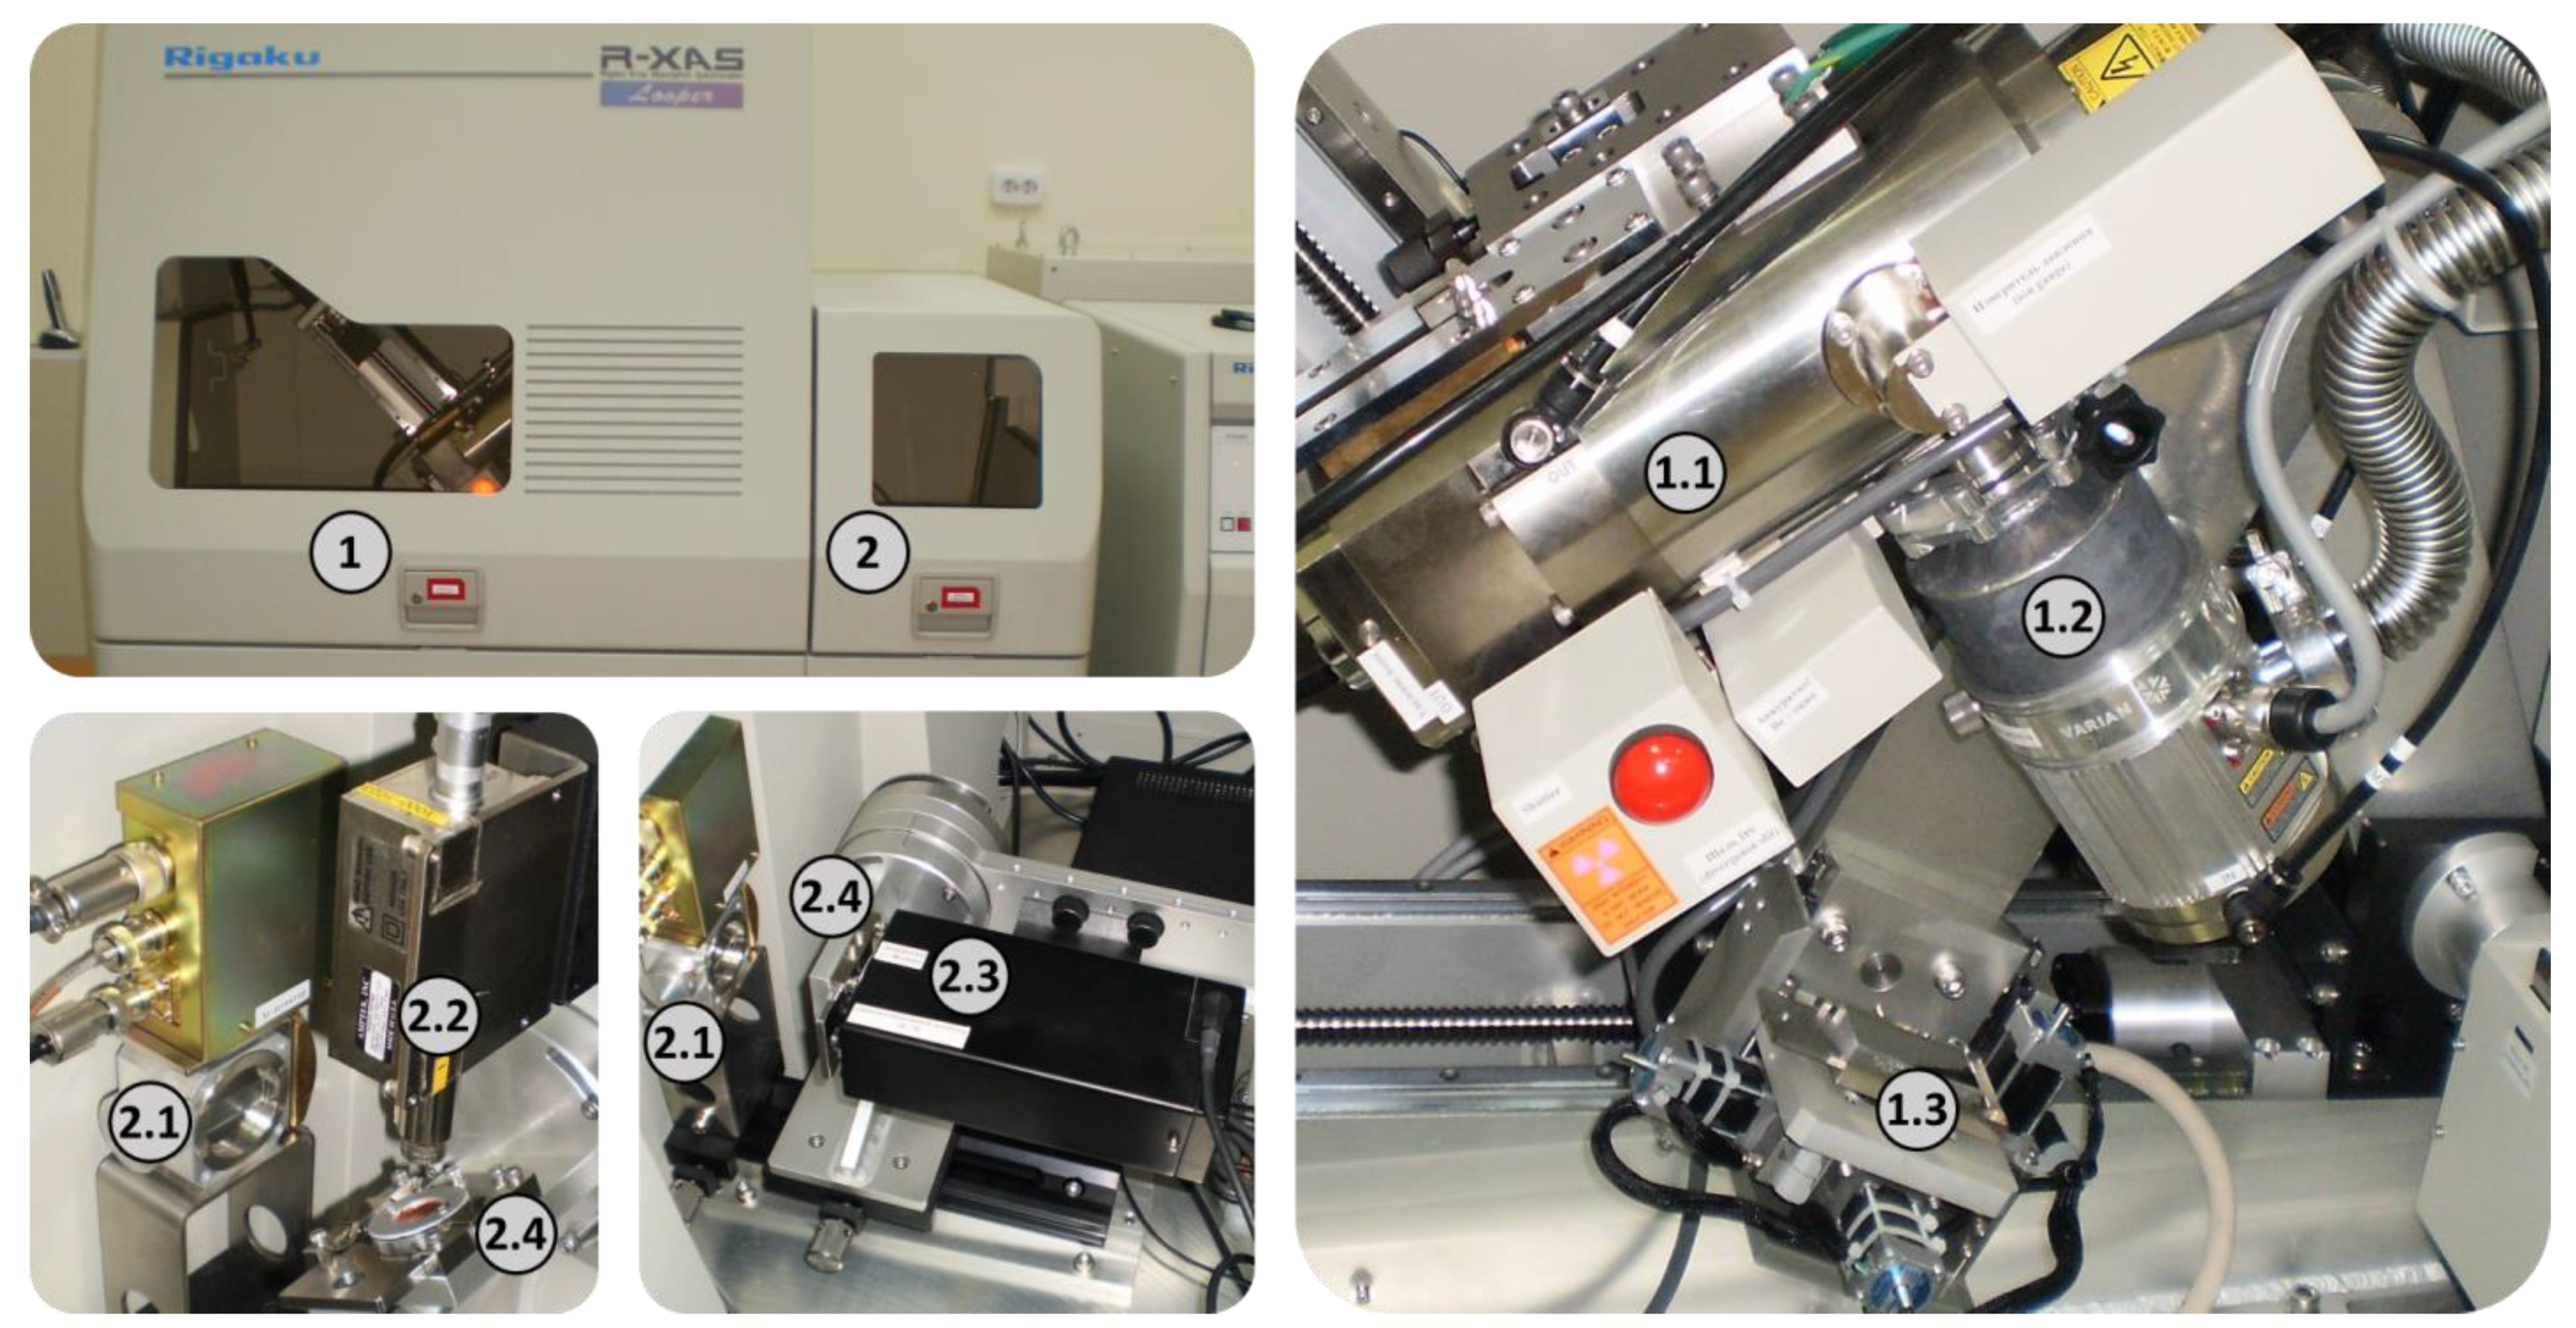
2. Objects and Methods of Research

Composite films with different contents of metal Co or alloy CoFeZr in a dielectric matrix MgF2 were obtained using the original ion-beam deposition setup described in our work [16]. The composite target consisted of a massive plate of metal Co or metal alloy Co45Fe45Zr10 with uneven and asymmetric placement of dielectric inserts MgF2. As a result of using such a target in the sputtered material in one cycle in an argon atmosphere at an operating pressure of ~ 5.10-4 Torr on substrates, a given gradient of composite concentration is formed [10,16].
The layer thicknesses of film samples of granulated composites with different compositions smoothly changed from one edge of the substrate to the other in the range of 2–4 μm with an increase in the metal or alloy concentration x in the nanocomposite. The layer thicknesses were measured using a scanning electron microscope SEM of JEOL JSM-6380LV (Japan).
The concentrations of chemical elements included in the composites were measured by electron probe X-ray spectral microanalysis using an attachment to the SEM equipped with three crystal diffraction spectrometers and an energy dispersive analysis system, with an error of less than 1.0 at.% of the measured element content. The determined composition of the samples was the percentage of each chemical element in the (CoFeZr)x (MgF2)100-x composite layer, expressed in atomic percent. In this case, the variable value x of the metal component in the composite is the sum of the atomic concentrations of three alloy metals Co, Fe and Zr.
The phase composition of nanocompositesd and the sizes of nanocrystals formed as a result of self-organization of two components, metallic and dielectric in different ratios, were studied by X-ray diffraction (XRD) on a DRON-4 diffractometer (St. Petersburg, Russia) using Co Kα radiation. X-ray diffraction patterns were obtained in a step-by-step scanning model.
The tunneling magnetoresistance (TMR) in accordance with the relation (1)
TMR= (R(H) - R(0))/R(0)=ΔR/R(0)
where ΔR is the difference in the electrical resistance in the presence of a magnetic field R(H) and in its absence R(0), was studied by directly measuring the electrical resistance of samples when changing an external constant magnetic field using the four-probe method on an ECOPIA HMS-3000 setup. The device kit included a certified magnetic attachment with a magnetic induction of B = 5.5 kG.
The magneto-optical (MO) properties of the nanocomposites were studied in the transversal Kerr effect (TKE) geometry, which consists of a change in the intensity of p-polarized light reflected by a sample upon magnetization in a magnetic field parallel to the sample surface and perpendicular to the plane of incidence of light. The TKE values ​​are determined by the relation:
δ = [I(H)–I(–H)]/2I(0)
I(H) and I(0) are the intensities of reflected light in the presence and absence of a magnetic field, respectively, measured dynamically with magnetic field modulation.
This method allows the use of a differential measurement scheme, ensuring an accuracy of measuring relative changes in the intensity of reflected light of ~10−5 [17,18].
The TKE spectra were recorded in the energy range E = 0.5–4.0 eV with an applied magnetic field of up to 3.0 kOe and room temperature. The magnetic field dependences of TKE(H) were measured at three fixed energies to analyze the magnetic structure of the nanocomposites.
The magnetic properties of the samples were studied using a Lake Shore Vibrating Sample Magnetometer (VSM) 7407 in magnetic fields up to 16 kOe at T = 300 K.
The X-ray absorption spectra of Co and Fe K-edge XANES were measured using a Rigaku R-XAS laboratory spectrometer. Figure 1 shows its main parts.
Monochromatic radiation from the anode of the X-ray tube operating at 18 kV and 60 mA was obtained after reflection from a Ge (311) single crystal bent according to Johansson (Johansson bent [10.1016/j.ccr.2020.213466]). The energy resolution is 1.3 eV in the X-ray energy range of 7000-8000 eV. An ionization chamber filled with argon (gas pressure 300 mbar) is used to determine the intensity of incoming X-rays. The signal from the film sample on the substrate was recorded in the fluorescence mode using an Amptek XR-100KR semiconductor silicon drift detector. For each studied sample with a certain x value, ten XANES spectra were measured and averaged. Background subtraction, normalization, energy equalization, and extraction of the oscillation function χ(k) were performed in the Athena program from the Demeter1-2 package [19].

3. Structural-Phase Transformations and Nonlinear Electromagnetic Properties of Variable-Composition Nanocomposites Cox(MgF2)100-x and (CoFeZr)x(MgF2)100-x

Тhe phase composition of the composites on the substrate is formed as a result of self-organization from two components, metallic and dielectric, in different ratios from one edge of the substrate to the other, depending on the location of these edges relative to the composite target with non-equidistantly located dielectric inserts. After deposition of the composite, which smoothly changes the metal concentration x in the dielectric matrix and the thickness of the deposited layer over the substrate within a few microns, the substrate is cut into narrow strips about 3 mm wide and about 30 mm long to determine the atomic composition, structure and further studies of the functional properties depending on the phase composition and atomic structure of the samples.

1.1. Metal-Dielectric Nanocomposites Cox(MgF2)100-x

First, we studied in detail the features of the atomic structure, phase formation and substructure of thin-film composites Cox(MgF2)100-x with metallic cobalt in the dielectric matrix MgF2 with a change of metal concentrations in the range of 14 ≤ x≤ 63 at.% and showed [20,21] that at a cobalt content of x< 37 at.%, the metal Co is in an X-ray amorphous state in the form of clusters in the nanocrystalline matrix of MgF2 (Figure 2). At x=37 at.%, a nonequilibrium state occurs, in which both components, the metal and the dielectric matrix of the film composite on the glass substrate, are in an X-ray amorphous state. But with an increase in the cobalt content to x=42 at. % in the amorphous dielectric matrix MgF2, cobalt nanocrystals of hexagonal syngony with dimensions of about 10 nm are formed, predominantly oriented in the [001] direction of the α-Co hexagonal unit cell (Figure 2).
Then, we investigated the effect of the atomic composition and structural-phase state of Cox(MgF2)100-x nanocomposites on their nonlinear transport, magnetic and magneto-optical properties [22].
The concentration dependence of electrical resistance showed (Figure 3A) that at a low cobalt content in the range of x = 16-27 at.%, the resistance of nanocomposites reaches values ​​of 107-106 Ohm, characteristic of traditional dielectrics, whereas in the range of x = 47-59 at. %, the resistance drops to values ​​of the order of 1 Ohm or less, typical for metals. In the transition range x=32-42 at. %, corresponding to the formation of cobalt nanocrystals and the appearance of contacts between them at the percolation threshold at xper=37 at. %, a sharp drop in resistance by 4-5 orders of magnitude occurs.
The concentration dependence of the tunnel magnetoresistance of the samples of the Cox(MgF2)100-x system in Figure 3B shows a particularly nonlinear character. With an increase in the cobalt content to x=27 at.%, a sharp increase in TMR occurs to a maximum value of TMRmax=ΔR/R(0) =5% in accordance with the relation (1).
The concentration dependence of the magneto-optical Kerr effect in equatorial geometry, the so-called transversal Kerr effect (TKE), which consists in changing the intensity of linearly polarized light reflected by a sample magnetized perpendicular to the plane of incidence of light, also turned out to be nonlinear. The ratio of the difference in the intensities of light reflected by a sample in magnetized I(H) and demagnetized I(0) states to the intensity of light I(0) determines the magnitude and sign of the TKE in accordance with the relation (2).
It was found [22] that reaching of the percolation thresholds electric xper and magnetic xFM in Cox(MgF2)100-x nanocomposites at x = 37 at.% is manifested in the form of a maximum of the absolute value on the concentration dependences of TKE at photon energy values ​​of 1.97 eV and 3.28 eV (Figure 4A).
It is known that, according to the magnitude of the coercive force Hc, magnetic materials are divided into hard magnetic (Hc≥ 50 Oe) and soft magnetic (Hc<50 Oe). The concentration dependence of the coercive force Hc in the Cox(MgF2)100-x nanocomposites in Figure 4B shows that at the percolation threshold at xFM = 37 at.%, the system transitions from the superparamagnetic to the soft ferromagnetic state, which, with an increase in the cobalt content (x>42 at.%), transforms into a hard magnetic state with a coercive force of Hc ≈ 95 Oe [22].
Having established nonlinear patterns of structural-phase and electromagnetic properties depending on the concentration of Co in the dielectric matrix of MgF2 for the Cox(MgF2)100-x system, we moved on to the study of nanocomposites of a more complex atomic composition with a three-element magnetic alloy CoFeZr in the same oxygen-free dielectric matrix of MgF2.

2.2. Alloy-Dielectric Nanocomposites (CoFeZr)x(MgF2)100-x

It should be noted that in all the works conducted before us, the metallic component of the composites was obtained by sputtering targets made of polycrystalline metals Co, Fe or CoFe alloy [6,7,8,9,10,12,13], while in our studies we use a target made of amorphous alloy Co45Fe45Zr10 [10] with inserts made of polycrystalline MgF2. It turned out that the use of an amorphous alloy instead of crystalline metals significantly affects the nature of interatomic interactions, phase transitions and electromagnetic properties in such composites due to the significantly smaller sizes of metal clusters in the amorphous phase.
Studies of variable composition nanocomposites (CoFeZr)x(MgF2)100-x in the alloy concentration range x=9-51 (at.%) using X-ray diffraction XRD, X-ray photoelectron spectroscopy XPS and infrared spectroscopy IR have shown that the relative content of the metallic alloy CoFeZr in the oxygen-free nanocomposite has the most significant effect on its atomic structure, substructure [23], conductivity and magneto-optical properties [24].
We have shown [22] that as a result of self-organization under nonequilibrium conditions of ion-plasma sputtering of a composite target at certain ratios of concentrations of the metallic and dielectric components of the nanocomposite, mutually inverse (antibatic) phase transitions from the amorphous to the nanocrystalline state of the metallic alloy occur simultaneously with the inverse transition of the dielectric phase of MgF2 from the nanocrystalline to the amorphous state.
As shown in Figure 5 [23], at alloy concentrations x< 30 at. % it is in an X-ray amorphous state in the form of CoFeZr clusters in the nanocrystalline matrix of MgF2. But already at x=30 at. % the dielectric matrix of MgF2 undergoes an antibate transformation from the nanocrystalline to the amorphous state, and a nonequilibrium state occurs in which both components, the alloy and the matrix of the film composite on a glass substrate, are in an X-ray amorphous state. However, with an increase in the alloy content to x=34 at. % the first phase transition occurs, when CoFeZr nanocrystals of hexagonal syngony with dimensions of about 10 nm are generated in the amorphous dielectric matrix of MgF2, predominantly oriented in the basal plane of the hexagonal unit cell (001) α-Co (Figure 5). The second phase transition from the hexagonal structure to the body-centered cubic bcc α-Fe structure of CoFeZr nanocrystals occurs in the amorphous dielectric matrix of MgF2 with an increase in the relative content of the alloy to x = 43-47 at.% (Figure 5).
Our studies using the XPS method [23] with the use of ion etching of the surface layers of nanocomposites confirmed the presence of a predominant type of metallic bonds in the clusters and nanocrystals of CoFeZr, as well as ionic bonds in the dielectric matrix of MgF2, preserved as a result of self-organization under nonequilibrium conditions of ion-plasma sputtering. In this case, the main role of zirconium atoms of the sputtered three-element alloy Co45Fe45Zr10 is to bind impurity oxygen atoms with the formation of stable chemical bonds Zr-O in ZrO2.
The studies of IR spectra in the same work [23] showed that changes in the sizes of nanocrystals and interatomic distances of the MgF2 matrix, occurring with an increase in the content of the metal alloy in (CoFeZr)x(MgF2)100-x nanocomposites in the range of x = 7-25 at.% up to the percolation threshold, are accompanied by a narrowing of the width of the main band of the IR spectra and small changes in the position of the maximum towards higher frequencies (~ 500 cm-1) compared to polycrystalline MgF2 (~ 450 cm-1) [25].
At the same time, none of the methods we used to study interatomic interactions (XRD, XPS, IR) detected possible chemical bonds of the metal atoms with the matrix fluorine atoms at the metal-dielectric interphase boundaries. Therefore, we attempted to detect the most probable interaction of iron and fluorine atoms using nuclear Mössbauer spectroscopy in [24].
The total amount of accumulated statistics in the Mössbauer spectrum from the (CoFeZr)51(MgF2)49 sample with the maximum magnetic alloy content x=51 at. % was more than 500 hours. In the spectrum of this sample, reproduced on the right side of Figure 6, an intense magnetic sextet (hyperfine magnetic splitting) stands out, which we attribute to iron in the composition of nanocrystals of the CoFeZr alloy with the bcc structure of α-Fe. However, along with the magnetic sextet, a paramagnetic quadrupole doublet stands out in the center of the spectrum of the nanocomposite, which belongs to iron fluoride FeF2. The ratio of the areas of these two spectra from two different phases in the nanocomposite sample (magnetic alloy CoFeZr and paramagnetic phase FeF2) is 82:18 with a total area of ​​100 for NC (CoFeZr)51(MgF2)49.
Thus, the appearance of an additional doublet from the paramagnetic phase FeF2 in the Mössbauer spectrum of the (CoFeZr)51(MgF2)49 nanocomposite indicated that chemical interaction of the boundary iron atoms with the fluorine atoms of the matrix occurs at the interfaces of the magnetic nanocrystals CoFeZr and the matrix MgF2, resulting in the formation of the paramagnetic phase of iron fluoride FeF2. This circumstance significantly affects the nonlinear electromagnetic properties of this system compared to the previous less complex system of nanocomposites Cox(MgF2)100−x containing one metal Co in the same dielectric matrix.
Further, in Figure 7A we reproduce from our work [24] the concentration dependence of electrical resistance for samples of the (CoFeZr)x(MgF2)100-x system with two extrapolation lines at different tilt angles. The intersection of these lines in the region x=30-34 at.% corresponds to the electrical percolation threshold xper. Two straight lines of different slopes indicate different mechanisms of current flow before and after the percolation threshold along high-resistance and low-resistance paths.
Figure 7B reproduces the concentration dependence of tunnel magnetoresistance
TMR= ΔR/R(0), equal to the ratio ΔR - the difference in sample resistance in the presence of an external magnetic field R(H) and in its absence R(0)- to the resistance R(0).
This dependence is extremely non-monotonic: in the dielectric region of the composites, small values ​​of TMR are recorded, with an increase in the relative content of the metal component in the range of 15<x<27 TMR sharply increases to a maximum value of ΔR/R(0) = 2.4% at x=25 at.%, and then at x>27 at.% also decreases sharply and remains insignificant in the low-resistance region beyond the percolation threshold. Thus, the maximum value of TMS in nanocomposites (CoFeZr)x(MgF2)100-x ΔR/R(0) = 2.4% is two times smaller than the corresponding value ΔR/R(0) = 5% in the simpler system Cox(MgF2)100-x, which lacks the paramagnetic phase FeF2.
In [24], we presented new data on magnetic and magneto-optical (MO) properties and the effect of phase transitions on them when changing the composition of the composite. It was found that the appearance of the coercive force at the magnetic percolation threshold in (CoFeZr)x(MgF2)100-x nanocomposites corresponds to the value xFM~ 34 at% (Figure 8A,B), coincides with the electric percolation threshold xper, and both thresholds correspond to the formation of nanocrystals of the CoFeZr alloy of the hexagonal syngony.
Since, according to the value of the coercive force Hc, magnetic materials are divided into hard magnetic (Hc≥ 50 Oe) and soft magnetic (Hc<50 Oe), then the (CoFеZr)x(MgF2)100-x nanocomposites with the maximum value Hc≈ 30 Oe at x=47at.% should be classified as soft magnetic materials in accordance with the results presented in Figure 8C.
It should also be noted that the threefold decrease in the maximum value of the coercive force Hc≈30 Oe and the significant “softening” of the magnetic properties of the (CoFeZr)x(MgF2)100-x system compared to the magnetic hard Cox(MgF2)100-x system may be due to the appearance of Fe-F chemical bonds at the interphase boundaries with the formation of the paramagnetic compound FeF2.
In addition, when studying nanocomposites using magneto-optical spectroscopy methods, two maxima were revealed on the concentration dependences of the transverse Kerr effect (TKE) (Figure 8D) corresponding to the structural-phase transitions of the CoFeZr alloy. The first maximum corresponds to the transition from an X-ray amorphous to a nanocrystalline state with a hexagonal structure at x≈30-34 at.%, and the second to the transition of CoFeZr nanocrystals from a hexagonal to a cubic body-centered structure at x≈43 at.%.
Comparing the obtained results of complex studies of the atomic composition, structural-phase organization and electromagnetic properties of two metal-insulator nanocomposite systems Cox(MgF2)100-x and (CoFeZr)x(MgF2)100-x, we come to the conclusion that the well-known composition-structure-property triad manifests itself in these materials in its entirety.
In this case, the primary factor in this triad is the atomic composition of the metal component in the nanocomposite. In our case, this is a change in the atomic composition from one metallic cobalt Co in the dielectric matrix MgF2 in the first system to a three-element alloy CoFeZr in the same matrix of the second system. The two studied systems have in common the regularity that we recorded for the first time, which consists in the fact that at the first stage of self-organization of nanocomposites during ion-beam sputtering of composite targets on substrates in both systems, a heterophase material is formed, which contains one amorphous and one nanocrystalline phase. Which of the two parts, the metallic or the dielectric, forms nanocrystals, depends on the relative content of the metallic phase x in the composite and coincides with the percolation thresholds, both electric xper (by the flow of TMS current) and magnetic xFM (superparamagnetic-soft magnetic transitions).
In this case, the different atomic composition of the metal component of the two systems Cox(MgF2)100-x and (CoFeZr)x(MgF2)100-x affects the electromagnetic properties of the nanocomposites. In both systems, the superparamagnetic-soft magnetic transitions coincide with the formation of nanocrystals of the metal component at close concentrations x = 34 at. % in the first system and x = 37 at. % in the second. However, with further increase in x in the first system, the nanocomposites with a cobalt content of Co x> 42 at. % beyond the percolation threshold transition from a soft magnetic state to a hard magnetic state with a coercive force of up to 95 Oe, whereas in the second system, with an increase in the content of the CoFeZr alloy in in nanocomposites, soft magnets with a coercivity of no more than 30 Oe remain beyond the percolation threshold. The general decrease in magnetism in a system with a three-element CoFeZr alloy can be understood using the basic idea of ​​the Giaccarino-Waller phenomenological model [26,27], which is that in transition metal alloys, the magnitude of the local magnetic moment on a d-metal atom is determined primarily by the composition of the immediate environment.
Then, in [28], it was shown that in such a model, not only the magnitude but also the direction of the local magnetic moment depends on the immediate environment of the d-metals. Therefore, with an increase in the number of chemical bonds of d-metal atoms Co, Fe, and Zr with impurity oxygen atoms and boundary fluorine atoms from the dielectric matrix, the local magnetic moments on the Co and Fe alloy atoms can not only decrease, but also flip opposite to the direction of the overall magnetization of the system. As a result, the magnetic properties of the heterogeneous multiphase nanocomposite system with CoFeZr alloy nanocrystals are significantly softened compared to nanocomposites containing cobalt nanocrystals in the same MgF2 dielectric matrix.
The next stage of our work is experimental studies of two nanocomposite systems at the atomic level. For these purposes, X-ray spectroscopy XANES (X-ray absorption near edge structure) on K-edges 3d metals Co and Fe was used.

4. XANES Spectra of the K-Edges of Co and Fe in Nanocomposites Cox(MgF2)100-x and (CoFeZr)x(MgF2)100-x

X-ray absorption spectrometry is based on measuring of the dependence of the X-ray absorption coefficient µ on the energy E of X-ray photons incident on the sample.
The linear coefficient of X-ray absorption is determined by the formula:
μ = ln I 0 I t
where I0 is the intensity of the incident radiation and It is the intensity of the radiation transmitted or reflected by the absorbing layer t of the sample.
As the energy of an X-ray photon approaches the binding energy of an electron at a deep internal level of an atom, the absorption coefficient µ(E) in the material increases sharply, and this jump is called the absorption edge. Depending on the principal quantum number n of the excited electron shell, the edges of X-ray absorption are designated by the Latin letters K (n=1), L (n=2), M (n=3), N (n=4), etc.
Near the absorption edge, the dependence µ(E) has a fine structure of an oscillating nature [29,30,31,32], which occurs due to the interference of the primary wave of the photoelectron with secondary waves that arise during its scattering by atoms of the nearest environment.
The X-ray absorption spectrum is conventionally divided into two regions [29]. One of them near threshold of absorption is called XANES (X-ray absorption near-edge structure). The energy region it occupies extends from ~50 eV before the absorption edge to 100 – 150 eV after the edge. In the low-energy region of XANES, electrons have a large mean free path in the material, are elastically scattered by atoms of the nearest environment, participating in multiple scattering. The participation of an electron in multiple scattering makes the XANES theory difficult to describe quantitatively, but even a qualitative analysis of the near-edge region of X-ray absorption spectra allows one to obtain information on the valence of the absorbing atom, the coordination environment and its symmetry by comparing the experimental spectrum with reference spectra from known phases [30].
The second region is called EXAFS (extended X–ray absorption fine structure), extends in the energy region above the absorption edge, i.e. beyond the absorption threshold by 500 – 1000 eV. This distribution is due to the fact that the mean free path of low-energy electrons is significantly higher, which allows them to travel long distances by undergoing multiple scattering, elastically reflecting from the electron shells of neighboring atoms, unlike high-energy electrons, which lose energy during the transfer of momentum through the Compton effect already at the first collision and participate in scattering once. The oscillatory structure of the EXAFS spectrum is formed due to the scattering of photoelectrons on atoms of the local environment. This method allows one to obtain an idea of ​​the local environment of the absorbing atom, the number of neighboring atoms, as well as interatomic distances [30,31,32], i.e., the short-range order of the substance.

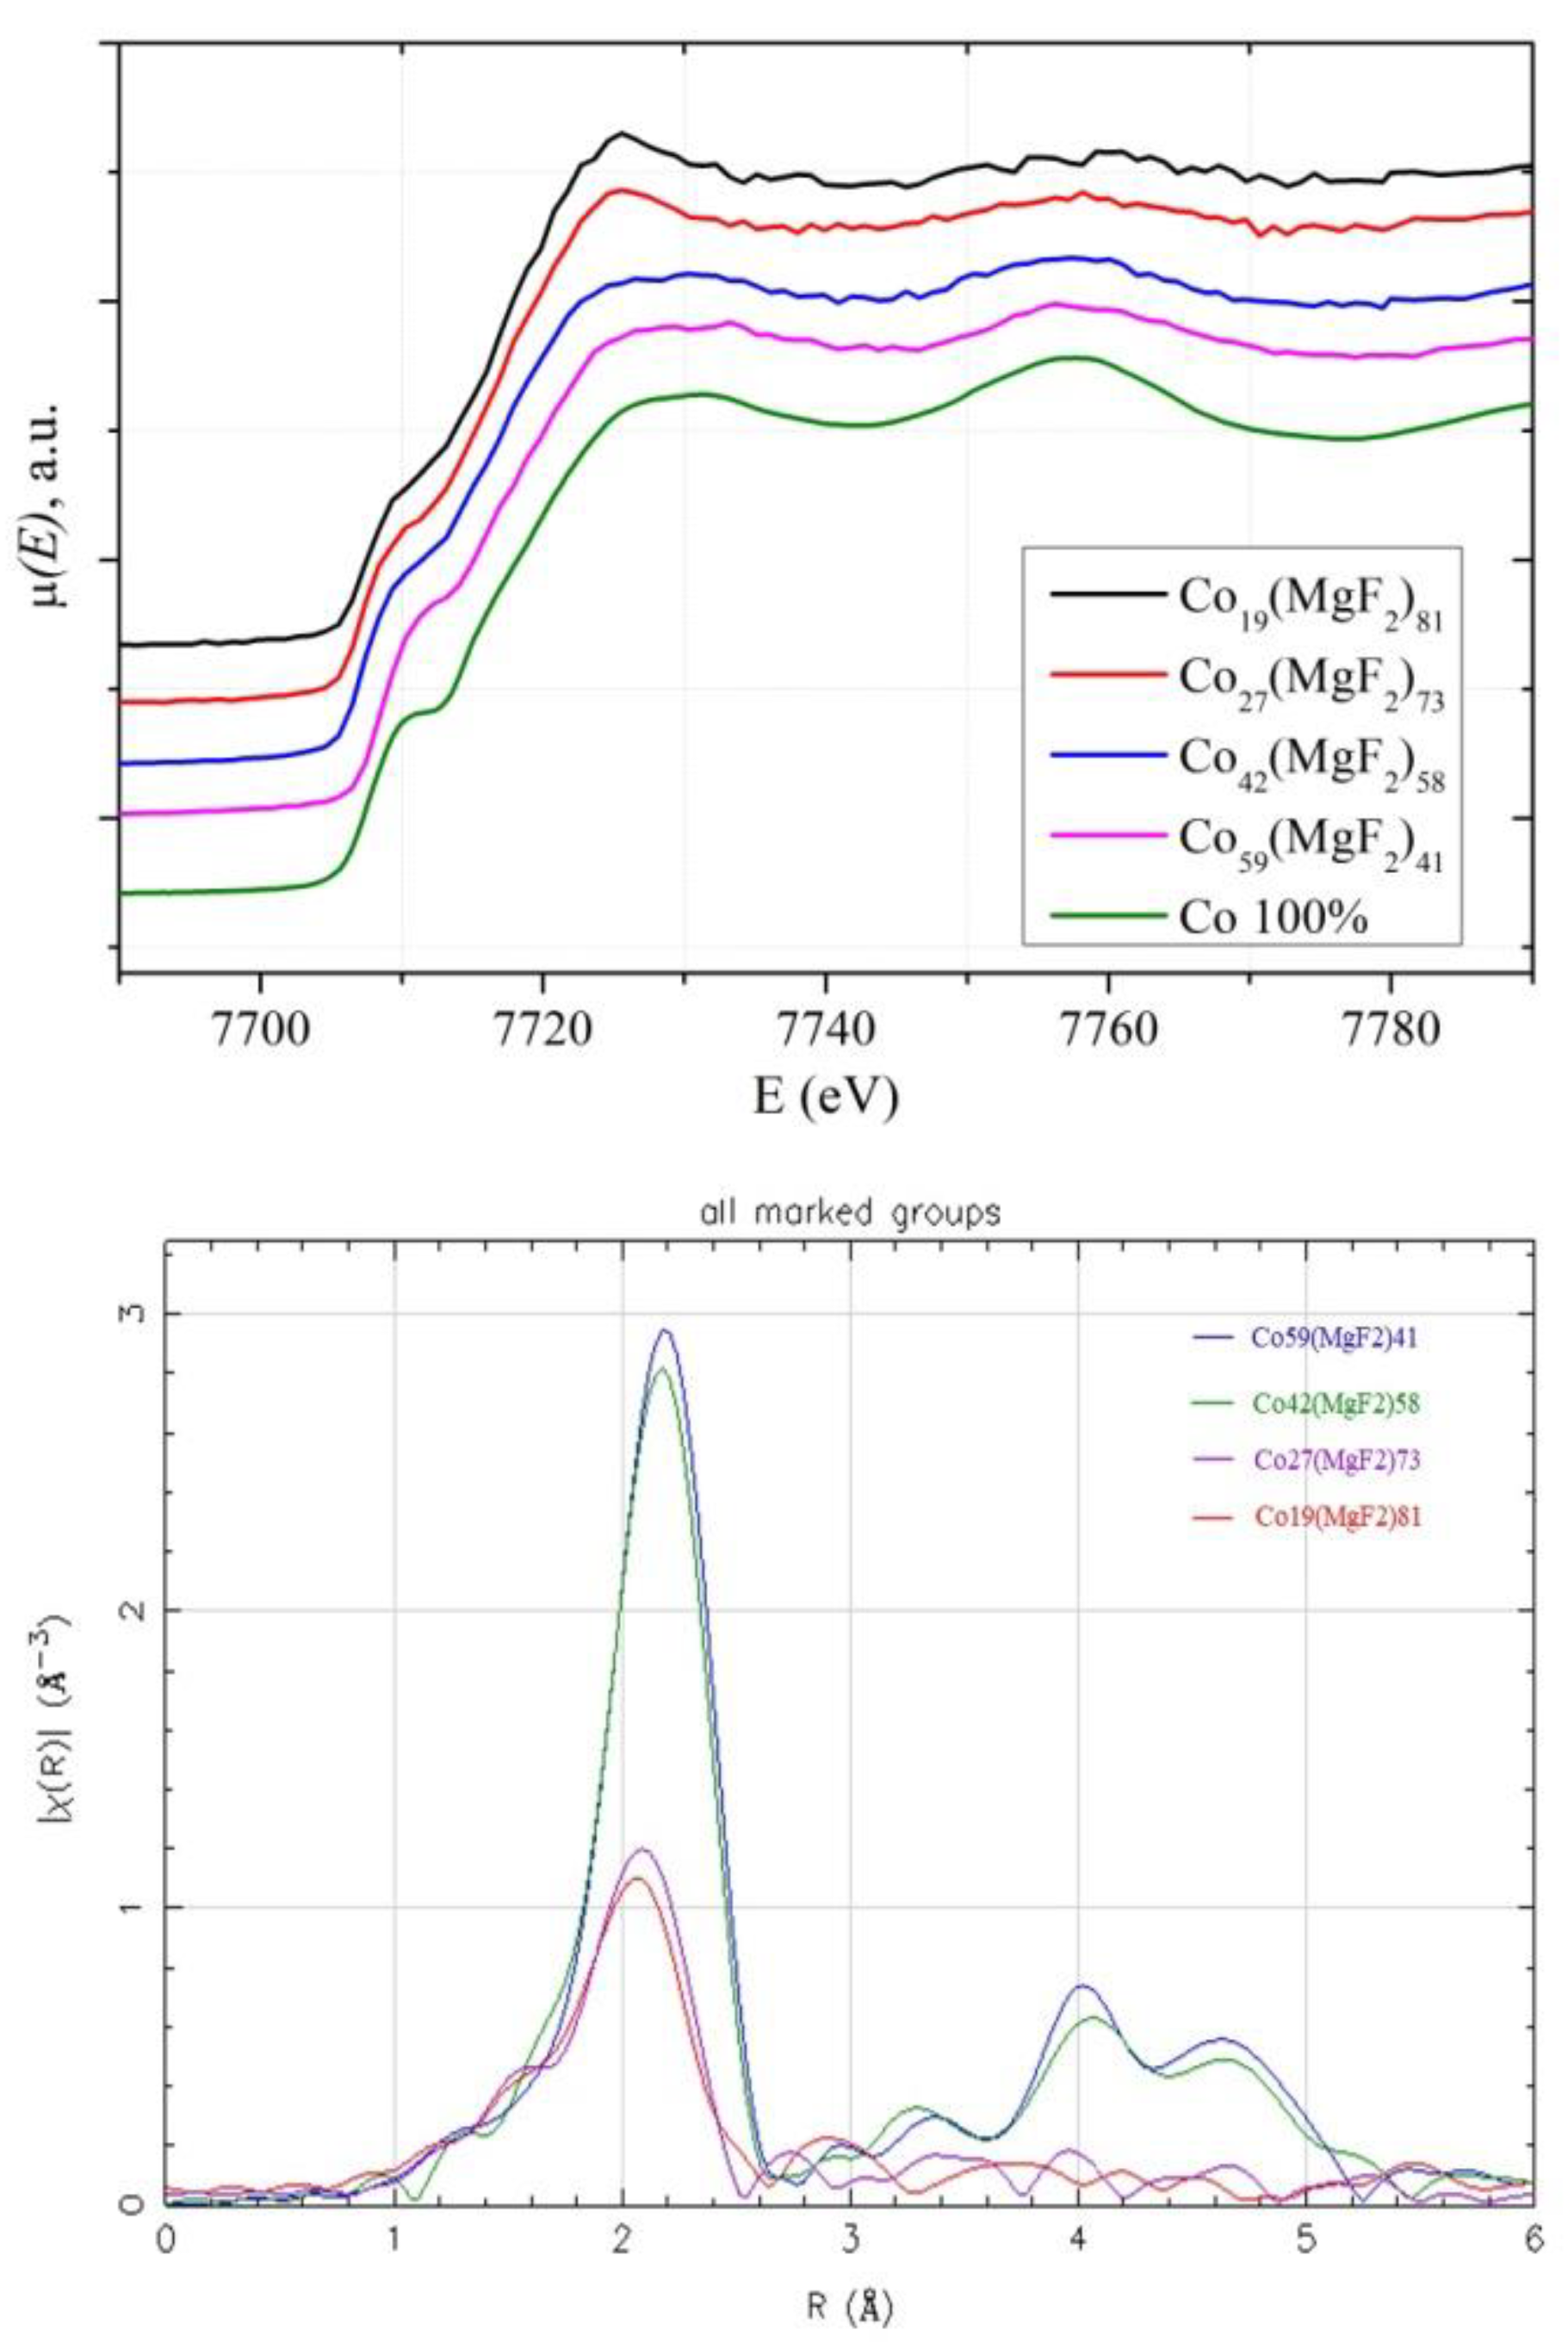
4.1. XANES Spectra of Co K-Edges in Cox(MgF2)100-x Nanocomposites

In the system of nanocomposites with metallic cobalt Co in the dielectric matrix MgF2, the XANES spectra of Co K-edge were obtained for four samples with different metal concentrations, two samples from the region before the percolation threshold (x=19, 27) and after the threshold (x=42, 59).
Figure 9A shows the XANES spectra in the Co K-edge absorption region of cobalt in these samples together with the reference spectrum (Co 100%) from the α-Co metal foil.
Visual comparison of the oscillating structure of the XANES spectra from the nanocomposite samples and the reference spectrum of the microcrystalline α-Co foil (Figure 9A) shows that in two samples with the maximum metal concentration x=59 and x=42 (beyond the percolation threshold xper=37 at.%) and nanocrystal sizes of about 20 nm, it is similar to the XANES of the reference spectrum of Co (100%).
Therefore, the symmetry of the arrangement of cobalt atoms in nanocrystals in an amorphous MgF2 matrix is similar to the symmetry of the crystal structure of metallic α-Co with a hexagonal close packing of atoms and a coordination number close to 12.
While in two other samples with a lower concentration of amorphous metal clusters x=19 and x=27 (up to the percolation threshold), the XANES spectra differ from the reference α-Co with a more intense and expressive first maximum at the main K-edge of absorption, indicating a possible change in the short-range order in nanocomposites with compositions below the percolation threshold.
The assumption of such a change was confirmed by analyzing the Fourier transform of an extended region of the experimental spectra beyond the Co K-edge of absorption, representing the radial distribution function of Co atoms without correction for the scattering phase shift (Figure 9B). Here, the main maximum of the radial distribution function of Co atoms decreases its intensity almost three times in samples with a lower metal concentration below the percolation threshold (x = 19 and 27) compared to the other two samples (x = 42 and 59) beyond the percolation threshold, indicating a decrease in the number of metal atoms in the immediate vicinity of cobalt in Co metal clusters immersed in the MgF2 nanocrystalline matrix.
Also, in the radial distribution curves up to the percolation threshold, there is no noticeable signal from the second coordination sphere at distances greater than 4 A, which additionally confirms the small size and/or strong disorder in the structure of small metallic cobalt clusters. Thus, in the Cox(MgF2)100 nanocomposite system, the concentration dependences of the structural-phase properties also manifested themselves at the atomic level of the local environment of Co atoms, which was determined based on the rearrangement of the fine structure of the X-ray absorption spectra in the region of the Co K-edges.

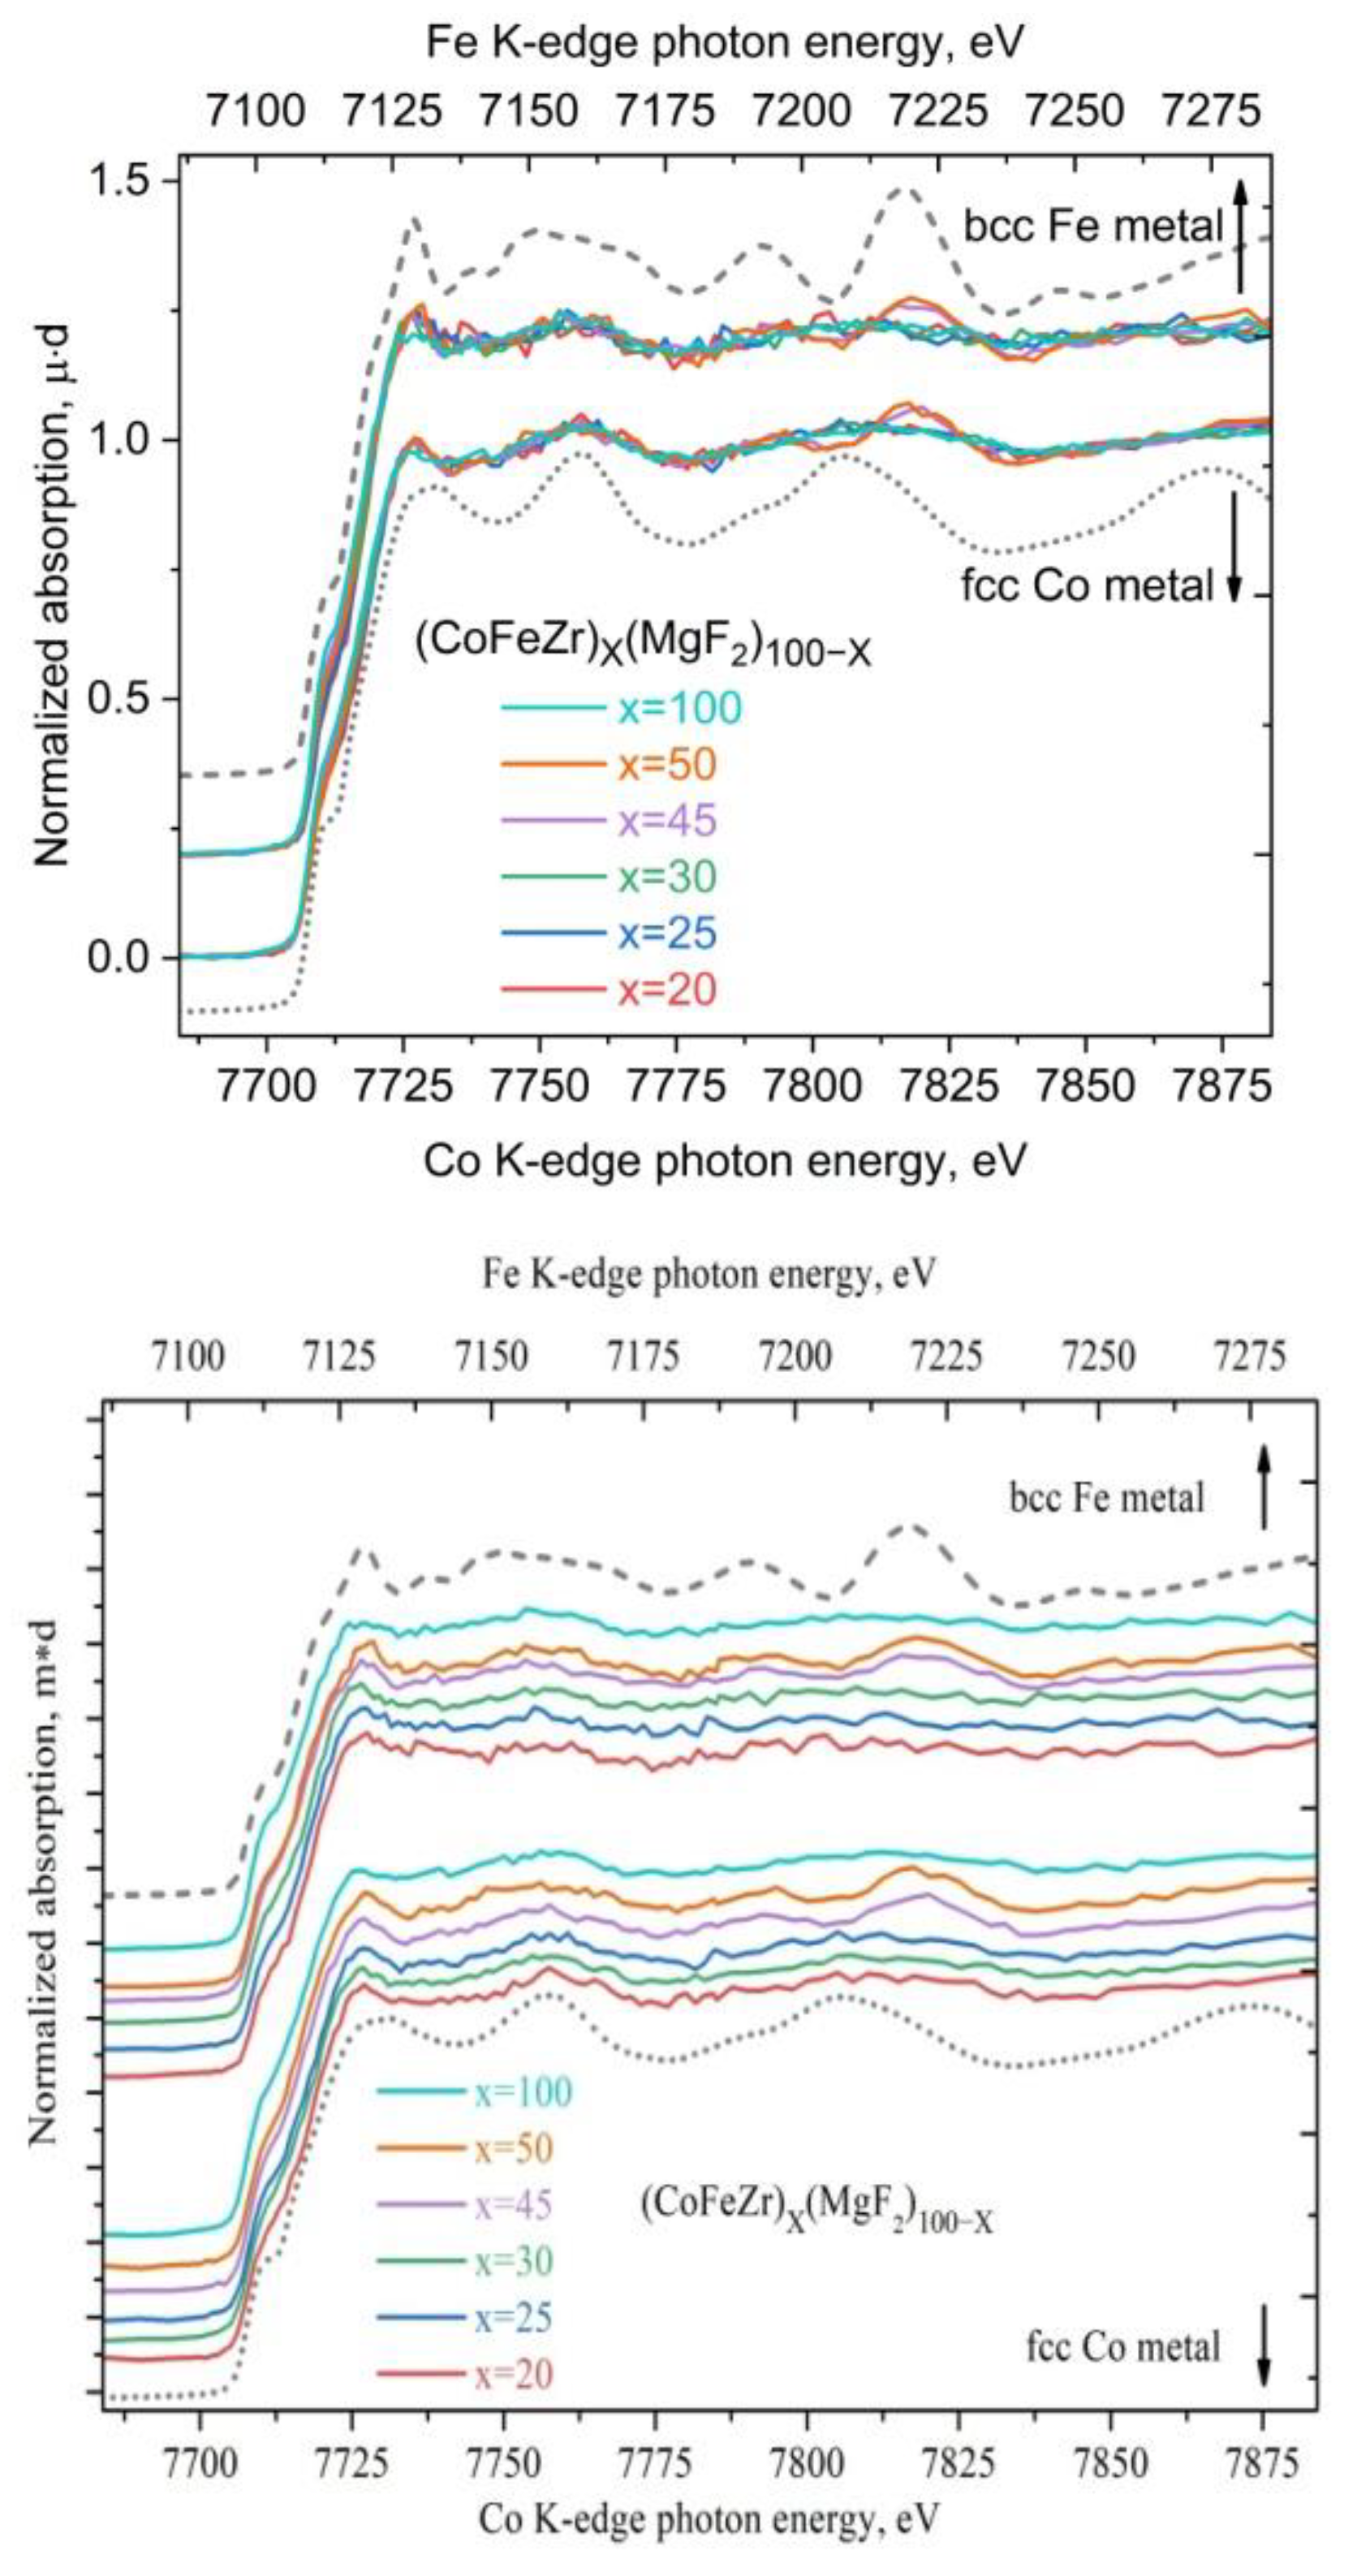
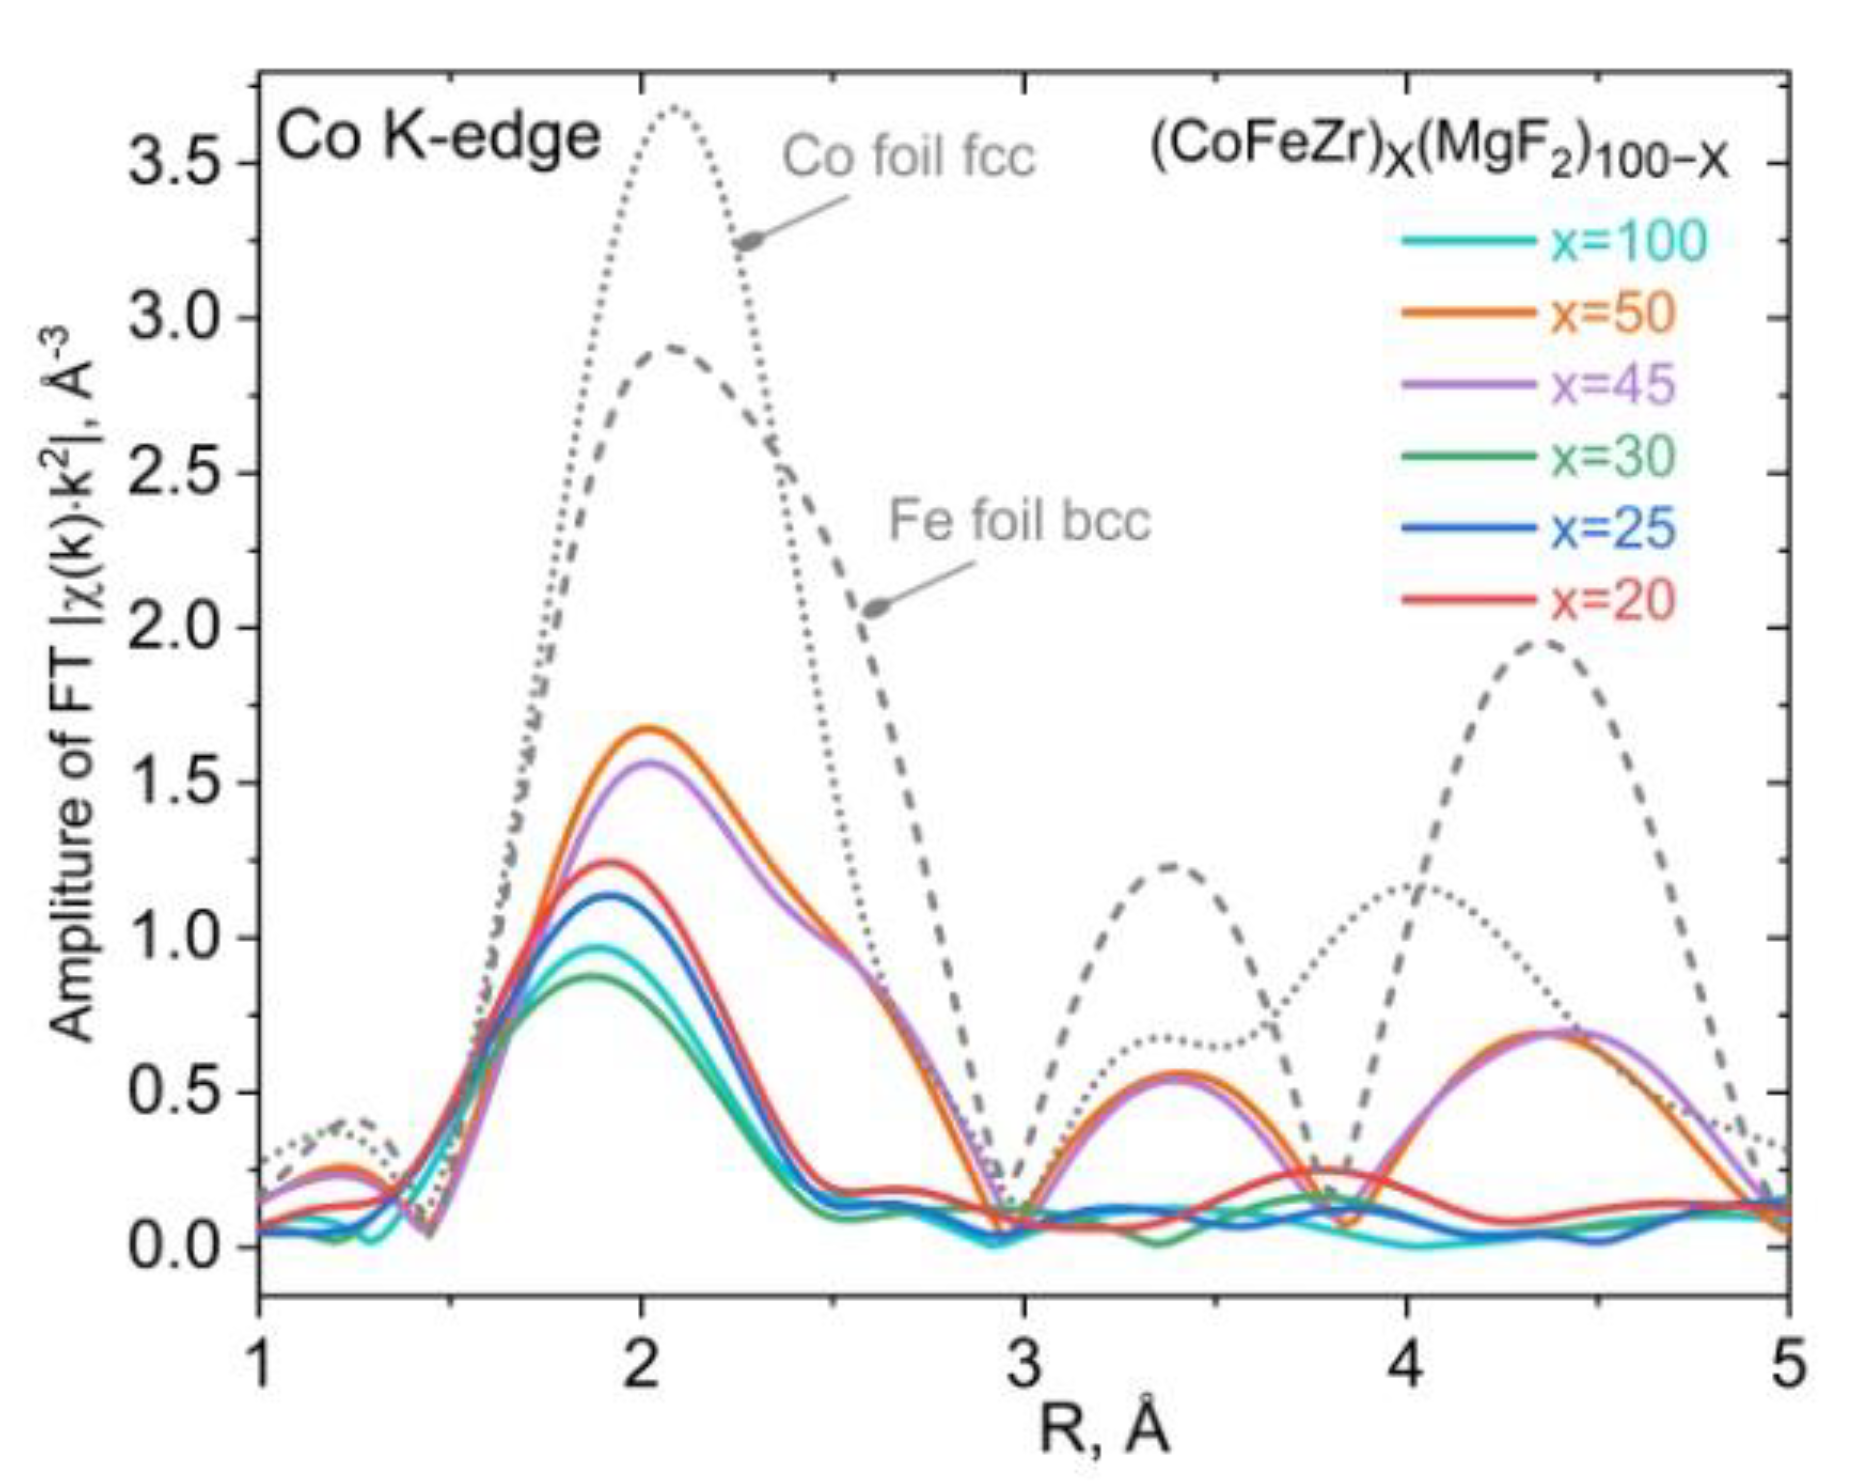
4.2. XANES Spectra of Co and Fe K-Edges in Nanocomposites (CoFeZr)x(MgF2)100-x

In the system of nanocomposites with a three-element alloy CoFeZr in a dielectric matrix MgF2, XANES spectra were obtained for six samples with different metal concentrations in the nanocomposites x = 20, 25, 30, 45, 50, 100, three samples from the region before the percolation threshold (xper = 34 at.%) and three samples from the region after the percolation threshold, including a sample of a thin-film amorphous alloy without a dielectric (x = 100).
Figure 10 shows the XANES spectra of Fe and Co with the K-edge positions for the two metals of the same alloy aligned on the main absorption threshold in a single energy scale. The energy scale for the Fe K-edge is shown at the top, and the energy scale for the Co K-edge is shown at the bottom of the figure. The dotted curves indicate the reference spectra of the metal foil α-Fe with a body-centered cubic structure and a coordination number of 8 (upper dotted curve) and the metal foil of α-Co with a hexagonal close-packed structure and a coordination number of 12 (lower dotted curve), the fine oscillatory structure of which differs significantly due to the different symmetry and different short-range of their crystal structure.
In Figure 10A, all six XANES spectra with different x values ​​for each of the two metals Fe and Co are combined in the normalized intensity scale of the absorption coefficient µ in order to demonstrate the almost complete similarity of the fine structure of the spectra in nanocomposites of any composition for both 3d metals Fe and Co located next to each other in the periodic table of elements. The similarity of the fine structure of the XANES K-spectra of the two metals indicates the equal participation of Co and Fe atoms in the formation of nanocrystals of the CoFeZr alloy of either of the two symmetries, hexagonal close-packed (up to the percolation threshold) or body-centered cubic (after the percolation threshold).
In Figure 10B, spectra with different alloy contents x are presented individually one above the other in the intensity scale to show how the fine structure of the XANES spectrum behind the K-absorption edges of the two metals simultaneously responds to a change in the symmetry of the nanocrystal structure from cobalt-like to iron-like, during the phase transition of the nanocrystals from the hcp to the bcc structure (samples x = 45; 50).
In this sistem, the most structureless, but still similar, are the XANES K-spectra of two metals Co and Fe in a sample of pure CoFeZr alloy (x=100), which is due to its amorphous state and the complete absence of long-range order, even limited by the size of the nanocrystals.
Figure 11 shows the Fourier transforms of the experimental spectra beyond the K-edge of cobalt absorption of (CoFeZr)x(MgF2)100-x nanocomposites, representing the radial distribution function of Co atoms for nanocomposites with different alloy contents x without taking into account the phase shift during photoelectron scattering. Here the main maximum of the radial distribution function of Co atoms is located close to the Co-Fe interatomic distance in the alloy, its intensity decreases almost twofold in all samples compared to the reference samples of metal foil of both metals, indicating a significant change in the short-range order in metal clusters/nanocrystals in nanocomposites towards decreasing coordination numbers. However, the Fourier transforms of two samples with the highest alloy concentration x=45 and x=50 beyond the percolation threshold xper=34at.% become similar to the Fourier transforms of α-Fe with three pronounced maxima in accordance with the phase transition of the alloy nanocrystals from the cobalt-like hcp structure (samples with x=20; 25; 30) to the iron-like bcc structure in samples x=45; 50 with maximum nanocrystal sizes of about 20 nm, determined from X-ray diffraction data presented in Figure 4.
Thus, the transformation of the local environment of two Co and Fe atoms of the magnetic alloy at the percolation threshold is manifested at the atomic level in the fine structure of the X-ray absorption spectra XANES at the K-edges of Co and Fe and in the Fourier transforms of the spectra beyond the Co K-edge absorption in the nanocomposite (CoFeZr)x(MgF2)100-x system

5. Conclusions

The obtained results of complex studies of the atomic composition, structural and phase organization, electromagnetic properties and XANES spectra of two nanocomposite systems Cox(MgF2)100-x and (CoFeZr)x(MgF2)100-x show, that for any composition, the nanocomposite consists of one X-ray amorphous phase and one nanocrystalline phase.
Which of the two components, metallic or dielectric, forms nanocrystals depends on the relative content of the metallic component x, and it is determined by the percolation threshold xper=37 at. % in the first system and xper=34 at. % in the second system. The average size of metal nanocrystals in both systems varies within 10-20 nm.
The main role of zirconium atoms of the sputtered three-element alloy Co45Fe45Zr10 is to bind impurity oxygen atoms with the formation of stable chemical bonds Zr-O in ZrO2, detected by X-ray photoelectron spectroscopy XPS using ion etching of the surface layers of nanocomposites.
At the metal-dielectric interfaces in the (CoFeZr)x(MgF2)100-x nanocomposites, the formation of Fe-F chemical bonds between iron and fluorine atoms with the formation of a paramagnetic FeF2 phase, detected by Mössbauer spectroscopy. That affects the reduction of magnetic properties in this system, compared to the Cox(MgF2)100-x system.
The percolation thresholds in Cox(MgF2)100-x nanocomposites at xper=37 at.% and in (CoFeZr)x(MgF2)100-x nanocomposites at xper=34 at.%, determined from the concentration dependences of electrical resistance, coincide with the formation of metallic nanocrystals in the amorphous dielectric matrix of MgF2.
In the concentration dependences of the magneto-optical equatorial Kerr effect in the Cox(MgF2)100−x system, one maximum is observed at the percolation threshold at x=37 at.%, coinciding with the formation of α-Co nanocrystals of hexagonal syngony, whereas in the (CoFeZr)x(MgF2)100−x system, two maxima appear, one of which (x≈30-34 at.%) corresponds to the formation of nanocrystals of the CoFeZr alloy of hexagonal symmetry, and the second maximum at x≈45 at.% corresponds to the phase transition of nanocrystals from a hexagonal structure to a cubic body-centered structure.
In the Cox(MgF2)100−x system, the formation of hexagonal Co nanocrystals occurs in the region of electric and magnetic percolation thresholds at xper≈37at.% and is accompanied by a transition of the system from the superparamagnetic to the ferromagnetic state. With an increase in the metal content (x>42 at.%), this state acquires a magnetically hard character with a coercive force of Нс ≈ 95 Oe.
In the (CoFeZr)x(MgF2)100−x system, the formation of hexagonal nanocrystals occurs in the /region of electric and magnetic percolation thresholds at xper≈34 at.%. Below this value, the nanocomposites exhibit superparamagnetic properties, and at higher x values they become soft magnetically and retain this state far beyond the percolation threshold and after the phase transition of nanocrystals from the hcp to the bcc structure at x = 43 at.%, with a maximum value of the coercive force Hc ≤ 30 Oe. We associate such a decrease in magnetism compared to the first system with the formation of the paramagnetic phase FeF2 at the interface of the CoFeZr alloy nanocrystals with the MgF2 dielectric matrix.
The concentration dependences of the structural-phase properties of the two nanocomposite systems are manifested at the level of the local environment of Co and Fe atoms, which follows from the rearrangement of the fine structure of the XANES spectra in the region of percolation thresholds.
The similarity of the oscillating structure in XANES K-spectra of two metals Co and Fe in (CoFeZr)x(MgF2)100−x of any composition indicates the same local environment of Co and Fe atoms in the CoFeZr alloy, regardless of the symmetry of the clusters and nanocrystals, hexagonal or cubic.
The oscillating structure of the XANES K-spectra of Co and Fe changes simultaneously and remains similar beyond the percolation threshold, during the phase transition from the hcp to the bcc structure (at x=43).
A significant decrease in the amplitude of the spectral oscillations in the deposited film of pure CoFeZr alloy (x=100) is explained by its X-ray amorphous state and the absence of long-range order, even limited by the size of the nanocrystals.

Author Contributions

Evelina Pavlovna Domashevskaya conceived and designed the experiments, analyzed the data; Elena Alexandrovna Ganshina designed the experiments and analyzed the data; Sergey Alexandrovich Ivkov, Lyubov Vladimirovna Guda and Valeriy Grigoryevich Vlasenko designed the experiments; Alexander Victorovich Sitnikov contributed materials.

Funding

The work was carried out with the financial support of the Ministry of Education and Science of the Russian Federation within the framework of the State Assignment, project No. FZGU-2023-006, and Agreement No. 075-15-2021-1351 in terms of XRD and XANES studies. Co-authors from Southern Federal University acknowledge the support by the Strategic Academic Leadership Program of the Southern Federal University (“Priority 2030”).

Data Availability Statement

Data available in a publicly accessible repository.

Conflicts of Interest

The authors declare no conflict of interest.

References

  1. M.N.Baibich, J.M.Broto, A.Fert Van Dau, N. F.Petroff , P. Eitenne, G.Creuzet A.Friederich , J.Chazelas. Giant magnetoresistance of (001)Fe/(001)Cr magnetic superlattices. Phys. Rev. Lett. 1988, 61, 2472–2475. [Google Scholar] [CrossRef] [PubMed]
  2. J. Erkowitz, J.R. Mitchell, M.J.Carey, A.P.Young , S.Zhang, F.E.Parker, A. Hutten , G.Thomast. Giant Magnetoresistance in Heterogeneous Cu-Co Alloys. Phys. Rev. Lett. 1992, 68, 3745. [Google Scholar] [CrossRef] [PubMed]
  3. J.Q. Xiao , J.S. Jiang, C.L.Chien. Giant Magnetoresistance in Nonmnltilayer Magnetic Systems. Phys. Rev. Lett. 1992, 68, 3749. [Google Scholar] [CrossRef] [PubMed]
  4. M. P. Levy. Giant Magnetoresistance in Magnetic Layered and Granular Materials. Solid State Phys. Adv. Res. Appl. 1994, 47, 367–462. [Google Scholar] [CrossRef]
  5. T. Miyazaki, N.Tezuka. Giant magnetic tunneling effect in Fe/Al2O3/Fe junction. J. Magn. Magn. Mater. 1995, 139, L231–L234. [Google Scholar] [CrossRef]
  6. J.S.Moodera, L.R. Kinder, T.M. Wong, R. Meservey. Large Magnetoresistance at Room Temperature in Ferromagnetic Thin Film Tunnel Junctions. Phys. Rev. Lett. 1995, 74, 3273. [Google Scholar] [CrossRef]
  7. H. Fujimori, S.Mitani, S.Ohnuma, T. Ikeda, T.Shima, T. Masumoto. High electrical resistivity behaviour of Fe- and Co-based soft magnetic heterogeneous alloys. Mater. Sci. Eng. A. 1994, 181–182, 897–901. [Google Scholar] [CrossRef]
  8. H. Fujimori, S. Mitani, S. Ohnuma. Tunnel-type GMR in Co-Al-O insulated granular system - its oxygen-concentration dependence. J. Magn. Magn. Mater. 1996, 156, 311–314. [Google Scholar] [CrossRef]
  9. S. Maekawa, U. Gafvert. Electron tunneling between ferromagnetic films. IEEE Trans. Magn. 1982, 18, 707–708. [Google Scholar] [CrossRef]
  10. S.A.Gridnev, Y.E. Kalinin, A.V. Sitnikov, O.V.Stogne. Nonlinear phenomena in nano- and microheterogeneous systems. BINOM. Knowledge laboratory [in Russian], Moscow. 2012. [Google Scholar]
  11. Stognei, Electrical transfer and magnetic properties of amorphous nanogranular metal-dielectric composites. Abstract of a dissertation for the degree of Doctor of Physical and Mathematical Sciences, Voronezh State Technical University, Voronezh, 2004; p. 280.
  12. N . Kobayashi, S.Ohnuma, T.Masumoto, H. Fujimori. (Fe-Co)-(Mg-fluoride) insulating nanogranular system with enhanced tunnel-type giant magnetoresistance. J. Appl. Phys. 2001, 90, 4159–4162. [Google Scholar] [CrossRef]
  13. D. Yao, S.Ge, B.Zhang, H. Zuo, X. Zhou. Fabrication and magnetism of Fe65 Co35 -MgF 2 granular films for high frequency application. J. Appl. Phys. 2008, 103. [Google Scholar] [CrossRef]
  14. T. Tregubova, O.Stognei, V. Kirpan. Magnetotransport properties of Cox(MgF2)100-x oxygen-free nanocomposites. EPJ Web of Conferences.Moscow International Symposium on Magnetism; 2018; p. 01014. [Google Scholar] [CrossRef]
  15. T. Tregubova, O. Stogney, I. Tregubov, V.Kirpan et al. Electrical and magnetoresistive properties of oxygen-free composites Cox(MgF2)100-x. Vestnik of Voronezh State Technical University. 2017, 13, 127. [Google Scholar] [CrossRef]
  16. E.A.Ganshina, S.A Ivkov, E.P. Domashevskaya et al. Effect of phase transformations of a metal component on the magneto-optical properties of thin-films nanocomposites (CoFeZr)x(MgF2)100-x. Nanomaterials 2021, 11, 1666. [Google Scholar] [CrossRef] [PubMed]
  17. E.Ganshina, V. Garshin, N.Perova, G.Zykov, A. Aleshnikov, Y.Kalinin, A.Sitnikov. Magneto-optical properties of nanocomposites ferromagnetic-carbon. J. Magn. Magn. Mater. 2019, 470, 135–138. [Google Scholar] [CrossRef]
  18. E.A Balykina, E.A.Gan’shina, G.S.Krinchik. Magnetooptic properties of rare-earth orthoferrites in the region of spin reorientation transitions. JETP 1987, 93, 1879–1887. [Google Scholar]
  19. В.Ravel, M.Newville. ATHENA, ARTEMIS, HEPHAESTUS: data analysis for X-ray absorption spectroscopy using IFEFFIT. J. Synchrotron Radiat. 2005, 12, 537–541. [Google Scholar] [CrossRef]
  20. E.P. Domashevskaya, S.A.Ivkov, A.V. Sitnikov, O.V. Stogney, A.T.Kozakov, A.V.Nikolsky. Formation of nanocrystals of a metal or dielectric component depending on their *relative content in Cox(MgF2)1-x composites. Solid State Physics 2019, 61, 211–219. [Google Scholar] [CrossRef]
  21. E.P. Domashevskaya, S.A Ivkov, O.V. Stogney, A.V.Sitnikov. Mutual influence of the relative content of the metallic and dielectric component on the phase composition and substructure of nanocomposites Cox(MgF2)1-x. 8th International Conference on Nanotechnology and materials science, Netherlands, Amsterdam, April 24-26. 2019; p. 81. [Google Scholar]
  22. S.A. Ivkov, K.A. Barkov, E.P.Domashevskaya et al. Nonlinear Transport and Magnetic/Magneto-Optical Properties of Cox(MgF2)100-x Nanostructures. Appl. Sci. 2023, 13, 2992. [Google Scholar] [CrossRef]
  23. E.P. Domashevskaya, S.A. Ivkov, A.V. Sitnikov et al. The features of CoFeZr nanocrystals formation in film composites of (CoFeZr)x(MgF2)100-x. Journal of Alloys and Compounds. 2021, 870, 159398. [Google Scholar] [CrossRef]
  24. E.P Domashevskaya, S.A. Ivkov, P.V. Seredin, D.L. Goloshchapovet al. Nonlinear electromagnetic properties of thinfilm nanocomposites (CoFeZr)x(MgF2)100−x. Magnetochemistry. 2023, 6, 160. [Google Scholar]
  25. M.E. Тhomas, K.A. Stefan, M.C. Thomas, T. Kim. Infrared properties of polycrystalline magnesium fluoride. Infrared Physics & Technology. 1998, 39, 213–222. [Google Scholar]
  26. V. Jaccarino, L.R. Walker. Discontinuous occurrence of localized moments. Phys. rev. Lett. 1965, 15, 258–259. [Google Scholar] [CrossRef]
  27. R. Grössinger, G. Hilscher, G. Wiesinger. Temperature and concentration dependence of magnetization, magnetocrystalline anisotropy and hyperfine parameters in Zr(Fe1-xAlx)2. J. Magn. Magn. Mater. 1981, 23, 47–58. [Google Scholar] [CrossRef]
  28. M. El-Hilo, K. O’Grady, R.W. Chantrell. Chantrell, The ordering temperature in fine particle systems. 1992, 117, 21–28. [Google Scholar]
  29. D. Norman. X-ray absorption spectroscopy (EXAFS and XANES) at surfaces. Journal of Physics C: Solid State Physics. 1986, 19, 3273–3311. [Google Scholar] [CrossRef]
  30. G. Bunker. Introduction to XAFS: A practical guide to absorption fine structure spectroscopy; Published in the United State of America by Cambridge university press: New York, 2010. [Google Scholar]
  31. Ya. V. Zubavichus, Yu. L. Slovokhotov. X-ray synchrotron radiation in physicochemical studies. Advances in Chemistry (Rus) 2001, 70, 429–463. [Google Scholar]
  32. G. V. Fetisov. Synchrotron radiation: methods for studying the structure of matter. Moscow, FIZMATLIT. 2007. [Google Scholar]
Figure 1. The main parts of the laboratory X-ray absorption spectrometer for measuring X-ray absorption spectra in transmission and fluorescence modes. Goniometer compartment 1 contains an X-ray tube 1.1, a turbomolecular pump 1.2 and a monochromator 1.3. These devices are mounted on a Rowland circle and direct monochromated radiation into the measuring chamber 2. Detector 2.1 measures the intensity of incoming radiation, while detector 2.2 or detector 2.3 measures the intensity of fluorescence or radiation passing through the sample, respectively. Sample 2.4 is mounted on a rotating holder, which is adjusted for both measurement schemes.
Preprints 145119 g001
Figure 2. Diffractograms of Cox(MgF2)100−x nanocomposite samples of different compositions on the glass substrates. The x values ​​in at.% are indicated on the right of each diffractograms. The upper diffractogram belongs to metallic α-Co, and the lower one to polycrystalline MgF2 [20].
Preprints 145119 g002
Figure 3. Concentration dependences of electrical resistance R (A) and tunnel magnetoresistance TMR (B) of Cox(MgF2)100-x nanocomposites [22].
Preprints 145119 g003
Figure 4. Concentration dependences in Cox(MgF2)100-x nanocomposites: (A) transverse Kerr effect TKE at different values ​​of incident light energy and (B) coercive force Hc [22].
Preprints 145119 g004
Figure 5. Diffractograms of (CoFeZr)x(MgF2)100−x nanocomposite samples of different composition on glass substrates [23]. The values ​​of x in at.% are indicated on the right of each diffractograms. The two upper diffractograms belong to metallic samples of α-Co and α-Fe, and the lower one to polycrystalline MgF2 [23].
Preprints 145119 g005
Figure 6. Mössbauer spectra from the calibration sample of α-Fe (left) and from the nanocomposite sample (CoFeZr)51(MgF2)49, measured at room temperature (right) [24].
Preprints 145119 g006
Figure 7. Concentration dependences of electrical resistance R (A) and tunnel magnetoresistance TMR (B) of (CoFeZr)x(MgF2)100-x nanocomposites [24].
Preprints 145119 g007
Figure 8. The absence of the hysteresis loop at x = 30 (A) and its appearance at x = 34 (B) in (CoFeZr)x(MgF2)100-x nanocomposites. Concentration dependences of the coercive force Hc (C) and the transverse Kerr effect TKE (D) at different values ​​of the energy of light incident on the sample [24].
Preprints 145119 g008
Figure 9. (A) XANES spectra in the region of the Co K-absorption edge and (B) Fourier transforms of the experimental spectra beyond the Co K-absorption edge in nanocomposites with different Co concentrations x.
Preprints 145119 g009
Figure 10. XANES spectra of Fe and Co with K-edges aligned in a single energy scale. The dotted curves denote the reference spectra of α-Fe and α-Co metal foils. In Fig.(A) all six XANES spectra with different x values ​​are combined in the normalized intensity scale of the absorption coefficient µ for each of the two metals. In Fig.(B) the same XANES spectra with different x values ​​are presented individually one above the other in the intensity scale.
Preprints 145119 g010
Figure 11. Fourier transform of the spectra behind the Co K-edge of absorption in samples with different alloy contents x in (CoFeZr)x(MgF2)100-x nanocomposites. The dotted curves represent the reference samples of hcp α-Co and bcc α-Fe foils.
Preprints 145119 g011
Disclaimer/Publisher’s Note: The statements, opinions and data contained in all publications are solely those of the individual author(s) and contributor(s) and not of MDPI and/or the editor(s). MDPI and/or the editor(s) disclaim responsibility for any injury to people or property resulting from any ideas, methods, instructions or products referred to in the content.
Copyright: This open access article is published under a Creative Commons CC BY 4.0 license, which permit the free download, distribution, and reuse, provided that the author and preprint are cited in any reuse.
Prerpints.org logo

Preprints.org is a free preprint server supported by MDPI in Basel, Switzerland.

Subscribe

Disclaimer

Terms of Use

Privacy Policy

Privacy Settings

© 2025 MDPI (Basel, Switzerland) unless otherwise stated