Submitted:
10 May 2023
Posted:
11 May 2023
You are already at the latest version
Abstract
Ni1-xGdxFe2O4 (x=0.02, 0.04, 0.06 & 0.08) (NGF) nanoparticles were synthesized via hydrothermal method. The X-ray diffraction study confirmed the single-phase cubic spinel structure. The morphology indicated the stones (approximately nanocubes) like structures in the FESEM images. The mass loss, and thermal transition temperatures were evaluated as a function of Gd-content using TG-DTG, and TG-DSC measurements. The M-H loops evidenced the high magnetization values for NGFO as compared to pure nickel ferrite. Cation distribution showed the preferred occupancy of cations in the magnetic spinel system. Frequency dependence of dielectric, conductivity, and impedance parameters was elucidated with increase in Gd-content.
Keywords:
Nanoparticles
; Ferrites
; Hydrothermal
; Microscopy
; Magnetic
; Dielectric
1. Introduction
It is a known fact that the ferrites belong to magnetic spinel structure having a chemical formula AB2O4 (where A & B are tetrahedral (A), and octahedral (B) sites, respectively). For instance, NiFe2O4, MgFe2O4, CuFe2O4, ZnFe2O4, MnFe2O4, FeFe2O4, CoFe2O4, CdFe2O4 etc., are the ferrite ceramics exhibiting the ferrimagnetic nature. These are classified into normal spinels, inverse spinels, and mixed spinels based on the degree of inversion (δ) which describes the cationic distribution at A, and B-sites. That is, δ=1 for normal spinel (Ex: ZnFe2O4, MgAl2O4, CdFe2O4 etc., in bulk form), δ=0 for inverse spinels (NiFe2O4, Fe3O4, CoFe2O4 etc., in bulk form), and δ=0.25 (0<δ<1) for mixed spinels (NiFe2O4, & MgFe2O4 etc., in nanoform) [1,2]. The pictorial representation of classification of spinels, and alignment of magnetic spins is shown in Figure 1. The properties of ferrites in bulk form are usually different from nano as reported in literature [2]. For example, NiFe2O4 is inverse spinel in bulk form, whereas the same shows mixed spinel structure in nanoform. This can be attributed to the cation distribution between A, and B-sites. Owing to this interesting behavior in nickel ferrite, several researchers worked on bulk, and nano nickel ferrites for various structure, optical, magneto-electric, morphological, electrochemical, microwave, and catalytic properties [2].
Investigations were performed by scientists, and further started working on various rare-earth dopants, and substituents into the spinel nickel ferrite system. In this regard, Parida et al. [3], reported the magnetic, and magnetoelectric behavior of Gd-doped nickel ferrite, and barium titanate nanocomposites. Sattibabu et al. [4], investigated the neutron diffraction, and magnetic properties of NiFe2-xScxO4. Hao et al. [5], provided the enhanced resistive switching, and magnetic nature of NiGdFe2O4 thin films. Chauhan et al. [6], prepared the NiDyFe2O4 nanopowders via combustion technique, and studied the structure, microstructure, and electrical behavior. Dixit et al. [7], reported the magnetic resonance behavior of NiGdCeFe2O4 nanoparticles. Sahariya et al. [8], synthesized the iron deficient NiGdDyFe2O4 samples, and studied magnetic Compton scattering nature. Sonia et al. [9], synthesized the NiGdFe2O4 nanocrystallites using Sol-Gel method, and investigated the structure, microstructure, and magneto-dielectric behavior. Ugendar et al. [10], synthesized the iron deficient NiGdFe2O4, NiDyFe2O4, and NiHoFe2O4, and reported the magnetic behavior, Mossbauer study, and cationic distribution. Akhtar et al. [11], prepared the graphene based NiReFe2O4 (Re=Yb, Gd & Sm) nanocomposites, and reported the structural, magnetic, bandgap, and conductive behavior. Guo et al. [12], reported the structure, and magnetic nature of NiSmFe2O4 nanofibers. Chen et al. [13], prepared the nickel ferrite hollow nanospheres via gel assisted hydrothermal method, and reported the magnetic properties. Dixit et al. [14], prepared the NiCeFe2O4 nanoparticles, and reported the structure, magnetic nature, and electronic properties. Joshi et al. [15], reported the structure, magneto-dielectric nature of NiGdFe2O4 nanoparticles. Shah et al. [16], provided the review in detail on novel catalysts for visible light assisted dye degradation in case of spinel structured ceramics. Sabikoglu et al. [17], reported the structural, and magnetic behavior of NiNdFe2O4 ceramics. Almessiere et al. [18], also provided the structure, and magnetic nature of NiDyFe2O4 nanoparticles. Yao et al. [19], prepared the NiGdFe2O4 thin films through Facile Sol-Gel method, and reported the structural, optical, magnetic behavior. Almessiere et al. [20], evidently discussed the effect of dysprosium element on nickel ferrite in respect of magnetic behavior. Yehia et al. [21], synthesized the NiGdFe2O4 nanoparticles, and investigated the structural, and magnetic properties along with the effect of Gd in the spinel system. From this vast literature survey, it was understood that the Ni1-xGdxFe2O4 (x=0.02-0.08) nanoparticles were prepared by several scientists reporting the structure, and magnetic nature. Moreover, the preferred methods were considered as sol-gel, autocombustion, solid state reaction, and thin film methods. At this juncture, an attempt was made to prepare the Ni1-xGdxFe2O4 (x=0.02-0.08) nanoparticles via hydrothermal method (provides benefits like inexpensive, easy synthesis, low temperature requirement, less time consumption, high crystallinity etc.) investigating the detailed structural (X-ray diffraction study), microstructural (grain size, and particle size analysis), electrical (dielectric, electrical conductivity, impedance parameters), magnetic (M-H curves, cation distribution), and thermal (TG-DTG & TG-DSC) properties.
2. Materials:
In order to prepare the Ni1-xGdxFe2O4 (x=0.02 - 0.08) nanoparticles, the precursors were selected as Gd (NO3)3.6H2O, Ni (NO3)2.6H2O, and Fe (NO3)3.9H2O in nitrate form having the purity 99.98 %-Sigma Aldrich. Besides, the Teflon bowl of 300 ml capacity, stainless steel autoclave, hot air oven, magnetic stirrer with hot plate, glassware etc., were also used in the sample preparation.
3. Synthesis Method:
In the current work, the samples were synthesized via hydrothermal method (Figure 2). At the outset, the precursors were weighed according to stoichiometric proportion, and dropped in a fresh glass beaker. The distilled water was poured into the nitrate precursor in 1:4 ratio. The beaker was kept on magnetic stirrer, and stirred constantly at 30oC for 2 hrs. Hence, the brown precursor solution was formed. In the meantime, the NaOH solution was dropped slowly using rubber head dropper. This process was continued till pH reaches 12 as it helps the compound to form completely without secondary phases. The final solution was deposited in Teflon bowl and kept in stainless steel autoclave. The screws were made tight, and the autoclave was kept in hot air oven. The hydrothermal reaction was carried out at 423 K for 6 hrs. Upon completion of reaction, the hot air oven was quenched to room temperature. Then, the autoclave was separated from oven, and further the Teflon bowl was removed. The nanoparticles were found at underneath of distilled water. The surface water was removed via centrifuge process. The remained nanoparticles were extracted from bowl and kept in a glass dish. This was heated using hot plate at 333 K for 2 hrs to remove the moisture, and water content (if any). The samples were pressed into pellets of thickness 0.14 cm, and radius 0.66 cm. Later, the pellet (Figure 3), and powder samples were characterized for the X-Ray diffraction (XRD) (Bruker), FESEM (Ultra 55, Carl Zeiss), LCR-controller (HIOKI 3532-50), TG-DTA (30-700 oC), and VSM (EV-7 H = +15000 Oe.) to investigate the structure, morphology, dielectric behavior, thermal analysis, and magnetic behavior of Ni1-xGdxFe2O4 (x=0.02 – 0.08) nanoparticles.
4. Results, and Discussion
The X-ray diffraction (XRD) patterns of x=0.02-0.08 evidenced the phase purity, crystallinity, unit cell dimensions etc. In Figure 4, the ferrites showed significant intensity for all phases. All the samples expressed, the single-phase cubic spinel structure. But, on the other hand, a minute phase is detected at 2-theta angle at 43.56o. This is obtained due to the trivalent rare-earth cations (Gd3+) present in the nickel ferrite system. Shannon ionic radii table [22], evidences a fact that the ionic radii of Ni2+=0.060 nm, Gd3+=0.0938 nm, Fe2+=0.063 nm, and Fe3+=0.049 nm cations can be responsible for either single-phase or multi-phase structure. On doping Gd into nickel ferrite system, due to high ionic radii difference (>15 %), Gd3+ cations cannot replace Ni2+/Fe3+ ions without any consequences. The conversion of Fe3+ to Fe2+ becomes predominant upon occupying the Ni2+ site. This reinforces the increase of unit cell dimensions. Herein, the high ionic radii difference, and different valency positions are responsible for the formation of secondary phases as suggested by Hume-Rothery rule [23]. Thus, a small secondary phase is evolved at 43.56o. The similar observation is reported by Raghuram et al. [24]. The average crystallite size (Da) of all diffraction peaks is calculated using Scherrer equation: D=0.9λ/βCosθ, where ‘β’ is the full width half maxima, and ‘θ’ is the angle of diffraction [25]. The Da value is first decreased from 24.8 nm to 18.7 nm (for x =0.2-0.4). Further, it is increased to 43.4 nm from x=0.4-0.8. This kind of variation is ascertained owing to the effect of micro-strain as a function of ‘x’. The maximum intensity is recorded for (311) plane of x=0.02-0.08. The lattice constants are computed using a=d (h2+k2+l2)0.5, where d=interplanar spacing, and (hkl) are the Miller indices. The results obtained (see Table 1) suggested that the lattice constants are increasing from 0.8956 to 0.8975 nm with increase in ‘x’ from 0.02-0.08. This kind of manner is achieved owing to the high ionic radii of Gd3+ cations, and conversion of ferric ions to ferrous ions within the cubic spinel system (NiFe2O4). Moreover, the phase shift provided in the inset of Figure 1 towards lower 2-theta angles indicates the decrease of lattice constants. Subsequently, the unit cell volume (V=a3) of x=0.02-0.08 showed the increasing trend from 0.622 to 0.626 (Å)3. The theoretical density is calculated using ρx =ZMW/NV, where Z=8 (effective number of atoms per unit cell), MW= compositional molecular weight, N=6.023*1023, and the other symbols have their own meaning. The obtained densities showed that the values are increasing from 5.047 to 5.143 g/cm3 with x. This kind of trend is attributed to the increase of compositional molecular weight from 236.355 to 242.268 g/mole as a function of ‘x’. Similarly, the surface area (S=6/Daρx) is calculated and found to be varying inversely proportional to the crystallite size. The values are found to be altering between 26.9 to 63.2 m2/g.
The surface morphology evidenced that the stones like (almost nanocubes) grains are found in FESEM images of x=0.02-0.08 (Figure 5). Even in the HRTEM images (Figure 6) also, the similar nanoparticles are noticed. For all FESEM images, in order to determine the grain size, the linear intercept method is used. According to this method, the average grain size Ga is calculated using an equation: 1.5L/MN, where L stands for test line length, M refers to magnification, and N shows the number of grains intersecting the test line [24]. The results offered that the Ga value is varying unsystematically from 111 to 180 nm. That is, for x=0.02 (149 nm) to 0.04 (168 nm), it is increased, and for x=0.06 (111 nm) to 0.08 (180 nm), again it is increased. It is also observed that the homogeneity is increased with increase in Gd-content. Moreover, the shape of grain is little bit converted to almost nanocube with ‘x’. In HRTEM (Figure 6) also, the nanoparticles are not of pure nanocubes. Minute amount of distortion happened. It may be due to selected spot of the sample dispersed in the copper grid. For x=0.08 sample, it looks to be nanocubes having smoothened corners. Due to magnetic interactions, the grains/particles are connected to each other within the morphology.
The thermal analysis of Ni1-xGdxFe2O4 (x=0.02 – 0.08) nanoparticles is performed using TG-DTG, and TG-DSC curves. It is well-known that the TG plots evidence the mass loss with increase of temperature, whereas the DTG plots offer the thermogram peaks where the hydrate ions can be removed, and decomposition of nitrates (organic/inorganic) takes place. Besides, the decomposition of metallic/non-metallic species can be identified. In Figure 7, TG-DTG plots are shown. The plots addressed a fact that for x=0.02, and 0.04, the mass losses are noted to be 7.81, and 8.45 %, respectively. It is evident that the mass loss is increased from x=0.02 to 0.04. In the similar fashion, for x=0.06, and 0.08, the mass losses are found as 6.68 to 7.13 %, respectively. The similar trend is followed for these samples like x=0.02-0.04. As a whole, it is confirmed that the x=0.04 showed high mass loss while x=0.06 provided low mass loss. Further, the DTG plots of x=0.02-0.08 revealed three considerable peak temperatures around 200, 400, and 1330oC. The thermogram peak temperatures of spinel ferrites at around 200oC indicate the removal hydrate ions from the samples. Similarly, the nitrates can be removed from the samples at around 400oC. The sharp peaks are seen at around 1330oC for x=0.02-0.08 expressing the decomposition of residual species. For x=0.02-0.08, the residual peak temperature is increasing with increase in ‘x’ from 1315 to 1332oC. Figure 8 shows the TG-DSC plots of x=0.02-0.08. It is familiar that the TG-DSC curves represent the thermal transition temperatures such as glass transition (Tg), crystallization (Tc), and melting (Tm) temperatures. The grass transition temperatures are found to be decreased from 192 to 182 for x=0.02-0.04. For further increase of Gd-content, the Tg values are increased. This can be attributed to the ferri to paramagnetic transition. The variation trend of these temperatures is similar to the variation of crystallite size. Hence, it is confirmed that the crystallite size shows effect on thermal transition temperatures. After crossing Tg, the crystallization process will be initiated. Owing to this, beyond Tg, the atomic diffusion takes place, wherein, the atomic nuclei can be produced. Subsequently, the crystal grains are formed. Therefore, these crystal grains lead to the crystallization of samples at crystallization temperature. The Tc values of x=0.02-0.08 are found to be increasing from 910 to 1110oC. From TG-DSC curves, endothermic or exothermic reaction can be understood for x=0.02-0.08. At crystallization temperatures, the energy is released owing to low free energy, and enthalpy. Hence, it comes under exothermic reaction suggesting the formation of Ni1-xGdxFe2O4 (x=0.02 – 0.08) compound. The endothermic peak temperatures (melting) are increased from 1310 to 1370oC with increase in ‘x’ from 0.02-0.08. At these temperatures, the samples initiate absorbing heat, and shifts into the liquid form. Thus, these are connected to the endothermic reactions. Above the melting temperatures, the oxidation temperatures are considered for all nanoferrites.
Figure 9 shows the magnetization versus applied magnetic field (M-H) curves of Ni1-xGdxFe2O4 (x=0.02 – 0.08) nanoparticles. It is observed that the well-define hysteresis curves are formed for x=0.02-0.08. Herein, the curves are not completely saturated suggesting the requirement of higher magnetic field than 15k Oe. However, the saturation magnetization (Ms) values are evaluated using the law of approach to saturation (LAS) plots (see the inset of Figure 9). Therefore, the Ms values are extracted, and listed in Table 3. The results indicate that the magnetization values are decreased from 62.1 to 49.1 emu/g (for x=0.02-0.04). For further increase of Gd-content, the magnetization is increased from 49.1 to 57.1 emu/g (for x=0.04-0.08). This trend is similar to the variation of crystallite size, and glass transition (magnetic transition) temperatures as a function of ‘x’. Similarly, the retentivity (Mr) is following the identical trend and found to be varying from 16.1 to 19.6 emu/g with Gd-content. The squareness (Mr/Ms) of x=0.02-0.08 shows that the values are altering between 0.316 to 0.328. It is a familiar fact that the Mr/Ms values <1/2 suggest the multi-domain magnetic structure while the similar values having >1/2 indicate the single-domain magnetic structure. But for the present NGF nanoparticles, it is noted that these values are less than ½. Hence, the magnetic structure of NGF samples is of multi-domain. The coercivity is observed to be varying between 789 to 824 Oe., as a function of ‘x’. High magnitude of anisotropy constant (K1= HcMs/0.96) is noticed for all Gd-contents. It is attributed to the presence of Gd-element. Further, the magnetic moment nB = M.W.*Ms/5585, is calculated [26,27,28], and found to be altering between 2.095 to 2.627 μB/f.u., with increase in ‘x’. It is understood from the magnetization, and magnetic moment values of x=0.02-0.08 that the variation trend is similar. Joshi et al. [15], reported the cation distribution of iron deficient NiGdFe2O4 indicating the Gd3+ ions preferring the B-site. The Ni2+ ions, ferric, and ferrous ions can occupy both the sites. From x=0.02-0.04, both the parameters are decreased owing the decrease of magnetic exchange interactions between two iron ions through oxygen (Fe-O-Fe) ions. For x=0.04-0.08, the similar interactions are increased leading to the increase of magnetic moment. The variation of superexchange interactions is mainly dependent of cation distribution with ‘x’. For this, the magnetic moments of cations are considered. Further, using Neel’s two sublattice model, the results magnetic moment is given by the subtraction of total magnetic moment of A-site from B-site (MB-MA). The cation distribution is provided in Table 4. It indicates the preferential occupation of sites by the cations. According to this, the Gd3+ ions first occupy the B-site, and therefore, the Ni2+ will be migrated to A-site. As a result, the conversion of ferric to ferrous ions takes place predominantly. Thus, in the cation distribution, ferrous ion concentration is increased progressively. The observed coercivity is obtained due to the domain wall energy (ωp), and critical diameter (Dc). Hence, ωp=(2*KB*Tc*K1/a)0.5 (where KB is the Boltzmann constant in Kelvin, Tc is the Curie-transition temperature, and other symbols have their usual meaning), and Dc=1.4ωp/Ms2 (symbols have their usual meaning) values are calculated for x=0.02-0.08 as listed in Table 3. The crystallite size values, and critical diameter values are in almost same agreement. Hence, for all the samples, the achieved coercivity is due to domain wall rotation rather than domain wall displacement. The similar observations are found in literature [2].
The dielectric behavior of Ni1-xGdxFe2O4 (x=0.02 – 0.08) nanoparticles is understood by studying the frequency dependence of dielectric constant (ɛ'), dielectric loss (ɛ"), and real & imaginary parts of dielectric modulus (M' & M"). It is evident from Figure 10 that the ɛ', and ɛ" values are high in magnitude at 100 Hz. This behavior is due to inhomogeneous dielectric structure. In addition, the mechanism behind this can be well understood by Koop’s theory [29]. It reveals the polycrystalline (NGF) materials pertain the grain, and grain boundaries which are considered as high resistive, and low resistive layers, respectively. At 100 Hz or even less than the similar frequency, the carriers will be piled at the grain boundary interface leading to the accumulation of carriers. This found effective at low frequencies of NGF samples. Hence, one can confirm that the high magnitude of ɛ', and ɛ" at low frequencies is attributed to the grain boundary’s effect. On the other hand, the magnitude of ɛ', and ɛ" comes down with increase in frequency, wherein the breakage of grain boundary interface takes place. Thus, the carriers enter the grain portion, wherein the conductivity is predominant. In the case of, NGF samples, the reduction in ɛ', and ɛ" suggested the breakage of grain boundary. In Table 3, the ɛ', and ɛ" values of NGF are mentioned at 8 MHz. It is observed from these values that the x=0.06 content shows the high dielectric constant of 5.23, and low dielectric loss of 0.181. Moreover, the same composition offered high magnetization value of 54.5 emu/g, and low coercivity value indicate the composition suitable for microinductor applications. Further, the ac-electrical conductivity (σac) is calculated using a formula: ɛoɛ"ω, and results at 8 MHz are reported in Table 5. The log σac ~ -4.092 suggests the low conductivity which is one of the required parameters for the microinductor devices. With increase of frequency, the conductivity of x=0.02-0.08 started increasing (see Figure 11) owing to the thermal activation of charges at room temperature. Similarly, x=0.02 shows high ɛ'~7.44, and ɛ"~0.987, and hence the high conductivity is obtained. The real part of dielectric modulus (M'=ε'/(ε'2+ε"2)), and imaginary part of dielectric modulus (M"=ε"/(ε'2+ε"2)) are calculated, M' & and M" values (Figure 12) are noted to be almost zero. This a common dielectric modulus behavior in case of any polycrystalline materials. It is attributed to the lack of restoring force to the carriers to reach the original positions. This is possible for carriers participating in long-range motion. The frequency dependent M" plots offered the relaxation at different frequencies. That is, x=0.02, 0.04, 0.06 & 0.08 at log ω=4.200, 5.611, 6.298 & 5.421, respectively. These results revealed that the relaxation frequency is increased from x=0.02-0.06, and beyond x=0.06, it is reduced. However, these relaxations usually provide two regions such as long-range (below relaxation), and short-range polarization mechanisms. In is clearly noticed that the plots of dielectric parameters, and conductivity show the scattering nature of data points. It is usually attributed to the presence of imperfections, and moisture in the samples. Moreover, these imperfections, and moisture can act as the scattering centres of charge carriers as indicated in the literature [31]. Similarly, the Z' Vs. Z" plots are drawn (Figure 13), and the trend of x=0.02-0.08 is not completely semicircle. It is established owing to the partial relaxation strength of carriers, wherein, the charges will go for long-range motion. However, it is remembered that the complete semicircle indicates the charges preferring the short-range motion. In this case, the charges will be confined to the potential well. Once the semicircles are imagined for Cole-Cole plots of x=0.02-0.08, the arcs pertain the centres lying below the real axis. Hence, it is confirmed that the relaxations are of non-Debye type.
5. Conclusions
The NGF nanoparticles were successfully prepared by hydrothermal technique at 150oC. The XRD patterns evidenced cubic spinel structure having the increasing trend of lattice constants from 0.8956 to 0.8975 nm as a function of ‘x’. The FESEM, and HRTEM showed the stones like (almost nanocubes) grains/particles in the morphology. The TG curves indicated high mass losses for x=0.02 (7.81 %), and 0.04 (8.45 %) while the low masses were observed for x=0.06 (6.68 %), and 0.08 (7.13 %). The DTG plots of x=0.02-0.08 expressed three thermogram temperatures at around 200 (removal hydrate ions), 400 (removal of nitrates), and 1330oC (decomposition of residual species). The Tc values of x=0.02-0.08 were increased from 910 to 1110oC. The endothermic peak temperatures (melting) were increased from 1310 to 1370oC with increase in ‘x’. The M-H curves showed that the Ms values were altering from 49.1 to 62.1 to 49.1 emu/g following the trend of crystallite size as a function of ‘x’. The Mr/Ms (0.316 to 0.328) of x=0.02-0.08 showed the multi-domain magnetic structure. The critical diameter values suggested the production of coercivity owing to domain wall rotation rather than displacement. Moreover, x=0.06 offered high dielectric constant of 5.23, low dielectric loss of 0.181, high magnetization value of 54.5 emu/g, low coercivity, low conductivity of log σac ~ -4.092 values indicated the composition suitable for microinductor applications.
Author Contributions
M.Yellanna: Synthesis, analysis and writing manuscript; N. Suresh Kumar: Supporting the synthesis, analysis and writing manuscript; K. Chandra Babu Naidu: Guiding, analysis, editing, and corresponding.
Acknowledgments
Authors express thanks to STIC-Kerala, IISC-Bangalore, IIT-Madras, and JNTUA for providing characterizations.
Conflicts of Interest
The authors declare that we have no conflicts of interest.
References
- K. C. B. Naidu et al., Microwave Processed Bulk and Nano NiMg Ferrites: A Comparative Study on X-band Electromagnetic Interference Shielding Properties, Materials Chemistry and Physics 187 (2017) 164-176. [CrossRef]
- K. C. B. Naidu et al., Hydrothermal Synthesis of NiFe2O4 nano-particles: Structural, Morphological, Optical, Electrical and Magnetic Properties, Bulletin of Materials Science 40 (2017) 417-425. [CrossRef]
- Parida, T., Kumar, A., Murty, B. S., & Markandeyulu, G. (2020). Magnetic and magnetoelectric response of Gd doped nickel ferrite and barium titanate nanocomposites. In Journal of Applied Physics (Vol. 127, Issue 11, p. 114104). AIP Publishing. [CrossRef]
- Sattibabu, B., Durga Rao, T., Bhatnagar, A. K., Satyanarayana Murthy, V., Rayaprol, S., & Siruguri, V. (2020). Neutron diffraction study and magnetic properties of NiFe2-xScxO4. In Materials Letters (Vol. 277, p. 128325). Elsevier BV. [CrossRef]
- Hao, A., Ismail, M., He, S., Qin, N., Chen, R., Rana, A. M., & Bao, D. (2018). Enhanced resistive switching and magnetic properties of Gd-doped NiFe 2 O 4 thin films prepared by chemical solution deposition method. In Materials Science and Engineering: B (Vol. 229, pp. 86–95). Elsevier BV. [CrossRef]
- Chauhan, L., Singh, N., Dhar, A., Kumar, H., Kumar, S., & Sreenivas, K. (2017). Structural and electrical properties of Dy 3+ substituted NiFe 2 O 4 ceramics prepared from powders derived by combustion method. In Ceramics International (Vol. 43, Issue 11, pp. 8378–8390). Elsevier BV. [CrossRef]
- Dixit, G., Pal Singh, J., Srivastava, R. C., & Agrawal, H. M. (2012). Magnetic resonance study of Ce and Gd doped NiFe2O4 nanoparticles. In Journal of Magnetism and Magnetic Materials (Vol. 324, Issue 4, pp. 479–483). Elsevier BV. [CrossRef]
- Sahariya, J., Mund, H. S., Sharma, A., Dashora, A., Itou, M., Sakurai, Y., & Ahuja, B. L. (2014). Magnetic properties of NiFe 2−x RE x O 4 (RE=Dy, Gd) using magnetic Compton scattering. In Journal of Magnetism and Magnetic Materials (Vol. 360, pp. 113–117). Elsevier BV. [CrossRef]
- Sonia, M. M. L., Anand, S., Vinosel, V. M., Janifer, M. A., Pauline, S., & Manikandan, A. (2018). Effect of lattice strain on structure, morphology and magneto-dielectric properties of spinel NiGdxFe2−xO4 ferrite nano-crystallites synthesized by sol-gel route. In Journal of Magnetism and Magnetic Materials (Vol. 466, pp. 238–251). Elsevier BV. [CrossRef]
- Ugendar, K., Hari Babu, V., Raghavendra Reddy, V., & Markaneyulu, G. (2019). Cationic ordering and magnetic properties of rare-earth doped NiFe2O4 probed by Mössbauer and X-ray spectroscopies. In Journal of Magnetism and Magnetic Materials (Vol. 484, pp. 291–297). Elsevier BV. [CrossRef]
- Akhtar, M. N., Yousaf, M., Lu, Y., Mahmoud, M. Z., Iqbal, J., Khan, M. A., Khallidoon, M. U., Ullah, S., & Hussien, M. (2022). Magnetic, structural, optical band alignment and conductive analysis of graphene-based REs (Yb, Gd, and Sm) doped NiFe2O4 nanocomposites for emerging technological applications. In Synthetic Metals (Vol. 284, p. 116994). Elsevier BV. [CrossRef]
- Guo, L., Shen, X., Meng, X., & Feng, Y. (2010). Effect of Sm3+ ions doping on structure and magnetic properties of nanocrystalline NiFe2O4 fibers. In Journal of Alloys and Compounds (Vol. 490, Issues 1–2, pp. 301–306). Elsevier BV. [CrossRef]
- Chen, L., Dai, H., Shen, Y., & Bai, J. (2010). Size-controlled synthesis and magnetic properties of NiFe2O4 hollow nanospheres via a gel-assistant hydrothermal route. In Journal of Alloys and Compounds (Vol. 491, Issues 1–2, pp. L33–L38). Elsevier BV. [CrossRef]
- Dixit, G., Singh, J. P., Chen, C. L., Dong, C. L., Srivastava, R. C., Agrawal, H. M., Pong, W. F., & Asokan, K. (2013). Study of structural, morphological and electrical properties of Ce doped NiFe2O4 nanoparticles and their electronic structure investigation. In Journal of Alloys and Compounds (Vol. 581, pp. 178–185). Elsevier BV. [CrossRef]
- Joshi, S., Kumar, M., Pandey, H., Singh, M., & Pal, P. (2018). Structural, magnetic and dielectric properties of Gd3+ substituted NiFe2O4 nanoparticles. In Journal of Alloys and Compounds (Vol. 768, pp. 287–297). Elsevier BV. [CrossRef]
- Shah, P., Unnarkat, A., Patel, F., Shah, M., & Shah, P. (2022). A comprehensive review on spinel based novel catalysts for visible light assisted dye degradation. In Process Safety and Environmental Protection (Vol. 161, pp. 703–722). Elsevier BV. [CrossRef]
- Şabikoğlu, İ., Paralı, L., Malina, O., Novak, P., Kaslik, J., Tucek, J., Pechousek, J., Navarik, J., & Schneeweiss, O. (2015). The effect of neodymium substitution on the structural and magnetic properties of nickel ferrite. In Progress in Natural Science: Materials International (Vol. 25, Issue 3, pp. 215–221). Elsevier BV. [CrossRef]
- Almessiere, M. A., Slimani, Y., Güner, S., Baykal, A., & Ercan, I. (2019). Effect of dysprosium substitution on magnetic and structural properties of NiFe2O4 nanoparticles. In Journal of Rare Earths (Vol. 37, Issue 8, pp. 871–878). Elsevier BV. [CrossRef]
- Yao, H., Ning, X., Zhao, H., Hao, A., & Ismail, M. (2021). Effect of Gd-Doping on Structural, Optical, and Magnetic Properties of NiFe2O4 As-prepared Thin Films via Facile Sol–Gel Approach. In ACS Omega (Vol. 6, Issue 9, pp. 6305–6311). American Chemical Society (ACS). [CrossRef]
- Almessiere, M. A., Slimani, Y., Güngüneş, H., Ali, S., Manikandan, A., Ercan, I., Baykal, A., & Trukhanov, A. V. (2019). Magnetic Attributes of NiFe2O4 Nanoparticles: Influence of Dysprosium Ions (Dy3+) Substitution. In Nanomaterials (Vol. 9, Issue 6, p. 820). MDPI AG. [CrossRef]
- Yehia, M., & Hashhash, A. (2019). Structural and magnetic study of Sm doped NiFe2O4 nanoparticles. In Journal of Materials Science: Materials in Electronics (Vol. 30, Issue 7, pp. 6768–6775). Springer Science and Business Media LLC. [CrossRef]
- R.D. Shannon, Revised Effective Ionic Radii and Systematic Studies of Interatomic Distances in Halides and Chalcogenides. Acta Cryst. A 32, 751–767 (1976).
- Hume-Rothery Rules’’. Van Nostrand’s Scientifific Encyclopedia. John Wiley & Sons, Inc. 2002.
- Raghuram, N., Subba Rao, T., & Chandra Babu Naidu, K. (2020). Electrical and impedance spectroscopy properties of hydrothermally synthesized Ba0.2Sr0.8-yLayFe12O19 (y = 0.2–0.8) nanorods. In Ceramics International (Vol. 46, Issue 5, pp. 5894–5906). Elsevier BV. [CrossRef]
- P. Scherrer, Bestimmung der Grosse und der Inneren Struktur von Kolloidteilchen Mittels Rontgenstrahlen, Nachrichten von der Gesellschaft der Wissenschaften. Gottingen. Mathematisch-Physikalische Klasse 2, 98–100 (1918).
- Baba Basha, D., Suresh Kumar, N., C. B. Naidu, K. et al. Structural, electrical, and magnetic properties of nano Sr1−XLaXFe12O19 (X = 0.2–0.8). Sci Rep 12, 12723 (2022). [CrossRef]
- Baykal, A., Güngüneş, H., Sözeri, H., Amir, Md., Auwal, I., Asiri, S., Shirsath, S. E., & Demir Korkmaz, A. (2017). Magnetic properties and Mössbauer spectroscopy of Cu-Mn substituted BaFe12O19 hexaferrites. In Ceramics International (Vol. 43, Issue 17, pp. 15486–15492). Elsevier BV. [CrossRef]
- Sakthipandi, K., Ganesh Babu, B., Rajkumar, G., Hossian, A., Srinidhi Raghavan, M., & Rajesh Kumar, M. (2022). Investigation of magnetic phase transitions in Ni0.5Cu0.25Zn0.25Fe2-La O4 nanoferrites using magnetic and in-situ ultrasonic measurements. In Physica B: Condensed Matter (Vol. 645, p. 414280). Elsevier BV. [CrossRef]
- C.G. Koops, On the Dispersion of Resistivity and Dielectric Constant of Some Semiconductors at Audio frequencies. Phys. Rev. 83, 121–124 (1951).
- K.W. Wagner, The Distribution of Relaxation Times in Typical Dielectrics. Ann. Phys. 40, 817 (1913).
- Rahman, M. T. and C. V. Ramana (2014). Impedance spectroscopic characterization of gadolinium substituted cobalt ferrite ceramics, Journal of Applied Physics, Vol. 116, pp. 164108-10.
Figure 1.
Schematic representation of spin structure of spinels.
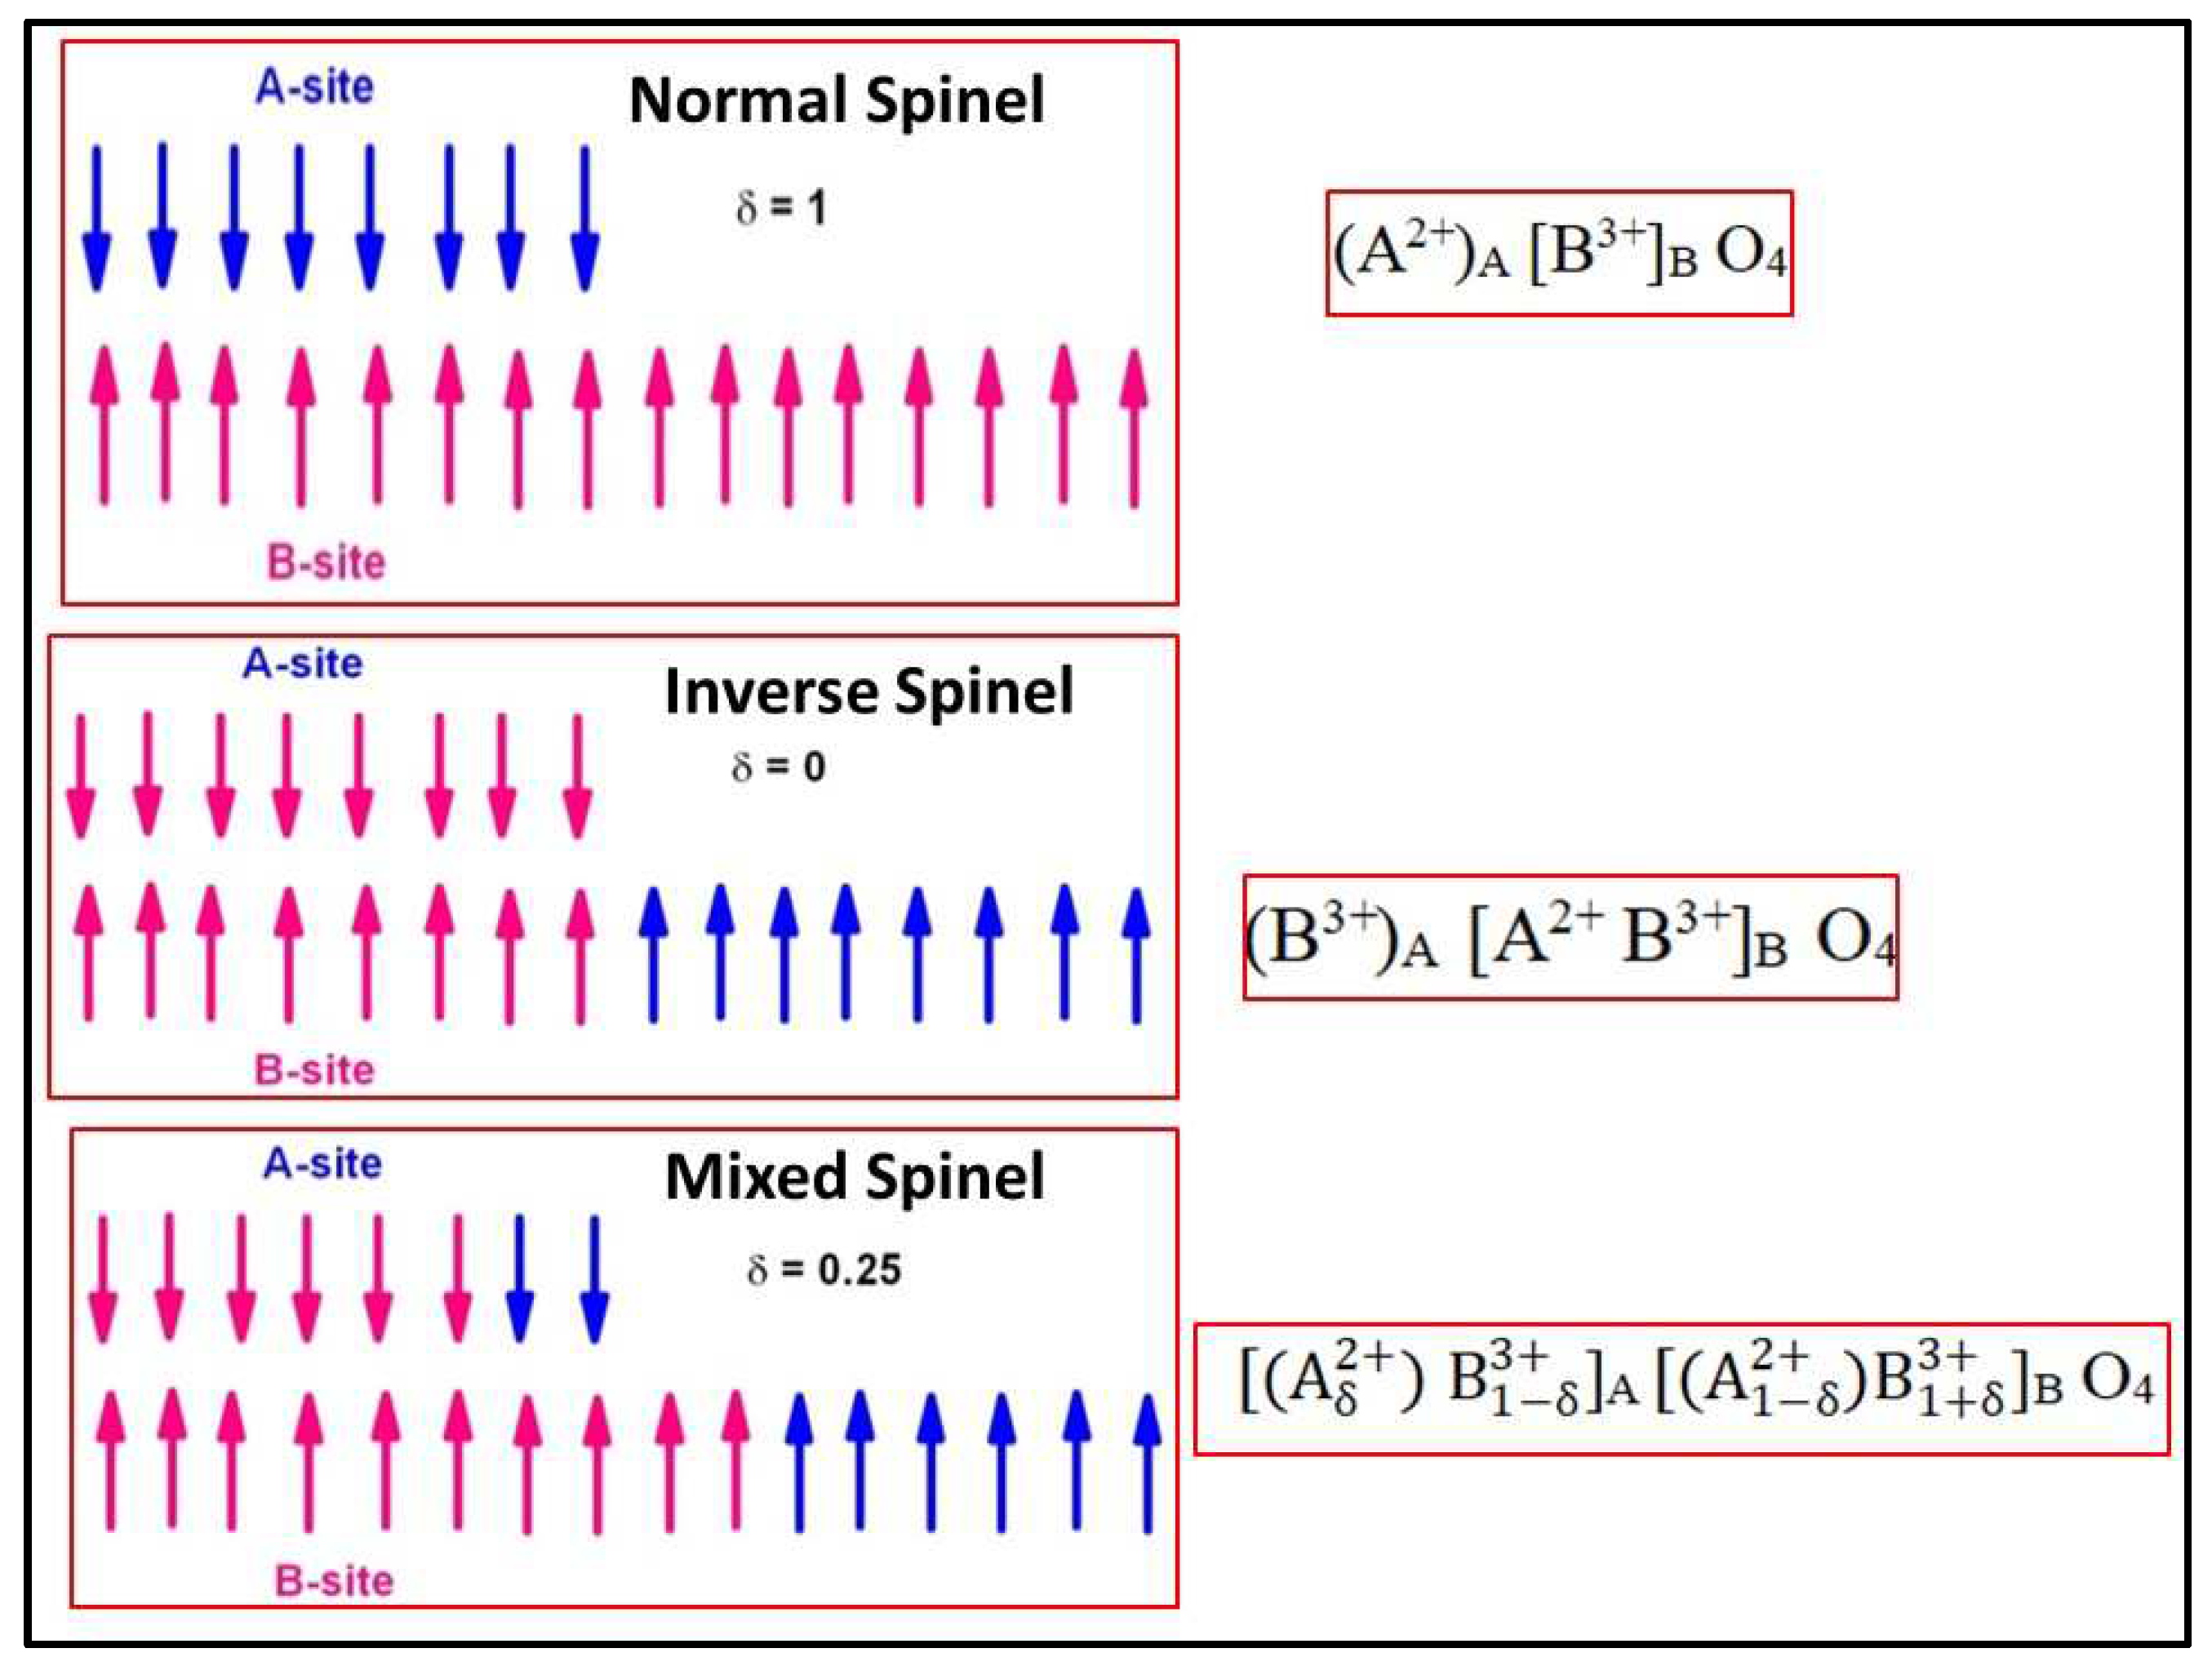
Figure 2.
Schematic diagram for the synthesis of Ni1-xGdxFe2O4 (x=0.02 – 0.08) nanoparticles.
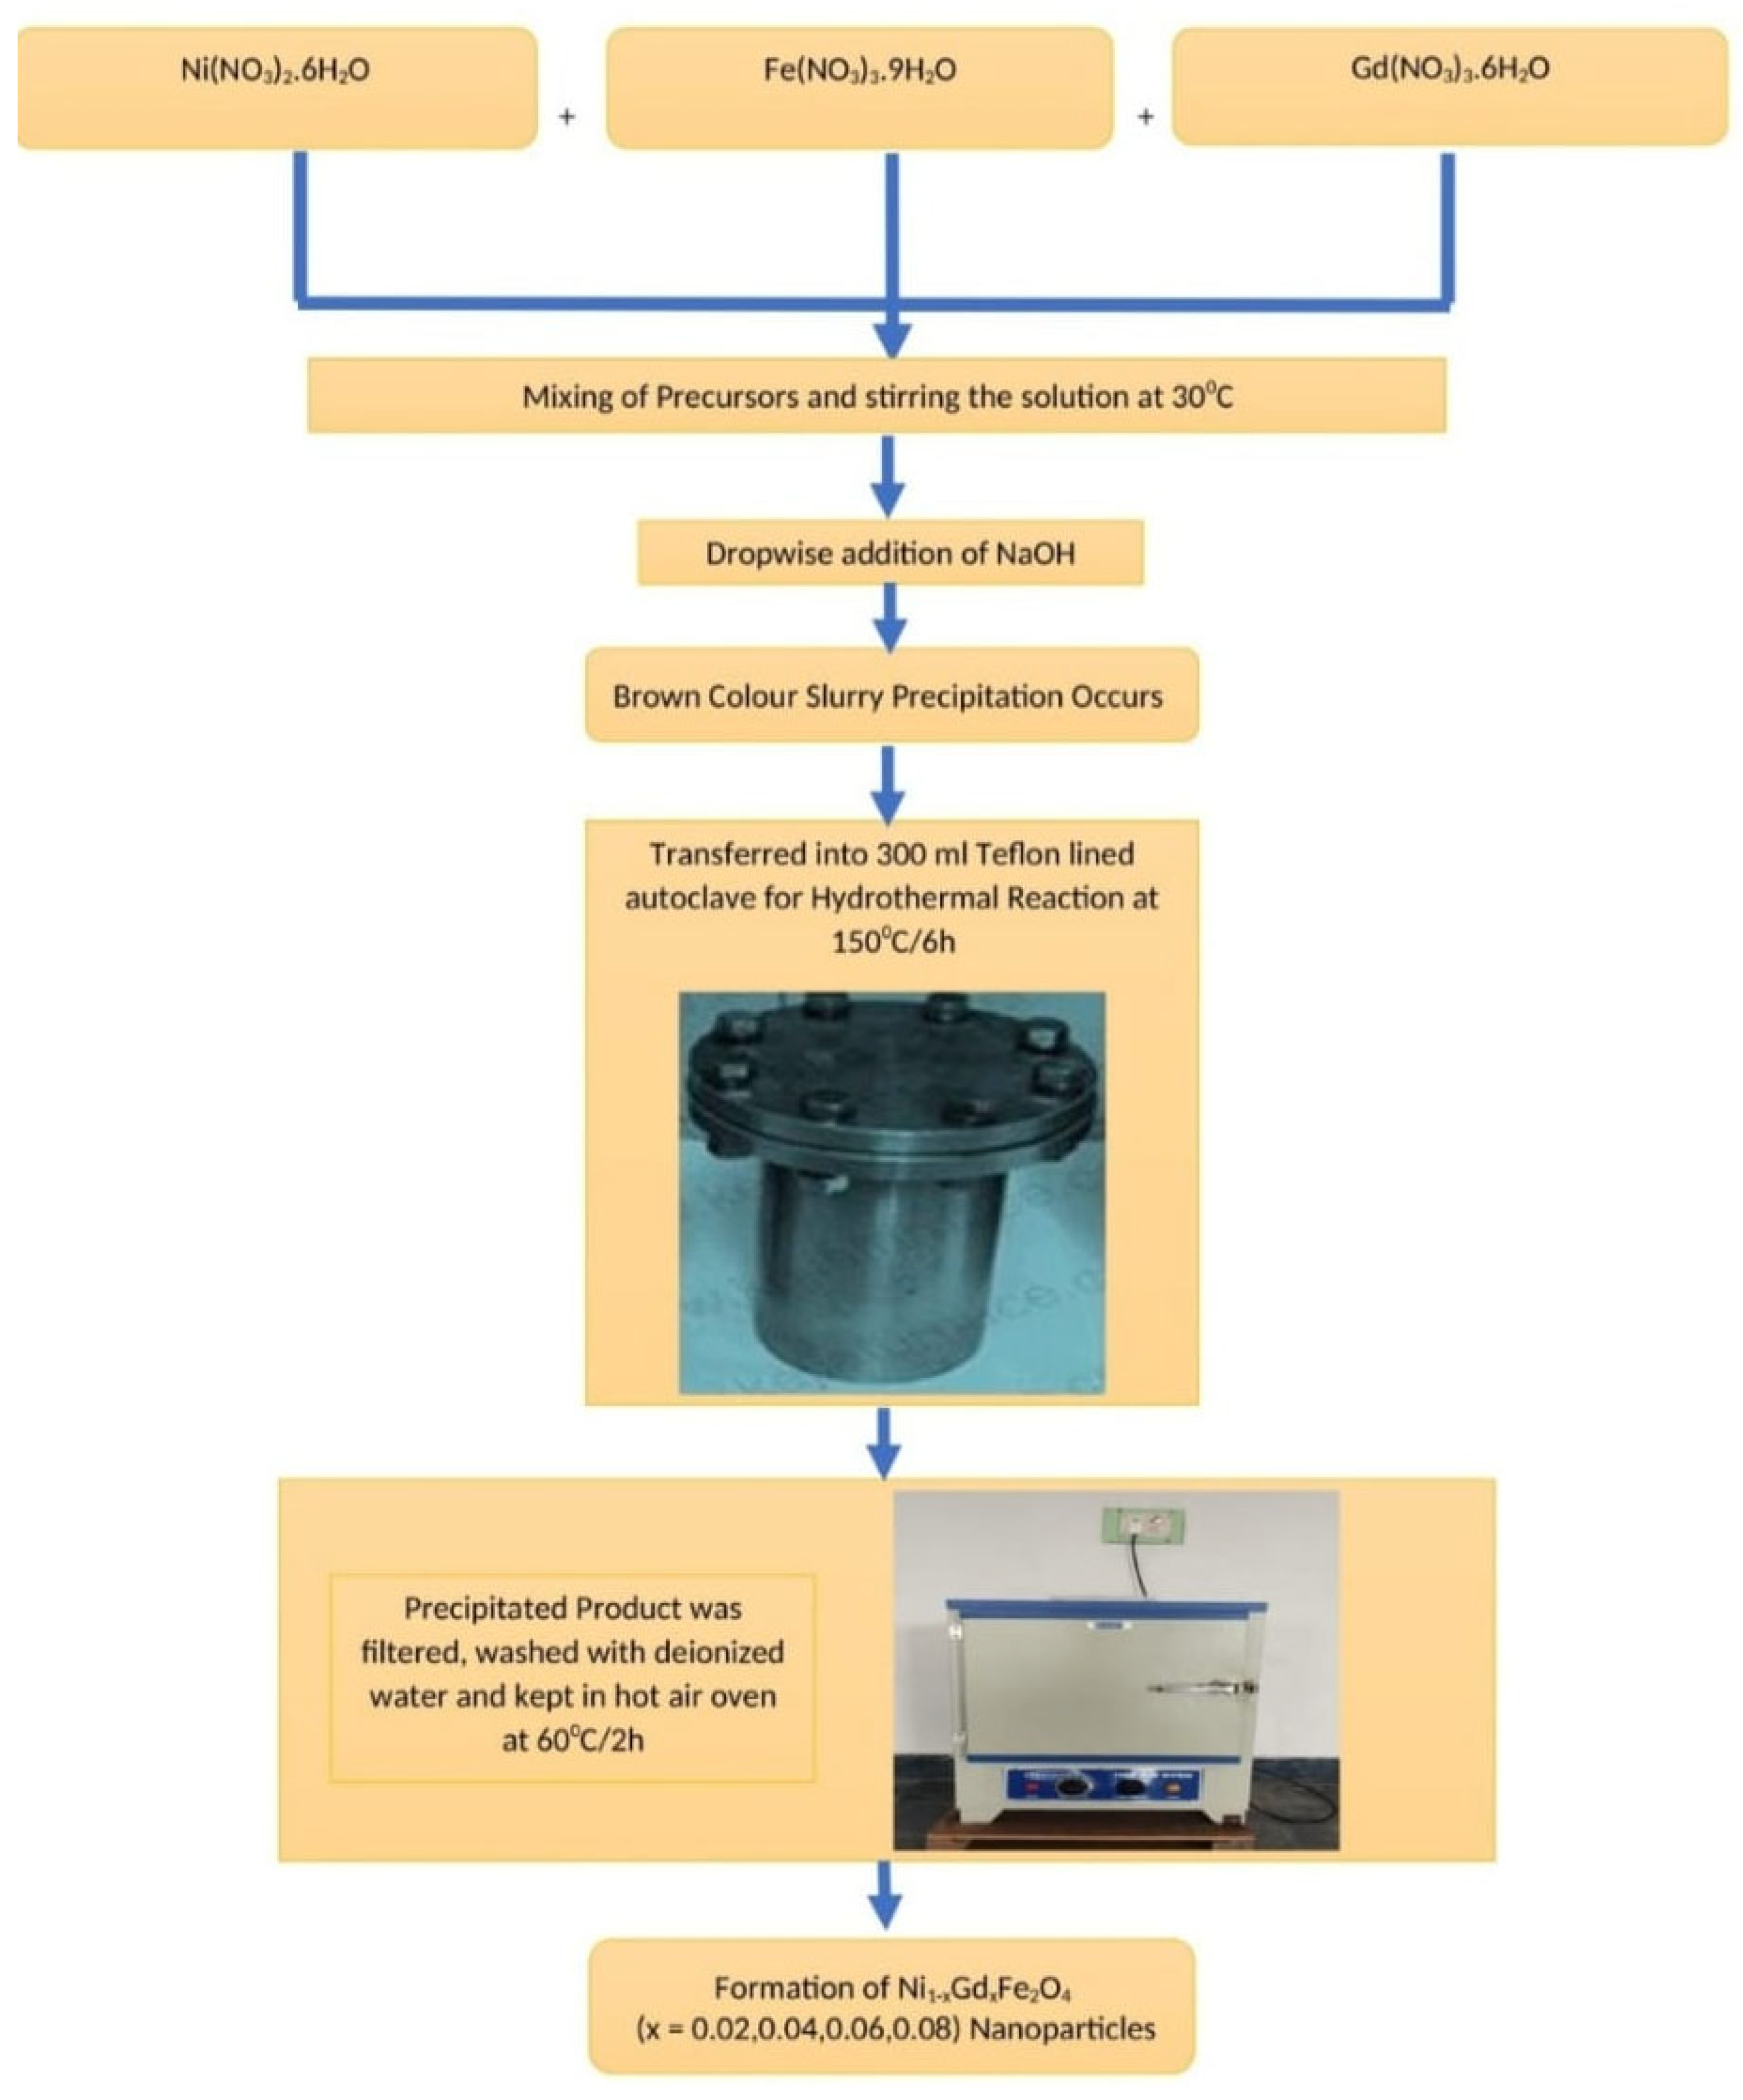
Figure 3.
Prepared pellets of Ni1-xGdxFe2O4 (x=0.02 – 0.08) nanoparticles.
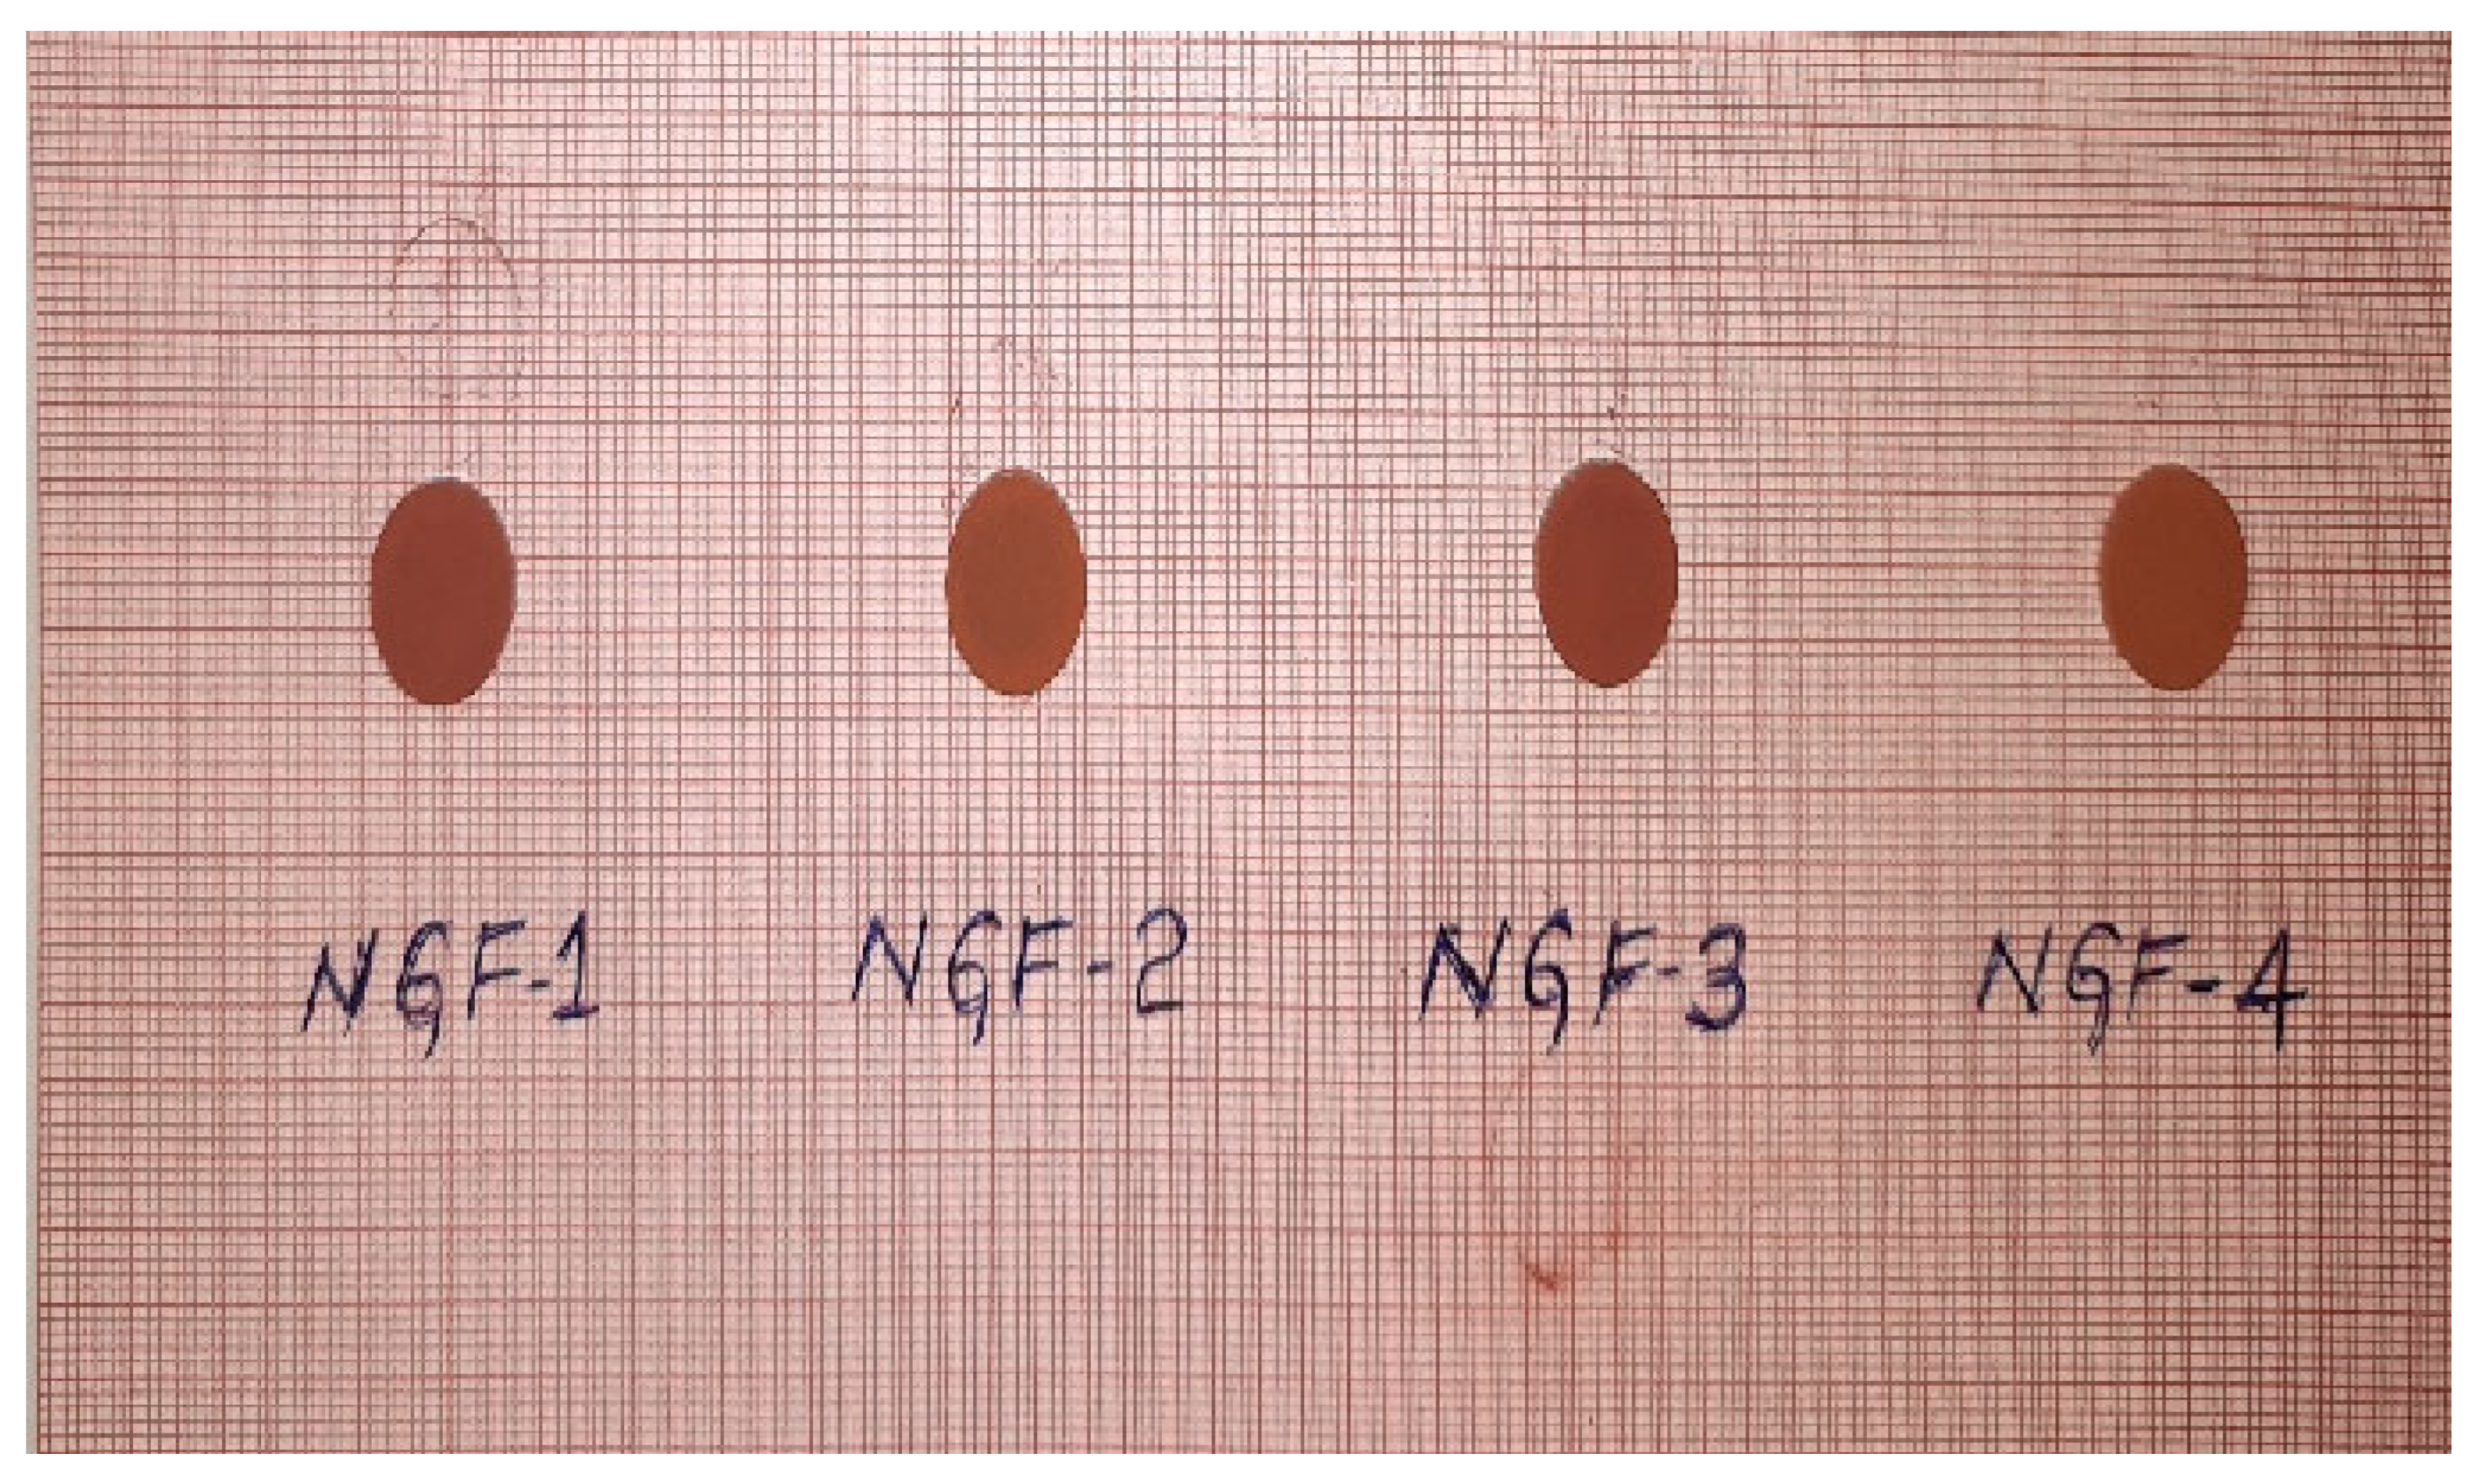
Figure 4.
XRD patterns of Ni1-xGdxFe2O4 (x=0.02 – 0.08) nanoparticles.
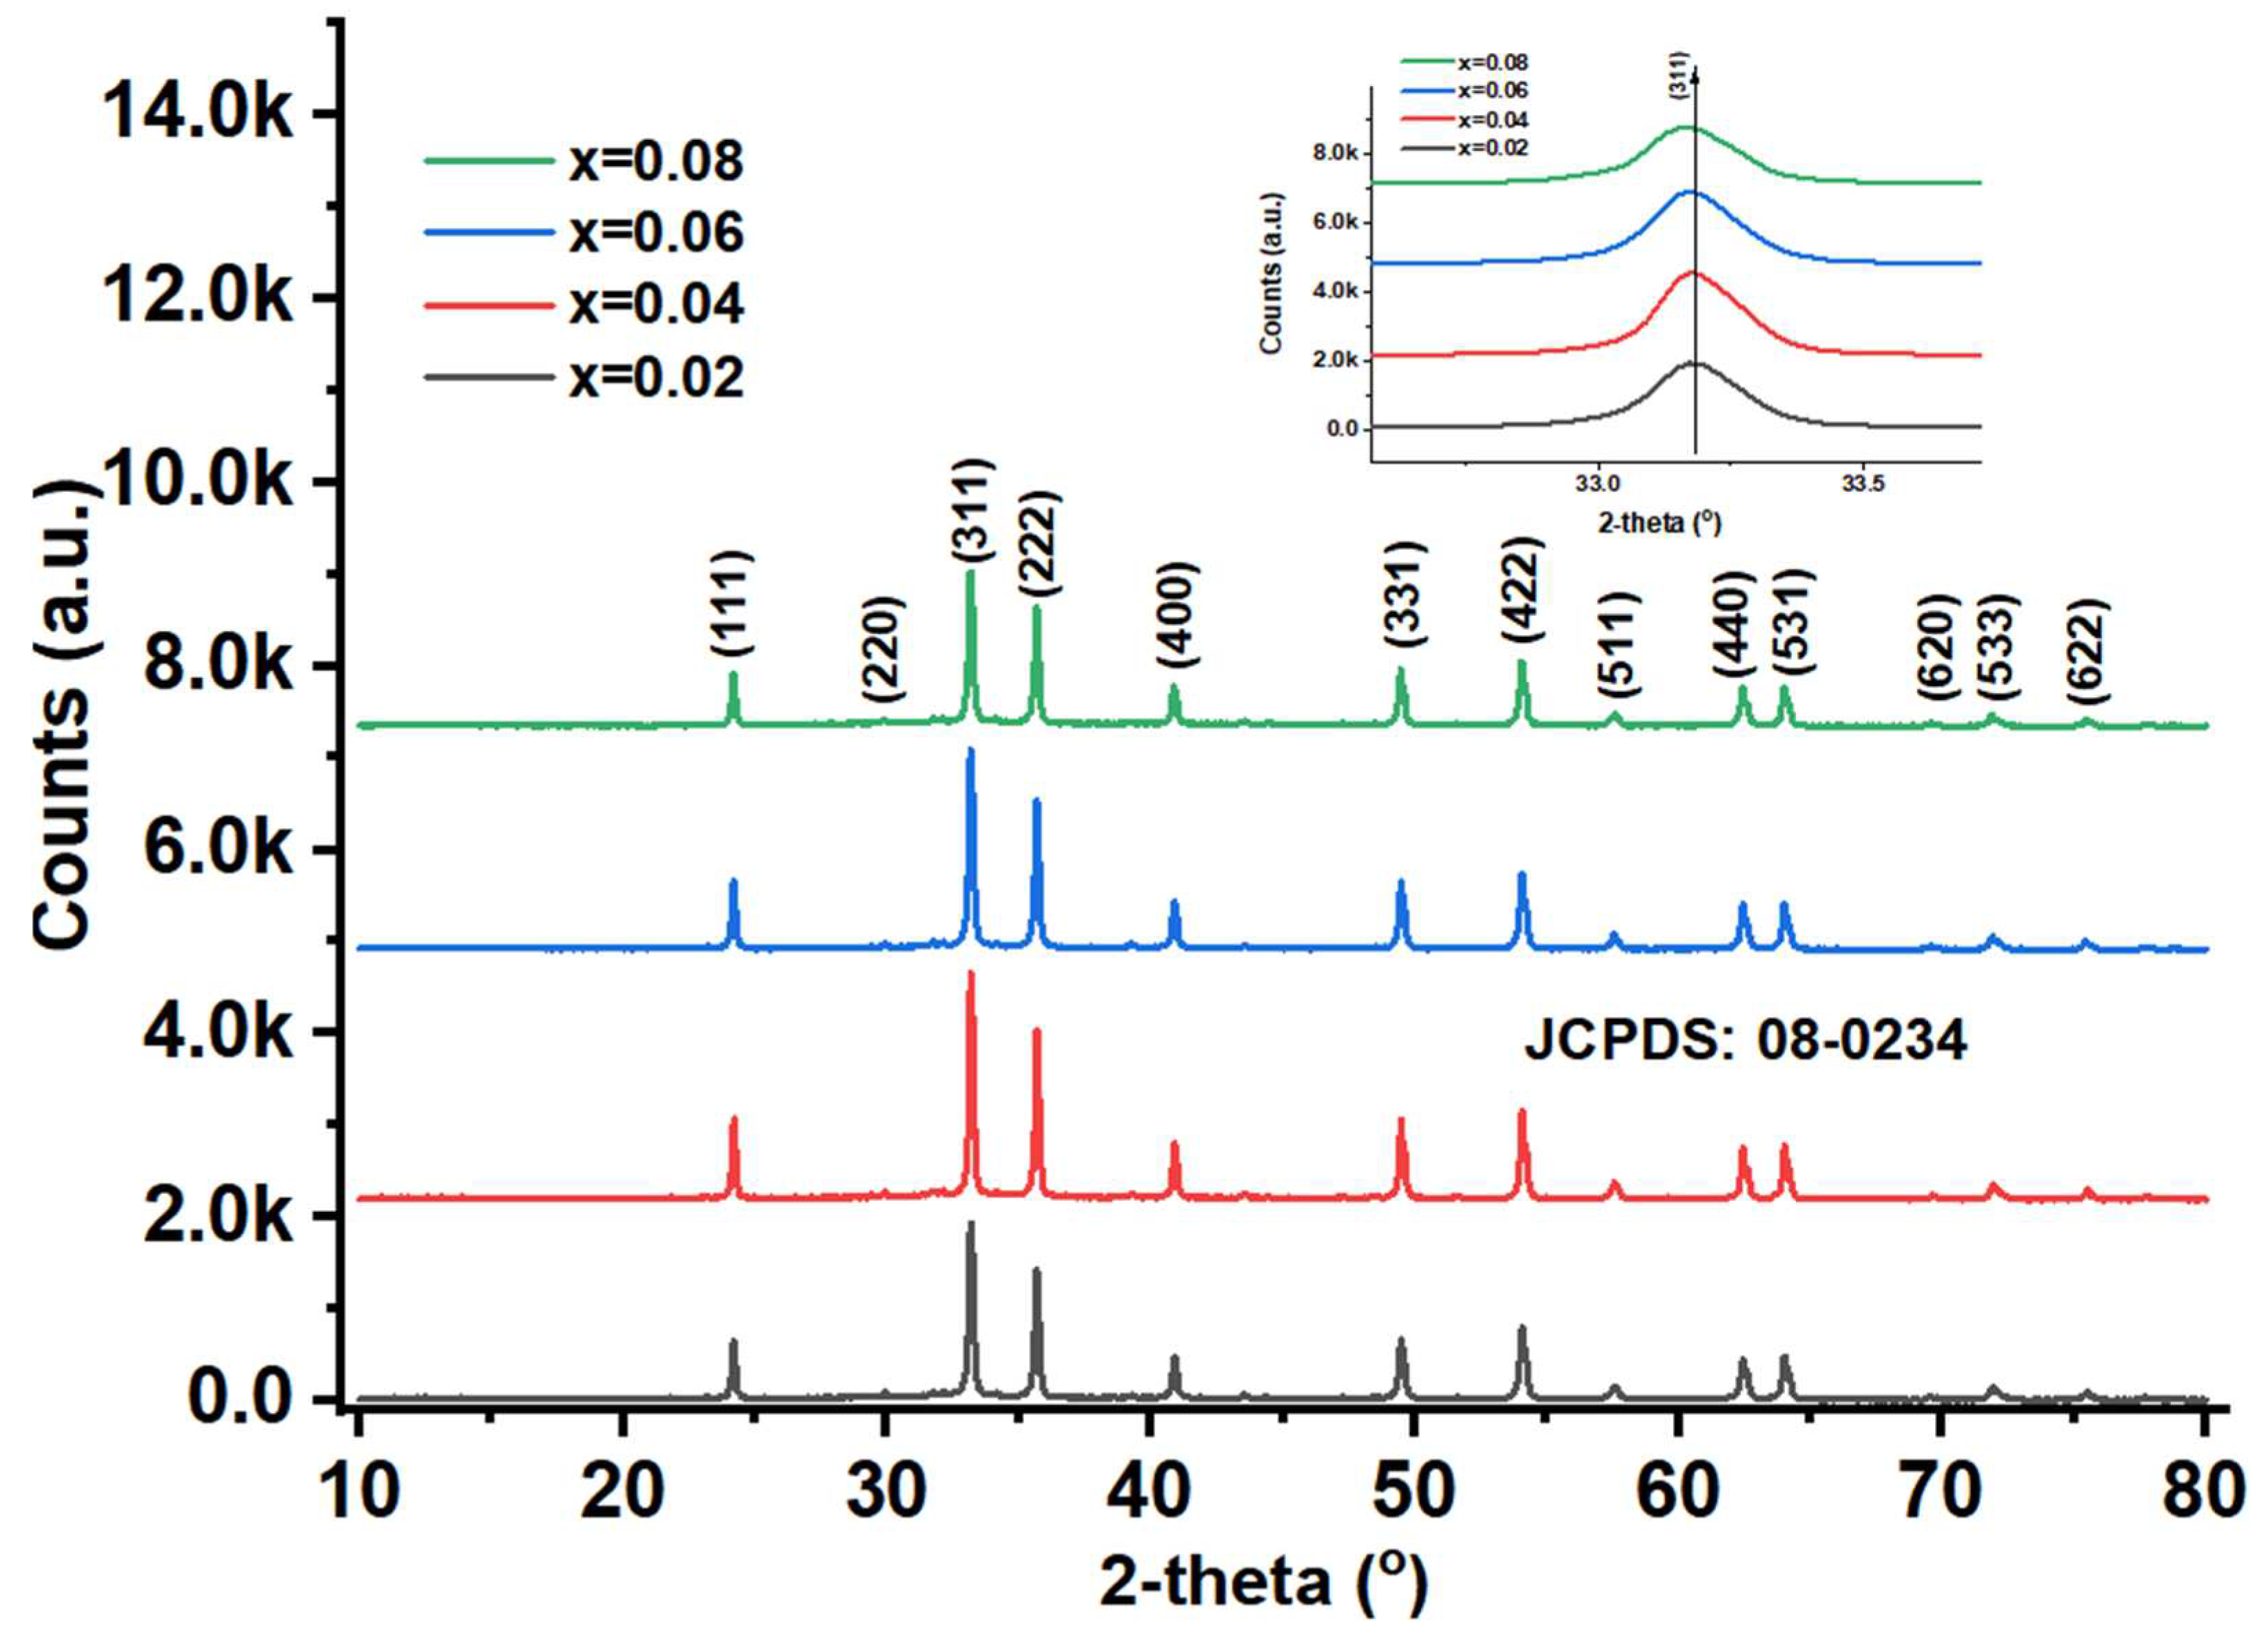
Figure 5.
FESEM images of Ni1-xGdxFe2O4 (x=0.02 – 0.08) nanoparticles.
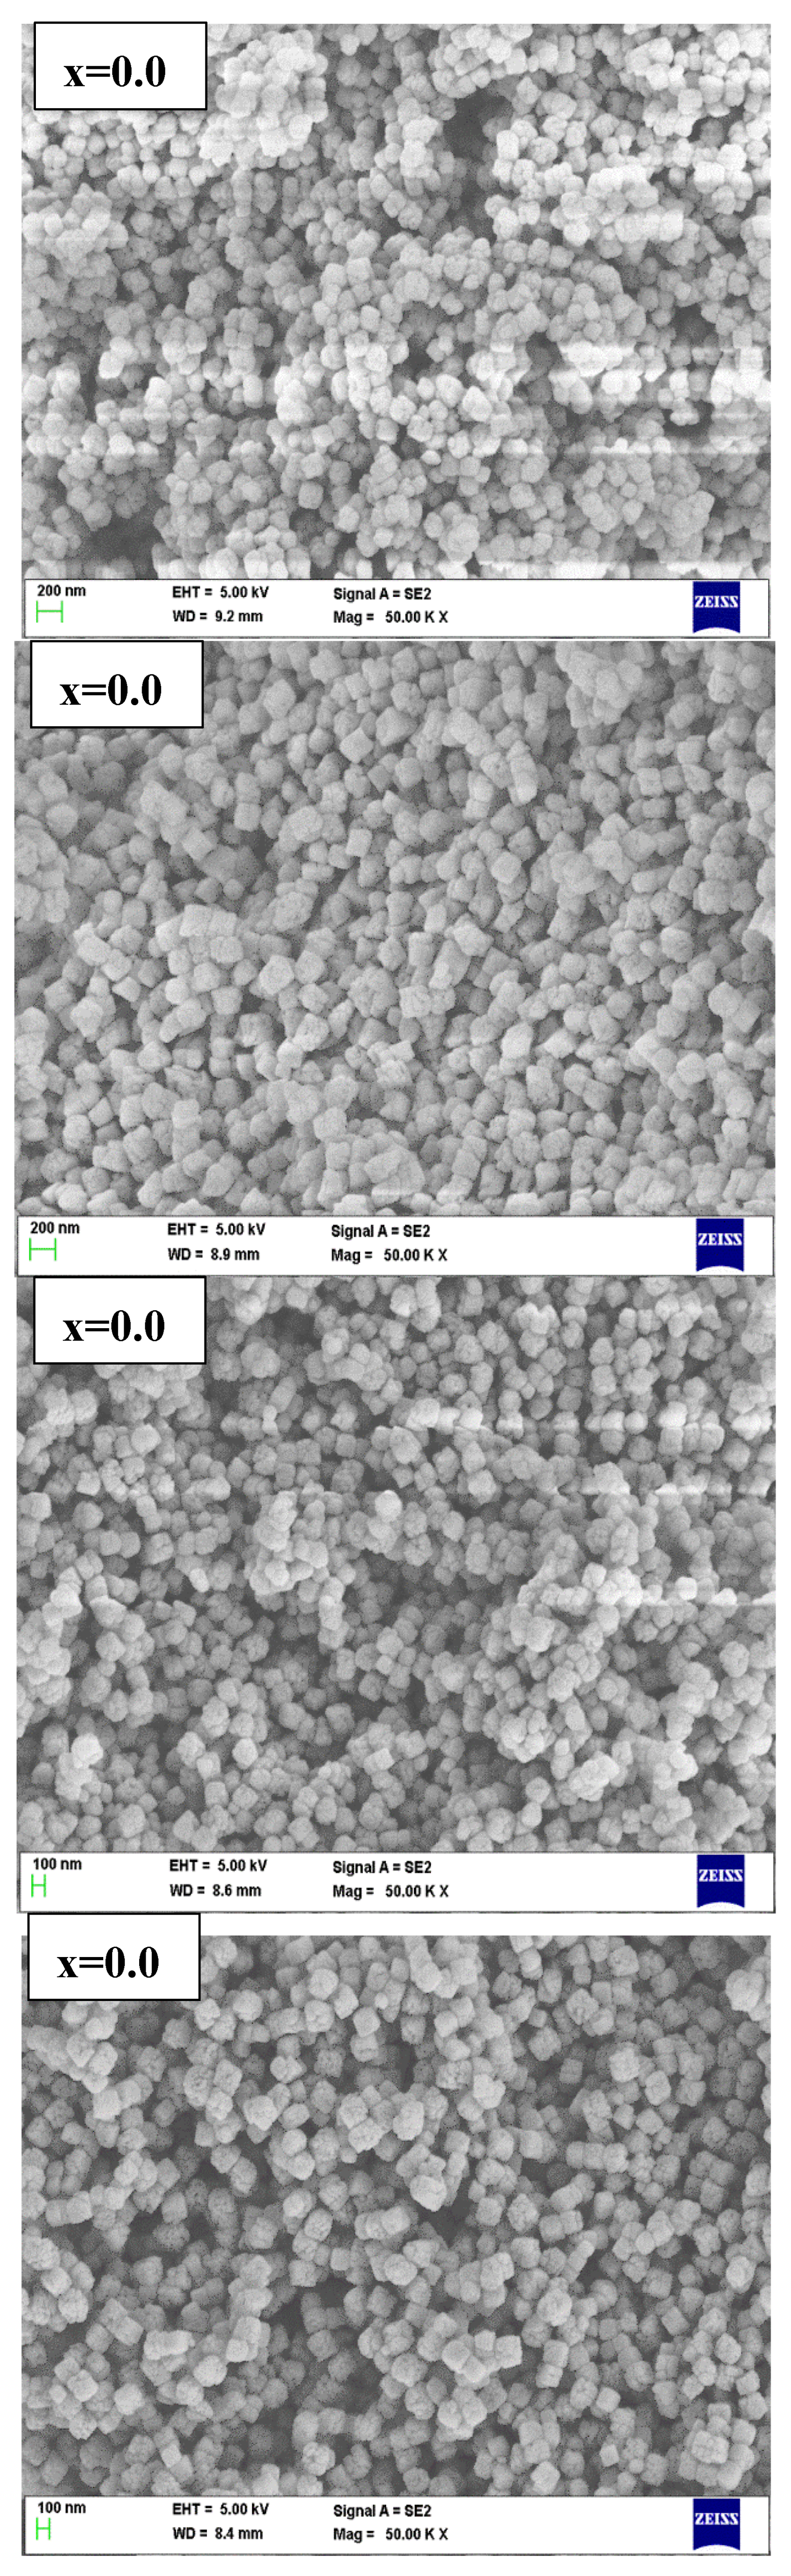
Figure 6.
HRTEM images of Ni1-xGdxFe2O4 (x=0.02 – 0.08) nanoparticles.
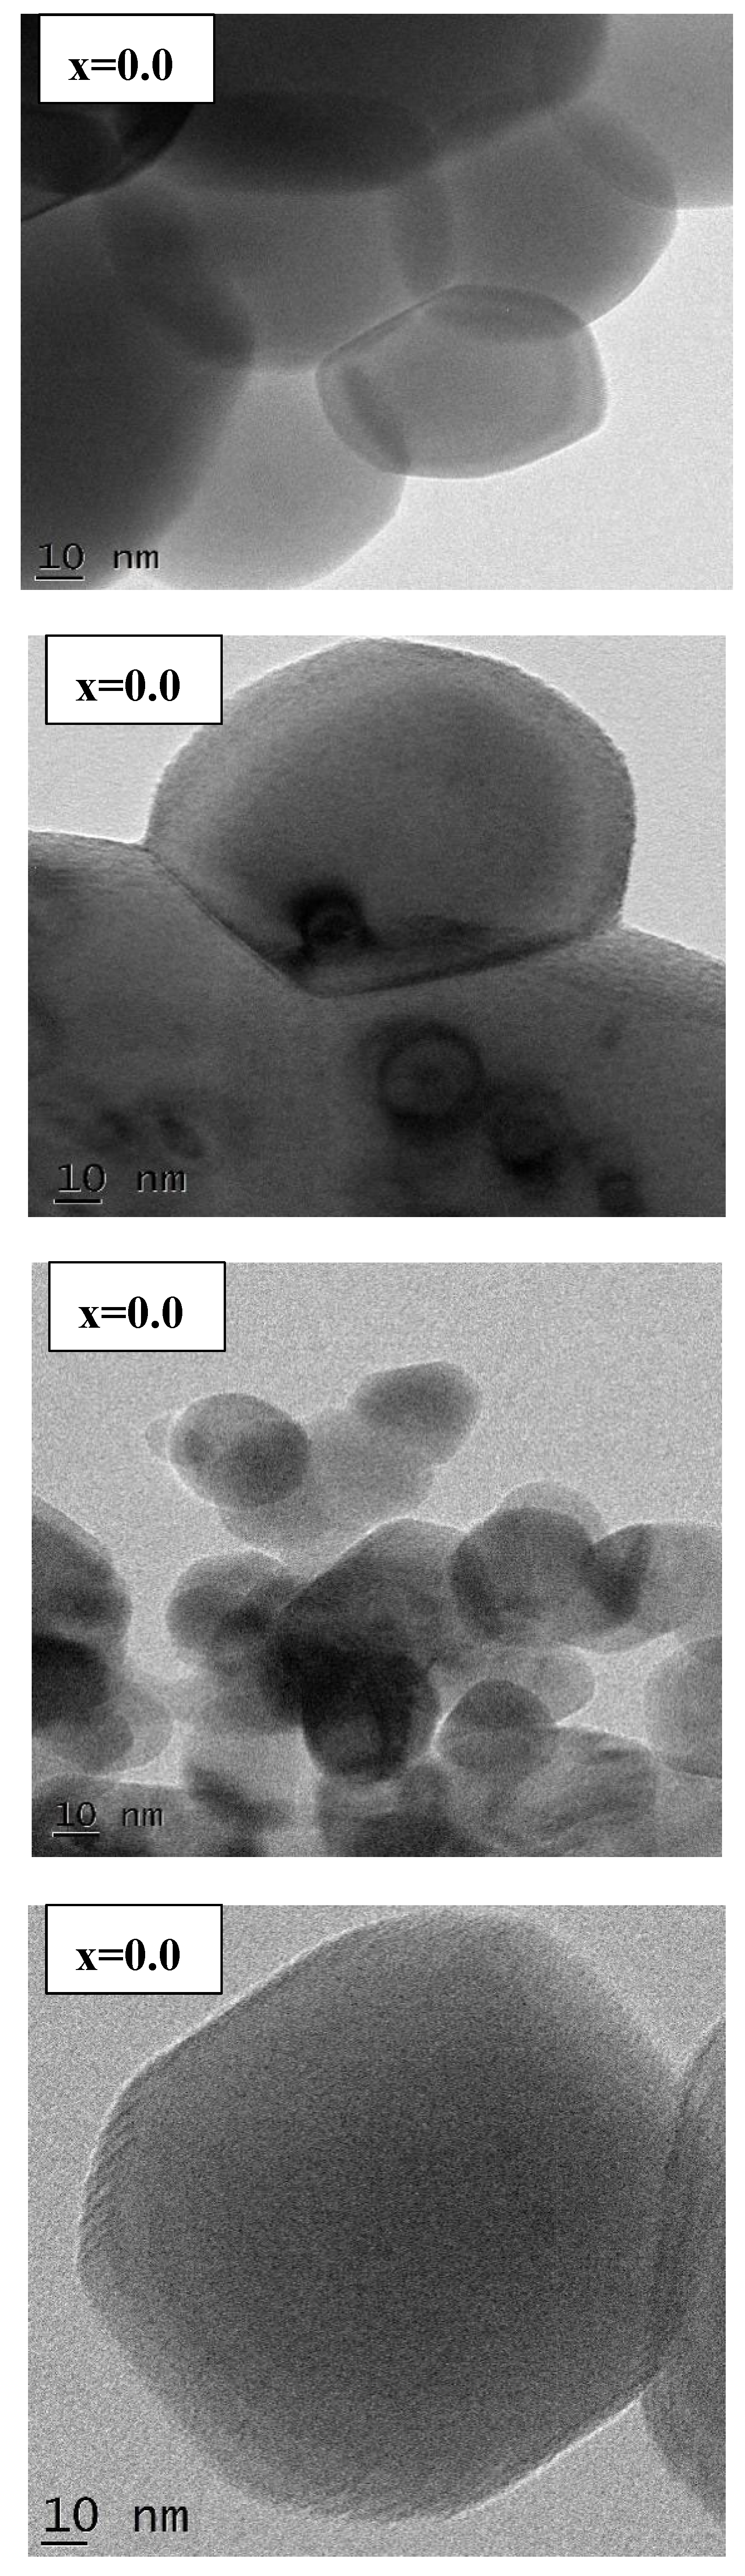
Figure 7.
TG-DTG plots of Ni1-xGdxFe2O4 (x=0.02 – 0.08) nanoparticles.
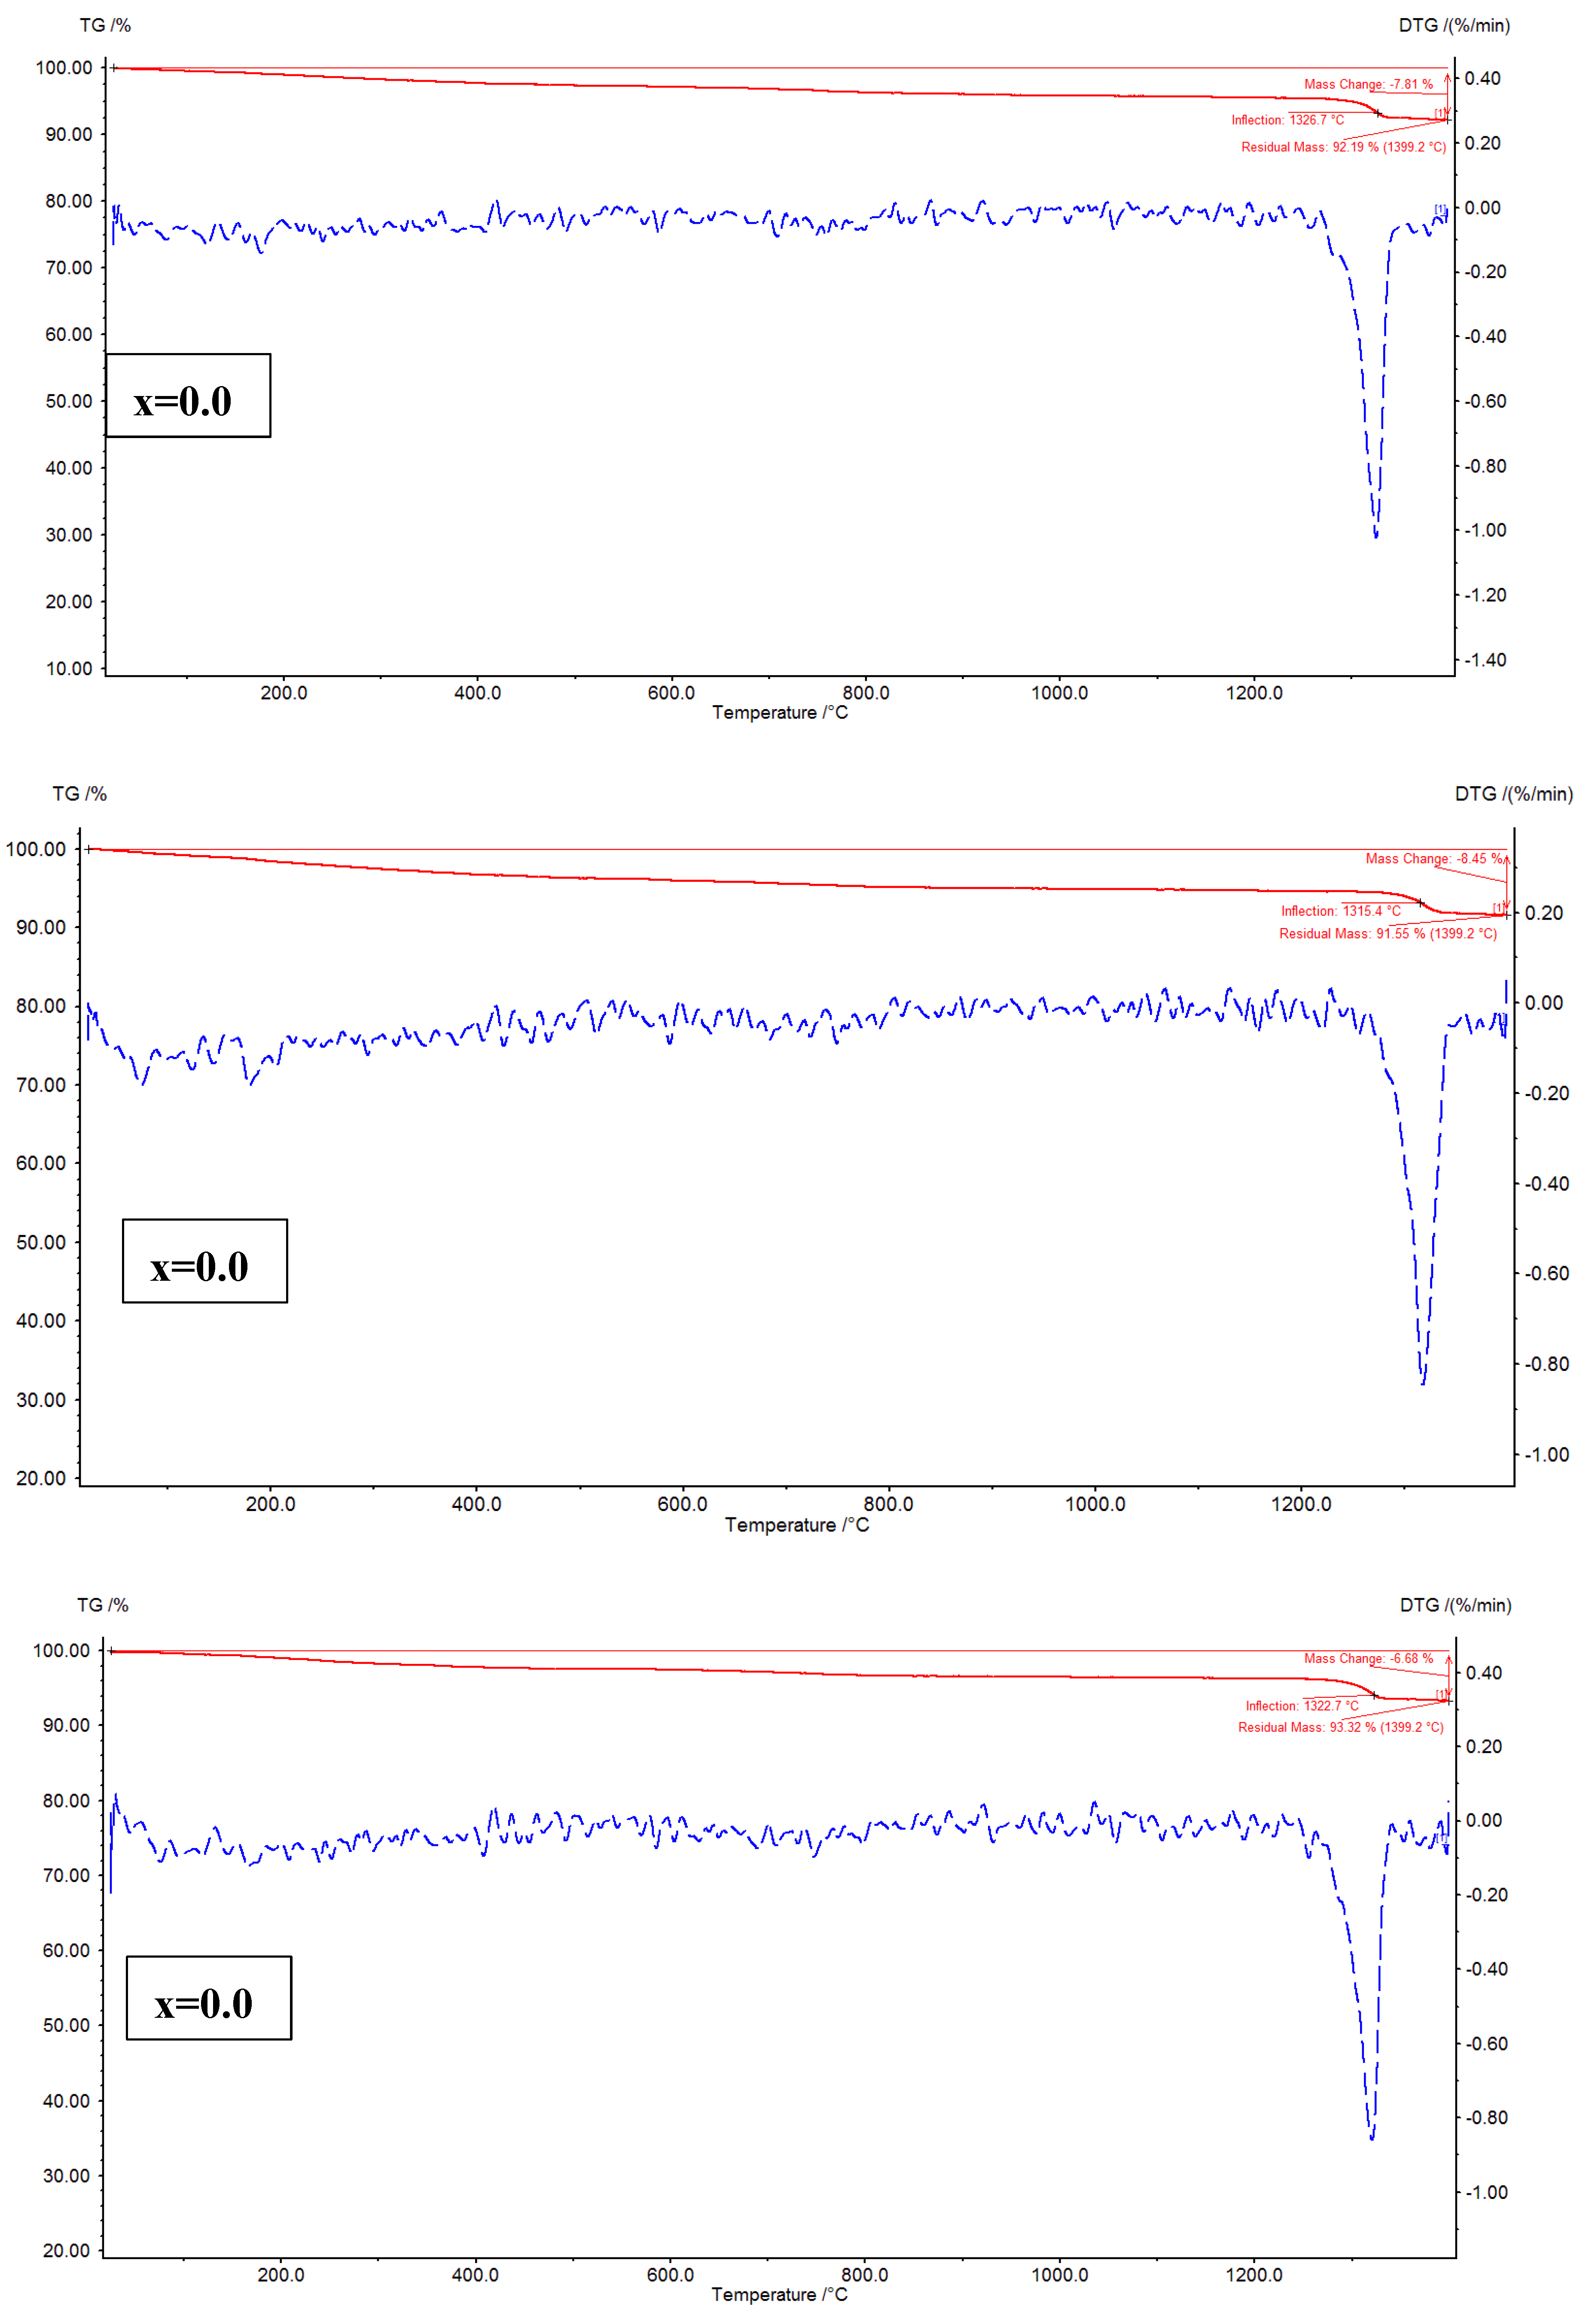
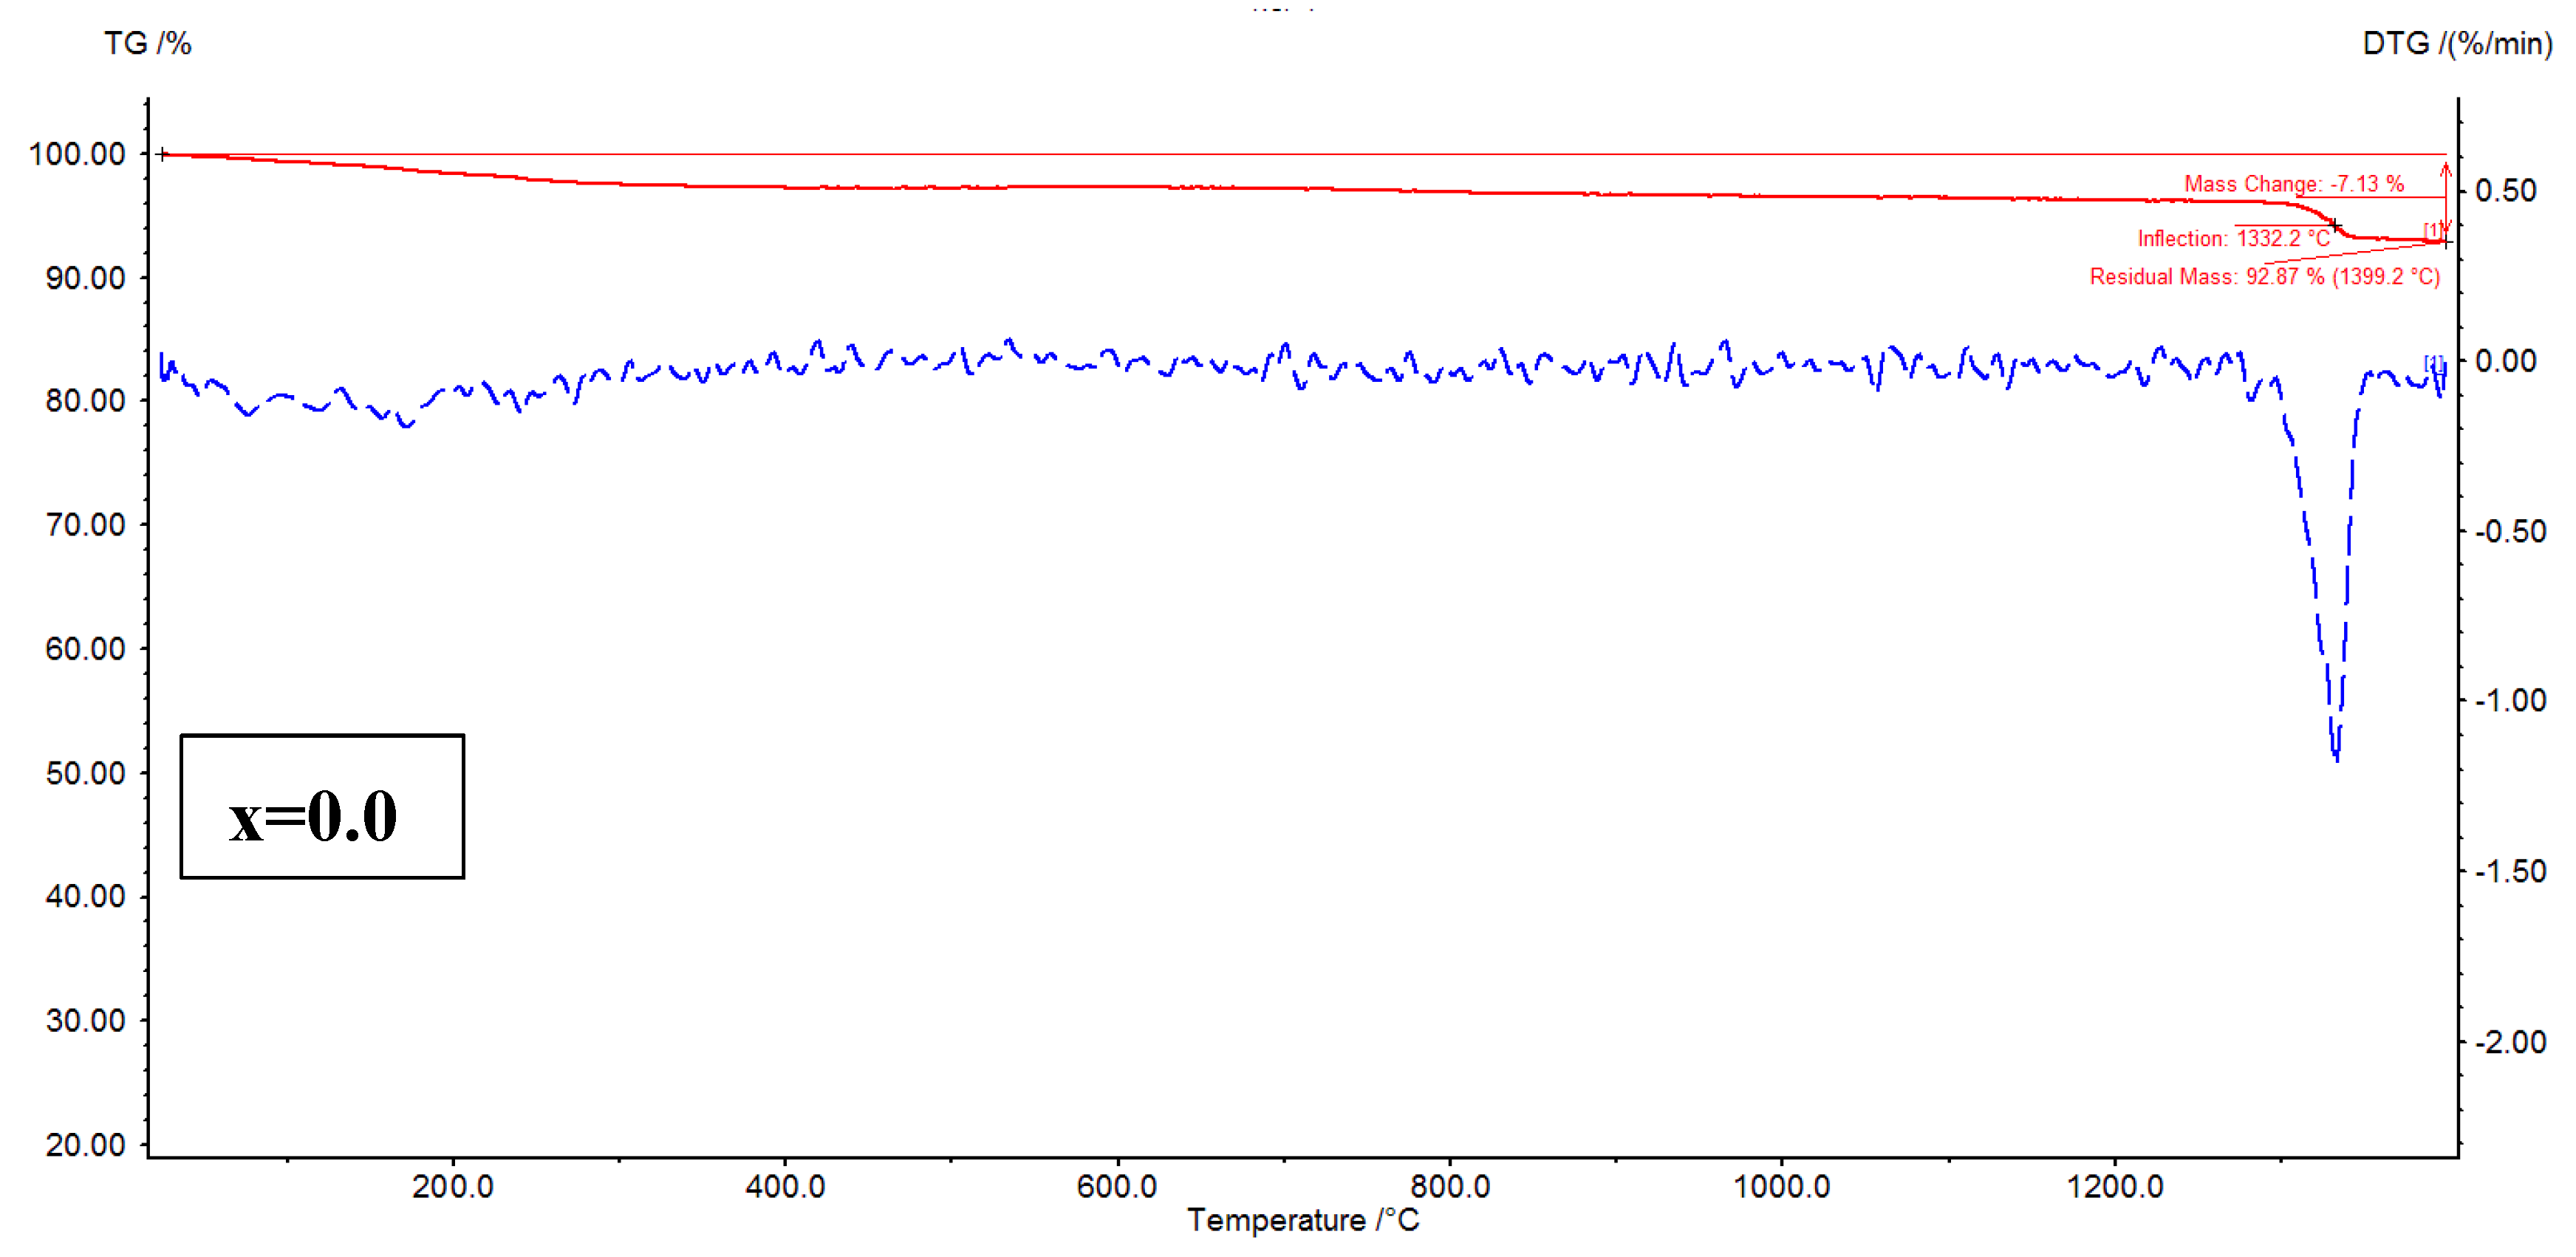
Figure 8.
TG-DSC plots of Ni1-xGdxFe2O4 (x=0.02 – 0.08) nanoparticles.
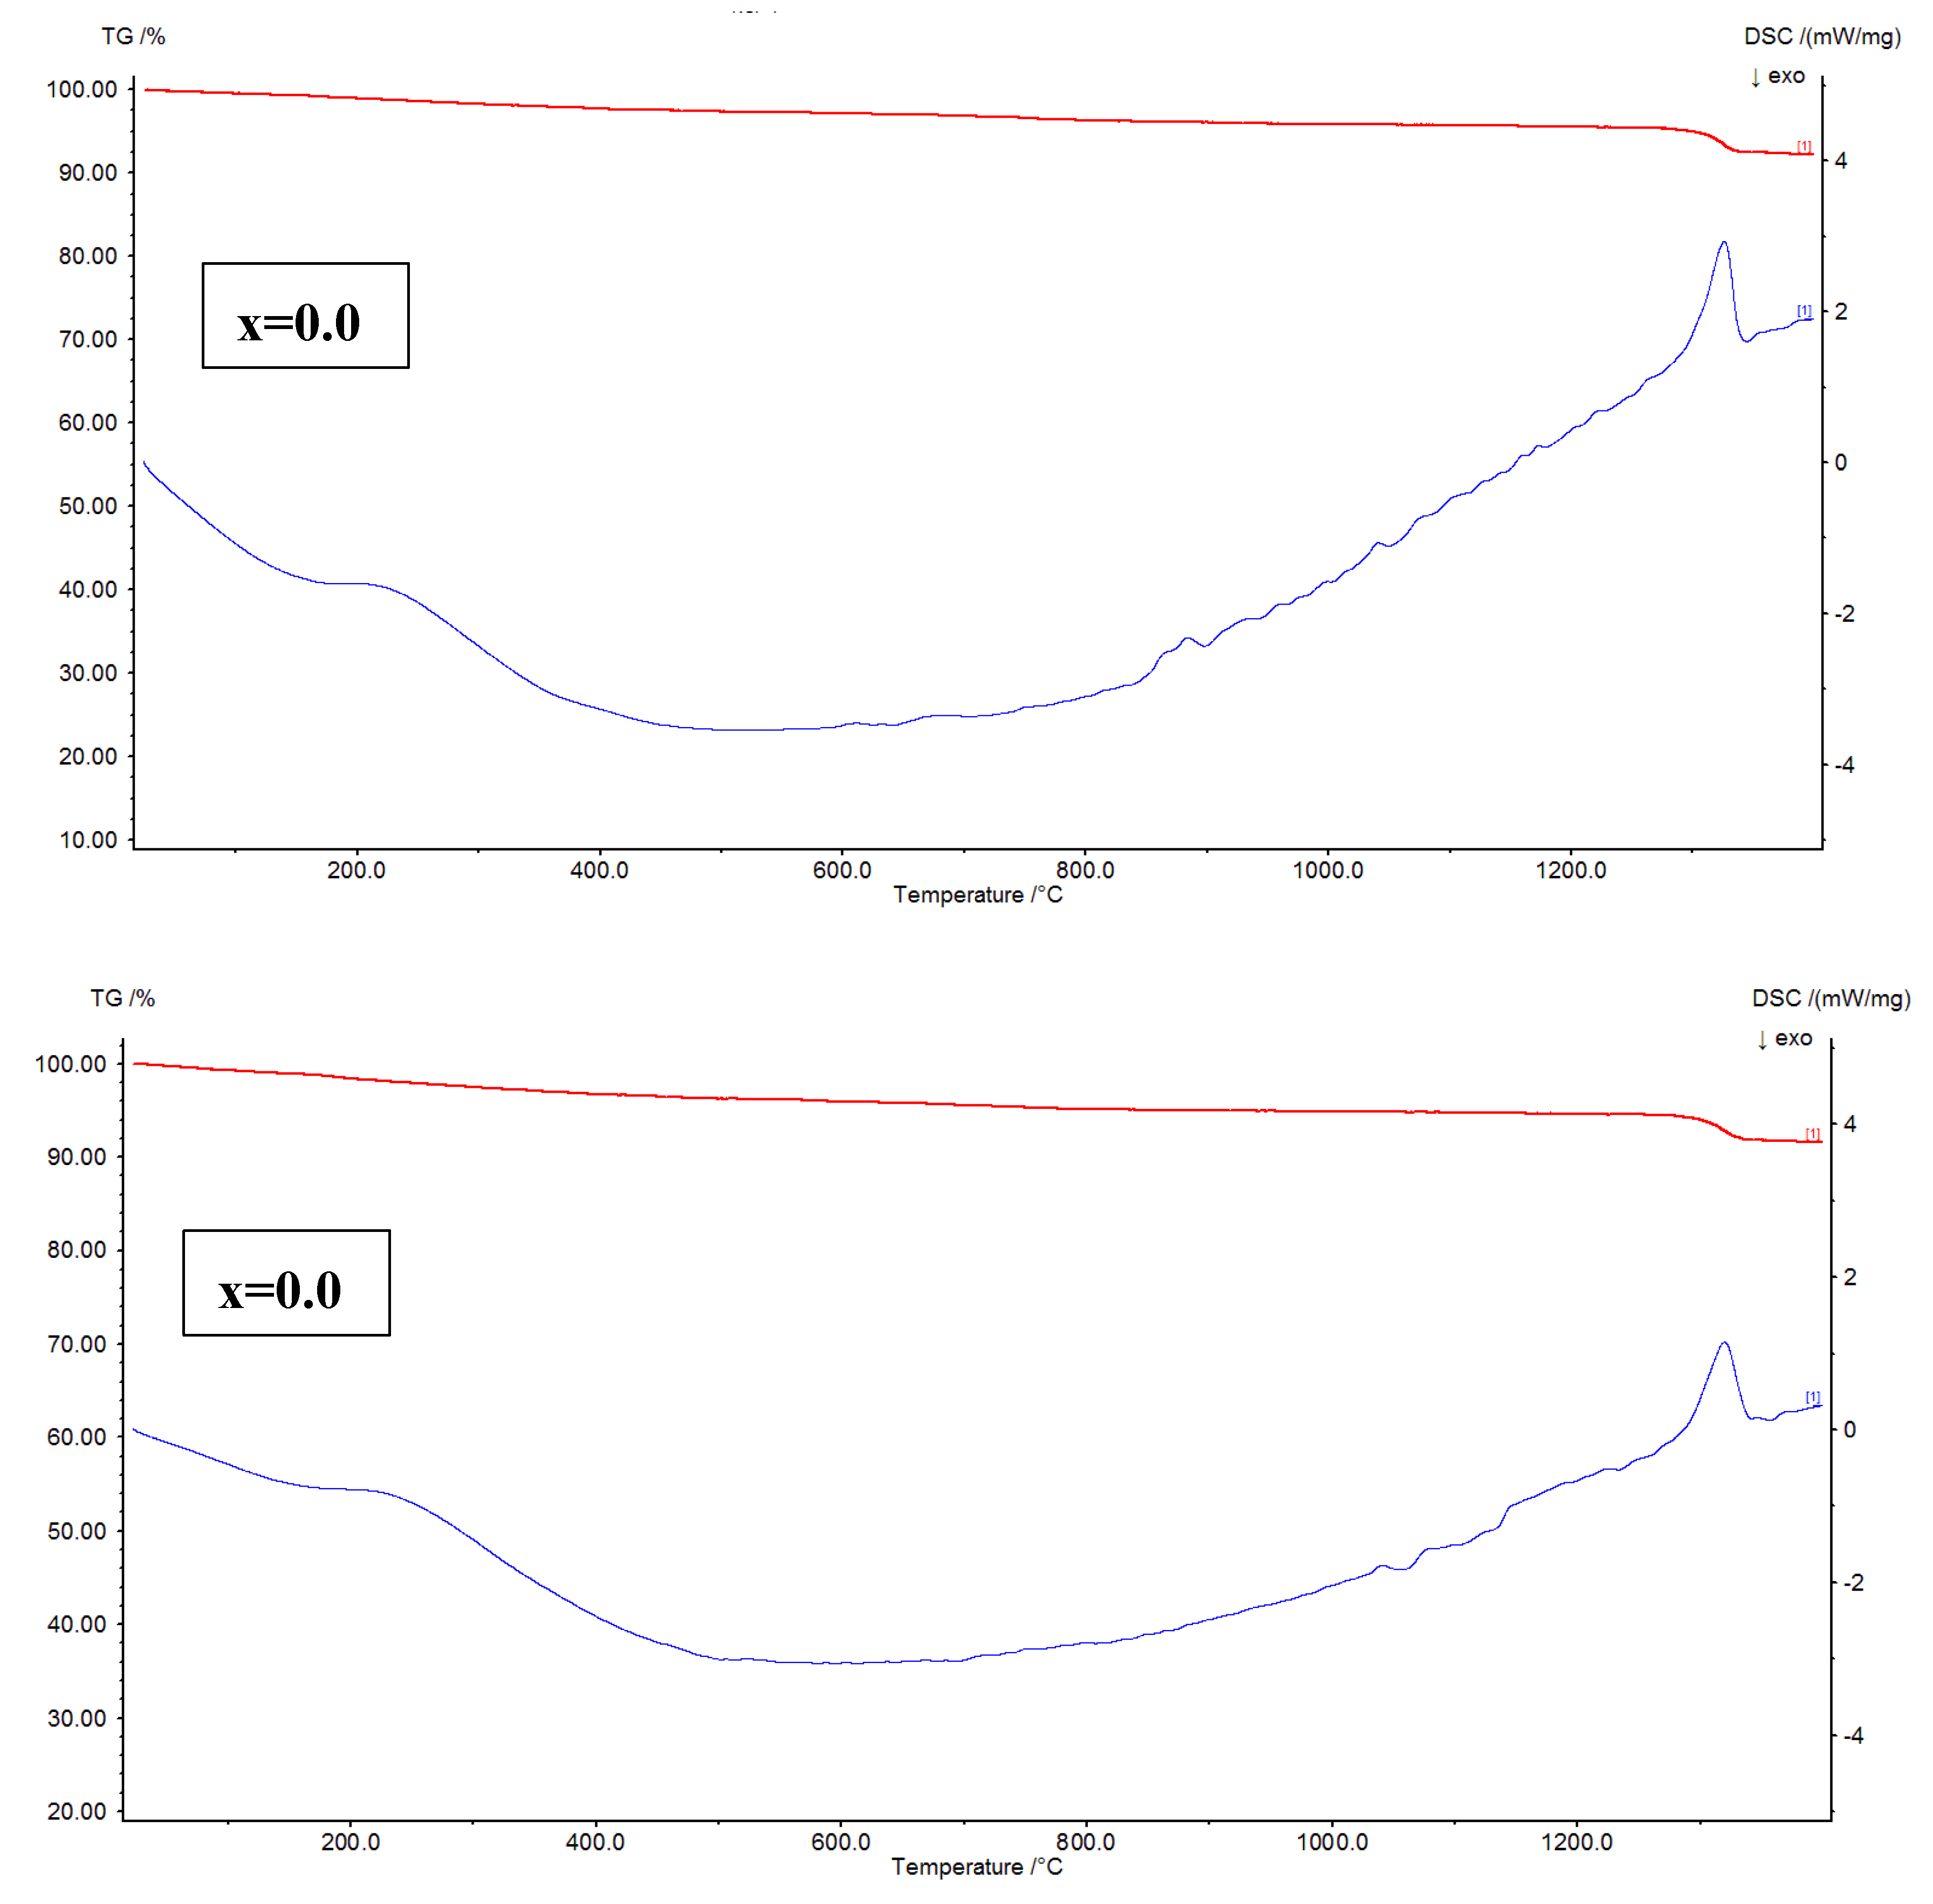
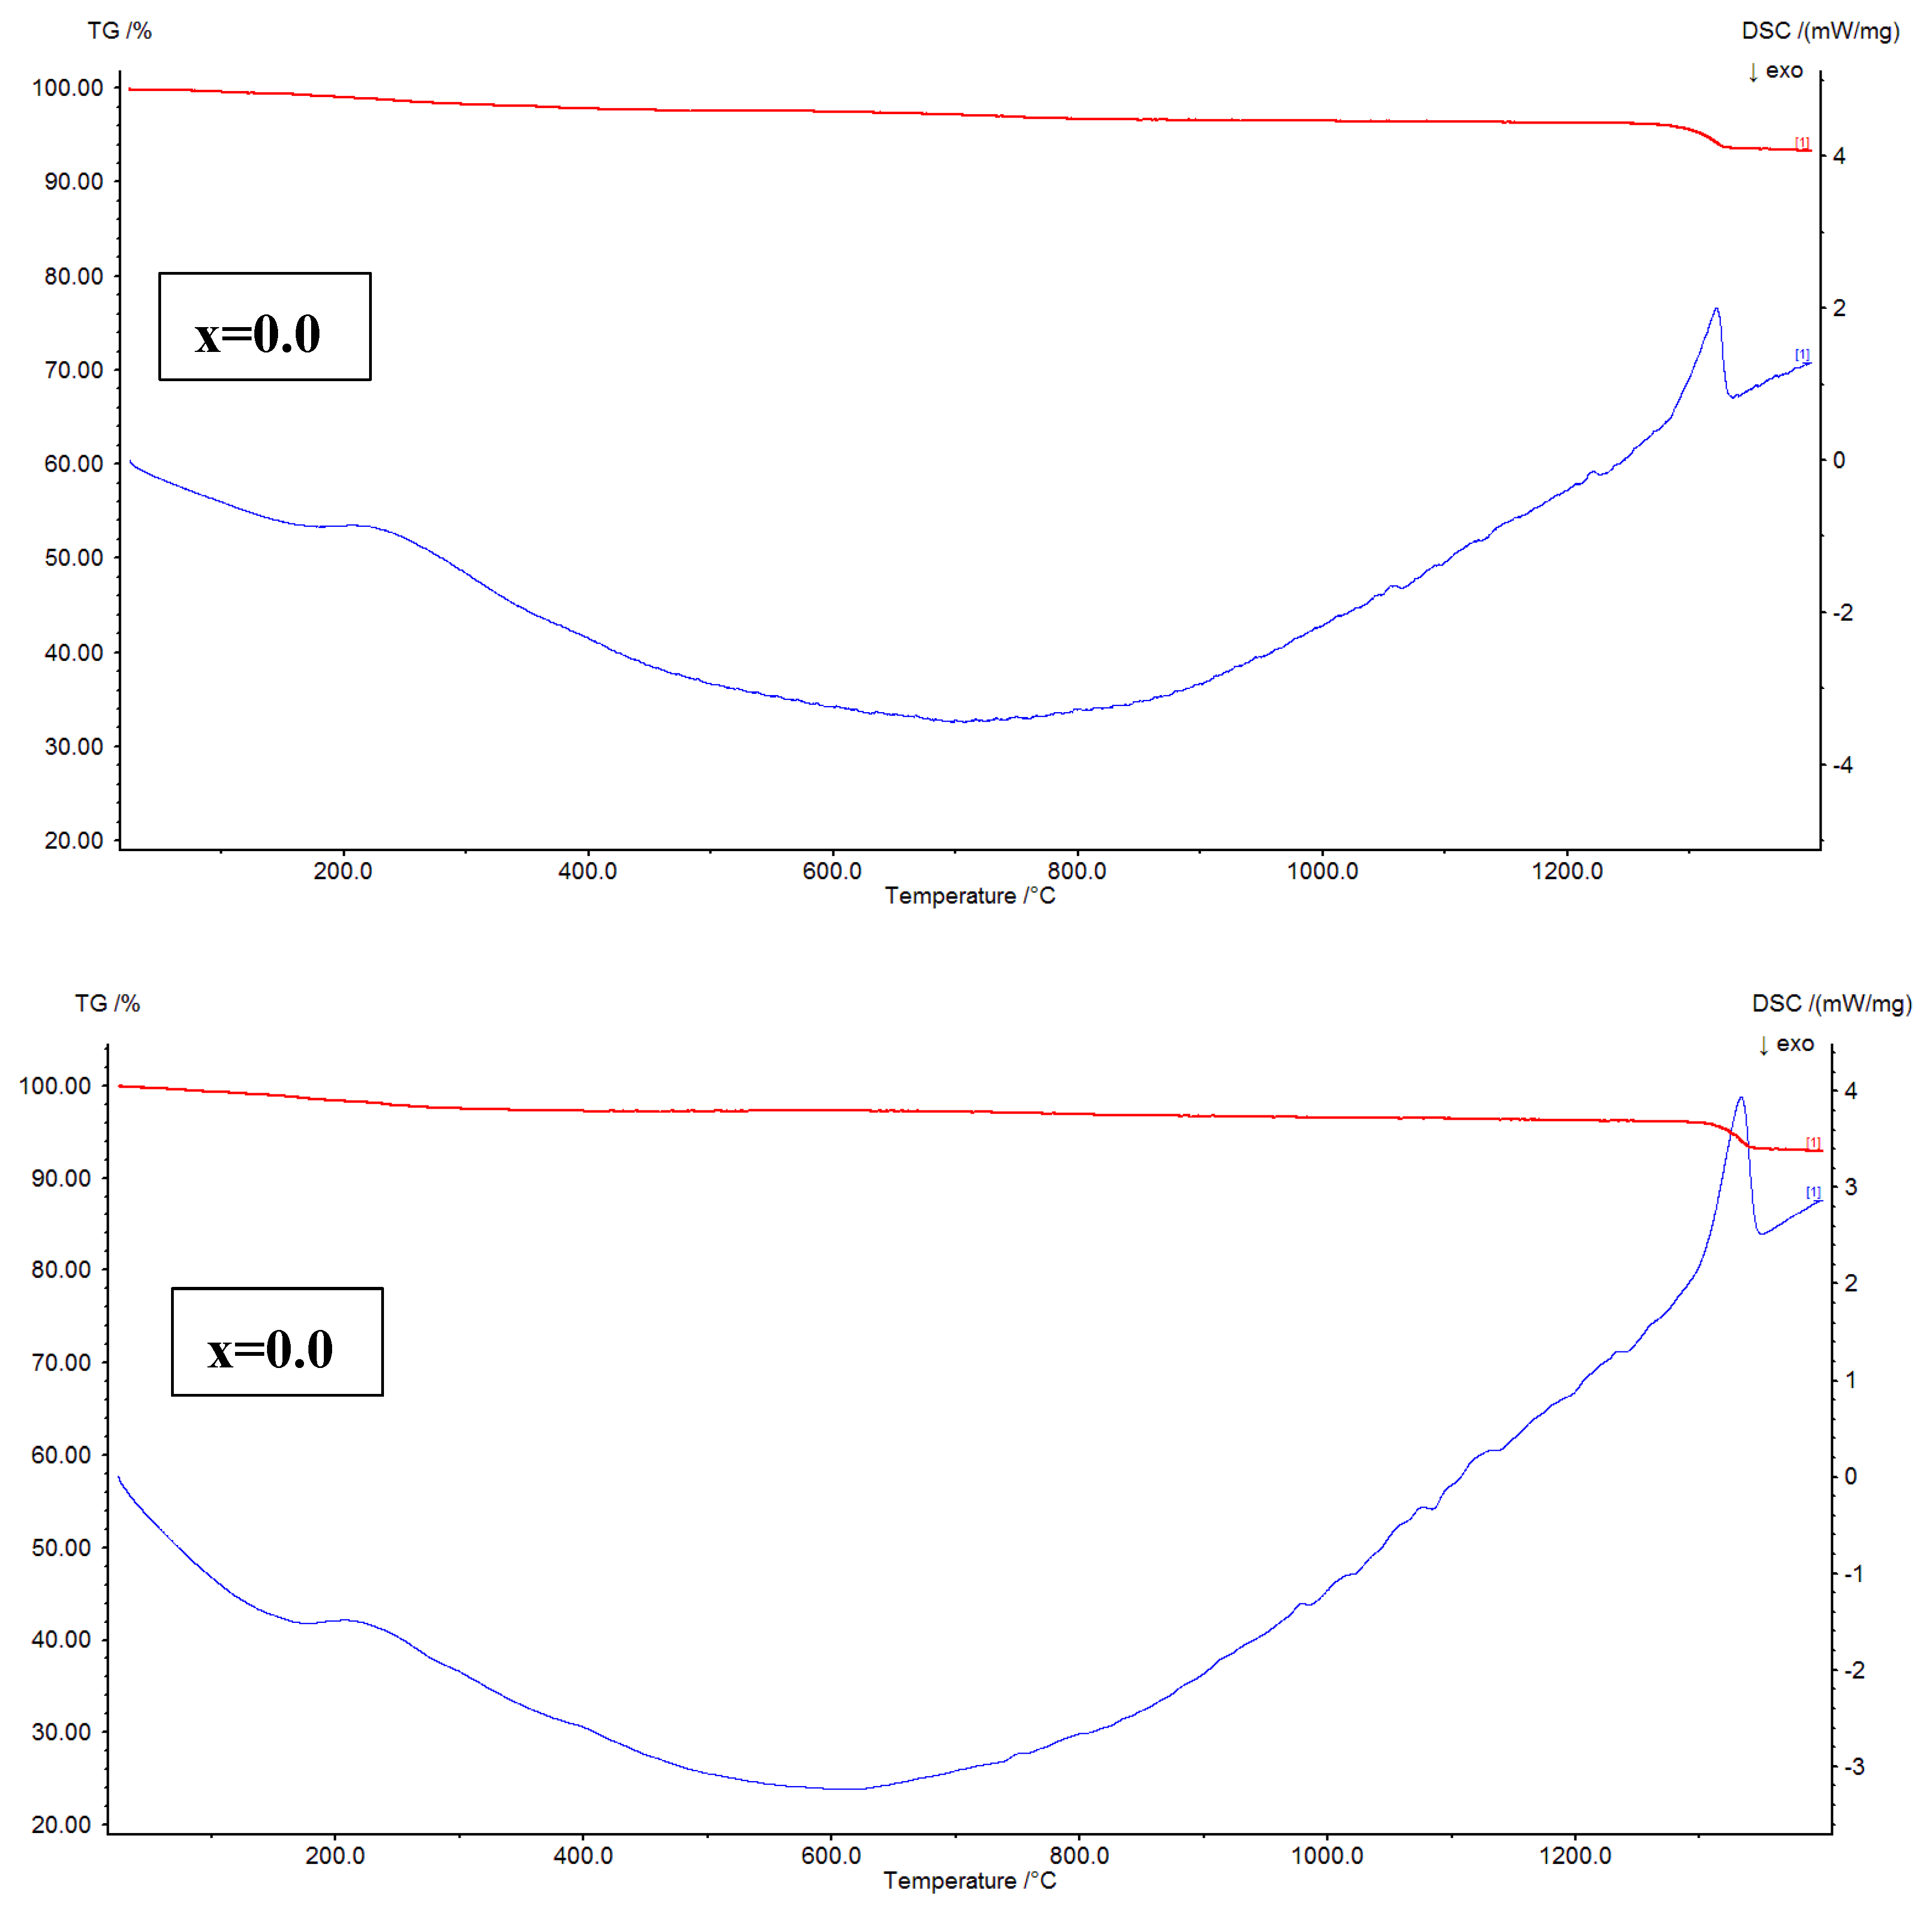
Figure 9.
M-H curves of Ni1-xGdxFe2O4 (x=0.02 – 0.08) nanoparticles.
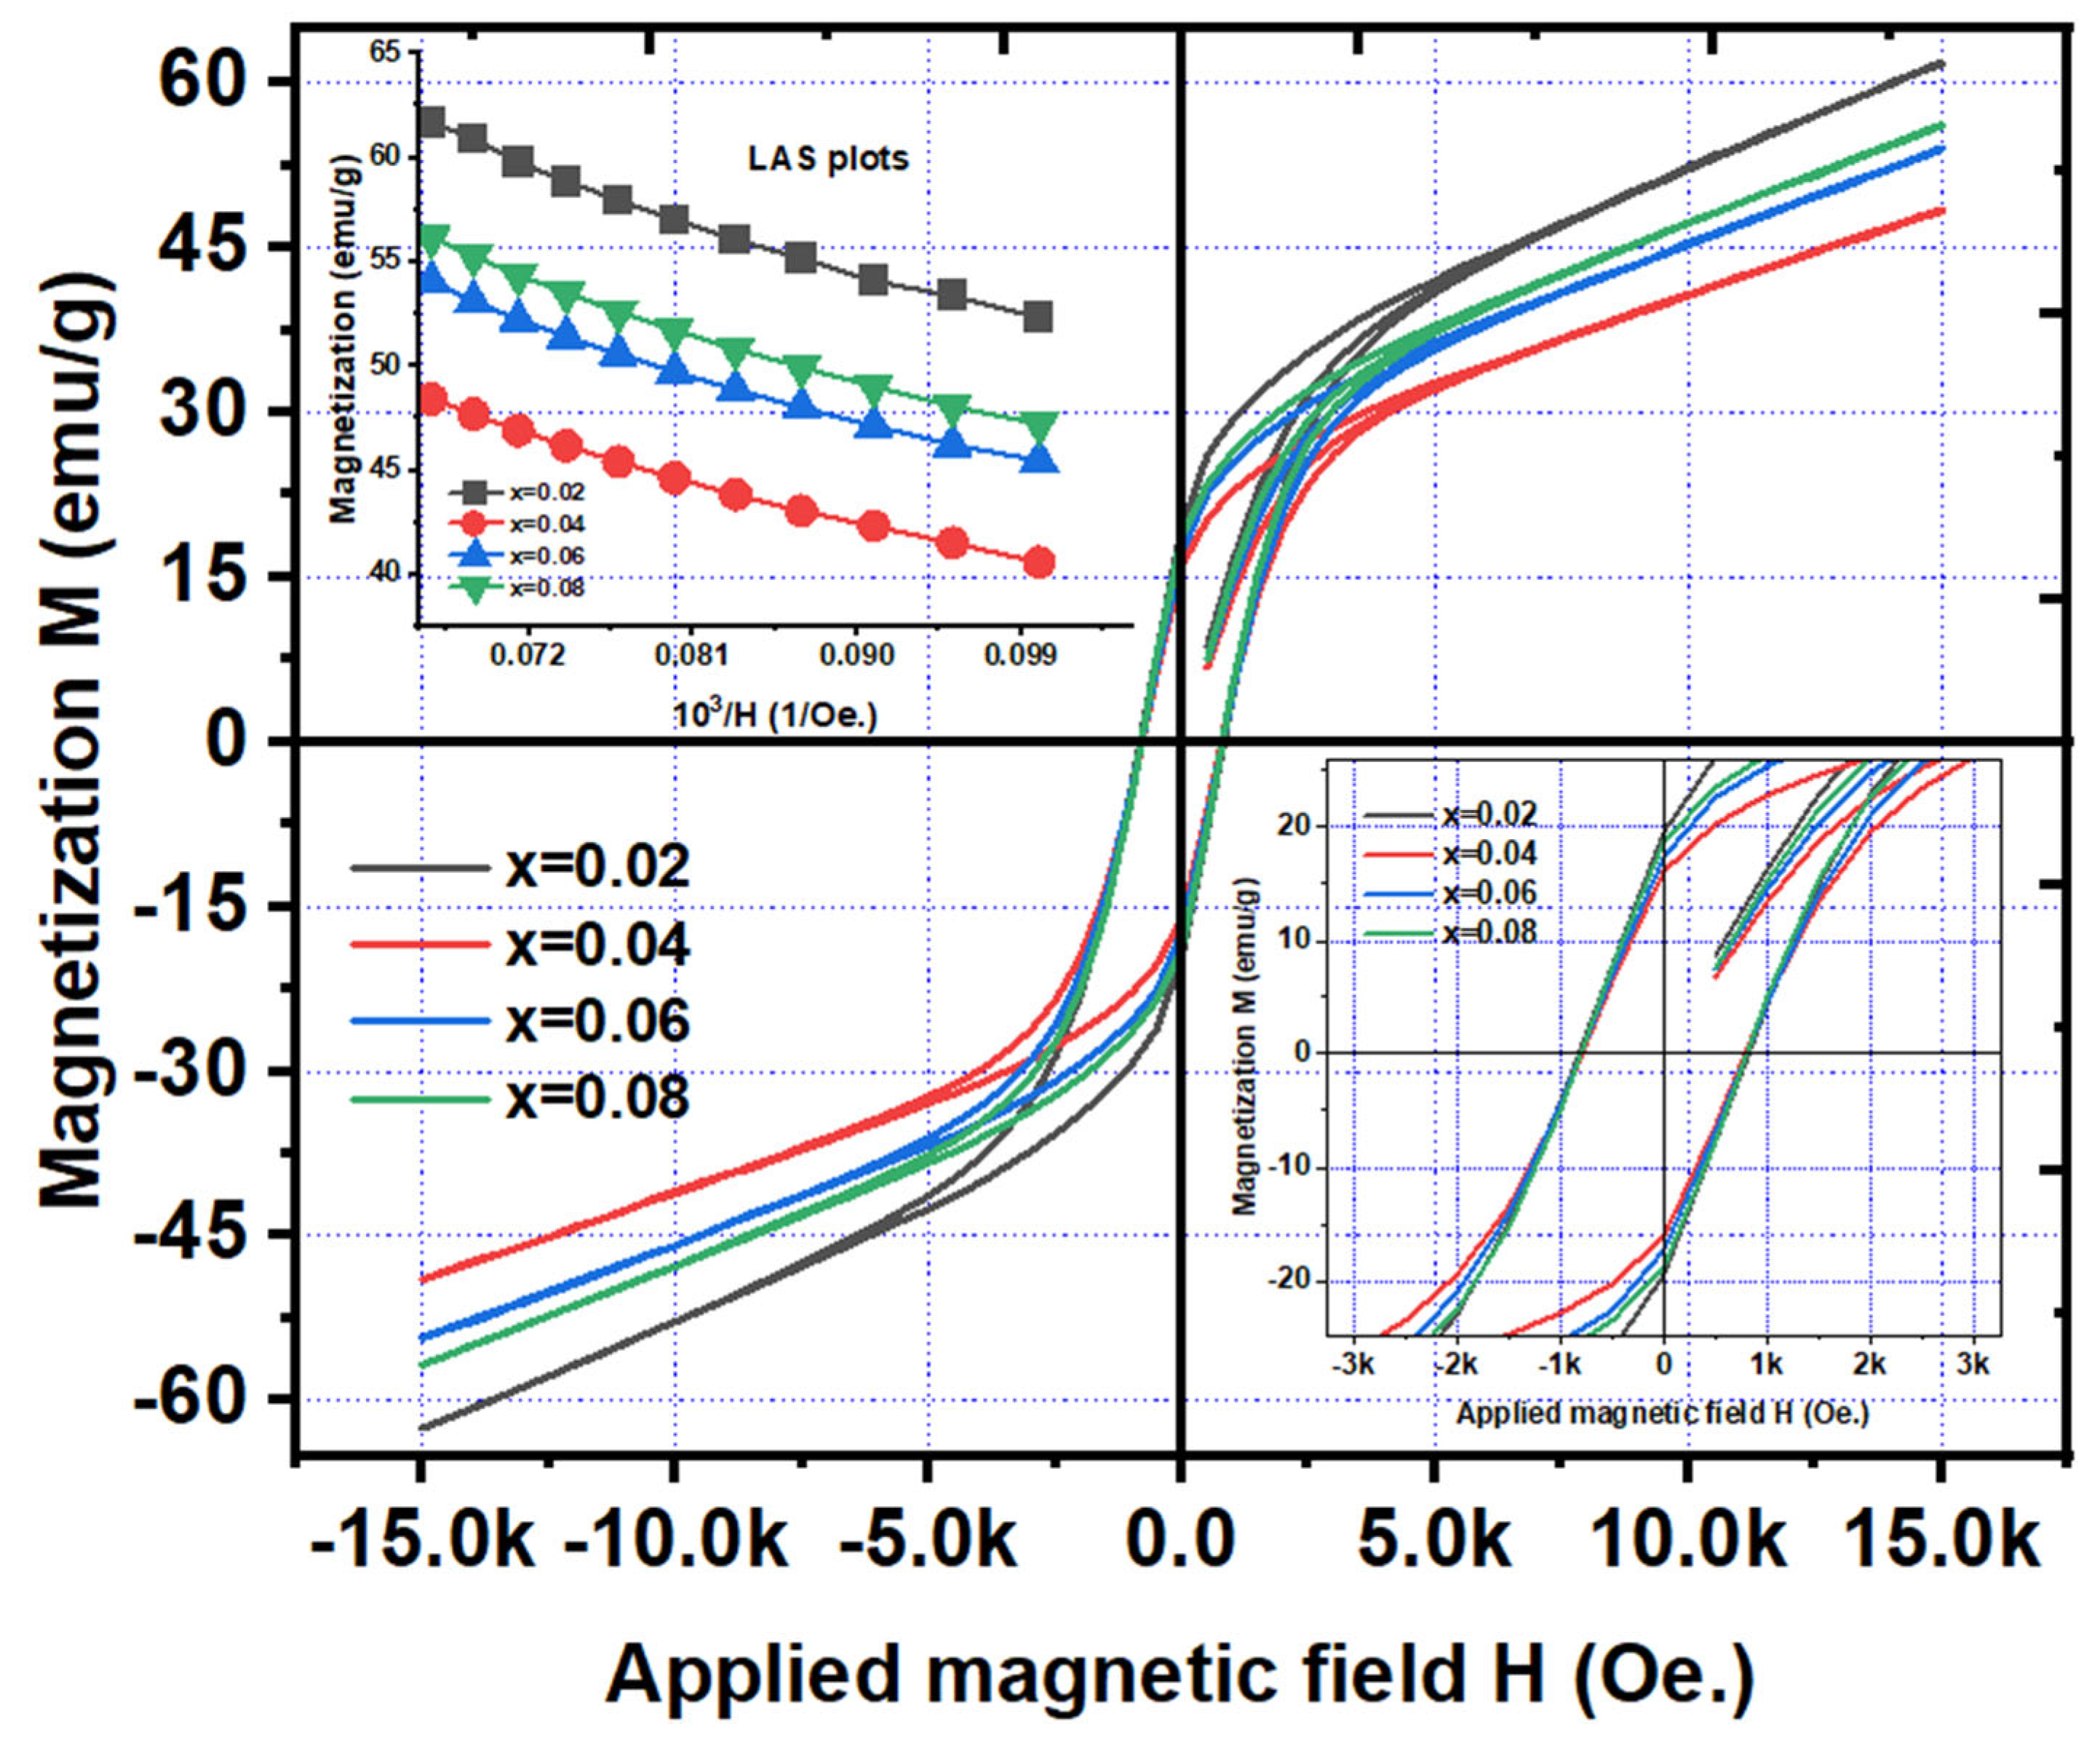
Figure 10.
Frequency dependence of ɛ', and ɛ" of NGF nanoparticles.
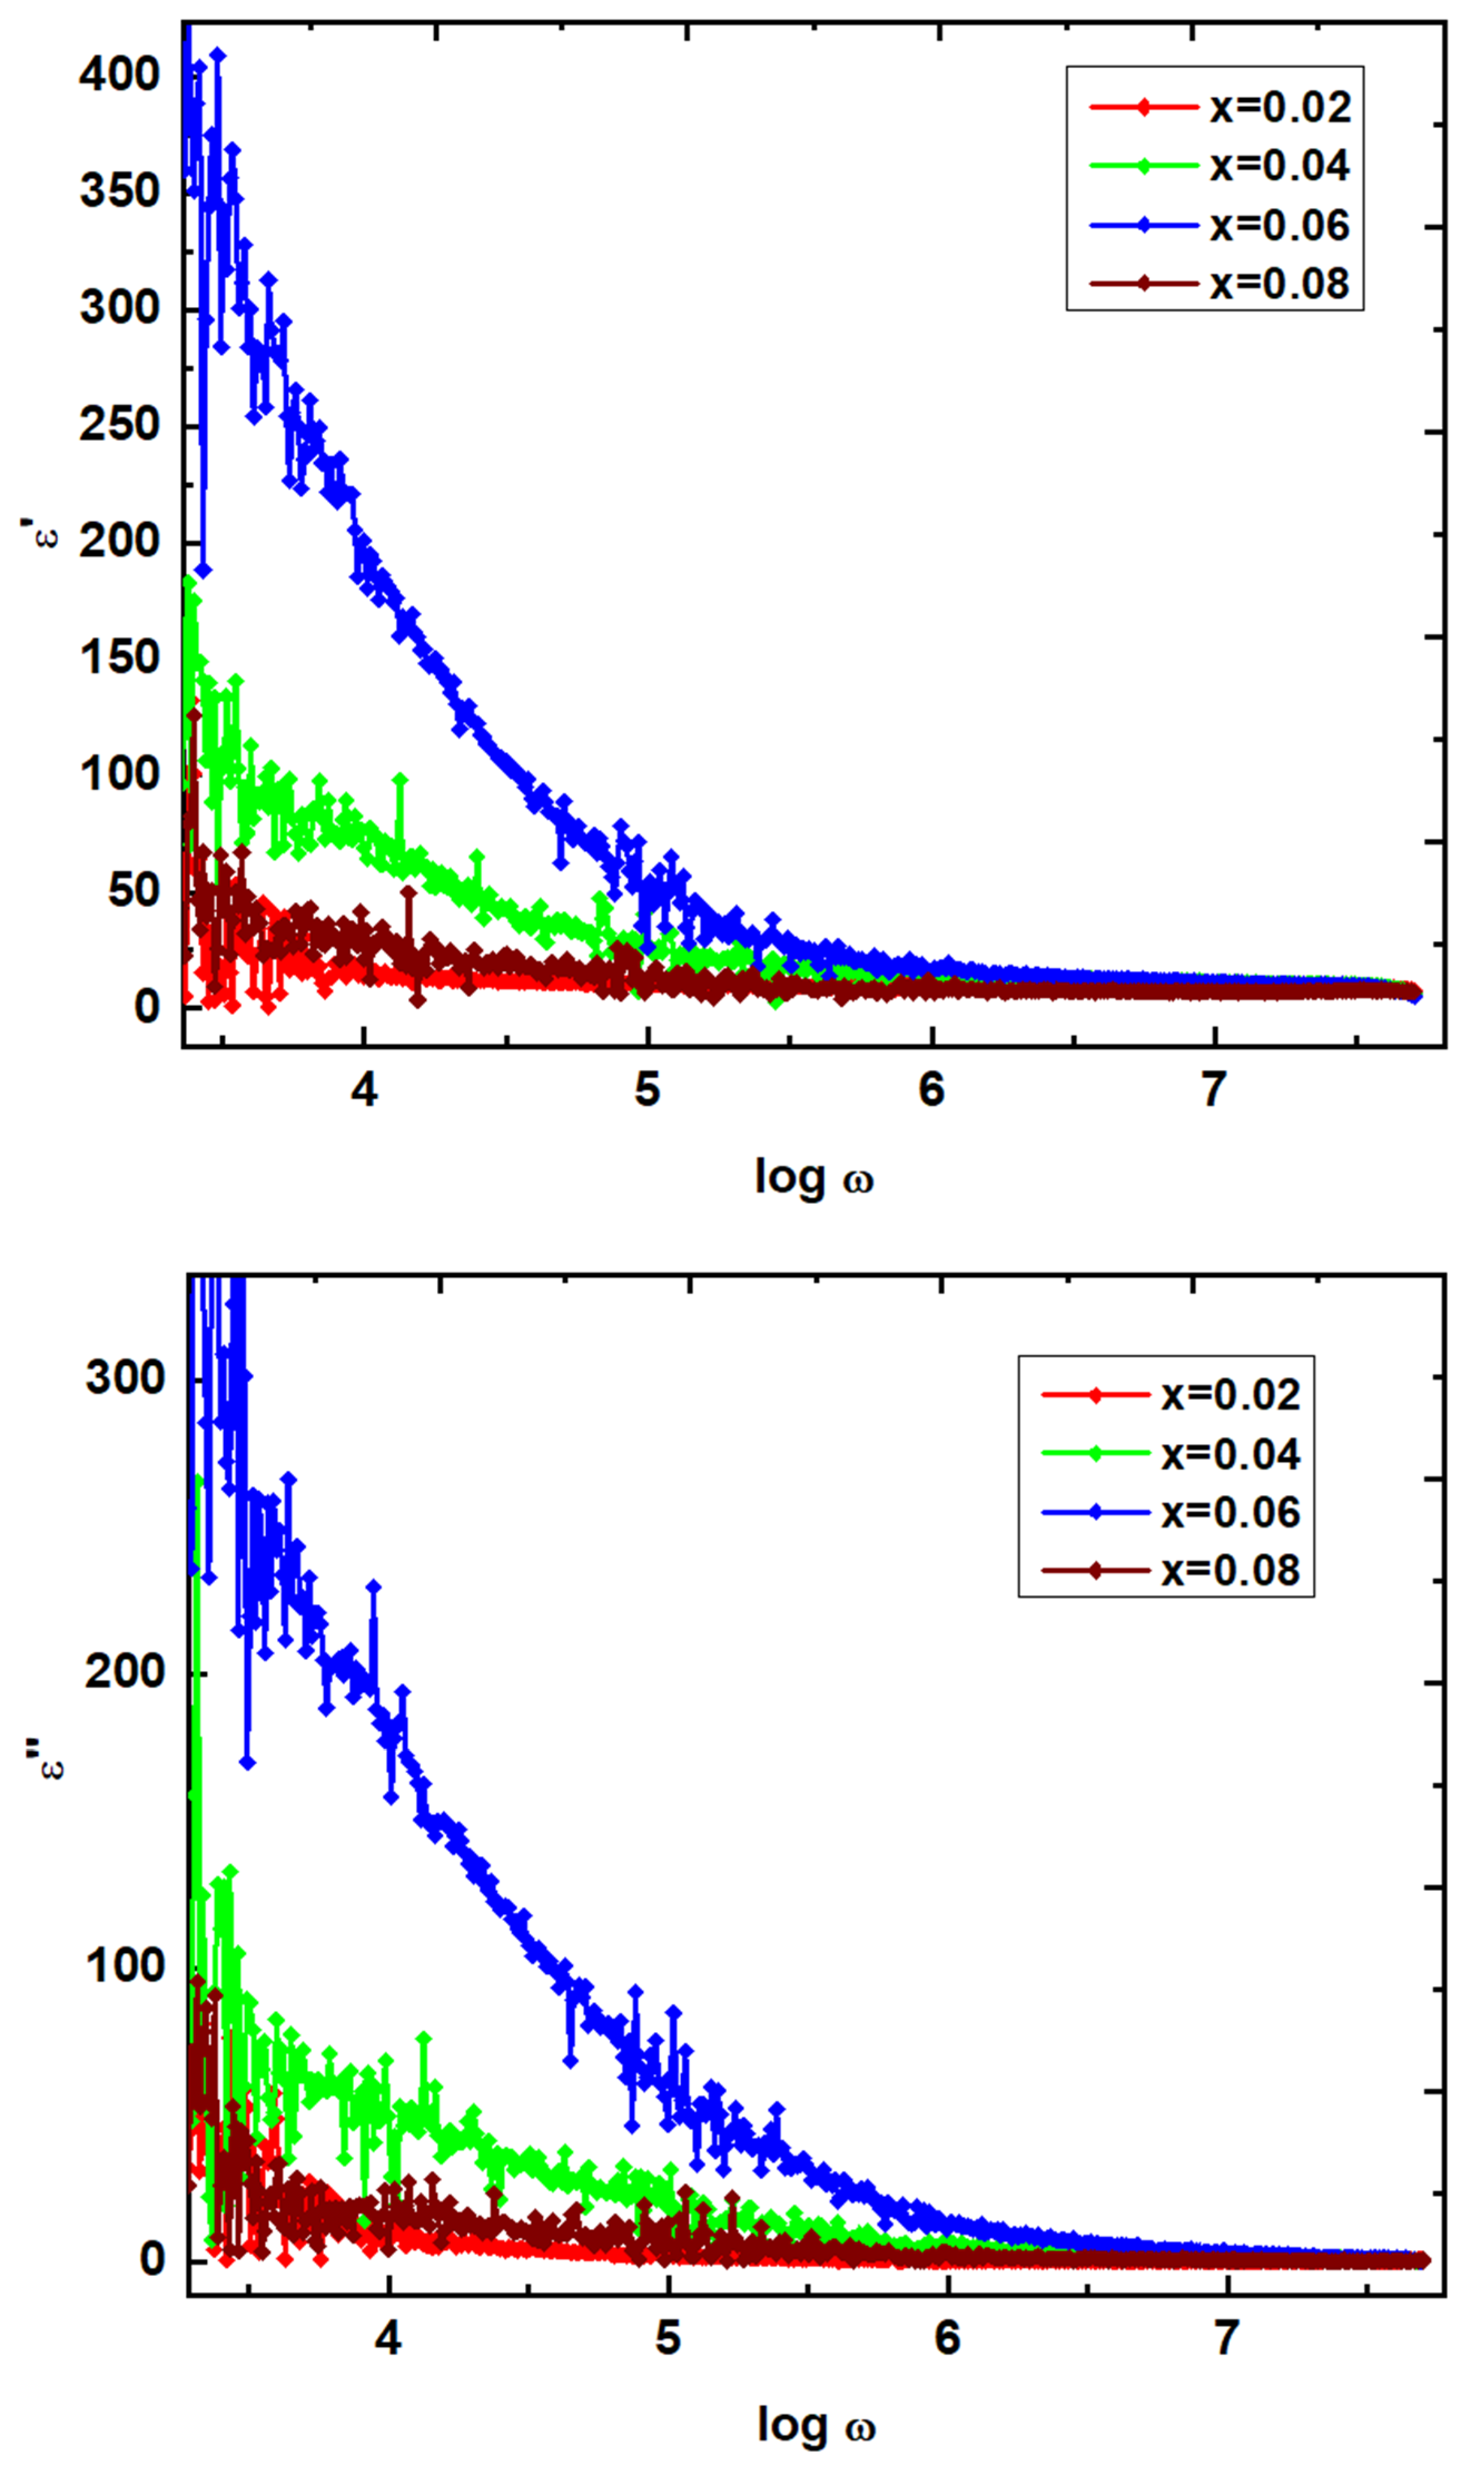
Figure 11.
Frequency dependence of ac-conductivity of NGF nanoparticles.
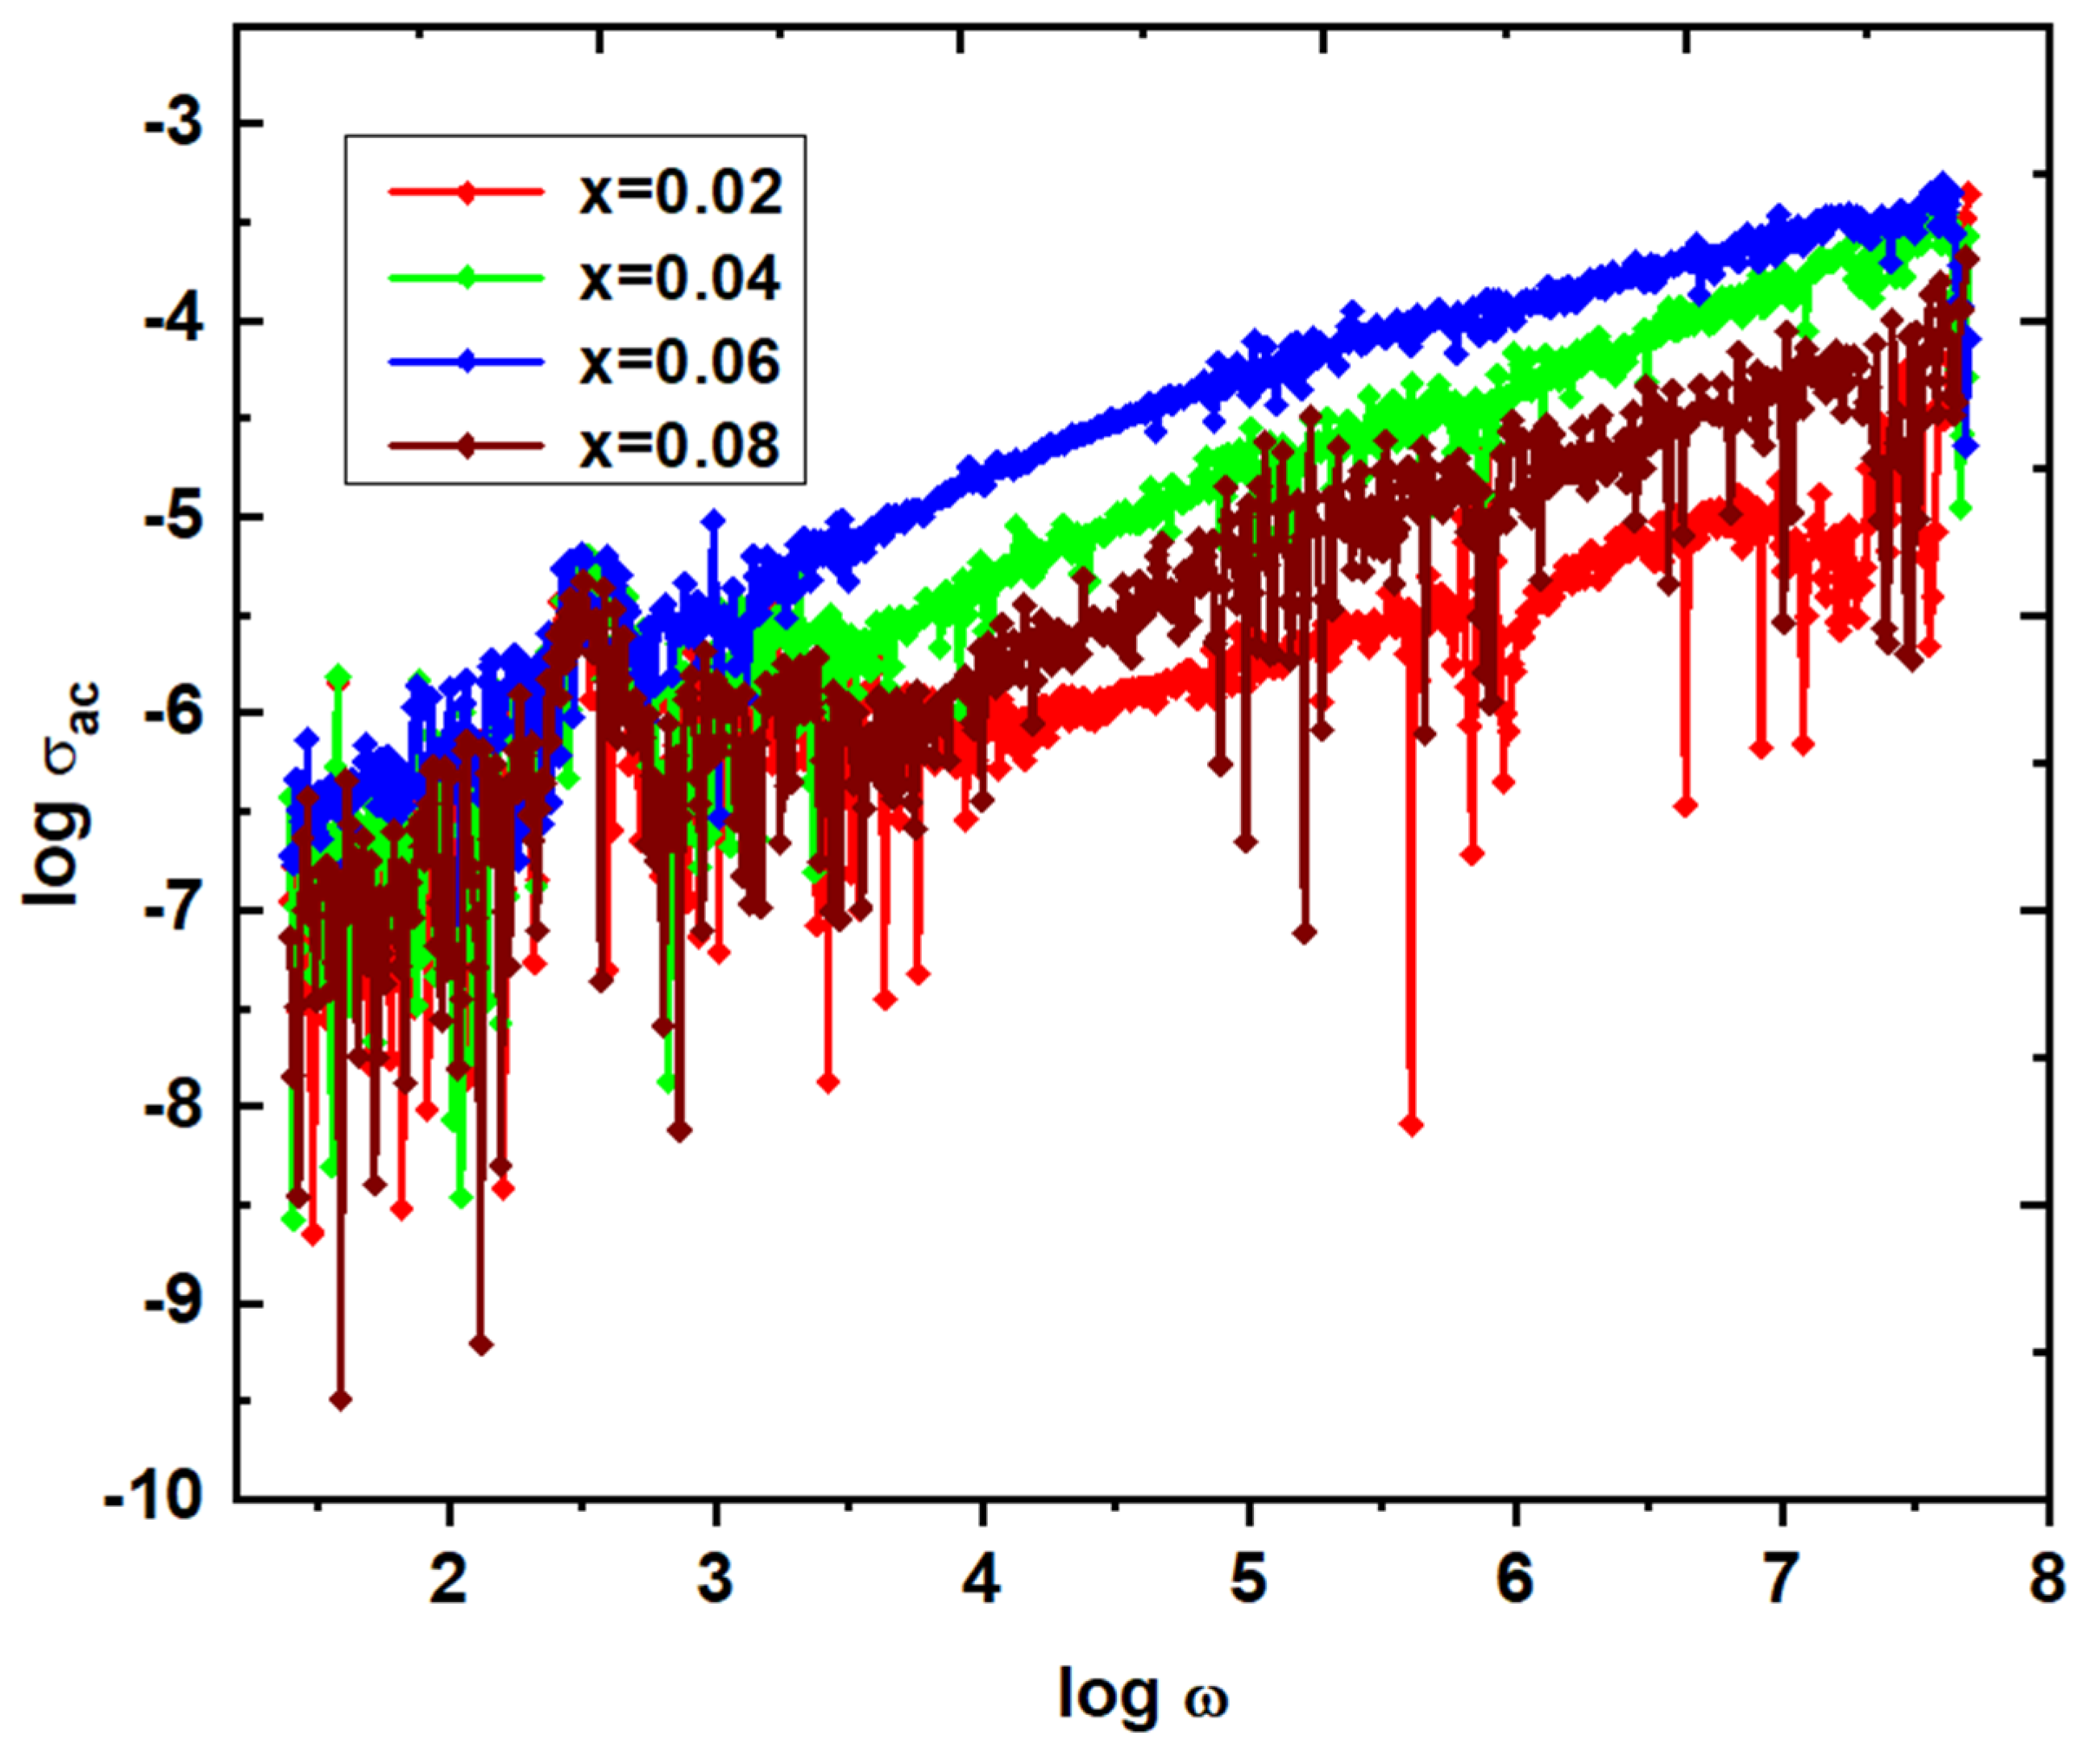
Figure 12.
Frequency dependence of M', and M" of NGF nanoparticles.
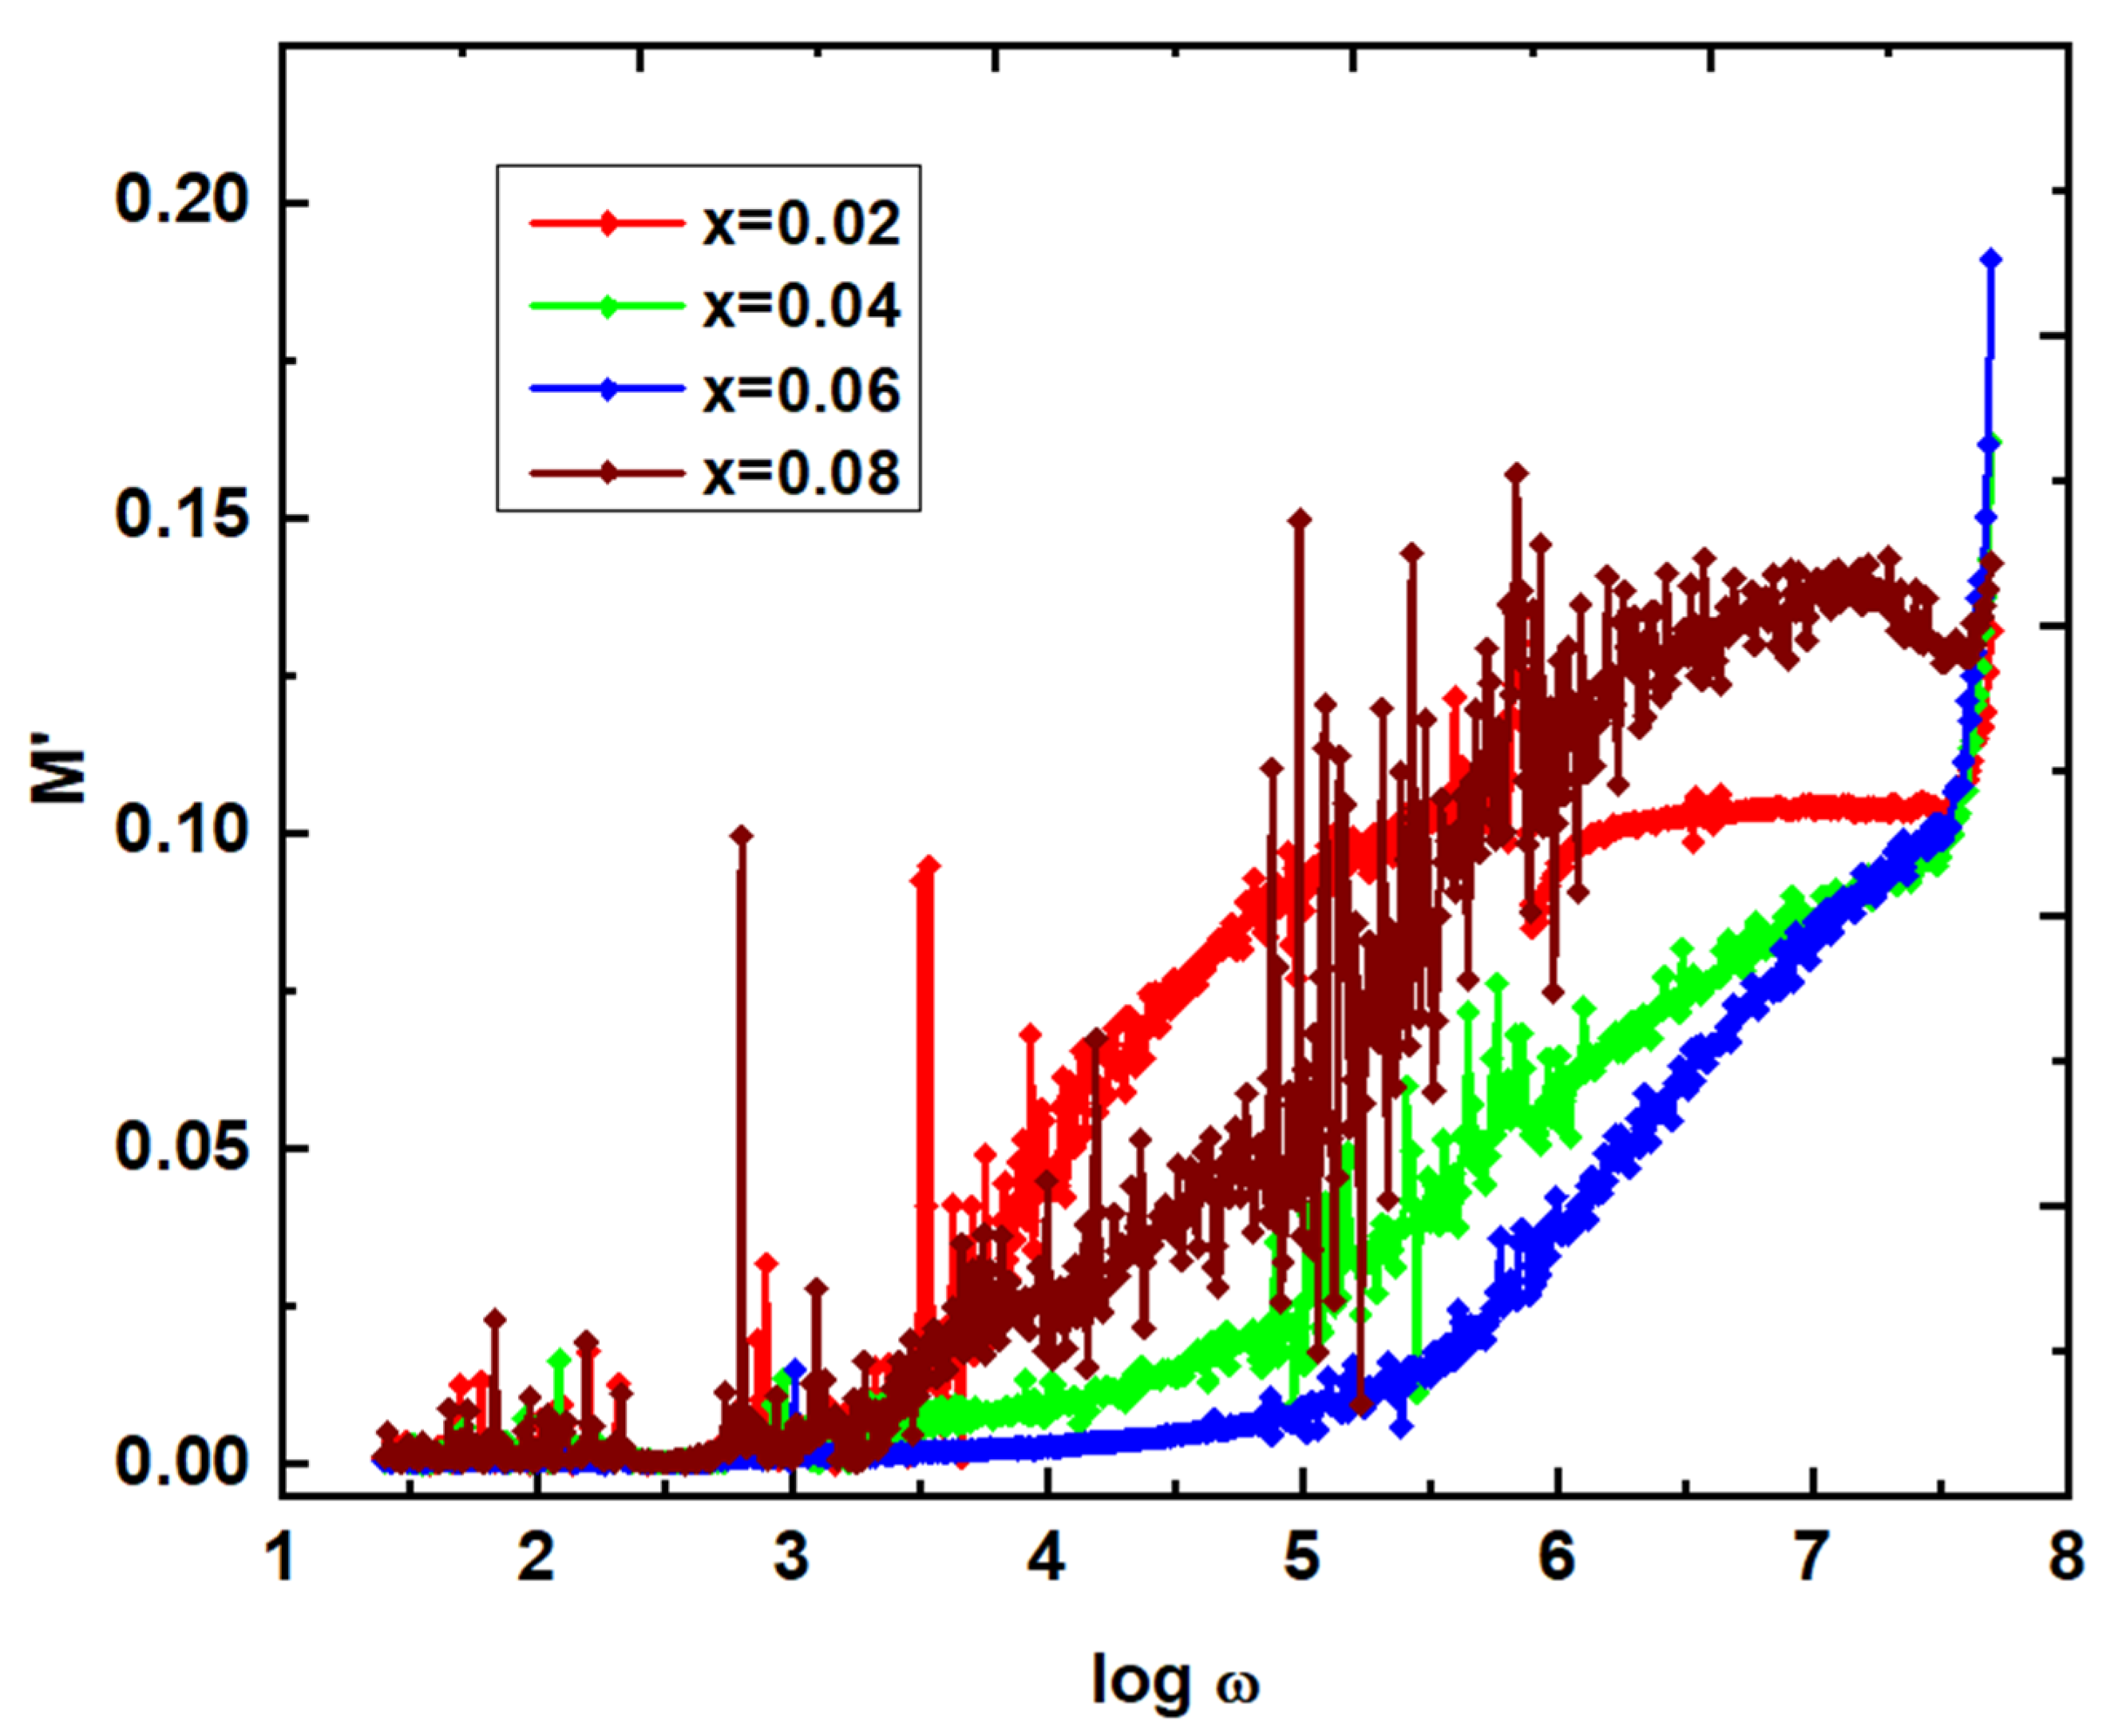
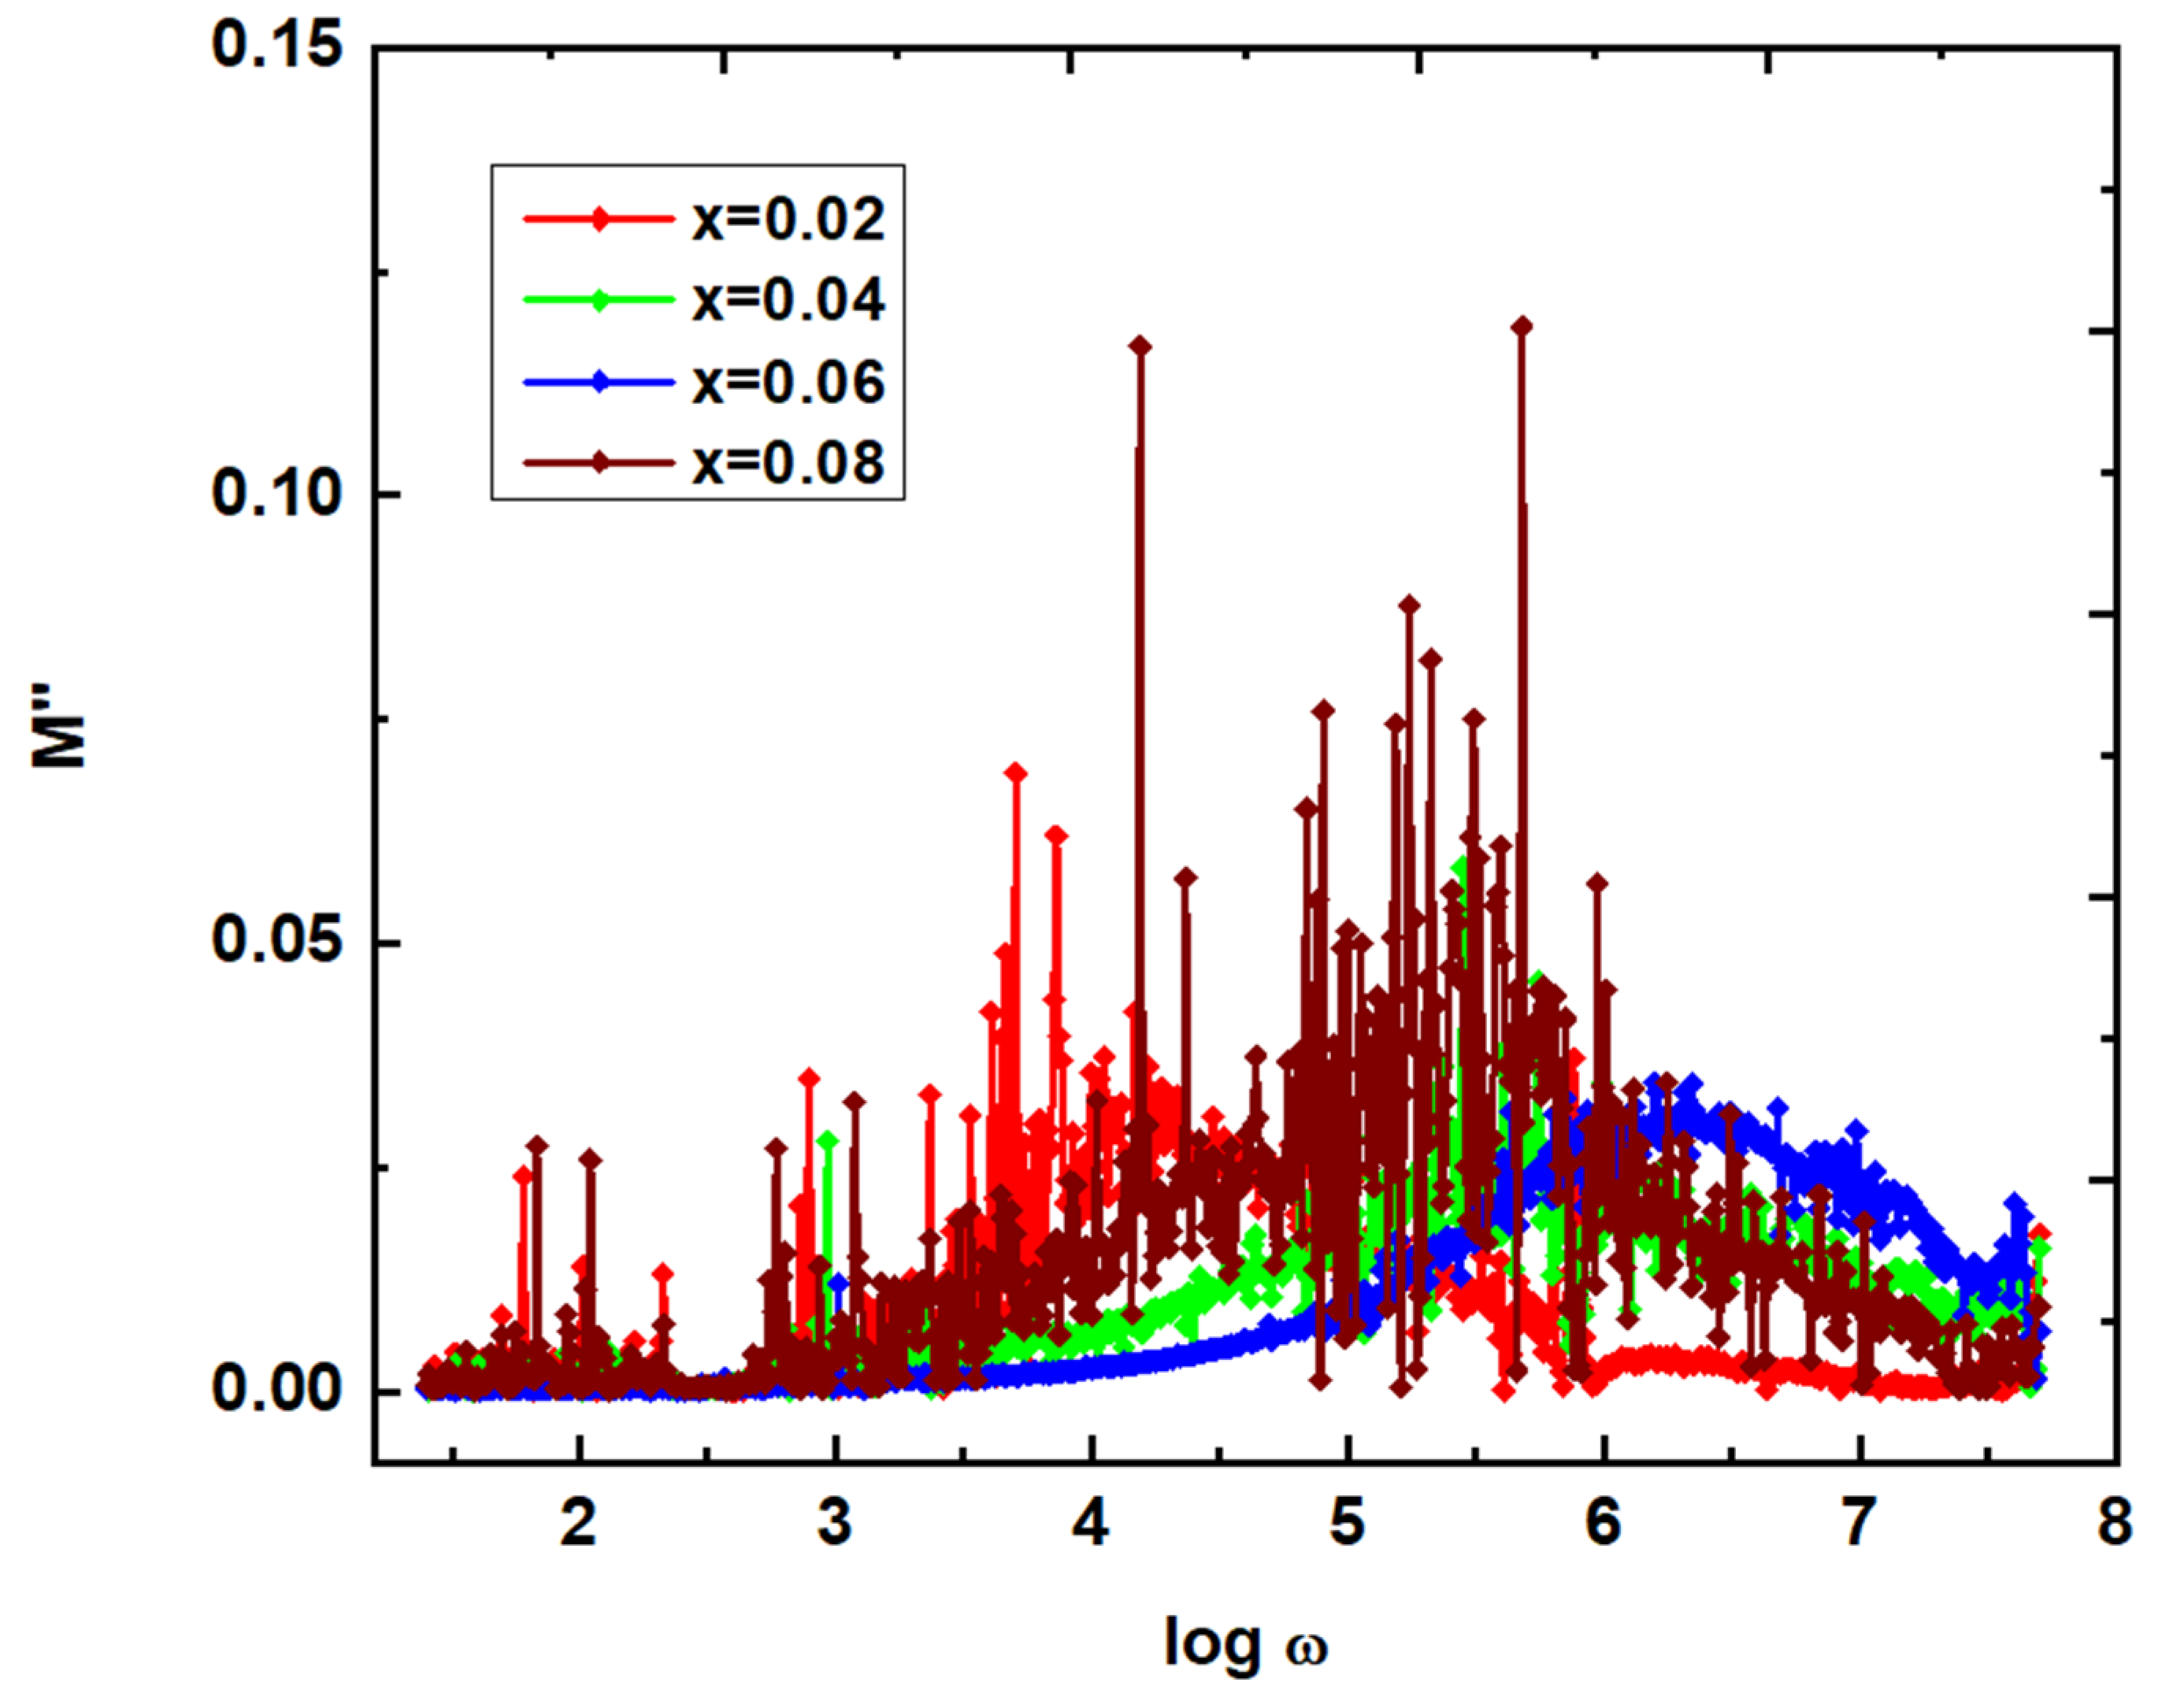
Figure 13.
Frequency dependence of Z', and Z" of NGF nanoparticles.
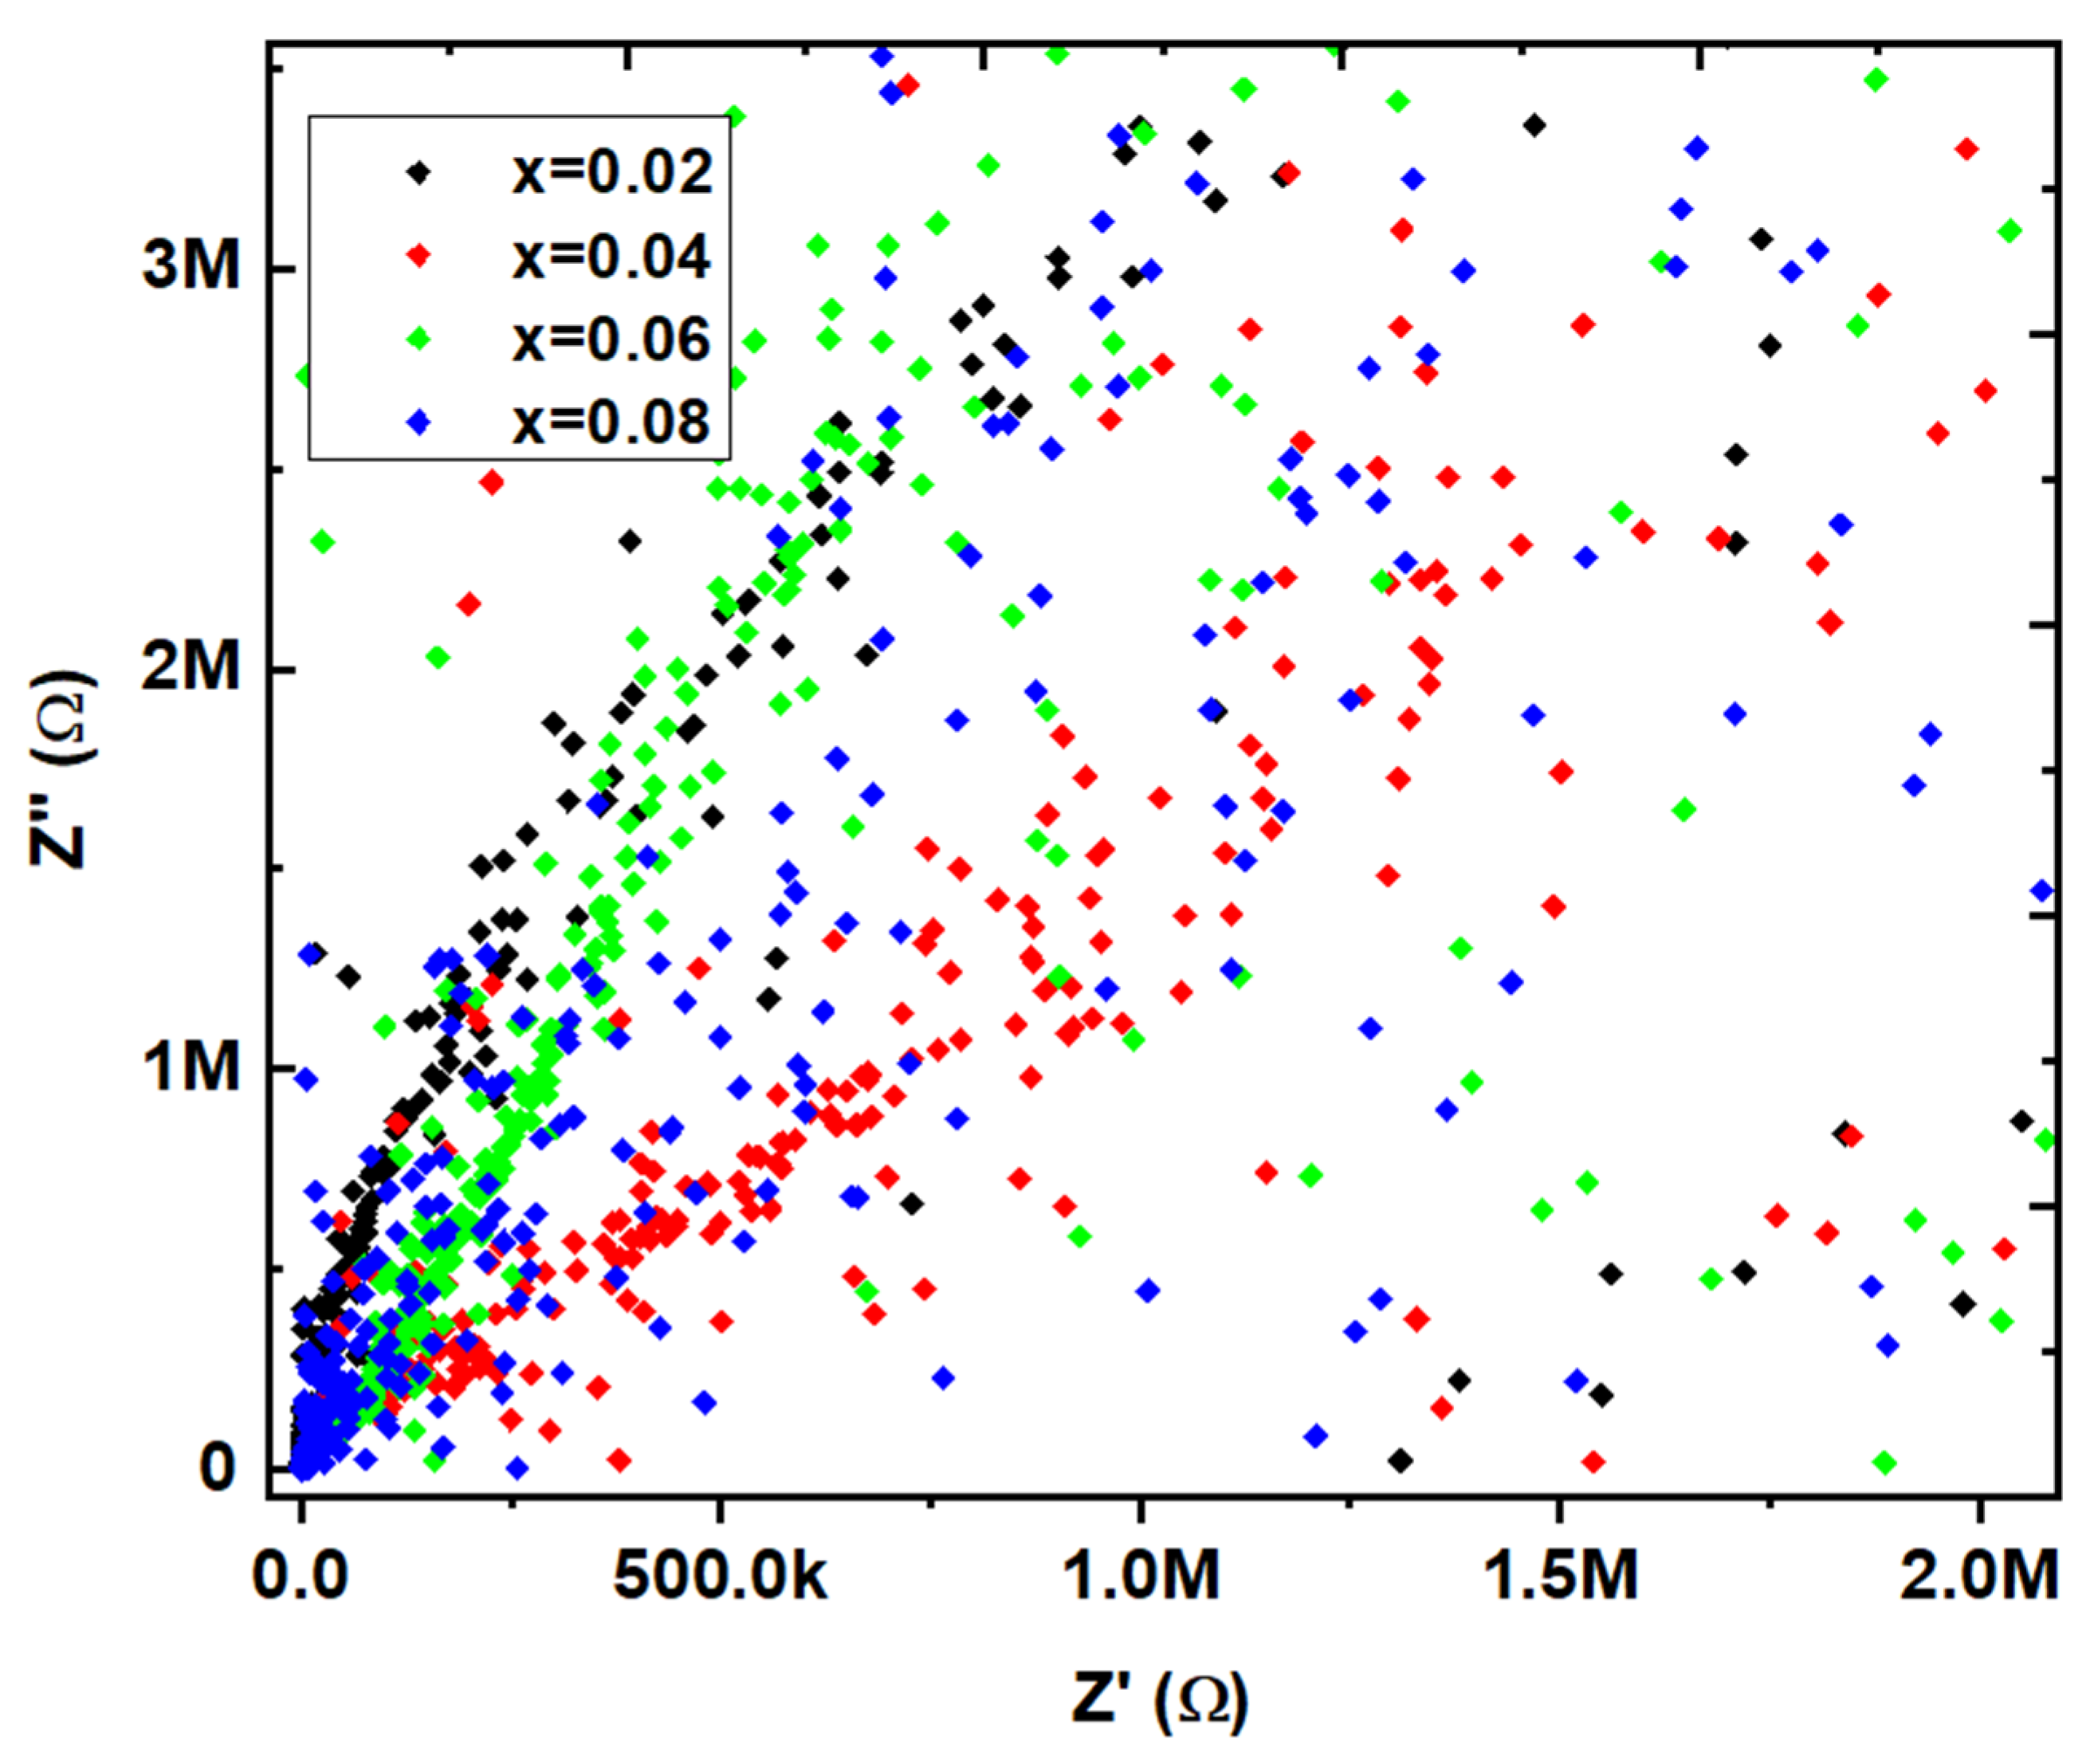

Table 1.
Data on XRD parameters of Ni1-xGdxFe2O4 (x=0.02 – 0.08) nanoparticles.
| x | 0.02 | 0.04 | 0.06 | 0.08 |
|---|---|---|---|---|
| Da (nm) | 24.8 | 18.7 | 39.1 | 43.4 |
| a=b=c (Å) | 8.956 | 8.961 | 8.969 | 8.975 |
| V (Å)3 | 0.622 | 0.6234 | 0.625 | 0.626 |
| MW (g/mole) | 236.355 | 238.326 | 240.297 | 242.268 |
| ρx (g/c.c.) | 5.047 | 5.078 | 5.108 | 5.143 |
| S (m2/g) | 47.9 | 63.2 | 30.1 | 26.9 |
Table 2.
Thermal parameters of Ni1-xGdxFe2O4 (x=0.02 – 0.08) nanoparticles.
| x | 0.02 | 0.04 | 0.06 | 0.08 |
|---|---|---|---|---|
| Tg (oC) | 186 | 182 | 188 | 190 |
| Tc (oC) | 910 | 1040 | 1080 | 1110 |
| Tm (oC) | 1310 | 1340 | 1360 | 1370 |
Table 3.
Magnetic parameters of Ni1-xGdxFe2O4 (x=0.02 – 0.08) nanoparticles.
| Parameter | x=0.02 | x=0.04 | x=0.06 | x=0.08 |
|---|---|---|---|---|
| Ms (emu/g) | 62.07 | 49.1 | 54.5 | 57.1 |
| Mr (emu/g) | 19.6 | 16.1 | 17.3 | 18.5 |
| Mr/Ms | 0.316 | 0.328 | 0.317 | 0.324 |
| Hc (Oe.) | 823.7 | 788.8 | 806.3 | 801.1 |
| K1 (erg/cm3) | 53257.4 | 40343.8 | 45774.3 | 47648.8 |
| nB (μB/f.u.) | 2.627 | 2.095 | 2.345 | 2.477 |
| ωp (erg/cm2) | 0.00197 | 0.00172 | 0.00183 | 0.00188 |
| Dc (nm) | 27.7 | 38.1 | 32.0 | 30.2 |
Table 4.
Cation distribution of Ni1-xGdxFe2O4 (x=0.02 – 0.08) nanoparticles.
| x | A-site | B-site | ||||||
|---|---|---|---|---|---|---|---|---|
| Ni2+ | Fe3+ | Fe2+ | Gd3+ | Ni2+ | Fe3+ | Fe2+ | nB (μB/f.u.) | |
| 0.02 | 0.490 | 0.750 | 0.04 | 0.02 | 0.490 | 1.153 | 0.057 | 2.627 |
| 0.04 | 0.513 | 0.750 | 0.09 | 0.04 | 0.447 | 1.100 | 0.060 | 2.095 |
| 0.06 | 0.495 | 0.440 | 0.40 | 0.06 | 0.445 | 0.844 | 0.316 | 2.345 |
| 0.08 | 0.485 | 0.510 | 0.33 | 0.08 | 0.435 | 0.890 | 0.270 | 2.477 |
Table 5.
Dielectric parameters of Ni1-xGdxFe2O4 (x=0.02 – 0.08) nanoparticles at 8 MHz.
| x | ɛ' | ɛ" | Log σac (S/m) |
|---|---|---|---|
| 0.02 | 7.44 | 0.987 | -3.355 |
| 0.04 | 6.11 | 0.599 | -3.571 |
| 0.06 | 5.23 | 0.181 | -4.092 |
| 0.08 | 6.97 | 0.460 | -3.686 |
Disclaimer/Publisher’s Note: The statements, opinions and data contained in all publications are solely those of the individual author(s) and contributor(s) and not of MDPI and/or the editor(s). MDPI and/or the editor(s) disclaim responsibility for any injury to people or property resulting from any ideas, methods, instructions or products referred to in the content. |
© 2023 by the authors. Licensee MDPI, Basel, Switzerland. This article is an open access article distributed under the terms and conditions of the Creative Commons Attribution (CC BY) license (http://creativecommons.org/licenses/by/4.0/).
Copyright: This open access article is published under a Creative Commons CC BY 4.0 license, which permit the free download, distribution, and reuse, provided that the author and preprint are cited in any reuse.


