
Submitted:
05 January 2025
Posted:
06 January 2025
You are already at the latest version
Abstract
Consumption of high fat (HFD) or carbohydrates (LFD) diets are related to insu-lin resistance; however, central and peripheral alterations can occur independently. The timeline of insulin resistance was determined taking in consideration the role of diet on oxidative damage. Background/Objectives: The aim to this study was to ascertain whether HFD or LFD induces peripheral insulin resistance (PIR) before brain insulin re-sistance (BIR), and whether the timing of these alterations correlates with heightened oxi-dative damage markers in plasma, adipose tissue and cerebral cortex. Methodology and results: 3-month-old C57BL/6 male mice were fed with either HFD, LFD, or standard diet for 1, 2, or 3 months. Glucose and insulin tolerance test were performed to determine PIR, and hypothalamic thermogenic response to insulin was used to determine BIR status. For oxidative damage, levels of malondialdehyde (MDA), protein carbonyl group (PCO), and the enzymatic activity of glutathione peroxidase (GSH-Px) were evaluated in plasma, white adipose tissue, brown fat and brain cortex. PIR occurred at 3 months of HFD how-ever MDA levels in the white adipose tissue increased at 2 months. BIR occurred at 1 and 2 months of LFD but the enzymatic activity of GSH-Px was lower at one month and the amount of PCO increased at 2 months. Conclusion: The use of HFD or LFD at different duration can influence the establishment of PIR or BIR, and oxidative damage in the fat tissue and cerebral cortex can play an important role.
Keywords:
diet
; insulin resistance
; oxidative damage
1. Introduction
Insulin resistance is an impairment on biological response to insulin due to the deterioration of the signaling processing of this hormone leading to hyperglycemia and is a major cause of metabolic diseases commonly associated with obesity [1]. It has been proposed that in central obesity, white adipose tissue is infiltrated with activated macrophages (M1) [2,3], and correlate with secreting monocyte chemoattractant protein-1 (MCP-1), tumor necrosis factor α (TNFα), interleukin-1β (IL-1β), interleukin 6 (IL-6), and interleukin 1α (IL-1α) [4,5,6]. Additionally, obesity leads to elevated levels of circulating free fatty acids (FFA) which contributes to reactive oxygen species (ROS) production, exacerbating the adverse effects of metabolic stress associated with obesity [7,8]. The decreases antioxidant defenses coupled with increased ROS levels lead to oxidative stress on macromolecules including lipids, proteins, and nuclei acids [9,10,11,12,13].
The proinflammatory cytokines activate stress-responsive kinases like c-Jun N-terminal kinase (JNK/SAPK) [14,15]. This activation results in serine phosphorylation surpassing tyrosine phosphorylation of the insulin receptor (IR), hindering insulin receptor substrate (IRS) binding [15,16,17]. Serine phosphorylation at 307 site of IRS-1 further impedes phosphoinositide 3-kinase (PI3K) and AKT/PDK activation, ultimately leading to insulin resistance [18,19,20]. Peripherally, in muscle, insulin resistance disrupts glucose entry for energy homeostasis and energy storage [19,20]. In adipose tissue, it hampers glycerol-3-phosphate formation, long-chain fatty acid uptake, triglyceride absorption, lipid esterification, and storage [21].
Recent studies have established the role of insulin in the brain and it had been shown that insulin enhance N-methyl-D-aspartate (NMDA) and α-amino-3-hydroxy-5-methyl-4-isoxazolepropionic acid (AMPA) receptor activity in rat hippocampal neurons [22,23,24], promote synaptic plasticity [25], regulate body temperature via the preoptic area (POA) [26], and modulate appetite [27]. Therefore, insulin resistance in the brain (BIR) might affects cognitive function, neurotransmission, thermogenesis, appetite, and body weight, underscoring the need to study these processes, and recently it has been proposed that in neurodegenerative diseases such as Alzheimer disease, insulin resistance could play a role in the development of dementia [28,29,30].
Numerous studies indicate that high-fat diets (HFD) intake induces body weight gain and subsequently obesity [31,32,33], for example, Maciejczyk and collaborators (2018) have shown elevated plasma and cerebral cortex levels of malondialdehyde (MDA) —a marker of lipid oxidative damage—alongside increased glutathione peroxidase (GSH-Px), catalase (CAT), and superoxide dismutase (SOD) activity are established after 8 weeks in animals fed with HFD [34]. Bodur and collaborators (2019), in mice fed with HFD for 16 weeks, have shown oxidative damage in lipids subsequent to increased oxidative damage in epididymal adipose tissue [35]. Moreover, Alcalá and collaborators (2017) it has been shown that HFD intake for 20 weeks induces increase in the ROS together with CAT and SOD activities resulting in a protective effect in the brown adipose tissue [36].
In the other hand, studies using high carbohydrate diet (low fat diet, LFD) in male Wistar rats fed for 3 weeks show increase in lipid peroxidation and decrease of SOD and glutathione reductase (GSR) activity in hippocampus [37], and when the LFD intake is extended for 8 weeks it induces a decrease of antioxidant enzymes such as GSH-Px and SOD-1, and an increase of prooxidant enzymes such as xanthine oxidase and NADPH oxidase in the hypothalamus of rats fed with fructose [38]. LFD intake for 12 weeks induces hyperglycemia, hyperinsulinemia as well as ROS and MDA production in the liver of rats Sprague-Dawley [39]; and finally, in C57BL/6 mice fed for 16 weeks, reveals a decreased of MDA levels in subcutaneous white adipose tissue [35].
These findings underscore that insulin resistance could be link to oxidative damage which, in turn, could target peripheral and central tissues subsequent to HFD or LFD feeding, although the duration of exposure.
Therefore, this study aimed to ascertain whether HFD or LFD induces PIR before BIR, and whether the timing of these alterations correlates with heightened systemic oxidative damage markers in various adipose tissues and the cerebral cortex. Furthermore, it is uncertain whether short-term consumption of HFD or LFD, as well as the presence of oxidative stress, are factors that predispose the onset of PIR or BIR in C57BL/6 mice.
2. Materials and Methods
2.1. Animals and Group Assignment
Male C57BL/6 mice aged 12 weeks of age (20 – 25 g of weight) were obtained from the vivarium of the Faculty of Chemical-Biological Sciences of the Autonomous University of Guerrero. Mice were individually housed under standard conditions of constant room temperature (26 ± 1 °C), and 12:12 light/dark cycle (lights on at 8 a.m, light onset = Zeitgeber Time 0, ZT0). They had ad libitum access to food and water.
The mice were randomly assigned to different experimental groups, and were fed according to the following categories:
(1) Standard diet (C) (LabDiet 5001, St. Louis, MO, USA): Providing 29% kcal from protein, 13% kcal from fat, 58% kcal from carbohydrate, and a calorie density of 2.89 kcal/g.
(2) Low-fat diet (LFD or high-carbohydrate diet) (Research Diets, Inc., Cat. num. D12450J, New Brunswick, NJ, USA): Providing 20% kcal from protein, 10% kcal from fat, 70% kcal from carbohydrates, and a calorie density of 3.82 kcal/g.
(3) High-fat diet (HFD) (Research Diets, Inc., Cat. num D12492, New Brunswick, NJ, USA): Providing 20% kcal from protein, 60% kcal from fat, 20% kcal from carbohydrates, and a calorie density of 5.21 kcal/g (supplementary material, table 1).
The groups were assigned based on the duration of diet exposure:
Group 1 (C1, LFD1, HFD1): Mice fed for one month.
Group 2 (C2, LFD2, HFD2): Mice fed for two months.
Group 3 (C3, LFD3, HFD3): Mice fed for three months.
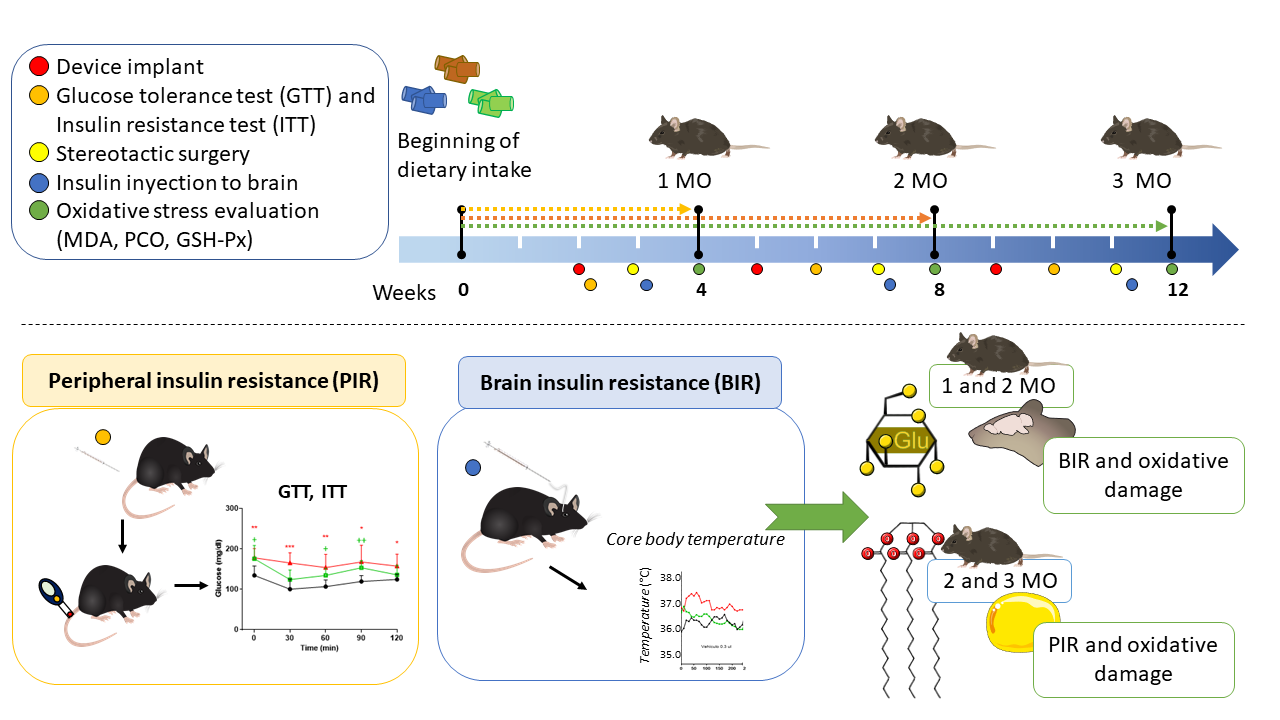
Body weight was measured weekly (n= 5-8). Mice in the HFD group with a body weight difference >10 g compared to the control group were classified as obese. The summary of experimental design and the moment of the interventions are shown in Figure 1.
2.2. Evaluation of the Peripheral Insulin Resistance
To determine the timing of the PIR, glucose tolerance test (GTT) and insulin tolerance test (ITT) were conducted at 2 (C1, LFD1 and HFD1), 6 (C2, LFD2 and HFD2) and 10 (C3, LFD3 and HCD3) weeks of feeding diet. These tests evaluated insulin sensitivity and the ability to lower fasting blood glucose levels.
Animals were fasted for 6 hours prior to blood glucose measurements (at ZT6), which were performed using the OneTouch® UltraTM diagnostic kit according to the manufacturer's instructions. During the GTT, glucose (2 g/kg body weight, Sigma-Aldrich, St. Louis, MO, USA) was administered orally. For the ITT, animals received an intraperitoneal injection of human recombinant insulin (0.5 IU/kg body weight, Eli Lilly, Humulin R, Mexico). Blood glucose concentrations were monitored at 30, 60, 90 and 120 min post-administration of glucose or insulin.
2.3. Evaluation of Brain Insulin Resistance
Telemetry studies were performed to determine BIR and to monitor changes in body temperature following insulin injections into the POA. For the telemetry studies, peritoneal implant of SubCue Mini dataloggers (Canadian Analytical Technologies, Inc., Alberta, Canada, sensitivity of 0.01°C) were performed under anesthesia with sodium pentobarbital (SP, 30 g/kg body weight. SP, PiSA Agropecuaria, Hgo, Mex,), This surgical procedure, involving laparotomy was carried out at 2 (C1, LFD1 and HFD1), 5 (C2, LFD2 and HFD2), and 9 (C3, LFD3 and HFD3) weeks after diet initiation. The dataloggers were programmed using SubCue Analyzer software to record core body temperature every 10 min for 15 days. Post-surgery, the mice were individually housed in standard Plexiglas boxes.
To administer insulin directly into the POA, mice underwent stereotaxic surgery. Anesthesia was induced with SP, and the mice were secured in a stereotaxic frame (Model 902 Dual Small Animal Stereotaxic Instrument, David Kopf Instruments, Tujunga, CA, USA). A guide cannula (26 G, 10 mm length) was implanted in the mouse skull at coordinates anterior-posterior from bregma +0.34 mm, lateral = midline, ventral = 4.4 mm. This surgical procedure, was carried out at 3 (C1, LFD1 and HFD1), 7 (C2, LFD2 and HFD2), and 11 (C3, LFD3 and HFD3) weeks after diet initiation. Two days post-surgery, insulin injections were performed into the POA using a microsyringe (5 μl, Hamilton Company, Reno, Nevada, USA) connected to the implanted cannula and plastic tubing. Recombinant human insulin (0.015, 0.03, and 0.06 IU) or vehicle (artificial cerebrospinal fluid, ACSF, prepared according to Alzet® guidelines) were injected randomly on different days starting at 2 p.m (ZT6). The injections were administered over 1 min to allow for hormone diffusion.
2.4. Sacrifice and Tissue Sampling
The animals were euthanized at the end of each experimental period (4, 8, and 12 weeks) to collect blood and tissues for assessing oxidative damage. Before sacrifice, the mice were anesthetized with SP. Blood was collected via cardiac puncture (approximately 700 to 1,000 μL), transferred to microtubes containing EDTA, and then centrifuged at 3,500 rpm for 10 min at 4 °C to obtain plasma. Tissues were dissected anatomically, including the cerebral cortex and approximately 30 mg each of subscapular brown adipose tissue and visceral white adipose tissue. These tissues were placed in individual tubes containing 450 μL of cold PBS. Subsequently, the tissues were homogenized. The homogenates were then centrifuged at 3,500 rpm for 10 min at 4 °C to obtain the supernatant for analysis of oxidative damage markers.
2.5. Glutathione Peroxidase (GSH-Px) Activity
For the determination of GSH-Px activity, the samples were incubated in a redox solution (50 mM PBS, pH 7.0, 1 mM EDTA, 1 mM sodium azide, 0.2 mM NADPH, 1 U/ml glutathione reductase and 1 mM reduced glutathione) and incubated at 37 ºC for 5 min. The reaction was started by adding 0.25 mM H2O2. The absorbance reading was carried out at a wavelength of 340 nm for 3 min in 1 min intervals in the NanoDrop at 37 °C. The millimolar absorption coefficient of NADPH at 340 nm (6.22 x 10⁶) was used to quantify the enzymatic activity of GSH-Px.
2.6. Malondialdehyde (MDA) Concentration
MDA quantified lipid peroxidation. Colorimetric determinations of MDA were performed with 1-methyl-2-phenylindole (MPI, Sigma-Aldrich) in an HCl-based assay, and values were calculated from a standard curve using 1,1,3,3 tetramethoxypropane (Sigma-Aldrich).
Determination of MDA levels was performed by adding 50 μl of sample, 50 μl of H2O, 325 μl of 10 mM MPI, and 100 μL of 37 % hydrochloric acid in dark microtubes. The mixture was incubated at 45 °C for 40 min. The MPI for the control tube was replaced by HCl at 20 mM. Subsequently, samples were centrifuged at 7,000 rpm for 10 min, the supernatant was obtained, and the absorbance was read at 586 nm. Data were reported in μM and were adjusted per mg of protein.
2.7. Determination of Protein Carbonyl Group (PCO)
The content of PCO evaluated damage to proteins in plasma and cerebral cortex through the derivatization of 2,4-dinitrophenylhydrazine (DNPH, Sigma-Aldrich). 50 μL of sample and 10 mM DNPH were placed, and the mixture was incubated in the dark at room temperature for 1 h. Subsequently, the proteins were precipitated with 5% and 2.5% trichloroacetic acid (w/v) and centrifuged at 3,500 rpm for 10 min. The pellets were washed with ethanol/ethyl acetate (1:1; volume/volume) and were resuspended in 500 μL of guanine hydrochloride (6 M) at 37°C for 10 min. The level of PCO was quantified by spectrophotometry at 370 nm using an extinction coefficient of 22,000 M−1cm−1. The results were reported as nM of osazones and adjusted by mg of protein.
PCO in adipose tissue was determined with the simplified alkaline DNPH derivatization methodology [40], and the modifications of Lo and collaborators [41]. 100 μL of sample and 100 μL of 10 mM DNPH were placed in glass test tubes, and the mixture was incubated for 10 min at room temperature. Subsequently, 50 μL of 1 M NaOH was added and incubated for 10 min at room temperature. Finally, absorbance readings were taken at 450 nm. The results were obtained through the molar extinction coefficient of DNPH under alkaline conditions of 22.308 M−1cm−1 and were reported as nM of osazones and adjusted per mg of proteins.
2.8. Statistical Analysis
The data were expressed as mean and standard error. Variations between groups were evaluated by two-way analysis of variance (ANOVA) and followed by a student t-test for differences between individual experimental groups (C vs LFD and C vs HFD). The area under curve (AUC) and statistical analysis were performed in the GraphPad Prism (v 8) software. A value of p < 0.05 was considered statistically significant.
3. Results
3.1. Obesity Induction by HFD
HFD and LFD were used to create models of obesity and insulin resistance in C57BL/6 mice. Due to laparotomy and stereotactic surgery performed at different times (indicated by arrows in the graphs for each group) the mice did not gain weight immediately following the laparotomy.
After 1 month of consumption of the diets, no significant changes in the body weight were observed (Figure 2A) among the groups (HFD1, LFD1, and C1). In the animals fed for 2 months with the diets, it is observed that HFD2 mice had a significant weight increase of 7.6 g (32.4 g ± 2.0 g, p = 0.0037) compared to C2 mice (24.8 g ± 0.5 g) (Figure 2B). Finally, when the animals consumed the diets for 3 months, we observed that the HFD3 mice showed a significant increase in body weight of 12.7 g (38.6 g ± 2.3 g, p = 0.0004) compared to C3 mice (25.9 g ± 1.1 g) (Figure 2C). Growth rate is clearer at the end of the experimental period at 2 and 3 months.
3.2. HFD Causes Glucose Intolerance in C57BL/6 Mice Starting from the First Month of this Diet
The GTT was conducted and the AUC was calculated to assess changes in glucose tolerance in mice as a potential factor for developing PIR. Blood glucose level were measured at 0, 30, 60, 90, and 120 min after oral glucose administration, in groups of animals that had been fed different diets for 1 month (Figure 3A), 2 months (Figure 3B), and 3 months (Figure 3C). The AUC of GTT was present in the figure 3D.
In the first month of diet exposure, the fasting glucose level of HFD1 group (198 ± 48.0 mg/dl) as well as the AUC (AUC = 27, 636 ± 2,314, p < 0.001) was higher than C1 (140.6 ± 20.7 mg/dl; AUC = 21.309 ± 1.599) (Figure 3A–D). In the second month of diet exposure, the fasting glucose level of HFD2 mice (187.8 ± 45.3 mg/dl) and AUC (AUC= 26,415 ± 1,958, p < 0.001), as well as the fasting glucose level of LFD2 mice (188.5 ± 34.9 mg/dl) and AUC (AUC= 24,925 ± 1,880, p = 0.0025) compared to C2 (147.8 ± 27.6 mg/dl) (Figure 3B–D). In the third month, the fasting glucose level of HFD3 mice (194.0 ± 31.3 mg/dl) and the AUC (AUC = 25,654 ± 1,944, p < 0.001) was higher than C3 mice (140.0 ± 24.4 mg/dl, AUC= 21,448 ± 1,156) (Figure 3C–D).
Thirty minutes after glucose administration, the glucose levels of the increased to 279.2 ± 69.7 mg/dl, 259.2 ± 54.6 mg/dl, 289.4 ± 68.4 mg/dl for HFD1, HFD2 and HFD3 respectively. Although the levels decreased over the next 60 minutes, they remained above approximately 200 mg/dl. The data indicated the presence of glucose intolerance in these groups compared to the C group (Figure 3A–C).
Regarding the GTT of LFD mice, it was higher only in the LFD2 (AUC = 24.925 ± 1.880, p = 0.0025) compared to the C2 control group (AUC = 21.355 ± 1.592) (Figure 3D).
3.3. Peripheral Insulin Resistance is Established in C57BL/6 Mice fed HFD up to the Third Month of Administration
To determine if the animals develop insulin insensitivity as an indicator of PIR, blood glucose levels were evaluated after insulin administration (0.5 IU/kg) for 2 h with subsequent glucose measurements at 0, 30, 60, 90, and 120 min in groups of animals that had been fed different diets for 1 month (Figure 3E), 2 months (Figure 3F), and 3 months (Figure 3G). The AUC of ITT was present in the figure 3H.
Animals fed HFD responded to the action of insulin during the first (HFD1, T0 min= 205.6 ± 45.7 mg/dl, T30 min = 149.6 ± 52.5 mg/dl) and second month (HFD2, T0 min= 182.8 ± 35.5 mg/dl, T30 min = 82.6 ± 43.2 mg/dl) by decreasing glucose levels after insulin injection, as to respective control (C1, T0 min= 155.6 ± 46.1 mg/dl, T30 min = 99.6 ± 36.1 mg/dl; C2, T0 min= 149.0 ± 19.6 mg/dl, T30 min = 87.0 ± 28.6) (Figure 3E-3F).
However, in the HFD3 group, the animals did not show a decrease in glucose level after insulin injection by maintaining linearly levels of 180 mg/dl during the 2 h of the test and its AUC of ITT was higher (AUC=19,614 ± 1,365, p < 0.001), compared to C3 (T0 min= 134.3 ± 23.3 mg/dl, T30 min = 100.3 ± 24.7 mg/dl, AUC= 13,670 ± 808) (Figure 3G,H), confirming insulin insensitivity in this experimental group.
With respect to LFD mice, they showed similar changes in the glucose levels by the action of insulin with their respective controls (Figure 3E,F). Despite this, the AUC of ITT was higher in LFD1 (AUC=15,110 ± 1,427, p < 0.001) and LFD3 (AUC=17,014 ± 944, p < 0.001) mice compared to C1 (AUC=12,438 ± 1,711) and C3 (AUC= 13,670 ± 808) (Figure 3H).
3.4. LFD Diet Promotes BIR in the First Two Months of Exposure
To determine the presence of BIR, insulin (0.015, 0.03, and 0.06 IU) were administered in the POA after stereotaxic surgery, and the change in body temperature was detected using the datalogger device previously implanted by abdominal surgery. Temperature was detected for 4 h after insulin administration in the experimental groups. In the mice administrated with ACFS and fed with diets (C, HFD and LFD), they there is not significant changes (Figure 4A,E,I).
In the first month (Figure 4B-4D), the temperature at time zero of C1 mice was 35.82 ± 0.37 °C, for LFD1 it was 36.02 ± 0.17 °C and for HFD1 36.45 ± 0.13 °C. At 30 minutes of the injection of 0.015 IU insulin in the POA, the temperature was higher in HFD1 mice (36.95 ± 0.01, p = 0.0108) compared to C1 mice (36.52 ± 0.13 °C), while in LFD1 mice the temperature was 36.57 ± 0.25 °C (p = 0.9798). However, at 170 min after administration, the temperature of LFD1 mice (35.57 ± 0.2 °C, p= 0.0424) was lower compared to C1 mice (36.46 ± 0.3 °C) and HFD1 group (36.37 ± 0.19 °C).
Interestingly, the hyperthermic effects of insulin were also not observed in the LFD2 animals (Figure 4E–H) which maintained a temperature at 36.48 ± 0.2 °C (30 min) and 36.43 ± 0.3 °C (120 min) after the 0.015 IU of insulin injection. When comparing the temperature values at 170 min with groups C2 (36.88 ± 0.3 °C) and HFD2 (36.6 ± 0.2 °C), we observed that the LFD2 mice (36.05 ± 0.2 °C) present lower temperature (p = 0.0208) (Figure 4F).
At 3-months do not shown significant differences between groups (C3, LFD3, HFD3) (Figure 4I–L). These observations suggest that the alteration in the thermogenic capacity of insulin observed in the LFD1 and LFD2 groups was reversed.
Based on the real temperature values, it is demonstrated that the LFD does not maintain the increase in temperature in the mice when 0.015 IU of insulin were administered, which may indicate early signs of insulin resistance in the brain.
3.5. Oxidative Damage of Lipids, Proteins, and Enzymatic Activity in Plasma
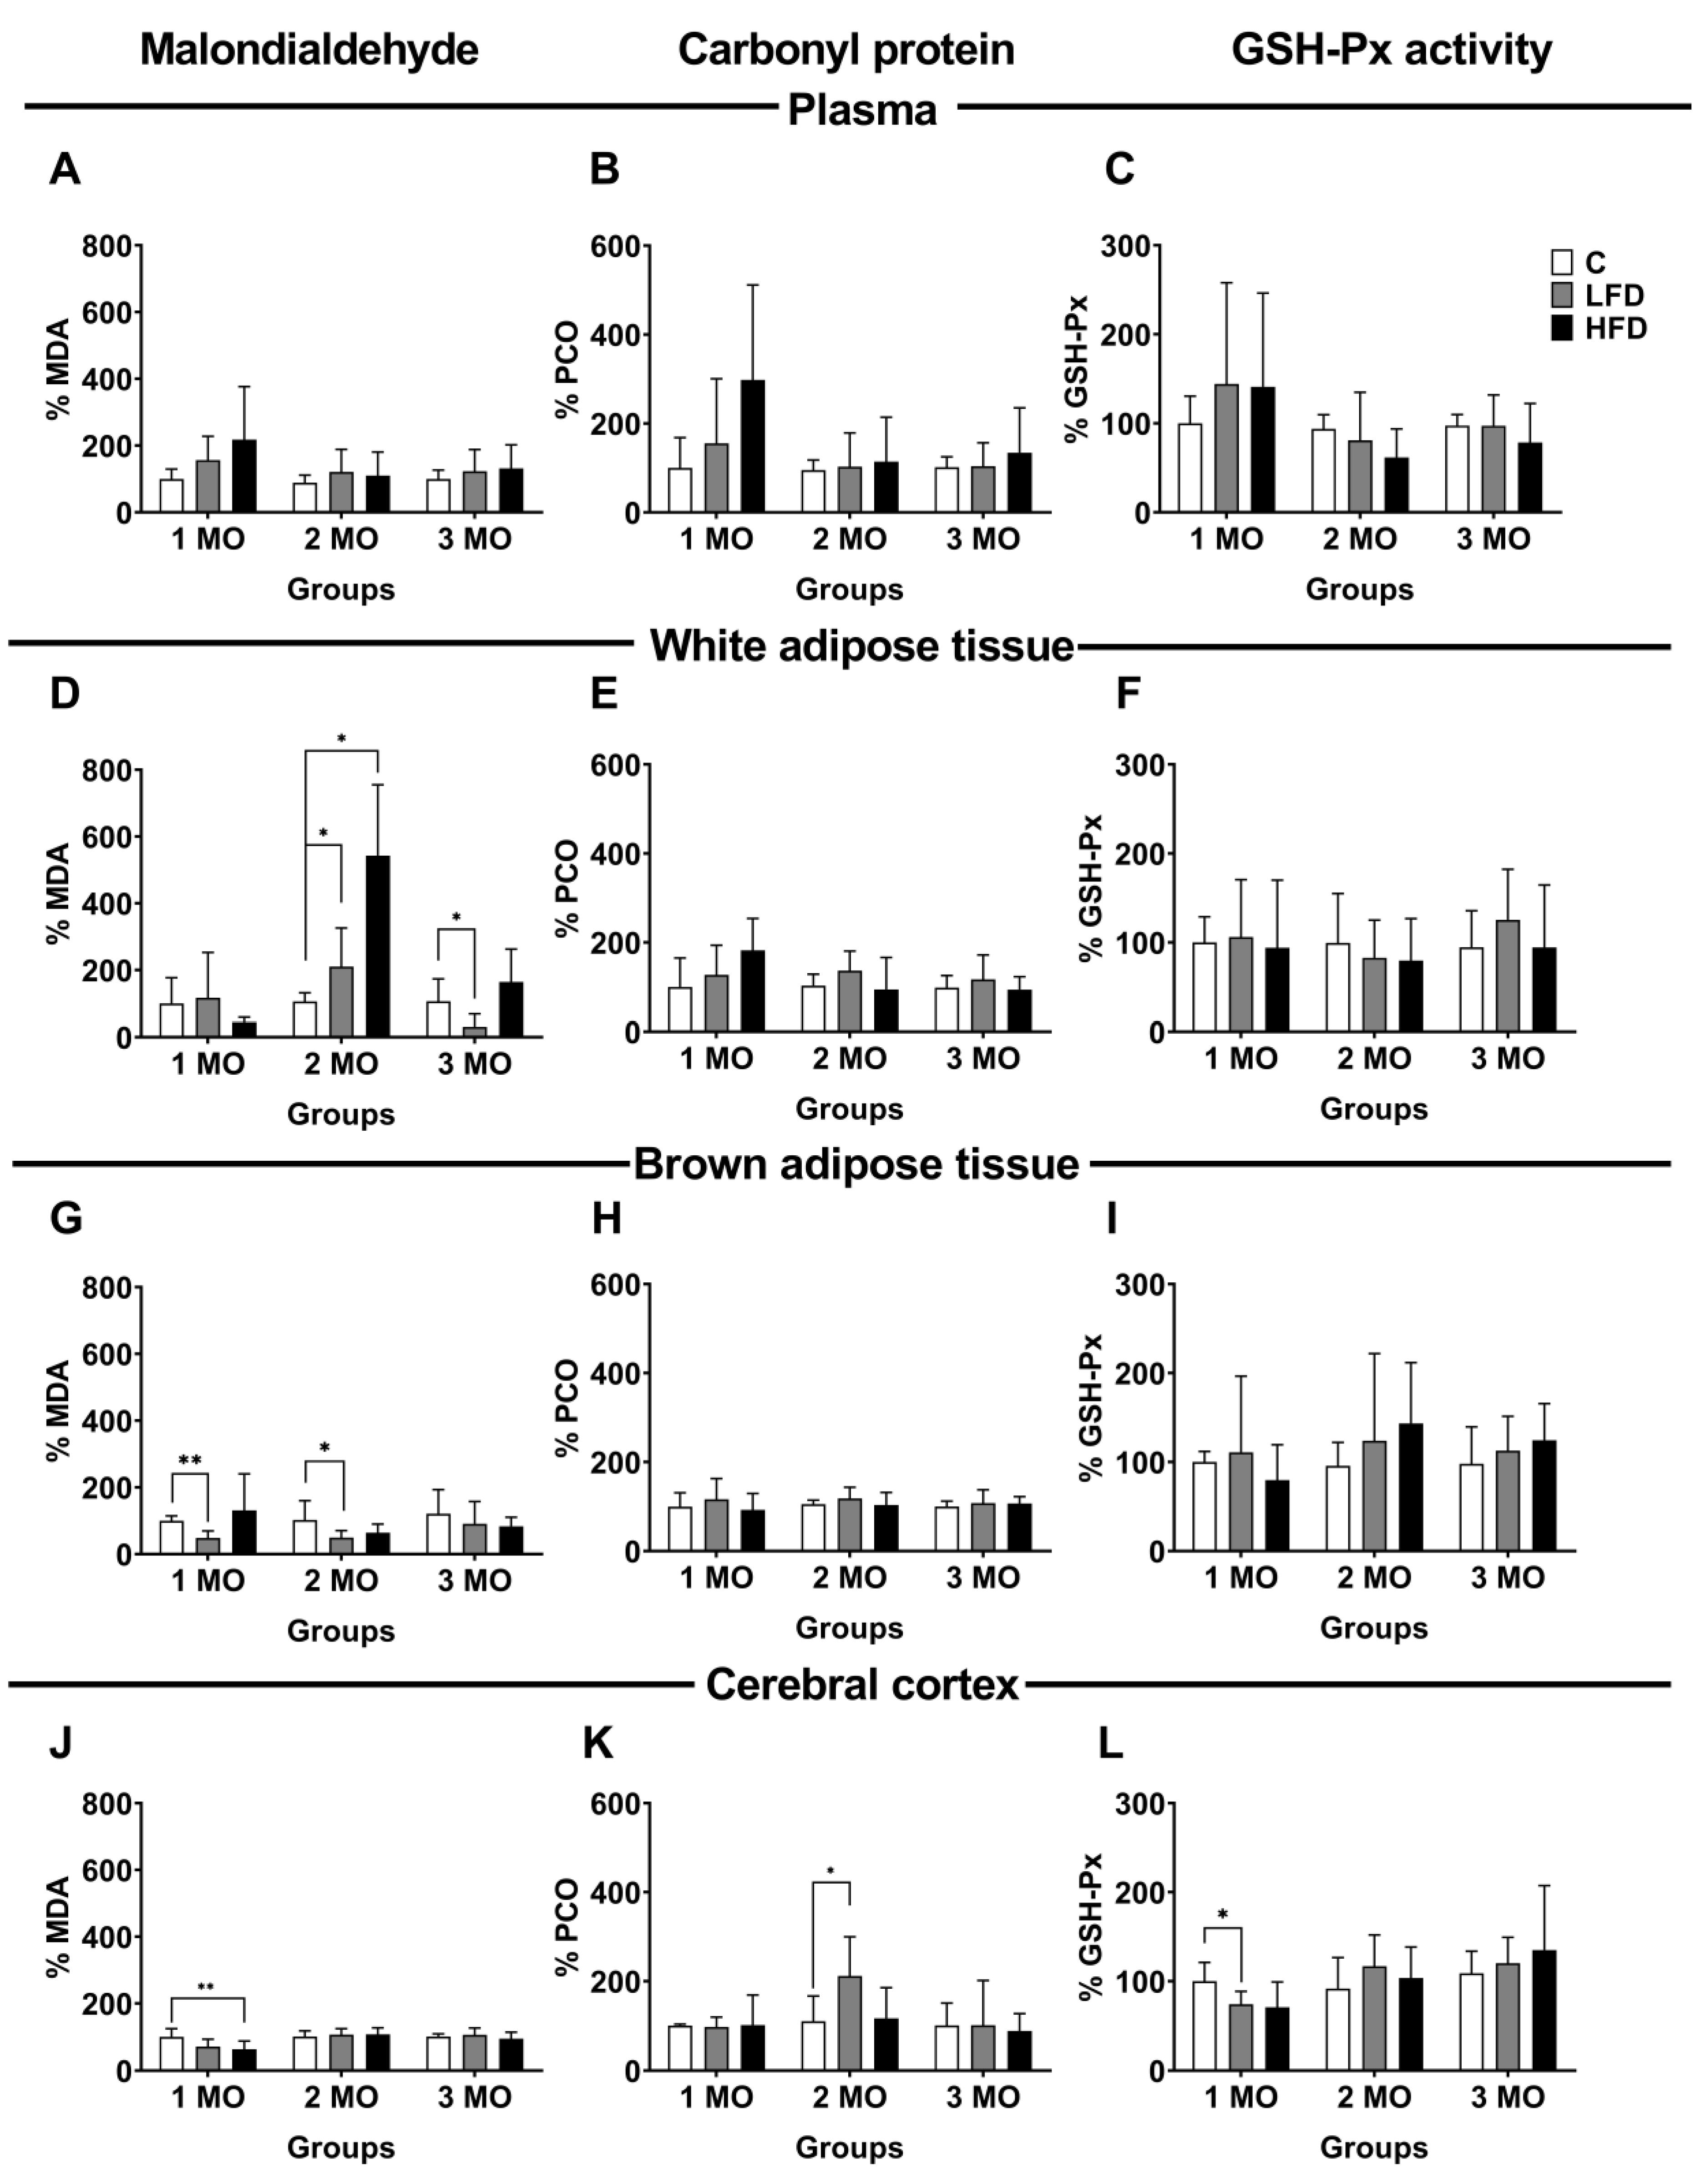
To evaluate oxidative damage in bloodstream and different tissues, we used samples of plasma, white adipose tissue (visceral), brown adipose tissue, and cerebral cortex. As markers of oxidative damage, we evaluated MDA as a marker of lipid peroxidation, PCO as a product of protein oxidation, and GSH-Px activity as an indicator of the antioxidant system. Our results are expressed as a percentage (%), considering the mice fed standard diet as the reference group (control group, C). In the plasma, the MDA, and PCO levels, as well as the GSH-Px activity showed no significant changes in any of the study groups (Figure 5A–C).
3.6. Oxidative Damage of Lipids and Proteins and Enzymatic Activity in White Adipose Tissue
In white adipose tissue, the level of MDA was variable according to the type of diet and duration of consumption. After 1 month of feeding with different diets, MDA levels showed no significant changes in LFD1 and HFD1 mice compared to C1 mice. However, after 2 months of diet, MDA levels increased 104 ± 47.3 % (p = 0.0434) in the LFD2 mice and 437 ± 94.9 % (p = 0.0056) in the HFD 2 mice, compared with C2 mice (106.2 ± 10.5 %). Conversely, after 3 months of diet, MDA levels decreased 75 ± 15.4 % (p = 0.0375) in LFD3 mice compared to C3 mice (106.7 ± 27.3 %) (Figure 5D).
Regarding PCO levels and GSH-Px, they show no significant changes in any of the study groups (Figure 5E,F).
3.7. Oxidative Lipid and Protein Damage and Enzymatic Activity in Brown Adipose Tissue
In brown adipose tissue, the level of MDA significantly decreased 52 ± 8.6 % (p = 0.0006) in LFD1 and 50 ± 7.8 % (p = 0.0431) in LFD2 mice, compared to their respective control groups (C1;100.0 ± 5.9 %; C2, 102.6 ± 23.5 %). Likewise, MDA level in HFD mice showed no significant changes (Figure 5G).
The PCO level and the enzymatic activity of GSH-Px showed no significative changes in any group of studies (Figure 5H,I).
3.8. Oxidative Damage of Lipids and Proteins and Enzymatic Activity in the Cerebral Cortex
In the cerebral cortex, the level of MDA was significantly decreased 36 ± 9.5% (p = 0.0275) in HFD1 mice, compared to C1 mice (100 ± 10.1%). However, in the groups fed for 2 and 3 months with different diets, there were no changes in the level of MDA (Figure 5J). Additionally, the PCO level only increased 102 ± 35.9% (p = 0.0383) in LFD2 mice compared to C2 mice (103.2 ± 10.5%) (Figure 5K).
Finally, GSH-Px activity decreased 79.2 ± 5.9% (p = 0.0329) in LFD1 mice, compared to C1 mice (100 ± 8.6%) (Figure 5L).
4. Discussion
In the present study, we investigated the effect of HFD, LFD and standard diet on the stablishment of periphral and/or central insulin resistance using a murine model of diet-induce obesity in C57BL/6 mice. We also examined the potential role of oxidative stress induced by the diets in the installment of BIR, PIR or both
As previosly reported, animals fed with HFD gained weight after a week of diet initiation, compared to control [31,32,33,42,43]. HFD fed mice reached significant weight difference of 12.7 g after 3 three months confirming the role of HDF in the development of obesity. In contrast, animals receiving LFD, showed only a slight weight increase after 3 months feeding. Thus, HFD consumption demonstrated greater efficiency in inducing obesity compared to LFD. It is also important to note that all HFD-fed mice (1, 2, and 3 months) became more passive to handling, had greasy hair appearance, and exhibited decreased physical activity, similar to what is reported [44,45].
In addition to this, GTT indicated the development of glucose intolerance in animals fed HFD for 1, 2 and 3 months, with consistently elevated glucose levels compared to controls (C mice). Specifically the HFD3 animals exhibited sustained hyperglycemia compared to the LFD3 and C3 groups, indicating disrupted glucose homeostasis, which correlates with their gradual weight gain. Additionally, glucose levels in HFD3 group remained elevated after insulin injection during the ITT, confirming the establishment of PIR.
This phenomenon during obesity development, in mice fed with HFD, may be attributed to increased availability of FFA, from hypertrophied adipocytes [5], as well as, elevates concentration of DAG and sphingolipids, such as ceramide. DAG is a molecule impairs insulin signaling through the activation of several isoforms of protein kinase C (PKC), leading to PIR through increased IRS-1 serine1101 phosphorylation and inhibition of insulinstimulated IRS-1 tyrosine phosphorylation and Akt2 phosphorylation. While ceramide, interferes with the insulin signaling pathway by inhibiting insulin-induced phosphorylation of Akt/PKB and activation of protein phosphatase 2A, resulting in impaired insulin sensitivity in skeletal muscle and liver. Ceramide also cause endoplasmic reticulum stress and mitochondrial dysfunction, which increases the concentration of ROS and thus the development of oxidative stress [5,46].
In addition, studies in mice show that increased FFA could activate Toll-like receptor 4 (TLR4), triggering the expression of nuclear factor kappa B (NF-κB) and proinflammatory cytokines (e.g., IL-1β, IL-6, and TNF-α). This activation upregulates NADPH oxidase activity, promoting the production of ROS [47,48,49]. ROS increase early on may lead to oxidative damage and elevated MDA and PCO levels. Moreover, ROS - induced phosphorylation of IR and IRS on serine residues may attenuate insulin signaling, hindering GLUT4 translocation to the cell membrane and thus impairing glucose uptake which would cause an increase in glucose in bloodstream and insulin resistance [27,50]. Additionally, FFA released, and oxidative stress from hypertrophic adipose tissue will inhibit the antilipophilic action of insulin [51,52]. Therefore, the intake of HFD is related to glucose intolerance and PIR.
Conversely, LFD intake was associated with BIR, due mice fed with LFD for one and two months did not present hyperthermia in response to hypothalamic insulin stimulation (0.015 of insulin). Insulin in the POA causes neurons in the dorsomedial nucleus to signal neurons in the raphe pallidus, which stimulates the sympathetic nervous system to release norepinephrine from postganglionic neurons, which acts on brown adipose tissue and triggers uncoupling protein-1 (UCP1) is activated to release thermal energy by taking advantage of the proton gradient in the inner mitochondrial membrane and increasing core body temperature [53,54]. Thus, BIR was evidenced by the inability of insulin to induce thermogenesis in LFD-fed animals [26]. This means that the body temperature of the mice was not increased after insulin injection.
The development of BIR is an understudied topic, compared to PIR. In relation to the time in which this alteration occurs, longitudinal studies in humans are limited and have mainly focused on people with obesity, Alzheimer's disease or symptoms of dementia. Therefore, the approach and its study is in people who already present a condition without knowing the moment in which the insulin resistance appears [29,30,55,56]. In murine models, it has been reported that the development of insulin resistance in the brain are variable, which will depend on the study model. For example, in models of metabolic alterations it occurs up to 8 weeks [34], while to Alzheimer's disease models, genetically susceptible animals, occurs from 24 weeks of HFD consumption [57]. Therefore, the time period in which the first evidence of BIR is not precisely known. In this study, we focused on the effect of the acute dietary exposure and the appearance of BIR or PIR, observing that from the first month there are already signs of BIR in LFD fed mice.
While PIR, has been more extensively studied, our research shows signs from the first month that continue for 3 months. It is worth mentioning that extending the time of exposure to the diets may accentuate PIR. This is because it has been documented that exposure to the HFD diet for 20 weeks causes an increase in body weight and fasting glucose and insulin levels, as well as an increase in the HOMA (homeostatic model assessment) IR index [58,59], with more pronounced alterations occurring at 22 weeks[44], and 36 weeks of exposure to the HFD diet [59]. For its part, the LFD diet does not have the same effect as HFD on body weight or serum insulin levels at 24 weeks. However, serum insulin and glucose levels are similar at 40 weeks of exposure to LFD compared with the HFD diet. Interestingly, they also report that mice exposed for 52 weeks to HFD or LFD do not exhibit PIR, there was regression of this metabolic abnormality [60].
The LFD consists of a high percentage of carbohydrates (70%) compared to the HFD (20%) and C (58%) diets. Carbohydrates promote hyperglicemia and thus insulin secretion by the β cells of the pancreas, causing hyperinsulinemia [61], which causes large amounts of insulin to be transported to the brain, causing desensitization of insulin receptors [62]. GLUT-3 is expressed in POA neurons, while GLUT-1 is mainly expressed in astrocytes. These transporters do not require insulin stimulation to facilitate glucose entry into the cell [63,64,65], which results in higher intracellular glucose concentrations, increased glycolysis, and elevated production of ROS during mitochondrial respiration, ultimately triggering oxidative stress [66,67].
In the present work, oxidative damage at the brain level was evidenced by PCO increased (LFD2 mice) and decreased GSH-Px (LFD1 mice). GSH-Px is an enzyme belonging to the endogenous antioxidant system responsible for catalyzing the replacement of glutathione disulfide using H2O2 [68]. The decrease in GSH-Px in the cerebral cortex shows a decrease in antioxidant defense, exclusively in mice that consumed LFD for 1 month. In addition, the decrease in MDA at the brain in HFD1 mice could indicate an early compensatory antioxidant response, but other factors may be involved in the long term. It has been described that the cortex is susceptible to stress and oxidative damage due to the low activity of the antioxidant system, the high concentration of pro-oxidant metal ions, and the high oxygen demand (20% of body oxygen).[34,69]. Additionally, the brain consumes more than 25% of circulating glucose. When glucose use increases, oxidative stress can be induced by the increase in the generation of advanced glycosylation end products (AGEs). It has been reported that high consumption of simple carbohydrates (>45%), such as glucose and fructose, favors the production of AGEs and ROS that react with nucleic acids, lipids and proteins. This leads to the development of insulin resistance [46,70].
Likewise, increased glucose use leads to increased oxygen requirements and, thus, the production of ROS [71]. Therefore, due to LFD consumption, oxidative stress damage is present during the establishment of BIR. Three months after consumption of LFD in the mice, we did not observe any alteration that evidenced the presence of oxidative stress. Coincidentally, the animals did not present BIR either since they again responded to the insulin stimulus in the POA upon detecting hyperthermia in these mice.
This may be due to a state of neuronal preconditioning, which favors the reestablishment of neuronal functions; in this case, the sensitivity of the IR and, thus, its multiple functions in the brain. In this context, it has been described that a high amount of glucose in neurons causes oxidative stress due to glucose oxidation and cellular respiration [71]. However, the establishment of oxidative stress favors neuronal preconditioning since when the production of free radicals is blocked, the neuroprotective effect of neuronal preconditioning significantly decreases, and cell death increases [72].
The group of animals with LFD did not develop obesity or PIR during the 3 months of diet, nor did we observe elevated blood glucose levels in the tolerance curves. This can be explained by the fact that peripheral organs use different GLUTs to internalize glucose into the cell. Peripheral organs such as liver, muscle and adipose tissue use GLUT-4, which is contained in vesicles inside the cell and needs the stimulation of insulin to translocate to the membrane and allow glucose to pass into the cell [63,73], and will in some cases prevent the production of ROS [19,61]. The fact that we did not observe PIR during 3 months of diet does not rule out the possibility that it may occur during prolonged periods of LFD diet.
In this study, white adipose tissue from the visceral region and brown adipose tissue from the scapular area were analyzed. White adipose tissue plays a fundamental role in obesity. Obesity is a disease characterized by weight gain due to fat accumulation in white adipose tissue. This tissue can accumulate in different body regions, and its location or distribution gives it differences that relate it to the development of obesity [2]. In particular, white adipose tissue that accumulates in the visceral area is associated with comorbidities and metabolic alterations in this pathology [8].
HFD2 and LFD2 mice, showed higher levels of MDA in the visceral white adipose tissue compared to C2 mice, without changes in GSH-Px activity, which indicates the establishment of oxidative stress in visceral white adipose tissue. Our results coincide with those reported by Alcalá and collaborators (2017), who found an increase in the level of ROS without significant differences in GSH-Px activity in the visceral white adipose tissue of mice fed with HFD for five months [36].
Regarding oxidative damage in brown adipose tissue, the results show decreased MDA levels in mice fed LFD1 and LFD2, compared to control mice, with no changes in GSH-Px. This suggests that oxidative damage might not occur, because this tissue has adipocytes with a greater number of mitochondria compared to white adipose tissue [74]. UCP1 is expressed in these mitochondria, a membrane protein that carries out the exchange of electrons for heat generation and reduces oxidative stress generation in this tissue. Additionally, brown adipose tissue may exhibit resistance to oxidative stress and damage even under HFD and LFD diets, due to the activity of the enzymes of the antioxidant system [75]. It has been reported that, in brown adipose tissue from mice fed for 20 weeks with HFD, there is a lower concentration of indicators of lipid damage, a higher concentration of ROS, and a higher enzymatic activity of CAT and SOD [36].
In this study, we observed that oxidative stress markers and GSH-Px activity are negatively altered in the first and in the second month, specifically in white adipose tissue and cerebral cortex, respectively, and normalized after the third month of LFD or HFD intake, which coincides with the time at which BIR occurred.
The above may be due to excessive intake of carbohidrates or fat, which leads to an increase in the production of ROS in cells. This triggers an adaptive response that promote the production and action of antioxidant enzymes as part of a long-term adaptation process, inducing protective mechanisms. This phenomenon is known as hormesis, where cells adapt to adverse conditions. [68,76,77].
In summary, oxidative stress is common in PIR and BIR. PIR was observed in mice fed with HFD, while early signs of BIR were observed in mice fed with LFD.
Supplementary Materials
The following supporting information can be downloaded at the website of this paper posted on Preprints.org., Table S1: Details of the contents of diets.
Author Contributions
M.E.R. and M.S.A. conceived and designed the experiments. E.S.H., O.E.B.C., M.I.B.B., and J.M.M.B. performed the experiments. E.S.H., O.E.B.C. and J.M.M.B. performed data analysis. M.E.R and M.S.A. wrote the manuscript. All authors reviewed and accepted the submitted version.
Institutional Review Board Statement
The animal study protocol was approved (September 24, 2021) by the Institutional Animal Care and Use Committee of the Autonomous University of Guerrero (CICUAL-04/2021).
Acknowledgments
The authors appreciate the financial support from Consejo Nacional de Humanidades, Ciencias y Tecnologías (CONACYT- 1560315 proyect). E.S.H. was funded by Becas Nacional (Tradicional) 2022 -1 (630184) and O.E.B.C. by CONAHCYT. E.S.H. and O.E.B.C. contributed equally to the preparation of this article.
Conflicts of Interest
The authors declare no conflicts of interest.
Abbreviations
| BIR | Brain insulin resistance |
| C | Control |
| CAT | Catalase |
| FFA | Free fatty acids |
| GLUT | Glucose transporter |
| GSH-Px | Glutathione peroxidase |
| GST | Glutathione S-transferase |
| GTT | Oral glucose tolerance test |
| HFD | High fat diet |
| IR | Insulin receptor |
| IRS | Insulin receptor substrate |
| ITT | Insulin tolerance test |
| LFD | Low fat diet |
| MDA | Malondialdehyde |
| MPI | 1-methyl-2-phenylindole |
| NADPH | Nicotinamide adenine dinucleotide phosphate |
| PBS | Phosphate buffer solution |
| PCO | Carbonylated proteins |
| PIR | Peripherical insulin resistance |
| POA | Preoptic area |
| ROS | Reactive oxygen species |
| SOD | Superoxide dismutase |
| SP | Sodium pentobarbital |
| UCP1 | Uncoupling protein-1 |
References
- Osborn, O.; Olefsky, J.M. The Cellular and Signaling Networks Linking the Immune System and Metabolism in Disease. Nat Med 2012, 18, 363–374. [Google Scholar] [CrossRef]
- Gil, A.; Olza, J.; Gil-Campos, M.; Gomez-Llorente, C.; Aguilera, C.M. Is Adipose Tissue Metabolically Different at Different Sites? Int J Pediatr Obes 2011, 6, 13–20. [Google Scholar] [CrossRef] [PubMed]
- Li, F.; Zhang, Z.; Bai, Y.; Che, Q.; Cao, H.; Guo, J.; Su, Z. Glucosamine Improves Non-Alcoholic Fatty Liver Disease Induced by High-Fat and High-Sugar Diet through Regulating Intestinal Barrier Function, Liver Inflammation, and Lipid Metabolism. Molecules 2023, 28, 6918. [Google Scholar] [CrossRef] [PubMed]
- Lagathu, C.; Yvan-Charvet, L.; Bastard, J.-P.; Maachi, M.; Quignard-Boulangé, A.; Capeau, J.; Caron, M. Long-Term Treatment with Interleukin-1β Induces Insulin Resistance in Murine and Human Adipocytes. Diabetologia 2006, 49, 2162–2173. [Google Scholar] [CrossRef] [PubMed]
- Elkanawati, R.; Sumiwi, S.; Levita, J. Impact of Lipids on Insulin Resistance: Insights from Human and Animal Studies. DDDT 2024, 18, 3337–3360. [Google Scholar] [CrossRef] [PubMed]
- Jung, S.-B.; Choi, M.J.; Ryu, D.; Yi, H.-S.; Lee, S.E.; Chang, J.Y.; Chung, H.K.; Kim, Y.K.; Kang, S.G.; Lee, J.H.; et al. Reduced Oxidative Capacity in Macrophages Results in Systemic Insulin Resistance. Nat Commun 2018, 9, 1551. [Google Scholar] [CrossRef]
- Hurrle, S.; Hsu, W.H. The Etiology of Oxidative Stress in Insulin Resistance. Biomedical Journal 2017, 40, 257–262. [Google Scholar] [CrossRef] [PubMed]
- de Mello, A.H.; Costa, A.B.; Engel, J.D.G.; Rezin, G.T. Mitochondrial Dysfunction in Obesity. Life Sciences 2018, 192, 26–32. [Google Scholar] [CrossRef] [PubMed]
- Ayala, A.; Muñoz, M.F.; Argüelles, S. Lipid Peroxidation: Production, Metabolism, and Signaling Mechanisms of Malondialdehyde and 4-Hydroxy-2-Nonenal. Oxidative Medicine and Cellular Longevity 2014, 2014, 1–31. [Google Scholar] [CrossRef]
- Frijhoff, J.; Winyard, P.G.; Zarkovic, N.; Davies, S.S.; Stocker, R.; Cheng, D.; Knight, A.R.; Taylor, E.L.; Oettrich, J.; Ruskovska, T.; et al. Clinical Relevance of Biomarkers of Oxidative Stress. Antioxidants & Redox Signaling 2015, 23, 1144–1170. [Google Scholar] [CrossRef]
- Gonos, E.S.; Kapetanou, M.; Sereikaite, J.; Bartosz, G.; Naparło, K.; Grzesik, M.; Sadowska-Bartosz, I. Origin and Pathophysiology of Protein Carbonylation, Nitration and Chlorination in Age-Related Brain Diseases and Aging. Aging 2018, 10, 868–901. [Google Scholar] [CrossRef]
- Hawkins, C.L.; Davies, M.J. Detection, Identification, and Quantification of Oxidative Protein Modifications. Journal of Biological Chemistry 2019, 294, 19683–19708. [Google Scholar] [CrossRef] [PubMed]
- Morales, M.; Munné-Bosch, S. Malondialdehyde: Facts and Artifacts. Plant Physiol. 2019, 180, 1246–1250. [Google Scholar] [CrossRef] [PubMed]
- Jomova, K.; Raptova, R.; Alomar, S.Y.; Alwasel, S.H.; Nepovimova, E.; Kuca, K.; Valko, M. Reactive Oxygen Species, Toxicity, Oxidative Stress, and Antioxidants: Chronic Diseases and Aging. Arch Toxicol 2023, 97, 2499–2574. [Google Scholar] [CrossRef]
- Lauterbach, M.A.R.; Wunderlich, F.T. Macrophage Function in Obesity-Induced Inflammation and Insulin Resistance. Pflugers Arch - Eur J Physiol 2017, 469, 385–396. [Google Scholar] [CrossRef]
- Kim, F.; Pham, M.; Luttrell, I.; Bannerman, D.D.; Tupper, J.; Thaler, J.; Hawn, T.R.; Raines, E.W.; Schwartz, M.W. Toll-Like Receptor-4 Mediates Vascular Inflammation and Insulin Resistance in Diet-Induced Obesity. Circulation Research 2007, 100, 1589–1596. [Google Scholar] [CrossRef]
- Onyango, A.N. Cellular Stresses and Stress Responses in the Pathogenesis of Insulin Resistance. Oxidative Medicine and Cellular Longevity 2018, 2018, 1–27. [Google Scholar] [CrossRef]
- Itani, S.I.; Ruderman, N.B.; Schmieder, F.; Boden, G. Lipid-Induced Insulin Resistance in Human Muscle Is Associated With Changes in Diacylglycerol, Protein Kinase C, and IκB-α. Diabetes 2002, 51, 2005–2011. [Google Scholar] [CrossRef] [PubMed]
- Petersen, M.C.; Shulman, G.I. Mechanisms of Insulin Action and Insulin Resistance. Physiological Reviews 2018, 98, 2133–2223. [Google Scholar] [CrossRef]
- Lee, B.-C.; Lee, J. Cellular and Molecular Players in Adipose Tissue Inflammation in the Development of Obesity-Induced Insulin Resistance. Biochimica et Biophysica Acta (BBA) - Molecular Basis of Disease 2014, 1842, 446–462. [Google Scholar] [CrossRef] [PubMed]
- Morigny, P.; Boucher, J.; Arner, P.; Langin, D. Lipid and Glucose Metabolism in White Adipocytes: Pathways, Dysfunction and Therapeutics. Nat Rev Endocrinol 2021, 17, 276–295. [Google Scholar] [CrossRef] [PubMed]
- Christie, J.M.; Wenthold, R.J.; Monaghan, D.T. Insulin Causes a Transient Tyrosine Phosphorylation of NR2A and NR2B NMDA Receptor Subunits in Rat Hippocampus. Journal of Neurochemistry 1999, 72, 1523–1528. [Google Scholar] [CrossRef] [PubMed]
- Skeberdis, V.A.; Lan, J.; Zheng, X.; Zukin, R.S.; Bennett, M.V.L. Insulin Promotes Rapid Delivery of N -Methyl- d - Aspartate Receptors to the Cell Surface by Exocytosis. Proc. Natl. Acad. Sci. U.S.A. 2001, 98, 3561–3566. [Google Scholar] [CrossRef]
- Huang, C.; Lee, C.; Hsu, K. An Investigation into Signal Transduction Mechanisms Involved in Insulin-induced Long-term Depression in the CA1 Region of the Hippocampus. Journal of Neurochemistry 2004, 89, 217–231. [Google Scholar] [CrossRef]
- Van Der Heide, L.P.; Kamal, A.; Artola, A.; Gispen, W.H.; Ramakers, G.M.J. Insulin Modulates Hippocampal Activity-dependent Synaptic Plasticity in a N -methyl- d -aspartate Receptor and Phosphatidyl-inositol-3-kinase-dependent Manner. Journal of Neurochemistry 2005, 94, 1158–1166. [Google Scholar] [CrossRef]
- Sanchez-Alavez, M.; Tabarean, I.V.; Osborn, O.; Mitsukawa, K.; Schaefer, J.; Dubins, J.; Holmberg, K.H.; Klein, I.; Klaus, J.; Gomez, L.F.; et al. Insulin Causes Hyperthermia by Direct Inhibition of Warm-Sensitive Neurons. Diabetes 2010, 59, 43–50. [Google Scholar] [CrossRef]
- Boucher, J.; Kleinridders, A.; Kahn, C.R. Insulin Receptor Signaling in Normal and Insulin-Resistant States. Cold Spring Harbor Perspectives in Biology 2014, 6, a009191–a009191. [Google Scholar] [CrossRef]
- Akhtar, A.; Sah, S.P. Insulin Signaling Pathway and Related Molecules: Role in Neurodegeneration and Alzheimer’s Disease. Neurochemistry International 2020, 135, 104707. [Google Scholar] [CrossRef] [PubMed]
- Arnold, S.E.; Arvanitakis, Z.; Macauley-Rambach, S.L.; Koenig, A.M.; Wang, H.-Y.; Ahima, R.S.; Craft, S.; Gandy, S.; Buettner, C.; Stoeckel, L.E.; et al. Brain Insulin Resistance in Type 2 Diabetes and Alzheimer Disease: Concepts and Conundrums. Nat Rev Neurol 2018, 14, 168–181. [Google Scholar] [CrossRef]
- Kellar, D.; Craft, S. Brain Insulin Resistance in Alzheimer’s Disease and Related Disorders: Mechanisms and Therapeutic Approaches. The Lancet Neurology 2020, 19, 758–766. [Google Scholar] [CrossRef]
- Matsuzawa-Nagata, N.; Takamura, T.; Ando, H.; Nakamura, S.; Kurita, S.; Misu, H.; Ota, T.; Yokoyama, M.; Honda, M.; Miyamoto, K.; et al. Increased Oxidative Stress Precedes the Onset of High-Fat Diet–Induced Insulin Resistance and Obesity. Metabolism 2008, 57, 1071–1077. [Google Scholar] [CrossRef] [PubMed]
- Pieri, B.L.D.S.; Rodrigues, M.S.; Farias, H.R.; Silveira, G.D.B.; Ribeiro, V.D.S.G.D.C.; Silveira, P.C.L.; De Souza, C.T. Role of Oxidative Stress on Insulin Resistance in Diet-Induced Obesity Mice. IJMS 2023, 24, 12088. [Google Scholar] [CrossRef]
- Carillon, J.; Romain, C.; Bardy, G.; Fouret, G.; Feillet-Coudray, C.; Gaillet, S.; Lacan, D.; Cristol, J.-P.; Rouanet, J.-M. Cafeteria Diet Induces Obesity and Insulin Resistance Associated with Oxidative Stress but Not with Inflammation: Improvement by Dietary Supplementation with a Melon Superoxide Dismutase. Free Radical Biology and Medicine 2013, 65, 254–261. [Google Scholar] [CrossRef]
- Maciejczyk, M.; Żebrowska, E.; Zalewska, A.; Chabowski, A. Redox Balance, Antioxidant Defense, and Oxidative Damage in the Hypothalamus and Cerebral Cortex of Rats with High Fat Diet-Induced Insulin Resistance. Oxidative Medicine and Cellular Longevity 2018, 2018, 1–11. [Google Scholar] [CrossRef]
- Bodur, A.; İnce, İ.; Kahraman, C.; Abidin, İ.; Aydin-Abidin, S.; Alver, A. Effect of a High Sucrose and High Fat Diet in BDNF (+/-) Mice on Oxidative Stress Markers in Adipose Tissues. Archives of Biochemistry and Biophysics 2019, 665, 46–56. [Google Scholar] [CrossRef]
- Alcalá, M.; Calderon-Dominguez, M.; Bustos, E.; Ramos, P.; Casals, N.; Serra, D.; Viana, M.; Herrero, L. Increased Inflammation, Oxidative Stress and Mitochondrial Respiration in Brown Adipose Tissue from Obese Mice. Sci Rep 2017, 7, 16082. [Google Scholar] [CrossRef] [PubMed]
- Mazzoli, A.; Spagnuolo, M.S.; Nazzaro, M.; Gatto, C.; Iossa, S.; Cigliano, L. Fructose Removal from the Diet Reverses Inflammation, Mitochondrial Dysfunction, and Oxidative Stress in Hippocampus. Antioxidants 2021, 10, 487. [Google Scholar] [CrossRef] [PubMed]
- Żebrowska, E.; Chabowski, A.; Zalewska, A.; Maciejczyk, M. High-Sugar Diet Disrupts Hypothalamic but Not Cerebral Cortex Redox Homeostasis. Nutrients 2020, 12, 3181. [Google Scholar] [CrossRef]
- Long, Z.; Zhang, X.; Sun, Q.; Liu, Y.; Liao, N.; Wu, H.; Wang, X.; Hai, C. Evolution of Metabolic Disorder in Rats Fed High Sucrose or High Fat Diet: Focus on Redox State and Mitochondrial Function. General and Comparative Endocrinology 2017, 242, 92–100. [Google Scholar] [CrossRef]
- Mesquita, C.S.; Oliveira, R.; Bento, F.; Geraldo, D.; Rodrigues, J.V.; Marcos, J.C. Simplified 2,4-Dinitrophenylhydrazine Spectrophotometric Assay for Quantification of Carbonyls in Oxidized Proteins. Analytical Biochemistry 2014, 458, 69–71. [Google Scholar] [CrossRef]
- Lo, A.T.C.; Francisqueti, F.V.; Hasimoto, F.K.; Ferraz, A.P.C.R.; Minatel, I.O.; Garcia, J.L.; Dos Santos, K.C.; Alves, P.H.R.; Lima, G.P.P.; Moreto, F.; et al. Brazilian Curcuma Longa L. Attenuates Comorbidities by Modulating Adipose Tissue Dysfunction in Obese Rats. Nutrire 2018, 43, 25. [Google Scholar] [CrossRef]
- Ji, T.; Fang, B.; Wu, F.; Liu, Y.; Cheng, L.; Li, Y.; Wang, R.; Zhu, L. Diet Change Improves Obesity and Lipid Deposition in High-Fat Diet-Induced Mice. Nutrients 2023, 15, 4978. [Google Scholar] [CrossRef] [PubMed]
- Małodobra-Mazur, M.; Cierzniak, A.; Pawełka, D.; Kaliszewski, K.; Rudnicki, J.; Dobosz, T. Metabolic Differences between Subcutaneous and Visceral Adipocytes Differentiated with an Excess of Saturated and Monounsaturated Fatty Acids. Genes 2020, 11, 1092. [Google Scholar] [CrossRef]
- Casimiro, I.; Stull, N.D.; Tersey, S.A.; Mirmira, R.G. Phenotypic Sexual Dimorphism in Response to Dietary Fat Manipulation in C57BL/6J Mice. Journal of Diabetes and its Complications 2021, 35, 107795. [Google Scholar] [CrossRef]
- Shetty, S.; Duesman, S.J.; Patel, S.; Huynh, P.; Toh, P.; Shroff, S.; Das, A.; Chowhan, D.; Keller, B.; Alvarez, J.; et al. Sex-Specific Role of High-Fat Diet and Stress on Behavior, Energy Metabolism, and the Ventromedial Hypothalamus. Biol Sex Differ 2024, 15, 55. [Google Scholar] [CrossRef] [PubMed]
- Wali, J.A.; Solon-Biet, S.M.; Freire, T.; Brandon, A.E. Macronutrient Determinants of Obesity, Insulin Resistance and Metabolic Health. Biology (Basel) 2021, 10, 336. [Google Scholar] [CrossRef]
- Tan, B.L.; Norhaizan, M.E. Effect of High-Fat Diets on Oxidative Stress, Cellular Inflammatory Response and Cognitive Function. Nutrients 2019, 11, 2579. [Google Scholar] [CrossRef]
- Polyzos, S.A.; Kountouras, J.; Mantzoros, C.S. Adipose Tissue, Obesity and Non-Alcoholic Fatty Liver Disease. Minerva Endocrinol 2017, 42. [Google Scholar] [CrossRef] [PubMed]
- Milić, S.; Lulić, D.; Štimac, D. Non-Alcoholic Fatty Liver Disease and Obesity: Biochemical, Metabolic and Clinical Presentations. World J Gastroenterol 2014, 20, 9330–9337. [Google Scholar] [CrossRef]
- Chen, W.; Balland, E.; Cowley, M.A. Hypothalamic Insulin Resistance in Obesity: Effects on Glucose Homeostasis. Neuroendocrinology 2017, 104, 364–381. [Google Scholar] [CrossRef]
- Boden, G. Obesity, Insulin Resistance and Free Fatty Acids. Current Opinion in Endocrinology, Diabetes & Obesity 2011, 18, 139–143. [Google Scholar] [CrossRef]
- Yu, C.; Chen, Y.; Cline, G.W.; Zhang, D.; Zong, H.; Wang, Y.; Bergeron, R.; Kim, J.K.; Cushman, S.W.; Cooney, G.J.; et al. Mechanism by Which Fatty Acids Inhibit Insulin Activation of Insulin Receptor Substrate-1 (IRS-1)-Associated Phosphatidylinositol 3-Kinase Activity in Muscle. Journal of Biological Chemistry 2002, 277, 50230–50236. [Google Scholar] [CrossRef] [PubMed]
- Morrison, S.F.; Madden, C.J.; Tupone, D. Central Neural Regulation of Brown Adipose Tissue Thermogenesis and Energy Expenditure. Cell Metabolism 2014, 19, 741–756. [Google Scholar] [CrossRef] [PubMed]
- Yahiro, T.; Kataoka, N.; Nakamura, Y.; Nakamura, K. The Lateral Parabrachial Nucleus, but Not the Thalamus, Mediates Thermosensory Pathways for Behavioural Thermoregulation. Sci Rep 2017, 7, 5031. [Google Scholar] [CrossRef]
- Kullmann, S.; Heni, M.; Veit, R.; Scheffler, K.; Machann, J.; Häring, H.-U.; Fritsche, A.; Preissl, H. Selective Insulin Resistance in Homeostatic and Cognitive Control Brain Areas in Overweight and Obese Adults. Diabetes Care 2015, 38, 1044–1050. [Google Scholar] [CrossRef] [PubMed]
- Kullmann, S.; Valenta, V.; Wagner, R.; Tschritter, O.; Machann, J.; Häring, H.-U.; Preissl, H.; Fritsche, A.; Heni, M. Brain Insulin Sensitivity Is Linked to Adiposity and Body Fat Distribution. Nat Commun 2020, 11, 1841. [Google Scholar] [CrossRef]
- Hahm, J.R.; Jo, M.H.; Ullah, R.; Kim, M.W.; Kim, M.O. Metabolic Stress Alters Antioxidant Systems, Suppresses the Adiponectin Receptor 1 and Induces Alzheimer’s Like Pathology in Mice Brain. Cells 2020, 9, 249. [Google Scholar] [CrossRef]
- Toniolo, L.; Gazzin, S.; Rosso, N.; Giraudi, P.; Bonazza, D.; Concato, M.; Zanconati, F.; Tiribelli, C.; Giacomello, E. Gender Differences in the Impact of a High-Fat, High-Sugar Diet in Skeletal Muscles of Young Female and Male Mice. Nutrients 2024, 16, 1467. [Google Scholar] [CrossRef]
- Maldonado-Devincci, A.M.; Odelade, A.E.; Irby-Shabazz, A.; Jadhav, V.; Nepal, P.; Chang, E.M.; Chang, A.Y.; Han, J. Longitudinal Sex-Specific Impacts of High-Fat Diet on Dopaminergic Dysregulation and Behavior from Periadolescence to Late Adulthood. Nutritional Neuroscience 2024, 1–14. [Google Scholar] [CrossRef]
- Van Der Heijden, R.A.; Sheedfar, F.; Morrison, M.C.; Hommelberg, P.P.; Kor, D.; Kloosterhuis, N.J.; Gruben, N.; Youssef, S.A.; De Bruin, A.; Hofker, M.H.; et al. High-Fat Diet Induced Obesity Primes Inflammation in Adipose Tissue Prior to Liver in C57BL/6j Mice. Aging 2015, 7, 256–268. [Google Scholar] [CrossRef] [PubMed]
- Barazzoni, R.; Gortan Cappellari, G.; Ragni, M.; Nisoli, E. Insulin Resistance in Obesity: An Overview of Fundamental Alterations. Eat Weight Disord 2018, 23, 149–157. [Google Scholar] [CrossRef] [PubMed]
- Komatsu, M.; Takei, M.; Ishii, H.; Sato, Y. Glucose-stimulated Insulin Secretion: A Newer Perspective. J of Diabetes Invest 2013, 4, 511–516. [Google Scholar] [CrossRef] [PubMed]
- Deng, D.; Yan, N. GLUT, SGLT, and SWEET: Structural and Mechanistic Investigations of the Glucose Transporters. Protein Science 2016, 25, 546–558. [Google Scholar] [CrossRef] [PubMed]
- McNay, E.C.; Pearson-Leary, J. GluT4: A Central Player in Hippocampal Memory and Brain Insulin Resistance. Experimental Neurology 2020, 323, 113076. [Google Scholar] [CrossRef] [PubMed]
- Mueckler, M.; Thorens, B. The SLC2 (GLUT) Family of Membrane Transporters. Molecular Aspects of Medicine 2013, 34, 121–138. [Google Scholar] [CrossRef] [PubMed]
- Chen, Z.; Zhong, C. Decoding Alzheimer’s Disease from Perturbed Cerebral Glucose Metabolism: Implications for Diagnostic and Therapeutic Strategies. Progress in Neurobiology 2013, 108, 21–43. [Google Scholar] [CrossRef] [PubMed]
- Witek, K.; Wydra, K.; Filip, M. A High-Sugar Diet Consumption, Metabolism and Health Impacts with a Focus on the Development of Substance Use Disorder: A Narrative Review. Nutrients 2022, 14, 2940. [Google Scholar] [CrossRef] [PubMed]
- Ristow, M.; Zarse, K. How Increased Oxidative Stress Promotes Longevity and Metabolic Health: The Concept of Mitochondrial Hormesis (Mitohormesis). Experimental Gerontology 2010, 45, 410–418. [Google Scholar] [CrossRef]
- Camiletti-Moirón, D.; Aparicio, V.; Nebot, E.; Medina, G.; Martínez, R.; Kapravelou, G.; Andrade, A.; Porres, J.; López-Jurado, M.; Aranda, P. High-Intensity Exercise Modifies the Effects of Stanozolol on Brain Oxidative Stress in Rats. Int J Sports Med 2015, 36, 984–991. [Google Scholar] [CrossRef]
- Papakonstantinou, E.; Oikonomou, C.; Nychas, G.; Dimitriadis, G.D. Effects of Diet, Lifestyle, Chrononutrition and Alternative Dietary Interventions on Postprandial Glycemia and Insulin Resistance. Nutrients 2022, 14, 823. [Google Scholar] [CrossRef]
- Lee, K.H.; Cha, M.; Lee, B.H. Crosstalk between Neuron and Glial Cells in Oxidative Injury and Neuroprotection. IJMS 2021, 22, 13315. [Google Scholar] [CrossRef] [PubMed]
- Zeiger, S.L.H.; McKenzie, J.R.; Stankowski, J.N.; Martin, J.A.; Cliffel, D.E.; McLaughlin, B. Neuron Specific Metabolic Adaptations Following Multi-Day Exposures to Oxygen Glucose Deprivation. Biochimica et Biophysica Acta (BBA) - Molecular Basis of Disease 2010, 1802, 1095–1104. [Google Scholar] [CrossRef] [PubMed]
- Bryant, N.J.; Govers, R.; James, D.E. Regulated Transport of the Glucose Transporter GLUT4. Nat Rev Mol Cell Biol 2002, 3, 267–277. [Google Scholar] [CrossRef]
- Zwick, R.K.; Guerrero-Juarez, C.F.; Horsley, V.; Plikus, M.V. Anatomical, Physiological, and Functional Diversity of Adipose Tissue. Cell Metabolism 2018, 27, 68–83. [Google Scholar] [CrossRef]
- Ortega, S.P.; Chouchani, E.T.; Boudina, S. Stress Turns on the Heat: Regulation of Mitochondrial Biogenesis and UCP1 by ROS in Adipocytes. Adipocyte 2017, 6, 56–61. [Google Scholar] [CrossRef] [PubMed]
- Pickering, A.M.; Vojtovich, L.; Tower, J.; A. Davies, K.J. Oxidative Stress Adaptation with Acute, Chronic, and Repeated Stress. Free Radical Biology and Medicine 2013, 55, 109–118. [Google Scholar] [CrossRef]
- Sharma, V.; Mehdi, M.M. Oxidative Stress, Inflammation and Hormesis: The Role of Dietary and Lifestyle Modifications on Aging. Neurochemistry International 2023, 164, 105490. [Google Scholar] [CrossRef]
Figure 1.
Experimental diagram of obesity induction and measurement of peripheral and cerebral insulin resistance in C57BL/6 mice. Mice were exposed to standard, low fat, or high fat diets for 1 (4 weeks), 2 (8 weeks), and 3 (12 weeks) months (MO). Body weight was measured weekly until 12 weeks. Device implant were performed at weeks 2 (1 MO group), 5 (2 MO group), and 9 (3 MO group). Subsequently, the insulin tolerance test (ITT) and the glucose tolerance test (GTT) were performed at weeks 2, 6 and 10. Placement of the guide cannula for insulin injections in the mice was performed through stereotaxic surgery at weeks 3,7 and 11 weeks. Finally, the mice were sacrificed at weeks 4, 8 and 12 for organ attainment and determination of oxidative damage markers.
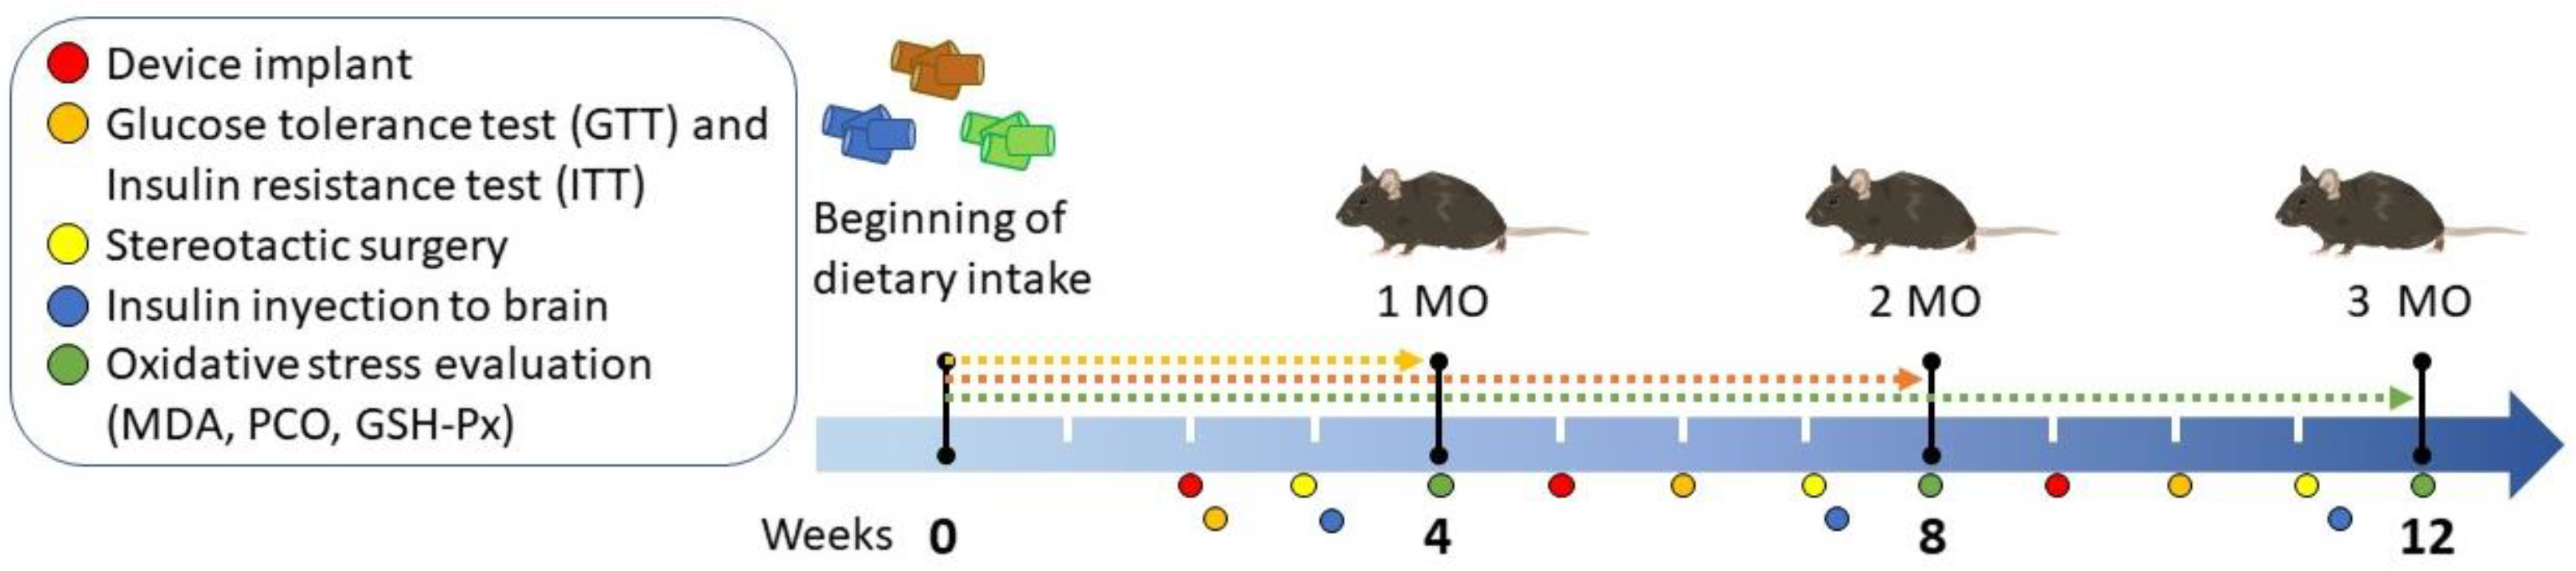
Figure 2.
Effect of fat intake on body weight of C57BL/6 mice. Body weight of mice fed different diets for 1 (A), 2 (B), and 3 (C) months (MO) are shown. Data is shown as mean ± standard deviation. Statistical significance by two way analysis of variance (ANOVA) followed by Student's t-test. C: Standard Diet (black circle), LFD: Low Fat Diet or High Carbohydrate Diet (light gray square), HFD: High Fat Diet (strong gray triangle). Solid arrow indicates the time of performance of the laparotomy and dotted arrow indicates the time of performance of stereotaxic surgery. C vs LFD = + p < 0.05, C vs HFD * p < 0.05, ** p < 0.01 and *** p < 0.001.
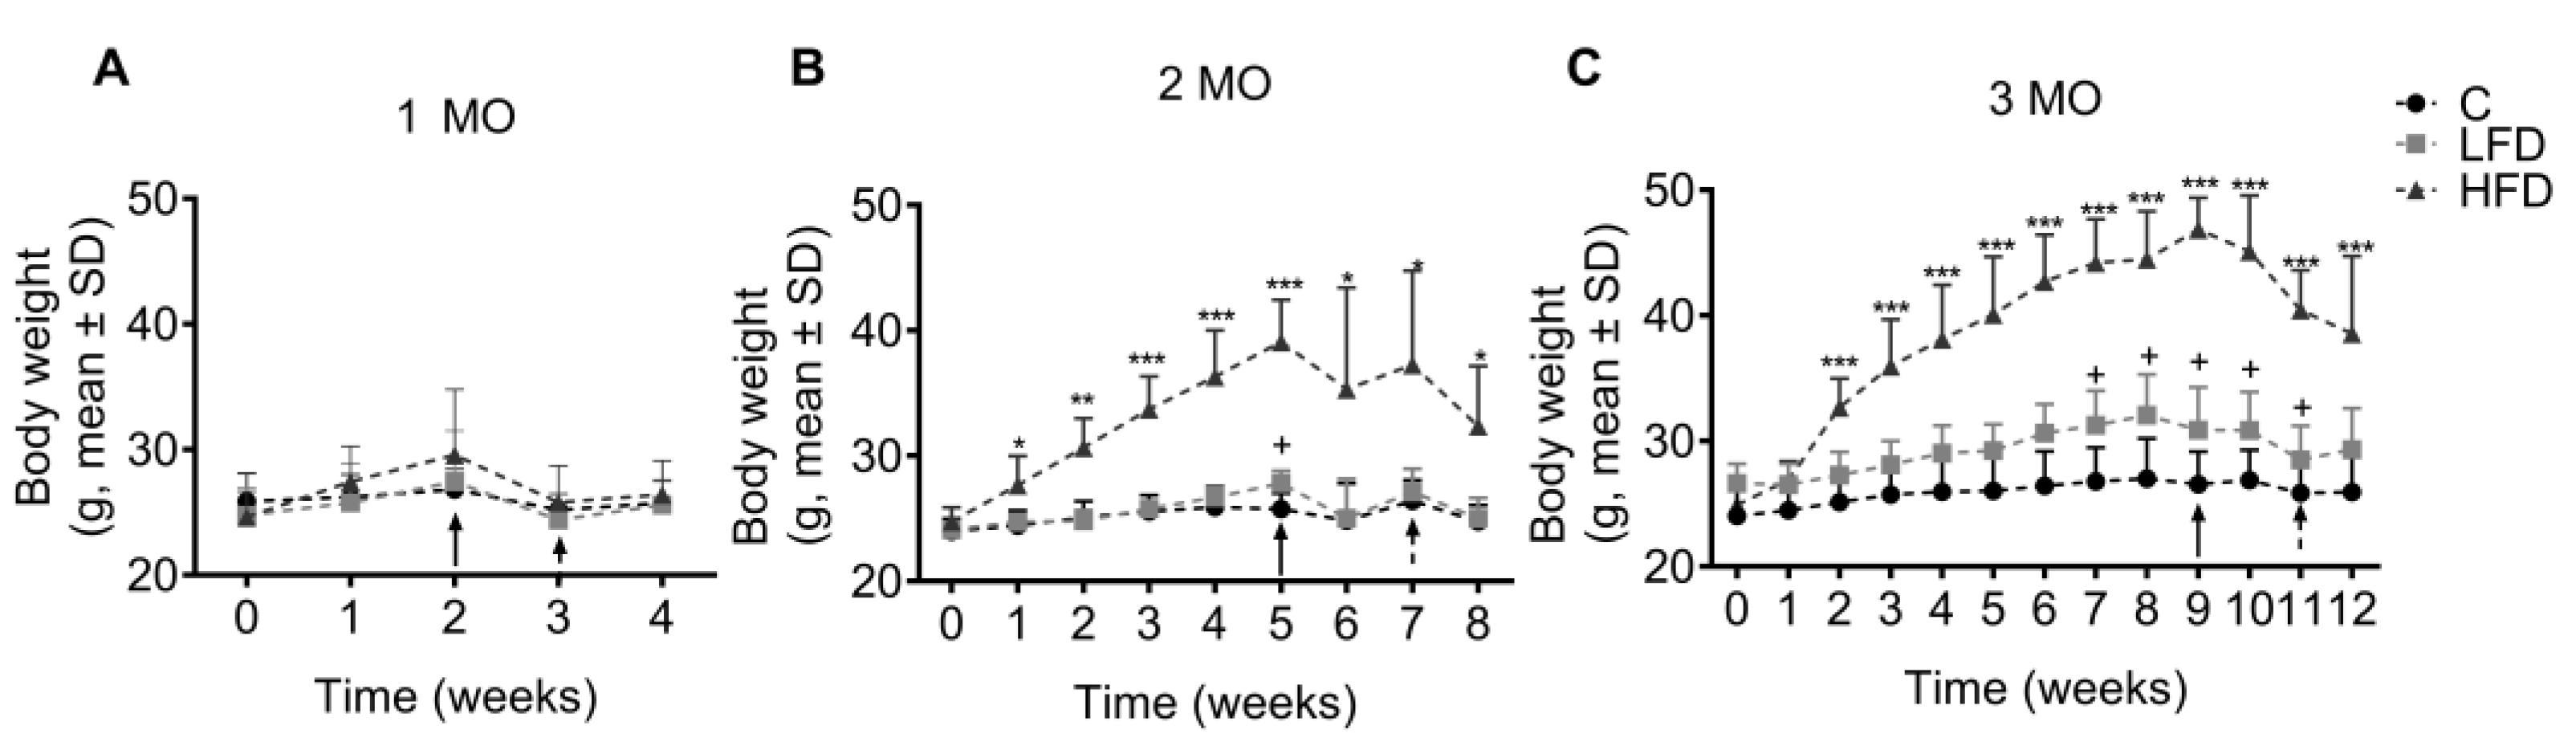
Figure 3.
Effect of HFD and LFD intake on glucose tolerance and peripheral insulin sensitivity in C57BL/6 mice. Glucose levels are shown versus time (0, 30, 60, 60, 90 and 120 min) after administration of 2 g glucose/kg body weight in mice fed for 2 (A), 6 (B) and 10 (C) weeks on low fat or high carbohydrate diet (LFD), high fat (HFD) or standard diet (C) and the area under the curve (AUC) (D) for the glucose tolerance test (GTT) by 1, 2 and 3 month (MO) groups. Glucose levels are shown versus time (0, 30, 60, 60, 90 and 120 min) after administration of 0.5 IU insulin/kg body weight intraperitoneally in LFD, HFD or C mice fed for 2 (E), 6 (F) and 10 (G) weeks and the AUC (H) for the insulin tolerance test (ITT) by 1, 2 and 3 MO groups. Data are shown as mean ± standard deviation. + p < 0.05, ++ p < 0.01 significance LFD vs C. * p < 0.05, ** p < 0.01, *** p < 0.001 significance HFD vs C.
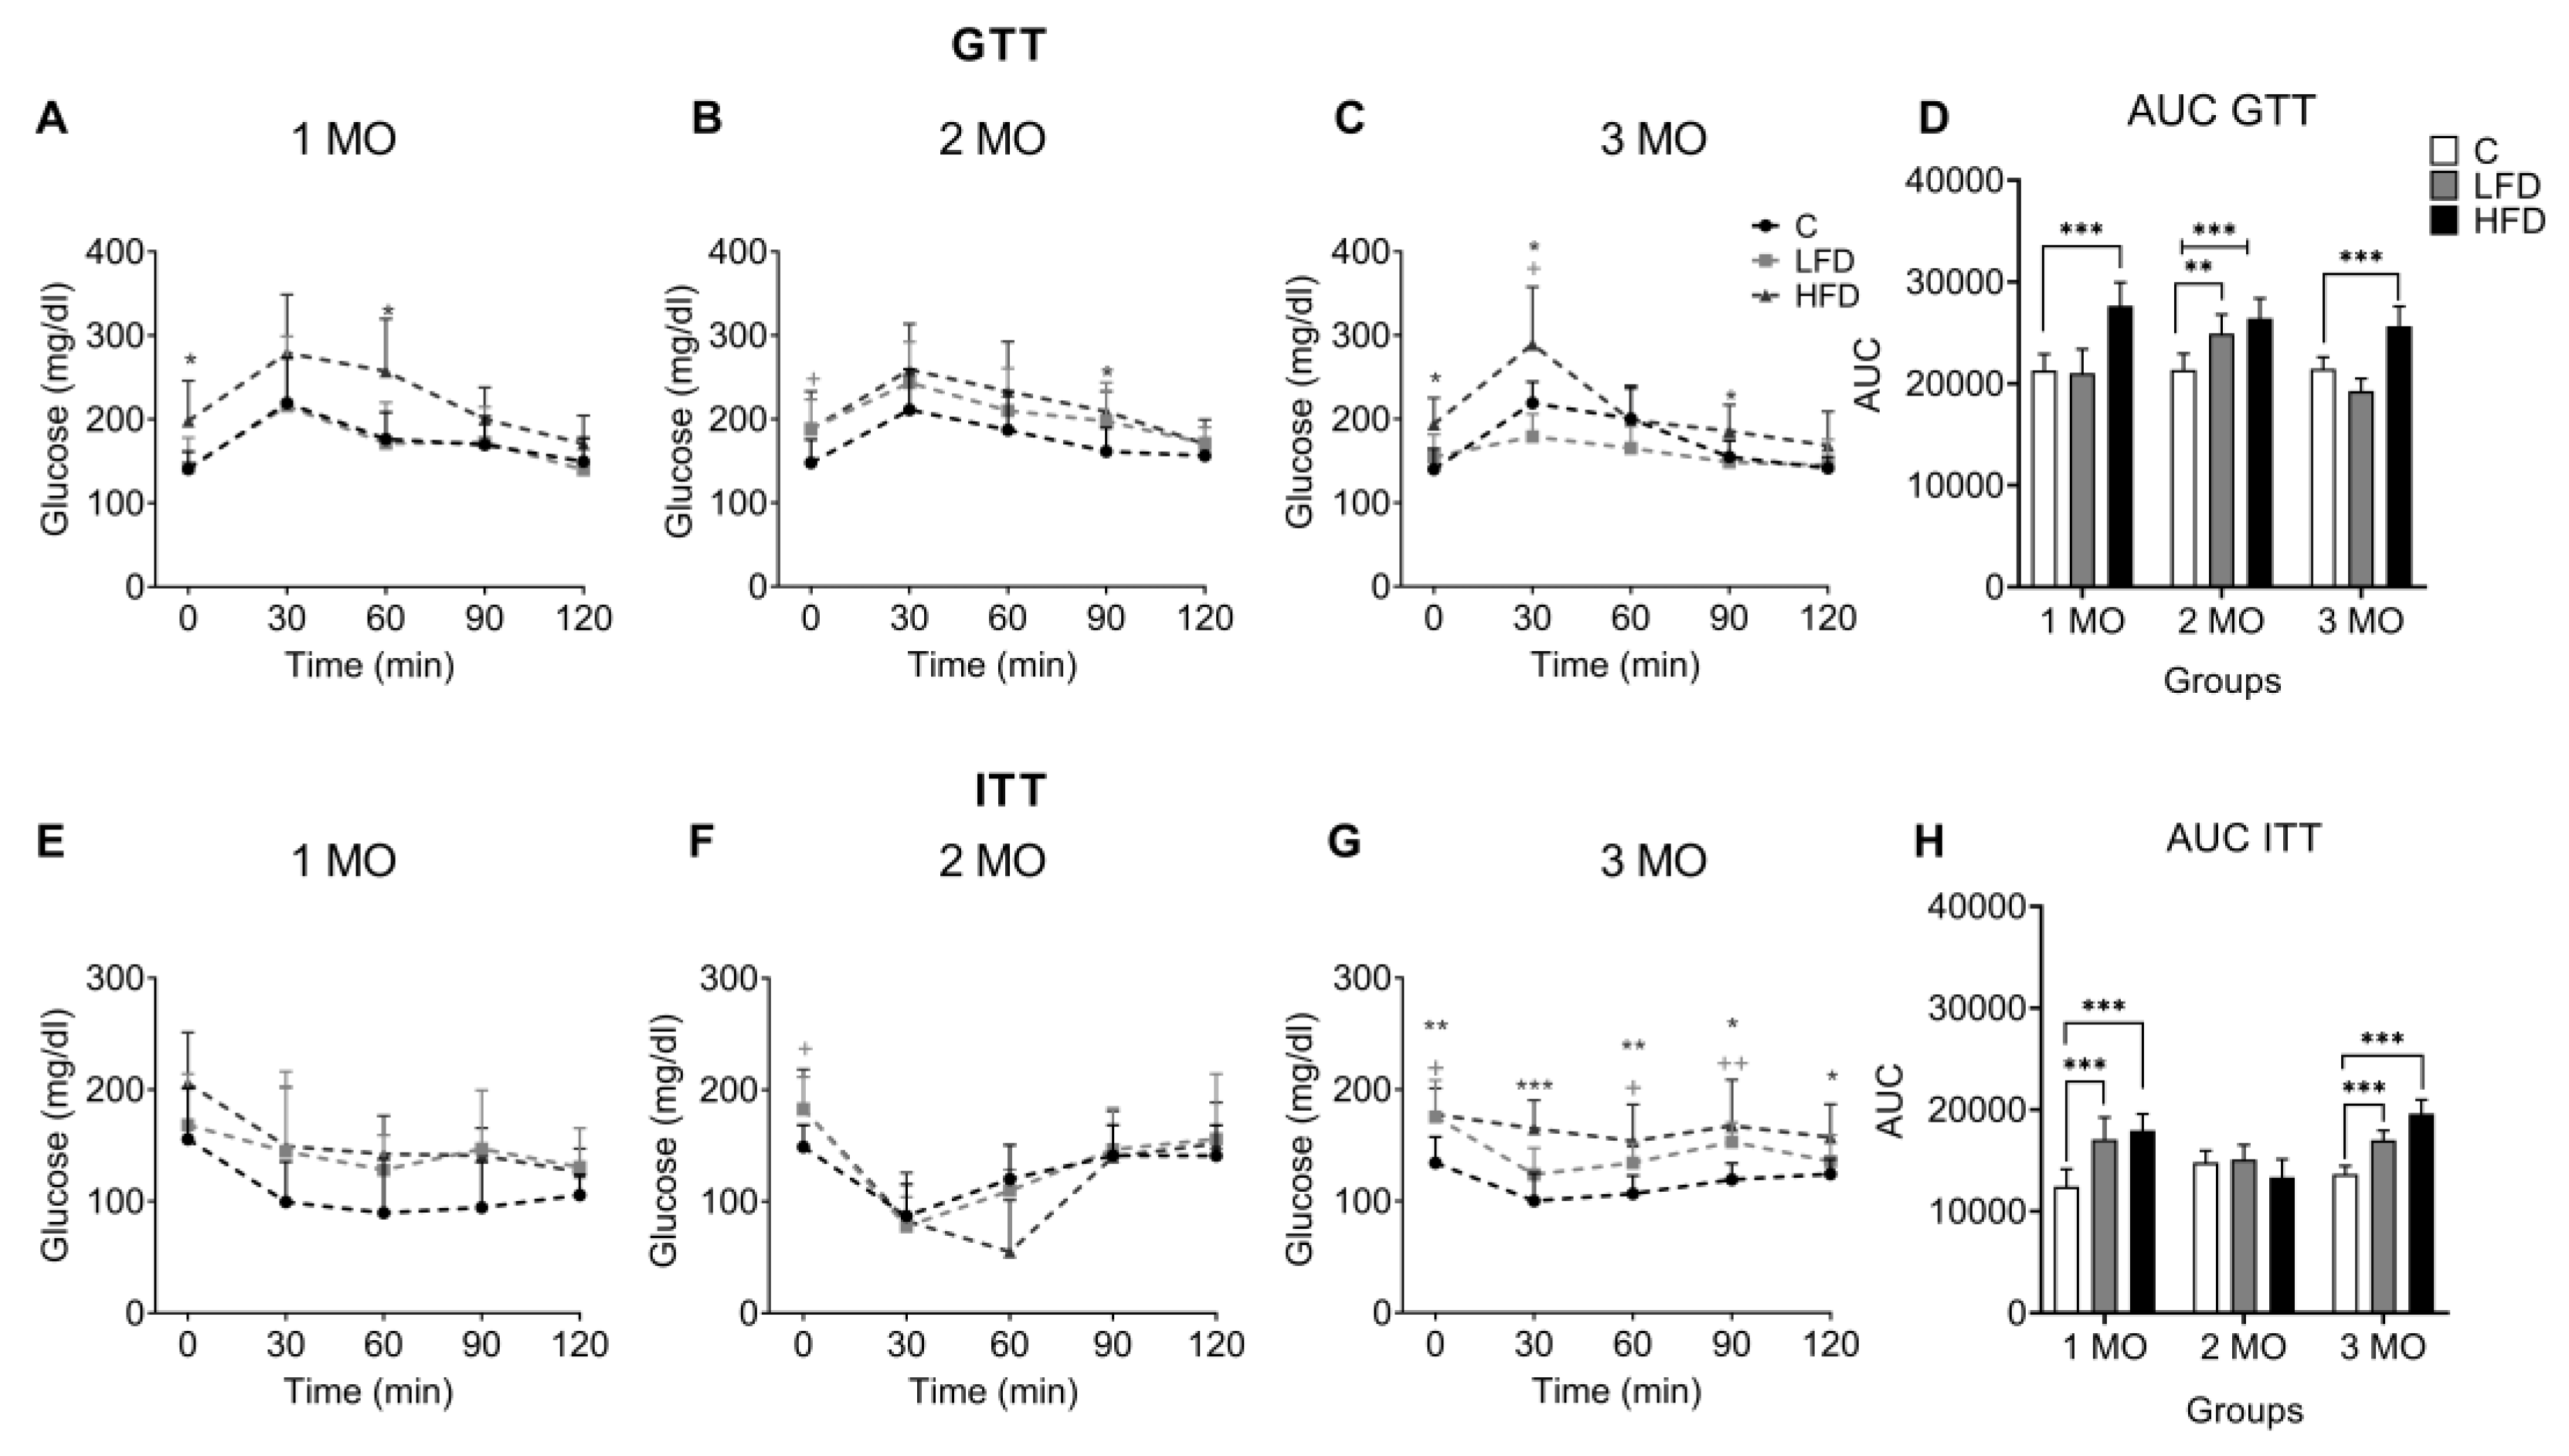
Figure 4.
Effect of brain insulin injections on core body temperature in C57BL/6 mice. Shown are changes in core body temperature (CBT) over 4 hours after local injection of insulin (0.015, 0.03, and 0.06 IU) and vehicle in the POA by groups of 1, 2 and 3 months (MO) of exposure to the diets. Data is shown as mean ± standard deviation. * p < 0.05, ** p < 0.01 significance vs C. C: Standard Diet (black circle), LFD: Low Fat Diet or High Carbohydrate Diet (orange square), HFD: High Fat Diet (blue triangle). The orange arrow indicates insulin injection time.
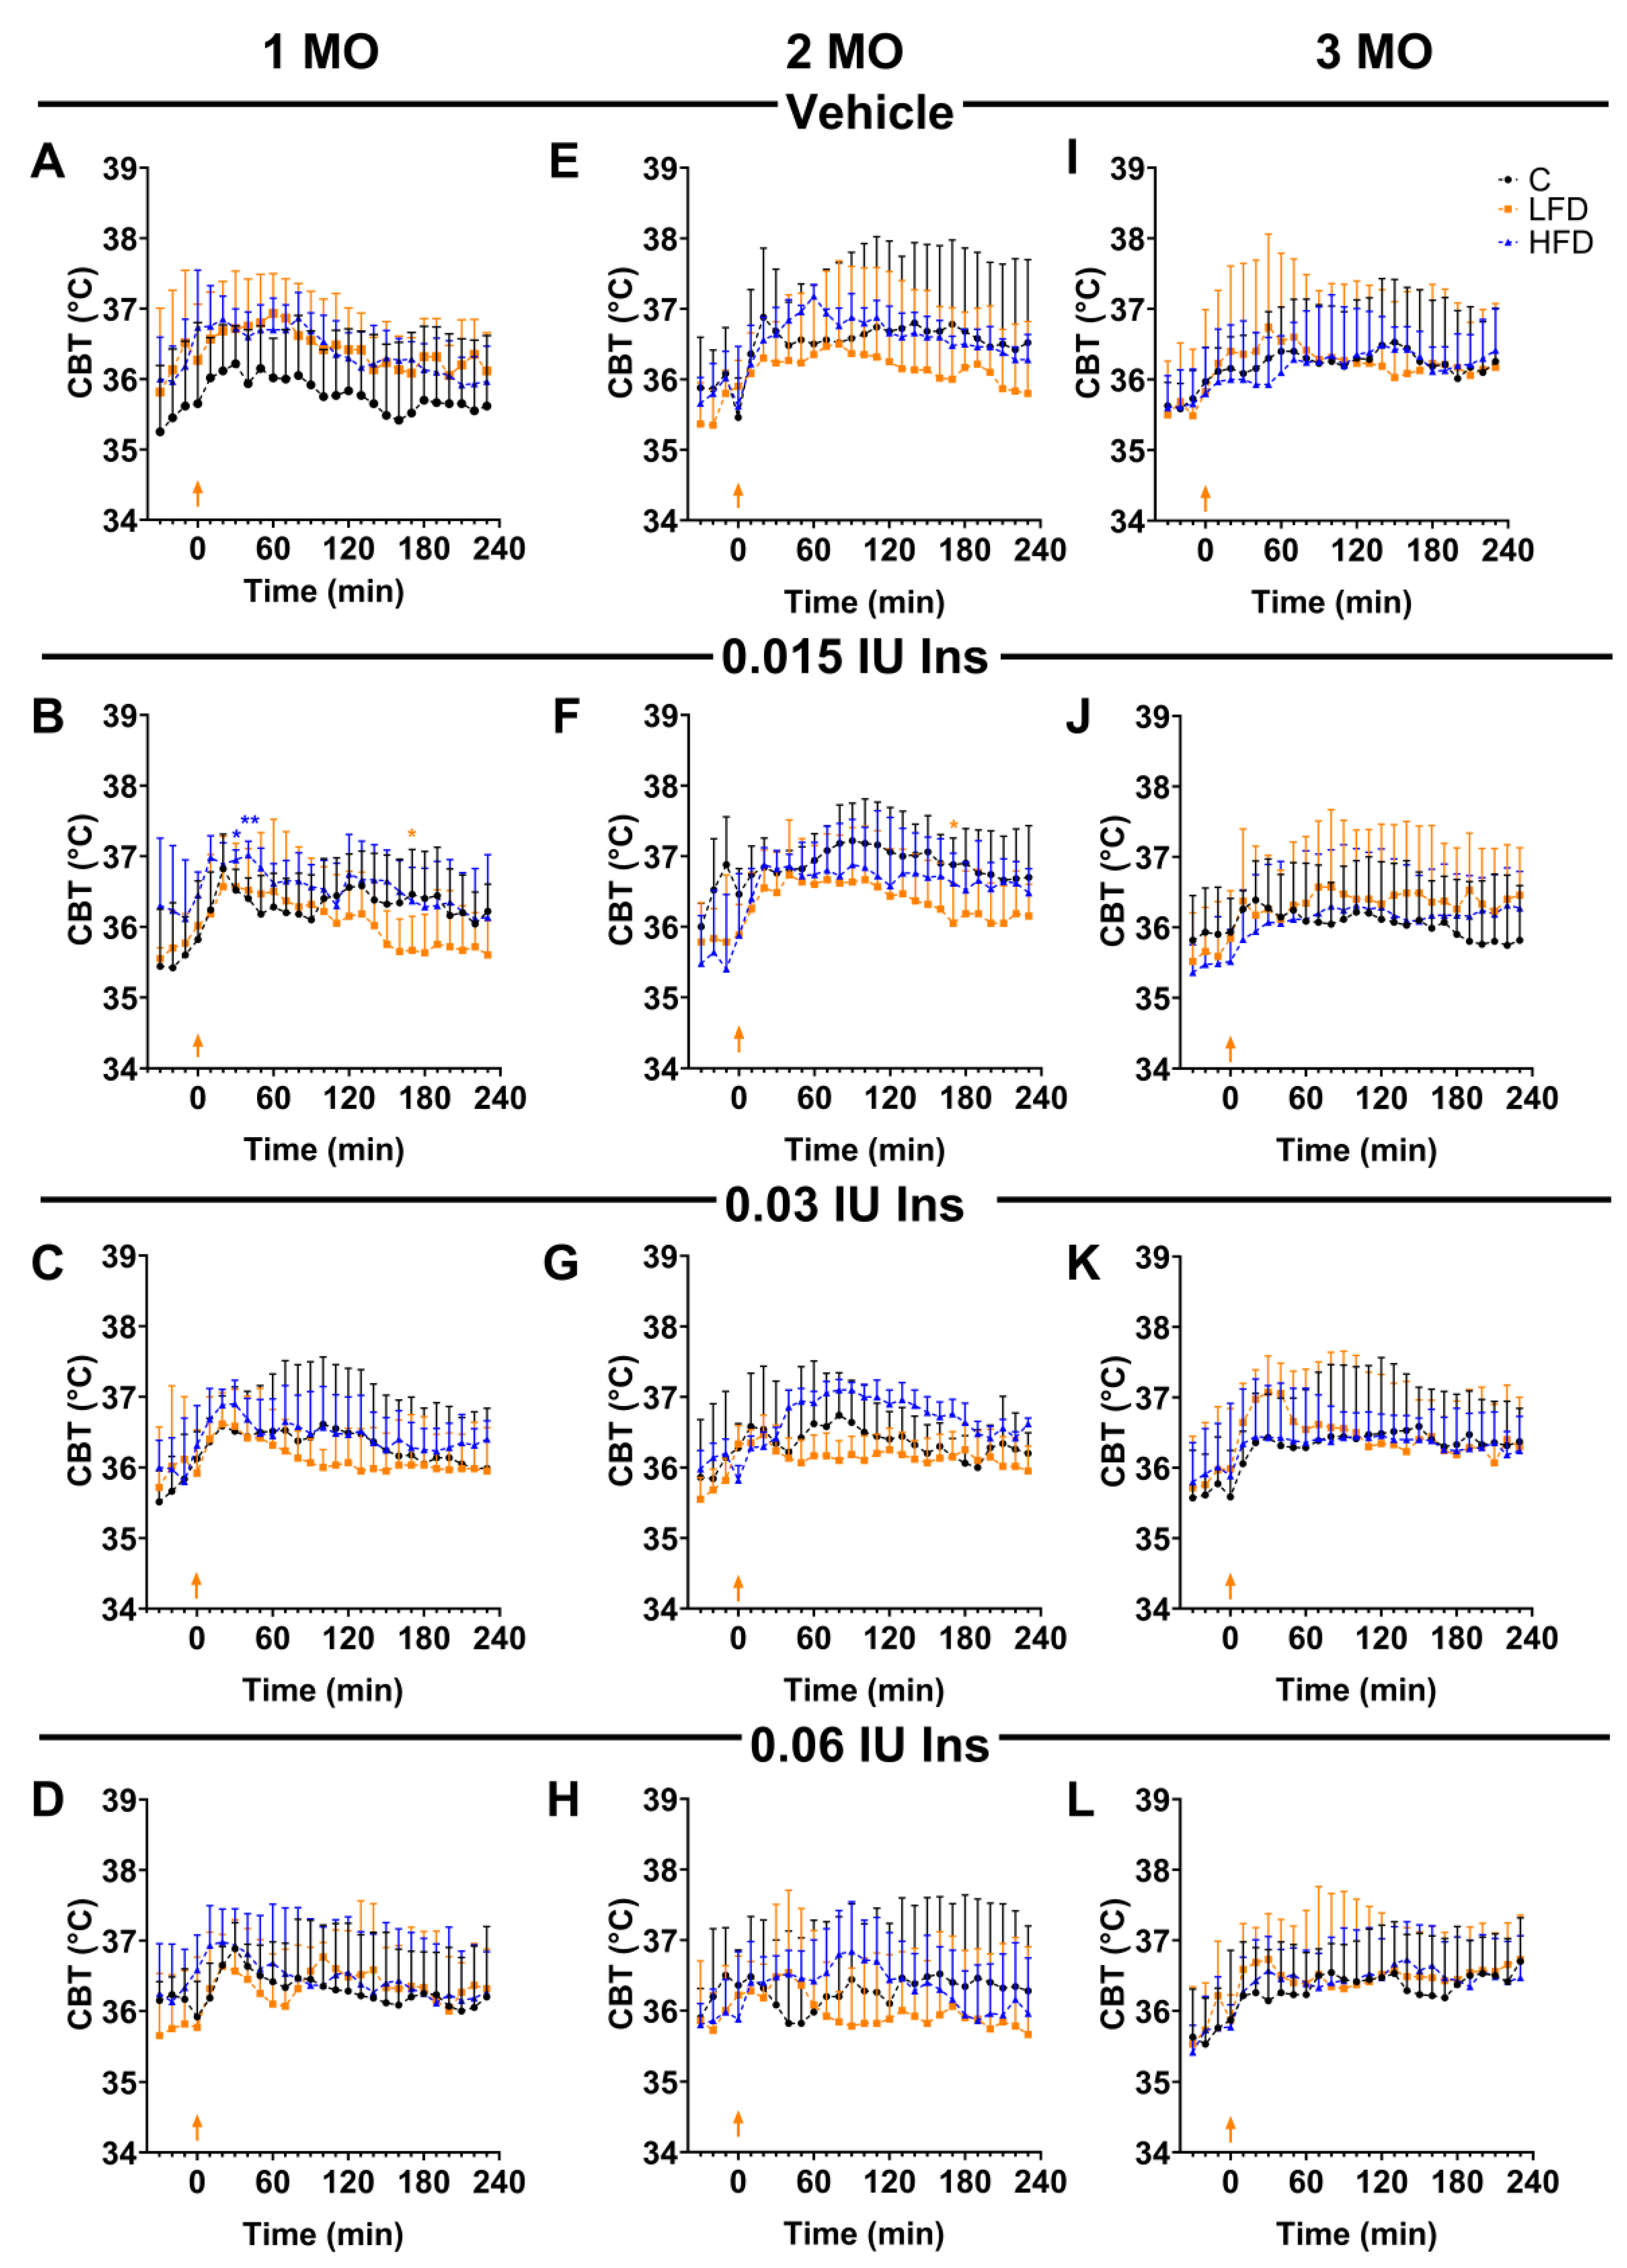
Figure 5.
Oxidative damage in plasma, white adipose tissue, brown adipose tissue, and cerebral cortex. Percentage of malondialdehyde (MDA) (A, D, G, J), protein carbonyl group (PCO) (B, E, H, K), and glutathione peroxidase activity (GSH-Px) (C, F, I, L) in plasma, white adipose tissue, brown adipose tissue and cerebral cortex of mice fed standard diet (C), Low Fat (LFD) and High Fat Diet (HFD) by 1, 2 and 3 months (MO). Data are shown as mean and ± standard deviation. Statistical significance by two way analysis of variance (ANOVA) followed by Student's t-test. * p < 0.05; ** p <0.01.
Disclaimer/Publisher’s Note: The statements, opinions and data contained in all publications are solely those of the individual author(s) and contributor(s) and not of MDPI and/or the editor(s). MDPI and/or the editor(s) disclaim responsibility for any injury to people or property resulting from any ideas, methods, instructions or products referred to in the content. |
© 2025 by the authors. Licensee MDPI, Basel, Switzerland. This article is an open access article distributed under the terms and conditions of the Creative Commons Attribution (CC BY) license (https://creativecommons.org/licenses/by/4.0/).
Copyright: This open access article is published under a Creative Commons CC BY 4.0 license, which permit the free download, distribution, and reuse, provided that the author and preprint are cited in any reuse.


