
Submitted:
01 January 2025
Posted:
06 January 2025
You are already at the latest version
Abstract
Sulfur dioxide (SO2) can be of natural and anthropogenic origin and is one of the sulfur compounds present in the atmosphere. Among natural sources, volcanoes contribute with relevant annual outputs, and major eruptions lead to spikes in these outputs. In the case of anthropogenic pollution, SO2 emissions are mostly correlated with the sulfur content of fuels, which has been the focus of specific emission mitigation policies for decades. Following other examples of cyclic and multi-year evaluations, an analysis on SO2 at the Lamezia Terme (code: LMT) WMO/GAW (World Meteorological Organization – Global Atmosphere Watch) station in Calabria, Southern Italy was performed. The coastal site is characterized by wind circulation patterns that result in the detection of air masses with poor or enhanced anthropic influences. The presence of the Aeolian Arc of active, quiescent, and extinct volcanoes, as well as Mount Etna in Sicily, may influence LMT observations with diffused SO2 emissions. For the first time in the history of LMT, a multi-year analysis of a parameter has been integrated with TROPOMI data gathered by Sentinel-5P used to test total tropospheric column densities at the LMT itself and select coordinates in the Tyrrhenian and Ionian seas. Surface and satellite data indicate that SO2 peaks at LMT are generally linked to winds from the western-seaside wind corridor, a pattern that is compatible with active volcanism in the Tyrrhenian Sea and maritime shipping to and from the Gioia Tauro port located in the same region. The findings of this research provide the basis for enhanced source apportionment which could further differentiate anthropogenic sources in the area from natural outputs.
Keywords:
sulfur dioxide
; GAW
; Lamezia Terme
; Mediterranean Basin
; Tyrrhenian Sea
; Ionian Sea
; surface measurements
; TROPOMI
; tropospheric column data
Introduction
Sulfur dioxide (SO2), sometimes spelled as sulphur dioxide, is one of the sulfur compounds present in the atmosphere and can be natural or anthropogenic in origin [1,2,3,4].
Among natural sources of SO2, volcanoes contribute with a significant emission rate [5,6,7,8]. Direct impact of volcanic eruptions on sulfur dioxide concentrations in the troposphere and the stratosphere has been documented in the past few decades [9,10,11,12]. The Mt. Pinatubo eruption of June 1991 set a milestone in the implementation of plume tracking technologies, satellite data, airborne measurements, and global collaborative networks used to monitor sulfur dioxide emissions from the volcano and their consequent diffusion [13,14,15,16,17]. The Hunga Tonga–Hunga Haʻapai eruption of 2022, which is considered the most explosive eruption of the past 140 years, has resulted in a significant SO2 output that was promptly tracked with multiple methodologies [18,19].
Wildfires, agricultural fires, and other forms of biomass burning also result in sulfur dioxide emissions, as well as the release of other sulfur compounds, which influence the overall budget on a global scale [20,21,22,23,24,25]. Volcanic and wildfire emissions of SO2 have a direct impact on the atmosphere’s ERF (effective radiative forcing), in conjunction with aerosols; for this reason, SO2 is also the subject of evaluations meant at assessing the climate change potential [26,27,28].
Anthropogenic emissions are primarily due to fossil fuels and their sulfur content, whose impact on the environment does not affect all areas of the globe via the same mechanisms [29]. Vehicular traffic has been a major source of anthropogenic sulfur dioxide and regulations – in addition to new technologies – have led to the implementation of sulfur-low fuels which reduced the output from vehicles [30,31,32,33]. The oil and gas sector is also linked to sulfur dioxide emissions at various stages [34]. The emissions from this sector are such that they pose a health hazard for workers operating in the field of oil and gas [35].
Shipping is among the main sources of anthropogenic SO2 [36,37,38] and air quality parameters in areas where ports are present are known to be affected by maritime traffic [39]. In the Mediterranean, the Suez Canal is a major hotspot for such activities and a comparative study between standard pollution levels and periods of exceptionally low traffic such as the COVID-19 pandemic and the Ever Given incident showed relevant reductions in SO2 levels [40]. In the past few years, new technologies have been implemented in the effort to model [41], and also mitigate [42] SO2 emissions related to maritime traffic. The use of low-sulfur fuel in maritime shipping can effectively reduce the degrees of pollution [43,44]. Aviation fuel is also affected by similar issues [45,46,47] and the physical-chemical processes that occur at high altitudes in exhaust plumes have been the focus of scientific research meant to assess the extent of aviation fuel related pollution [48]. Most SO2 emissions related to aviation occur during the cruise phase and therefore have an impact over wide regions in short amount of time [49]. Many techniques have been tested to provide accurate information on the impact of aircraft engine exhausts on the total budget of anthropogenic emissions [50,51]. With the rise of SAF (Sustainable Aviation Fuel), sulfur content has reduced and the impacts of such emissions on the environment are partially mitigated [52].
As a pollutant, sulfur dioxide is short lived: depending on a number of environmental factors, its persistence in the atmosphere may be limited to two days [53,54,55,56]. In the atmosphere, chemical reactions between sulfur dioxide and other compounds occur [57]: following the reaction with water droplets, sulfuric acid (H2SO4) – which is responsible for the acid rain phenomenon – is released [58].
The effects of sulfur dioxide on human health are well documented [59]. SO2 affects the respiratory system [60] and also poses mental health concerns [61,62]. Globally, it causes more than one million premature deaths every year [63] and prolonged exposure can negatively affect pregnancies [64,65,66,67].
The adverse effects of sulfur dioxide have led to global mitigation policies which managed to reduce the annual rate of anthropogenic emissions [68]. In China, which is characterized by significant SO2 outputs from transportation, industry, and other activities [69], assessments of PCSO2 (Per Capita SO2) emissions [70] have demonstrated that, once applied, policies can effectively reduce sulfur dioxide emissions [71,72]. It is worth noting however that the reduction of sulfur dioxide emissions may lead to an increase in the release of other pollutants, such as coal [73].
In a work by Altamira-Colado and collaborators [74] a number of patents based on the implementation of UAS (Unmanned Aerial Systems, commonly referred to as drones) compatible sulfur dioxide detectors were reviewed, thus highlighting recent advances in environmental monitoring technology and the possibility of pinpointing sources of SO2 emissions. Overall, monitoring sulfur dioxide concentrations and their possible sources is therefore important in the assessment of anthropogenic and natural pollution in a given area [75,76,77]. This study is aimed at the multi-year characterization of sulfur dioxide variability at the World Meteorological Organization – Global Atmosphere Watch (WMO/GAW) regional station of Lamezia Terme (code: LMT) located in the southern Italian region of Calabria. Sulfur dioxide is the third compound to be subject to a multi-year characterization at the site, following methane [78] (2016-2022) and ozone [79] (2015-2023). Using eight years of continuous surface SO2 measurements (2016-2023), this study also integrates tropospheric column data obtained by satellite to further assess the sources of emission in the area. The paper is divided as follows: Section 2 described the LMT site, its peculiarities in the context of the Mediterranean basin, and the instruments/methodologies used in this evaluation; Section 3 shows the results of the analysis; Section 4 and 5 discuss and conclude the findings of this paper, respectively.
2. The Lamezia Terme Station and Surface/Tropospheric SO2 Databases
2.1. The WMO/GAW Regional Coastal Site of Lamezia Terme
Within the WMO/GAW (World Meteorological Organization – Global Atmosphere Watch) network, the Lamezia Terme regional coastal station (WMO/GAW code: LMT) located in the municipality of Lamezia Terme in Calabria, Southern Italy gathers continuous data on a number of meteorological and chemical parameters in the atmosphere. Its coordinates are 38.87630°N-16.23220°E (Figure 1A) and has been operated by the National Research Council of Italy – Institute of Atmospheric Sciences and Climate (CNR-ISAC) since 2015. The observation site is located at an elevation of 6 meters above sea level, approximately 600 meters from the nearby Tyrrhenian coastline of Calabria.
In terms of anthropogenic and natural SO2 emission hotspots, the area where LMT is located is characterized by the presence of the Gioia Tauro port (52 kilometers S-SW from the site) [80] and volcanic activities [81] (Figure 1B). The Mount Etna volcano is located in the nearby region of Sicily (160 km S-SW from LMT) [82,83,84]. The Aeolian Arc, which includes the Aeolian Islands and a number of underwater volcanoes [85] many of which have not erupted in historical times, are also close to LMT. Stromboli (88 km W-SW from LMT) is the nearest active volcano, and a well-documented source of sulfur dioxide in the region [86,87]. Vulcano, located in the southernmost part of the Aeolian Islands, has not experienced eruptions in the past few centuries but is subject to SO2 degassing in the form of fumarole/vents, a phenomenon that also affects Stromboli and Mt. Etna [88,89,90,91].
Previous works based on preliminary data [92] and nearly a decade of LMT observations [78,79], reported the influence of local wind circulation on the surface concentrations of many parameters. In fact, the site is characterized by two distinct wind axes: a western “seaside” wind corridor normally yielding lower concentrations of pollutants, and a northeastern “continental” corridor which is generally linked to the highest peaks observed at LMT, although notable exceptions have been reported [78,79,93]. The Lamezia Terme International Airport (IATA: SUF; ICAO: LICA), which is located approximately 3 km north from the WMO/GAW station, has a RWY 10/28 (100-280 °N) runway orientation and local air traffic is constantly influenced by the same wind circulation patterns reported at LMT.
Prior to LMT continuous atmospheric observations, local wind patterns were subject to a number of studies. Locally, wind circulation is dominated by breeze regimes, which also regulate the climate across all seasons [94,95]. Although seasonal changes in wind circulation occur, the main corridors at low altitudes are oriented on a NE-ENE/W-WSW axis, while NW large scale circulation is dominant at the 850 hPa layer [94]. During the winter season and in the month of November, daytime circulation is mainly subject to large-scale forcing, and breezes dominate nocturnal flows; in the other periods of the year (spring, summer, and the remaining months of fall), daytime breezes are dominated by both local and large-scale flows [95].
Following the introduction of surface measurements of greenhouse gases (GHGs) and other parameters at LMT in 2015, additional campaigns were targeted at an enhanced characterization of local wind circulation at low altitudes. Using a Zephir lidar 300, several wind profiles were observed at the site at various altitude thresholds from 10 to 300 meters above the ground level [100]. Additionally, based on the results of a short 2009 summertime campaign performed via the implementation of multiple techniques and instruments, two evaluations of PBL (Planetary Boundary Layer) variability at the site were conducted [101,102]. These studies however lacked information on additional parameters, which were however covered in a longer 2024 campaign on integrated PBL/GHG/aerosol variability which demonstrated the influence of PBLH (PBL height) and wind regime categories on LMT observations [103].
Prior to this research study and the assessment of possible volcanic activity influence on LMT, multiple local sources of pollution have been mentioned in the past as responsible for some of the peaks observed at the site. Landfills, agricultural and livestock farming, the A2 highway, the SUF/LICA airport and urban traffic in the town center have been reported in various studies as possible sources of certain peaks [78,92,99]. Specifically, many of the hypotheses on these sources were confirmed in an analysis of the first 2020 COVID-19 lockdown period, during which the restrictions introduced by the Italian government were strict and allowed to better assess a number of pollution sources in a period of exceptionally low anthropic activities [93]. Furthermore, considering the location of the site in the context of the Mediterranean basin, summer open fire emissions [104,105] and Saharan dust events [106] have also characterized LMT observations.
2.2. Measurements of Surface Sulfur Dioxide and Meteorological Parameters
Sulfur dioxide concentrations at the LMT observation site have been gathered by a Thermo Scientific 32i (Franklin, Massachusetts, USA). The model 43i operates under the principle by which sulfur dioxide molecules in ambient air absorb ultraviolet (UV) light, and consequently become excited, at a specific wavelength and emit additional UV light at a given wavelength during their decay to a lower energy state. Specifically, sample air in the 43i model flows through a hydrocarbon (HC) “kicker” which removes HC from gathered ambient air by forcing these compounds to permeate through the kicker tube wall, while SO2 molecules are unaffected by the filter. The standard flow rate is 0.5 liters per minute. Ambient air is then channeled towards a fluorescence chamber where UV light pulses excite sulfur dioxide molecules. A condensing lens, following these pulses, focuses UV light on the mirror assembly, which contains four selective mirrors which reflect only the wavelength capable of exciting SO2 molecules. As described above, following the absorption of UV light, sulfur dioxide molecules decay and emit UV at an intensity that is proportional to SO2 concentration within the chamber. Thanks to a bandpass filter, only the wavelengths emitted by excited sulfur dioxide in sampled air can reach the PMT (photomultiplier tube), which detects UV light emissions attributable only to these decaying molecules. A photodetector located at the back of the fluorescence chamber is configured to monitor UV light pulses and is connected to a compensation circuit which counterbalances fluctuations in UV light. The sampled ambient air moves from the chamber to a flow sensor, followed by a capillary, and the exhaust bulkhead. The instrument provides, at a rate of ten measurements per minute (one every six seconds), observed SO2 concentrations and stores them in a record for further data analysis. The detection limit is < 0.5 ppb of SO2. In this research study, data have been aggregated on a hourly, daily, monthly, seasonal, or yearly basis depending on each evaluation.
A Vaisala WXT520 (Vantaa, Finland) instrument has been used to gather data on key meteorological parameters (wind speed, wind direction, and temperature). The WXT520 measures temperature in Celsius degrees (°C) with a precision of 0.3 °C via a RC oscillator and two reference capacitors; the capacitance of both sensors is measured, and a microprocessor perform temperature dependency compensations for pressure and humidity. Wind data is obtained by ultrasonic transducers placed on a horizontal plane, via a direct measurement of the time span required for pulses to travel been transducers. Wind speed is measured with a precision of 3 meters per second, while wind direction has a precision of 3 degrees. Data aggregation algorithms have been applied to meteorological data depending on the evaluation type (hourly, daily, etc.).
As described in section 2.1, the LMT observation site is characterized by a daily cycle which results in a clear differentiation between western-seaside and northeastern-continental winds, which in turn result in differences in a number of parameters [78]. Figure 2A shows a wind rose of hourly data gathered between 2016 and 2023, and the presence of two distinct wind corridors is noticeable.
The western wind corridor, which has virtually no obstacles in that direction for hundreds of kilometers, has been used as a baseline to define an offshore cone aimed at satellite data evaluation. The points TYR1-3 located 60 kilometers from the coast, point TYR4 located 3 kilometers west from the observatory, and point ION1 in the Ionian coast of the Catanzaro isthmus are shown in Figure 2B. These points are considered representative of the airmasses passing at the LMT observatory from both wind corridors.
Following other studies based on multi-year evaluations on LMT data [78,79], the four seasons have been divided as follows: Summer (JJA – June, July, August); Fall (SON – September, October, November); Winter (JFD – January, February, December); Spring (MAM – March, April, May).
Additional details on the data gathered at LMT during the observation period 2016-2023 are available in Table 1, which reports the coverage rate of Thermo Scientific 43i (“SO2”) and Vaisala WXT520 (“Meteo”) instruments and their respective datasets as a percentage (%) of the total number of hours in each year. The “Combined” dataset, used for data evaluations accounting for both sulfur dioxide concentrations and wind speed/direction, refers to instances of both instruments fully operating at the same time and therefore results in overall lower coverage rates. Due to maintenance, the SO2 dataset is affected by low rates in 2019, 2022, and 2023, however the high coverage rate of the Meteo dataset throughout the entire study period ensures a minimum additional loss of coverage in the Combined set. Furthermore, wind direction filters have been applied to differentiate the western-seaside corridor (240-300 °N) at the observation site of LMT from the northeastern-continental corridor (0-90 °N).
Data aggregation algorithms have been processed in R 4.4.0 using the ggplot2, ggpubr, tidyverse, and dplyr libraries and their respective packages. The aggregations are based on the data analyses performed on multi-year methane [78] and ozone [79] concentrations at the same observation site. In this research, evaluations showing sulfur dioxide data alone are based on the SO2 dataset from Table 1, while those combining sulfur dioxide concentrations with meteorological data are based on the Combined dataset.
2.3. Tropospheric Column Measurements of SO2
On 13 October 2017, the TROPOspheric Monitoring Instrument (TROPOMI) installed onboard the Sentinel-5P satellite, under ESA’s Copernicus program, was launched [107]. The satellite and instrument perform detailed analyses of SO2, CH4 (methane), CO (carbon monoxide), O3 (ozone), NO2 (nitrogen dioxide), and HCHO (formaldehyde) concentrations in the atmosphere. TROPOMI is a remote sensing instrument of the “passive” type, equipped with a hyperspectral nadir sensor of several UV-Vis-NIR spectrometers. Specifically, the advanced instrument relies on four spectrometers set at two bands: SWIR (2305-2385 nanometers, nm); UV and Vis (270-495 nm); and NIR (675-775 nm). The spectral resolution is in the 5-15 kilometers range, with an option for 50 kilometers at wavelengths lower than 300 nanometers [108].
The instrument images a swath for about one second, yielding a spatial resolution at the center of the swath in the of 7×7 km2. The result of TROPOMI scans are processed by an algorithm providing accurate vertical column densities, or VCDs, in molecules per square centimeter (mol/cm2) of SO2, CO, and NO2 [109]. Study areas are processed with one full scan, with an option for two partial scans; available data were used in this research using level 2 TROPOMI products from 1 January 2020 to 31 December 2023, in accordance with the recommendations and technical documents provided with these products [110]. Column density data in molecules per square meter (mol/m2) were converted into molecules per square centimeter (mol/cm2) using the multiplication factor of 6.02214 × 10¹⁹ recommended by ESA [111].
Downloaded products have been processed by an algorithm programmed in MATLAB-R2016a, based on a number of steps which have also been used in a summer campaign on formaldehyde tropospheric column data at LMT [112]. Specifically, the steps are the following: TROPOMI products are downloaded in netCDF format; the program parses through all variables and processes them; coordinates and time are extracted from the products and converted as per the satellite’s scanning and tracking time; data on tropospheric gas density are extracted from the matrix and stored in an array, which is focused on a region of interest; the array itself is subject to a georeferencing process; the entire dataset is filtered and all data with a Quality Assurance Value (Qa) lower than 0.5 are excluded. Qa, and its related qa_value flag in the dataset, is a data quality value ranging from 0 (no performance) to 1 (all status flags check out) considering a number of factors such as cloud or snow/ice, the air mass coefficient, anomalies, data processing errors. As per the recommendations, only data with Qa > 0.5 have been used for further evaluation in this study, representative of the following conditions: Solar Zenith Angle (SZA) ≤ 70°; air mass factor > 0.1; cloud radiance fraction at 340 nm < 0.5; surface albedo ≤ 0.2; no error flag; no snow/ice warning. Additional steps in the data evaluation process performed by the algorithm are aimed at a comparison between a target site and its coordinates, and tropospheric column data in the proximity of these coordinates. The algorithm relates the minimum distance in the array used for data processing to the smallest distance to the selected target site. The final output are daily data matching ESA’s quality recommendation. In this work, LMT’s coordinates, as well as the coordinates of the TYR1-4 and ION1 points shown in Figure 2B, have been selected and their coverage rate is reported in Table 2. Additional details on the algorithm and its evaluations are available in Barrese et al. (2024) [112].
3. Results
3.1. Daily Cycles of Sulfur Dioxide at LMT
As described in section 2, the LMT observation site is affected by local wind circulation patterns, which result into peculiar daily cycle for greenhouse gases, traces gases, and aerosols at the site. The characterization of daily cycles based on multi-year data on methane [78] and ozone [79] showed two distinct behaviors. Sulfur dioxide is the third compound at LMT to be subject to detailed cyclic and multi-year analysis, and Figure 3 shows the results of daily cycle analysis of this compound at the site.
Overall, the daily cycle of sulfur dioxide is unlike the cycles observed for methane and ozone, although ozone shows a similar behavior in diurnal peaks [79]. In this case, the peaks are narrowed down in a specific time window (11:00-15:00).
3.2. Bivariate Analysis with Wind Direction and Speed
Integrating the data shown in the wind rose based on 2016-2023 hourly averages (Figure 2) and thus representative of eight years of local wind circulation at LMT, a total and four seasonal bivariate plots of sulfur dioxide are shown in Figure 4. These plots, that integrate the daily cycle evaluations seen in 3.1, show SO2 concentrations from the western-seaside wind corridor at wind speeds higher than their northeastern-continental counterparts. Supplementary Materials S1-A through S1-H cover seasonal patterns in each year between 2016 and 2023.
D’Amico et al. (2024a) [78] showed that methane concentrations at LMT from the northeastern-continental sector follow a hyperbola branch pattern (HBP), with low wind speeds correlated with high concentrations and, vice versa, high wind speeds yielding very low mole fractions. The same pattern was not observed from the western-seaside air corridor. An identical analysis was performed by D’Amico et al. (2024d) [79] on surface ozone and did not show any evidence of a similar pattern. Eight years of continuous surface sulfur dioxide records at LMT are now tested in Figure 5 with respect to wind speeds and wind corridor. Figure 5A and 5B refer to the W and NE sectors respectively, while Figure 5C considers all data, including those falling outside the W and NE filters. Supplementary Materials S2-A1 through S2-H3 cover the entire 2016-2023 period.
The observed behavior of sulfur dioxide at the LMT observation site is different from that of methane and surface ozone.
3.3. Evaluation of Weekly Cycles of SO2 at LMT
Multi-year evaluations of compounds at LMT have also been conducted on the weekly cycles as possible indicators of natural vs. anthropogenic sources [78,79,99]. In the case of sulfur dioxide, considering the implementation of satellite data which were not used in similar research studies on LMT, weekly cycles have been assessed and are shown in Figure 6. Supplementary Materials S3-A1 through S3-H3 cover surface data at LMT from each year within the entire 2016-2023 observation period.
The analysis of surface data has not shown specific weekly patterns, with the exception of a number of spikes falling outside weekends. Tropospheric column data are more heterogeneous and show various fluctuations affecting mostly LMT and ION data.
3.4. Variability during the Observation Period
After specific evaluations aimed at daily, weekly and seasonal trends, in conjunction with the cross-analysis with wind data, the multi-year variability of sulfur dioxide at LMT was assessed and the results on surface data are shown in Figure 7.
Tropospheric column densities gathered between 2020 and 2023 at the designated LMT, TYR, and ION locations have also been analyzed to monitor multi-year variability and the results are shown in Figure 8. This methodology was not applied to studies on multi-year variability of other compounds previously assessed at LMT. Specifically, in Figure 8A the monthly variability of the total SO2 column measured by satellite is reported.
To highlight the differences between the two Calabrian coasts, in order to identify the sources of SO2 emissions in Figure 8B, the monthly means of TCSO2 (Total Column SO2) at points TYR4 and ION1 are reported. A comparison between the in situ SO2 concentration data and the satellite tropospheric column data is shown in Figure 8C. In Figure 8D, the points TYR1-3 are analyzed, which are further away from the Tyrrhenian coast (Figure 2), in order to highlight possible SO2 outputs from maritime shipping and volcanic sources.
4. Discussion
At the Lamezia Terme (LMT) WMO/GAW station, a multi-year and cyclic characterization of sulfur dioxide (SO2) was performed based on 2016-2023 surface data gathered at the observation site. SO2 is the third parameter subject to such data evaluation, following methane [78] and ozone [79]. Due to sulfur dioxide’s heterogeneous sources and the presence of a volcanic arc less than 100 kilometers from the observatory (Figure 1), this study was integrated by the analysis of TROPOMI data on tropospheric column densities gathered by Sentinel-5P between 2020 and 2023. Specifically, a number of target coordinates have been designated as representative of the Tyrrhenian and Ionian coasts of central Calabria, with three points (TYR1-3) specifically selected in proximity of the nearest active volcano, Stromboli (Figure 2). This is the first occurrence of an integrated analysis of surface and satellite data at LMT based on a medium-term data series.
In the analysis of daily cycles of SO2 at the site, an early morning peak (greater than 1.2 ppb) is observed between 09:00 and 16:00. Two minor peaks in the 0.3 ppb range match rush hour traffic hours. These findings are in accordance with Cristofanelli et al. (2017) [92], which first assessed the influence of vehicular traffic at the site based on the analysis of other pollutants, and D’Amico et al. (2024c) [93] which compared 2020 COVID-19 lockdown period data with the pre- and post-lockdown peaks to show the differences caused by exceptionally low anthropic activities. The daily cycle of sulfur dioxide at LMT is characterized by a 12:00-hour peak which matches the peak in sea breezes and is compatible with the transport of air masses from the west. This pattern is similar to that observed for surface ozone at LMT [79] but is narrowed down to a shorter time window. The influence of solar radiation and, in particular, local wind circulation is well-documented in Figure 3C, where the observed peaks are differentiated by wind corridor.
In the context of the Mediterranean basin, the relationship between gases present in the atmosphere, temperatures, and solar radiation has been the subject of research. In the case of ozone [113,114], research studies have found evidence of different patterns between the eastern and western Mediterranean sectors. At LMT, the complexities in the distribution of gases and aerosols are amplified by the contribution of anthropogenic sources and, with respect to sulfur dioxide, by the presence of a volcanic arc and a major volcano in 160 km radius from the observation site. The Mediterranean is recognized as a hotspot for air quality [115] and an intersection for several distinct air mass transport processes [116,117,118]. For this reason, a precise understanding of the mechanisms driving changes in observes cycles and trends are necessary.
The correlations between SO2 concentrations and wind data shown in Figure 4, 5 also indicate the presence of westerly peaks compatible with possible volcanic and shipping emissions. Many of the sulfur dioxide peaks occur at high wind speeds, which indicate air mass transport from the Tyrrhenian Sea which is likely not related to local emissions in the context of the Calabrian peninsula.
In detail, from the western sectors SO2 concentrations reach peaks above 3.4 ppb both in the case of winds below 5 m/s (breeze regimes) and in synoptic conditions with speeds can exceed the 8 m/s threshold. From the northeastern sector, winter and fall concentrations are linked to values that exceed the 5 ppb threshold under both breeze regimes and synoptic conditions where wind speeds exceed 7-8 m/s. These patterns affecting cold seasons are compatible with anthropogenic emissions from fossil fuels in nearby urban areas. Wind regimes have been found in a 2024 campaign integrating greenhouse gas, aerosol, and planetary boundary layer (PBL) data to influence several parameters at LMT [103]. The differentiation between two corridors remains one of the main characteristics of LMT.
Under the assumption that only anthropogenic emissions are subject to weekly cycles, unlike natural emissions which are not affected [99], a weekly assessment of sulfur dioxide concentrations was performed. For the first time in the history of LMT observations, a weekly analysis has also been applied to tropospheric column data. In Figure 6, surface fluctuations are linked to winter peaks falling outside weekends, a pattern that may be compatible with anthropogenic emissions, although further investigations would be required. Tropospheric column data reported in Figure 6 are also subject to weekly oscillations, but the TYR points are less affected; this is compatible with natural emissions and could therefore point to volcanic activity (in the form of fumarole and constant gaseous outputs) as responsible for these regular patterns which are not seen in LMT and ION due to increased anthropogenic influence. Maritime shipping due to the Gioia Tauro port located in the Tyrrhenian coast of Calabria could also be responsible for TYR and LMT baseline values which are higher compared to those of ION.
Multi-year variability of surface SO2 has been evaluated and the results are shown in Figure 7. For the first time in the history of LMT, a multi-year evaluation (2020-2023) has also been applied to tropospheric column data and the results are shown in Figure 8.
By differentiating surface sulfur dioxide averages by wind corridor (Figure 7), higher concentrations linked to westerly winds are prominent and are compatible with maritime shipping and volcanic activity. The implementation and evaluation of TROPOMI data (Figure 8) aimed at the TYR1-4 points in the Tyrrhenian Sea and the ION1 point in the Ionian Sea, in conjunction with tropospheric column data on the LMT site itself, constitute a completely new methodology for the assessment of local observations. LMT’s surface and column data (Figure 8C) are mostly in accordance, peaks included.
A comparison between TYR4 and ION1 was performed to assess coast-to-coast differences in tropospheric column data in the narrowest point of the entire Italian peninsula (approximately 32 kilometers between the two seas). The graph shows that TYR4, representative of near-shore Tyrrhenian conditions, yields generally higher values compared to ION1, which is its Ionian counterpart.
In Figure 8D, the TYR1-3 points – which are further away from the Tyrrhenian coast – have been analyzed in detail to highlight contributions from volcanic activity. The results indicate that the three points are not affected in the same way, with the southernmost location (TYR1) generally yielding much lower density values compared to the central (TYR2) and northern (TYR3) points.
Overall, the findings described in this study set up new fundaments and methodologies upon which future assessments of sulfur dioxide in the area could be performed to discriminate natural and anthropogenic sources. Additional methodologies such as the carbon isotope fractionation of carbon dioxide (δ13C-CO2), which is also a product of volcanic activity, could be used in source apportionment: the characteristic isotopic fingerprint of volcanic CO2, paired with surface observations of SO2, could differentiate volcanic and anthropogenic sources [119,120,121] and thus provide a clear understanding of volcanic influence over LMT observations.
5. Conclusions
Via the implementation of new methodologies that have never been applied to similar studies at the same observation site, integrated surface and tropospheric column data on sulfur dioxide (SO2) have been evaluated at the Lamezia Terme (code: LMT) WMO/GAW station in Calabria, Southern Italy.
Surface (2016-2023) and satellite (2020-2023) have provided new evidence of possible volcanic activity influence over LMT data gathering due to the presence of the Aeolian Arc and Mount Etna in a 160 kilometer radius from the station. Surface measurements, in conjunction with satellite data on select coordinates within the Tyrrhenian and Ionian seas, indicate that SO2 peaks are linked to westerly winds compatible with maritime shipping and volcanic pollution. The target coordinates selected for satellite data evaluations are based on local wind circulation, which is known to be characterized by a western-seaside sector, and a northeastern-continental sector. Local wind circulation and air mass transport is subject to winds alternating between these sectors.
Sulfur dioxide peaks linked to westerly winds from the Tyrrhenian Sea are in contrast with other observed trends at the same site, where northeastern-continental winds are generally enriched in pollutants while western-seaside winds generally yield low concentrations of compounds attributable to anthropic activity. Sulfur dioxide variability at the site is also distinct from that of surface ozone, a compound that shares similar patterns but shows different seasonal and diurnal trends. At LMT, higher sulfur dioxide concentrations are also observed in the case of synoptic conditions where wind speeds exceed the thresholds of 7-8 m/s, thus indicating the influence of air mass transport from other locations.
This research study sets new fundaments upon which future source apportionment efforts could be based on. Via the implementation of additional methodologies, the influence of volcanic activity on LMT measurements could be assessed with greater detail, thus providing new insights on the role played by active volcanoes in air mass transport within the context of a climatic hotspot such as the Mediterranean basin. Furthermore, the study shows the importance of performing multi-year evaluations of specific compounds to assess their cycles, variability, and trends with enhanced detail.
Supplementary Materials
The following supporting information can be downloaded at the website of this paper posted on Preprints.org.
Author Contributions
Conceptualization, F.D., T.L.F. and C.R.C.; methodology, F.D., T.L.F., D.G. and C.R.C.; software, F.D., T.L.F., D.G., S.S. and G.D.B.; validation, T.L.F., D.G., I.A. and C.R.C.; formal analysis, F.D., T.L.F. and D.G.; investigation, F.D., T.L.F. and D.G.; data curation, F.D., T.L.F., D.G., I.A., L.M., S.S., G.D.B. and C.R.C.; writing—original draft preparation, F.D. and T.L.F.; writing—review and editing, F.D., T.L.F., D.G., I.A., M.D.P., L.M., S.S., G.D.B. and C.R.C.; visualization, F.D., T.L.F., D.G., L.M., S.S., G.D.B.; supervision, C.R.C.; funding acquisition, C.R.C. and M.D.P. All authors have read and agreed to the published version of the manuscript.
Funding
This research was funded by AIR0000032 – ITINERIS, the Italian Integrated Environmental Research Infrastructures System (D.D. n. 130/2022 - CUP B53C22002150006) under the EU - Next Generation EU PNRR - Mission 4 “Education and Research” - Component 2: “From research to business” - Investment 3.1: “Fund for the realization of an integrated system of research and innovation infrastructures”.
Data Availability Statement
The surface datasets presented in this article are not readily available because they are part of other ongoing studies.
Acknowledgments
To be filled in later (anonymous reviewers, editors).
Conflicts of Interest
The authors declare no conflicts of interest.
References
- Eriksson, E. The yearly circulation of sulfur in nature. J. Geophys. Res. 1963, 68, 4001–4008. [Google Scholar] [CrossRef]
- Robinson, E.; Robbins, R.C. Gaseous sulfur pollutants from urban and natural sources. J. Air Pollut. Control Assoc. 1970, 20, 233–235. [Google Scholar] [CrossRef]
- Feinberg, A.; Sukhodolov, T.; Luo, B.-P.; Rozanov, E.; Winkel, L.H.E.; Peter, T.; Stenke, A. Imrpoved tropospheric and stratospheric sulfur cycle in the aerosol-chemistry-climate model SOCOL-AERv2. Geosci. Model Dev. 2019, 12, 3863–3887. [Google Scholar] [CrossRef]
- Brodowsky, C.V.; Sukhodolov, T.; Chiodo, G.; Aquila, V.; Bekki, S.; Dhomse, S.S.; Hopfner, M.; Laakso, A.; Mann, G.W.; Niemeier, U.; Pitari, G.; Quaglia, I.; Rozanov, E.; Schmidt, A.; Sekiya, T.; Tilmes, S.; Timmreck, C.; Vattioni, S.; Visioni, D.; Yu, P.; Zhu, Y.; Peter, T. Analysis of the global atmospheric background sulfur budget in a multi-model framework. Atmos. Chem. Phys. 2024, 24, 5513–5548. [Google Scholar] [CrossRef]
- Berresheim, H.; Jaeschke, W. The contribution of volcanoes to the global atmospheric sulfur budget. J. Geophys. Res. -Oceans, 3732. [Google Scholar] [CrossRef]
- Bhugwant, C.; Siéja, B.; Bessafi, M.; Staudacher, T.; Ecormier, J. Atmospheric sulfur dioxide measurements during the 2005 and 2007 eruptions of the Piton de La Fournaise volcano: Implications for human health and environmental changes. J. Volcanol. Geotherm. Res. 2009, 184, 208–224. [Google Scholar] [CrossRef]
- Mills, M.J.; Schmidt, A.; Easter, R.; Solomon, S.; Kinnison, D.E.; Ghan, S.J.; Neely, R.R. III; Marsh, D.R.; Conley, A.; Bardeen, C.G.; Gettelman, A. Global volcanic aerosol properties derived from emissions, 1990–2014, using CESM1(WACCM). J. Geophys. Res. – Atmos 2016, 121, 2332–2348. [Google Scholar] [CrossRef]
- Filippi, J.-B.; Durand, J.; Tulet, P.; Bielli, S. Multiscale Modeling of Convection and Pollutant Transport Associated with Volcanic Eruption and Lava Flow: Application to the April 2007 Eruption of the Piton de la Fournaise (Reunion Island). Atmosphere 2021, 12, 507. [Google Scholar] [CrossRef]
- Cadle, R.D. Volcanic emissions of halides and sulfur compounds to the troposphere and stratosphere. J. Geophys. Res. -Oceans 1975, 80, 1650–1652. [Google Scholar] [CrossRef]
- Bluth, G.J.S.; Schnetzler, C.C.; Krueger, A.J.; Walter, L.S. The contribution of explosive volcanism to global atmospheric sulphur dioxide concentrations. Nature 1993, 366, 327–329. [Google Scholar] [CrossRef]
- Ge, C.; Wang, J.; Carn, S.; Yang, K.; Ginoux, P.; Krotkov, N. Satellite-based global volcanic SO2 emissions and sulfate direct radiative forcing during 2005–2012. J. Geophys. Res. – Atmos 2016, 121, 3446–3464. [Google Scholar] [CrossRef]
- Schmidt, A.; Mills, M.J.; Ghan, S.; Gregory, J.M.; Allan, R.P.; Andrews, T.; Bardeen, C.G.; Conley, A.; Forster, P.M.; Gettelman, A.; Portmann, R.W.; Solomon, S.; Toon, O.B. Volcanic radiative forcing from 1979 to 2015. J. Geophys. Res. – Atmos 2018, 123, 12491–12508. [Google Scholar] [CrossRef]
- Bluth, G.J.S.; Doiron, S. D:; Schnetzler, C.C.; Krueger, A.J.; Walter, L.S. Global tracking of the SO2 clouds from the June, 1991 Mount Pinatubo eruptions. Geophys. Res. Lett. 1992, 19, 151–154. [Google Scholar] [CrossRef]
- Mankin, W.G.; Coffey, M.T.; Goldman, A. Airborne observations of SO2, HCl, and O3 in the stratospheric plume of the Pinatubo Volcano in July 1992. Geophys. Res. Lett. 1992, 19, 179–182. [Google Scholar] [CrossRef]
- Goldman, A.; Murcray, F.J.; Rinsland, C.P.; Blatherwick, R.D.; David, S.J.; Murcray, F:H. ; Murcray, D.G. Mt. Pinatubo SO2 column measurements from Mauna Loa. Geophys. Res. Lett. 1992, 19, 183–186. [Google Scholar] [CrossRef]
- Baran, A.J.; Foot, J.S.; Dibben, P.C. Satellite detection of volcanic sulphuric acid aerosol. Geophys. Res. Lett. 1993, 20, 1799–1801. [Google Scholar] [CrossRef]
- Guo, S.; Bluth, G.J.S.; Rose, W.I.; Watson, I.M.; Prata, A.J. Re-evaluation of SO2 release of the 15 June 1991 Pinatubo eruption using ultraviolet and infrared satellite sensors. Geochem. Geophys. Geosyst. 2004, 5, Q04001. [Google Scholar] [CrossRef]
- Mishra, M.K.; Hoffmann, L.; Thapliyal, P.K. Investigations on the Global Spread of the Hunga Tonga-Hunga Ha’apai Volcanic Eruption Using Space-Based Observations and Lagrangian Transport Simulations. Atmosphere 2022, 13, 2055. [Google Scholar] [CrossRef]
- Sun, Q.; Lu, T.; Li, D.; Xu, J. The Impact of the Hunga Tonga–Hunga Ha’apai Volcanic Eruption on the Stratospheric Environment. Atmosphere 2024, 15, 483. [Google Scholar] [CrossRef]
- Clinton, N.E.; Gong, P.; Scott, K. Quantification of pollutants emitted from very large wildland fires in Southern California, USA. Atmos. Environ. 2006, 40, 3686–3695. [Google Scholar] [CrossRef]
- Granier, C.; Bessagnet, B.; Bond, T.; D’Angiola, A.; Denier van der Gon, H.; Frost, G.J.; Heil, A.; Kaiser, J.W.; Kinne, S.; Klimont, Z.; Kloster, S.; Lamarque, J.-F.; Masui, T.; Meleux, F.; Mieville, A.; Ohara, T.; Raut, J.-C.; Riahi, K.; Schultz, M.G.; Smith, S.J.; Thompson, A.; van Aardenne, J.; van der Werf, G.R.; van Vuuren, D.P. Evolution of anthropogenic and biomass burning emissions of air pollutants at global and regional scales during the 1980–2010 period. Clim. Change 2011, 109, 163. [Google Scholar] [CrossRef]
- Urbanski, S. Wildland fire emissions, carbon, and climate: Emission factors. For. Ecol. Manag. 2014, 317, 51–60. [Google Scholar] [CrossRef]
- He, C:; Miljevic, B. ; Crilley, L.R.; Surawski, N.C.; Bartsch, J.; Salimi, F.; Uhde, E.; Schnelle-Kreis, J.; Orasche, J.; Ristovski, Z.; Ayoko, G.A.; Zimmermann, R. Characterisation of the impact of open biomass burning on urban air quality in Brisbane, Australia. Environ. Int. 2016, 91, 230–242. [Google Scholar] [CrossRef]
- Rickly, P.S.; Guo, H.; Campuzano-Jost, P.; Jimenez, J.L.; Wolfe, G.M.; Bennett, R.; Bourgeois, I.; Crounse, J.D.; Dibb, J.E.; DiGangi, J.P.; Diskin, G.S.; Dollner, M.; Gargulinski, E.M.; Hall, S.R.; Halliday, H.S.; Hanisco, T.F.; Hannun, R.E.; Liao, J.; Moore, R.; Nault, B.A.; Nowak, J.B.; Peischl, J.; Robinson, C.E.; Ryerson, T.; Sanchez, K.J.; Schöberl, M.; Soja, A.J.; St. Clair, J.M.; Thornhill, K.L.; Ullmann, K.; Wennberg, P.O.; Weinzierl, B.; Wiggins, E.B.; Winstead, E.L.; Rollins, A.W. Emission factors and evolution of SO2 measured from biomass burning in wildfires and agricultural fires. Atmos. Chem. Phys. 2022, 22, 15603–15620. [Google Scholar] [CrossRef]
- Ning, X.; Li, J.; Zhuang, P.; Lai, S.; Zheng, X. Wildfire combustion emission inventory in Southwest China (2001-2020) based on MODIS fire radiative energy data. Atmos. Pollut. Res. 2024, 15, 102279. [Google Scholar] [CrossRef]
- Rollins, A.W.; Thornberry, T.D.; Watts, L.A.; Yu, P.; Rosenlof, K.H.; Mills, M.; Baumann, E.; Giorgetta, F.R.; Bui, T.V.; Höpfner, M.; Walker, K.A.; Boone, C.; Bernath, P.F.; Colarco, P.R.; Newman, P.A.; Fahey, D.W.; Gao, R.S. The role of sulfur dioxide in stratospheric aerosol formation evaluated by using in situ measurements in the tropical lower stratosphere. Geophys. Res. Lett. 2017, 44, 4280–4286. [Google Scholar] [CrossRef]
- Guzewich, S.D.; Oman, L.D.; Richardson, J.A.; Whelley, P.L.; Bastelberger, S.T.; Young, K.E.; Bleacher, J.E.; Fauchez, T.J.; Kopparapu, R.K. Volcanic Climate Warming Through Radiative and Dynamical Feedbacks of SO2 Emissions. Geophys. Res. Lett. 2022, 49, e2021GL096612. [Google Scholar] [CrossRef]
- Yu, P.; Portmann, R.W.; Peng, Y.; Liu, C.-C.; Zhu, Y.; Asher, E.; Bai, Z.; Lu, Y.; Bian, J.; Mills, M.; Schmidt, A.; Rosenlof, K.H.; Toon, O.B. Radiative forcing from the 2024–2022 volcanic and wildfire injections. Geophys. Res. Lett. 2023, 50, e2023GL103791. [Google Scholar] [CrossRef]
- Sheng, J.-X.; Weisenstein, D.K.; Luo, B.-P.; Rozanov, E.; Stenke, A.; Anet, J.; Bingemer, H.; Peter, T. Global atmospheric sulfur budget under volcanically quiescent conditions: Aerosol-chemistry-climate model predictions and validation. J. Geophys. Res. - Atmos. 2015, 120, 256–276. [Google Scholar] [CrossRef]
- Klimont, Z.; Smith, S.J.; Cofala, J. The last decade of global anthropogenic sulfur dioxide: 2000–11 emissions. Environ. Res. Lett. 2013, 8, 014003. [Google Scholar] [CrossRef]
- Asghar, U.; Rafiq, S.; Anwar, A.; Iqbal, T.; Ahmed, A.; Jamil, F.; Khurram, M.S.; Akbar, M.M.; Farooq, A.; Shah, N.S.; Park, Y.-K. Review on the progress in emission control technologies for the abatement of CO2, SOx and NOx from fuel combustion. J. Environ. Chem. Eng. 2021, 9, 106064. [Google Scholar] [CrossRef]
- Fukusaki, Y.; Umehara, M.; Kousa, Y.; Inomata, Y.; Nakai, S. Investigation of Air Pollutants Related to the Vehicular Exhaust Emissions in the Kathmandu Valley, Nepal. Atmosphere 2021, 12, 1322. [Google Scholar] [CrossRef]
- Wallington, T.J.; Anderson, J.E.; Dolan, R.H.; Winkler, S.L. Vehicle Emissions and Urban Air Quality: 60 Years of Progress. Atmosphere 2022, 13, 650. [Google Scholar] [CrossRef]
- McDonald-Buller, E.; McGaughey, G.; Grant, J.; Shah, T.; Kimura, Y.; Yarwood, G. Emissions and Air Quality Implications of Upstream and Midstream Oil and Gas Operations in Mexico. Atmosphere 2021, 12, 1696. [Google Scholar] [CrossRef]
- Abdul-Wahab, S.; Ali, S.; Sardar, S.; Irfan, N. Impacts on Ambient Air Quality Due to Flaring Activities in One of Oman’s Oilfields. Arch. Environ. Occup. Health 2012, 67, 3–14. [Google Scholar] [CrossRef]
- Dore, A.; Vieno, M.; Tang, Y.; Dragosits, U.; Dosio, A.; Weston, K.; Sutton, M. Modelling the atmospheric transport and deposition of sulphur and nitrogen over the United Kingdom and assessment of the influence of SO2 emissions from international shipping. Atmos. Environ. 2007, 41, 2355–2367. [Google Scholar] [CrossRef]
- Berg, N.; Mellqvist, J.; Jalkanen, J.-P.; Balzani, J. Ship emissions of SO2 and NO2: DOAS measurements from airborne platforms. Atmos. Meas. Tech. 2012, 5, 1085–1098. [Google Scholar] [CrossRef]
- Spengler, T.; Tovar, B. Environmental Valuation of In-Port Shipping Emissions per Shipping Sector on Four Spanish Ports. Mar. Pollut. Bull. 2022, 178, 113589. [Google Scholar] [CrossRef] [PubMed]
- Fuentes García, G.; Echeverría, R.S.; Reynoso, A.G.; Baldasano Recio, J.M.; Rueda, V.M.; Retama Hernández, A.; Kahl, J.D.W. Sea Port SO2 Atmospheric Emissions Influence on Air Quality and Exposure at Veracruz, Mexico. Atmosphere 2022, 13, 1950. [Google Scholar] [CrossRef]
- Gamal, G.; Abdeldayem, O.M.; Elattar, H.; Hendy, S.; Gabr, M.E.; Mostafa, M.K. Remote Sensing Surveillance of NO2, SO2, CO, and AOD along the Suez Canal Pre- and Post-COVID-19 Lockdown Periods and during the Blockage. Sustainability 2023, 15, 9362. [Google Scholar] [CrossRef]
- Paternina-Arboleda, C.D.; Agudelo-Castañeda, D.; Voß, S.; Das, S. Towards Cleaner Ports: Predictive Modeling of Sulfur Dioxide Shipping Emissions in Maritime Facilities Using Machine Learning. Sustainability 2023, 15, 12171. [Google Scholar] [CrossRef]
- Ballini, F.; Bozzo, R. Air Pollution from Ships in Ports: The Socio-Economic Benefit of Cold-Ironing Technology. Res. Transp. Bus. Manag. 2015, 17, 92–98. [Google Scholar] [CrossRef]
- Isakson, J.; Persson, T.A.; Lindgren, E.S. Identification and assessment of ship emissions and their effects in the harbour of Göteborg, Sweden. Atmos. Environ. 2001, 35, 3659–3666. [Google Scholar] [CrossRef]
- Anastasopolos, A.T.; Sofowote, U.M.; Hopke, P.K.; Rouleau, M.; Shin, T.; Dheri, A.; Peng, H.; Kulka, R.; Gibson, M.D.; Farah, P.-M.; Sundar, N. Air quality in Canadian port cities after regulation of low-sulphur marine fuel in the North American Emissions Control Area. Sci. Total Environ. 2021, 791, 147949. [Google Scholar] [CrossRef] [PubMed]
- Miake-Lye, R.C.; Anderson, B.E.; Cofer, W.R.; Wallio, H.A.; Nowicki, G.D.; Ballenthin, J.O.; Hunton, D.E.; Knighton, W.B.; Miller, T.M.; Seeley, J.V.; Viggiano, A.A. SOx oxidation and volatile aerosol in aircraft exhaust plumes depend on fuel sulfur content. Geophys. Res. Lett. 1998, 25, 1677–1680. [Google Scholar] [CrossRef]
- Fan, W.; Sun, Y.; Zhu, T.; Wen, Y. Emissions of HC, CO, NOx, CO2, and SO2 from civil aviation in China in 2010. Atmos. Environ. 2012, 56, 52–57. [Google Scholar] [CrossRef]
- Zhou, Y.; Jiao, Y.; Lang, J.; Chen, D.; Huang, C.; Wei, P.; Li, S.; Cheng, S. Improved estimation of air pollutant emissions from landing and takeoff cycles of civil aircraft in China. Environ. Pollut. 2019, 249, 463–471. [Google Scholar] [CrossRef]
- Kärcher, B.; Hirschberg, M.; Fabian, P. Small-scale chemical evolution of aircraft exhaust species at cruising altitudes. J. Geophys. Res. -Atmos 1996, 101, 15169–15190. [Google Scholar] [CrossRef]
- An, H.; Wang, Y.; Wang, Y.; Liu, J.; Tang, X.; Yi, H. Civil aviation emissions in China in 2019: Characteristics and abatement potential. J. Environ. Sci. 2025, 151, 225–237. [Google Scholar] [CrossRef]
- Schumann, U.; Arnold, F.; Busen, R.; Curtius, J.; Kärcher, B.; Kiendler, A.; Petzold, A.; Schlager, H.; Schröder, F.; Wohlfrom, K.-H. Influence of fuel sulfur on the composition of aircraft exhaust plumes: The experiments SULFUR 1–7. J. Geophys. Res. -Atmos. 2002, 107, AAC 2-1–AAC 2-27. [Google Scholar] [CrossRef]
- Voitsekhovskaya, O.K.; Kashirskii, D.E.; Egorov, O.V. Spectroscopic support of laser remote sensing of the sulfur dioxide gas in the jet of engine exhaust gases. Russ. Phys. J. 2013, 56, 473–482. [Google Scholar] [CrossRef]
- Dischl, R.; Sauer, D.; Voigt, C.; Harlaß, T.; Sakellariou, F.; Märkl, R.; Schumann, U.; Scheibe, M.; Kaufmann, S.; Roiger, A.; Dörnbrack, A.; Renard, C.; Gauthier, M.; Swann, P.; Madden, P.; Luff, D.; Johnson, M.; Ahrens, D.; Sallinen, R.; Schripp, T.; Eckel, G.; Bauder, U.; Le Clercq, P. Measurements of particle emissions of an A350-941 burning 100% sustainable aviation fuels in cruise. Atmos. Chem. Phys. 2024, 24, 11255–11273. [Google Scholar] [CrossRef]
- Meetham, A.R. Natural removal of pollution from the atmosphere. Q. J. R. Meteorol. Soc. 1950, 76, 359–371. [Google Scholar] [CrossRef]
- Rodhe, H. Budgets and turn-over times of atmospheric sulfur compounds. Atmos. Environ. 1978, 12, 671–680. [Google Scholar] [CrossRef]
- Lee, C.; Martin, R.V.; van Donkelaar, A.; Lee, H.; Dickerson, R.R.; Hains, J.C.; Krotkov, N.; Richter, A.; Vinnikov, K.; Schwab, J.J. SO2 emissions and lifetimes: Estimates from inverse modeling using in situ and global, space-based (SCIAMACHY and OMI) observations. J. Geophys. Res. – Atmos 2011, 116, D06304. [Google Scholar] [CrossRef]
- Renuka, K.; Gadhavi, H.; Jayaraman, A.; Bhaskara Rao, S.V.; Lal, S. Study of mixing ratios of SO2 in a tropical rural environment in south India. J. Earth Syst. Sci. 2020, 129, 104. [Google Scholar] [CrossRef]
- Garland, J.A. Dry and wet removal of sulphur from the atmosphere. Atmos. Environ. 1978, 12, 349–362. [Google Scholar] [CrossRef]
- Charlson, R.; Lovelock, J.; Andreae, M.; Warren, S.G. Oceanic phytoplankton, atmospheric sulphur, cloud albedo and climate. Nature 1987, 326, 655–661. [Google Scholar] [CrossRef]
- Khan, R.R.; Siddiqui, M. Review on effects of particulates; sulfur dioxide and nitrogen dioxide on human health. Int. Res. J. Environ. Sci. 2014, 3, 70–73. [Google Scholar]
- Greenberg, N.; Carel, R.S.; Derazne, E.; Tiktinsky, A.; Tzur, D.; Portnov, B.A. Modeling long-term effects attributed to nitrogen dioxide (NO2) and sulfur dioxide (SO2) exposure on asthma morbidity in a nationwide cohort in Israel. J. Toxicol. Environ. Health 2017, 80, 326–337. [Google Scholar] [CrossRef] [PubMed]
- Szyszkowicz, M. Air pollution and emergency department visits for depression in Edmonton, Canada. Int. J. Occup. Med. Environ. Health 2007, 20, 241–245. [Google Scholar] [CrossRef]
- Shin, J.; Park, J.Y.; Choi, J. Long-term exposure to ambient air pollutants and mental health status: A nationwide population-based cross-sectional study. PLOS ONE 2018, 13, e0195607. [Google Scholar] [CrossRef] [PubMed]
- Lelieveld, J.; Evans, J.S.; Fnais, M.; Giannadaki, D.; Pozzer, A. The contribution of outdoor air pollution sources to premature mortality on a global scale. Nature 2015, 525, 367–371. [Google Scholar] [CrossRef]
- Hemminki, K.; Niemi, M.L. Community study of spontaneous abortions: relation to occupation and air pollution by sulfur dioxide, hydrogen sulfide, and carbon disulfide. Int. Arch. Occup. Environ. Health 1982, 51, 55–63. [Google Scholar] [CrossRef] [PubMed]
- Xu, X.; Ding, H.; Wang, X. Acute effects of total suspended particles and sulfur dioxides on preterm delivery: a community-based cohort study. Arch. Environ. Health 1995, 50, 407–415. [Google Scholar] [CrossRef]
- Lin, C.; Li, C.; Yang, G.; Mao, I. Association between maternal exposure to elevated ambient sulfur dioxide during pregnancy and term low birth weight. Environ. Res. 2004, 96, 41–50. [Google Scholar] [CrossRef]
- Enkhmaa, D.; Warburton, N.; Javzandulam, B.; Uyanga, J.; Khishigsuren, Y.; Lodoysamba, S.; Enkhtur, S.; Warburton, D. Seasonal ambient air pollution correlates strongly with spontaneous abortion in Mongolia. BMC Pregnancy Childbirth 2014, 14, 1–7. [Google Scholar] [CrossRef] [PubMed]
- Smith, S.J.; van Aardenne, J.; Klimont, Z.; Andres, R.J.; Volke, A.; Arias, S.D. Anthropogenic sulfur dioxide emissions: 1850–2005. Atmos. Chem. Phys. 2011, 11, 1101–1116. [Google Scholar] [CrossRef]
- Zhou, Z.; Ye, X.; Ge, X. The Impacts of Technical Progress on Sulfur Dioxide Kuznets Curve in China: A Spatial Panel Data Approach. Sustainability 2017, 9, 674. [Google Scholar] [CrossRef]
- Zhang, Y.-C.; Si, D.-K.; Zhao, B. The Convergence of Sulphur Dioxide (SO2) Emissions Per Capita in China. Sustainability 2020, 12, 1781. [Google Scholar] [CrossRef]
- Cheng, B.; Dai, H.; Wang, P.; Xie, Y.; Chen, L.; Zhao, D.; Masui, T. Impacts of low-carbon power policy on carbon mitigation in Guangdong Province, China. Energy Policy 2016, 88, 515–527. [Google Scholar] [CrossRef]
- Li, W.; Xiang, B.; Zhang, R.; Li, G.; Wang, Z.; Su, B.; Eric, T.M. Impact of Resource-Based Economic Transformation Policy on Sulfur Dioxide Emissions: A Case Study of Shanxi Province. Sustainability 2022, 14, 8253. [Google Scholar] [CrossRef]
- Liu, H.; Zhong, Y.; Zhang, C. Energy Costs of Reducing Industrial Sulfur Dioxide Emissions in China. Sustainability 2021, 13, 10726. [Google Scholar] [CrossRef]
- Altamira-Colado, E.; Cuevas-González, D.; Reyna, M.A.; García-Vázquez, J.P.; Avitia, R.L.; Osornio-Vargas, A.R. Drone-Assisted Particulate Matter Measurement in Air Monitoring: A Patent Review. Atmosphere 2024, 15, 515. [Google Scholar] [CrossRef]
- Prikaz, M.; Fang, C.; Dash, S.; Wang, J. Origin and Background Estimation of Sulfur Dioxide in Ulaanbaatar, 2017. Environments 2018, 5, 136. [Google Scholar] [CrossRef]
- Al-Hurban, A.; Khader, S.; Alsaber, A.; Pan, J. Air Quality Assessment in the State of Kuwait during 2012 to 2017. Atmosphere 2021, 12, 678. [Google Scholar] [CrossRef]
- Liakakou, E.; Fourtziou, L.; Paraskevopoulou, D.; Speyer, O.; Lianou, M.; Grivas, G.; Myriokefalitakis, S.; Mihalopoulos, N. High-Resolution Measurements of SO2, HNO3 and HCl at the Urban Environment of Athens, Greece: Levels, Variability and Gas to Particle Partitioning. Atmosphere 2022, 13, 218. [Google Scholar] [CrossRef]
- D’Amico, F.; Ammoscato, I.; Gullì, D.; Avolio, E.; Lo Feudo, T.; De Pino, M.; Cristofanelli, P.; Malacaria, L.; Parise, D.; Sinopoli, S.; De Benedetto, G.; Calidonna, C.R. Integrated analysis of methane cycles and trends at the WMO/GAW station of Lamezia Terme (Calabria, Southern Italy). Atmosphere 2024, 15, 946. [Google Scholar] [CrossRef]
- D’Amico, F.; Gullì, D.; Lo Feudo, T.; Ammoscato, I.; Avolio, E.; De Pino, M.; Cristofanelli, P.; Busetto, M.; Malacaria, L.; Parise, D.; Sinopoli, S.; De Benedetto, G.; Calidonna, C.R. Cyclic and multi-year characterization of surface ozone at the WMO/GAW coastal station of Lamezia Terme (Calabria, Southern Italy): implications for the local environment, cultural heritage, and human health. Environments 2024, 11, 227. [Google Scholar] [CrossRef]
- Gattuso, D.; Pellicanò, D.; Cassone, G. Policies and Models for Efficient and Eco-sustainable Ports. Open Transplant J. 2023, 17, e26671212265181. [Google Scholar] [CrossRef]
- Weibring, P.; Swartling, J.; Edner, H.; Svanberg, S.; Caltabiano, T.; Condarelli, D.; Cecchi, G.; Pantani, L. Optical monitoring of volcanic sulphur dioxide emissions–comparison between four different remote-sensing spectroscopic techniques. Opt. Lasers Eng. 2002, 37, 267–284. [Google Scholar] [CrossRef]
- Haulet, R.; Zettwoog, P.; Sabroux, J. Sulphur dioxide discharge from Mount Etna. Nature 1977, 268, 715–717. [Google Scholar] [CrossRef]
- Malinconico, L. Fluctuations in SO2 emission during recent eruptions of Etna. Nature 1979, 278, 43–45. [Google Scholar] [CrossRef]
- Jaeschke, W.; Berresheim, H. ; Georgii, H-W. Sulfur emissions from Mt. Etna. J. Geophys. Res. - Oceans 1982, 87, 7253–7261. [Google Scholar] [CrossRef]
- de Ronde, C.E.J.; Massoth, G.J.; Baker, E.T.; Lupton, J.E. Submarine hydrothermal venting related to volcanic arcs. In: Volcanic, Geothermal, and Ore-Forming Fluids, vol. 10, Giggenbach Memorial Volume, edited by S. F. Simmons, and I. J. Graham, pp. 91–110, Soc. of Econ. Geol., Littleton, Colo, 2003.
- Allard, P.; Carbonnelle, J.; Métrich, N.; Loyer, H.; Zettwoog, P. Sulphur output and magma degassing budget of Stromboli volcano. Nature 1994, 368, 326–330. [Google Scholar] [CrossRef]
- Barnie, T.; Bombrun, M.; Burton, M.R.; Harris, A.; Sawyer, G. Quantification of gas and solid emissions during Strombolian explosions using simultaneous sulphur dioxide and infrared camera observations. J. Volcanol. Geotherm. Res. 2015, 300, 167–174. [Google Scholar] [CrossRef]
- McGonigle, A.J.S.; Oppenheimer, C.; Hayes, A.R.; Galle, B.; Edmonds, M.; Caltabiano, T.; Salerno, G.; Burton, M.; Mather, T.A. Suplhur dioxide fluxes from Mount Etna, Vulcano, and Stromboli measured with an automated scanning ultraviolet spectrometer. J. Geophys. Res. -Solid Earth 2003, 108, 2455. [Google Scholar] [CrossRef]
- Aiuppa, A.; Inguaggiato, S.; McGonigle, A.J.S.; O’Dwyer, M.; Oppenheimer, C.; Padgett, M.J.; Rouwet, D.; Valenza, M. H2S fluxes from Mt. Etna, Stromboli, and Vulcano (Italy) and implication for the sulfur budget at volcanoes. Geochim. Cosmochim. Acta 2005, 69, 1861–1871. [Google Scholar] [CrossRef]
- D’Alessandro, W.; Aiuppa, A.; Bellomo, S.; Brusca, L.; Calabrese, S.; Kyriakopoulos, K.; Liotta, M.; Longo, M. Sulphur-gas concentrations in volcanic and geothermal areas in Italy and Greece: Characterising potential human exposures and risks. J. Geochem. Explor. 2013, 131, 1–13. [Google Scholar] [CrossRef]
- Gurrieri, S.; Liuzzo, M.; Giuffrida, G.; Boudoire, G. The first observations of CO2 and CO2/SO2 degassing variations recorded at Mt. Etna during the 2018 eruptions followed by three strong earthquakes. Ital. J. Geosci. 2021, 140, 95–106. [Google Scholar] [CrossRef]
- Cristofanelli, P.; Busetto, M.; Calzolari, F.; Ammoscato, I.; Gullì, D.; Dinoi, A.; Calidonna, C.R.; Contini, D.; Sferlazzo, D.; Di Iorio, T.; Piacentino, S.; Marinoni, A.; Maione, M.; Bonasoni, P. Investigation of reactive gases and methane variability in the coastal boundary layer of the central Mediterranean basin. Elem. Sci. Anth. 2017, 5, 12. [Google Scholar] [CrossRef]
- D’Amico, F.; Ammoscato, I.; Gullì, D.; Avolio, E.; Lo Feudo, T.; De Pino, M.; Cristofanelli, P.; Malacaria, L.; Parise, D.; Sinopoli, S.; De Benedetto, G.; Calidonna, C.R. Trends in CO, CO2, CH4, BC, and NOx during the first 2020 COVID-19 lockdown: source insights from the WMO/GAW station of Lamezia Terme (Calabria, Southern Italy). Sustainability 2024, 16, 8229. [Google Scholar] [CrossRef]
- Federico, S.; Pasqualoni, L.; De Leo, L.; Bellecci, C. A study of the breeze circulation during summer and fall 2008 in Calabria, Italy. Atmos. Res. 2010, 97, 1–13. [Google Scholar] [CrossRef]
- Federico, S.; Pasqualoni, L.; Sempreviva, A.M.; De Leo, L.; Avolio, E.; Calidonna, C.R.; Bellecci, C. The seasonal characteristics of the breeze circulation at a coastal Mediterranean site in South Italy. Adv. Sci. Res. 2010, 4, pgs–47. [Google Scholar] [CrossRef]
- NOAA National Geophysical Data Center. ETOPO1 1 Arc-Minute Global Relief Model. NOAA National Centers for Environmental Information, 2009. https://www.ncei.noaa.gov/access/metadata/landing-page/bin/iso?id=gov.noaa.ngdc.mgg.dem:316 (accessed 13 November 2024).
- Amante, C.; Eakins, B.W. ETOPO1 1 Arc-Minute Global Relief Model: Procedures, Data Sources and Analysis. NOAA Technical Memorandum NESDIS NGDC-24. National Geophysical Data Center, 2009. (accessed 13 November 2024). [CrossRef]
- European Commission. European Marine Observation and Data Network (EMODnet). https://emodnet.ec.europa.eu/en/bathymetry. (accessed on 13 November 2024).
- D’Amico, F.; Ammoscato, I.; Gullì, D.; Avolio, E.; Lo Feudo, T.; De Pino, M.; Cristofanelli, P.; Malacaria, L.; Parise, D.; Sinopoli, S.; De Benedetto, G.; Calidonna, C.R. Anthropic-induced variability of greenhouse gases and aerosols at the WMO/GAW coastal site of Lamezia Terme (Calabria, Southern Italy): towards a new method to assess the weekly distribution of gathered data. Sustainability 2024, 16, 8175. [Google Scholar] [CrossRef]
- Gullì, D.; Avolio, E.; Calidonna, C.R.; Lo Feudo, T.; Torcasio, R.C.; Sempreviva, A.M. Two years of wind-lidar measurements at an Italian Mediterranean Coastal Site. In European Geosciences Union General Assembly 2017, EGU – Division Energy, Resources & Environment, ERE. Energy Procedia 2017, 125, pgs–214. [Google Scholar] [CrossRef]
- Avolio, E.; Federico, S.; Miglietta, M.M.; Lo Feudo, T.; Calidonna, C.R.; Sempreviva, A.M. Sensitivity analysis of WRF model PBL schemes in simulating boundary-layer variables in southern Italy: An experimental campaign. Atmos. Res. 2017, 192, 58–71. [Google Scholar] [CrossRef]
- Lo Feudo, T.; Calidonna, C.R.; Avolio, E.; Sempreviva, A.M. Study of the Vertical Structure of the Coastal Boundary Layer Integrating Surface Measurements and Ground-Based Remote Sensing. Sensors 2020, 20, 6516. [Google Scholar] [CrossRef]
- D’Amico, F.; Calidonna, C.R.; Ammoscato, I.; Gullì, D.; Malacaria, L.; Sinopoli, S.; De Benedetto, G.; Lo Feudo, T. Peplospheric influences on local greenhouse gas and aerosol variability at the Lamezia Terme WMO/GAW regional station in Calabria, Southern Italy: a multiparameter investigation. Sustainability 2024, 16, 10175. [Google Scholar] [CrossRef]
- Malacaria, L.; Parise, D.; Lo Feudo, T.; Avolio, E.; Ammoscato, I.; Gullì, D.; Sinopoli, S.; Cristofanelli, P.; De Pino, M.; D’Amico, F.; Calidonna, C.R. Multiparameter detection of summer open fire emissions: the case study of GAW regional observatory of Lamezia Terme (Southern Italy). Fire 2024, 7, 198. [Google Scholar] [CrossRef]
- D’Amico, F.; De Benedetto, G.; Malacaria, L.; Sinopoli, S.; Calidonna, C.R.; Gullì, D.; Ammoscato, I.; Lo Feudo, T. Surface and tropospheric column observations of combustion tracers during the 2021 wildfire crisis in the central Mediterranean: insights from the WMO/GAW station of Lamezia Terme in Calabria, Southern Italy. Under review at MDPI Gases.
- Calidonna, C.R.; Avolio, E.; Gullì, D.; Ammoscato, I.; De Pino, M.; Donateo, A.; Lo Feudo, T. Five Years of Dust Episodes at the Southern Italy GAW Regional Coastal Mediterranean Observatory: Multisensors and Modeling Analysis. Atmosphere 2020, 11, 456. [Google Scholar] [CrossRef]
- Veefkind, J.P.; Aben, I.; McMullan, K.; Forster, H.; de Vries, J.; Otter, G.; Claas, J.; Eskes, H.J.; de Haan, J.F.; Kleipool, Q.; van Weele, M.; Hasekamp, O.; Hoogeveen, R.; Landgraf, J.; Snel, R.; Tol, P.; Ingmann, P.; Voors, R.; Kruizinga, B.; Vink, R.; Visser, H.; Levelt, P.F. TROPOMI on the ESA Sentinel-5 Precursor: A GMES mission for global observations of the atmospheric composition for climate, air quality and ozone layer applications. Remote Sens. Environ. 2012, 120, 70–83. [Google Scholar] [CrossRef]
- Eskes, H.; van Geffen, J.; Boersma, F.; Eichmann, K.-U.; Apituley, A.; Pedergnana, M.; Sneep, M.; Veefkind, J.P.; Loyola, D. Sentinel-5 Precursor/TROPOMI Level 2 Product User Manual Nitrogen dioxide; Royal Netherlands Meteorological Institute: De Bilt, The Netherlands, 2022. [Google Scholar]
- Van Geffen, J.H.G.M.; Eskes, H.J.; Boersma, K.F.; Veefkind, J.P. TROPOMI ATBD of the Total and Tropospheric NO2 Data Products; Royal Netherlands Meteorological Institute: De Bilt, The Netherlands, 2022. [Google Scholar]
- Copernicus Sentinel-5P (processed by ESA), 2020, TROPOMI Level 2 Sulphur Dioxide Total Column. Version 02. European Space Agency. (accessed on 13 November 2024). [CrossRef]
- Apituley, A.; Pedergnana, M.; Sneep, M.; Veefkind, J.P.; Loyola, D.H.O. Sentinel-5 Precursor/TROPOMI Level 2 Product User Manual Methane; Royal Netherlands Meteorological Institute: De Bilt, The Netherlands, 2022. [Google Scholar]
- Barrese, E.; Valentini, M.; Scarpelli, M.; Samele, P.; Malacaria, L.; D’Amico, F.; Lo Feudo, T. Assessment of formaldehyde’s impact on indoor environments and human health via the integration of satellite tropospheric total columns and outdoor ground sensors. Sustainability 2024, 16, 9669. [Google Scholar] [CrossRef]
- Gerasopoulos, E.; Kouvarakis, G.; Vrekoussis, M.; Donoussis, C.; Mihalopoulos, N.; Kanakidou, M. Photochemical ozone production in the Eastern Mediterranean. Atmos. Environ. 2006, 40, 3057–3069. [Google Scholar] [CrossRef]
- Kalabokas, P.D.; Mihalopoulos, N.; Ellul, R.; Kleanthous, S.; Repapis, C.C. An investigation of the meteorological and photochemical factors influencing the background rural and marine surface ozone levels in the Central and Eastern Mediterranean. Atmos. Environ. 2008, 42, 7894–7906. [Google Scholar] [CrossRef]
- Monks, P.S.; Granier, C.; Fuzzi, S.; Stohl, A.; Williams, M.L.; Akimoto, H.; Amann, M.; Baklanov, A.; Baltensperger, U.; Bey, I.; Blake, N.; Blake, R.S.; Carslaw, K.; Cooper, O.R.; Dentener, F.; Fowler, D.; Fragkou, E.; Frost, G.J.; Generoso, S.; Ginoux, P.; Grewe, V.; Guenther, A.; Hansson, H.C.; Henne, S.; Hjorth, J.; Hofzumahaus, A.; Huntrieser, H.; Isaksen, I.S.A.; Jenkin, M.E.; Kaiser, J.; Kanakidou, M.; Klimont, Z.; Kulmala, M.; Laj, P.; Lawrence, M.G.; Lee, J.D.; Liousse, C.; Maione, M.; McFiggans, G.; Metzger, A.; Mieville, A.; Moussiopoulos, N.; Orlando, J.J.; O’Dowd, C.D.; Palmer, P.I.; Parrish, D.D.; Petzold, A.; Platt, U.; Pöschl, U.; Prévôt, A.S.H.; Reever, C.E.; Reimann, S.; Rudich, Y.; Sellegri, K.; Steinbrecher, R.; Simpson, D.; ten Brink, H.; Theloke, J.; van der Werf, G.R.; Vautard, R.; Vestreng, V.; Vlachokostas, Ch.; von Glasow, R. Atmospheric composition change – global and regional air quality. Atmos. Environ. 2009, 43, 5268–5350. [Google Scholar] [CrossRef]
- Lelieveld, J.; Berresheim, H.; Borrmann, S.; Crutzen, P.J.; Dentener, F.J.; Fischer, H.; Feichter, J.; Flatau, P.J.; Heland, J.; Holzinger, R.; Korrmann, R.; Lawrence, M.G.; Levin, Z.; Markowicz, K.M.; Mihalopoulos, N.; Minikin, A.; Ramanathan, V.; Reus, M.D.; Roelofs, G.J.; Scheeren, H.A.; Sciare, J.; Schlager, H.; Schultz, M.; Siegmund, P.; Steil, B.; Stephanou, E.G.; Stier, P.; Traub, M.; Warneke, C.; Williams, J.; Ziereis, H. Global Air Pollution Crossroads over the Mediterranean. Science 2002, 298, 794–799. [Google Scholar] [CrossRef]
- Henne, S.; Furger, M.; Nyeki, S.; Steinbacher, M.; Neininger, B.; de Wekker, S.F.J.; Dommen, J.; Spichtinger, N.; Stohl, A.; Prévôt, A.S.H. Quantification of topographic venting of boundary layer air to the free troposphere. Atmos. Chem. Phys. 2004, 4, 497–509. [Google Scholar] [CrossRef]
- Duncan, B.N.; West, J.J.; Yoshida, Y.; Fiore, A.M.; Ziemke, J.R. The influence of European pollution on ozone in the Near East and northern Africa. Atmos. Chem. Phys. 2008, 8, 2267–2283. [Google Scholar] [CrossRef]
- Rizzo, A.L.; Liuzzo, M.; Ancellin, M.A.; Jost, H.J. Real-time measurements of δ13C, CO2 concentration, and CO2/SO2 in volcanic plume gases at Mount Etna, Italy, over 5 consecutive days. Chem. Geol. 2015, 411, 182–191. [Google Scholar] [CrossRef]
- Fischer, T.P.; Lopez, T.M. First airborne samples of a volcanic plume for δ13C of CO2 determinations. Geophys. Res. Lett. 2016, 43, 3272–3279. [Google Scholar] [CrossRef]
- Di Martino, R.M.R.; Gurrieri, S. Quantification of the Volcanic Carbon Dioxide in the Air of Vulcano Porto by Stable Isotope Surveys. J. Geophys. Res. – Atmos 2022, 128, e2022JD037706. [Google Scholar] [CrossRef]
Figure 1.
A: location of Lamezia Terme’s observation site (LMT) in the Mediterranean basin on a NOAA’s ETOPO1 DEM (Digital Elevation Model) [96,97]. B: EMODnet DEM map [98] showing the location of LMT in central Calabria and the sulfur dioxide emission hotspots present the area, marked in bold: the Gioia Tauro Port, the Stromboli volcano in the Aeolian Islands, and Mount Etna. Some of the underwater volcanoes in the area are also shown in italics. “Lametini” refers to the two twin underwater volcanoes named after the municipality of Lamezia Terme. Local maps showing sources of pollution in the Lamezia Terme municipality area with greater detail are available in D’Amico et al. (2024a, 2024b, 2024c) [78,93,99].
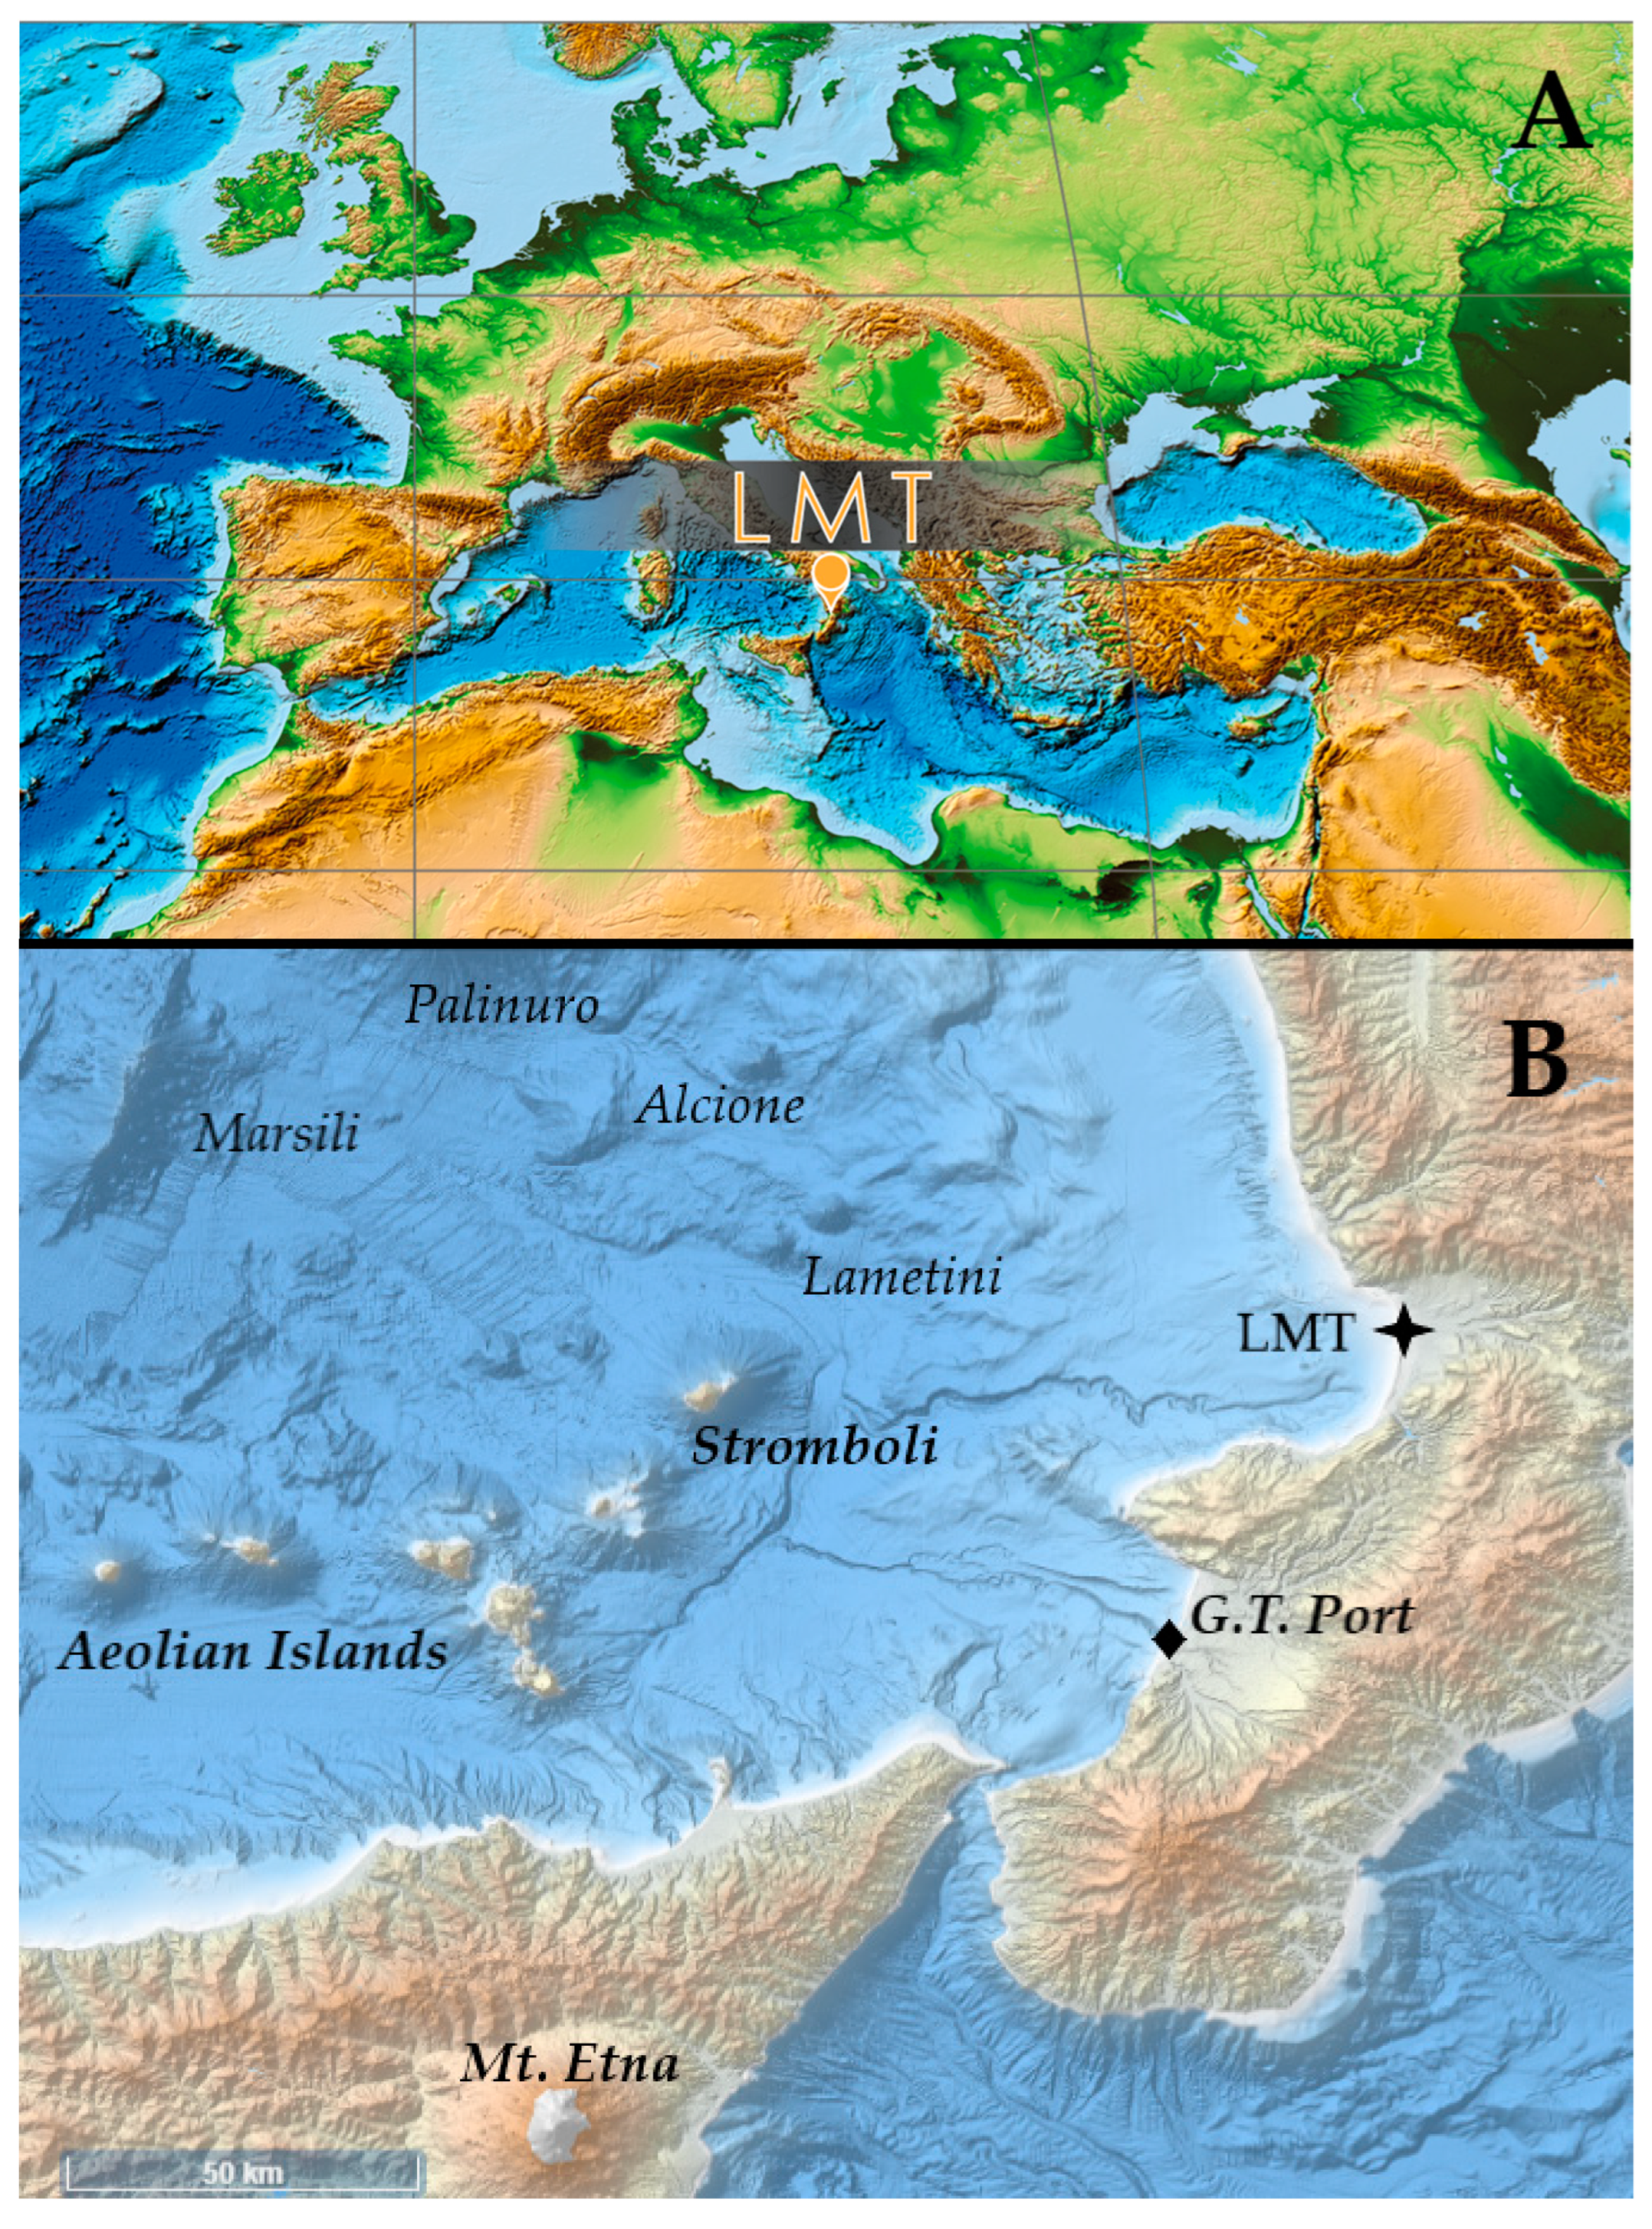
Figure 2.
Top: Wind rose of frequency counts and wind speed thresholds, based on hourly data gathered at LMT by Vaisala WXT520 equipment between 2016 and 2023. The bars have an angle of 8 degrees each. Bottom: locations of the TYR1-4 (Tyrrhenian) and ION1 (Ionian) points used for the comparison of surface mole fractions of SO2 with satellite tropospheric column data.
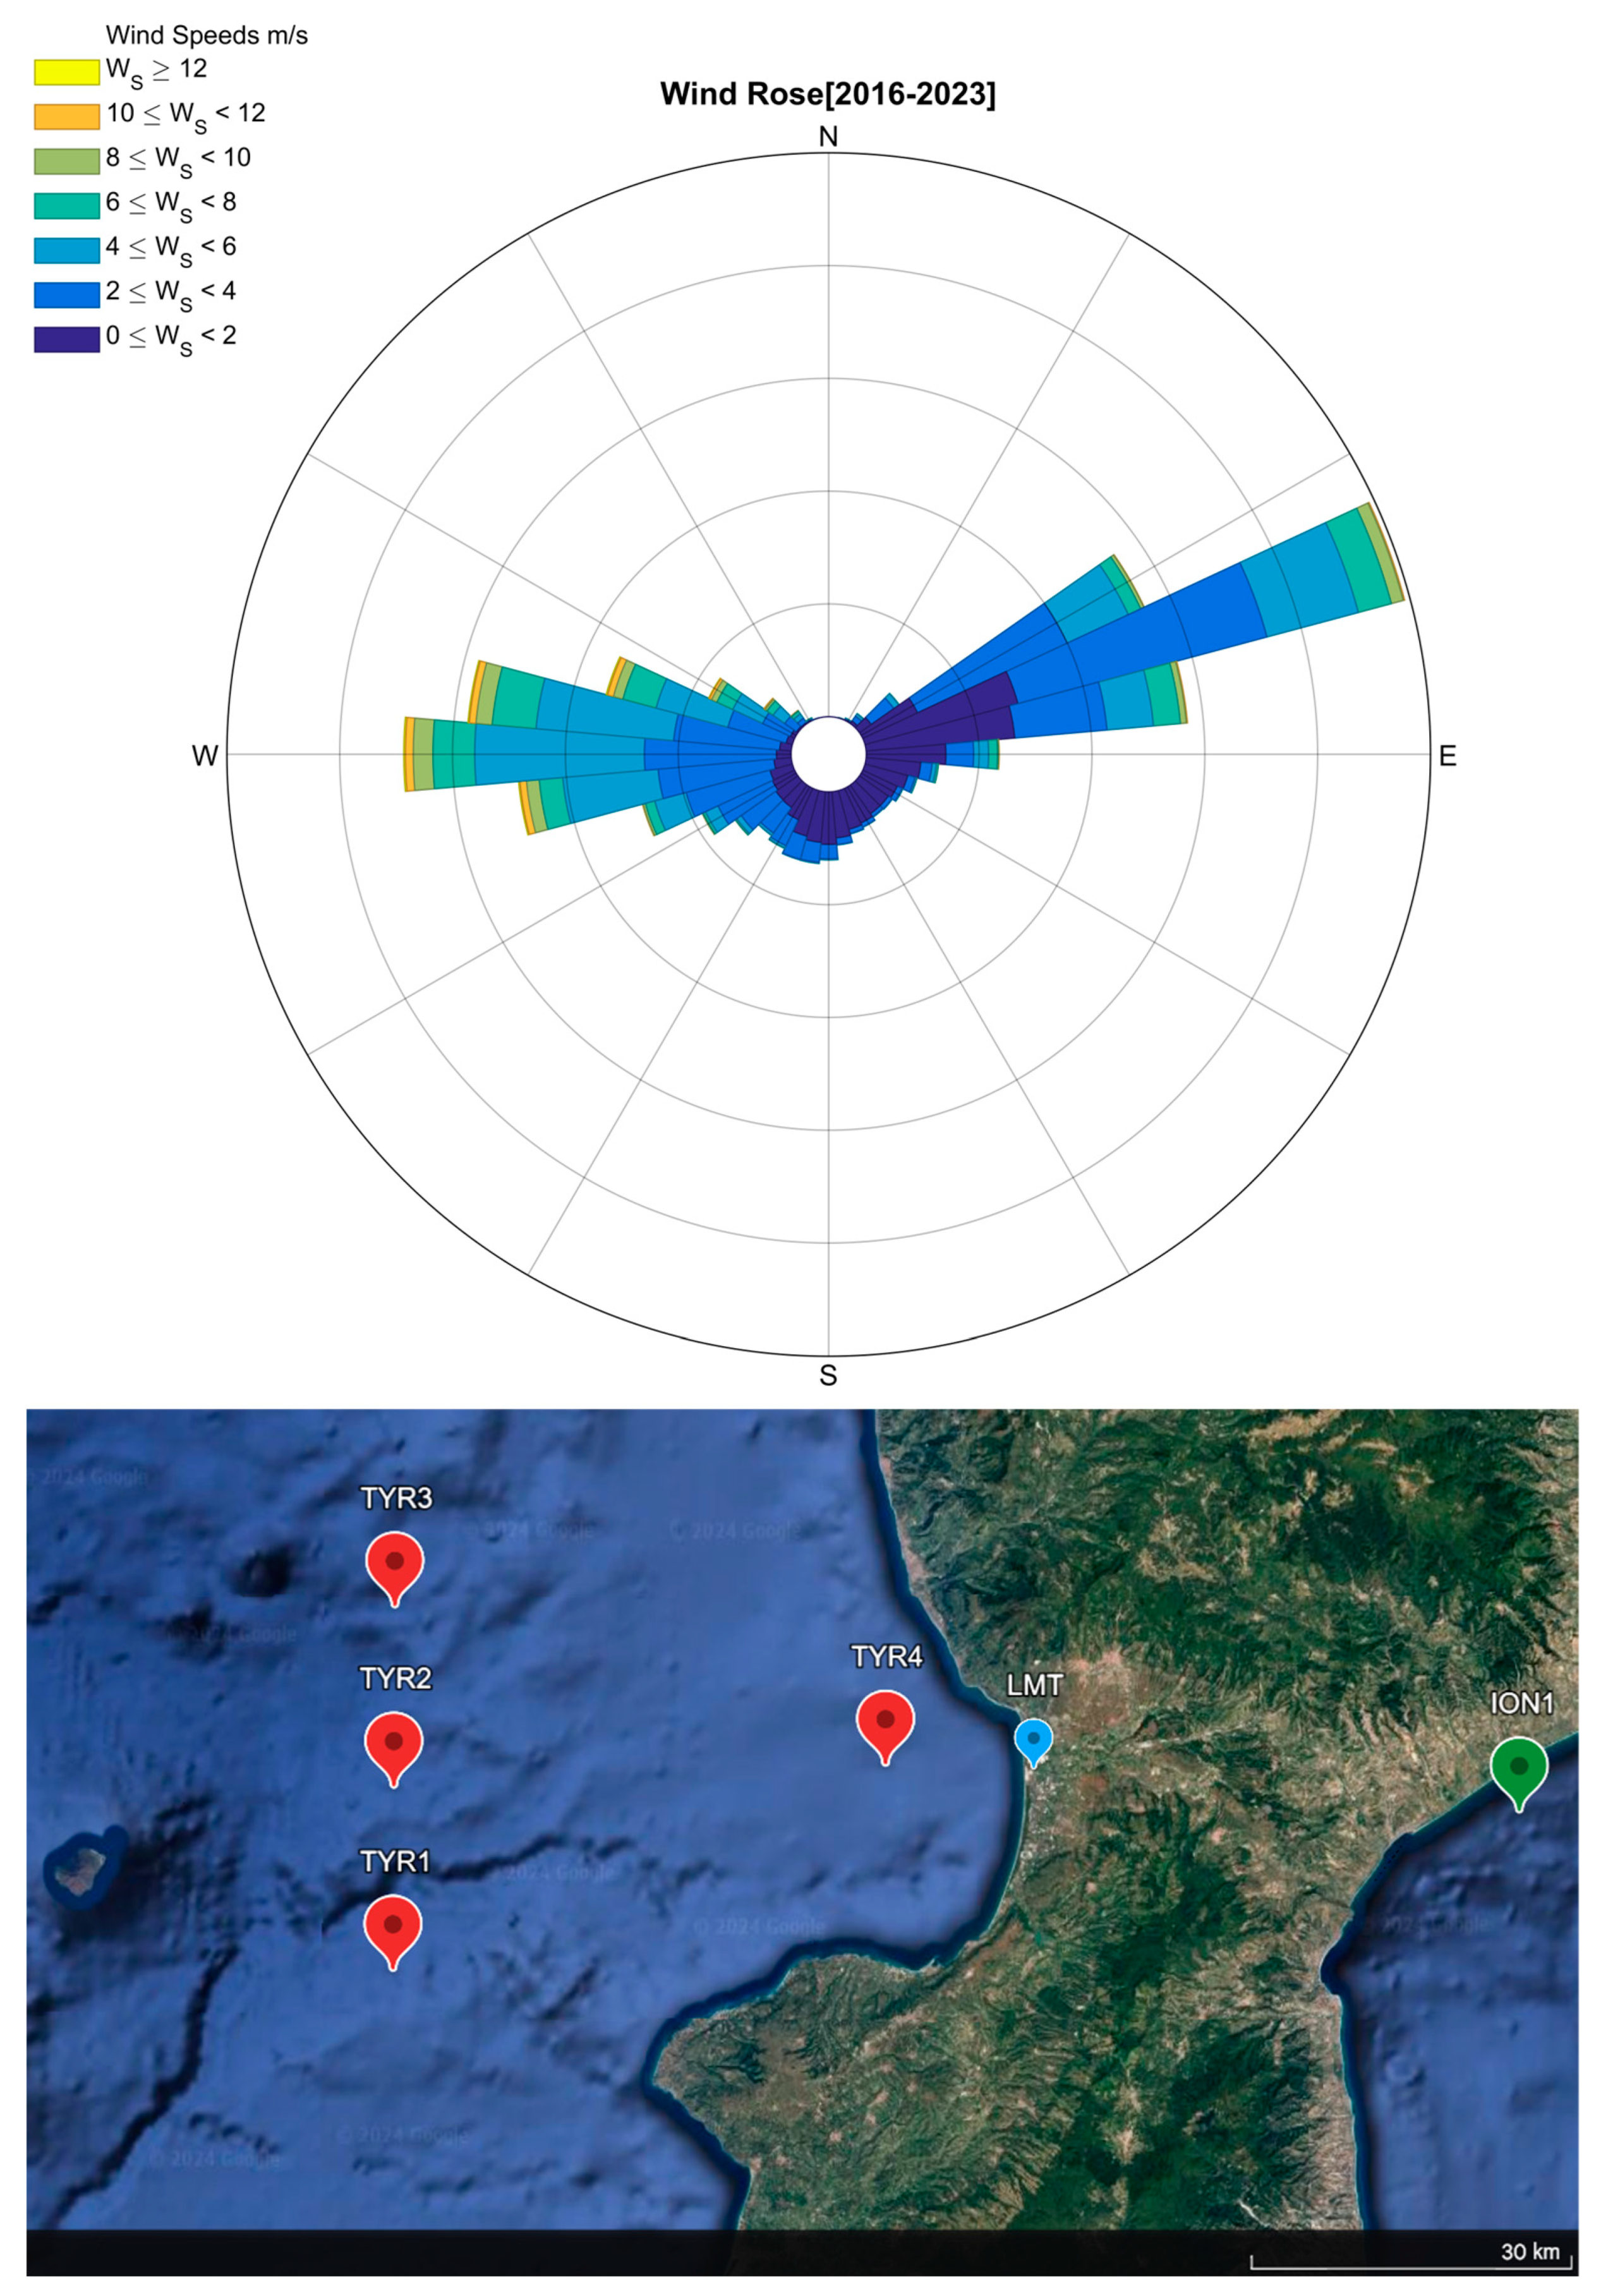
Figure 3.
A: daily cycle of sulfur dioxide at LMT based on the year of evaluation. B: seasonal daily cycle. C: Daily cycle differentiated by wind corridor, using both SO2 and meteorological data.
Figure 3.
A: daily cycle of sulfur dioxide at LMT based on the year of evaluation. B: seasonal daily cycle. C: Daily cycle differentiated by wind corridor, using both SO2 and meteorological data.
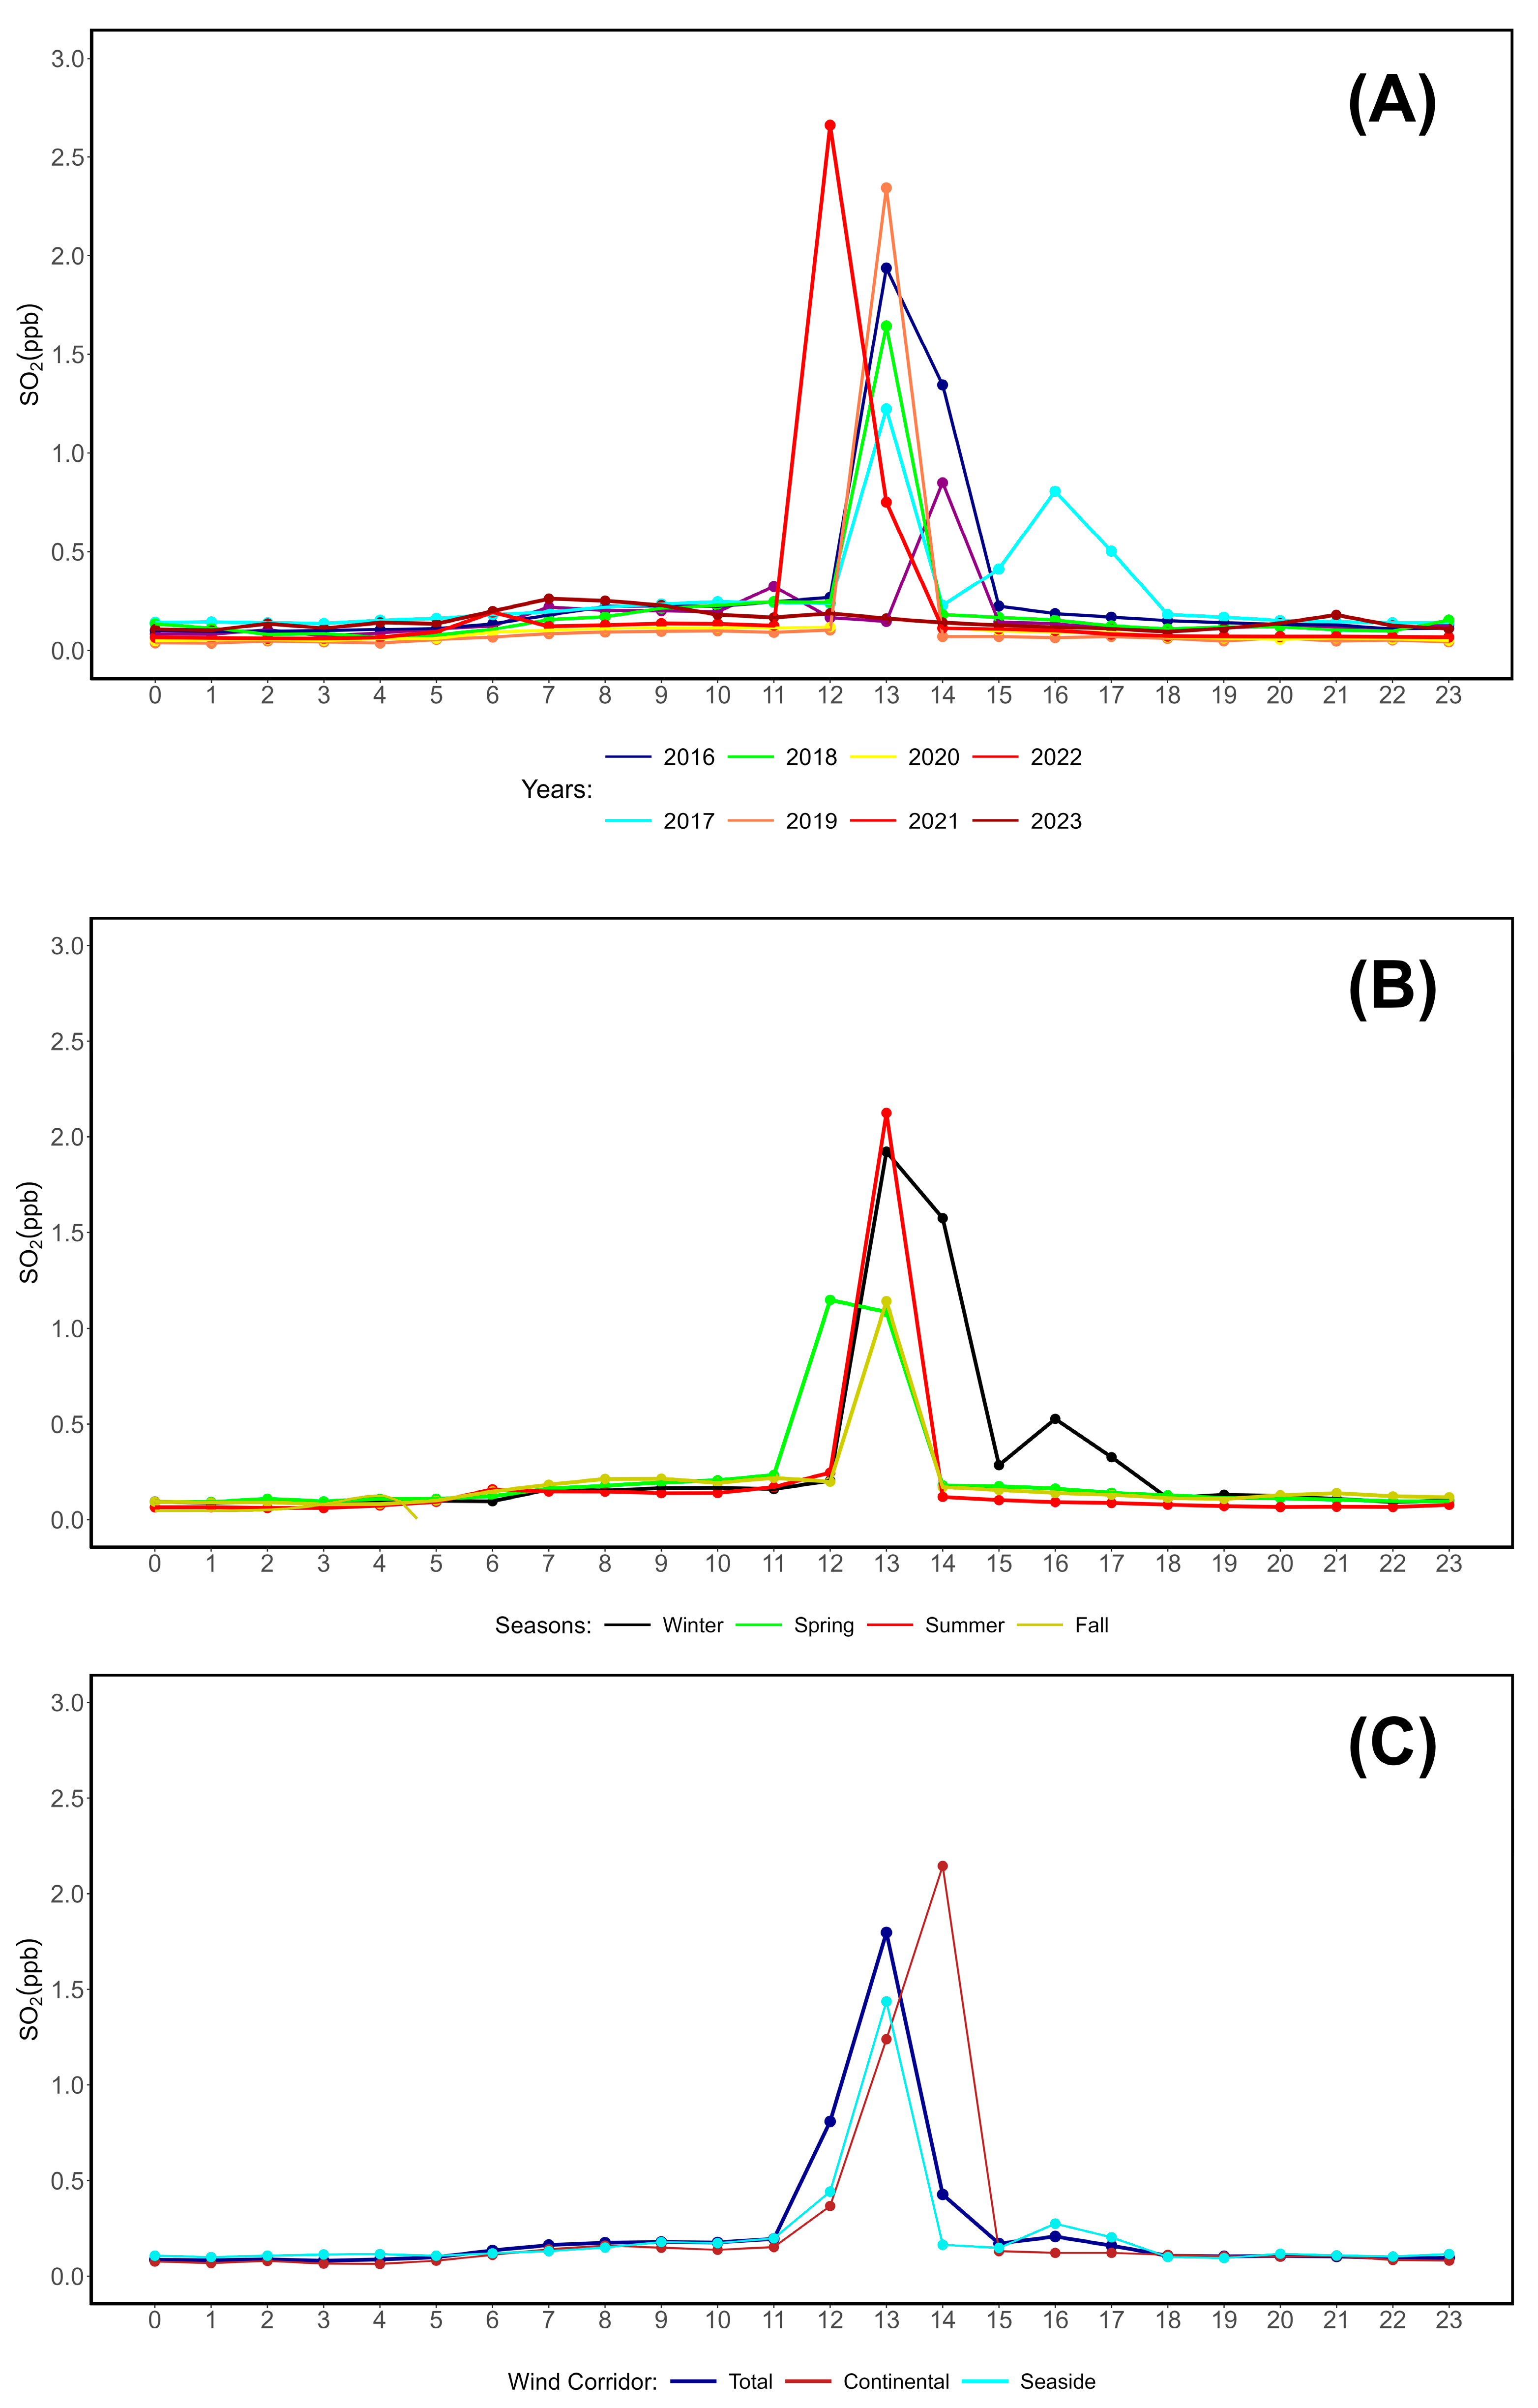
Figure 4.
Total (top) and seasonal (bottom) bivariate plots of observed SO2 mole fractions at Lamezia Terme (LMT), with respect to wind speeds and directions.
Figure 4.
Total (top) and seasonal (bottom) bivariate plots of observed SO2 mole fractions at Lamezia Terme (LMT), with respect to wind speeds and directions.
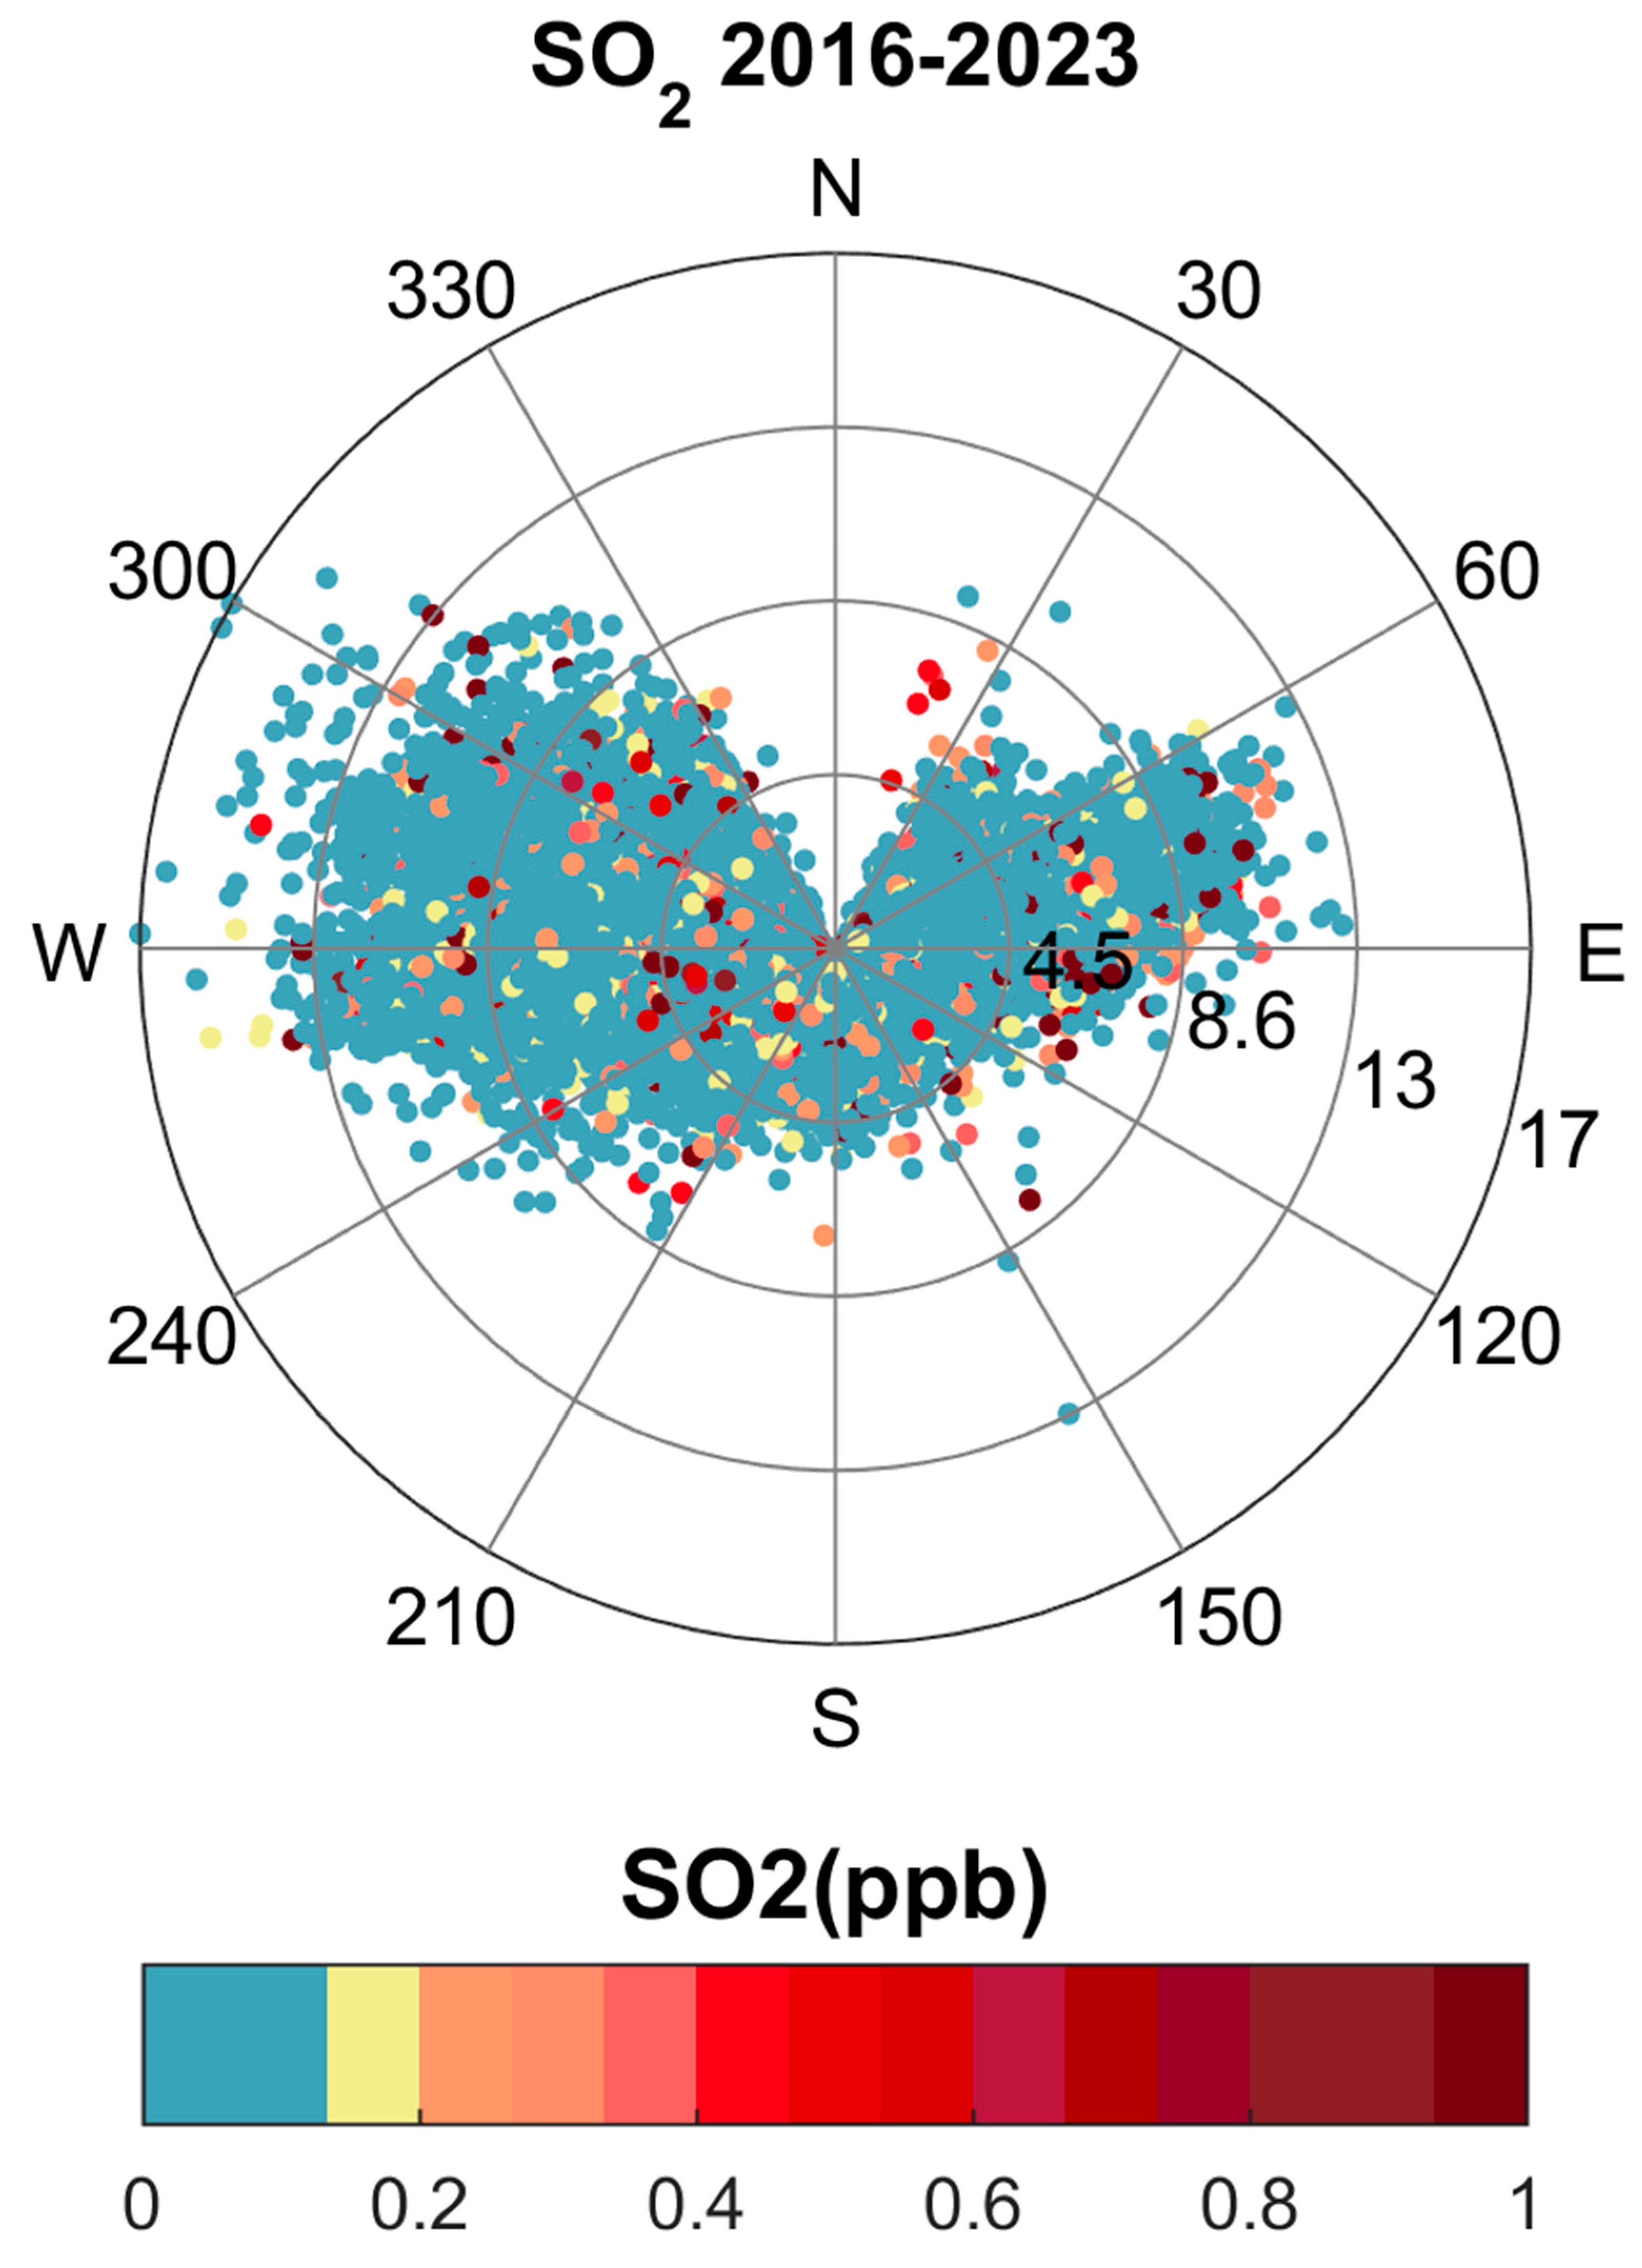
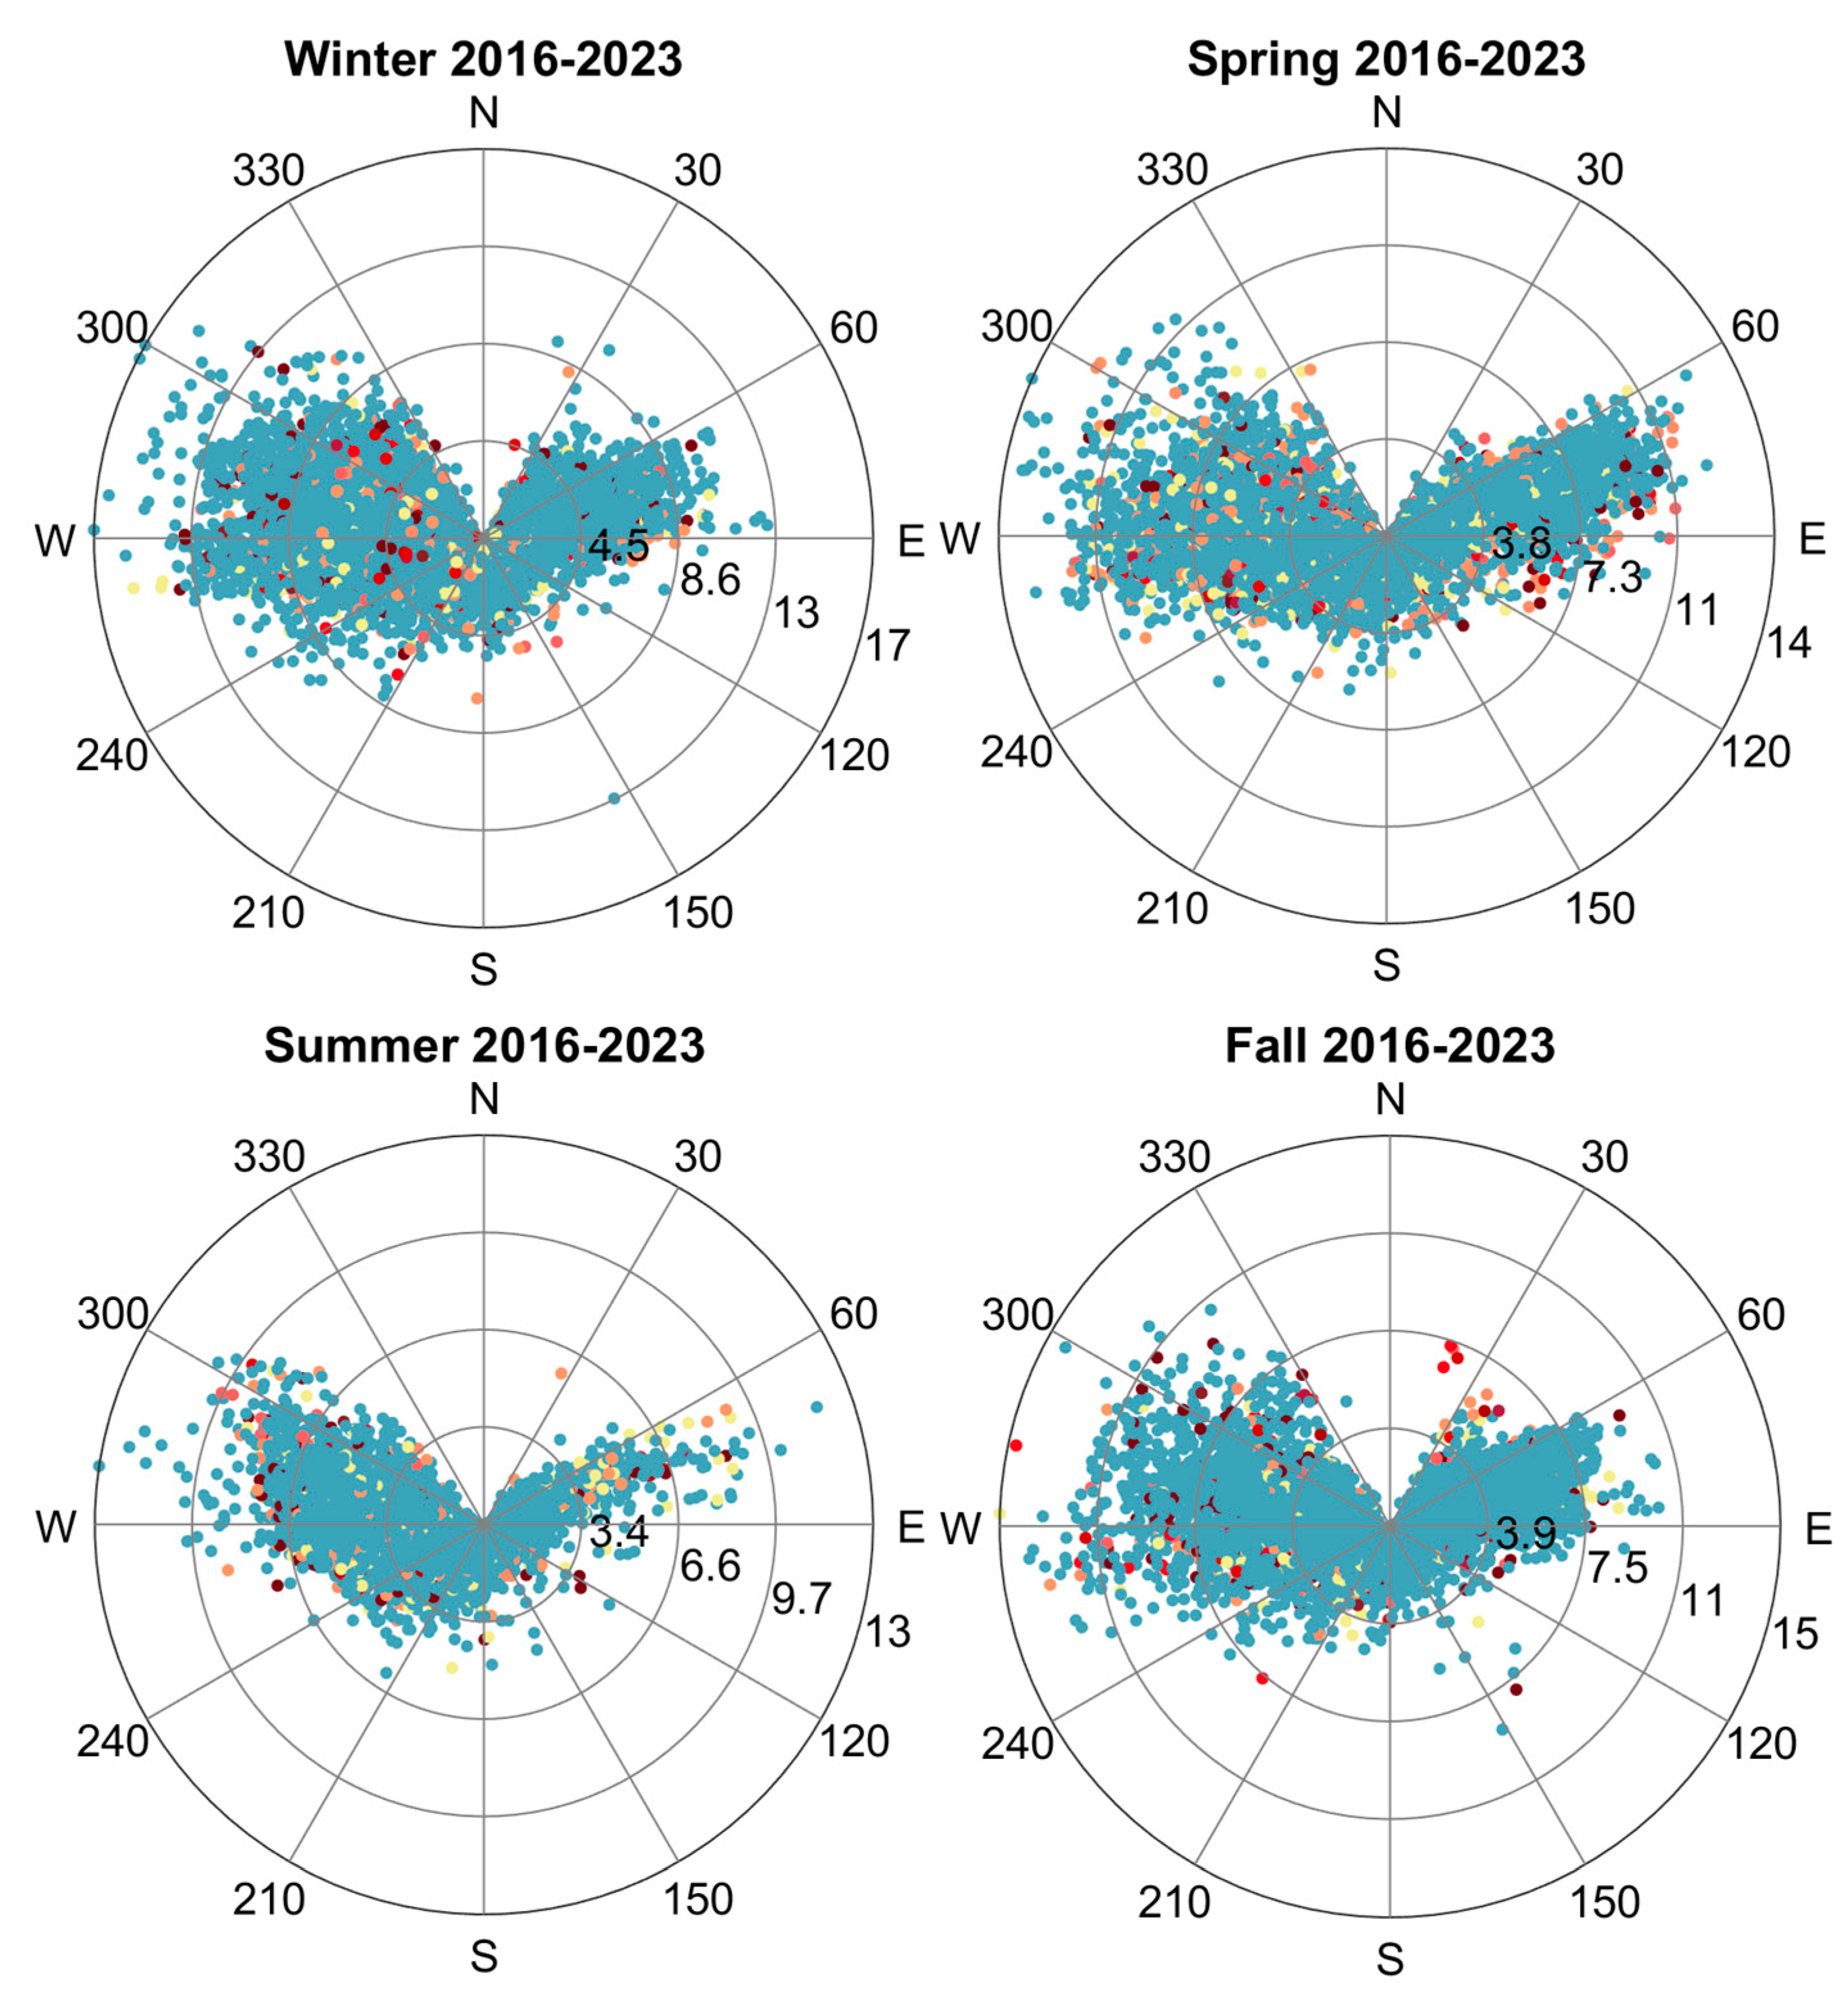
Figure 5.
Correlation between sulfur dioxide concentrations and wind speeds on a per-wind corridor basis. A: western “seaside” (240-300 °N); B: northeastern “continental” (0-90 °N); C: total data, including those falling outside the two wind direction filters.
Figure 5.
Correlation between sulfur dioxide concentrations and wind speeds on a per-wind corridor basis. A: western “seaside” (240-300 °N); B: northeastern “continental” (0-90 °N); C: total data, including those falling outside the two wind direction filters.
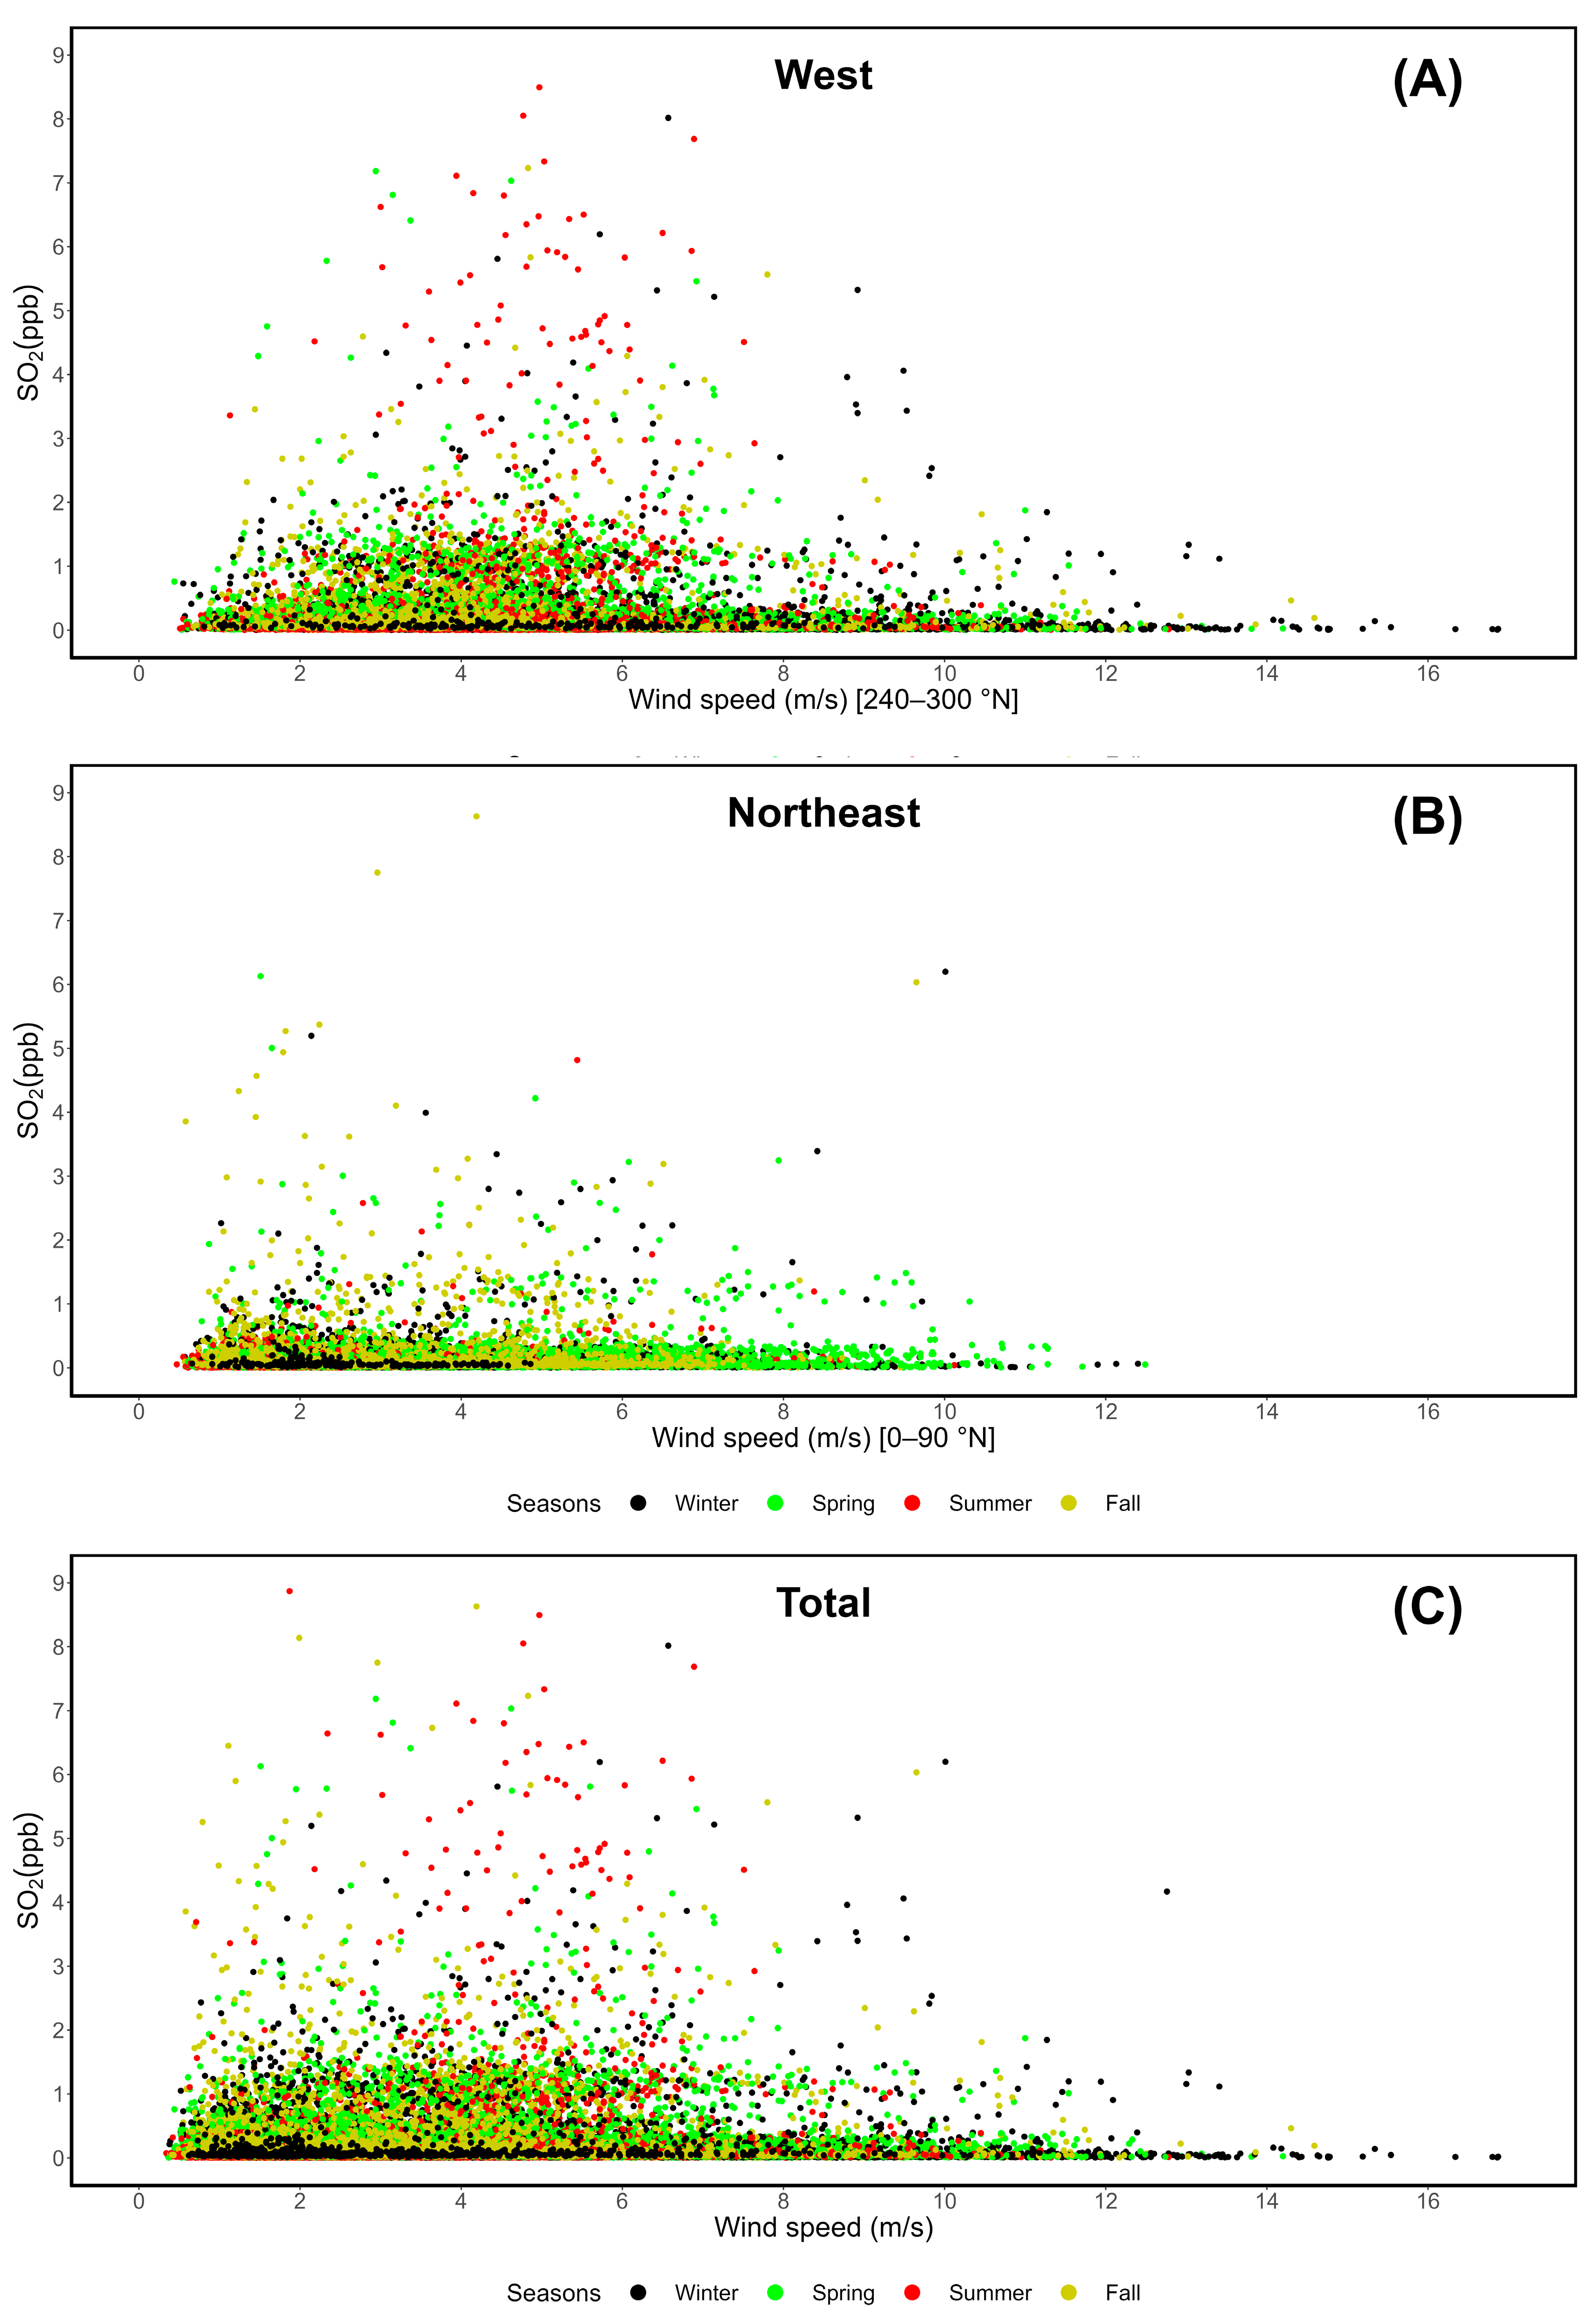
Figure 6.
Weekly cycle evaluation of surface and tropospheric column sulfur dioxide at LMT and the TYR-ION coordinates, with the dotted horizontal lines showing averages. A: surface, western “seaside” corridor (240-300 °N); B: surface, northeastern “continental” corridor (0-90 °N); C: surface, total data; D: column, at LMT. E: column, based on the averages of TYR points. F: column, ION1.
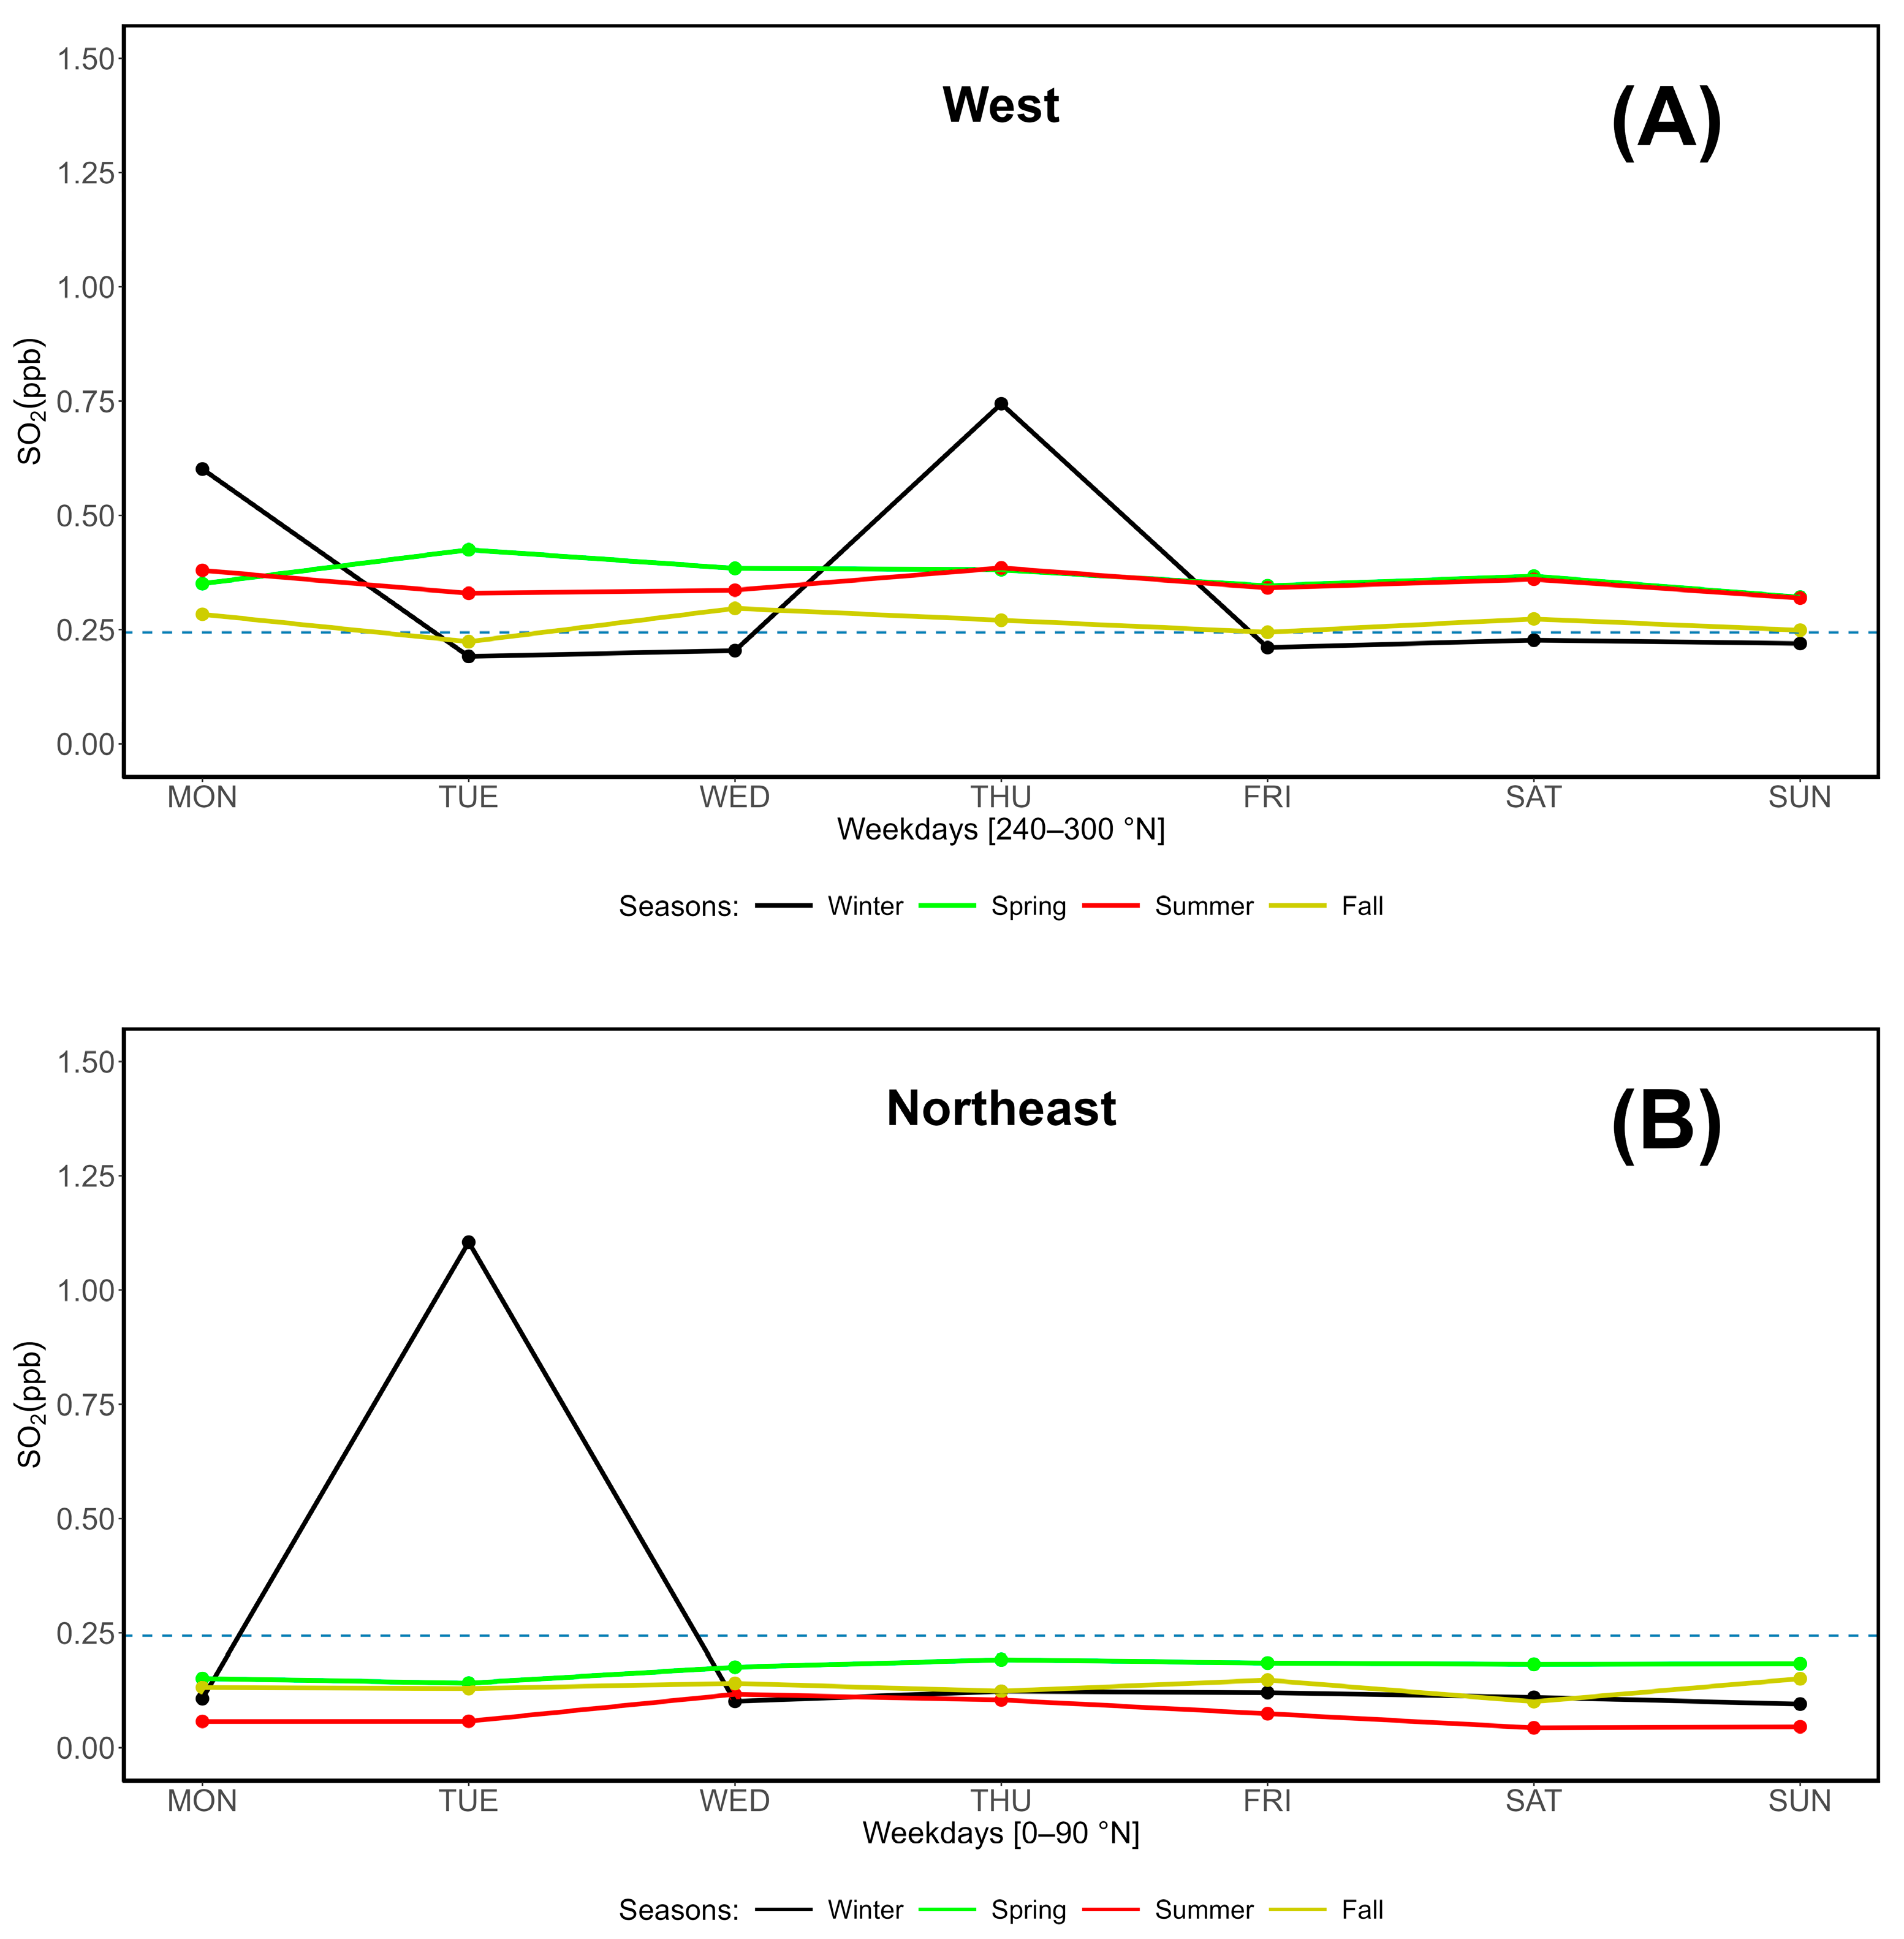
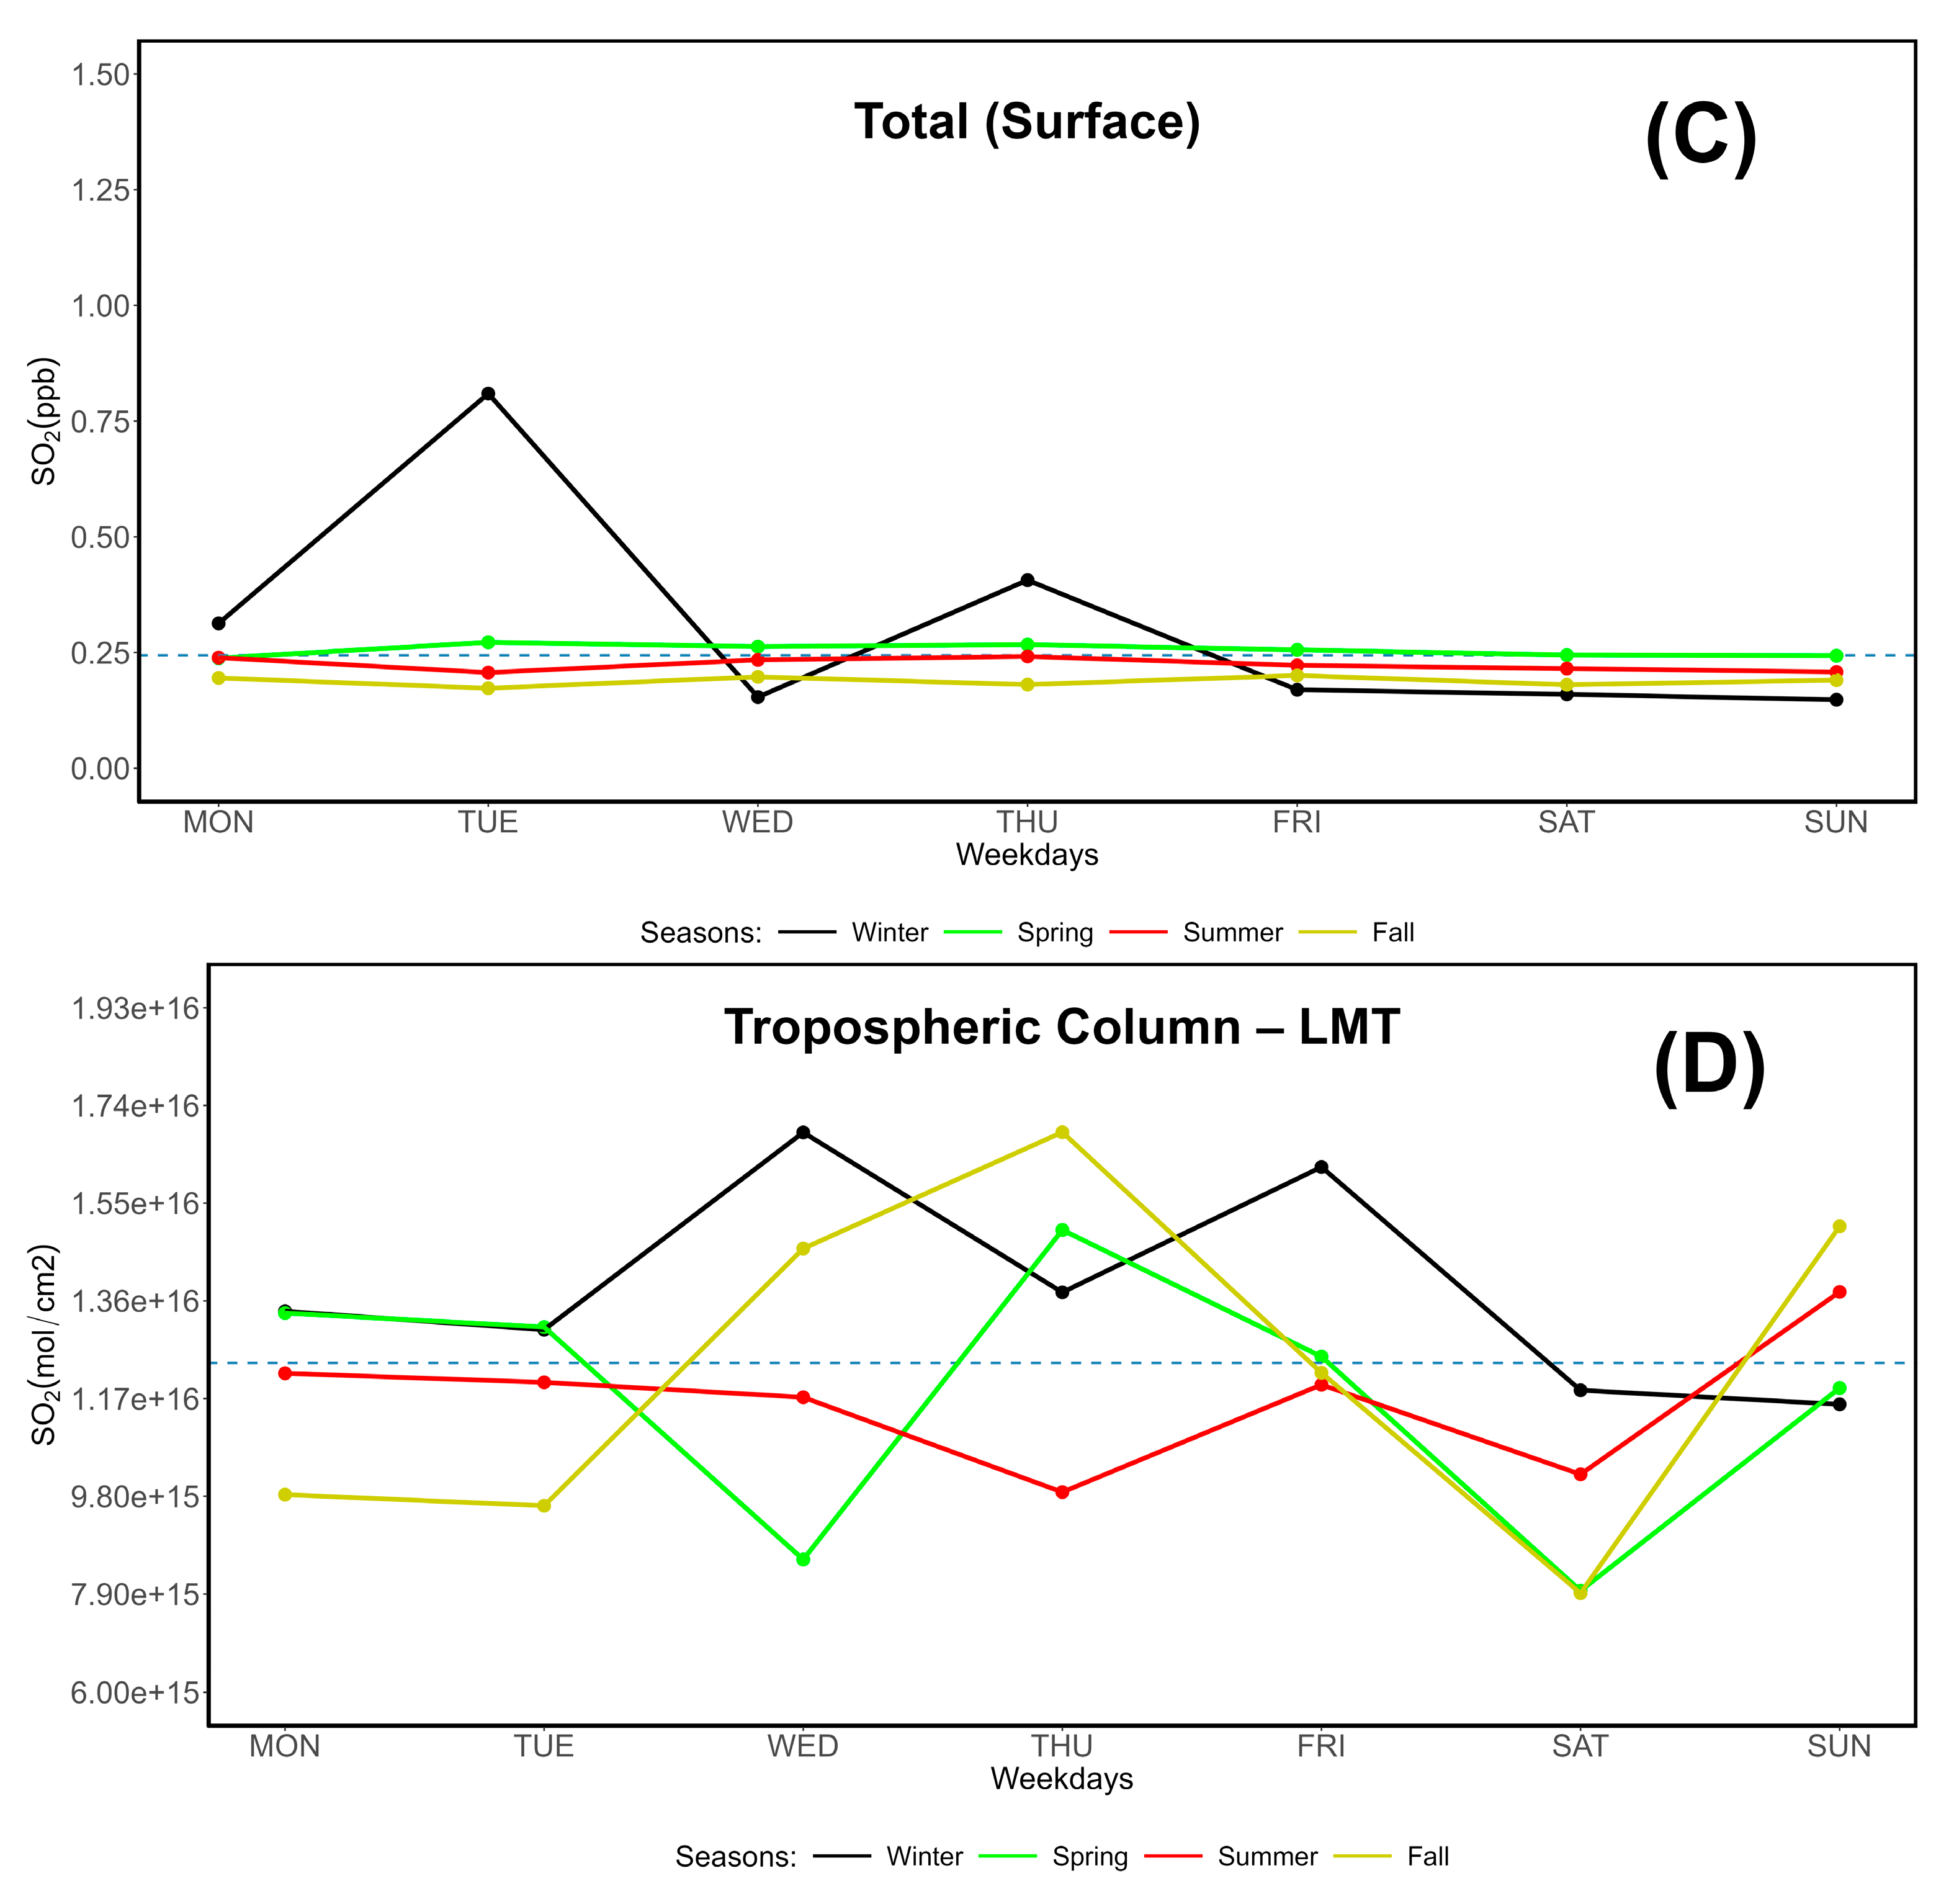
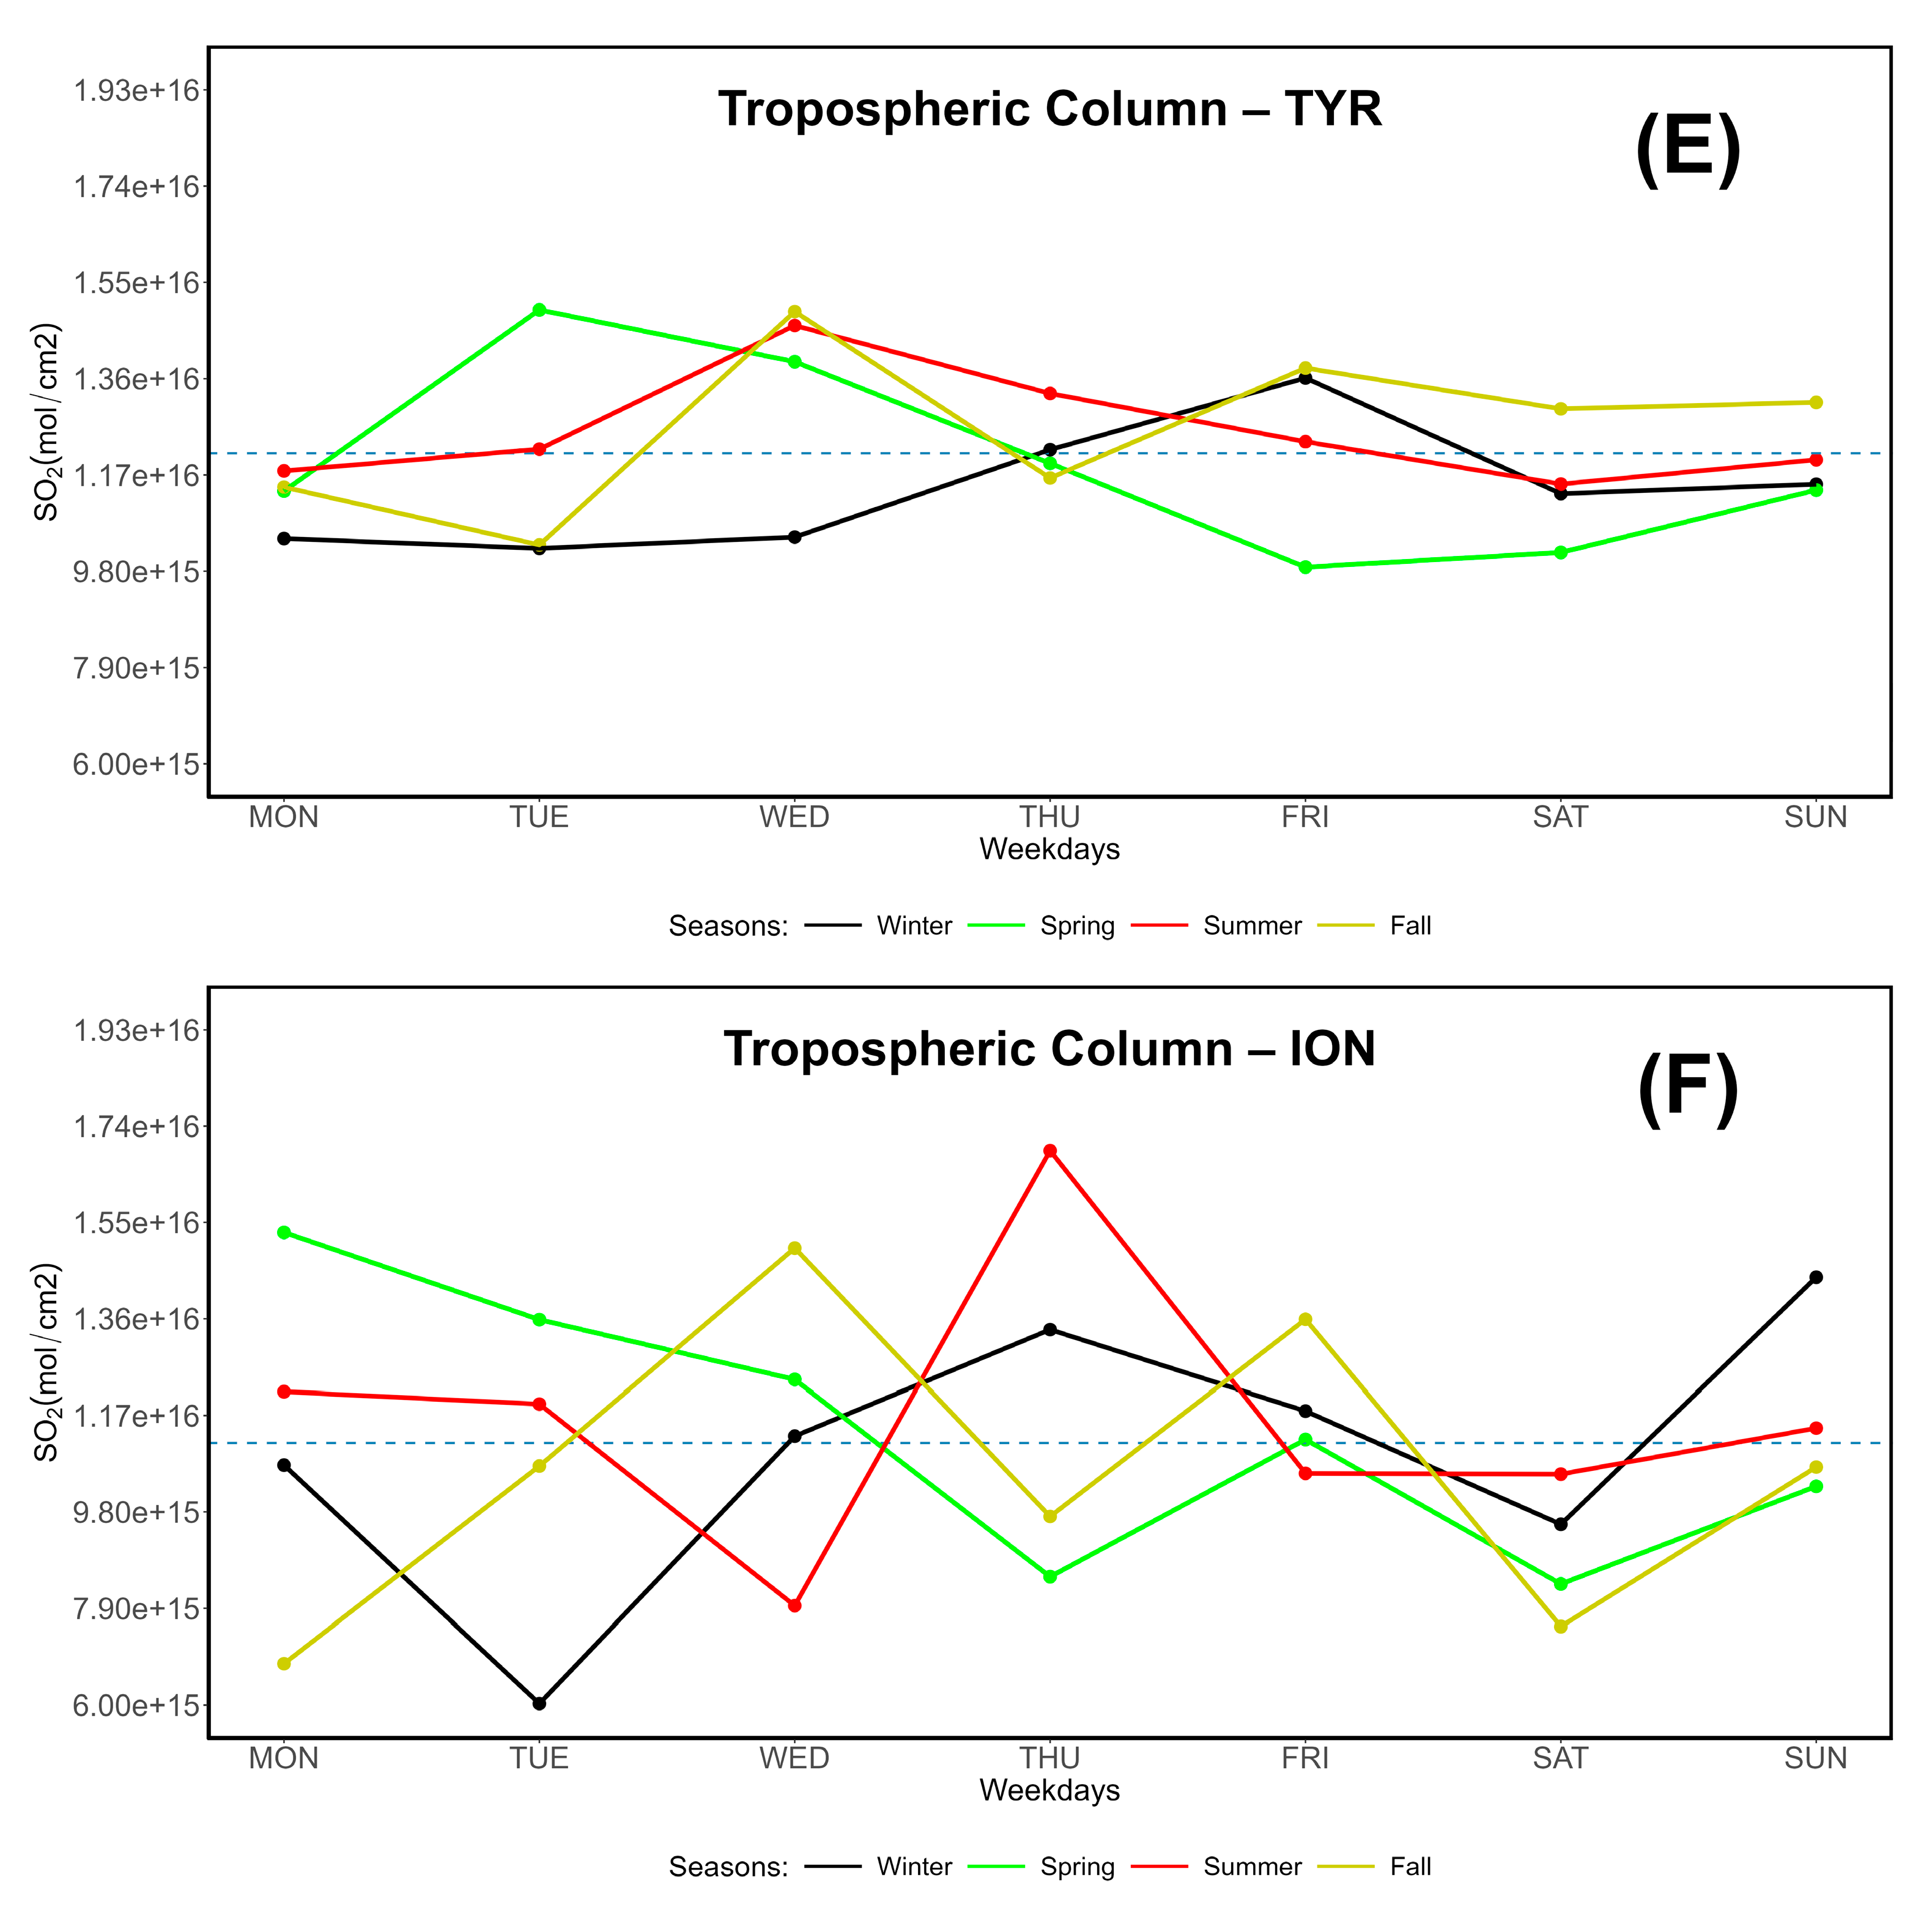
Figure 7.
Multi-year variability of surface sulfur dioxide concentrations at the Lamezia Terme WMO/GAW station differentiated by wind corridor. A: yearly averages between 2016 and 2023. B: seasonal cycle. C: monthly averages.
Figure 7.
Multi-year variability of surface sulfur dioxide concentrations at the Lamezia Terme WMO/GAW station differentiated by wind corridor. A: yearly averages between 2016 and 2023. B: seasonal cycle. C: monthly averages.
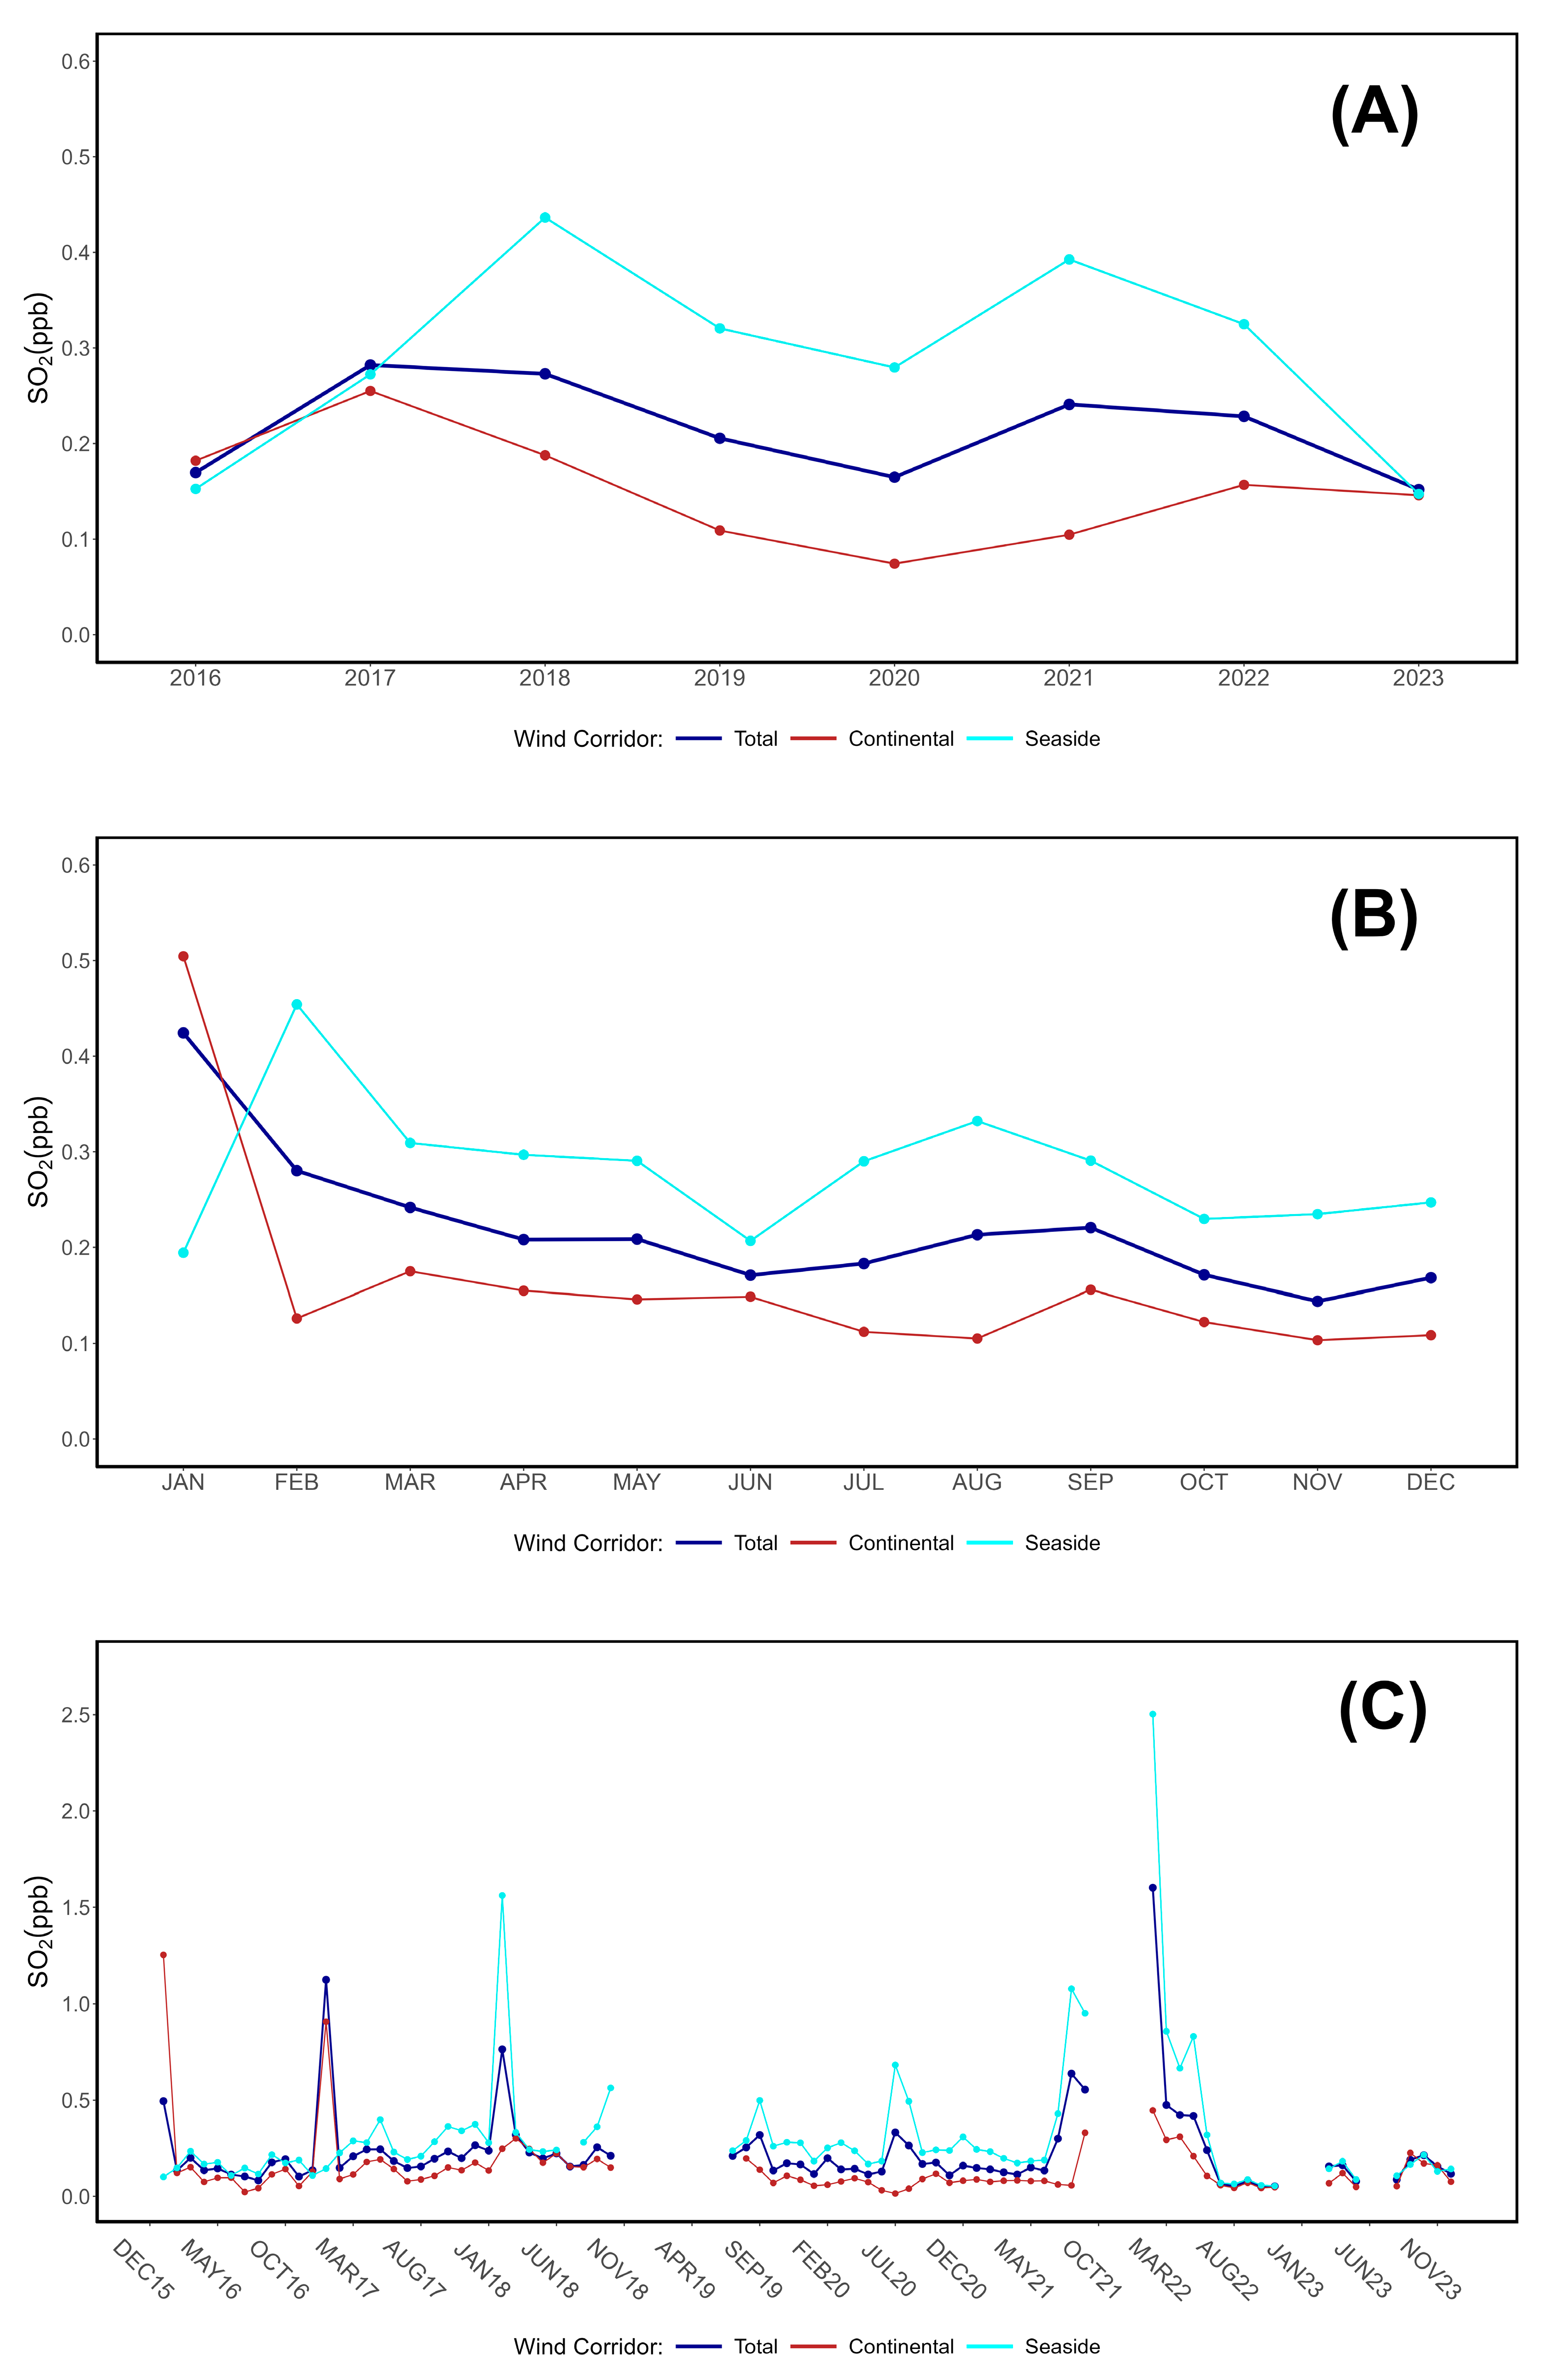
Figure 8.
Multi-year variability of tropospheric column data. A: monthly variability. B: TCSO2 monthly means measured at TYR4 and ION1, and their respective differences. C: direct comparison between LMT surface and column SO2 concentrations. D: Variability of the column data from the three TYR points in the Tyrrhenian Sea, located close to the Aeolian Arc.
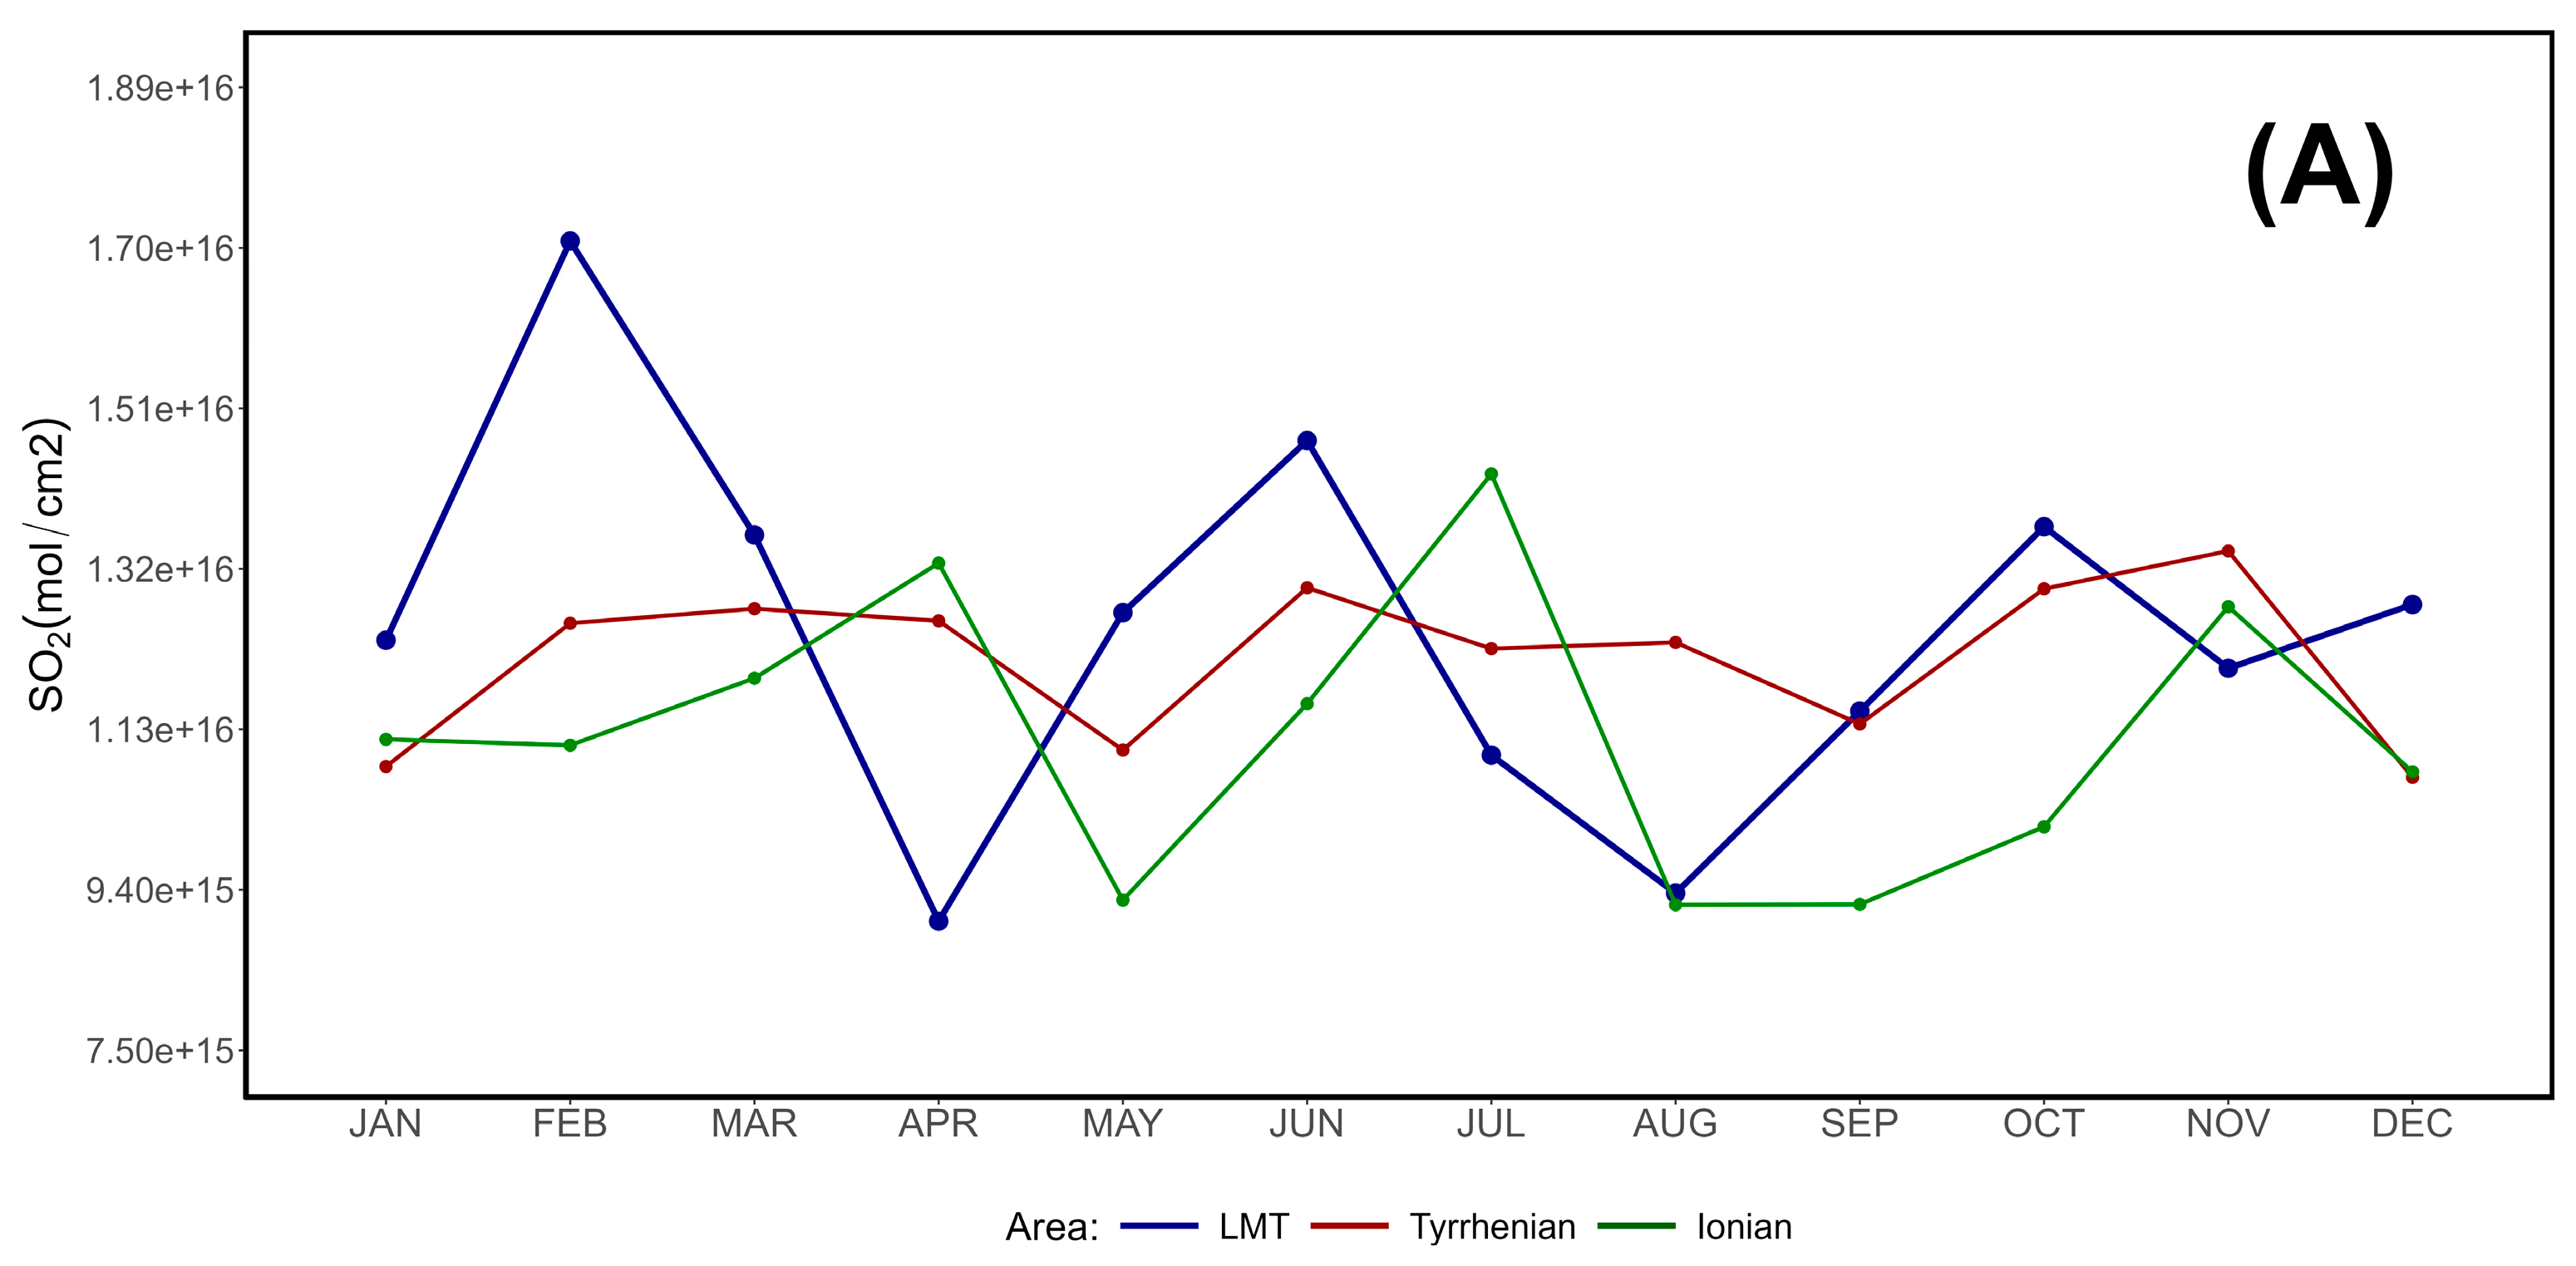
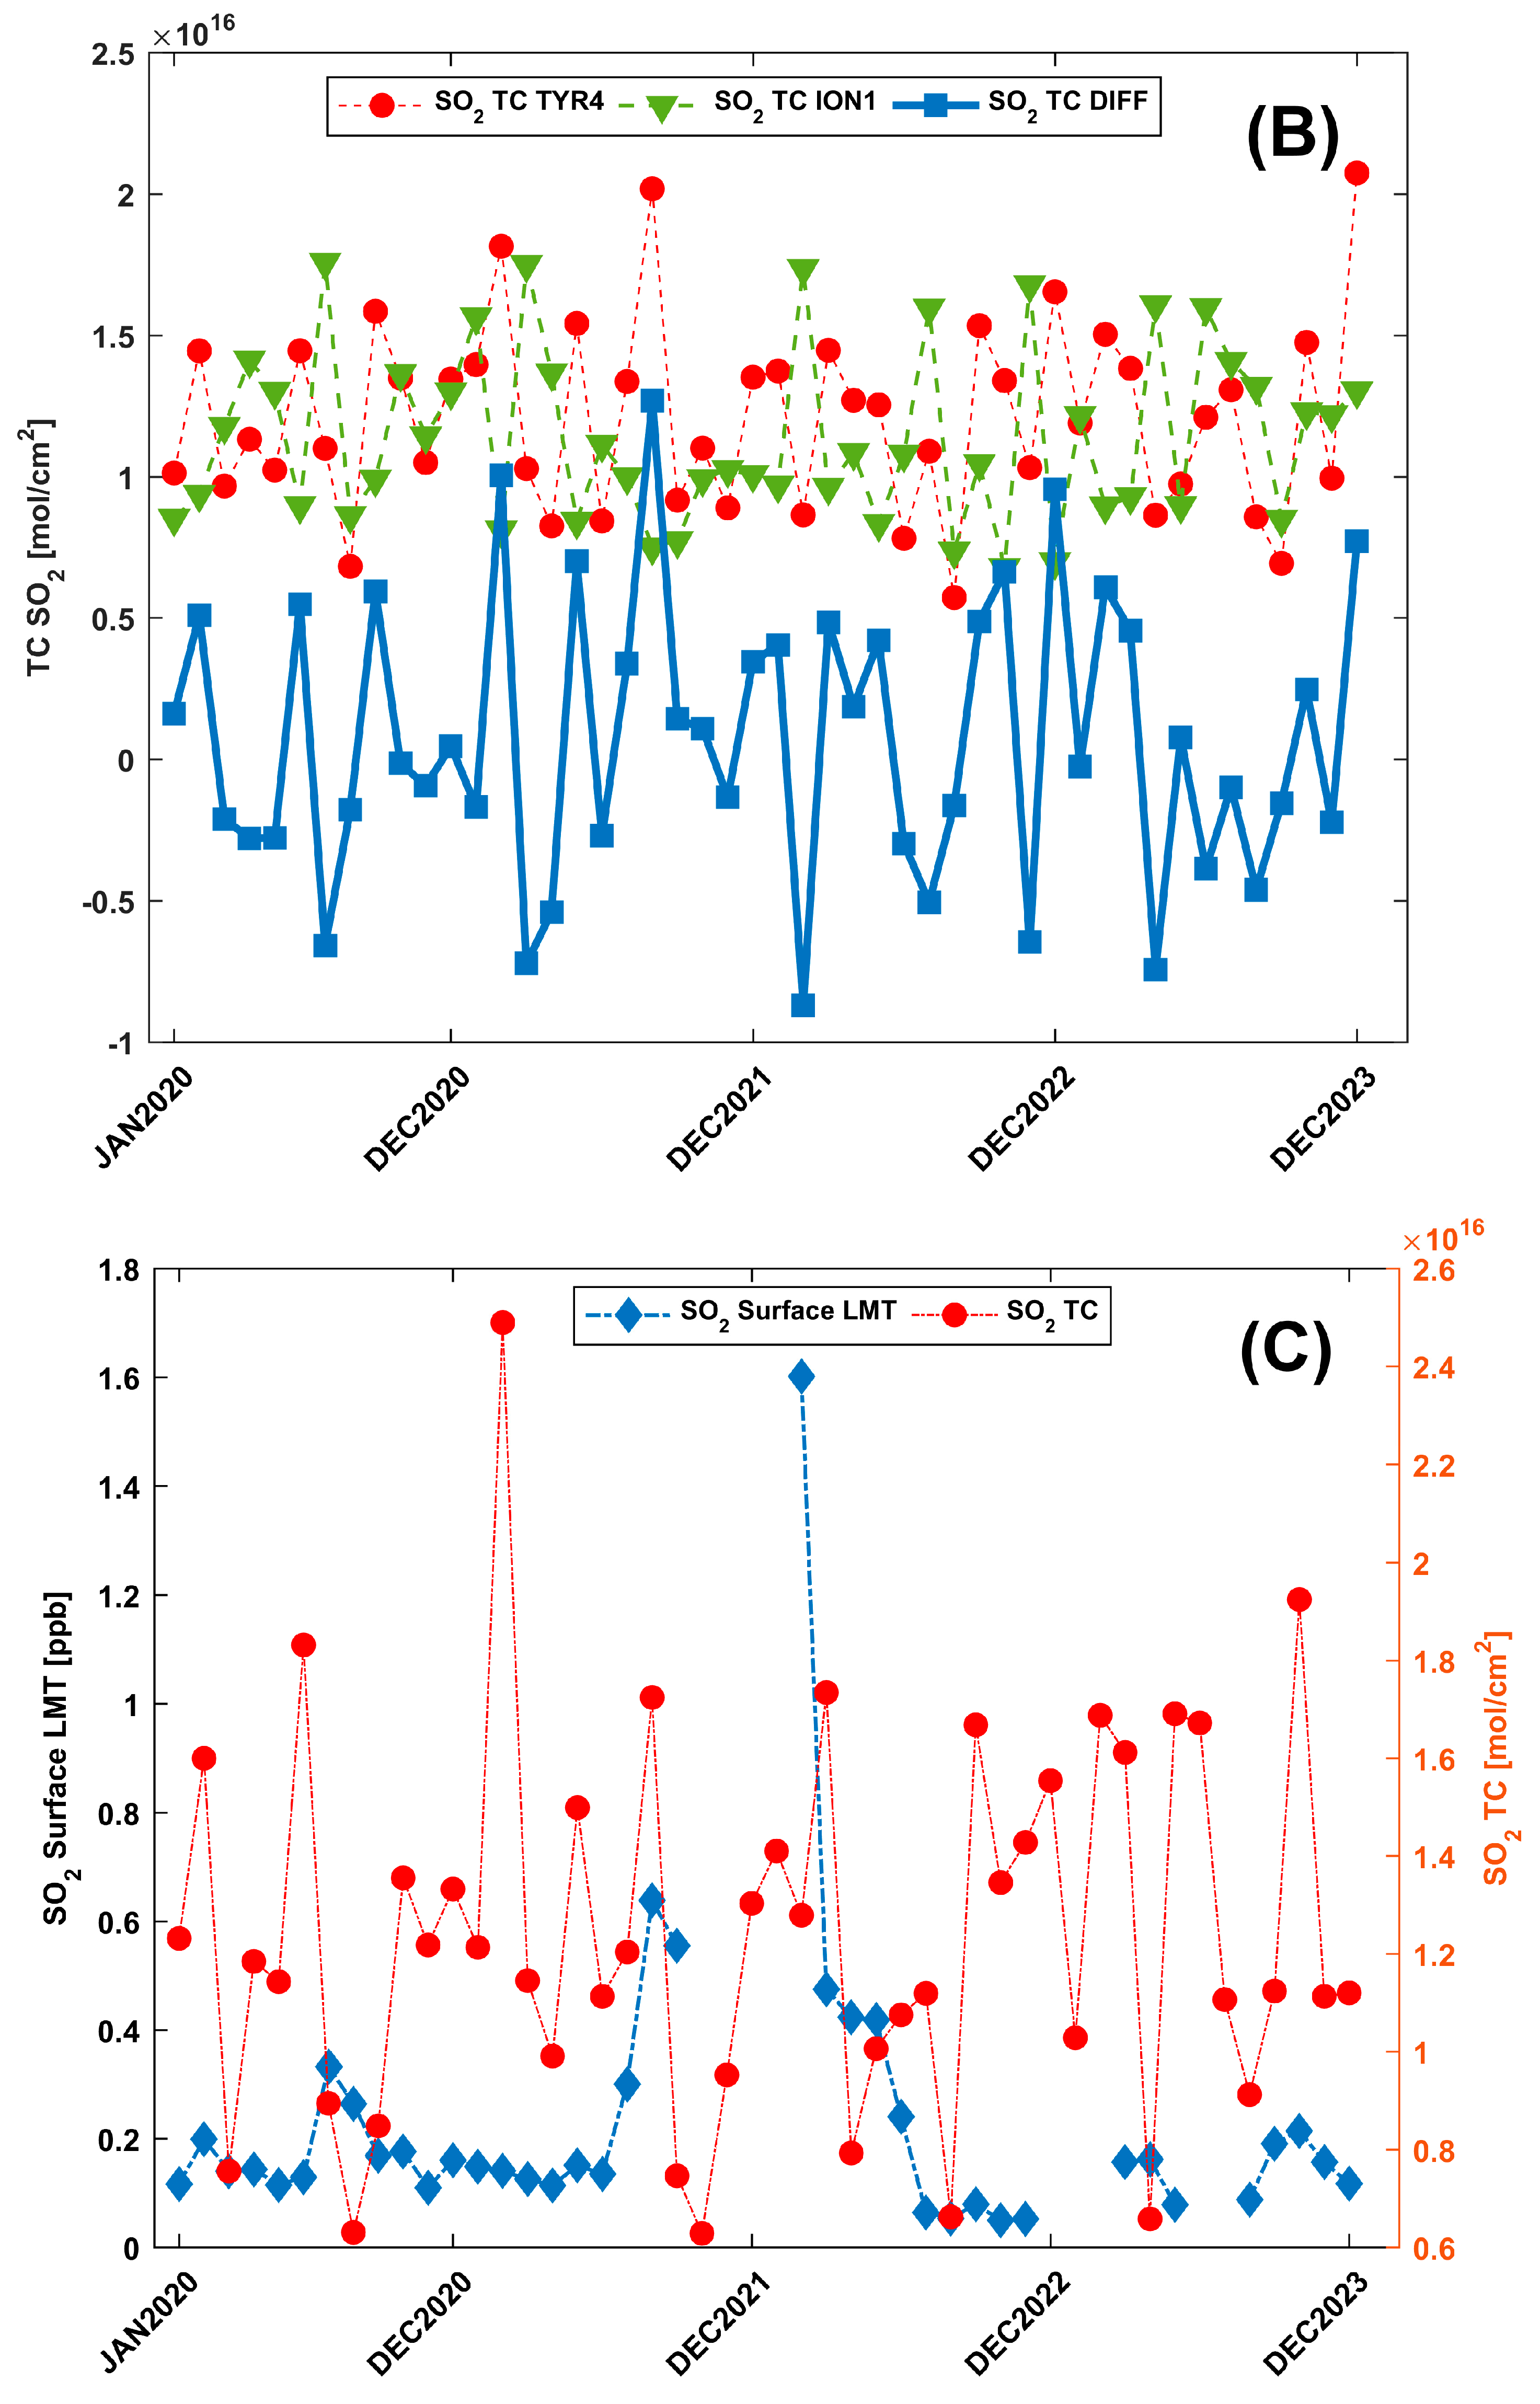
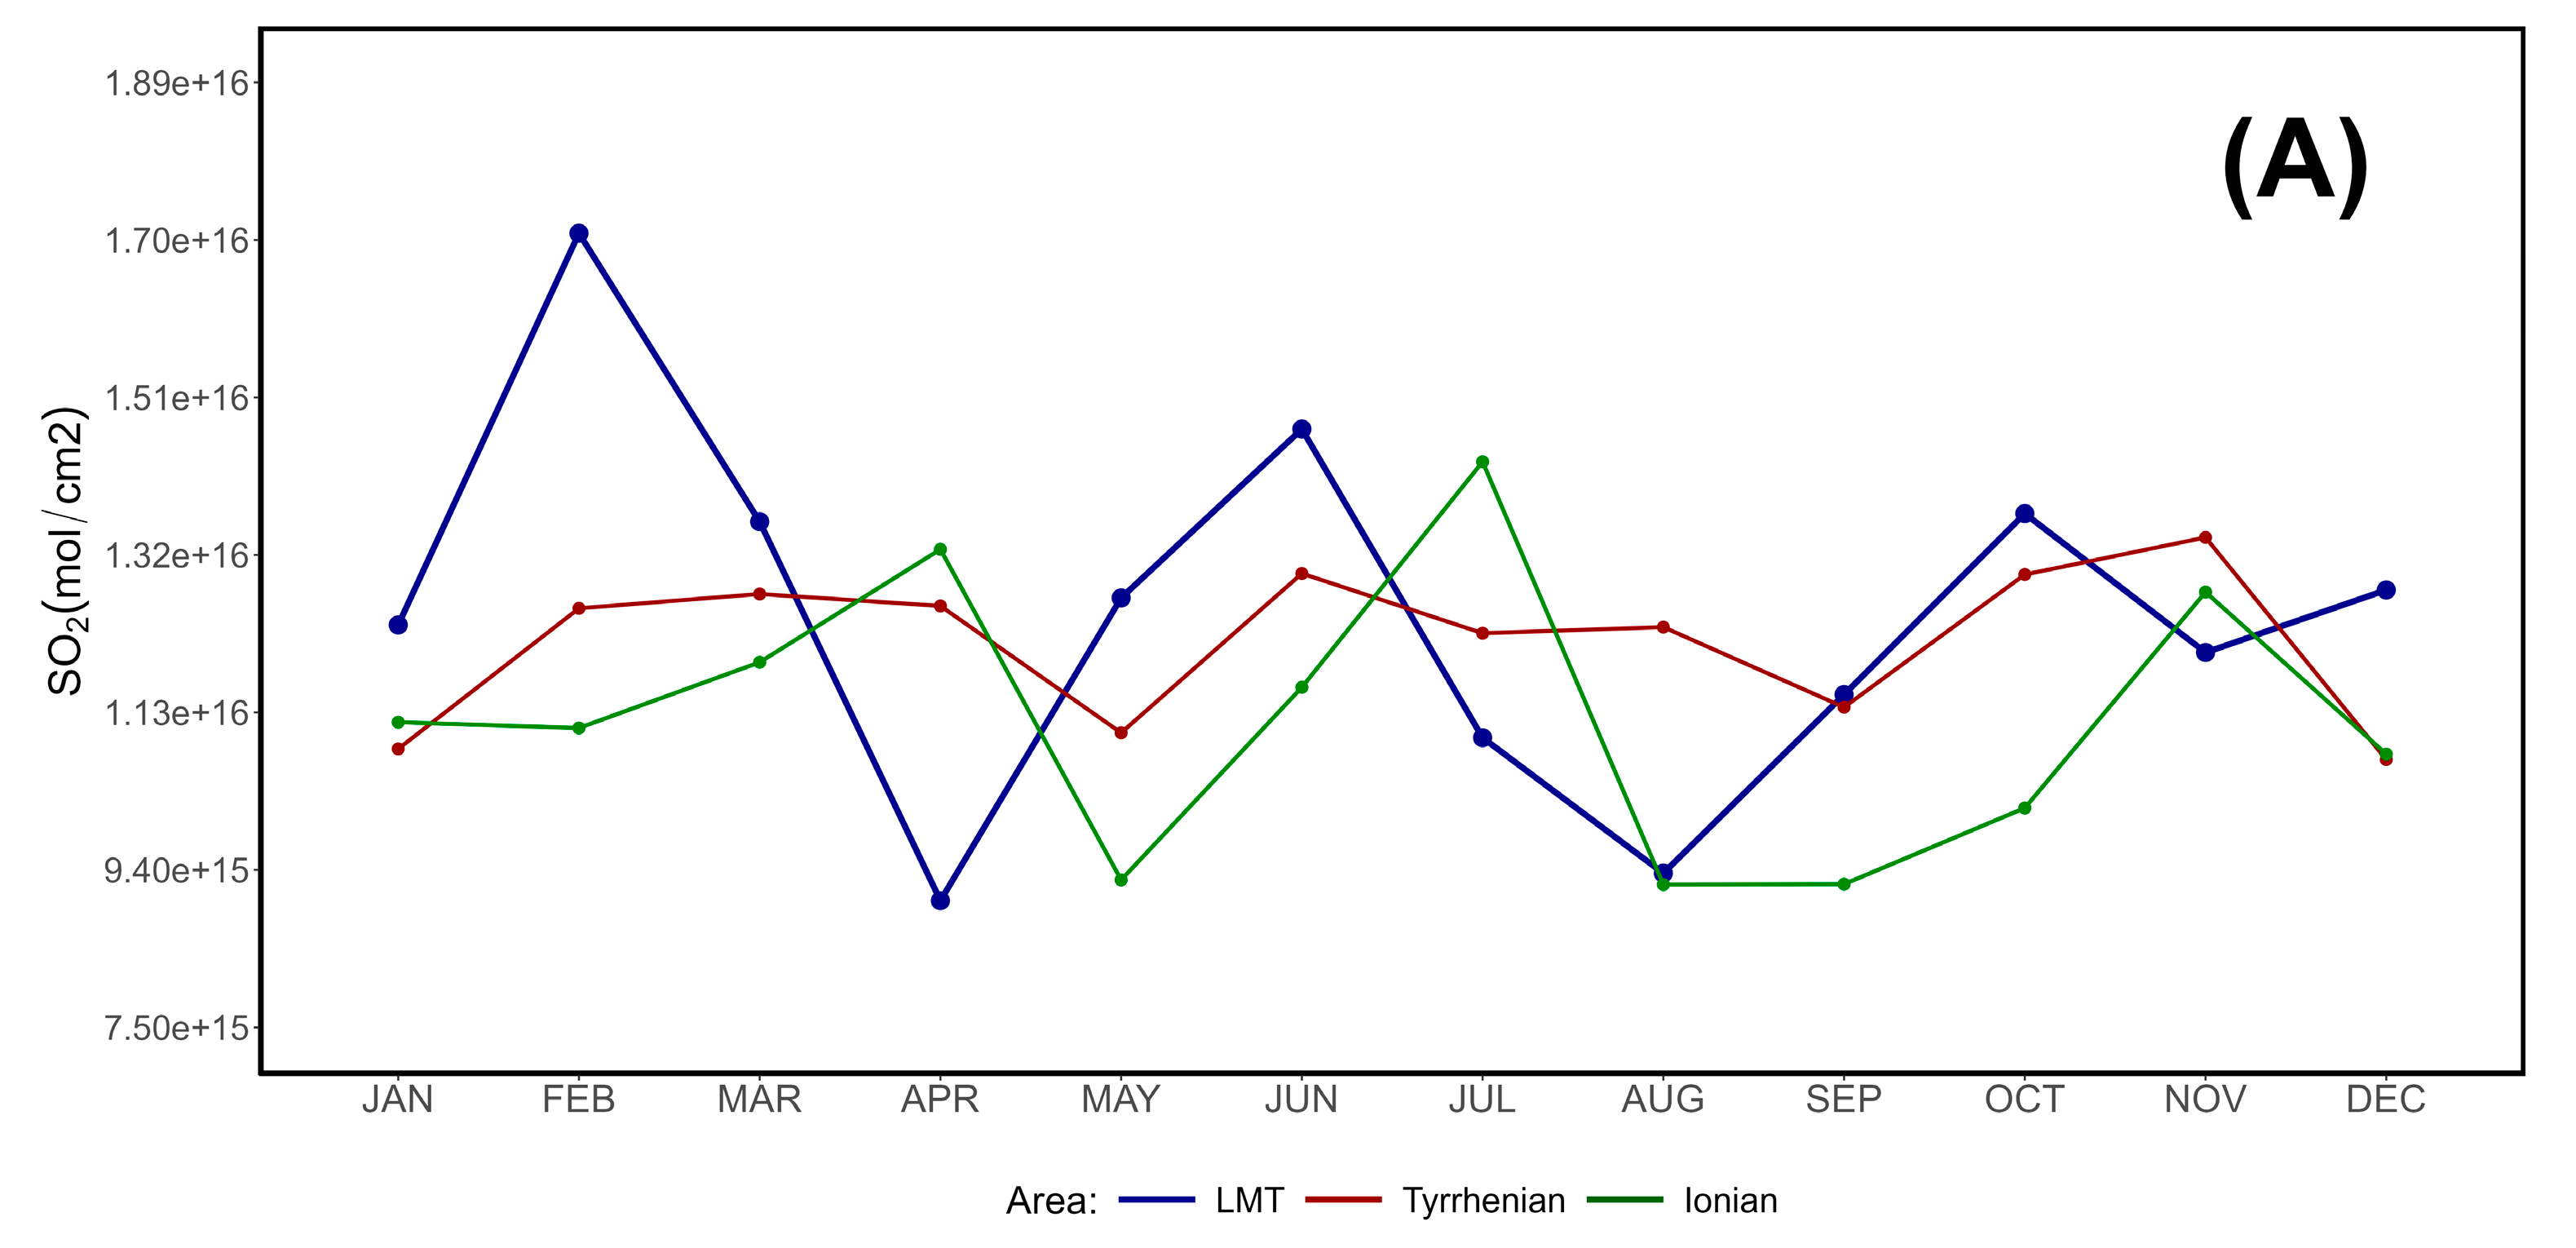

Table 1.
Coverage rates, shown as percentages compared to the actual number of hours, of the three datasets used in this study. Both 2016 and 2020 are leap years, with 24 extra hours each.
Table 1.
Coverage rates, shown as percentages compared to the actual number of hours, of the three datasets used in this study. Both 2016 and 2020 are leap years, with 24 extra hours each.
| Year | Hours | SO2 (%) | Meteo (%) | Combined (%) |
| 2016 | 8784 | 95.53% | 96.34% | 93.54% |
| 2017 | 8760 | 97% | 93.8% | 92.42% |
| 2018 | 8760 | 80.59% | 77.05% | 58.21% |
| 2019 | 8760 | 40.23% | 98.59% | 40.21% |
| 2020 | 8784 | 93.47% | 99.98% | 93.46% |
| 2021 | 8760 | 70.78% | 99.74% | 70.77% |
| 2022 | 8760 | 66.65% | 89.85% | 65.34% |
| 2023 | 8760 | 51.31% | 96.3% | 49.92% |
| Total | 701281 | 74.44%2 | 93.95%2 | 70.48%2 |
1 Sum of all hours. 2 Average rate.
Table 2.
Coverage rate, shown as percentage of the total number of days in a given year, of TROPOMI satellite data on sulfur dioxide concentrations. 2020 was a leap year, with one extra day.
Table 2.
Coverage rate, shown as percentage of the total number of days in a given year, of TROPOMI satellite data on sulfur dioxide concentrations. 2020 was a leap year, with one extra day.
| Year | Days | Sat. SO2 (%) |
| 2020 | 366 | 38.25% |
| 2021 | 365 | 34.52% |
| 2022 | 365 | 42.73% |
| 2023 | 365 | 38.08% |
| Total | 14611 | 38.39%2 |
1 Sum of days. 2 Average rate.
Disclaimer/Publisher’s Note: The statements, opinions and data contained in all publications are solely those of the individual author(s) and contributor(s) and not of MDPI and/or the editor(s). MDPI and/or the editor(s) disclaim responsibility for any injury to people or property resulting from any ideas, methods, instructions or products referred to in the content. |
© 2025 by the authors. Licensee MDPI, Basel, Switzerland. This article is an open access article distributed under the terms and conditions of the Creative Commons Attribution (CC BY) license (http://creativecommons.org/licenses/by/4.0/).
Copyright: This open access article is published under a Creative Commons CC BY 4.0 license, which permit the free download, distribution, and reuse, provided that the author and preprint are cited in any reuse.


