
Submitted:
02 January 2025
Posted:
04 January 2025
You are already at the latest version
Abstract
The application of nitrogen-fixing bacterium (NFB) as biofertilizer can greatly reduce or even avoid the environmental pollution caused by the excessive use of chemical nitrogen fertilizer. In this study, four nitrate transporter (NRT) genes (the Csa1G047430, Csa2G416080, Csa3G027720 and Csa5G161290) subcloned from a Chinese cucumber (Cucumis sativus L.) cultivar “Xintaimici” by RT-PCR were subjected to a determination of the relative expression level using fluorescent quantitative RT-PCR (qRT-PCR). The results showed that the expression of Csa3G027720 gene was significantly up-regulated in the root samples treated with liquid soil extract, and similarly Csa1G047430 and Csa3G027720 genes showed a significant up-regulation when treated with the bacterial cells of GXGL-4A. Differential transcriptome analysis of cucumber roots were conducted between the GXGL-4A-treated group and the control group treated with an equal volume of sterile water. A total of 418 differentially expressed genes (DEGs) were detected and categorized into 20 functional groups. Only the KEGG pathway of phenylpropanoid biosynthesis reached a significant level (P-adjust=0.0279) among all the 17 enriched KEGG pathways. Hence, we speculate that the NFB bacterial strain GXGL-4A, as a biological stimulus, promote the phenylpropanoid biosynthesis in cucumber roots after colonization in cucumber rhizosphere. Under drought condition, the rhizosphere electrical conductivities (EC) of the NFB treatment groups were extremely significantly higher than that of the control group, suggesting that the application of NFB significantly enhanced cucumber's resistance to drought.
Keywords:
nitrogen-fixing bacterium
; nitrate transport gene
; qRT-PCR
; Cucumis sativus
; differential transcriptome
; electrical conductivity
1. Introduction
Cucumber (Cucumis sativus L.) is a worldwide cultivated vegetable, and since 1970, due to the establishment of protected field cultivation facilities, the cultivated area of cucumber has been increasing continuously. According to FAO statistics (http://www.fao.org/faostat/en/#data/QC), as of 2019, the world's cucumber cultivation area and total yield reached respectively 2,231,402 hectares and 37,804,502.23 tons. Whether it is protected cultivation or open field cultivation, there is excessive use of chemical nitrogen fertilizer in cucumber production, which will lead to the accumulation of nitrite in cucumber, thus affecting the commodity quality of cucumber. Moreover, the unreasonable use of nitrogen fertilizer in farmland ecosystem may result in eutrophication of water, soil acidification and other environmental problems [1,2,3]. Thus, it is an urgent problem to improve the nitrogen use efficiency of crops and reduce the environmental pollution caused by chemical nitrogen fertilizer.
Plant roots can absorb various forms of nitrogen, including nitrate nitrogen, ammonium nitrogen and some organic nitrogen compounds. Among them, the most important source of nitrogen in a well-ventilated soil is nitrate nitrogen. Nitrate nitrogen is an essential nutrient for plant growth and development, and it also participates in signal regulation in plants. The absorption, transportation and assimilation of nitrate by higher plants mainly rely on nitrate transporter. When the external nitrate concentration is high, the low-affinity nitrate transport system (LATS, NRT 1 family) plays a major role. However, when the concentration of external nitrate is low, the high-affinity nitrate transporters (HATS, NRT 2 family) perform functions [4]. According to whether the synthesis is affected by the concentration of external nitrate, nitrate transporters can be divided into constitutive and inducible types. Scientists reported that many constitutive high-affinity nitrate transporters can be highly expressed even in the absence of nitrate [5]. Up to date, a total of 60 NRT genes have been found in Arabidopsis, of which 53 belong to the NRT 1 family and 7 belong to the NRT 2 family. Among the Arabidopsis thaliana NRT genes with proven functions, genes encoding proteins At NRT 1.1, At NRT 2.1, At NRT 2.2 and At NRT 2.5 are inducible, and the others NRT genes encoding proteins At NRT 1.2, At NRT 1.4, At NRT 2.3, At NRT 2.6 and At NRT 2.7 are constitutive [6]. At NRT 1.1 belongs to dual-affinity nitrate transport system. The expression of At NRT 2.5 is inhibited by nitrate. Compared with the model plant Arabidopsis thaliana, the current research on the molecular regulation mechanism of low-nitrogen tolerance-related genes in cucumber is still in its infancy.
The completion of cucumber genome sequencing work provides a good platform for the construction of large-scale cucumber genetic maps and gene cloning. Many studies have shown that adversity stresses including biological and abiotic factors can affect the absorption, transportation and assimilation of nitrogen in cucumber. For example, under low temperature, even if the nitrogen supply was sufficient, the absorption of nitrate nitrogen by cucumber roots decreased significantly. Cucumber is a typical nitrate-preferred plant. When ammoniacal nitrogen is used as the only nitrogen source, the growth of cucumber seedlings will be inhibited, and the plant will even wither in severe cases [7,8]. It was reported that the application of nitrogen fertilizer could significantly increase the absorption of calcium, magnesium and zinc by cucumber, so the yield of cucumber was greatly enhanced [9]. In the past few years, the low-affinity nitrate transporter gene of cucumber was introduced into an Arabidopsis mutant, and its nitrate absorption ability was successfully restored [10]. Zhao et al. analyzed the transcriptome data of cucumber under nitrogen-deficient condition and found that the transcription factor MYB12 can regulate auxin and ethylene signals, thereby promoting the absorption of nitrate by cucumber under nitrogen-deficient condition [11]. Although the physiological and biochemical responses of cucumber to different nitrogen nutrition levels have been extensively investigated, most studies still focus on the effects of nitrogen forms and levels on plant growth. Although the promoting effect of NFB on plant growth has been well known, the effect of NFB on the expression of transcriptome including NRT gene in plant roots has not been reported.
To reduce the environmental pollution and damage to the soil environment caused by chemical nitrogen fertilizer, the scientific and rational use of nitrogen fixing bacteria is an economic and feasible way to realize the sustainable development of agriculture. At present, research on NFB mainly focuses on the interaction mechanism between legumes and rhizobia, the isolation of NFB strains, and the use of synthetic biology for artificial nitrogen fixation. The effect of NFB agent on nitrate absorption and utilization of cucumber roots has not been studied. To reveal the interaction between NFB bacterial cells and cucumber roots and furthermore explore the law of nitrogen recycling in cucumber rhizosphere environment, four nitrate transporter genes, the Csa1G047430, Csa3G027720, Csa5G161290 and Csa2G416080 were cloned from a widely cultivated cucumber cultivar “Xintaimici” in this study, and the expression levels of these genes in cucumber roots were determined by qRT-PCR. Comparative transcriptome analysis of cucumber (Cucumis sativus L.) roots in response to NFB treatment was conducted.
2. Materials and Methods
2.1. Cucumber Cultivar and NFB Strain
The seeds of cucumber (Cucumis sativus L.) variety “Xintaimici” were purchased from the Original Seed Farm in Xintai City, Shandong Province of China. The associative nitrogen-fixing bacterium (NFB) GXGL-4A isolated from the maize (Zea mays L.) roots and its Tn5 mutants with different siderophore-producing capabilities M107 and M246-2, were used for a short-term inoculation treatment of cucumber seedlings in this study [12,13].
2.2. Cucumber Culture System
The aseptic cultivation of cucumber is carried out according to the following operation steps. Cucumber seeds were surface-sterilized with 75% ethanol for 30 s, and then soaked in 1% sodium hypochlorite for about 10 min, and finally washed thoroughly with sterile water. The treated seeds were subjected to germination in an incubator at 37 ℃. Subsequently, the germinated cucumber seeds were transferred to a closed sterile beaker (10.5 cm in diameter and 14.5 cm in height), and sown on a large piece of sterile degreasing cotton ball to fix the cucumber seedlings, and ensure that the cucumber roots will not rot due to hypoxia. The germinated seeds were divided into three groups. One group was hydroponically cultivated with sterile Hoagland nutrient solution without nitrate (Control group, supplied with sterile water), the other group was cultured in aseptic Hoagland solution (without nitrate nitrogen) added with the sterile soil extract (the treatment group 1), and the last group grown in Hoagland solution (without nitrate nitrogen) with NFB bacterial cells of GXGL-4A was recorded as the treatment group 2. The Hoagland nutrient solution was prepared with reference to the literature [14]. Considering that the NFB bacterial cells of GXGL-4A can provide nitrogen source for plant growth through biological nitrogen fixation, and more importantly, to eliminate the impact of nitrate nitrogen source in Hoagland nutrient solution on plant growth and cucumber root transcriptome, nitrate was not added in the Hoagland nutrient solution in the two treatment groups of this experiment. Except for this, other composition concentrations were the same as those in the literature. To explore the transcriptional status of the major NRT genes in cucumber roots in soil cultivation, the sterile soil extract was added in the treatment group 1 to simulate the actual level of cucumber rhizosphere nitrogen in agricultural production. The liquid soil extract was prepared according to the previous method [15]. The cucumber seedlings in the treatment group 1 and group 2 were hydroponically planted on a large sterile degreasing cotton ball floating in a closed sterile beaker (10.5 cm in diameter and 14.5 cm in height) to fix the plant. For the treatment group 2, the associative NFB bacterial cells of GXGL-4A were applied to the rhizosphere of cucumber plants when cotyledons were fully expanded.
2.3. Treatments of Cucumber Seedlings
The bacterial cells of GXGL-4A were inoculated into LB medium (Tryptone 10 g, Yeast extract 5 g, Sodium chloride 10 g) at a volume ratio of 1%, and cultured overnight at 37℃ in a shaker. Then cells were collected after a centrifugation at 8000 rpm for 8 min, and resuspended with sterile water. After two rounds of centrifugation and rinsing, the bacterial precipitate was resuspended with the same volume of sterile water. 10 mL of GXGL-4A cell suspension (about 1×10⁸ cfu/mL) was released into the rhizosphere of each cucumber seedling in the treatment group 2. In the control group, cucumber seedlings were treated with equal volume of sterile water. For the control group, 10 mL of Hoagland nutrient solution (without nitrate nitrogen) was applied to each cucumber seedling, and for the treatment group 1, 10 mL of soil extract containing 0.177 mmol/L nitrate nitrogen was used. Cucumber seedlings were treated once every 3 days, and carefully taken out after treatment for 3 times. A total of around 0.3 g of cucumber roots in each group were promptly harvested and placed in three 1.5-mL Eppendorf centrifuge tubes (about 0.1 g per tube). The cucumber root samples were stored in liquid nitrogen for subsequent experiments.
2.4. Library Preparation and Illumina HiSeq XTen/NovaSeq 6000 Sequencing
Total RNA was extracted from the cucumber roots using TRIzol® reagent (Plant RNA Purification Reagent for plant tissue) according to the manufacturer’s instructions (Invitrogen), and genomic DNA was removed using DNase I (TaKara). Then RNA quality was determined by 2100 Bioanalyzer (Agilent) and quantified using the ND-2000 (NanoDrop Technologies). Only high-quality RNA sample (OD260/280=1.8~2.2, OD260/230≥2.0, RIN≥6.5, 28S:18S≥1.0, >1 μg) was used to construct sequencing library.
RNA-seq transcriptome library of the treatment group 2 and the control group was prepared following TruSeqTM RNA sample preparation Kit from Illumina (San Diego, CA) using 1 μg of total RNA. Shortly, the messenger RNA was isolated according to polyA selection method by oligo (dT) beads and then fragmented by fragmentation buffer firstly. Secondly, the double-stranded cDNA was synthesized using a Superscript double-stranded cDNA synthesis kit (Invitrogen, CA) with random hexamer primers (Illumina). Then the synthesized cDNA was subjected to end-repair, phosphorylation and ‘A’ base addition according to Illumina’s library construction protocol. Libraries were size selected for cDNA target fragments of 300 bp on 2% Low Range Ultra Agarose followed by PCR amplification using Phusion DNA polymerase (NEB) for 15 PCR cycles. After a quantification by TBS380, the paired-end RNA-seq sequencing library was sequenced on the Illumina HiSeq XTen/NovaSeq 6000 platforms (2 × 150 bp read length).
2.5. Read Mapping
The raw paired end reads were trimmed and quality controlled by SeqPrep (https://github.com/jstjohn/SeqPrep) and Sickle (https://github.com/najoshi/sickle) with default parameters. Then, the clean reads were separately aligned to the reference genome of cucumber ‘Chinese long’ with orientation mode using HISAT2 (http://ccb.jhu.edu/software/hisat2/index.shtml) software [16]. The mapped reads of each sample were assembled by StringTie (https://ccb.jhu.edu/software/stringtie/index.shtml?t=example) in a reference-based approach [17].
2.6. Differential Expression Analysis and Functional Enrichment
To identify the differentially expressed genes (DEGs) between samples, the expression level of each transcript was calculated according to the transcripts per million reads (TPM) method. RSEM (http://deweylab.biostat.wisc.edu/rsem/) was used to quantify gene abundances [18]. Differential expression analysis was performed using the softwares, i.e. DESeq2 and the EdgeR with Q value ≤ 0.05, and the DEGs with |log2FC|>1 and Q value ≤ 0.05 were significantly different at transcriptional level [19,20]. In addition, the functional-enrichment analysis including GO and KEGG were conducted to identify those DEGs significantly enriched in GO terms and metabolic pathways at a Bonferroni-corrected P-value (≤0.05) compared with the whole-transcriptome background. Eventually, GO functional enrichment and KEGG pathway analyses were carried out by Goatools (https://github.com/tanghaibao/Goatools) and KOBAS (http://kobas.cbi.pku.edu.cn/home.do) [21].
2.7. Quantitative Real-Time PCR Analysis of Cucumber NRT Genes
Four major functional genes related to the nitrate transport in cucumber roots of “Xintaimici” were cloned using PCR. PCR primer pairs for the amplifications of NRT genes were designed according to the nucleotide sequences of cucumber cultivar “Chinese Long” (ftp://cucubitgenomics.org/pub/cucurbit/genome/cucumber/Chinese_long/) [22]. Total DNA was extracted from cucumber seedlings using EZ-10 Spin Column Plant Genomic DNA Purification Kit from Sangon Biotech (Shanghai) Co., Ltd. (Order No.: B518261). PCR was conducted to amplify DNAs of four NRT genes in the genome of cucumber “Xintaimici”. Total RNA was isolated using the EZ-10 Spin Column Total RNA Isolation Kit (Sangon, Shanghai, the order No.: B610583). The first-strand cDNA synthesis was performed using Sangon biotech's First Strand cDNA Synthesis Kit (Order NO.: B300537). All the experimental procedures were carried out according to the manufacturers’ instructions.
The expression levels of NRT genes in cucumber roots were determined with a housekeeping gene β-actin as internal control by quantitative real-time PCR (qRT-PCR). PCR primers used for the subclone of cucumber NRT genes and the subsequent qRT-PCR analysis are shown in Table 1. The qRT-PCR reaction mixture consisted of CybrGreen qPCR Master Mix (High Rox, B639273, BBI) 10 μL, forward and reverse primers 0.4 μL each, 2 μL of cDNA template, and ddH2O 7.2 μL. Real-time PCR were assayed in an ABI StepOnePlus thermocycler (ABI, Foster, CA, USA). Experiments were replicated three times.
2.8. Drought Treatment of Cucumber Seedlings
A total of 80 g of sterile vermiculite was placed in a 1-liter beaker, and five surface-disinfected cucumber seeds were sewed in each beaker. At the stage of two leaves and one heart, the cucumber seedlings were subjected to NFB treatment. The NFB strains GXGL-4A, M107 and M246-2 were inoculated at 1% (V/V) and incubated overnight in 200-mL LB medium. Then, the bacterial cells were harvested by centrifugation at 8,000 g for 5 min, and resuspended with sterile water. The processes duplicated twice, and finally the bacterial sediment was suspended in an equal amount of sterile water. 5 mL of bacterial suspension (108-109 CFU/mL) per plant was fertilized in the seedling rhizosphere. The fertilization was conducted every three days with three biological replicates for a total of five treatments. After NFB treatment, the cucumber seedlings were placed in a growth chamber at 28℃, and subjected to a drought treatment for 10 days (no watering). At the same time, a blank control group was set up for normal watering.
2.9. Determination of Rhizosphere Electrical Conductivity (EC)
About 5 g of vermiculite in the cucumber rhizosphere was taken from each experimental group, and then mixed with 25 mL of deionized water. The electrical conductivity (EC) was evaluated after a thorough stirring.
2.10. Statistical Analysis
The relative gene expression levels were calculated by the 2-ΔΔCt square method, and statistical analysis of the data were done using the software IBM SPSS 17 (ANOVA).
3. Results
3.1. Subclone of the Cucumber NRT Genes
Four genes involved in nitrate transport in cucumber roots were isolated from cucumber “Xintaimici” based on the reported genomic information of cucumber “Chinese long”. Among them, the three genes, Csa2G416080, Csa5G161290 and Csa3G027720 belong to the dual-affinity nitrate transporter gene family (NRT1.1), and the Csa1G047430 gene belongs to the high-affinity nitrate transporter gene family (HAT, NRT2). The results of PCR subcloning were consistent with expectations (Figure 1, Table 1).
3.2. Relative Transcriptional Levels of the NRT Genes in Cucumber Roots
The cucumber seedlings planted in different hydroponic systems containing the Hoagland nutrient solution without nitrate were subjected to qRT-PCR analysis of the differentially expressed NRT genes in roots. The samples in the treatment group 1 were detected to have an increase at the transcriptional levels of the genes Csa2G416080 and Csa1G047430 compared with that of the control group (Figure 2A,C), and the gene Csa5G161290 showed a decreased transcriptional level (Figure 2B). It should be noted that the transcriptional level of gene Csa3G027720 in samples of the treatment group 1 was significantly higher than that of the control group (Figure 2D).
Fluorescence quantitative results showed that the relative expression of the gene Csa1G047430 in the treatment group 2 decreased (Figure 3C), and on the contrary the transcriptional level of the gene Csa2G416080 increased (Figure 3A). However, the expression level differences of these two genes were not significant between the control group and the treatment group 2. Compared with the control group, the transcriptional levels of the two genes, Csa5G161290 and 3G027720 were significantly increased (p<0.05 and p<0.01, respectively. Figure 3B,D).
3.3. Illumina RNA Sequencing (RNA-Seq) and Sequence Assembly
A RNA-Seq-based transcriptome profiling of nitrogen metabolism response under NFB treatment in cucumber roots was performed, and a total of 38.46 GB clean data was obtained from 6 cucumber root samples. There were 3 samples in the treatment group 2 and the control group respectively. The clean data of each sample was more than 6.07 GB, and the percentage of Q30 base was over 95.18%. Clean reads from each cucumber sample were sequenced with the reference genome of Cucumis sativus 9930 (genome version: V3, http://cucurbitgenomics.org/organism/20), and the alignment rate ranged from 86.9% to 96.8%. The sequence data are deposited in NCBI Sequence Read Archive (SRA, http://www.ncbi.nlm.nih.gov/Traces/sra) with the BioProject ID PRJNA766832. A total of 21,158 unigenes (including 1,037 unknown genes) and 38,569 expressed transcripts that consisted of 19,275 known transcripts and 19,294 new transcripts were detected.
The unigenes and transcripts were annotated by searching the reference sequences using BLASTX against the major functional databases, i.e. NR, Swiss-Port, COG, GO, Pfam and KEGG, and the statistics of annotation results for cucumber “Xintaimici” unigenes is shown in Figure S1 and Table S1. The assembly produced a substantial number of long transcripts: 1,084 transcripts were < 200 bp in length and 3,3943 transcripts were > 1,000 bp. About half of the transcripts were between 200 and 1800 bp in length. 21552 transcripts were > 1,800 bp in length (Figure S2).
3.4. Expression Level Analysis of C. sativus Unigenes and Transcripts
The expression levels of unigenes and transcripts in cucumber (C. sativus L.) roots were analyzed quantitatively using the expression quantitative software RSEM (http://deweylab.github.io/RSEM/). The quantitative index is TPM, which refers to taking the number of transcripts as the calculation unit and using the number of transcripts instead of the number of spliced fragments. Considering the length of transcripts and the number of unigenes expressed in samples, the quantification is more accurate under certain conditions, especially when the total number of genes expressed among samples varies greatly. Eventually a total of 24,317 unigenes/transcripts were obtained by BLAST against the genome of C. sativus 9930 (version no: V3) (http://cucurbitgenomics.org/organism/20). The expression distribution of unigenes or transcripts in each sample of the treatment group 2 and the control group was similar, and there was no significant difference (Figure S3). The common and unique expressed genes/transcripts among different groups was analyzed. Venn analysis showed that 15,832 genes/transcripts were shared by the treatment group 2 and the control group, 463 specifically expressed genes/transcripts in the control group and 540 in the treatment group 2.
3.5. Variation in Gene Expression Among Groups
After obtaining the read counts of unigenes/transcripts, we can identify the differentially expressed genes (DEGs)/transcripts (DETs) between samples by using the softwares, DESeq2 and EdgeR (P-adjust < 0.05, |log2FC| ≥ 1). A total of 418 genes, including 174 up-regulated and 244 down-regulated genes, were identified in the treatment group 2 compared to the control group (Figure 4). The detailed gene expression differences were shown in Table S2.
3.6. GO Functional Classification of the DEGs
Functional classification analysis based on gene ontology (GO) was carried out on the C. sativus DEGs. Based on sequence homology, the 418 DEGs can be categorized into 20 functional groups. In each of the main categories, i.e. biological process (BP), cellular component (CC) and molecular function (MF) of the GO classification, ‘metabolic process’, ‘membrane part’ and ‘binding’ were dominant respectively. In addition, we found a high-percentage of genes from categories of ‘cellular process’, ‘cell part’ and ‘catalytic activity’ and only a few genes from terms of ‘reproductive process’, ‘protein-containing complex’ and ‘antioxidant activity’ (Figure 5).
3.7. Functional Classification of C. sativus DEGs by COG
To further explore the DEGs of C. sativus between the treatment group 2 and the control group, we searched the annotated sequences for the genes involved in Clusters of Orthologous Groups of proteins (COG) classifications. All the DEGs are aligned to COG database to predict and classify possible functions. In this study, a total of 316 DEGs were assigned to 19 categories, the cluster for ‘poorly characterized’ (195, 61.71%) was the largest group, followed by ‘information storage and processing’ (23, 7.28%), ‘cellular processes and signaling’ (20, 6.33%) and ‘metabolism’ (14, 4.43%) (Table 2).
3.8. Functional Classification of C. sativus DEGs by KEGG
To understand the biological pathways that might be active in C. sativus, the DEGs were compared against the Kyoto Encyclopedia of Genes and Genomes (KEGG) database. The results revealed that 57 of the 174 up-regulated genes were assigned to 13 KEGG pathways. The pathways with most representation by the unique sequences were signal transduction (10, 17.54%), carbohydrate metabolism (9, 15.79%) and biosynthesis of other secondary metabolites (7, 12.28%) (Figure 6A). Furthermore, 49 of 244 down-regulated genes were assigned to 13 KEGG pathways. The dominant pathway was biosynthesis of other secondary metabolites (10, 20.41%), followed by pathways of energy metabolism (8, 16.33%) and amino acid metabolism (8, 16.33%) (Figure 6B). The classification of KEGG pathways provides a valuable guide for investigating specific process, functions and pathways during C. sativus NFB-application response research.
3.9. GO Enrichment Analysis of C. sativus DEGs
Go enrichment analysis is to classify the differential genes according to GO, and analyze the significance, misjudgment rate and enrichment of the classification results based on discrete distribution, to obtain the functional classification of a targeted gene with low misjudgment rate, which is significantly related to the experimental purpose. This classification is the most important functional difference leading to the difference of sample traits. In the data analysis of cucumber transcriptome sequencing, we can find out which changed genes belong to a common GO functional branch, and use statistical methods to test whether the results are statistically significant, to get what biological functions the changed genes are mainly involved in. GO enrichment analysis of C. sativus DEGs was carried out using the software Goatools, to obtain the main GO functions of genes in the gene set (Klopfenstein et al. 2018). Fisher tests were performed with the Goatools Python module. When the corrected P values (P-adjust) is less than 0.05, it is considered that this GO function is significantly enriched. The results showed that the functional enrichment of GO with P-adjust value less than 0.5 came from 114 DEGs, including ‘transmembrane protein activity’ (34, 29.82%), ‘transporter activity’ (35, 30.70%), ‘tetrapyrrole binding’ (20, 17.54%), ‘inorganic anion transmembrane transporter activity’ (6, 5.26%), ‘heme binding’ (17, 14.91%) and ‘betaine-homocysteine S-methyltransferase activity’ (2, 1.75%). However, all the functional enrichment levels of the above-mentioned GO terms did not reach significant differences (Figure 7A).
3.10. KEGG Enrichment Analysis of C. sativus DEGs
The R script was used for KEGG pathway enrichment analysis on the C. sativus DEGs in this study. When the P-adjust value is less than 0.05, it is considered that there is a significant enrichment of KEGG pathway. The calculation principle is the same as that of GO functional enrichment analysis, finally, 59 DEGs were enriched into 17 KEGG pathways, including ‘phenylpropanoid biosynthesis’ (11, 18.64%), ‘cysteine and methionine metabolism’ (6, 10.17%), ‘MAPK signaling pathway-plant’ (6, 10.17%) and ‘ubiquinone and other terpenoid-quinone biosynthesis’ (4, 6.78%) and so on. It is worth noting that only the KEGG pathway of phenylpropanoid biosynthesis of these enriched pathways reached a significant level (P-adjust=0.0279) (Figure 7B).
3.11. EC Evaluation
Under normal watering conditions, there was no significant differences in EC values among the experimental groups, and they were all at a low level. However, under drought treatment conditions, the EC values of three NFB treatment groups were all extremely significantly higher than that of the control group (P<0.001) (Figure 8).
4. Discussion
Considering that it is difficult to keep the composition of soil extract consistent in soil environment, we only did the differential transcriptome analysis between the treatment group 2 and the control group. In actual production, the growth of cucumber is affected by microorganisms and nutritional conditions in soil environment, so the growth promoting effect of nitrogen-fixing bacteria is not stable. Soil extract treatment can only partially simulate the microenvironment of cucumber rhizosphere. It is difficult to ensure the consistency of soil extract composition and content in rhizosphere soil sampling of plants, so we did not do the differential transcriptome analysis of cucumber roots between the treatment group 1 and the control group.
The transcriptome analysis showed that when treated with the NFB bacterial cells of GXGL-4A, a gene that involved in the zeatin biosynthesis (CsaV3_5G006200 encoding cytokinin dehydrogenase and one brassinosteroid biosynthesis gene (CsaV3_3G034190 encoding 3-oxo-5-alpha-steroid 4-dehydrogenase) of C. sativus were apparently up-regulated at the transcriptional level. Moreover, several ethylene-responsive transcription factors such as ERF019 (CsaV3_2G033120) exhibited a significantly up-regulated response too. It should be emphasized that the expression of CsaV3_3G034190 gene was not detected in all the samples of the control group, suggesting that the short-term fertilization of the NFB GXGL-4A agent induced the expression of 3-oxo-5-alpha-steroid 4-dehydrogenase encoded by the gene CsaV3_3G034190 (Figure 9A). On the other hand, the expression levels of genes, CsaV3_1G044030 and CsaV3_6G042970 respectively encoding a 23 kDa jasmonate-induced protein-like (JIP23-like) and salicylic acid-binding protein 2 (SABP2) significantly decreased (Figure 9B). Brassinosteroids (BRs) are steroid hormones that are essential for plant growth and development. Responses to these hormones are mediated by transcription factors of the bri1-EMS suppressor 1/brassinazole resistant 1 subfamily, and BRs activate these factors by impairing their inhibitory phosphorylation by GSK3/shaggy-like kinases [23]. Brassinosteroid regulates seed size and shape in Arabidopsis [24]. Recently, scientists revealed that Brassinosteroid-mediated reactive oxygen species are essential for tapetum degradation and pollen fertility in tomato [25]. The ethylene-responsive factor 19 gene (ERF019) in Arabidopsis thaliana, AtERF019 negatively regulates plant resistance to Phytophthora parasitica by suppressing PAMP-triggered immunity, suggesting the importance of ERF019 in mediating plant susceptibility to phytopathogens through suppression of pathogen-associated molecular pattern-triggered immunity [26]. Zeatin, a cytokinin first isolated from the endosperm of Indian corn can promote cell division, and Biosynthesis and metabolism studies of zeatin have been well investigated during the past decades [27,28]. In excised leaf tissues of barley, as one major jasmonate effect, the induction of novel abundant proteins designated jasmonate-induced proteins (JIPs) have been observed, and JIP23 has been implicated in translational control [29,30]. High-affinity SABP2 is required for plant innate immunity and has salicylic acid-stimulated lipase activity [31]. We noticed that the genes related to auxin in cucumber roots had different responses on the treatment of NFB bacterial cells of GXGL-4A. The expression of WAT1 gene involved in the transport of auxin in plant vacuoles was down-regulated, but the expression levels of most genes related to cucumber auxin were significantly increased. Since NFB treatment leads to the enhancement of the transcription levels of multiple genes involved in the biosynthesis or regulation of plant growth-promoting, we speculate that nitrogen fixing bacteria not only provide nitrogen nutrition for plants, but also affect hormone synthesis in plant roots. The promoting effect of the NFB bacterial strain GXGL-4A on plant growth may be partly due to the changes of plant endogenous growth hormone.
Some genes related to stress resistance to adverse factors in cucumber had also changed significantly. The gene CsaV3_1G011730 encoding wound-responsive family protein played an extremely significant up regulation. Similarly, the gene CsaV3_6G015610 encoding heat stress transcription factors A-4c-like was also significantly up-regulated at the transcriptional level. However, the DEGs, CsaV3_2G026600 and CsaV3_3G012910 respectively encoding the heat stress transcription factors B-4 and A-6b responded negatively. Additionally, the DEGs encoding the myb-like transcription factor family proteins (CsaV3_2G025610 and CsaV3_6G003320) showed a significant down-regulation (Figure 10).
To adapt to microbial habitats and resist phytopathogens, plants evolved two defense systems, PTI and ETI [32]. Plants triggered PTI by recognizing pathogen-associated molecular patterns (PAMPs) by recognizing pattern recognition receptors (PRRs). The plant-encoded R protein and the corresponding pathogenic effector protein Avr occurred directly or indirect interactions to trigger a defense response, this is the effectors triggered immunity (ETI). Many studies showed that ethylene, salicylic acid and jasmonic acid were related to plant disease resistance. Salicylic acid (SA) could induce the expression of a variety of disease-related protein genes to resist disease. SA participated in the process of PTI and ETI, and could also cause hypersensitivity reactions in plants and cause programmed death. Jasmonic acid (JA) was essential for plants to cope with biological stress [33]. Ethylene was the only gaseous hormone in plants, and played a vital role in the growth, development and resistance of plants [34]. In most cases, the ethylene and JA signaling pathways together activated the expression of disease resistance genes [35,36,37]. Ethylene could also regulate the antagonism between SA and JA signaling pathways by enhancing the disease resistance response mediated by salicylic acid/NPR1 to increase plant resistance [38]. After the treatment of cucumber by the NFB strain GXGL-4A, five ethylene-related transcription factors all showed up-regulation, and the expression of JA and SA-related genes decreased. We assume that the nitrogen-fixing bacterium GXGL-4A may affect the resistance of cucumber plants to phytopathogens.
When facing the adverse environment or pathogenic bacteria, plants could only use the self-protection mechanism formed in the long-term continuous evolution process to resist and continuously adapt to the damage of the harsh environment and the invasion of pathogenic microorganisms. Studies showed that plants had evolved a variety of leucine-rich repeats (LRRs) proteins in the process of facing the ever-changing external environment. LRRs played an extremely important role in plant growth, development and plant disease resistance and defense. After treatment with the nitrogen-fixing bacterium GXGL-4A, four of LRR-related genes appeared up-regulated in response. The SWEET gene was regulated by plant hormones, abiotic or biotic stresses [39,40]. Mildew resistance locus o (MLO) was related to powdery mildew resistance [41]. These genes appeared to be down-regulated in response. Many transcription factors involved in the regulation of plant adversity stress also showed down-regulation responses. For example, the HSP transcription factor related to plant heat tolerance, and the expression of bHLH transcription factor are related to salt stress [42]. MYB transcription factor family proteins were the most abundant in plants and they regulate plant stress responses and plant secondary metabolism, and respond to hormones and environmental factors, and contribute to cell differentiation, organ formation and disease resistance [43]. In this study, five MYB transcription factors were found to be significantly down-regulated. This may lead to the change of cucumber resistance to some stresses. Some genes encoding NAC transcription factors that respond to drought and salt stress were reduced at the transcriptional level, and some genes are expressed higher [44,45].
Phenylpropanoids contribute to all aspects of plant responses towards biotic and abiotic stimuli. They are not only indicators of plant stress responses upon variation of light or mineral treatment, but are also key mediators of the plant’s resistance towards pests [46]. The general phenylpropanoid metabolism generates an enormous array of secondary metabolites based on the few intermediates of the shikimate pathway as the core unit [47]. In this study, the results of KEGG pathway enrichment for analysis of C. sativus DEGs showed that only the phenylpropanoid biosynthesis pathway was significantly enriched among the KEGG pathways of all the detected DEGs. Therefore, we speculate that the NFB bacterial strain GXGL-4A, as a biological stimulus, promote the phenylpropanoid biosynthesis in cucumber roots after colonization in cucumber rhizosphere.
Cucumber is a major cultivated vegetable crop of the world, and its absorption and utilization of nitrogen are mainly accomplished through nitrate transporters. In the experiment, four NRT genes (Csa2G416080, Csa5G161290, Csa3G027720 and Csa1G047430) were successfully cloned, and furthermore qRT-PCR determination was performed on these genes under different conditions. Csa1G047430 belonged to the NRT2 family of genes. The NRT2 gene could be induced and synthesized by nitrate [48]. The expression of Csa1G047430 was significantly increased after treatment with the NFB bacterial strain GXGL-4A, indicating that this microorganism can significantly improve the expression of NRT2 gene in a low-nitrogen environment, and enhance the absorption of nitrogen for plant. NRT1.1 was the sole dual-affinity nitrate transport system in the NRT1 family. Csa2G416080, Csa5G161290, and Csa3G027720 all belonged to the NRT1.1 family. A low concentration of nitrate in plant roots could stimulate the expression of AtNRT1.1 [49]. After adding a small amount of soil extract in a hydroponic environment lacking nitrate nitrogen, the expression of Csa3G027720 gene in cucumber roots was significantly increased, which was the same as the expression of NFB treatment. When the nitrate content was sufficient, the expression of NRT1.1 gene was down-regulated. In the absence or low concentration of nitrate, the expression of NRT1.1 gene would increase [50]. The GXGL-4A cells can provide a certain amount of nitrogen nutrition for cucumber plant growth. The transcriptome analysis of C. sativus showed that most of the genes related to nitrate transport were in a state of insignificant difference between groups. Only Nitrate reductase (CsaV3_3G036500), high-affinity nitrate transporter 3.1-like (CsaV3_1G008910) and the ferredoxin-nitrite reductase (CsaV3_3G018610) showed a significant down-regulation (Figure 11). We assumed that the main nitrogen source in a hydroponic environment was ammonium-nitrogen, and the increase of nitrate reduction products had a negative regulatory effect on nitrate reductase and ferredoxin-nitrite reductase. Previous reports revealed that the expression of At NRT 3.1 and At NRT 3.2 genes in Arabidopsis NRT 3 family was regulated by the NRT 2 gene and was not a nitrate transporter. NRT1.1 family genes were widely distributed in cucumber plants and had many functions. Studies had shown that Arabidopsis NRT1.1 could not only participate in high-affinity and low-affinity nitrate transport, but also was involved in the regulation of root auxin [51,52].
Rhizosphere EC has important applications in agriculture. Soil fertility and plant nutritional status can be assessed by monitoring the soil EC values. A high EC value may indicate that the soil contains more soluble nutrients, which are beneficial for plant growth. In addition, the changes in rhizosphere EC can also serve as indicators for monitoring soil pollution and plant health status. In this study, under drought stress, the rhizosphere ECs of cucumber treated with NFB strains were significantly higher than that of the blank control group, indicating that a short-term NFB fertilization can significantly improve the drought resistance of cucumber.
5. Conclusions
The NFB strains from non-leguminous plants have been widely used in agricultural production as an effective component of plant growth promoting agent, but the effects of NFB on nitrogen absorption and utilization in plant roots are rarely reported. Here, we detected the DEGs profile in C. sativus roots treated with the NFB bacterial cells of K. radicincitans GXGL-4A through transcriptome analysis. Based on subcloning four major NRT genes of C. sativus “Xintaimici”, we further analyzed the differential expression of these genes using qRT-PCR. The results showed that the expression of NRT1.1-related genes was significantly increased in cucumber roots after treatment with GXGL-4A cells. Some genes involved in the biological processes of auxin and cytokinin showed an up-regulated response. Additionally, a few of DEGs related to the biosynthesis of plant hormones including zeatin and brassinosteroid, and plant resistance to environmental stresses had a significant up-regulation response at the transcriptional level. KEGG pathway enrichment analysis of C. sativus DEGs revealed that phenylpropanoid biosynthesis pathway was significantly enriched, suggesting multiple aspects of cucumber plant responses towards the biotic stimulation from GXGL-4A. It was speculated that the application of NFB bacterial cells of GXGL-4A can not only provides nitrate nitrogen for the growth of cucumber seedlings, but also plays a potentially important role in regulating the biosynthesis and metabolism of some plant endogenous hormones. The results provide theoretical guidance for making full and rational use of NFB agents in sustainable agricultural production, to reduce the application of chemical nitrogen fertilizer, improve crop yield and protect farmland ecological environment.
Supplementary Materials
The following supporting information can be downloaded at the website of this paper posted on Preprints.org. Figure S1: Functional annotation statistics of C. sativus unigenes. The abscissa represents the database name, and the ordinate indicates the number or percentage of sequences annotated to the database. Figure S2: Length distribution of assembled C. sativus transcripts. The abscissa shows the transcript length range and the ordinate exhibits the number of transcripts within the length range of the transcript. Figure S3: Expression distribution of the detected unigenes and transcripts. The abscissa displays the sample names, and the ordinate indicates the expression levels of unigenes and transcripts detected in this study. Take the log10 logarithm processed value. Each color in the figure represents a sample, and most of the swelling in the figure represents the region with the most concentrated gene expression in the whole sample. This picture shows the expression distribution of the detected unigenes and transcripts in each sample of the treatment group 2 (samples were designated as C_T_1, C_T_2 and C_T_3, respectively) and the control group (samples were designated as C_CK_1, C_CK_2 and C_CK_3, respectively). Table S1: Annotation statistics of the unigenes and transcripts. Table S2: List of the significantly differentially expressed genes (DEGs) in this study.
Author Contributions
Conceptualization, Y.C; methodology and investigation, B.F. and E.W.; data curation, B.F. and L.X.; formal analysis, Y.Z. and Y.X.; writing-original draft preparation, B.F.; writing-reviewing and editing, Y.C; software, Y.Z. and E.W.; supervision, Y.C.; project administration, Y.C.; funding acquisition, Y.C. All authors have read and agree to the published version of the manuscript.
Funding
This work was financially supported by the National Natural Science Foundation of China (No. 31870496).
Data Availability Statement
The original contributions presented in the study are included in the article/Supplementary Materials, further inquiries can be directed to the corresponding author. The RNA-seq transcriptome data of the C. sativus roots are available at the National Center for Biotechnology Information (NCBI) Sequence Read Archive BioProject Database (PRJNA766832).
Acknowledgments
The authors thank Mengting Zhang (Department of Resources and Environment, School of Agriculture and Biology, Shanghai Jiao Tong University) and Yuqing Bao (School of Health Science and Engineering, University of Shanghai for Science and Technology) for helping to construct and preserve Tn5 mutants of the nitrogen-fixing bacterium GXGL-4A.
Conflicts of Interest
The authors declare no conflicts of interest.
References
- Le, C.; Zha, Y.; Li, Y.; Sun, D.; Lu, H.; Yin, B. Eutrophication of lake waters in China: cost, causes, and control. Environ Manage 2010, 45: 662–668. [CrossRef]
- Davidson, E.A. The contribution of manure and fertilizer nitrogen to atmospheric nitrous oxide since 1860. Nat Geosci 2009, 2: 659–662. [CrossRef]
- Matsuyama, N.; Saigusa, M.; Sakaiya, E.; Tamakawa, K.; Oyamada, Z.; Kudo, K. Acidification and soil productivity of Allophanic andosols affected by heavy application of fertilizers. Soil Sci Plant Nutr 2005, 51:117–123. [CrossRef]
- Lee, R.B.; Drew, M.C. Nitrogen-13 studies of nitrate fluxes in barley roots. J Exp Bot 1986, 37: 1768–1779. [CrossRef]
- Orsel, M.; Krapp, A.; Daniel, V. F. Analysis of the NRT2 nitrate transporter family in Arabidopsis. Structure and gene expression. Plant Physiol 2002, 129: 886–896. [CrossRef]
- Okamoto, M.; Vidmar, J.J.; Glass, A.D.M. Regulation of NRT1 and NRT2 gene families of Arabidopsis thaliana: Responses to nitrate provision. Plant Cell Physiol 2003, 44: 304–317. [CrossRef]
- Matsumoto, H.; Wakiuchi, N.; Takahashi, E. Changes of sugar levels in cucumber leaves during ammonium toxicity. Physiol Plantarum 1968, 21: 1210–1216. [CrossRef]
- Kronzucker, H.J.; Britto, D.T.; Davenport, R.J.; Tester, M. Ammonium toxicity and the real cost of transport. Trends Plant Sci 2001, 6: 335–337. [CrossRef]
- Chen, F. Effects of application and ratio of nitrogen,phosphorus,and potassium on mineral nutrient absorption and yield of cucumber (Cucumis sativus L.). J Northwest A & F Univ (Nat Sci) 2015, 43: 174–180.
- Wu, T.; Qin, Z.W.; Fan, L.X.; Xue, C.B.; Zhou, X.Y.; Xin, M.; Du, Y.L. Involvement of CsNRT1.7 in nitrate recycling during senescence in cucumber. J Plant Nutr Soil Sci 2014, 177: 714-721.
- Zhao, W.; Yang, X.; Yu, H.; Jiang, W.; Sun, N.; Liu, X.; Liu, X.; Zhang, X.; Wang, Y.; Gu, X. RNA-seq-based transcriptome profiling of early nitrogen deficiency response in cucumber seedlings provides new insight into the putative nitrogen regulatory network. Plant and Cell Physiol 2014, 56: 455–467. [CrossRef]
- Sun, S.X.; Chen, Y.P.; Cheng, J.J.; Li, Q.J.; Zhang, Z.C.; Lan, Z.L. Isolation, characterization, genomic sequencing, and GFP-marked insertional mutagenesis of a high-performance nitrogen-fixing bacterium, Kosakonia radicincitans GXGL-4A and visualization of bacterial colonization on cucumber roots. Folia Microbiol 2018, 63: 789–802. [CrossRef]
- Feng, B.Y.; Zhang, M.T.; Su, G.X.; Bao, Y.Q.; Xu, Y.; Chen, Y.P. Siderophore Synthesis Ability of the Nitrogen-Fixing Bacterium (NFB) GXGL-4A is Regulated at the Transcriptional Level by a Transcriptional Factor (trX) and an Aminomethyltransferase Encoding Gene (amt). Curr Microbiol 2022, 79(12): 369-382. [CrossRef]
- Li, H.Z.; Cheng, Z.H. Hoagland nutrient solution promotes the growth of cucumber seedlings under light-emitting diode light. Acta Agriculturae Scandinavica, Sec B-Soil & Plant Sci 2015, 65(1): 74–82. [CrossRef]
- Vilain, S.; Luo, Y.; Hildreth, M.B.; Brözel, V.S. Analysis of the life cycle of the soil saprophyte Bacillus cereus in liquid soil extract and in soil. Appl Environ Microb 2006, 72(7): 4970–4977. [CrossRef]
- Kim, D.; Langmead, B.; Salzberg, S.L. HISAT: A fast spliced aligner with low memory requirements. Nat Methods 2015, 12: 357–362. [CrossRef]
- Pertea, M.; Pertea, G.M.; Antonescu, C.M.; Chang, T.C.; Mendell, J.T.; Salzberg, S.L. StringTie enables improved reconstruction of a transcriptome from RNA-seq reads. Nat Biotechnol 2015, 33: 290–295. [CrossRef]
- Li, B.; Dewey, C.N. RSEM: accurate transcript quantification from RNA-Seq data with or without a reference genome. BMC Bioinformatics 2011, 12: 1–16. https://doi:10.1186/1471-2105-12-323.
- Love, M.I.; Huber, W.; Anders, S. Moderated estimation of fold change and dispersion for RNA-seq data with DESeq2. Genome Biol 2014, 15: 550.
- Robinson, M.D.; McCarthy, D.J.; Smyth, G.K. edgeR: a bioconductor package for differential expression analysis of digital gene expression data. Bioinformatics 2010, 26: 139–140. [CrossRef]
- Xie, C.; Mao, X.; Huang, J.; Ding, Y.; Wu, J.; Dong, S.; Kong, L.; Gao, G.; Li, C.Y.; Wei, L. KOBAS 2.0: a web server for annotation and identification of enriched pathways and diseases. Nucleic Acids Res 2011, 39: 316–322. [CrossRef]
- Li, Q.; Li, H.; Wang, S.; Huang, W.; Ruan, J.; Huang, S.; Xu, Y.; Zhou, Q.; Zhang, Z. A chromosome-scale genome assembly of cucumber (Cucumis sativus L.). GigaScience 2019, 8: giz072. [CrossRef]
- Miller, C.O. Evidence for the natural occurrence of zeatin and derivatives: Compounds from maize which promote cell division. PNAS 1965, 54: 1052–1058. [CrossRef]
- Jiang, W.B.; Huang, H.Y.; Hu, Y.W.; Zhu, S.W.; Wang, Z.Y.; Lin, W.H. Brassinosteroid regulates seed size and shape in Arabidopsis. Plant Physiol 2013, 162: 1965–1977. [CrossRef]
- Yan, M.Y; Xie, D.L.; Cao, J.J.; Xia, X.J.; Shi, K.; Zhou, Y.H.; Zhou, J.; Foyer, C.H.; Yu, J.Q. Brassinosteroid-mediated reactive oxygen species are essential for tapetum degradation and pollen fertility in tomato. Plant J 2020, 102: 931–947. [CrossRef]
- Lu, W.; Deng, F.; Jia, J.; Chen, X.; Li, J.; Wen, Q.; Li, T.; Meng, Y.; Shan, W. The Arabidopsis thaliana gene AtERF019 negatively regulates plant resistance to Phytophthora parasitica by suppressing PAMP-triggered immunity. Mol Plant Pathol 2020, 21: 1179–1193. [CrossRef]
- Miller, C.O. Evidence for the natural occurrence of zeatin and derivatives: Compounds from maize which promote cell division. PNAS 1965, 54: 1052–1058. [CrossRef]
- Görschen, E.; Dunaeva, M.; Reeh, I.; Wasternack, C. Overexpression of the jasmonate-inducible 23 kDa protein (JIP 23) from barley in transgenic tobacco leads to the repression of leaf proteins. FEBS Lett 1997, 419: 58–62. [CrossRef]
- Becker, W.; Apel, K. Isolation and characterization of a cDNA clone encoding a novel jasmonate-induced protein of barley (Hordeum vulgare L.). Plant Mol Biol 1992, 19: 1065–1067. [CrossRef]
- Görschen, E.; Dunaeva, M.; Reeh, I.; Wasternack, C. Overexpression of the jasmonate-inducible 23 kDa protein (JIP 23) from barley in transgenic tobacco leads to the repression of leaf proteins. FEBS Lett 1997, 419: 58–62. [CrossRef]
- Kumar, D.; Klessig, D.F. High-affinity salicylic acid-binding protein 2 is required for plant innate immunity and has salicylic acid-stimulated lipase activity. PNAS 2003, 100(26): 16101–16106. [CrossRef]
- Li, W.; Deng, Y.; Ning, Y.; He, Z.; Wang, G. Exploiting broad-spectrum disease resistance in crops: From molecular dissection to breeding. Annu Rev Plant Biol 2020, 71: 575–603. [CrossRef]
- Balbi, V.; Devoto, A. Jasmonate signalling network in Arabidopsis thaliana: crucial regulatory nodes and new physiological scenarios. New Phytol 2007, 177: 301–318. [CrossRef]
- Guo, H.; Ecker, J.R. The ethylene signaling pathway: new insights. Curr Opin Plant Biol 2004, 7: 40–49. [CrossRef]
- Kunkel, B.N.; Brooks, D.M. Cross talk between signaling pathways in pathogen defense. Curr Opin Plant Biol 2002, 5: 325–331. [CrossRef]
- Lorenzo, O.; Piqueras, R.; Sánchez, S.J.J.; Solano, R. Ethylene response factor1 integrates signals from ethylene and jasmonate pathways in plant defense. Plant Cell 2002, 15: 165–178. [CrossRef]
- Spoel, S.H.; Koornneef, A.; Claessens, S.M.C.; Korzelius, J.P.; Pelt, J.A.V.; Mueller, M.J.; Buchala, A.J.; Métraux, J.P.; Brown, R.; Kazan, K.; Loon, L.C.V.; Dong, X.; Pieterse, C.M.J. NPR1 modulates cross-talk between salicylate-and jasmonate-dependent defense pathways through a novel function in the cytosol. Plant Cell 2003, 15: 760–770. [CrossRef]
- Leon, Reyes.A; Spoel, S.H.; Lange, E.D.; Hiroshi, Abe.M.K.; Tsuda, S.; Millenaar, F.F.; Welschen, R.A.M; Ritsema, T.; Pieterse, C.M.J. Ethylene modulates the role of nonexpressor of pathogenesis-related gene1 in cross talk between salicylate and jasmonate signaling. Plant Physiol 2009, 149: 1797–1809. [CrossRef]
- Jian, H.; Lu, K.; Yang, B.; Liu, L.; Qu, C.; Li, J. Genome-wide analysis and expression profiling of the SUC and SWEET Gene families of sucrose transporters in oilseed rape (Brassica napus L.). Front Plant Sci 2016, 7: 1464–1470. [CrossRef]
- Hu, L.P.; Zhang, F.; Song, S.H.; Tang, X.W.; Xu, H.; Liu, G.M.; Wang, Y.Q.; He, H.J. Genome-wide identification, characterization, and expression analysis of the SWEET gene family in cucumber. J Integr Agr 2017, 16: 1486–1501. [CrossRef]
- Zhou, S.J.; Jing, Z.; Shi, J.L. Genome-wide identification, characterization, and expression analysis of the MLO gene family in Cucumis sativus. Genet Mol Res 2013, 12: 6565–6578. [CrossRef]
- Li, F.; Guo, S.; Chong, K.; Zhao, Y.; Chen, D.; Xu, Y. Overexpression of a homopeptide repeat-containing bHLH protein gene (OrbHLH001) from Dongxiang Wild Rice confers freezing and salt tolerance in transgenic Arabidopsis. Plant Cell Rep 2010, 29: 977–986. [CrossRef]
- Singh, K.B.; Foley, R.C.; Oñate-Sánchez, L. Transcription factors in plant defense and stress responses. Curr Opin Plant Biol 2002, 5: 430–436. [CrossRef]
- Hu, H.; Dai, M.; Yao, J.; Xiao, B.; Li, X.; Zhang, Q.; Xiong, L. Overexpressing a NAM, ATAF, and CUC (NAC) transcription factor enhances drought resistance and salt tolerance in rice. PNAS 2006, 103: 12987–12992. [CrossRef]
- Tran, L.S.P.; Nakashima, K.; Sakuma, Y.; Simpson, S.D.; Fujita, Y.; Maruyama, K.; Fujita, M.; Seki, M.; Shinozaki, K.; Yamaguchi-Shinozaki, K. Isolation and functional analysis of Arabidopsis stress-inducible NAC transcription factors that bind to a drought-responsive cis-element in the early responsive to dehydration stress 1 promoter. Plant Cell 2004, 16: 2481–2498.
- La Camera, S.; Gouzerh, G.; Dhondt, S.; Hoffmann, L.; Frittig, B.; Legrand, M.; Heitz, T. Metabolic reprogramming in plant innate immunity: the contributions of phenylpropanoid and oxylipin pathways. Immunol Rev 2004, 198: 267–284. [CrossRef]
- Vogt, T. Phenylpropanoid biosynthesis. Mol Plant 2010, 3(1): 2–20.
- Sundaram, M.; Min, H. Differential regulation of the NO3- and NH4+ transporter genes AtNrt2.1 and AtAmt1.1 in Arabidopsis: relation with long-distance and local controls by N status of the plant. Plant J 2010, 26(2): 143–155.
- Okamoto, M.; Vidmar, J.J.; Glass, A.D.M. Regulation of NRT1 and NRT2 gene families of Arabidopsis thaliana: Responses to nitrate provision. Plant Cell Physiol 2003, 44: 304–317. [CrossRef]
- Migocka, M.; Warzybok, A.; Kłobus, G. The genomic organization and transcriptional pattern of genes encoding nitrate transporters 1 (NRT1) in cucumber. Plant Soil 2013, 364: 245–260. [CrossRef]
- Liu, K.H.; Tsay, Y.F. Switching between the two action modes of the dual-affinity nitrate transporter CHL1 by phosphorylation. EMBO J 2003, 22: 1005–1013. [CrossRef]
- Krouk, G.; Lacombe, B.; Bielach, A.; Perrine-Walker, F.; Malinska, K.; Mounier, E.; Hoyerova, K.; Tillard, P.; Leon, S.; Ljung, K.; Zazimalova, E.; Benkova, E.; Nacry, P.; Gojon, A. Nitrate-regulated auxin transport by NRT1.1 defines a mechanism for nutrient sensing in plants. Dev Cell 2010, 18: 927–937. [CrossRef]
Figure 1.
PCR subclone of the cucumber NRT genes. The lanes 1 to 4 display the DNA amplifications of the genes Csa2G416080, Csa5G161290, Csa1G047430 and Csa3G027720, respectively.
Figure 1.
PCR subclone of the cucumber NRT genes. The lanes 1 to 4 display the DNA amplifications of the genes Csa2G416080, Csa5G161290, Csa1G047430 and Csa3G027720, respectively.
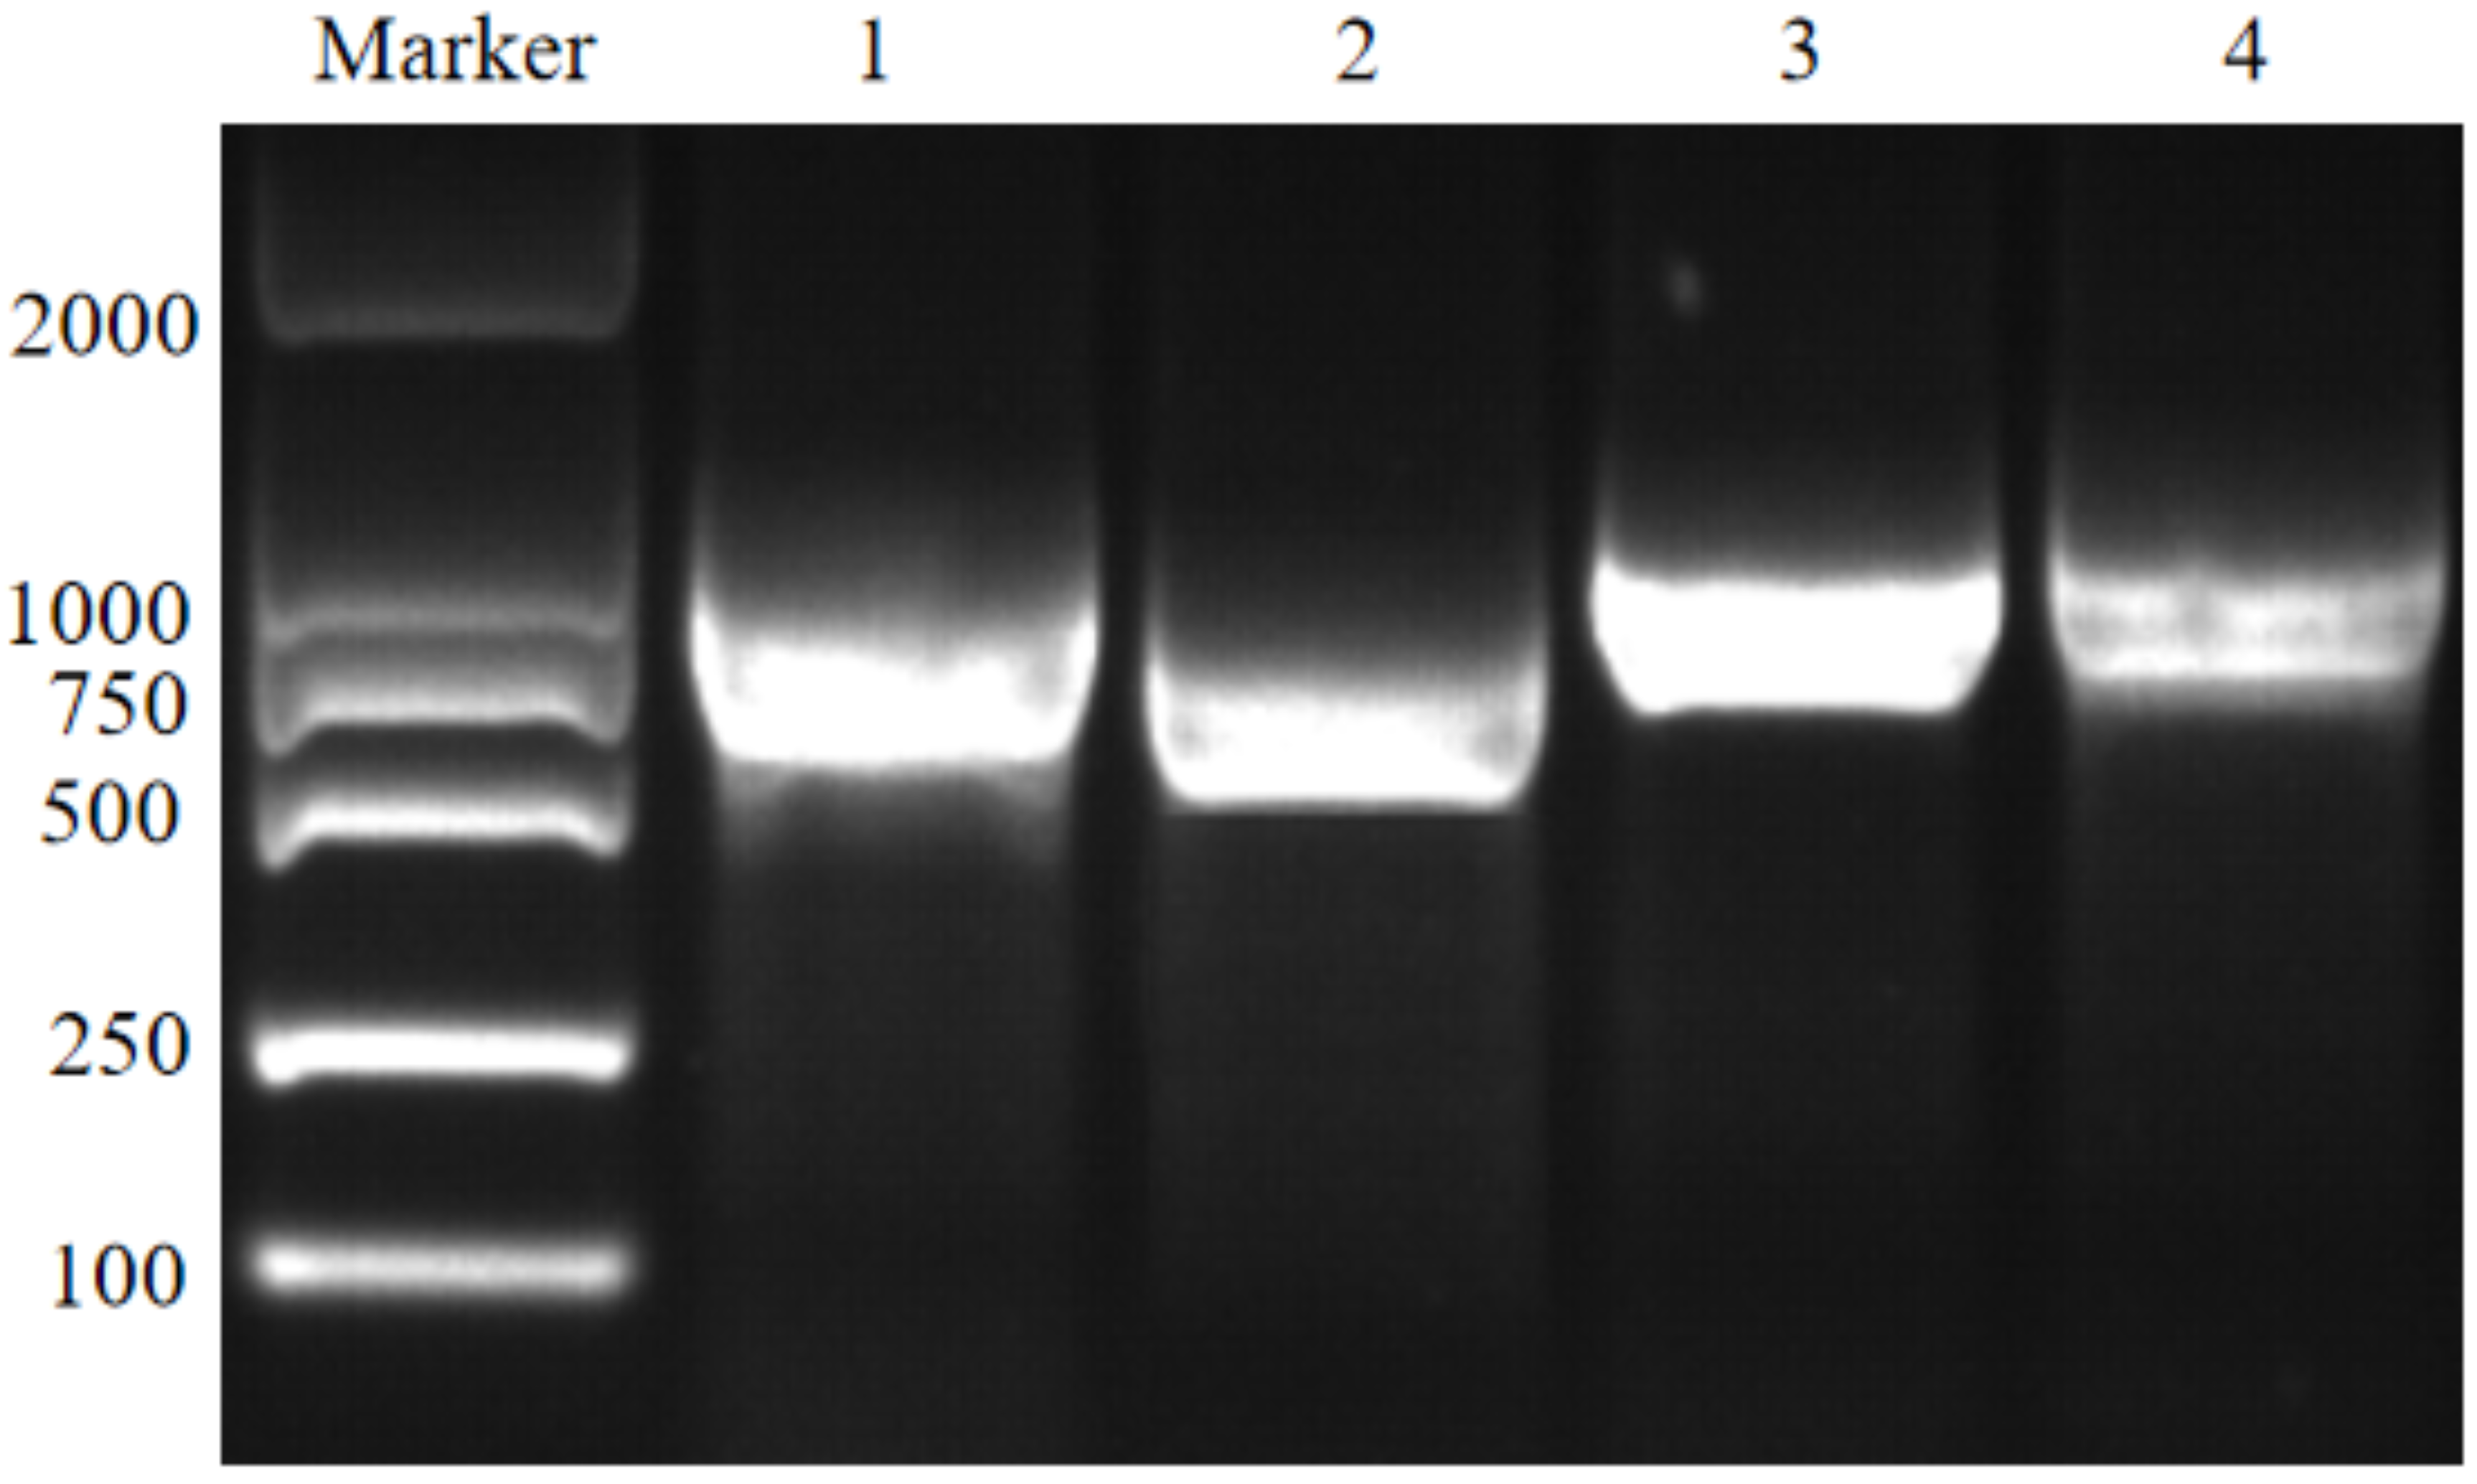
Figure 2.
Transcriptional levels of the NRT genes in cucumber roots between groups. The asterisk indicates a significant difference at the transcriptional level (p<0.05, one-way ANOVA). T: The root samples of C. sativus in the treatment group 1 (treated with sterile soil extract); CK: The root samples of C. sativus in the control group (treated with sterile water).
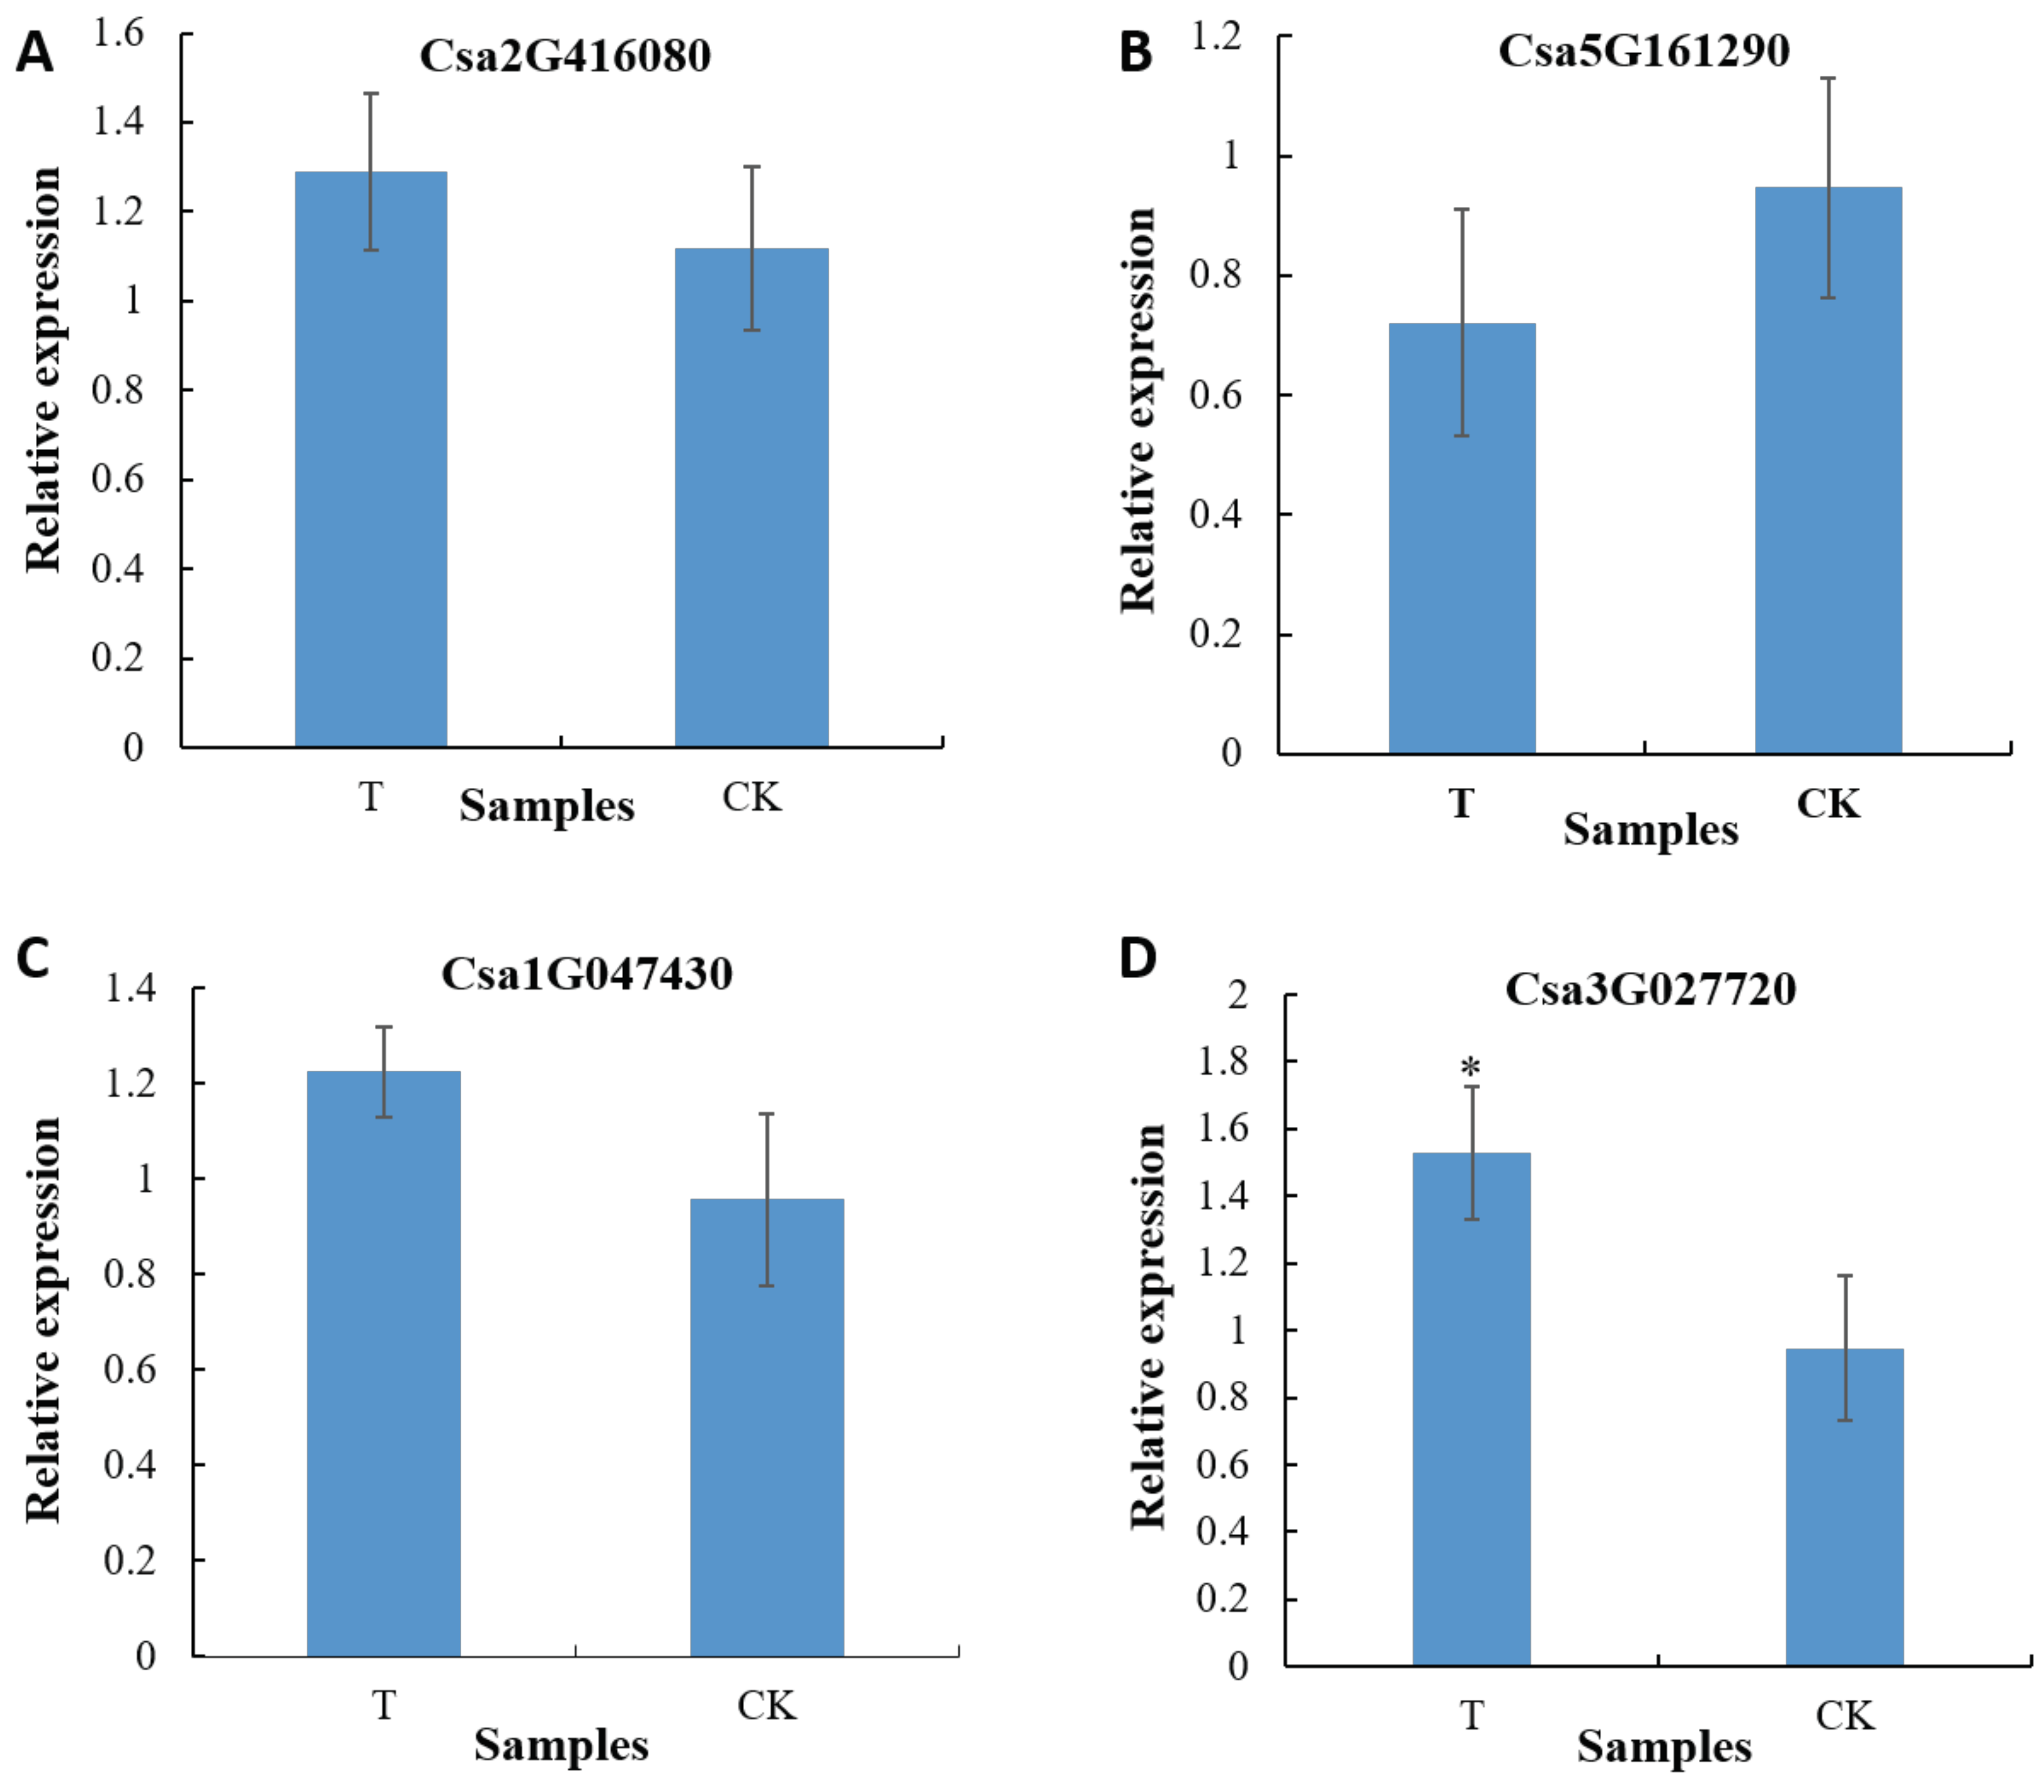
Figure 3.
Transcriptional levels of the NRT genes in cucumber roots between groups. Single asterisk (*) indicates a significant difference at the transcriptional level (p<0.05, one-way ANOVA). Double asterisks (**) represent an extremely significant difference at the transcriptional level (p<0.01, one-way ANOVA). T: The root samples of C. sativus in the treatment group 2 (treated with the bacterial cells of GXGL-4A); CK: The root samples of C. sativus in the control group (treated with an equal volume of sterile water).
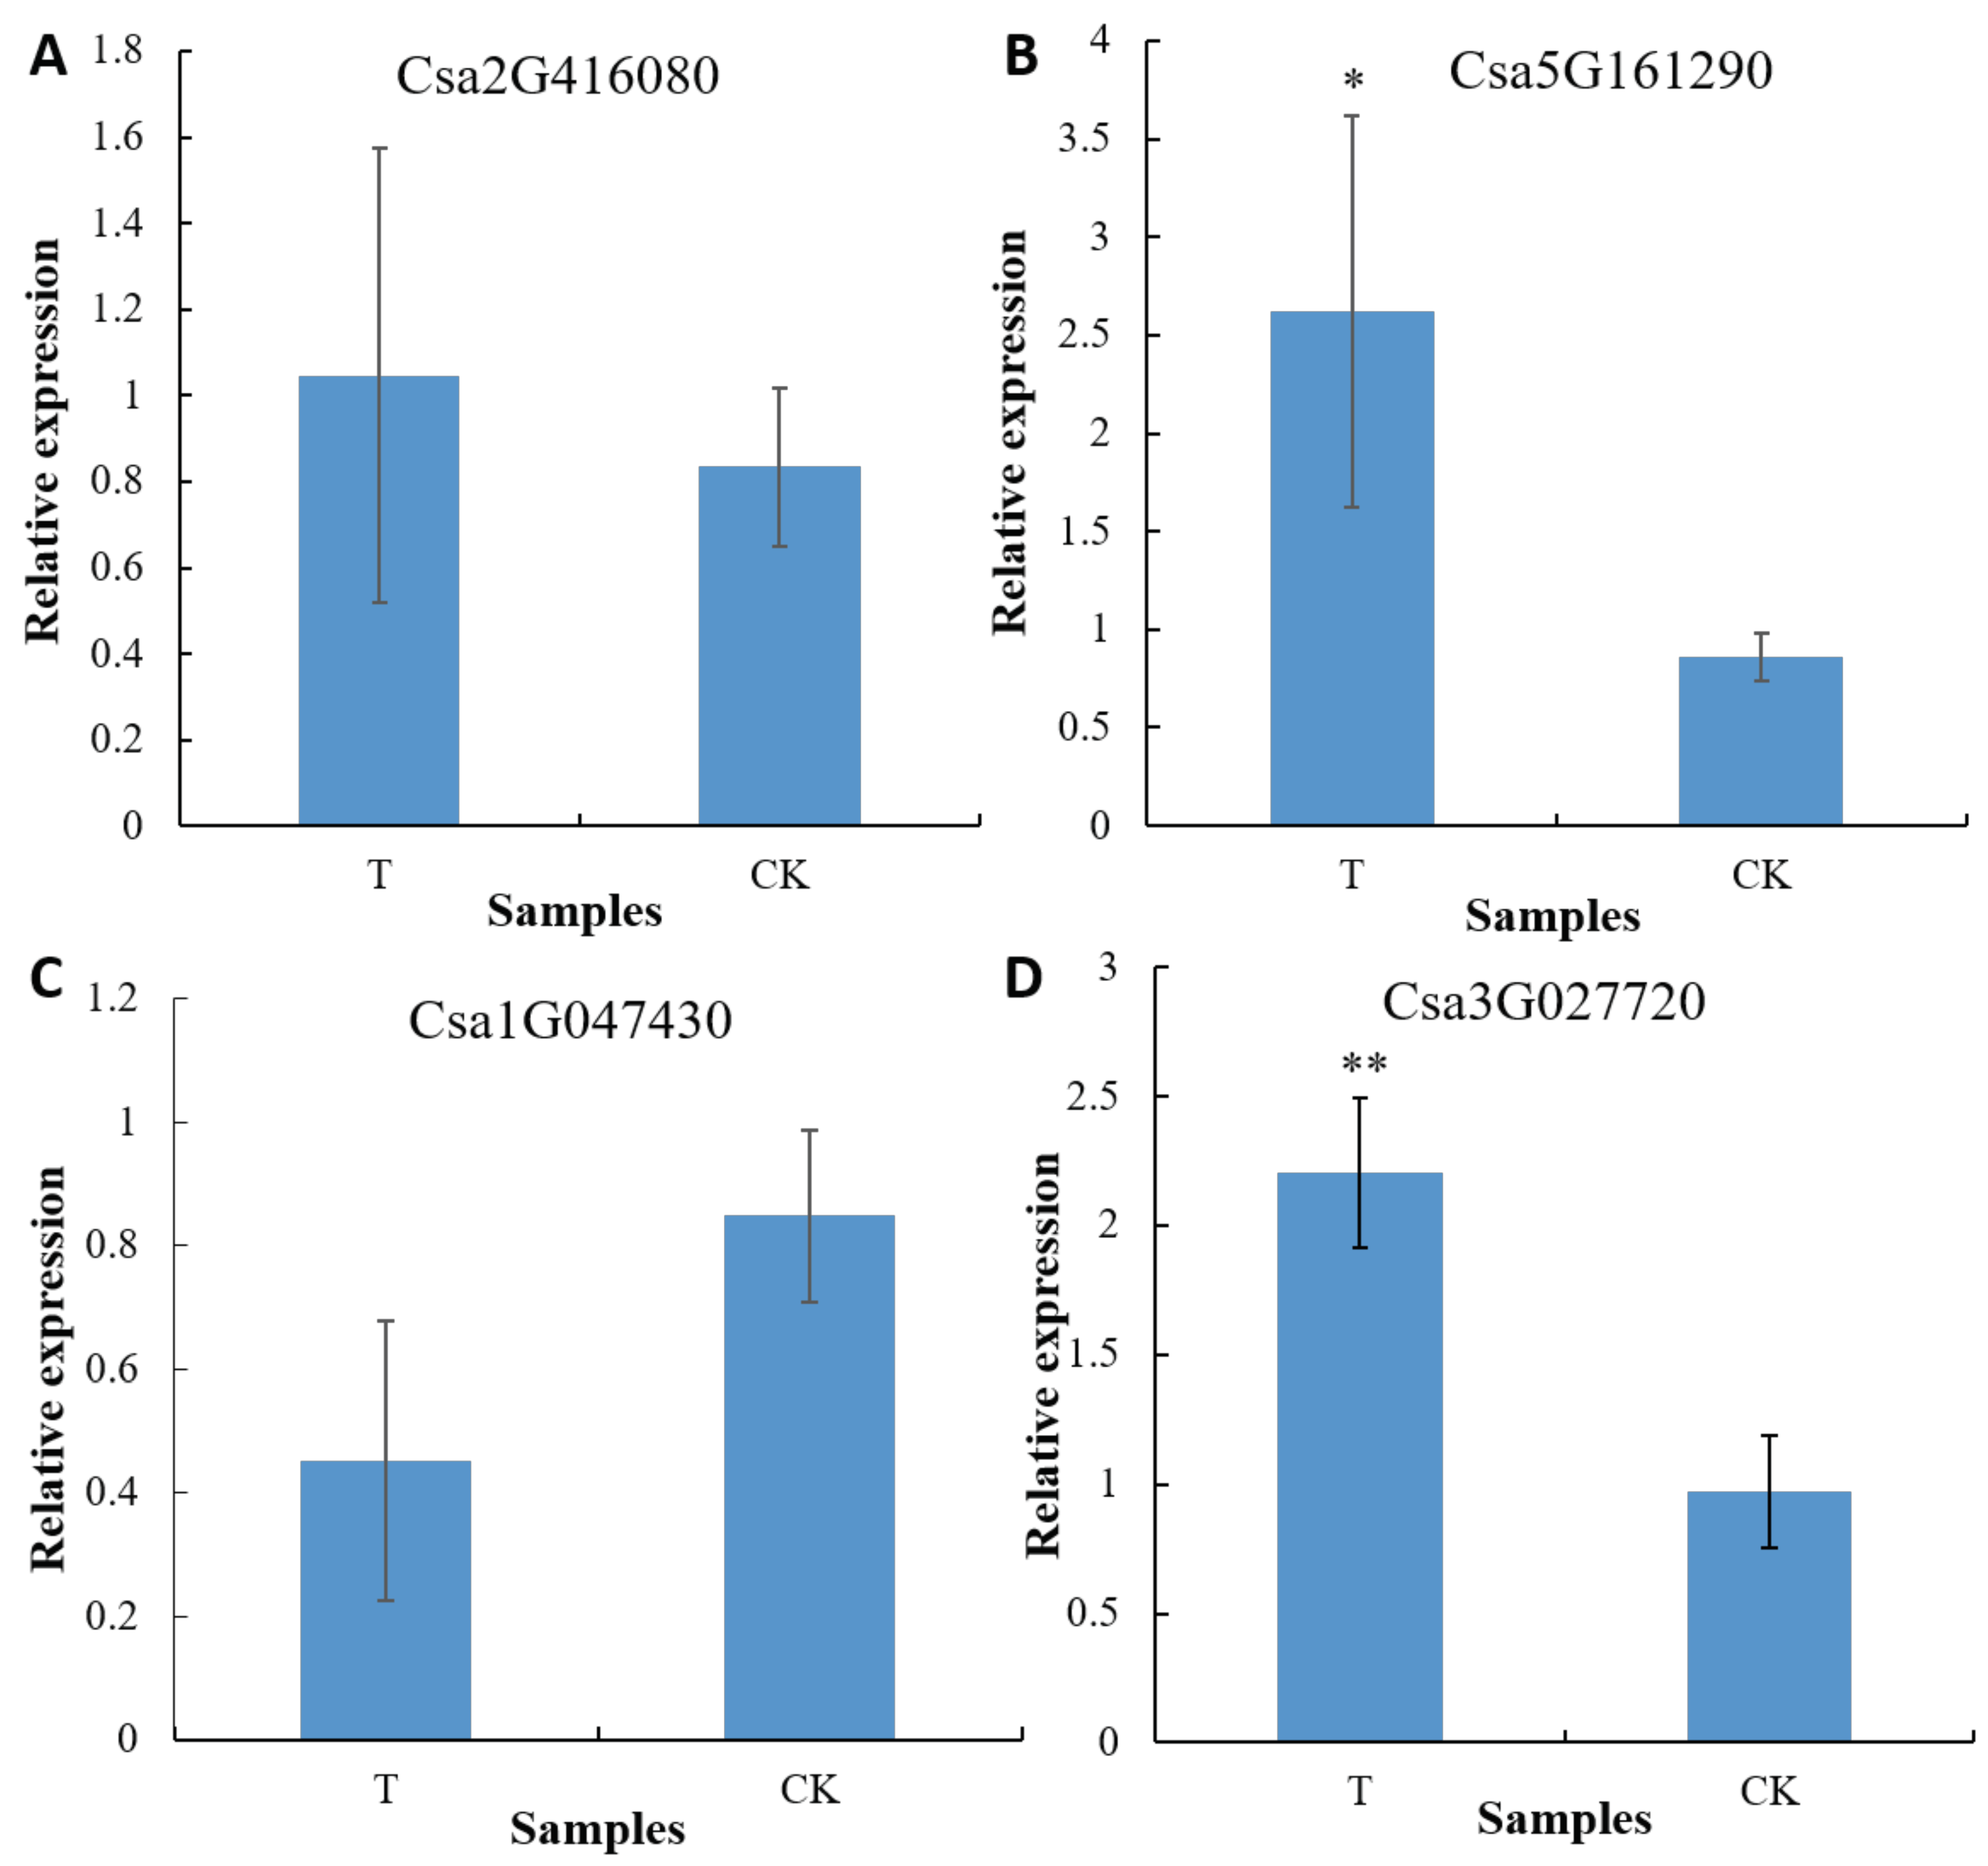
Figure 4.
Differences in expression levels of unigenes between the treatment group 2 and the control group. The abscissa and ordinate respectively represent the expression amount of unigene/transcript in the two samples. Here, the values of abscissa and ordinate are logarithmicized, and each point represents a specific unigene/transcript. The abscissa value corresponding to a specific point is the expression of the unigene in the control sample, and the ordinate value is the expression of the gene in the treatment sample. The red dot in the figure indicates the significantly up-regulated unigenes, the green dot indicates the significantly down-regulated unigenes, and the gray dot displays the non-significantly different unigenes. After mapping all unigenes, the closer the point to 0, the lower the expression. The greater the degree of deviation from the diagonal, the greater the difference in the expression of the unigene between the two samples. The abbreviation ‘nosig’ means no significance.
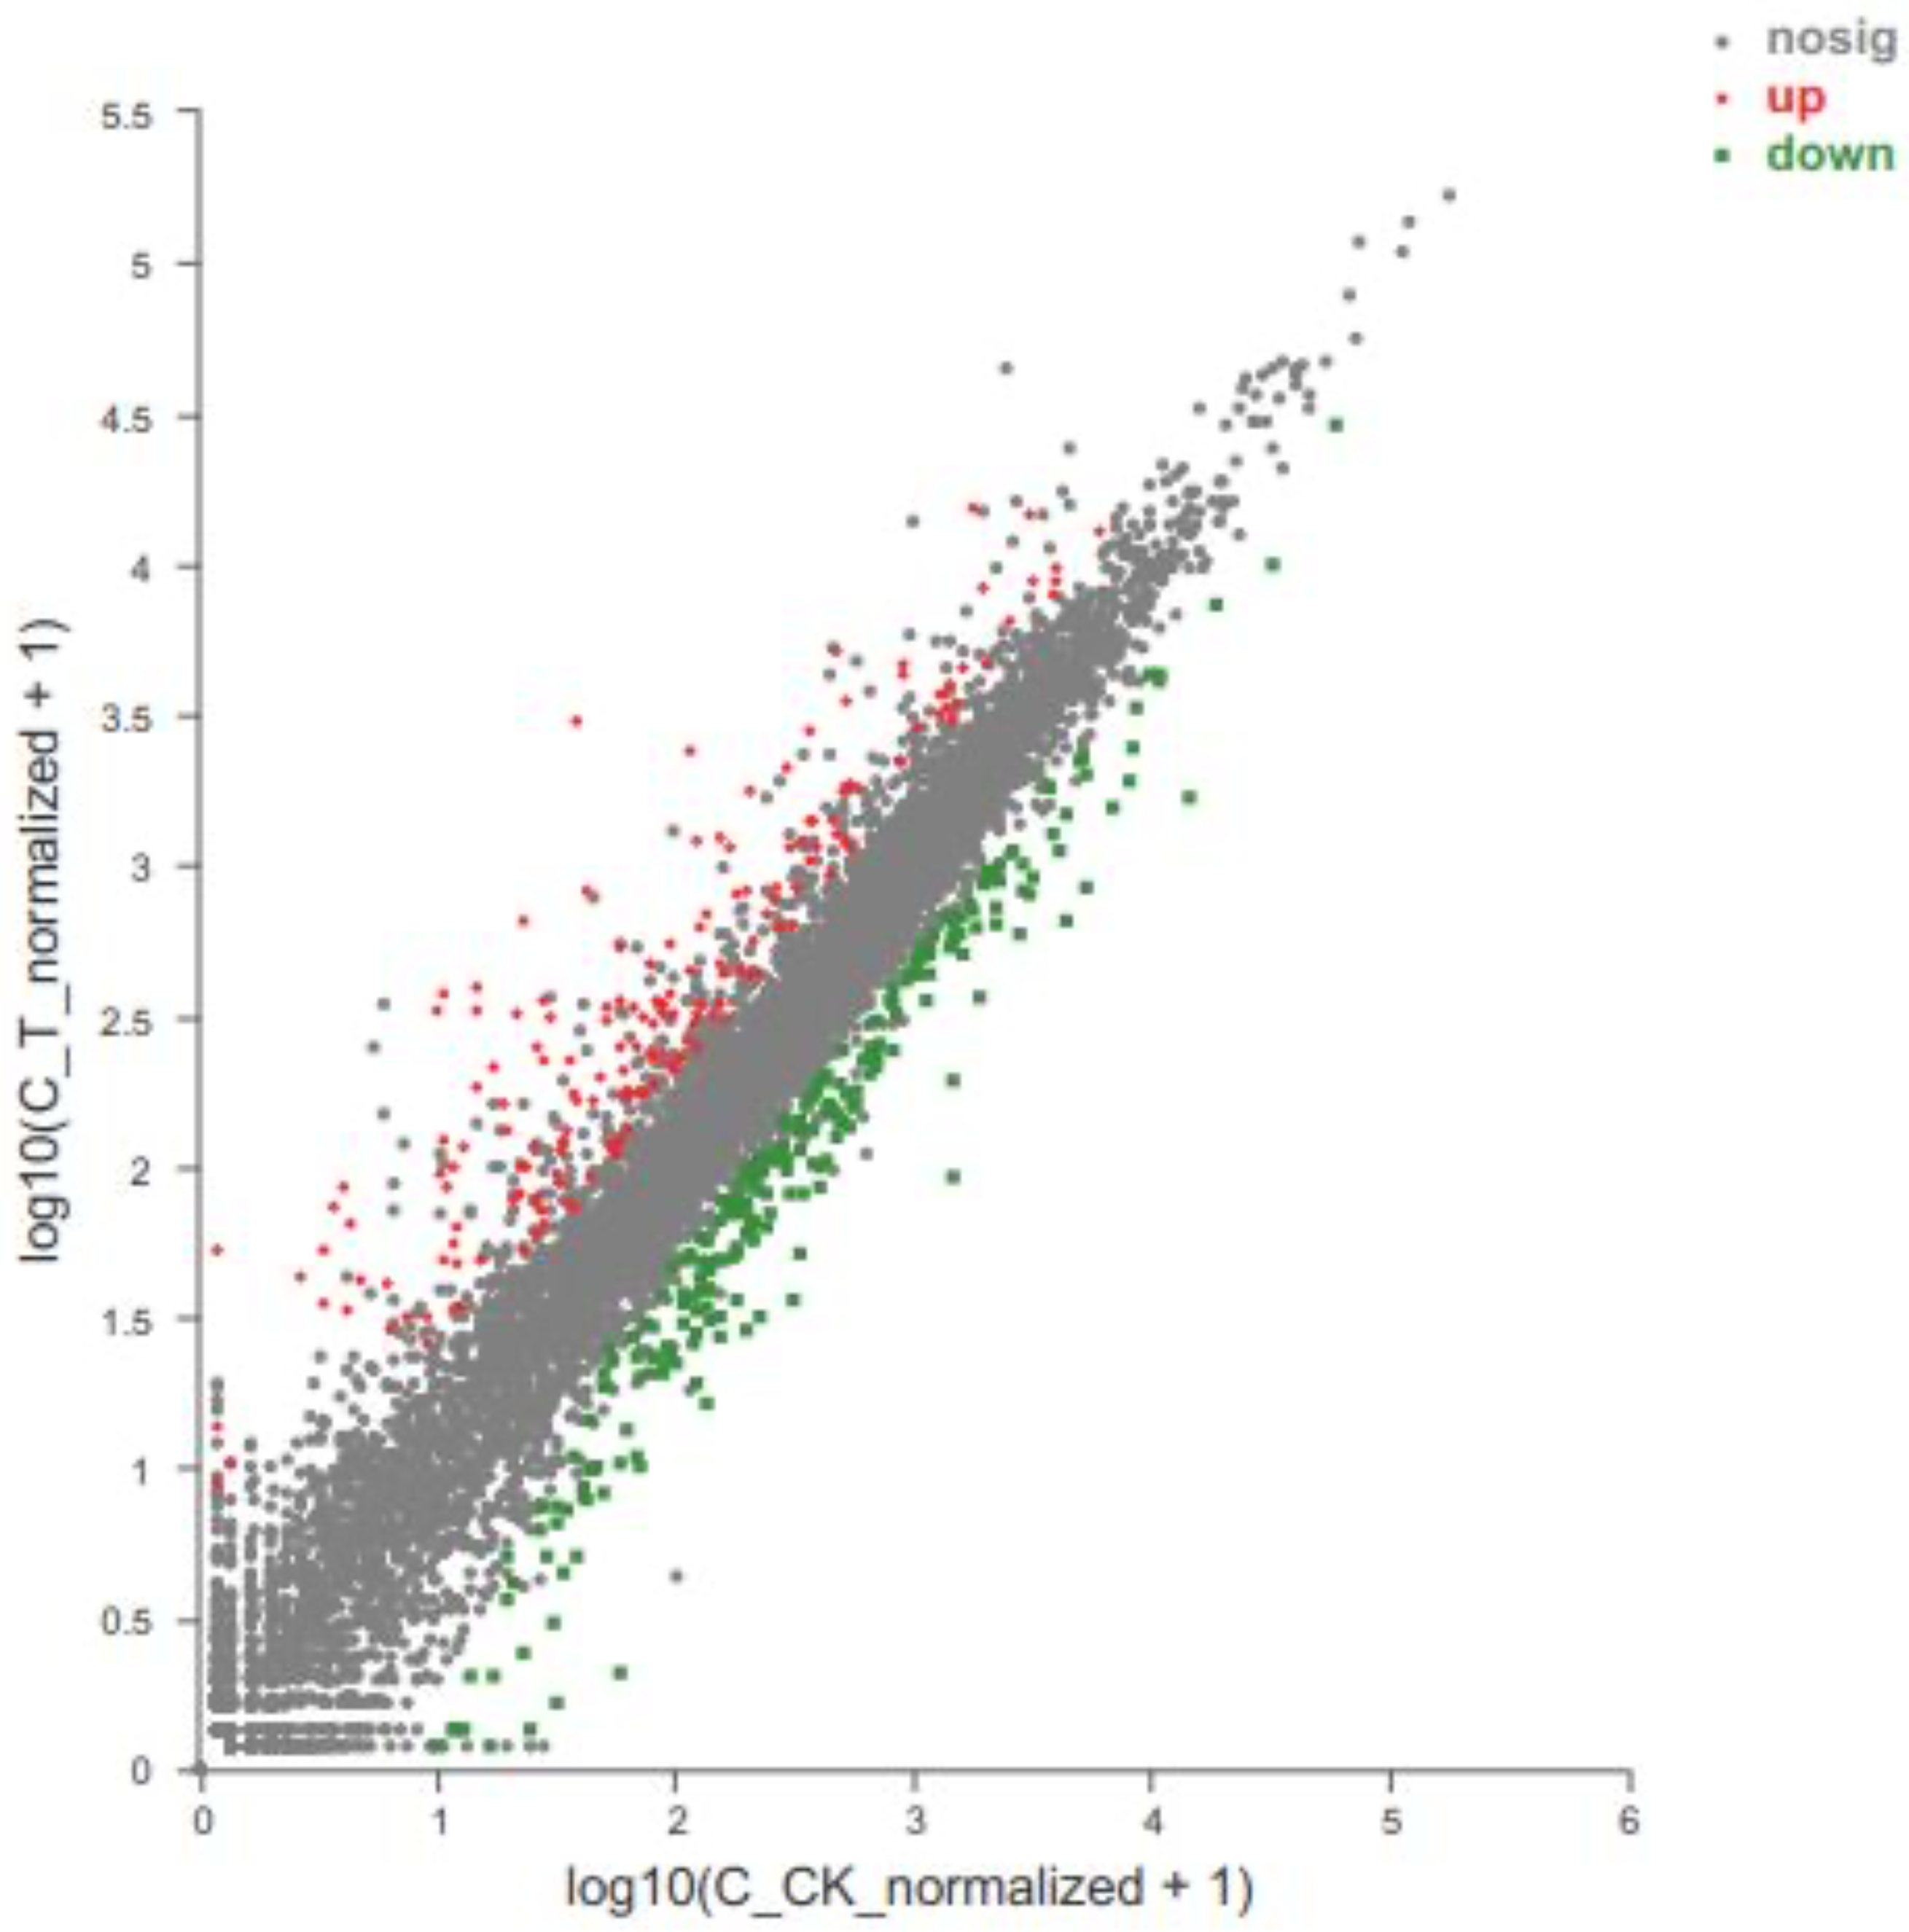
Figure 5.
Gene ontology (GO) classification of the identified DEGs among the treatment group 2 and the control group. The ordinate in the figure represents the secondary classification terms of GO and the abscissa indicates the number of unigenes/transcripts in the secondary classification. The three colors represent the three major classifications.
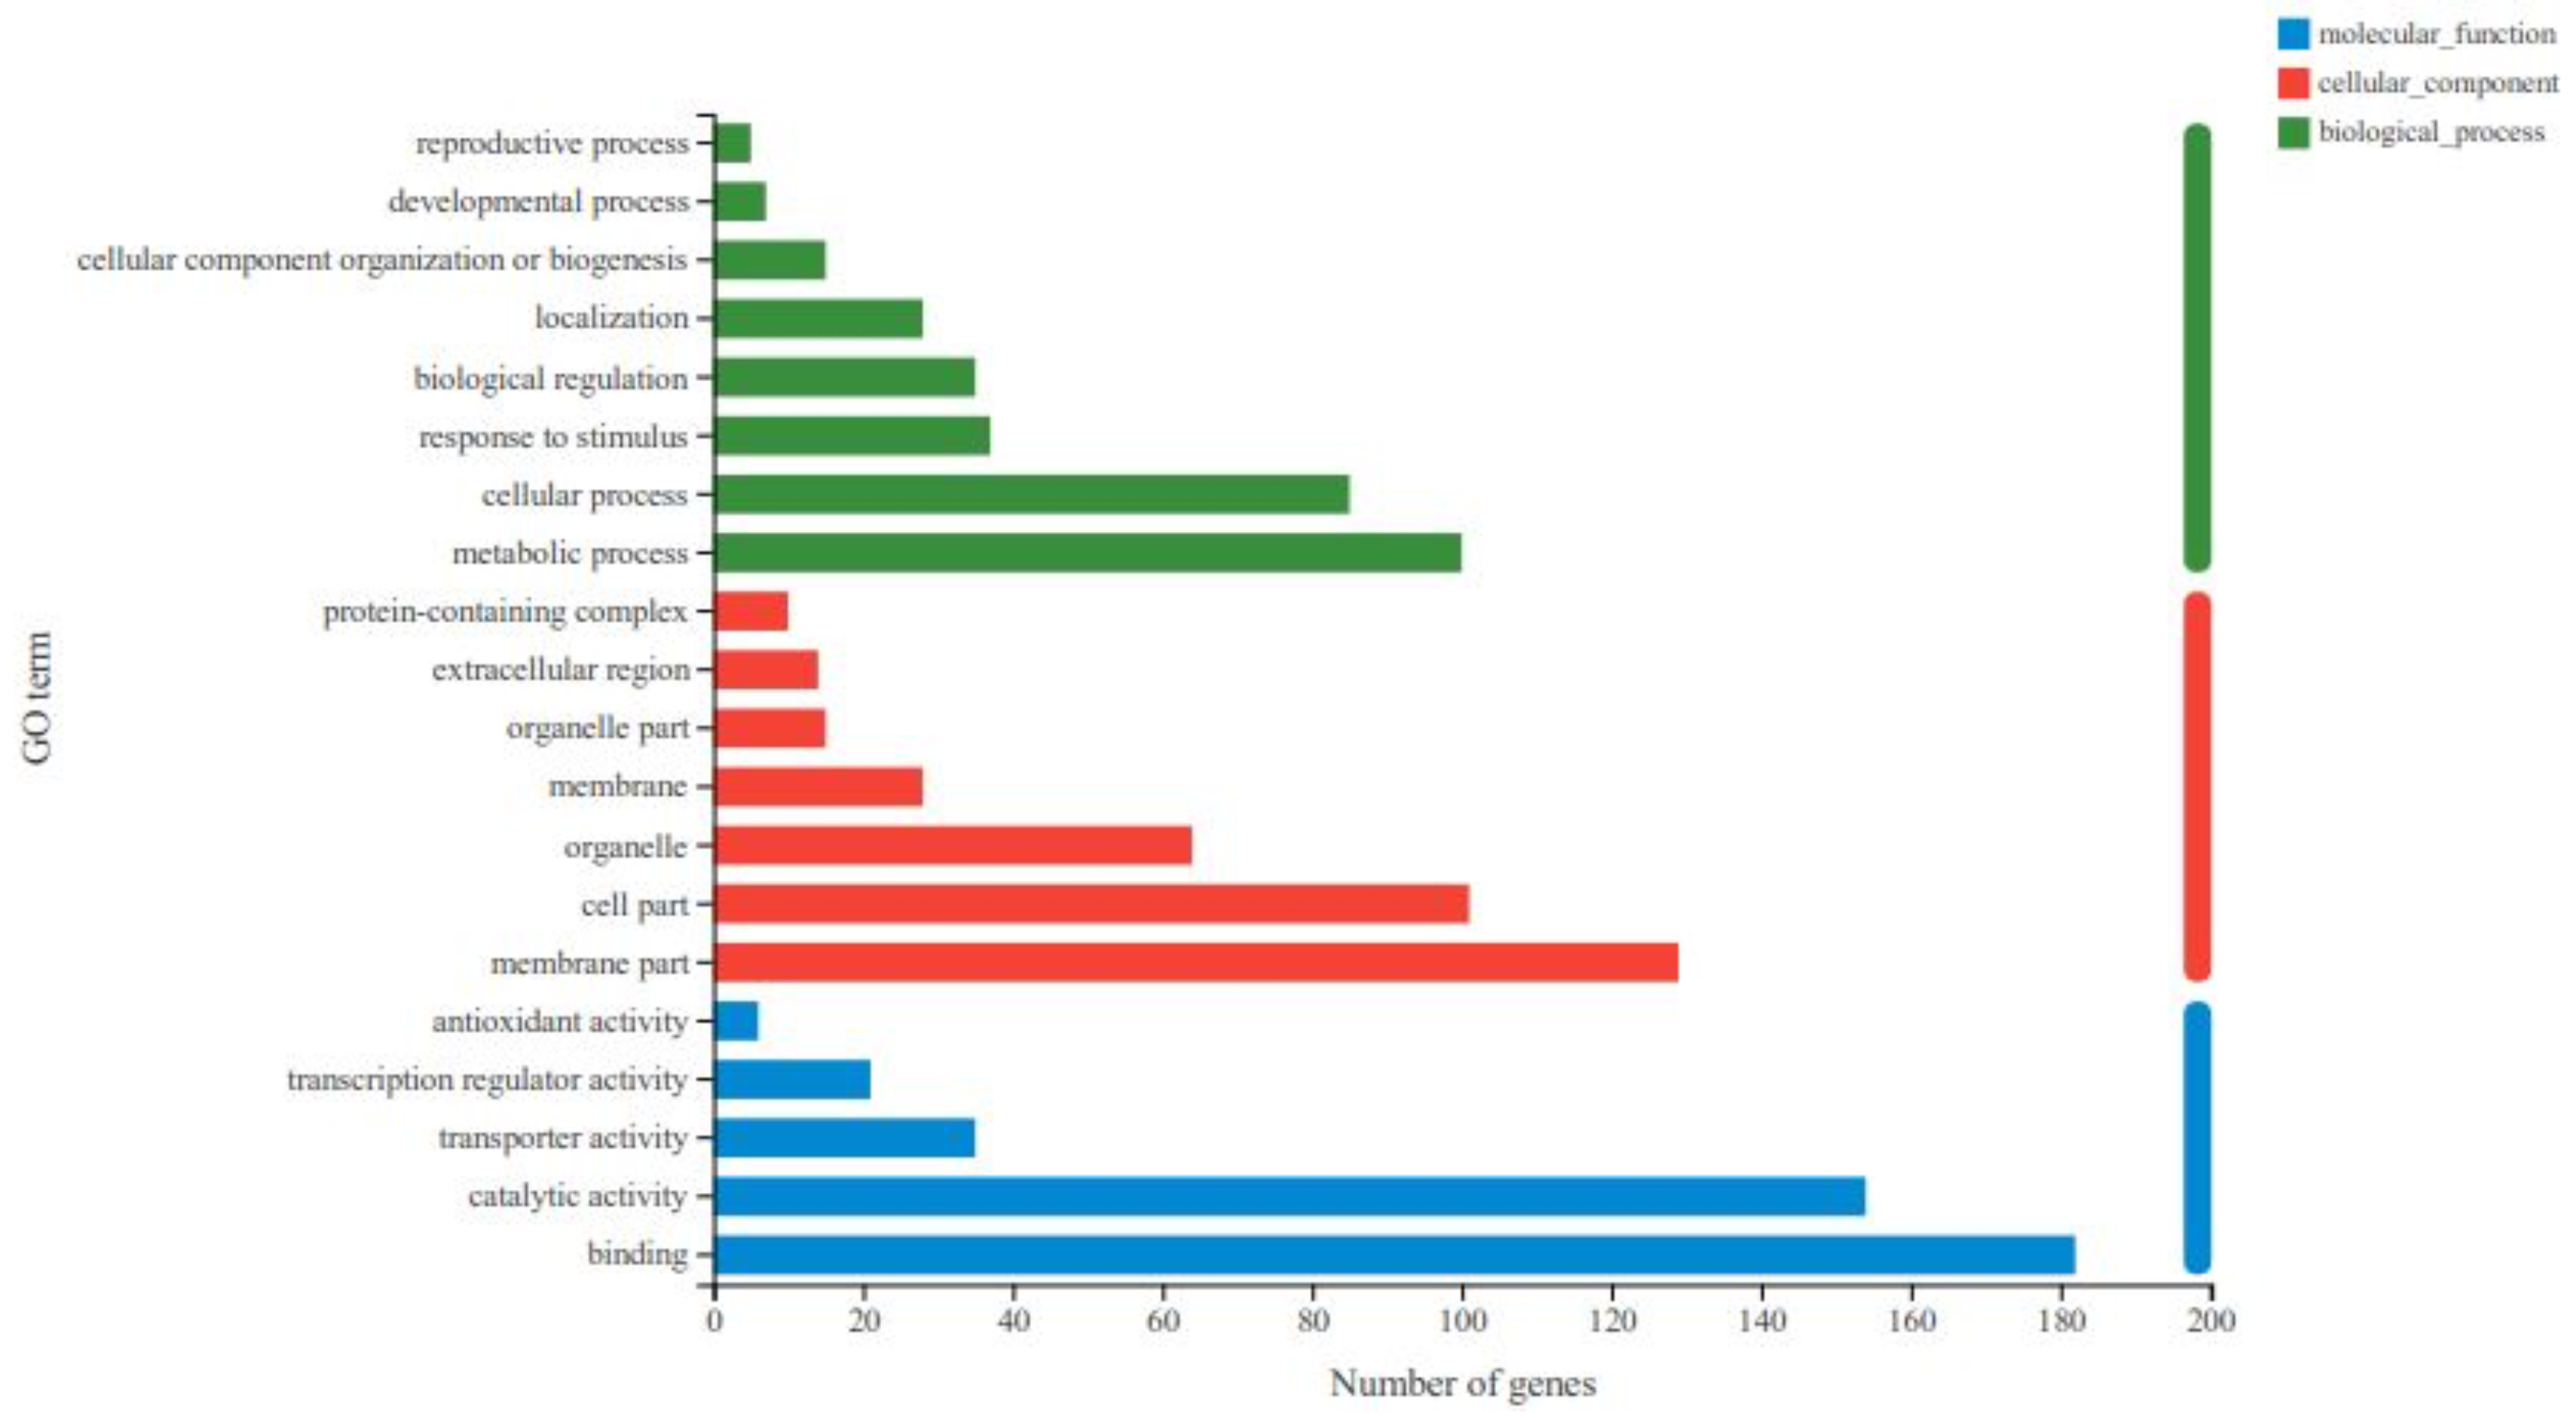
Figure 6.
Functional classification of C. sativus DEGs by KEGG. The ordinate represents the name of KEGG metabolic pathway and the abscissa indicates the number of up-regulated unigenes annotated to this pathway. GIP: Genetic information processing; EIP: Environmental information processing. A: up-regulated DEGs; B: down-regulated DEGs.
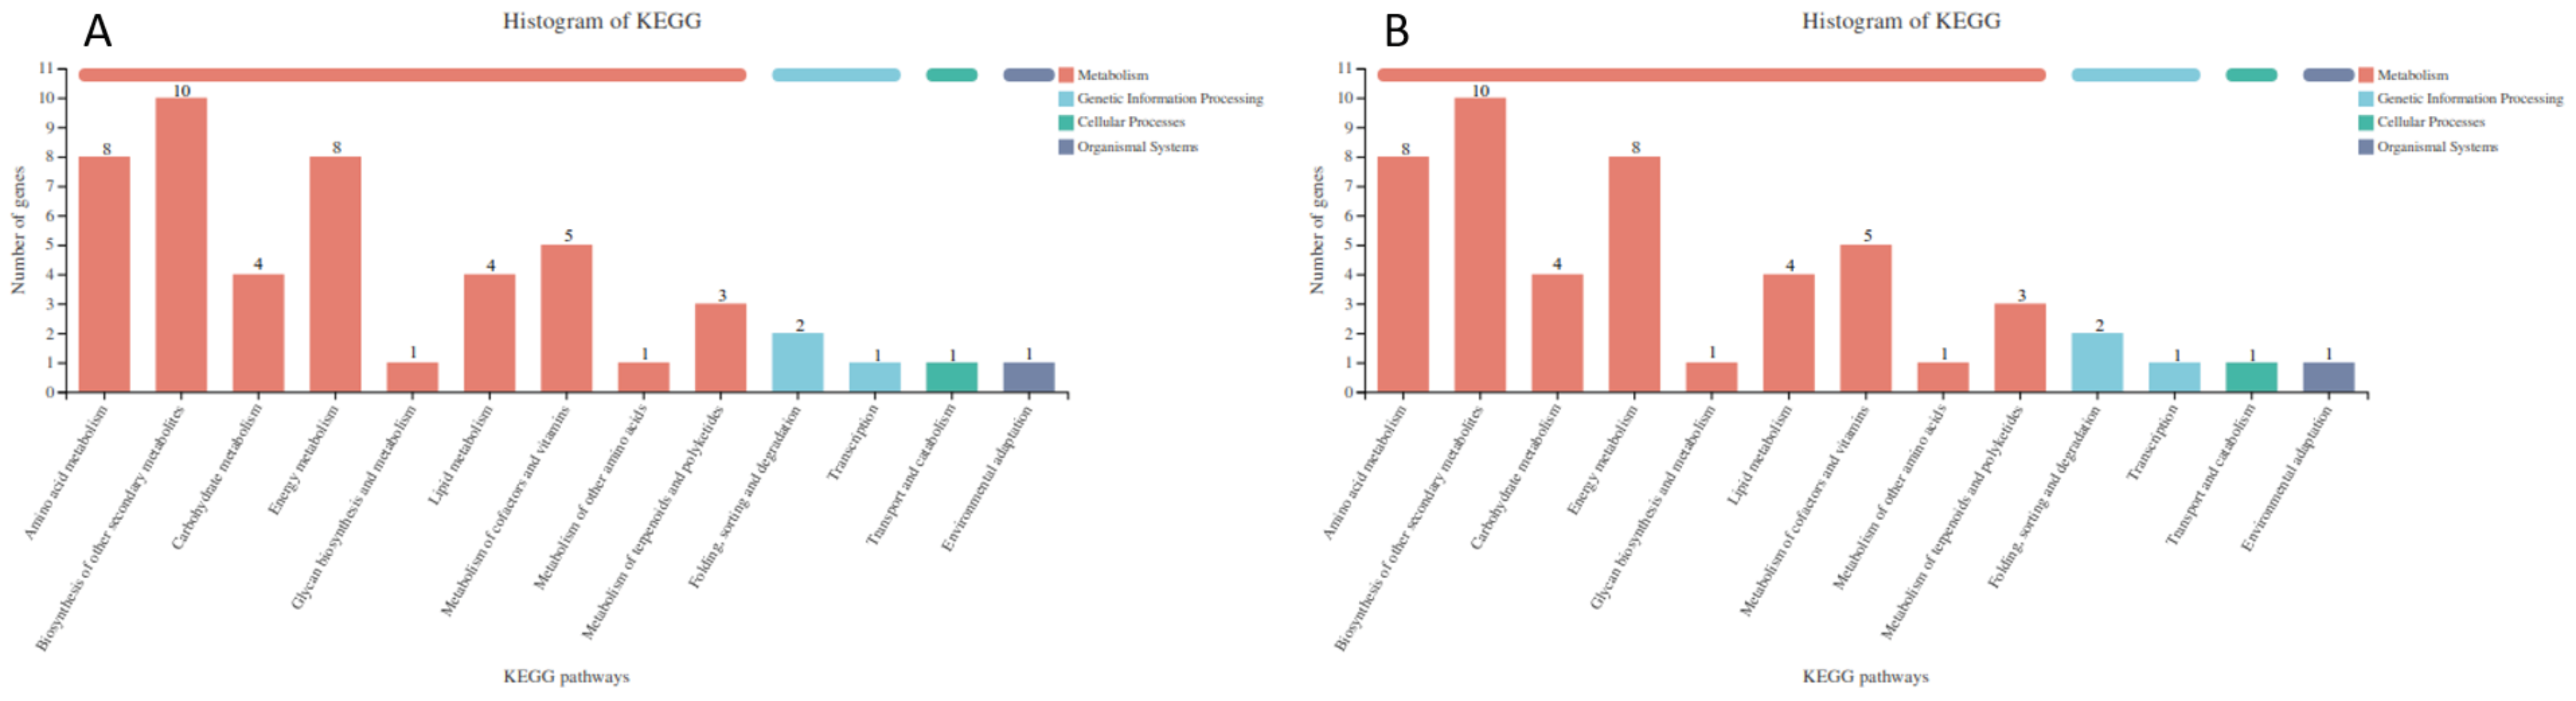
Figure 7.
Enrichments of GO and KEGG of C. sativus DEGs. The vertical and horizontal axes respectively represent GO term or KEGG pathway and rich factor (the ratio of the number of genes enriched in the GO term or KEGG pathway to the number of annotated genes). The larger the rich factor, the greater the degree of enrichment. The size of every point means the number of genes in the GO term or KEGG pathway, and the color of the point corresponds to different p-adjust ranges. A: GO enrichment of DEGs; B: KEGG enrichment of DEGs.
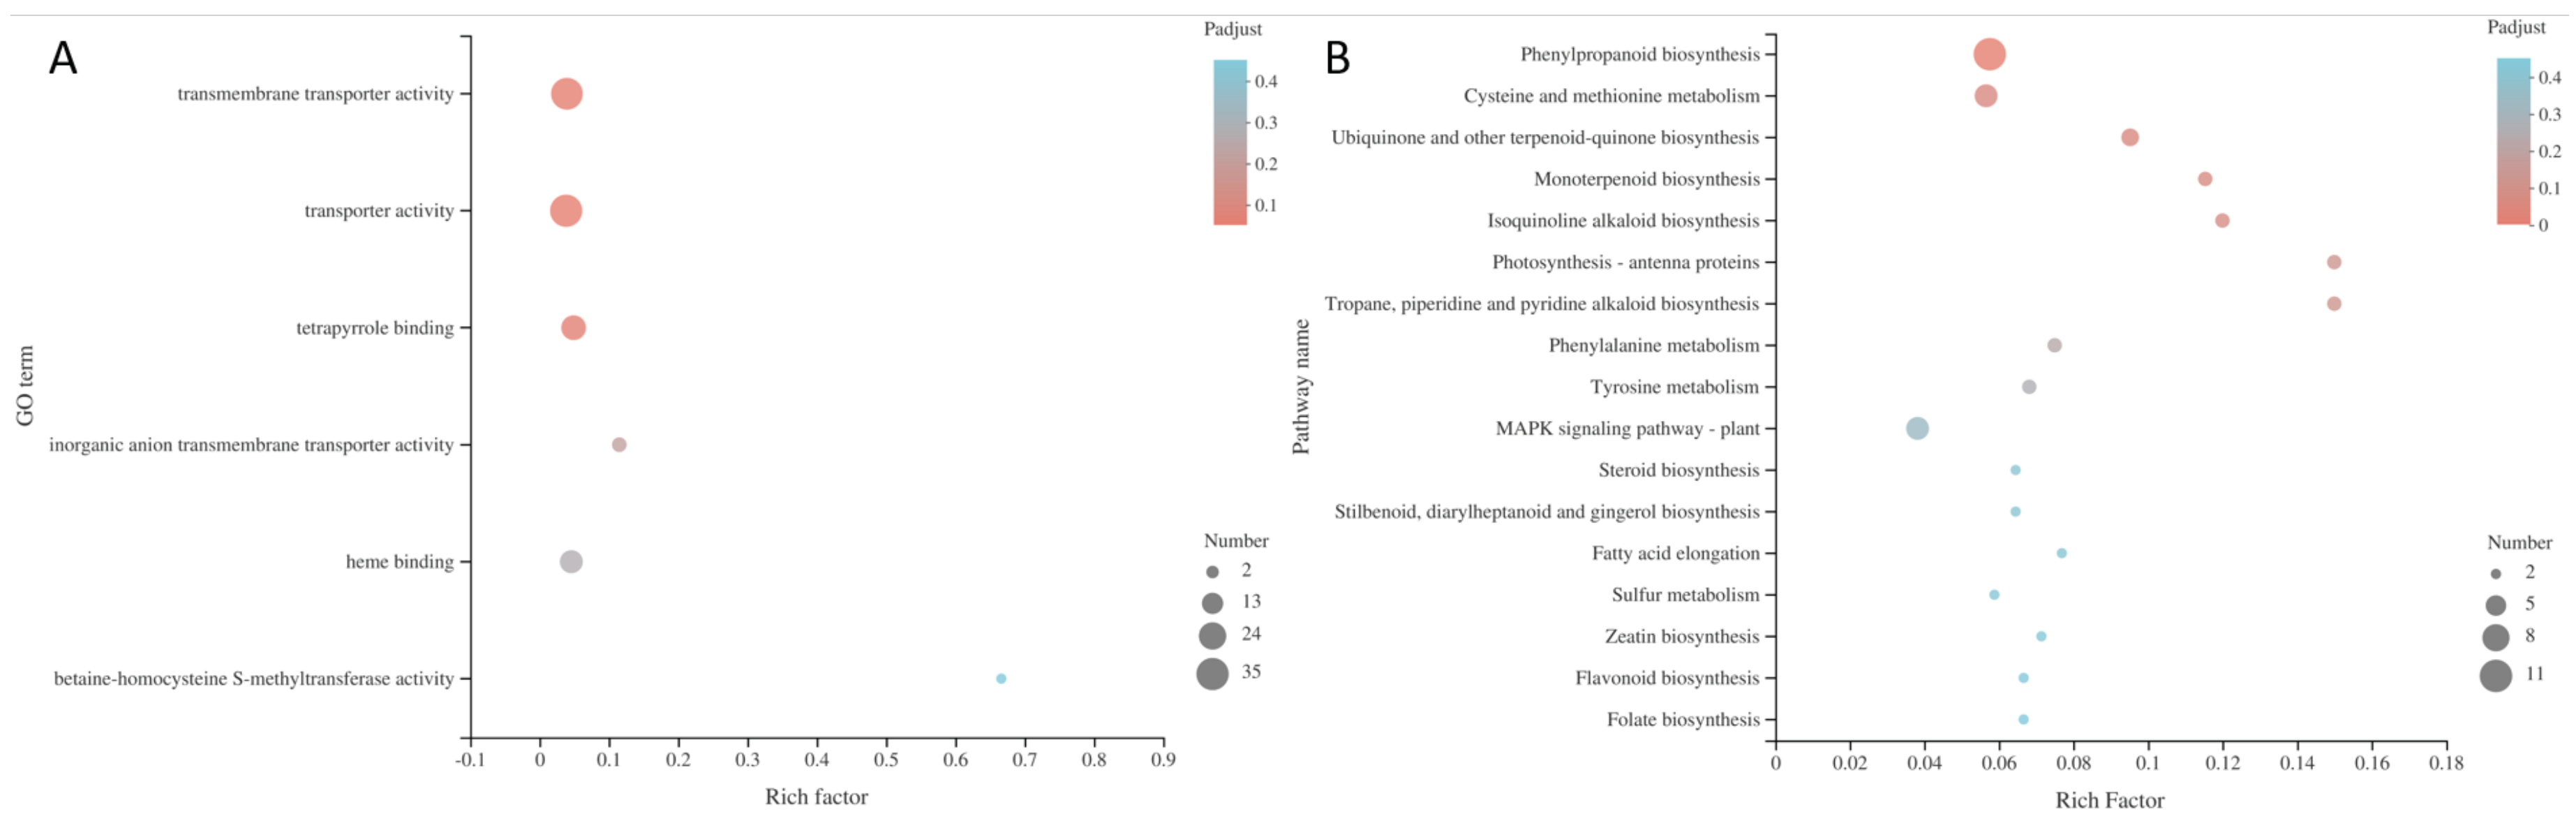
Figure 8.
Electrical conductivity of cucumber rhizosphere (in vermiculite system) after 10 days of drought treatment of GXGL-4A, M107 and M246-2. Three asterisks indicate that there is an extremely significant difference in EC value between two experimental groups.
Figure 8.
Electrical conductivity of cucumber rhizosphere (in vermiculite system) after 10 days of drought treatment of GXGL-4A, M107 and M246-2. Three asterisks indicate that there is an extremely significant difference in EC value between two experimental groups.
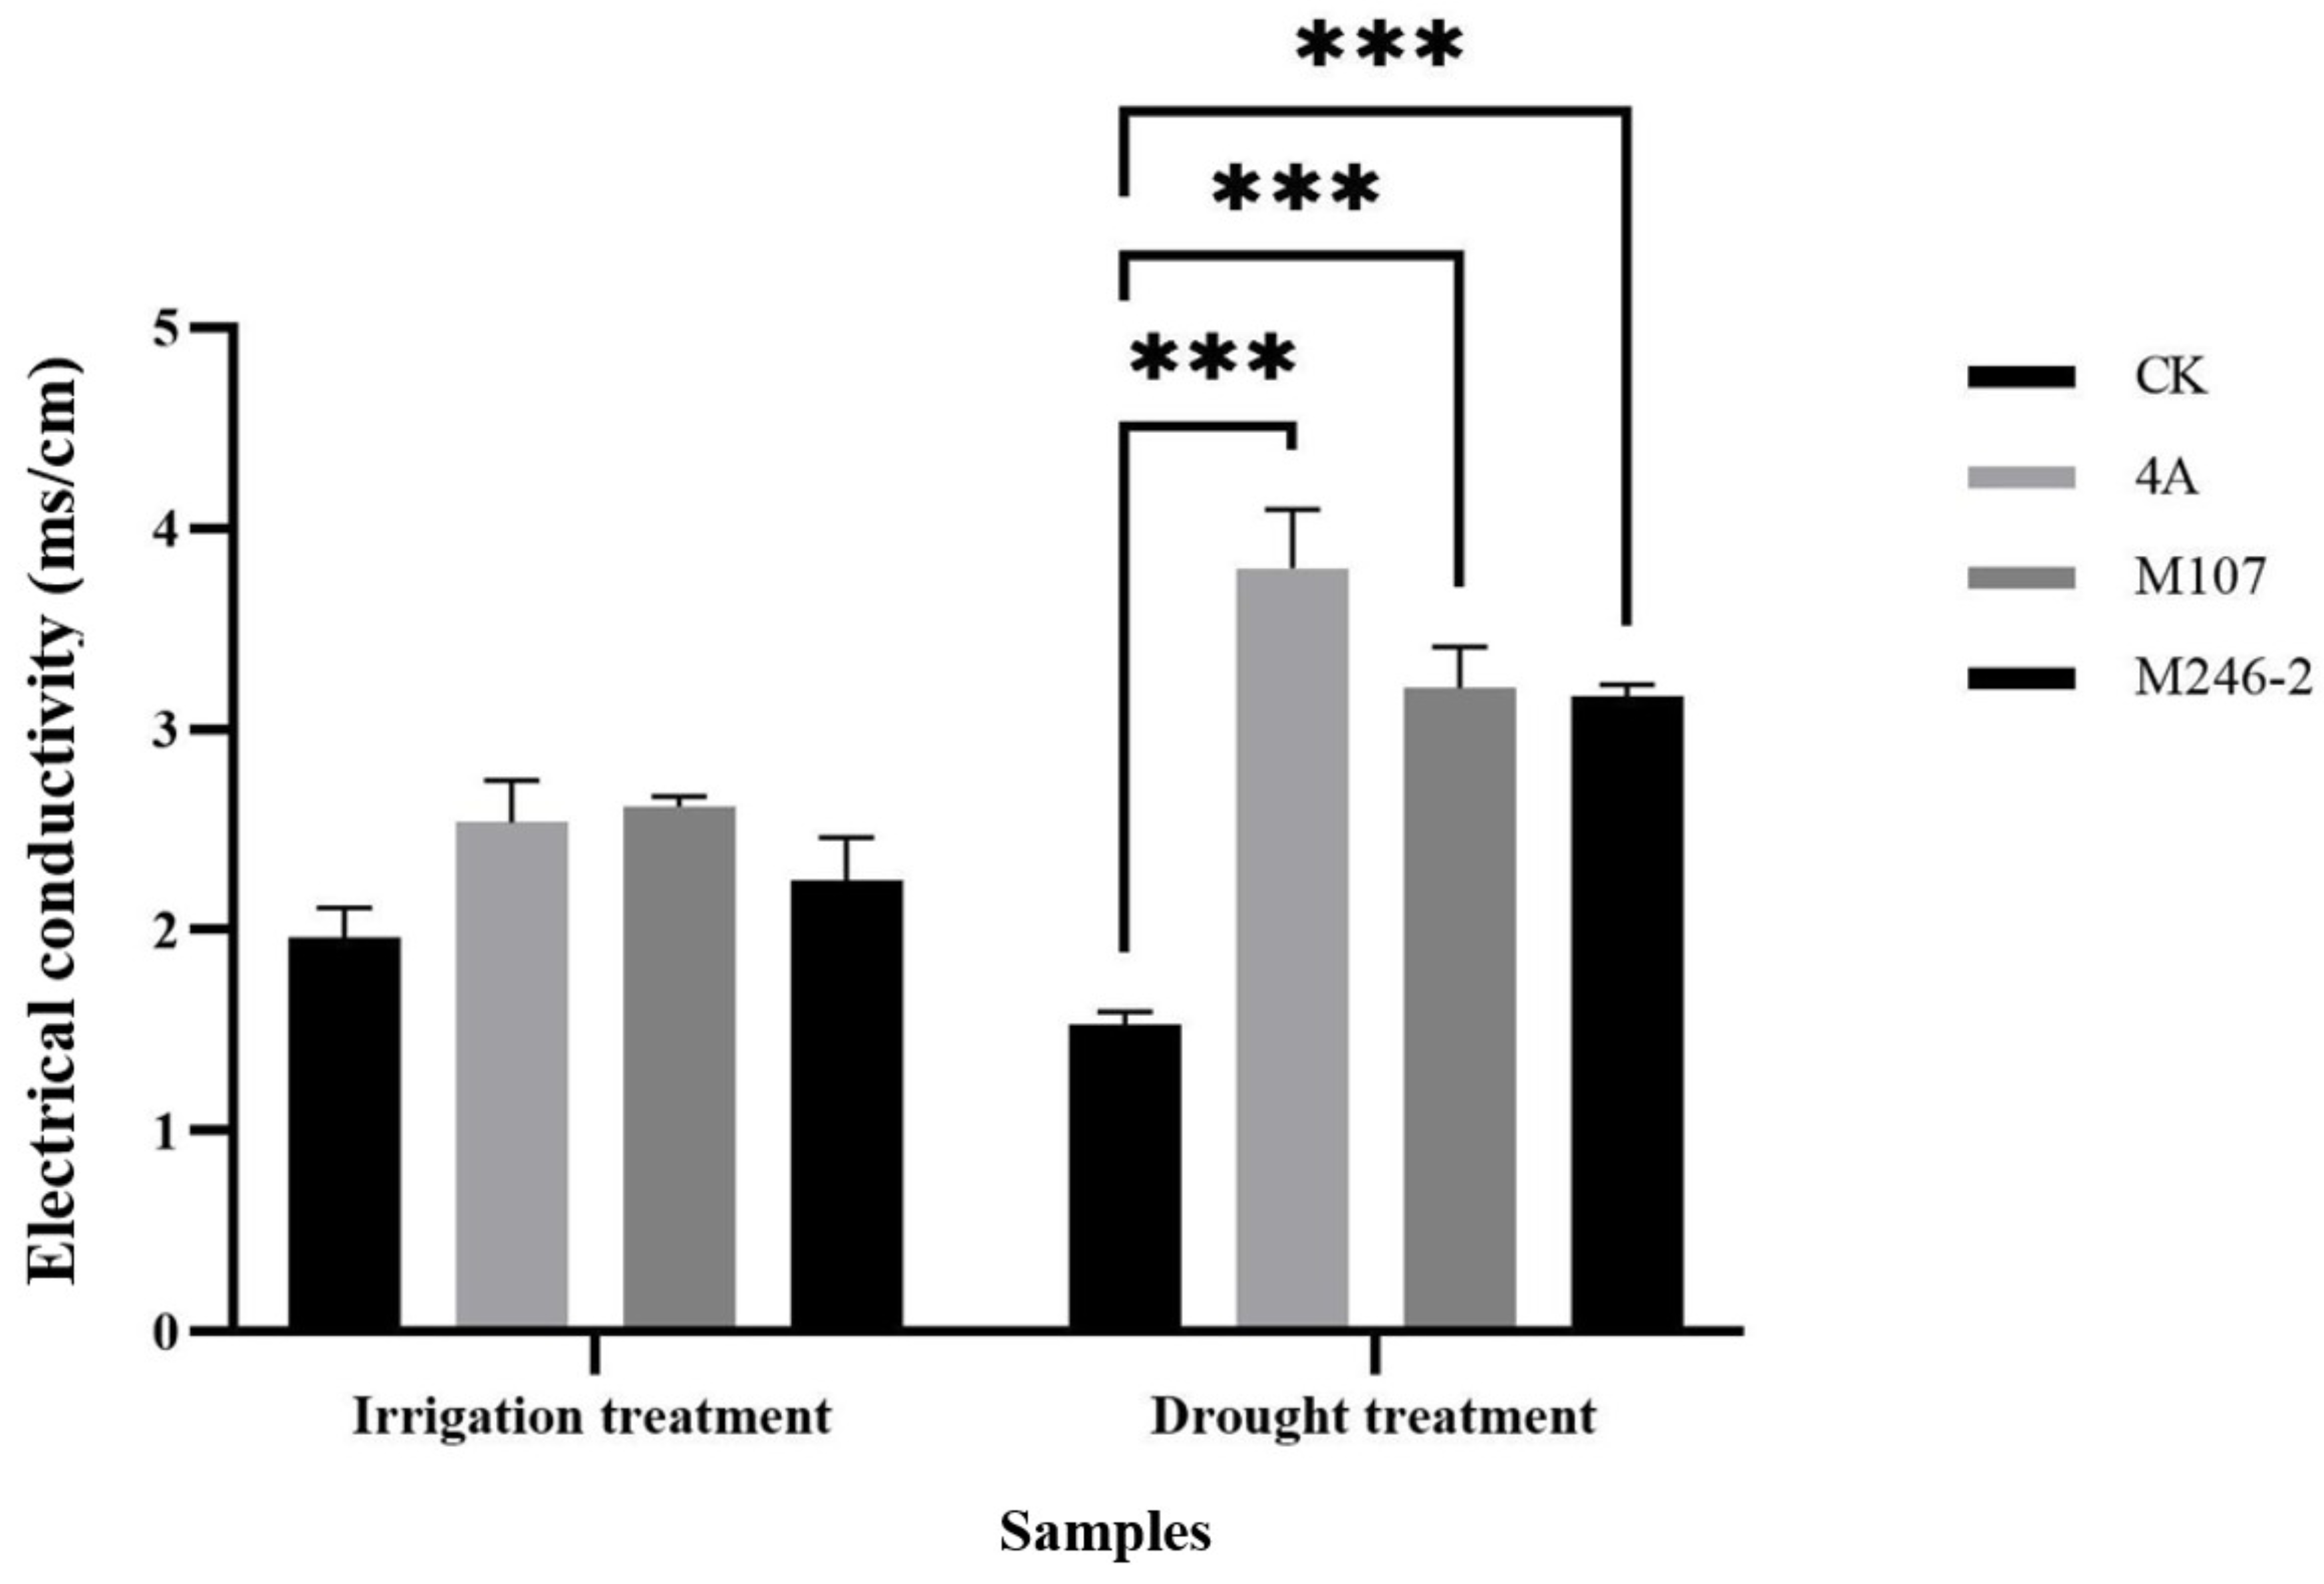
Figure 9.
Expression levels of the representative DEGs related to plant hormones. The abscissa represents differentially expressed genes (DEGs), and the ordinate shows the expression levels of DEGs, i.e. the values of transcripts per million (TPM) of the tested DEGs. A single asterisk indicates that there is a significant difference in gene expression between the treatment group and the control group (p-adjust<0.05). The double asterisks mean that there is an extremely significant difference in gene expression between the treatment group 2 and the control group (p-adjust<0.01). The expression of CsaV3_3G034190 gene was not detected in the control group. A: The up-regulated DEGs of CsaV3_5G006200, CsaV3_3G034190 and CsaV3_2G033120; B: The down-regulated DEGs of CsaV3_1G044030 and CsaV3_6G042970.
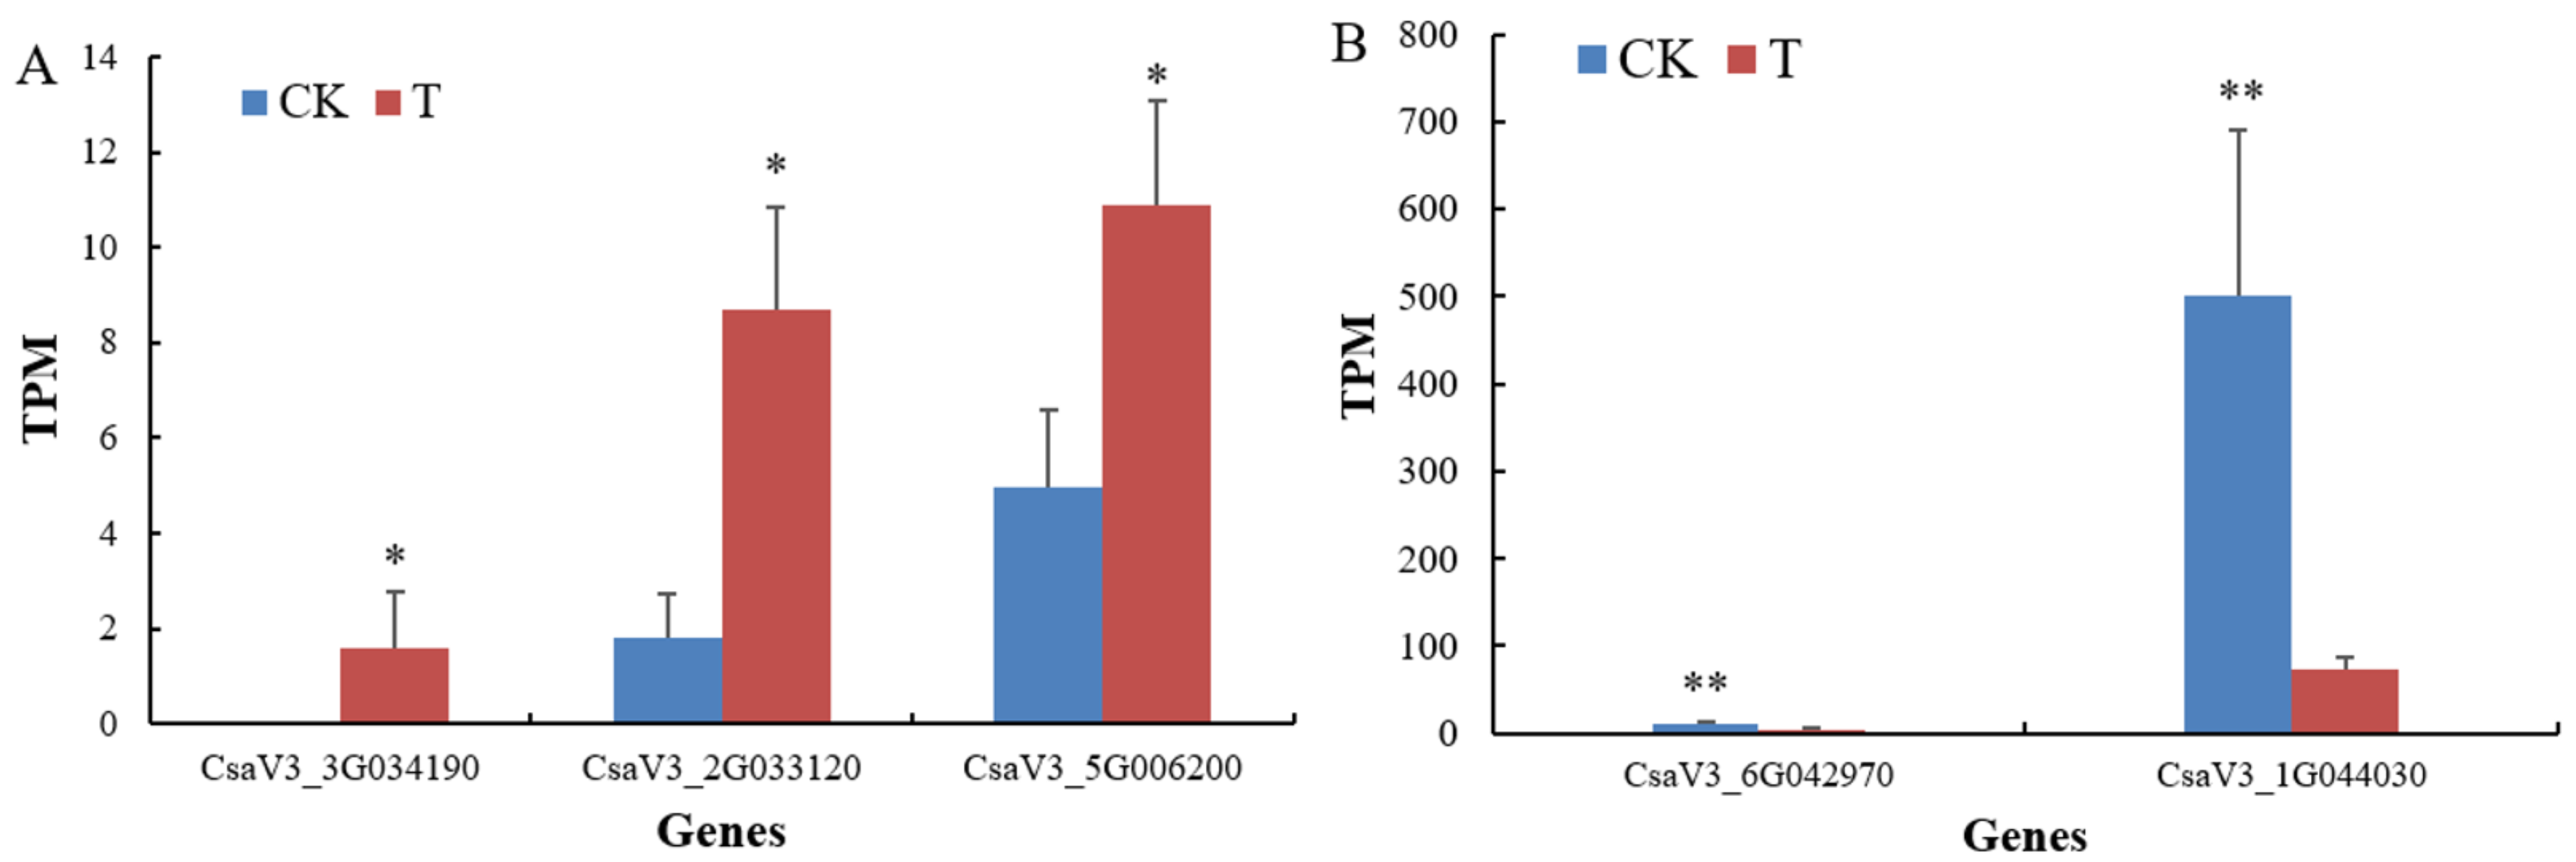
Figure 10.
Expression levels of the representative DEGs related to stress resistance. The abscissa represents differentially expressed genes (DEGs), and the ordinate shows the expression levels of DEGs, i.e. the values of transcripts per million (TPM) of the tested DEGs. A single asterisk indicates that there is a significant difference in gene expression between the treatment group and the control group (p-adjust<0.05). The double asterisks mean that there is an extremely significant difference in gene expression between the treatment group 2 and the control group (p-adjust<0.01).
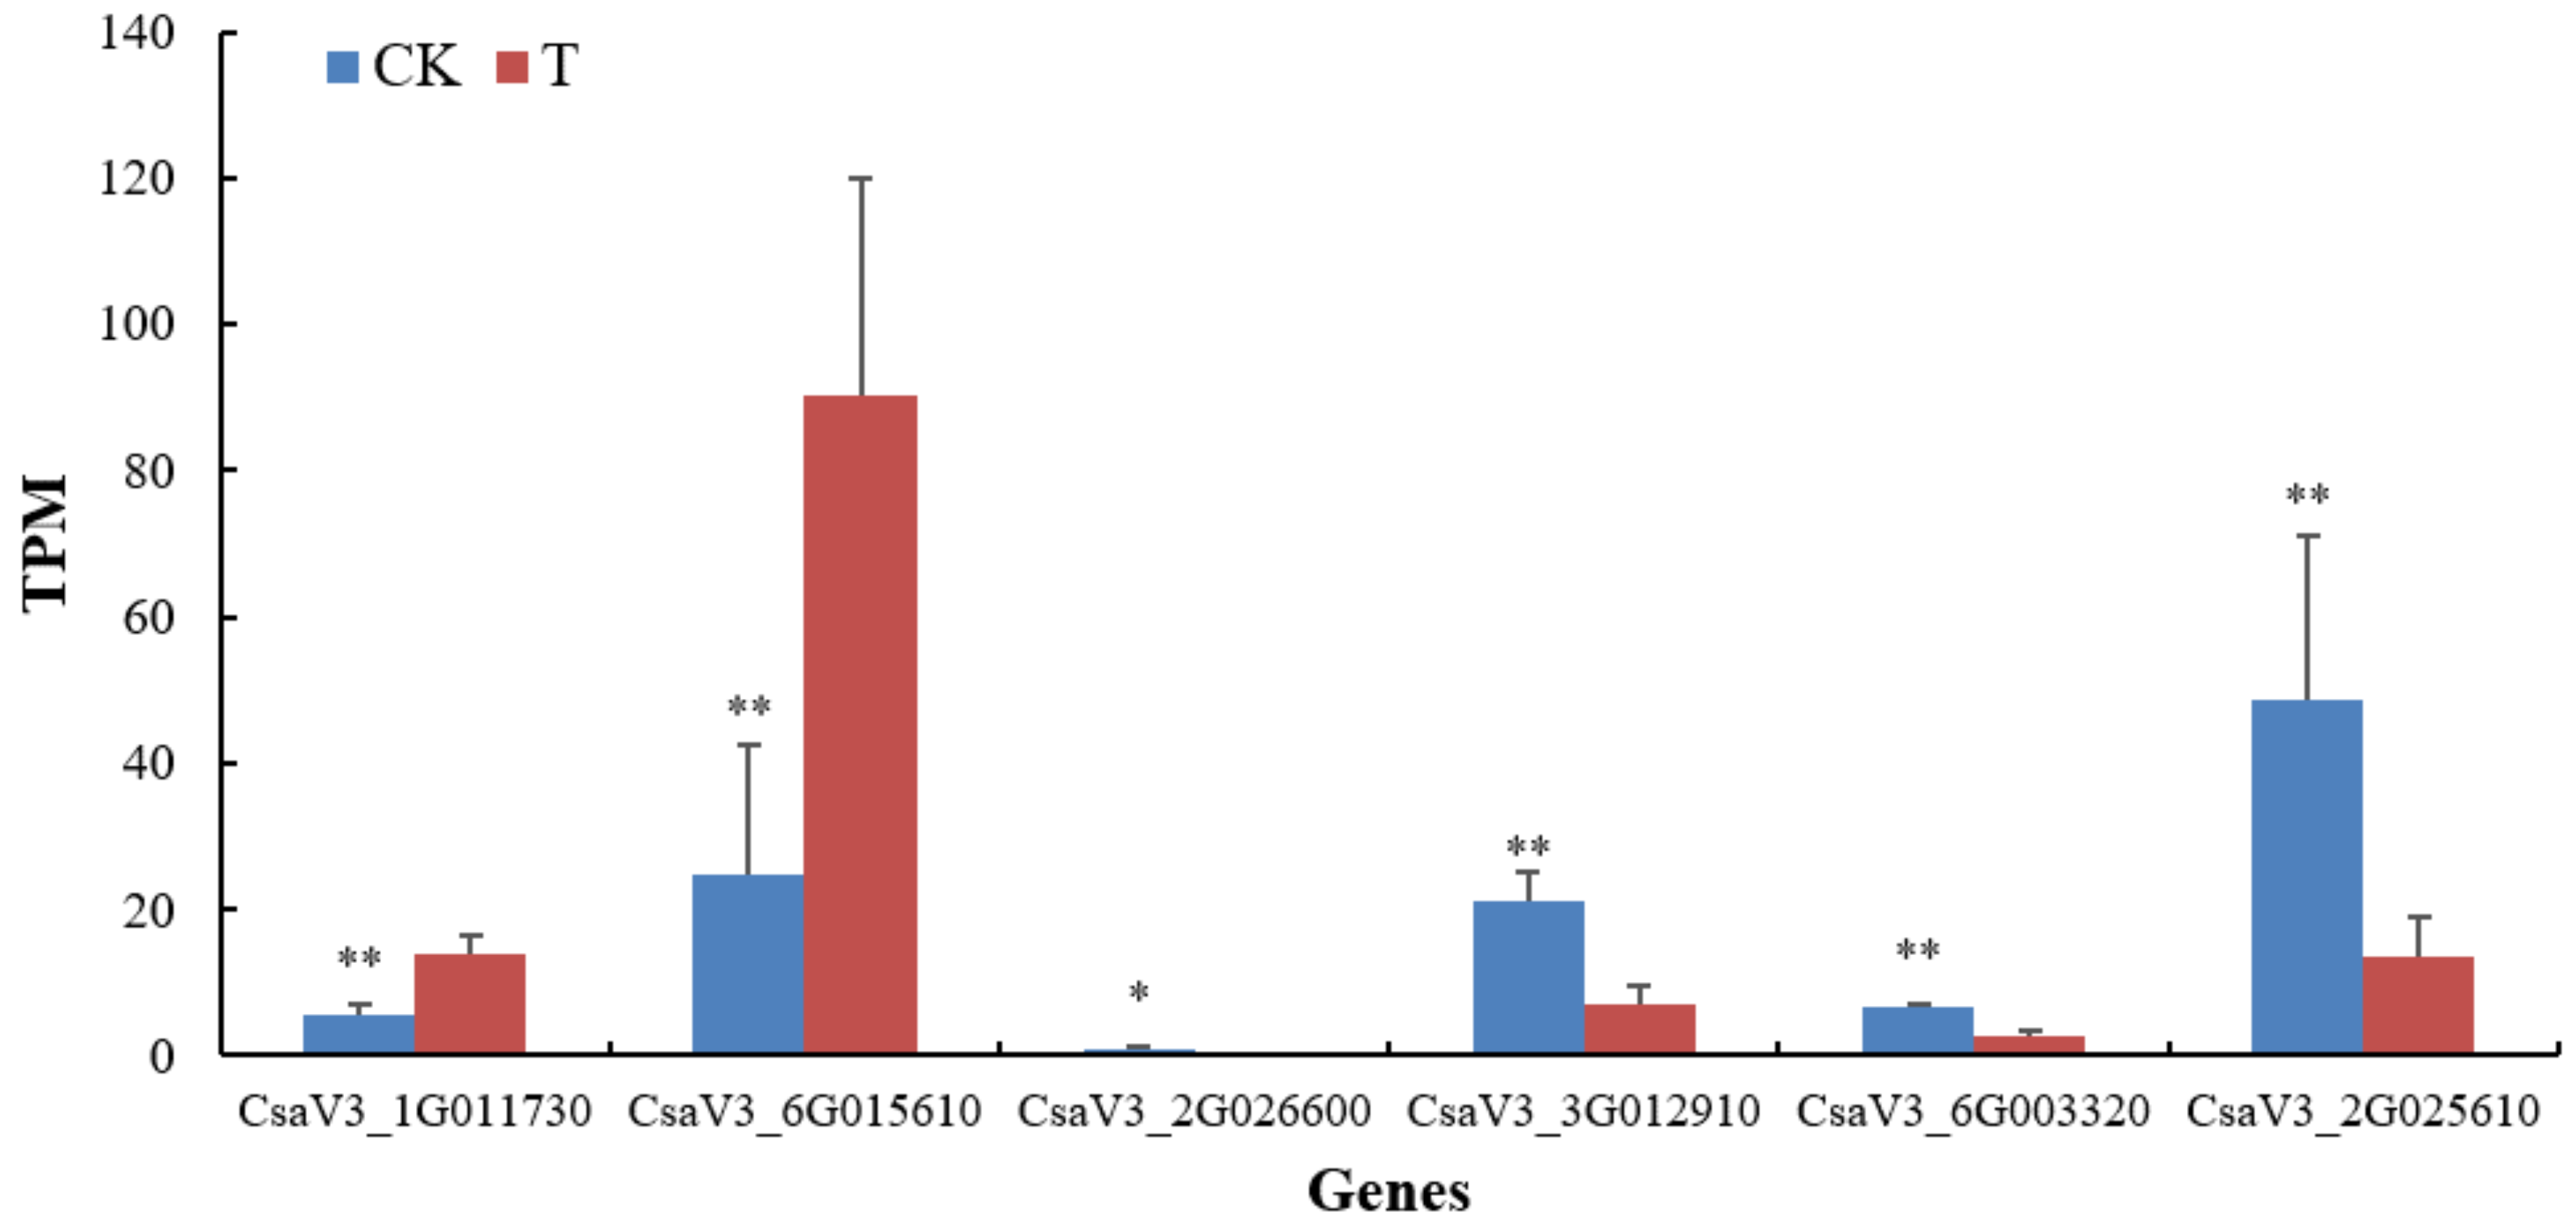
Figure 11.
Expression levels of the representative DEGs related to nitrogen metabolism. The abscissa represents several down-regulated genes related to nitrogen metabolism, and the ordinate shows the expression levels of DEGs, i.e. the values of transcripts per million (TPM) of the tested DEGs. A single asterisk indicates that there is a significant difference in gene expression between the treatment group and the control group (p-adjust<0.05). The double asterisks mean that there is an extremely significant difference in gene expression between the treatment group 2 and the control group (p-adjust<0.01).
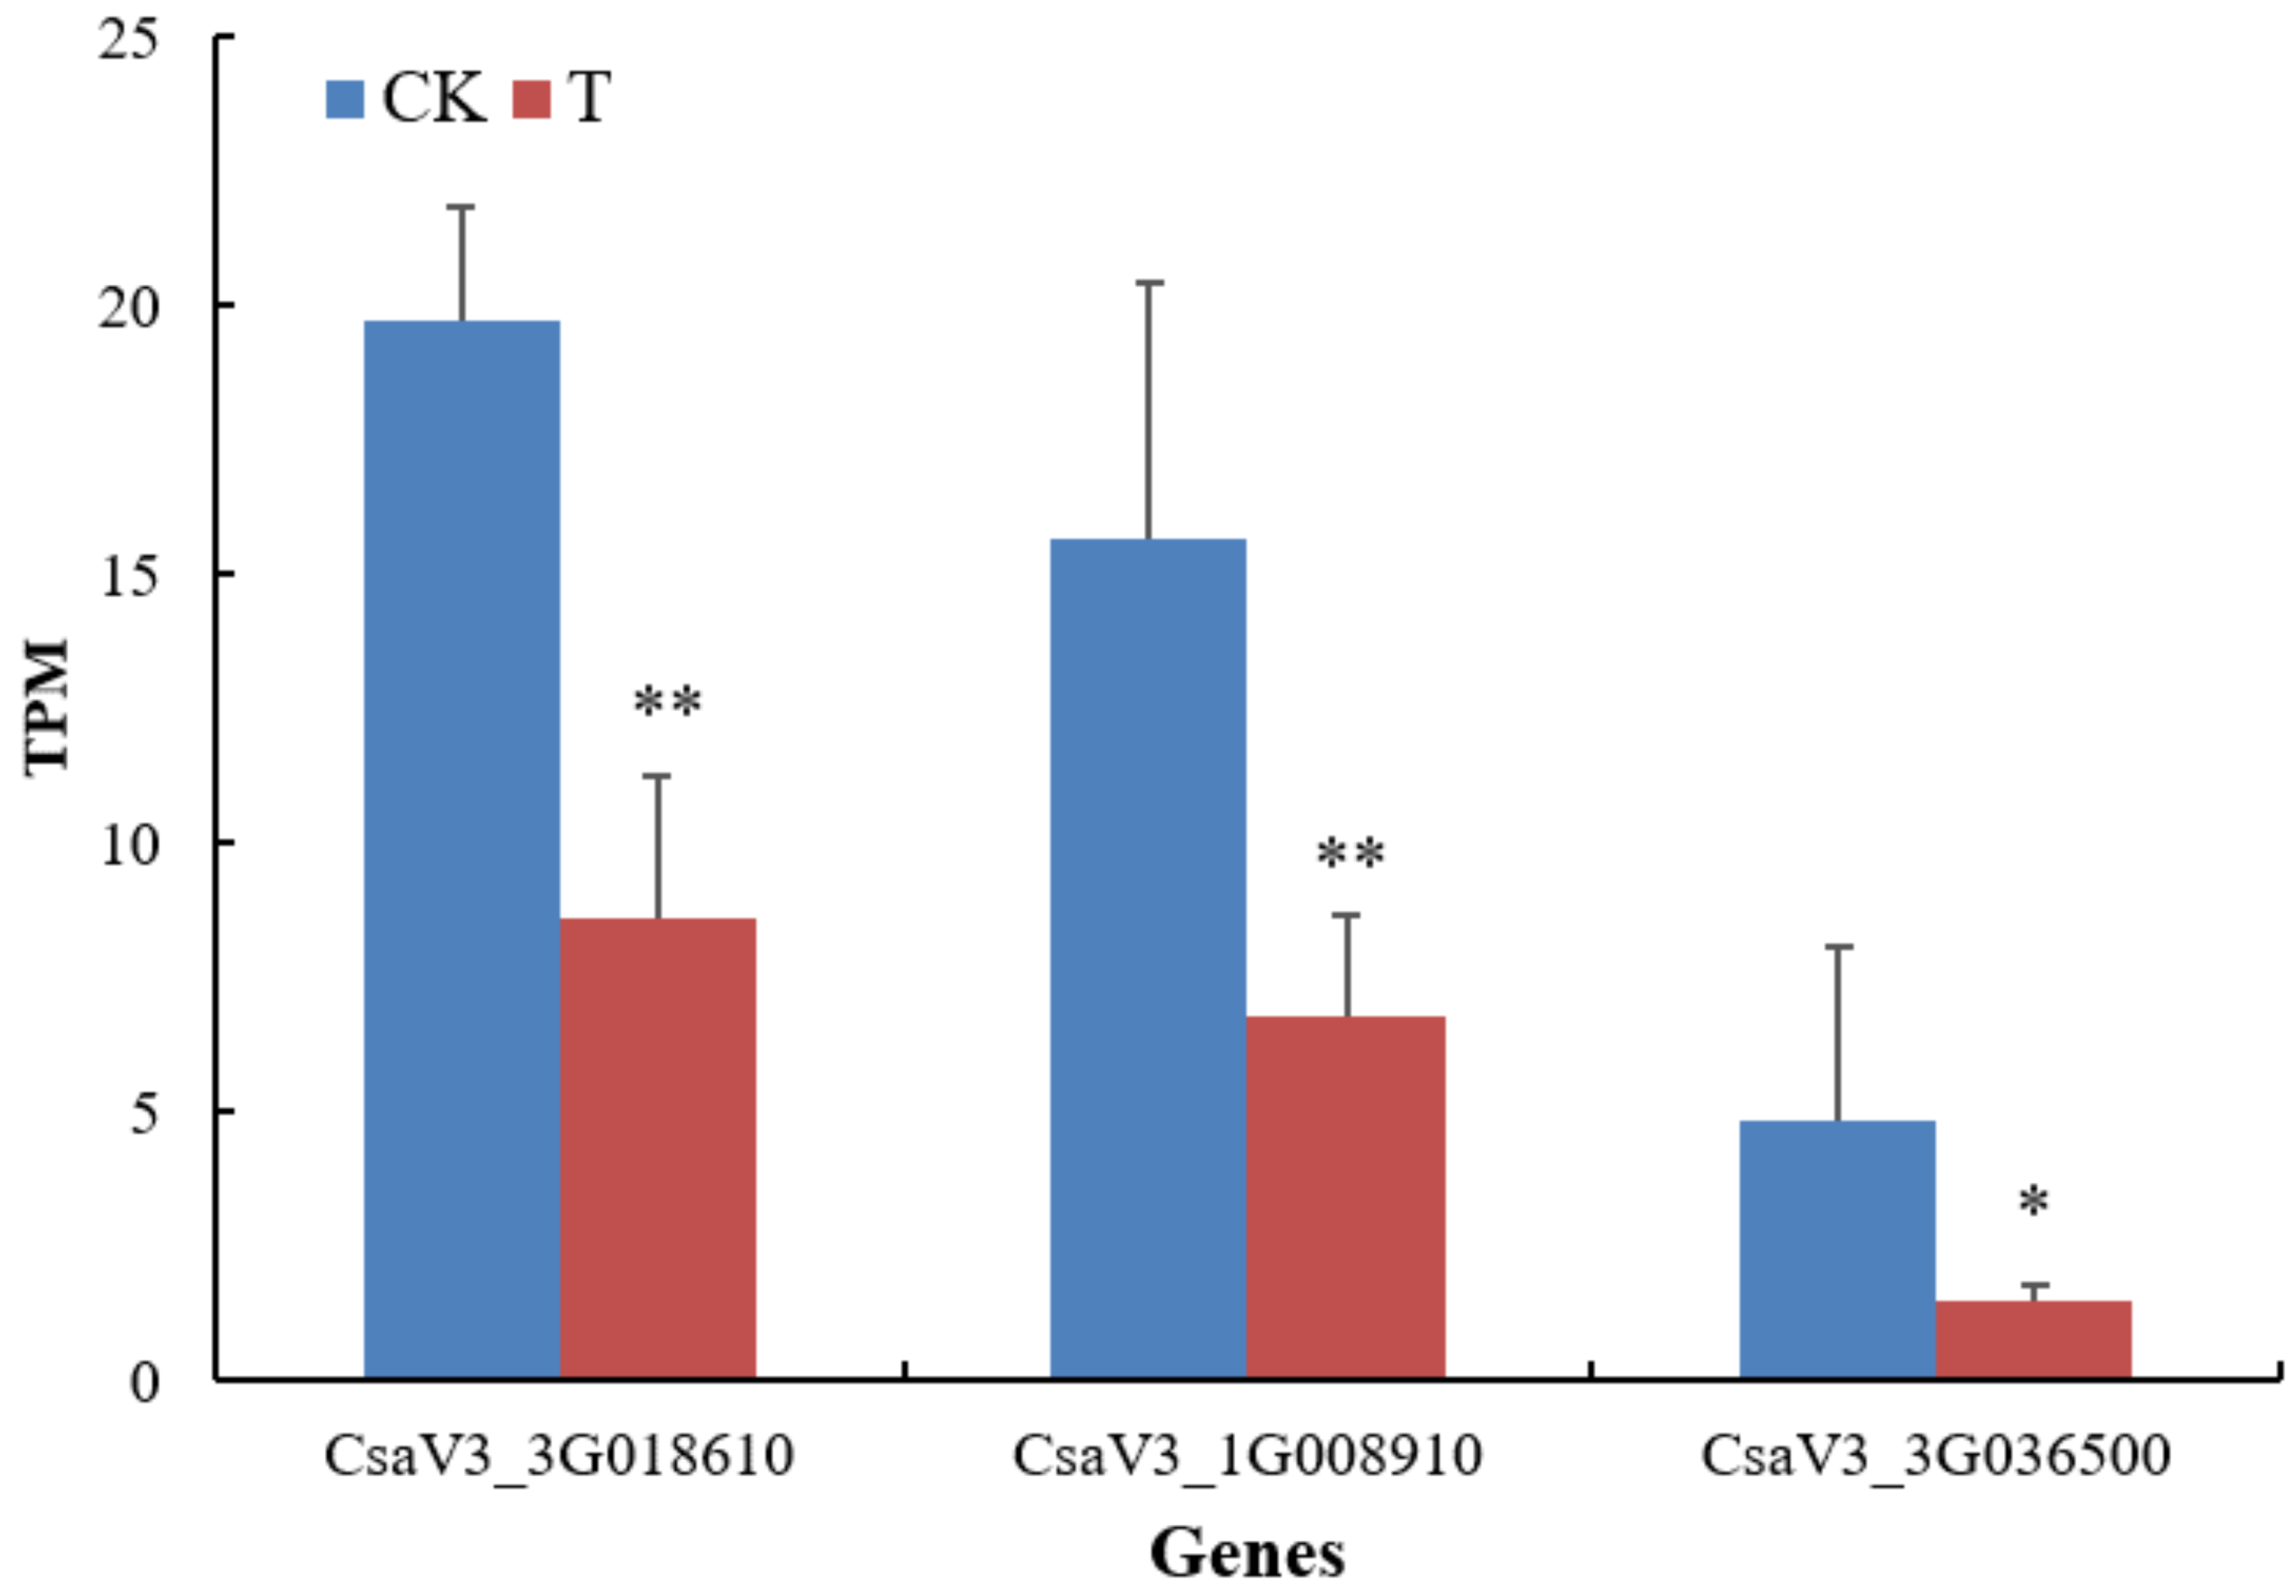

Table 1.
Primers’ sequences used in this study.
| Primer name | Primer sequence (5′ to 3′) | Size ( bp ) | Purpose |
| Csa1G047430-F | TGGCTTCAAATGCCTTTCTC | 938 | PCR subclone |
| Csa1G047430-R | CCAAACCCTTCTTTTGCTCA | ||
| Csa3G027720-F | AACCCCCTTTCCTCTCTTCA | 998 | |
| Csa3G027720-R | GCAGTCATTTGGGCTCTCTC | ||
| Csa5G161290-F | CACAAGCCACAATGAAC | 798 | |
| Csa5G161290-R | CATGGGGATTTTCAATGGAC | ||
| Csa2G416080-F | GATTTTTGGGGAAACCCAGT | 772 | |
| Csa2G416080-R | CTGGGTGAGGCAGACTTCTC | ||
| qRT_ACT-F | TTCTGGTGATGGTGTGAGTC | 151 | qRT-PCR |
| qRT_ACT-R | GGCAGTGGTGGTGAACATG | ||
| qRT_Csa1G047430-F | GCATCGTGGAAAAGCAGTACA | 233 | |
| qRT_Csa1G047430-R | GAAGCAAGCGGAGGCAATA | ||
| qRT_Csa3G027720-F | GCCACATCGGAAAATCGTT | 158 | |
| qRT_Csa3G027720-R | AATTCGTTGTAATGGGGTAAGG | ||
| qRT_Csa5G161290-F | CTCCGACCGCCAAAATG | 240 | |
| qRT_Csa5G161290-R | TCCAAGTGACCCAATGCTAAT | ||
| qRT_Csa2G416080-F | AGTATCGGGTCGTTGTTTGC | 162 | |
| qRT_Csa2G416080-R | AGGGCTTCCTCTTGGCTTT |
Table 2.
COG functional classification of C. sativus DEGs.
| Category | Type | Functional description | Gene-Number |
| Information storage and processing Metabolism Cellular processes and signaling Metabolism Metabolism Metabolism Metabolism Metabolism Information storage and processing Information storage and processing Information storage and processing Cellular processes and signaling Cellular processes and signaling Metabolism Metabolism Poorly characterized Cellular processes and signaling Cellular processes and signaling Cellular processes and signaling |
A C D E F G H I J K L M O P Q S T U V |
RNA processing and modification Energy production and conversion Cell cycle control, cell division, chromosome partitioning Amino acid transport and metabolism Nucleotide transport and metabolism Carbohydrate transport and metabolism Coenzyme transport and metabolism Lipid transport and metabolism Translation, ribosomal structure and biogenesis Transcription Replication, recombination and repair Cell wall/membrane/envelope biogenesis Posttranslational modification, protein turnover, chaperones Inorganic ion transport and metabolism Secondary metabolites biosynthesis, transport and catabolism Function unknown Signal transduction mechanisms Intracellular trafficking, secretion, and vesicular transport Defense mechanisms |
3 5 1 5 4 14 5 9 6 23 4 4 20 6 6 195 7 8 1 |
Disclaimer/Publisher’s Note: The statements, opinions and data contained in all publications are solely those of the individual author(s) and contributor(s) and not of MDPI and/or the editor(s). MDPI and/or the editor(s) disclaim responsibility for any injury to people or property resulting from any ideas, methods, instructions or products referred to in the content. |
© 2025 by the authors. Licensee MDPI, Basel, Switzerland. This article is an open access article distributed under the terms and conditions of the Creative Commons Attribution (CC BY) license (http://creativecommons.org/licenses/by/4.0/).
Copyright: This open access article is published under a Creative Commons CC BY 4.0 license, which permit the free download, distribution, and reuse, provided that the author and preprint are cited in any reuse.


