
Submitted:
03 January 2025
Posted:
04 January 2025
You are already at the latest version
Abstract
Sweet cherry (Prunus avium L.) is popular with the public because of its bright color and unique taste. In order to determine the changes of fruit quality of sweet cherry in southern China, the fruit quality of sweet cherry in southern China was analyzed. The results showed that the red variety 'JNH' had the largest single fruit weight and diameter, and the highest content of C3R. The yellow variety 'CY' has higher L* value, b* value and Vitamin C content. It was determined in this experiment that the main anthocyanin content in sweet cherry fruits during the ripening period was C3R. LOC110744862, LOC110749842 and LOC110753376, which participate in anthocyanin biosynthesis, were finally screened. Anthocyanin plays an important role in the fruit appearance and nutritional quality. The results provided a theoretical basis for the differences among sweet cherry varieties in southern China.
Keywords:
sweet cherry
; fruit quality
; anthocyanins
; WGCNA
1. Introduction
Sweet cherry (Prunus avium L.) belonging to the Rosaceae family, is originated in the border of Asia and Europe. Sweet cherries are popular among the public because of its unique taste and rich nutritional value (Antonio et al., 2018). Sweet cherry was first introduced to Yantai City, Shandong Provice , China in 1871. In recent years, growers have introduced sweet cherries to southern China in order to prolong the fruit eating cycle and increase economic income. The lack of cold conditions due to rapid within-spring warming in southern China, is the reason that sweet cherries only blossom but bear no fruit in this region (Erez, 1987; Ahmed, 2007). With the development of planting industry in recent years, various sweet cherry varieties introduced in Ningbo, Zhejiang province have successfully realized fruit bearing.
Sweet cherry is mainly eaten as fresh fruit and its consumption is directly related to ripeness and fruit quality (Irfan et al., 2021). At the same time, fruit color, protein content, endogenous hormones, anthocyanins and a variety of phenolic substances constitute the fruit quality of sweet cherry (Eda and Mehmet, 2015). Vitamin C (VC) plays an important physiological role in the human body, which is an important antioxidant that reduces the risk of cancer and cardiovascular disease (Byers and Perry, 1992). Studies have shown that VC content in sweet cherries is higher than other fruits (Leong and Oey, 2012), which may also provide important biological protection functions to reduce oxidative damage to body cells (Leong et al., 2017). Protein in fruits is important in the ripening and antioxidant processes, and some studies have shown that sweet cherry have higher protein concentrations than apple, plum and other fruits (Yang et al., 2021; Liu et al., 2022). Plant endogenous hormones are involved in key processes such as plant growth, development and signal response. Both gibberellin(GA) and brassinolide(BR) can improve fruit set percentage, prevent falling flowers and fruit, increase stress resistance, etc (Wang et al., 2017; Lv et al., 2022). However, there are few studies on BR in sweet cherry.
The flavor of fleshy fruits is mainly determined by the dynamic balance between sugars and acids (Colaric et al., 2005). The soluble glucose, sucrose and fructose not only act as signal molecules to initiate the signal transduction cascade, but also play an important role in plant growth and fruit quality (Cho and Yoo, 2011). Natural organic acids are widely found in fruits and medicinal plants, which play an important role in antioxidant, antibacterial and anti-inflammatory effects on human health (Adamczak et al., 2019). The common organic acids in fruits are mainly divided into aliphatic organic acids, including citric acid, tartaric acid, malic acid, etc. Aromatic organic compounds include salicylic acid and caffeic acid (Liu et al., 2016).
Anthocyanin is a class of water-soluble natural pigment in plants that widely presents in the nature belongs to a subgroup of flavonoids (He and Giusti, 2010). The mechanisms of anthocyanin biosynthesis have been elucidated in a variety of plant species, such as apple, pear, sweet cherry, eggplant, tomato, etc (Liu et al., 2021; Wei et al., 2015a; Li et al., 2020). Anthocyanins as one of the important qualities of sweet cherry, which play a decisive role in the appearance and color of sweet cherry fruit (Gonzalez-Gomez et al., 2010). The color of the sweet cherry fruit ranges from dark red to yellow because of the variety and content of anthocyanins. In the market, sweet cherry species mainly divided into red sweet cherry and yellow sweet cherry. The biosynthesis of anthocyanin compounds are maintained at high levels when red sweet cherry turning red, but the regulatory mechanism of anthocyanin transport and accumulation is still unclear (Qi et al., 2022).
According to the difference of fruit quality of sweet cherry in southern China, the apparent and intrinsic indexes of sweet cherry were studied, especially the determination of anthocyanin main components and the differential expression analysis of related anthocyanin genes.
2. Materials and Methods
2.1. Plant Materials
The material red sweet cherry fruits 'Jiangnanhong' (JNH), '5-106' (5-106), 'Changfengyihao' (CF) and yellow fruits 'Chaoyangyihao' (CY) were harvested from a commercial orchard in Yuyao, Ningbo City, China (121°16′ E, 30°1′ N; elevation 6m). The fruits were harvested at 4 commercial maturity stages: 40 days after flowering (DAF) (S1), 44 DAF (S2), 48 DAF (S3), 52 DAF (S4) (Supplementary Figure S1). Furthermore, Fruits that are free of pests, diseases, mechanical damage and roughly the same size and immediately transported back to the laboratory under cold storage.
2.2. Fruit Color and Size
Fruit color parameter were measured using a spectrometer (Konica Minolta, Japan), according to the CIELAB one-color system to analyze L*, a* and b* parameters. L* is the lightness of the color, ranging from black (L*=0) to white (L*=100). The a* negative and positive represent green and red, and b* negative and positive are for blue and yellow, respectively. Fruit size was measured by vernier calipers. Fruit shape index = fruit longitudinal diameter/fruit transverse diameter.
2.3. Total Soluble Solids, VC Content, Gibberellin and Brassinolide
Total soluble solids (TSS) content was determined in the juice at 20℃ by using a portable reflectometer (PAL-1, ATAGO Corporation, Tokyo, JPN), and results were presented as °Brix. VC content and total protein content were measured using the corresponding kit (Jiancheng Bio. Ins., China). Gibberellin (GA) and brassinolide (BR) were determined using corresponding plant hormone kits (Jingmei Bio., China). Take 0.2g samples according to the protocol and determine under the microplate reader (SpectraMax i3x, MolecularDevices Corporation, Sunnyvale, CA, USA).
2.4. Extraction and Analysis of Anthocyanin Components
Anthocyanin content was determined using the method described by Wei et al. (2015b) with minor modification. The supernatant fluid was condensed by rotary steaming and filtered through a 0.45 μm membrane for identification and analysis of anthocyanin. The anthocyanin content was measured by the TripleTOFTM 5600 LC-MS/MS (AB SCIEX, USA) at 520 nm. Anthocyanin compound standards, including cyanidin-3-O-glucoside, cyanidin-3-O-rutinoside chloride and pelargonidin-3-glucoside chloride were purchased from Sigma Aldrich Chemical Co., Ltd (USA).
2.5. Contents of Soluble Sugar
Based no the protocol reported by Wu et al. (2020) with minor modifications. The fruit powder (2.0 g) was mixed with 80% alcohol at 75℃ for 30 minutes, and the supernatant was filtered through a 0.22 µm filter membrane. The filtrate was analyzed by high performance liquid chromatography (Waters e2695, USA). For HPLC analysis, the following conditions were adopted: the injection volume was 10 μL; the chromatography was performed on Bio-Rad Aminex HPX-87H (300 mm×7.8 mm); the mobile phase acetonitrile: water = 4: 1; column temperature: 35℃; flow rate: 0.9 mL·min-1. The content of fructose, glucose and mannitol were achieved with standard substances and were purchased from Sangon Biotech (Shanghai) Co., Ltd. (CN).
2.6. The Content of Organic Acid
Based no the protocol reported by Fan et al. (2022) with minor modifications. Fruit powder (2.5 g) was immersed in 5.0 mL ultra-pure water, and then ultrasonic extraction was carried out at 40℃ for 50 minutes, and the supernatant was filtered through a 0.22 µm filter membrane. The organic acids were separated by Carbomix H column (300 mm×7.8 mm) with the column temperature at 28℃ and mobile phase NH4H2PO (pH 2.6, 10 mmol): methanol = 97: 3, the flow rate was 0.8 mL·min-1, and the injection volume was 10 μL. The content of malic acid, quinic acid and citric acid were achieved with standard substances and were purchased from Sangon Biotech (Shanghai) Co., Ltd. (CN).
2.7. Real-Time Quantitative PCR Analysis of Gene Expression
Total RNA was extracted by the polysaccharide polyphenol reagent kit (Takara Cat.9769, China). Using total RNA as template, reverse transcription experiments were performed using NovoScript® Plus All-in-one 1st Strand cDNA Synthesis SuperMix kit (Novoprotein Cat.E047, China). Specific primer pairs and reference gene (β-Actin) were showed in Supplement Table S1. qRT-PCR analysis was also performed by a kit according to protocol (Vazyme biotech Co. Ltd, China). The following reactions were performed using a real-time PCR instrument (ABI Q6 Flex) with a procedure: 95℃, 1 min; 95℃ 15 s; 60℃ 1 min (45 cycles of the above steps). Each plate was repeated three times in independent runs for all reference and selected genes. The real-time data were analyzed by CFX ManagerTM 3.0 software to obtain amplification and melting curves, which were transformed to analyze the data results by the 2-ΔΔCt method. Three biological replicates and three technical replicates were performed for each sample.
2.8. Analysis of WGCNA
Using gene expression information, WGCNA was constructed by R language package, and 12 modules were obtained. According to the gene expression and module eigen value, the correlation between gene and module was evaluted to identify the correlation result between gene and module.
2.9. Statistical Analysis
Statistical analysis and curve fitting were performed by using SPSS 19.0 software (SPSS Inc., Chicago, IL, USA). Significant differences were calculated by using one-way analysis of variance (ANOVA) followed by Duncan’s multiple range test at the 5% level (P < 0.05). The analysed data are shown in all the figures with lowercase letters (a, b, c, etc.) between the different treatments. Correlation analysis uses Origin 21.0 software (OriginLab Inc., Northampton, MA, USA) to represent correlation coefficients.
3. Results
3.1. Fruits Color
The L* value of the four sweet cherry varieties decreased gradually during ripening (Table 1). All values ranged from 22.10 to 72.44, and the L* value of 'JNH' was the smallest among the four maturities, and the L* value of 'CY' was the largest, indicating that the fruit color of 'JNH' was darker and that of 'CY' was brighter. There were significant differences in L* values among all varieties, with the largest variation in 'CF' and the smallest in 'CY'. The a* values of 'JNH' and 'CF' increased first and then decreased during ripening. The a* value reached a maximum of 40.74 at 'JNH' S2. but reached a maximum of 44.06 at 'CF' S3. The a* values of '5-106' and 'CY' increased gradually during ripening, and reached a maximum of 42.89 and 14.75 at S4, respectively. All the above indicated that 'JNH' fruit was dark red, '5-106' and 'CF' fruit was red. However, in 'CY', red content was always kept at a low level, which was significantly different from other varieties. The b* values of 'JNH', '5-106' and 'CF' all decreased during the maturation and varied significantly between maturities, with all values ranging between 2.72 and 34.44. The b* value of 'CY' basically kept between 39 and 40, indicating that the fruit color was yellow.
3.2. Fruits Shape
The changes of single fruit weight, fruit shape index, transverse and longitudinal diameter of southern sweet cherry fruit were shown in the Figure 1. The single fruit weight of all four varieties showed an increasing trend during ripening, and 'JNH' was the largest, with no significant change in S3 and S4 (P<0.05). The single fruit weight of 'CY' reached the maximum in S3, however , other varieties reached the maximum in S4 (Figure 1A). The variation trend of longitudinal and transverse diameter was similar to that of single fruit weight, with increasing first and then stabilizing, and the difference was significant in S3 and S4 period compared with S1 period. The transverse diameter of 'JNH' fruit was larger than that of other varieties. With regard to the longitudinal diameter, 'CY' fruit was significantly smaller than other varieties in S3 and S4 (Figure 1C,D). The fruit shape index of 'JNH' and 'CF' sweet cherry remained stable throughout the four stages of maturity, with values ranging from 0.9 to 1.0, indicating a round fruit shape. In contrast, the fruit shape index of '5-106' and 'CY' showed significant differences at S1 and S2 compared to S4, with values greater than 1.0 at S1 and S2 but less than 1.0 at S4, suggesting a change in fruit shape from elongated to round (Figure 1B).
3.3. Determination of Anthocyanin Components
The anthocyanin at each maturity of southern sweet cherry were identified (Table 2). The results showed that three anthocyanins were detected in southern sweet cherry, which were , cyanidin-3-O-glucoside (C3G), cyanidin-3-O-rutinoside chloride (C3R) and pelargonidin-3-glucoside chloride (P3G) with the proportion declining in turn. The C3R content of four sweet cherry varieties increased with the increase of sweet cherry maturity, and significant differences were observed among different stages of maturity. Among all the maturities, 'JNH' reached a maximum of 3909.32 µg/g at red cherries ( 'JNH') S4 but only reached a maximum of 6.25 µg/g in yellow cherries ('CY') S3. The content of C3G increased with the maturity, except for the 'CY' where it initially increased and then decreased. The content of C3G varied significantly among different maturities, except for 'CY'. Across all varieties, the content of C3G ranged from 0.74 to 13.54 μg·g-1 , among which 'JNH' was the highest and 'CY' was the lowest. P3G was only detected in trace amounts in 'JNH' and 'CF'.
The biosynthesis of anthocyanins is closely linked to the expression of F3'H, DFR, ANS and UFGT genes. All of the anthocyanin genes (including F3'H, DFR, ANS and UFGT) were signifiantly upregulated .in each varieties during ripening. The relative expression level of F3’H in 'JNH', '5-106' and 'CF' was respectively 10-fold, 4-fold and 2-fold higher than that in 'CY' at S4 (Figure 2A). Furthermore, the relative expression level of DFR in 'JNH' was increased by 7-fold compared to 'CY' (Figure 2B). The relative expression levels of ANS in 'CY' was the lowest compared to 'JNH', '5-106' and 'CF' (Figure 2C). As for UFGT, the relative expression level in 'JNH' exhibited a significantly greater difference compared to that of 'CY', '5-106' and 'CF', with an 800-fold increase relative to 'CY' (Figure 2D).
3.4. Fruits Quality
Total soluble solids (TSS), total protein content, VC, GA and BR of sweet cherry fruit were also determined in this study. The TSS exhibited a continuous increase throughout the ripening process of sweet cherry fruit, which increased significantly in 'JNH' (P<0.05) and reached the highest level of 18.30% among the four varieties in S4 (Figure 3A). In this study, fructose and glucose were identified as the predominant soluble sugars, with mannitol also present in significant amounts. The glucose and fructose contents of 'JNH', 'CY' and '5-106' exhibited a positive correlation with maturity, whereas 'CF' displayed a negative correlation. Mannitol increased continuously in 'CY' and '5-106', but in 'JNH' and 'CF' showed the opposite. Among the varieties, 'JNH' exhibited the highest content of the three sugar components, while '5-106' had the lowest (Figure 3B,C,D). Meanwhile, malic acid, citric acid and quinic acid were the three types of organic acids with the highest content detected, and malic acid was the main component of organic acids. With malic acid content ranging from 310.18 to 415.45 mg·100g-1, the content of 'JNH' at S4 increased by 23.5% compared with S1, while 'CY' and '5-106' at S4 decreased by 12.4% and 15.5% respectively compared with S1 (Figure 3E,F,G). The total protein content of 'JNH' was the highest, ranging from 46.71 to 59.27 mg·g-1. The lowest total protein content was '5-106', ranging from 20.86 to 23.23mg·g-1 (Figure 3H). The VC content of 'JNH' and '5-106' both showed an increasing trend, while 'CF' showed a trend of declining first and then rising.(Figure 3I). Compared with the S1, the variety with the greatest difference in gibberellin content during the S4 was '5-106', with a decrease of 34.24% in content. On the contrary, the smallest difference was CY', which reduced by 10.55% (Figure 3J). The content of brassinolide in 'JNH' at different maturity stages is the lowest, ranging from 0.25 to 0.32 μg·kg-1. The content of brassinolide reached a maximum of 0.48 μg·kg-1 at '5-106' S4. (Figure 3K).
3.5. Differential Transcription Factor of Sweet Cherry Fruit
The anthocyanins anabolism of sweet cherry is regulated by structural genes and transcription factors (TFs). We identified three TF families to explore the effect of TFs on anthocyanins synthesis in two cultivars, 'JNH'(red fruits) and 'CY'(yellow fruits) (Figure 4A–C). Among them, the MYB superfamily was the largest, including 42 MYB TFs. The second largest family was the bHLH family with 31 members, followed by the WD40 families with 15 members. Among all the detected MYB TFs, 32 genes were commonly expressed in S1 and S2 of 'JNH' and of 'CY', while 6 MYB TF genes were specifically expressed in S1 and S2 and 4 MYB TFgenes in S3 and S4 respectively.
The differential expression trend of bHLH TFs in 'JNH' and 'CY' was similar to that of MYB TFs. 4 bHLH TF genes were specifically expressed in S3 and S4 and 3 MYB TF genes at 4 ripening stages respectively. Other bHLH TFs were significantly expressed in S1 and S2 of 'JNH' and 'CY', but the expression was even more significant in 'JNH'. The WD40 TFs was significantly expressed in S1 and S2 of 'JNH' , with three WD40 TFs also significantly expressed in S4. Additionally, the WD40 TFs were mainly expressed in S1 and S2 of 'CY', but the expression level was lower than that of 'JNH'.
3.6. Screening Key Candidate Genes Based on WGCNA
In our study, the related genes affecting fruit anthocyanin biosynthesis of different sweet cherry fruit types were further identified by WGCNA analysis. According to the correlation coefficient between 24 samples, the co-expression modules of all samples were constructed, and 12 modules were finally obtained (Figure 5A). The correlation analysis between the gene expression module and the contents of C3R revealed that the yellow module was significantly correlated (r2=0.85), and that there were 173 genes in this module identifying a MYB transcription factor gene (Gene ID=LOC110744862) and a bHLH transcription factor gene (Gene ID=LOC110749842) (Figure 5B). By analyzing the enrichment of C3G metabolism-related genes, it was found that the red module containing 102 genes was highly correlated with the contents of C3G (r2=0.77), in which a bHLH transcription factor gene (Gene ID=LOC110753376) was identified.
4. Discussion
4.1. Difference in Fruit Quality Between Red and Yellow Cultivars of Sweet Cherry in Southeast China
Because of the difference in appearance, sweet cherries are divided into red and yellow groups (Esti et al., 2002). In terms of apparent color, the red cultivars show bright red, dark red, black red and so on, while the yellow cultivars show slightly red in yellow (Jin et al., 2016). In this study, the red variety showed bright red and dark red, while the yellow variety showed a yellow background with a translucent red color, which is consistent with Jin et al.. Wei et al. (2015a) reported that the fruit size of red varieties was larger than that of yellow varieties. In this study, the fruit size of red varieties was significantly larger than that of yellow varieties, which was similar to the results of previous studies. As for the different colors of different varieties, the color of sweet cherries is basically determined by the type and content of anthocyanins (Gonzalez-Gomez et al., 2010). However, the main anthocyanin components of red and yellow cultivars were the same, and UFGT played an important role in anthocyanin synthesis (Montefiori et al., 2011), which was consistent with the study of Wei et al. (2017). At the same time, consistent with the results of this study, the main anthocyanin component in red and yellow varieties is C3R. In previous studies, anthocyanin biosynthesis might lead to a reduction in other processes in plants because it was direct competition for assimilated carbon (Garcia-Macias et al., 2007). The anthocyanin content of red and yellow sweet cherry varieties increased, but only the soluble sugar content of 'CF' decreased slightly. We speculated that during fruit ripening, a large amount of organic matter accumulated in the fruit, and anthocyanin synthesis did not affect the production of soluble sugar. Multiple pathways are involved in the vitamin C synthesis, the most important of which is the pathway starting from glucose synthesis (Smirnoff, 1996). Yellow variety 'CY' was consistent with the results of Smirnoff's study. The content of vitamin C in red varieties 'JNH', '5-106' and 'CF' increased gradually, but it was inconsistent with the change of glucose content. In red varieties, there may be another pathway of vitamin C and glucose synthesis.
4.2. Quality Indexes During the Development of Sweet Cherry Fruit
In this study, the experimental materials were selected from different cultivars of sweet cherry at different maturity stages (Zhang et al., 2013). The sweet cherry growth and development presented double "S" curve(2014). From the late color turning stage to the commercial maturity stage, as the fruit expanded, the fruit shape index was less than 1, except for 5-106, all the other cultivars were in line with the general sweet cherry growth situation, which may be a unique growth attribute of the cultivar, requiring further exploration. Additionally, the appearance color of our results showed that L* value in red cultivar decreases continuously, a* value increases first and then decreases, and b* value decreases continuously, Studies (Piotr et al., 2019) have reported the similar results.
In terms of internal nutritional quality, there was no significant difference in total protein content and VC content between different maturities. In terms of endogenous hormones, GA can promote cell division, cell enlargement and fruit development, etc., while GA can inhibit anthocyanin synthesis through DELLA protein (Jeong et al., 2004; Kumar et al., 2014; Jiang et al., 2007; Xie et al., 2016). In this study, the GA content of fruit at maturity was continuously decreased, and the anthocyanin content was significantly increased, which was similar to the previous results. Anthocyanins are one of the important indexes for the intrinsic quality of sweet cherry fruits. The content of C3R in red sweet cherry increased sharply with the increase of maturity (Wei et al., 2017), and also increased significantly in yellow sweet cherry cultivar. Anthocyanins are one of the important indicators of the internal quality of sweet cherry fruit, and the content of C3R is the main anthocyanins of sweet cherry, which is consistent with Liu et al. (2011). The content of C3R increased sharply with the increase of maturity in red sweet cherry varieties, but only slightly increased in yellow sweet cherry varieties, which was consistent with the study of Wei et al. (2015a). The reason for this is that the anthocyanin metabolism pathway is regulated by genes, and the gene expression of different varieties is different.
4.3. PaMYB , PabHLH and PaWD40 Candidate Involved in Fruit Quality
Fruit quality is defined by its external and internal features, and fruit color is an effective means to predict both of these. Fruit peel pigment content determines the color of the fruit and can be affected by a variety of factors(Muhammad et al., 2023).A large accumulation of anthocyanins occurs in the peel and pulp tissue during the ripening process of sweet cherry fruit, which is favored by consumers because of its red flesh, unique taste and rich nutritional composition . Anthocyanins not only directly affect the appearance and quality of the fruit, but also have a variety of beneficial effects on human health due to its anti-oxidation and anti-carcinogenic functions (Wu et al., 2022). Anthocyanins are a class of natural water-soluble pigments, belonging to flavonoids. which are the flavonoids visible to the human eye with various colours like red, blue and purple imparted to tissues and reproductive organs of plants(Song et al., 2021). The synthesis of anthocyanins is mainly regulated by two types of genes. One is the gene encoding the key enzymes of anthocyanin synthesis, and the other is the regulatory genes such as MYB, bHLH, NAC and other transcription factors. The synthesis of anthocyanins in plants is mainly regulated by the the MYB-bHLH-WD40(MBW) transcriptional regulatory complex , which is formed by the interaction of MYB TF, bHLH TF and WD40 (Chen et al., 2022)In Arabidopsis, AtMYB90 can interact with TTG1 (WD40 ) and different bHLH partners (TT8, GL3 or EGL3) to regulate anthocyanin biosynthesis genes, and the sequence variation of AtMYB90 gene is the reason for the natural variation in anthocyanin accumulation(Gonzalez et al., 2008; Bac-Molenaar et al., 2015). However, FaMYB1 Inhibition of anthocyanin synthesis by interacting with bHLH proteins (JAF13 and AN1) in the MBW activation complex in strawberry(Aharoni et al., 2001). The interaction of PpMYBC2-L1 and PpMYBC2-L3 with MYC 1 inhibits the MBW complex protein in grape.(Cavallini et al., 2015). Similarly, in lily, LvMYB3 inhibits the synthesis of anthocyanins by competing with activating LvMYB7 to bind bHLH protein(Wang et al., 2022). In addition, there are many other TFs that regulate anthocyanin accumulation. MdNAC42, MdbZIP44 and MdERF78 found in apple can interact with MYB TFs and then participate in the regulatory network of anthocyanin accumulation(An et al.,2018; Zhang et al., 2020; Fang et al., 2022). PaMYB , PabHLH and PaWD40 candidate were screened by WGCNA analysis in this study. It is speculated that the candidate genes regulate anthocyanin synthesis of sweet cherry by forming protein complexes or interacting with other TFs, but its detailed mechanism needs further study.
5. Conclusions
In this research, we found that the red variety 'JNH' had the highest single fruit weight and diameter, with higher content of C3R, C3G, malic acid and total protein. The yellow variety 'CY' had higher quinic acid content and VC content, while the content of C3R, C3G, and citric acid were the lowest. In addition, it was determined in this experiment that the main anthocyanin content in sweet cherry fruits during the ripening period was C3R. LOC110744862, LOC110749842 and LOC110753376, which participate in anthocyanin biosynthesis, were finally screened. Anthocyanin plays an important role in the fruit appearance and nutritional quality. Therefore, it is speculated that it is involved in the formation of fruit anthocyanin biosynthesis traits of sweet cherry, but its mechanism needs further study.
Acknowledgments
This study was financially supported by the Ningbo Science and Technology Planning project of China (CN) (2019B10024).
References
- Adamczak, A., Ożarowski, M. and Karpiński, T. M. 2019. Antibacterial activity of some flavonoids and organic acids widely distributed in plants. Journal of Clinical Medicine 9(1): 109-126. [CrossRef]
- Adamczak, A., Ożarowski, M. and Karpiński, T. M. 2019. Antibacterial activity of some flavonoids and organic acids widely distributed in plants. Journal of Clinical Medicine 9(1): 109-126. [CrossRef]
- An JP, Yao JF, Xu RR, et al. Apple bZIP transcription factor MdbZIP44 regulates abscisic acid-promoted anthocyanin accumulation[J]. Plant Cell Environ, 2018, 41(11): 2678-2692).
- Antonio, M., Federica, I., Petronia, C., Loredana, F. C., Pasqualina, W., and Amodio, F. 2018. Metabolic characterization and antioxidant activity in sweet cherry (Prunus avium L.) campania accessions: metabolic characterization of sweet cherry accessions. Food Chemistry 240: 559-566.
- Bac-Molenaar J A, Fradin E F, Rienstra J A, et al. GWA mapping of anthocyanin accumulation reveals bal ancing selection of MYB90 in Arabidopsis thaliana[J]. PLoS One, 2015, 10(11): e0143212.
- Byers, T. and Perry, G. 1992. Dietary carotenes, vitamin C, and vitamin E as protective antioxidants in human cancers. Annual Review of Nutrition 12: 139-159. [CrossRef]
- Chen D Z, Chen H D, Dai G Q, et al. Genome-wide identification of R2R3-MYB gene family and association with anthocyanin biosynthesis in Brassica species[J]. BMC Genomics, 2022, 23(1): 441.
- Cho, Y. H. and Yoo, S. D. 2011. Signaling role of fructose mediated by FINS1/FBP in Arabidopsis thaliana. PLoS Genetics 7: e1001263.
- Commisso, M., Bianconi, M., Di, C. F., Poletti, S., Bulgarini, A., Munari, F., ... and Guzzo, F. 2017. Multi-approach metabolomics analysis and artificial simplified phytocomplexes reveal cultivar-dependent synergy between polyphenols and ascorbic acid in fruits of the sweet cherry (Prunus avium L.). PLoS One 12: e0180889. [CrossRef]
- Colaric, M., Veberic, R., Stampar, F. and Hudina, M. 2005. Evaluation of peach and nectarine fruit quality and correlations between sensory and chemical attributes. Journal of the Science of Food and Agriculture 85(15): 2611-2616. [CrossRef]
- Eda, H. and Mehmet, S. A. 2015. The effect of different electrolyzed water treatments on the quality and sensory attributes of sweet cherry during passive atmosphere packaging storage. Postharvest Biology and Technology 102: 32-41.
- Erez, A. 1987. Chemical control of budbreak. HortScience 22: 1240-1243. [CrossRef]
- Esti, M., Cinquanta, L., Sinesio, F., Moneta, E. and Matteo, M. D. 2002. Physicochemical and sensory fruit characteristics of two sweet cherry cultivars after cool storage. Food Chemistry 76: 399-405. [CrossRef]
- Fan, Y. T., Li, C. Y., Zhu, J., Sun, L., Huang, R., Guo, M., ... and Ge, Y. H. 2022. Organic acids metabolism and GABA shunt involved in maintaining quality of Malus domestica by methyl jasmonate treatment. Food Research International 160, 111741. [CrossRef]
- Fang X, Zhang LZ, Wang LJ. The transcription factor MdERF78 is involved in ALA-induced anthocyanin accumulation in apples[J]. Front Plant Sci, 2022, 13: 915197.
- García-Macías, P., Ordidge, M., Vysini, E., Waroonphan, S., Battey, N. H., Gordon, M. H., ... and Wagstaffe, A. 2007. Changes in the flavonoid and phenolic acid contents and antioxidant activity of red leaf lettuce (Lollo Rosso) due to cultivation under plastic films varying in ultraviolet transparency. Journal of Agricultural and Food Chemistry 55(25): 10168-10172. [CrossRef]
- Gonzalez-Gomez, D., Lozano, M., Fernandez-Leon, M. F., Bernalte, M. J., Ayuso, M. C. and Rodriguez, A. B. 2010. Sweet cherry phytochemicals: Identification and characterization by HPLC-DAD/ESI-MS in six sweet-cherry cultivars grown in Valle del Jerte (Spain). Journal of Food Composition and Analysis 23: 533-539. [CrossRef]
- Gonzalez A, Zhao M Z, Leavitt J M, et al. Regulation of the anthocyanin biosynthetic pathway by the TTG1/bHLH/Myb transcriptional complex in Arabidopsis seed lings[J]. Plant J, 2008, 53(5): 814-827.
- He, J. and Giusti, M. M. 2010. Anthocyanins: Natural colorants with health-promoting properties. Annual Review of Food Science and Technology 1: 163-187. [CrossRef]
- Irfan, A. S., Liu, X. J., Jiu, S. T., Matthew, W. and Zhang, C. X. 2021. Plant growth regulators modify fruit set, fruit quality, and return bloom in sweet cherry. HortScience 56: 922-931. [CrossRef]
- Jeong, S. T., Goto-Yamamoto, N., Kobayashi, S. and Esaka, M. 2004. Effects of plant hormones and shading on the accumulation of anthocyanins and the expression of anthocyanin biosynthetic genes in grape berry skins. Plant Science 167: 247-252. [CrossRef]
- Jiang, C. F., Gao, X. H., Liao, L. L., Harberd, N. P. and Fu, X. D. 2007. Phosphate starvation root architecture and anthocyanin accumulation responses are modulated by the gibberellin-DELLA signaling pathway in Arabidopsis. Plant Physiology 145: 1460-1470. [CrossRef]
- Jin, W. M., Wang, H., Li, M. F., Wang, J., Yang, Y., Zhang, X. M., ... and Zhang, K. C. 2016. The R2R3 MYB transcription factor PavMYB10.1 involves in anthocyanin biosynthesis and determines fruit skin colour in sweet cherry (Prunus avium L.). Plant Biotechnology Journal 14: 2120-2133.
- Kong, J. M., Chia, L. S., Goh, N. K., Chia, T. F. and Brouillard, R. 2003. Analysis and biological activities of anthocyanins. Phytochemistry 64: 923-933. [CrossRef]
- Kumar, R., Khurana, A. and Sharma, A. K. 2014. Role of plant hormones and their interplay in development and ripening of fleshy fruits. Journal of Experimental Botany 65: 4561-4571. [CrossRef]
- Leong, S. Y. and Oey, I. 2012. Effects of processing on anthocyanins, carotenoids and vitamin C in summer fruits and vegetables. Food Chemistry 133: 1577-1587. [CrossRef]
- Leong, S. Y., Burritt, D. J., Hocquel, A., Penberthy, A. and Oey, I. 2017. The relationship between the anthocyanin and vitamin C contents of red-fleshed sweet cherries and the ability of fruit digests to reduce hydrogen peroxide-induced dxidative stress in Caco-2 cells. Food Chemistry 227: 404-412.
- Li, L. Z., He, Y. J., Ge, H. Y., Liu, Y. and Chen, H. Y. 2020. Functional characterization of SmMYB86, a negative regulator of anthocyanin biosynthesis in eggplant (Solanum melongena L.). Plant Science 302: 110696. [CrossRef]
- Liu, H. M., Liu, Z. J., Wu, Y., Zheng, L. M. and Zhang, G. F. 2021. Regulatory mechanisms of anthocyanin biosynthesis in apple and pear. International Journal of Molecular Sciences 22: 8441-8454. [CrossRef]
- Liu, R., Wang, Y., Qin, G. and Tian, S. 2016. Molecular basis of 1-methylcyclopropene regulating organic acid metabolism in apple fruit during storage. Postharvest Biology and Technology 117, 57-63. [CrossRef]
- Liu, Y., Liu, X. Y., Zhong, F., Tian, R. R., Zhang, K. C., Zhang, X. M. and Li, T. H. 2011. Comparative study of phenolic compounds and antioxidant activity in different species of cherries. Journal of Food Science 76(4): 633-638. [CrossRef]
- Liu, Y. X., Huang, W. J., Yang, S. B., Mo, W. J., Zhang, Y., Han, W. J. and Zhang, J. J. 2022. Effects of ascorbic acid and salicylic acid on the storage properties of Prunus domestica × armeniaca. Non-wood Forest Research 40: 90-96 (in Chinese).
- Lv, J. H., Dong, T. Y., Zhang, Y. P., Ku, Y., Zheng, T., Jia, H. F. and Fang, J. G. 2022. Metabolomic profiling of brassinolide and abscisic acid in response to high-temperature stress. Plant Cell Reports 41: 935-946. [CrossRef]
- Muhammad N, Luo Z, Zhao X, Yang M, Liu Z, Liu M (2023) Transcriptome-wide expression analysis of MYB gene family leads to functional characterization of flavonoid biosynthesis in fruit coloration of Ziziphus Mill. Front Plant Sci 14:1171288.
- Montefiori, M., Espley, R. V., Stevenson, D., Cooney, J., Datson, P. M., Saiz, A., ... and Allan, A. C. 2011. Identification and characterisation of F3GT1 and F3GGT1, two glycosyltransferases responsible for anthocyanin biosynthesis in red-fleshed kiwifruit (Actinidia chinensis). The Plant Journal 65: 106-118.
- Piotr, C., Ireneusz, O. and Pawel, F. 2019. Sweet cherry skin colour measurement as an non-destructive indicator of fruit maturity. Food Technology 13(2): 157-166.
- Qi, X. L., Liu, C. L., Song, L. L., Dong, Y. X., Chen, L. and Li, M. 2022. A sweet cherry glutathione S-transferase gene, PavGST1, plays a central role in fruit skin coloration. Cells 11: 1170. [CrossRef]
- Smirnoff, N. 1996. Botanical briefing: The function and metabolism of ascorbic acid in plants. Annals of Botany 78(6): 661-669. [CrossRef]
- Song J.H., Guo C.K., and Shi M., 2021, Anthocyanin biosynthesis and transcriptional regulation in plant, Fenzi Zhiwu Yuzhong (Molecular Plant Breeding), 19(11): 3612-3620.
- Wang, L., Zhang, C. X., Huang, J. C., Zhu, L. N., Yu, X. M., Li, J. F. and Ma, C. 2017. Hydrogen cyanamide improves endodormancy release and blooming associated with endogenous hormones in ‘Summit’ sweet cherry trees. New Zealand Journal of Crop and Horticultural Science 45: 14-18. [CrossRef]
- Wei, H. R., Chen, X., Zong, X. J., Shu, H. R., Gao, D. S. and Liu, Q. Z. 2015a. Comparative transcriptome analysis of genes involved in anthocyanin biosynthesis in the red and yellow fruits of sweet cherry (Prunus avium L.). PLoS One 10: e0121164. [CrossRef]
- Wei, H. R., Yi, X. B., Tan, Y., Zong, X. J., Wang, J. W., Xu, L. and Liu, Q. Z. 2015b. Determination of anthocyanins in the peel of sweet cherry by ultra performance liquid chromatography-tandem mass spectrometry. Chromatography 33(6): 577-582. [CrossRef]
- Wei, H. R., Tan, Y., Zong, X. J., Zhu, D. Z., Chen, X., Xu, L., ... and Liu, Q. Z. 2017. Relationship between anthocyanin accumulation and the activities of anthocyanin biosynthesis enzymes in different color of sweet cherry fruits. Plant Physiology Journal 53: 429-436 (in Chinese).
- Wu, Z. F., Tu, M. M., Yang, X. P., Xu, J. H. and Yu, Z. F. 2020. Effect of cutting and storage temperature on sucrose and organic acids metabolism in postharvest melon fruit. Postharvest Biology and Technology 161: 111081. [CrossRef]
- Wu Z.Q.; Li X.S.; Zeng Y.Y.; Cai D.B.; Teng Z.J.; Wu Q.X.; Sun J.X.; Bai W.B., 2022, Color stability enhancement and antioxidation improvement of Sanhua plum wine under circulating ultrasound. Foods, 11(16): 2435.
- Xie, Y., Tan, H. J., Ma, Z. X. and Huang, J. R. 2016. DELLA proteins promote anthocyanin biosynthesis via sequestering MYBL2 and JAZ suppressors of the MYB/bHLH/WD40 complex in Arabidopsis thaliana. Molecular Plant 9: 711-721. [CrossRef]
- Yang, G., Wu, Y. L., Gao, Y., Zhang, X. J. and Hao, Y. Y. 2021. Effects of exogenous methyl jasmonate on the quality of apple. Journal of Fruit Resources 2: 15-22 (in Chinese).
- Zhang, C. X. and Whiting, M. 2013. Plant growth regulators improve sweet cherry fruit quality without reducing endocarp growth. Scientia Horticulturae 150: 73-79. [CrossRef]
- Zhang SY, Chen YX, Zhao LL, et al. A novel NAC transcription factor, MdNAC42, regulates anthocyanin accumulation in red-fleshed apple by interacting with MdMYB10[J]. Tree Physiol, 2020, 40(3): 413-423.
Figure 1.
Variation of weight of single fruit (A), fruit shape index (B), transverse diameter (C) and longitudinal diameter (D) of sweet cherry. Values are mean ± standard error (SE) of three biological replicates (n=3). Means followed by different lowercase superscripts are significantly different at p < 0.05.
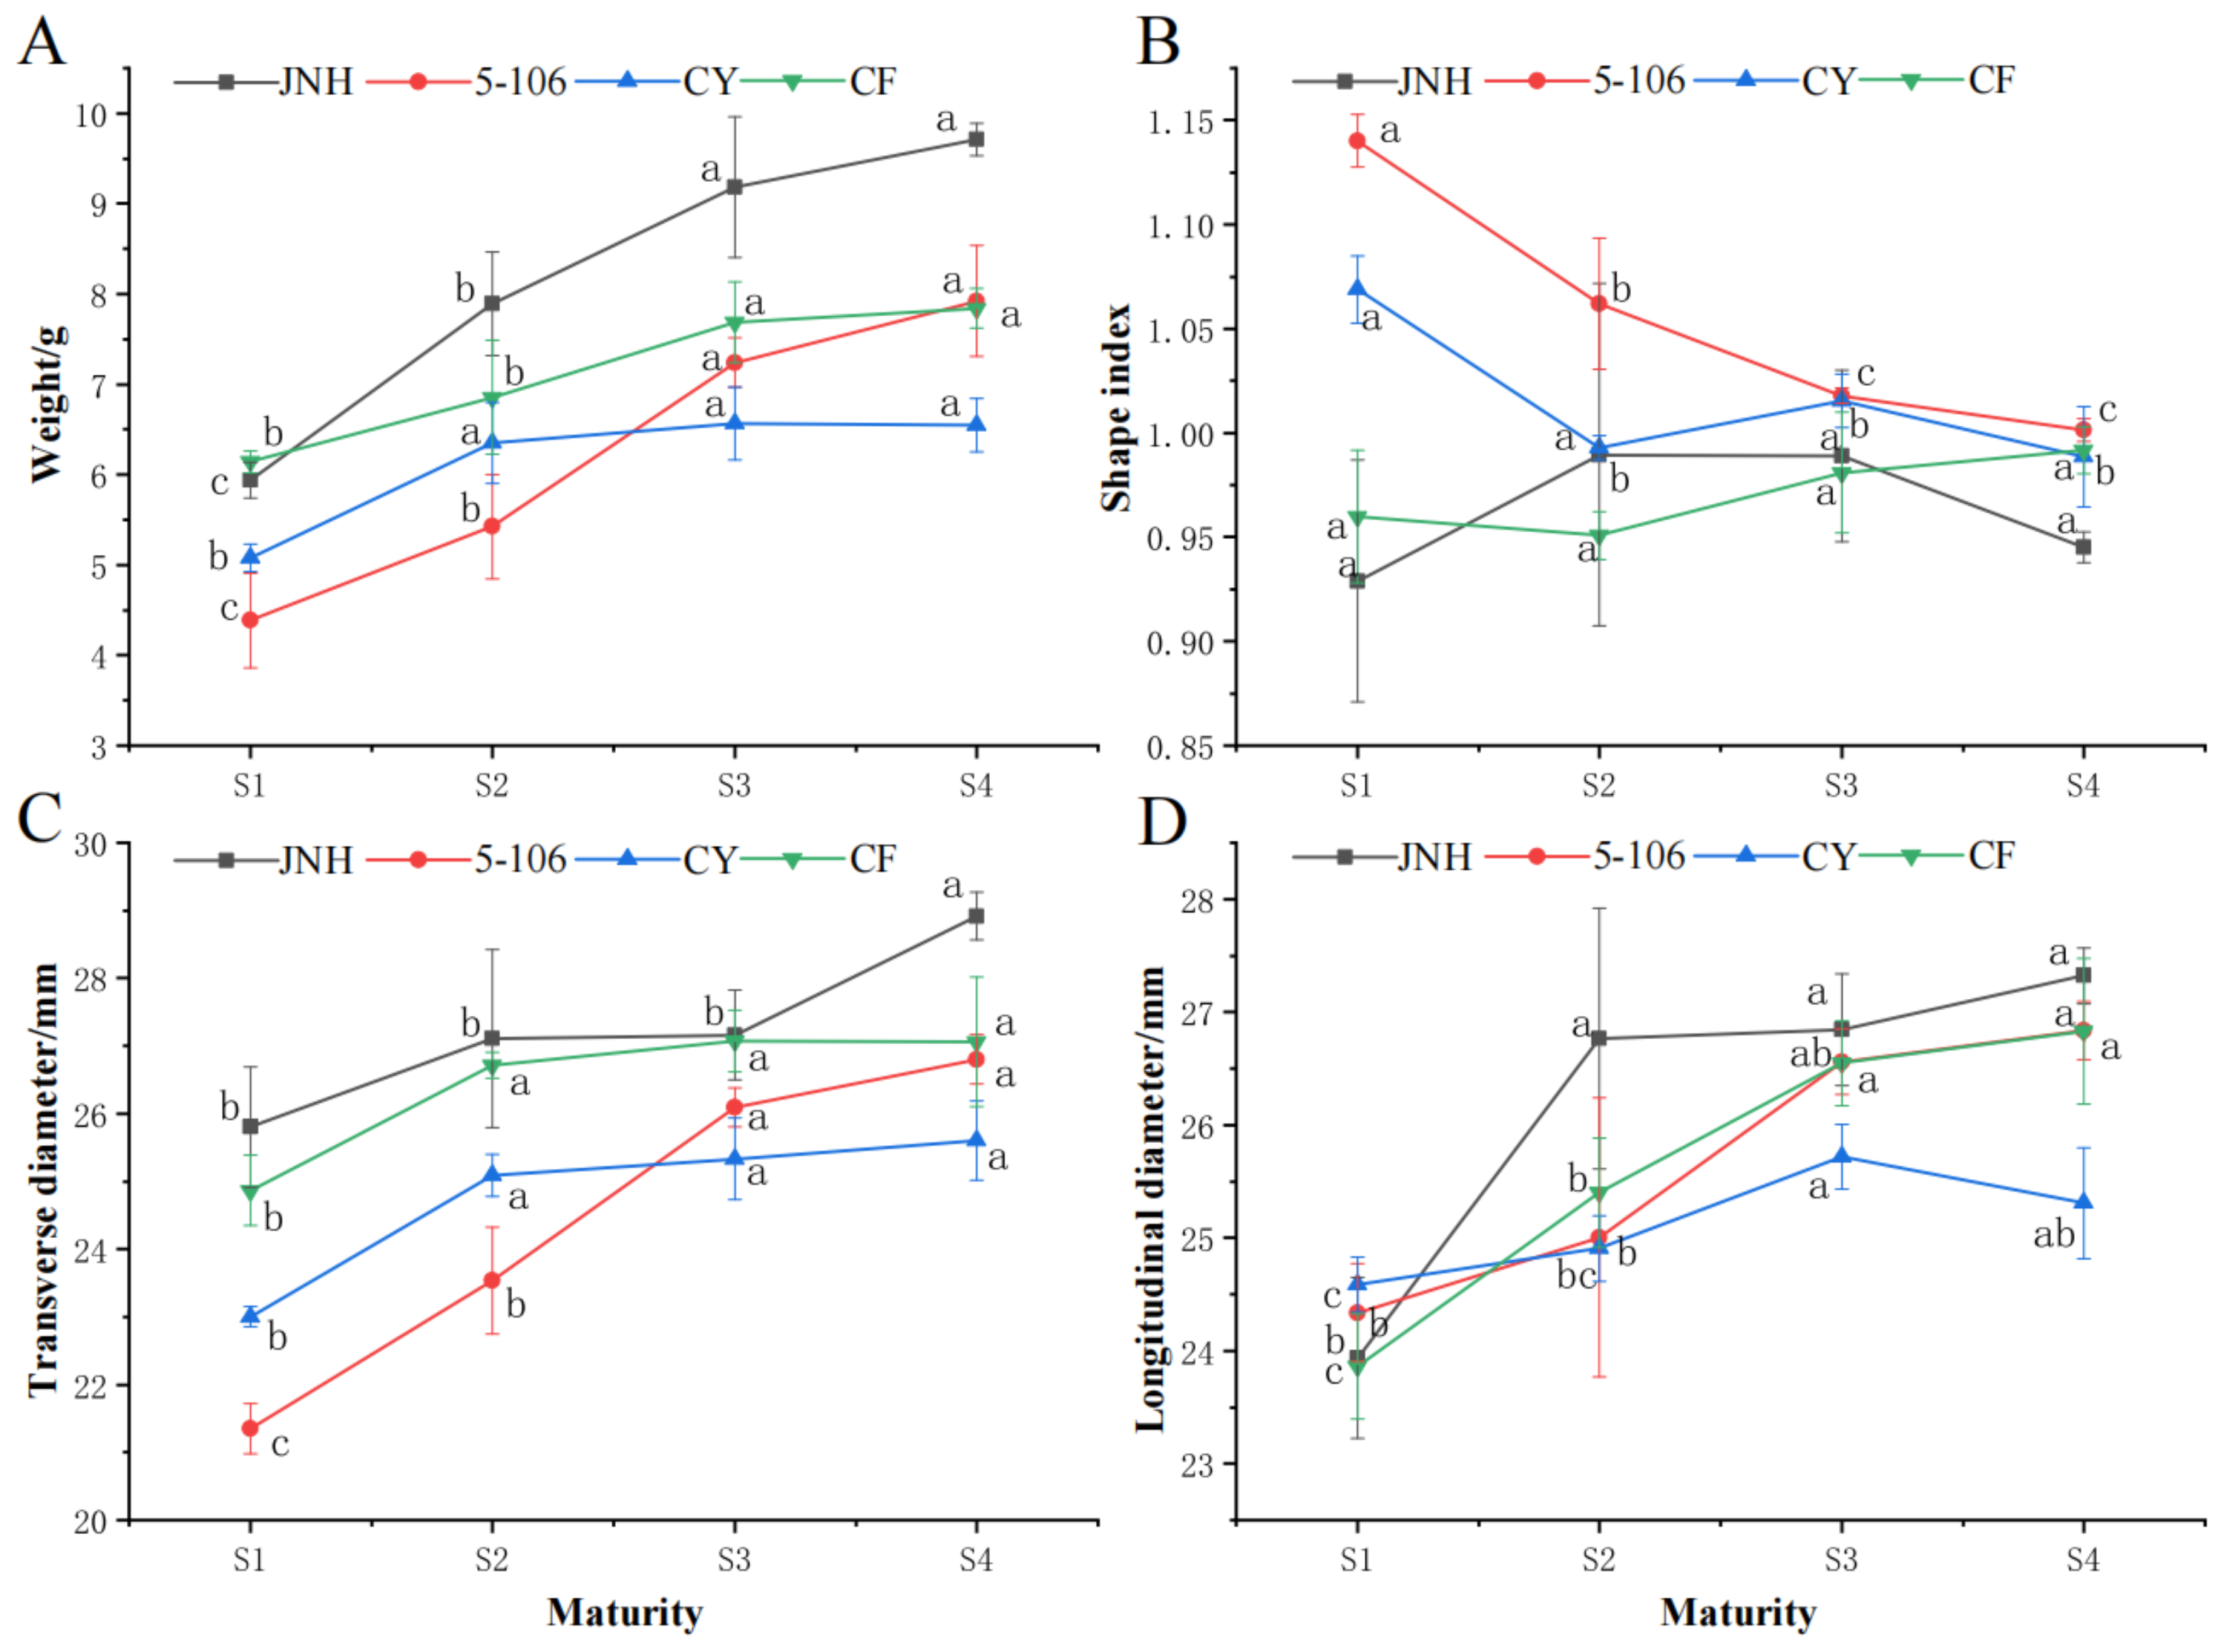
Figure 2.
Expression analysis of the structural genes related to anthocyanin biosynthesis in sweet cherry using qRT-PCR. Values are mean ± standard error (SE) of three biological replicates (n=3). Means followed by different lowercase superscripts are significantly different at p < 0.05.
Figure 2.
Expression analysis of the structural genes related to anthocyanin biosynthesis in sweet cherry using qRT-PCR. Values are mean ± standard error (SE) of three biological replicates (n=3). Means followed by different lowercase superscripts are significantly different at p < 0.05.
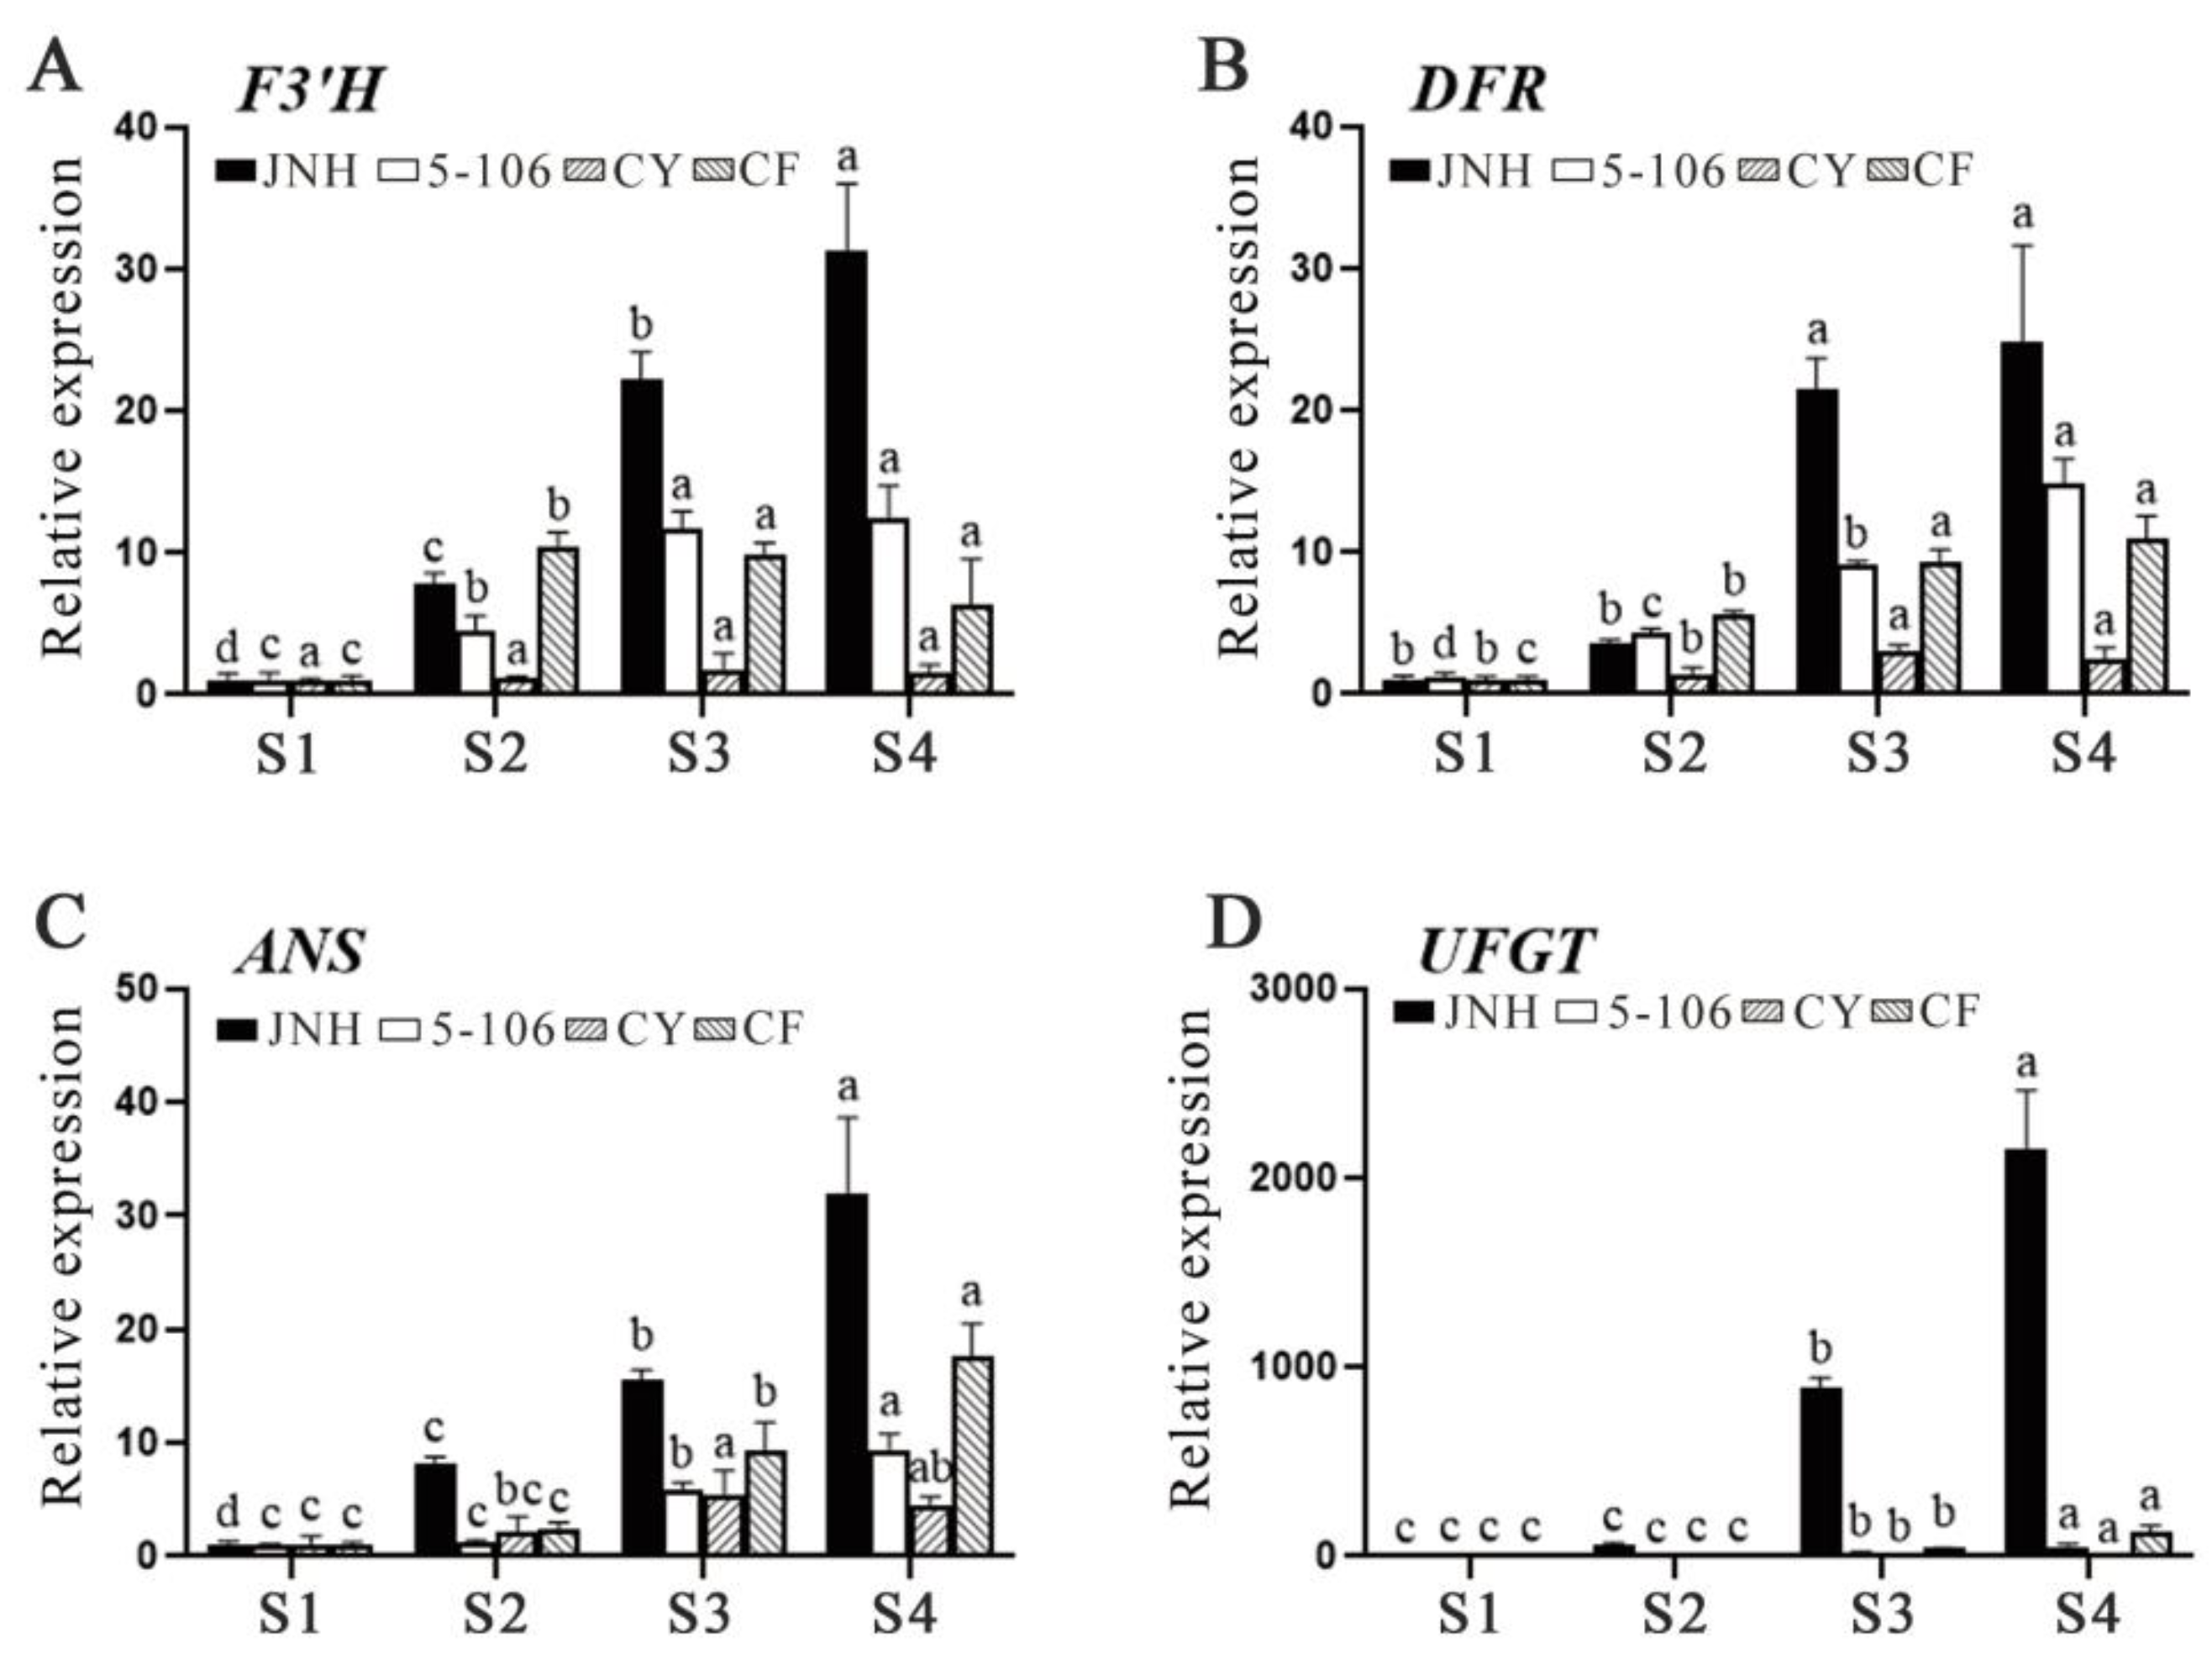
Figure 3.
Variation of TSS (A), glucose (B), mannitol (C), fructopyranose (D), malic acid (E), quinic acid (F), citric acid (G), Total protein content (H), VC content (I), GA content (J) and BR content (K) of sweet cherry. Values are mean ± standard error (SE) of three biological replicates (n=3). Means followed by different lowercase superscripts are significantly different at p<0.05.
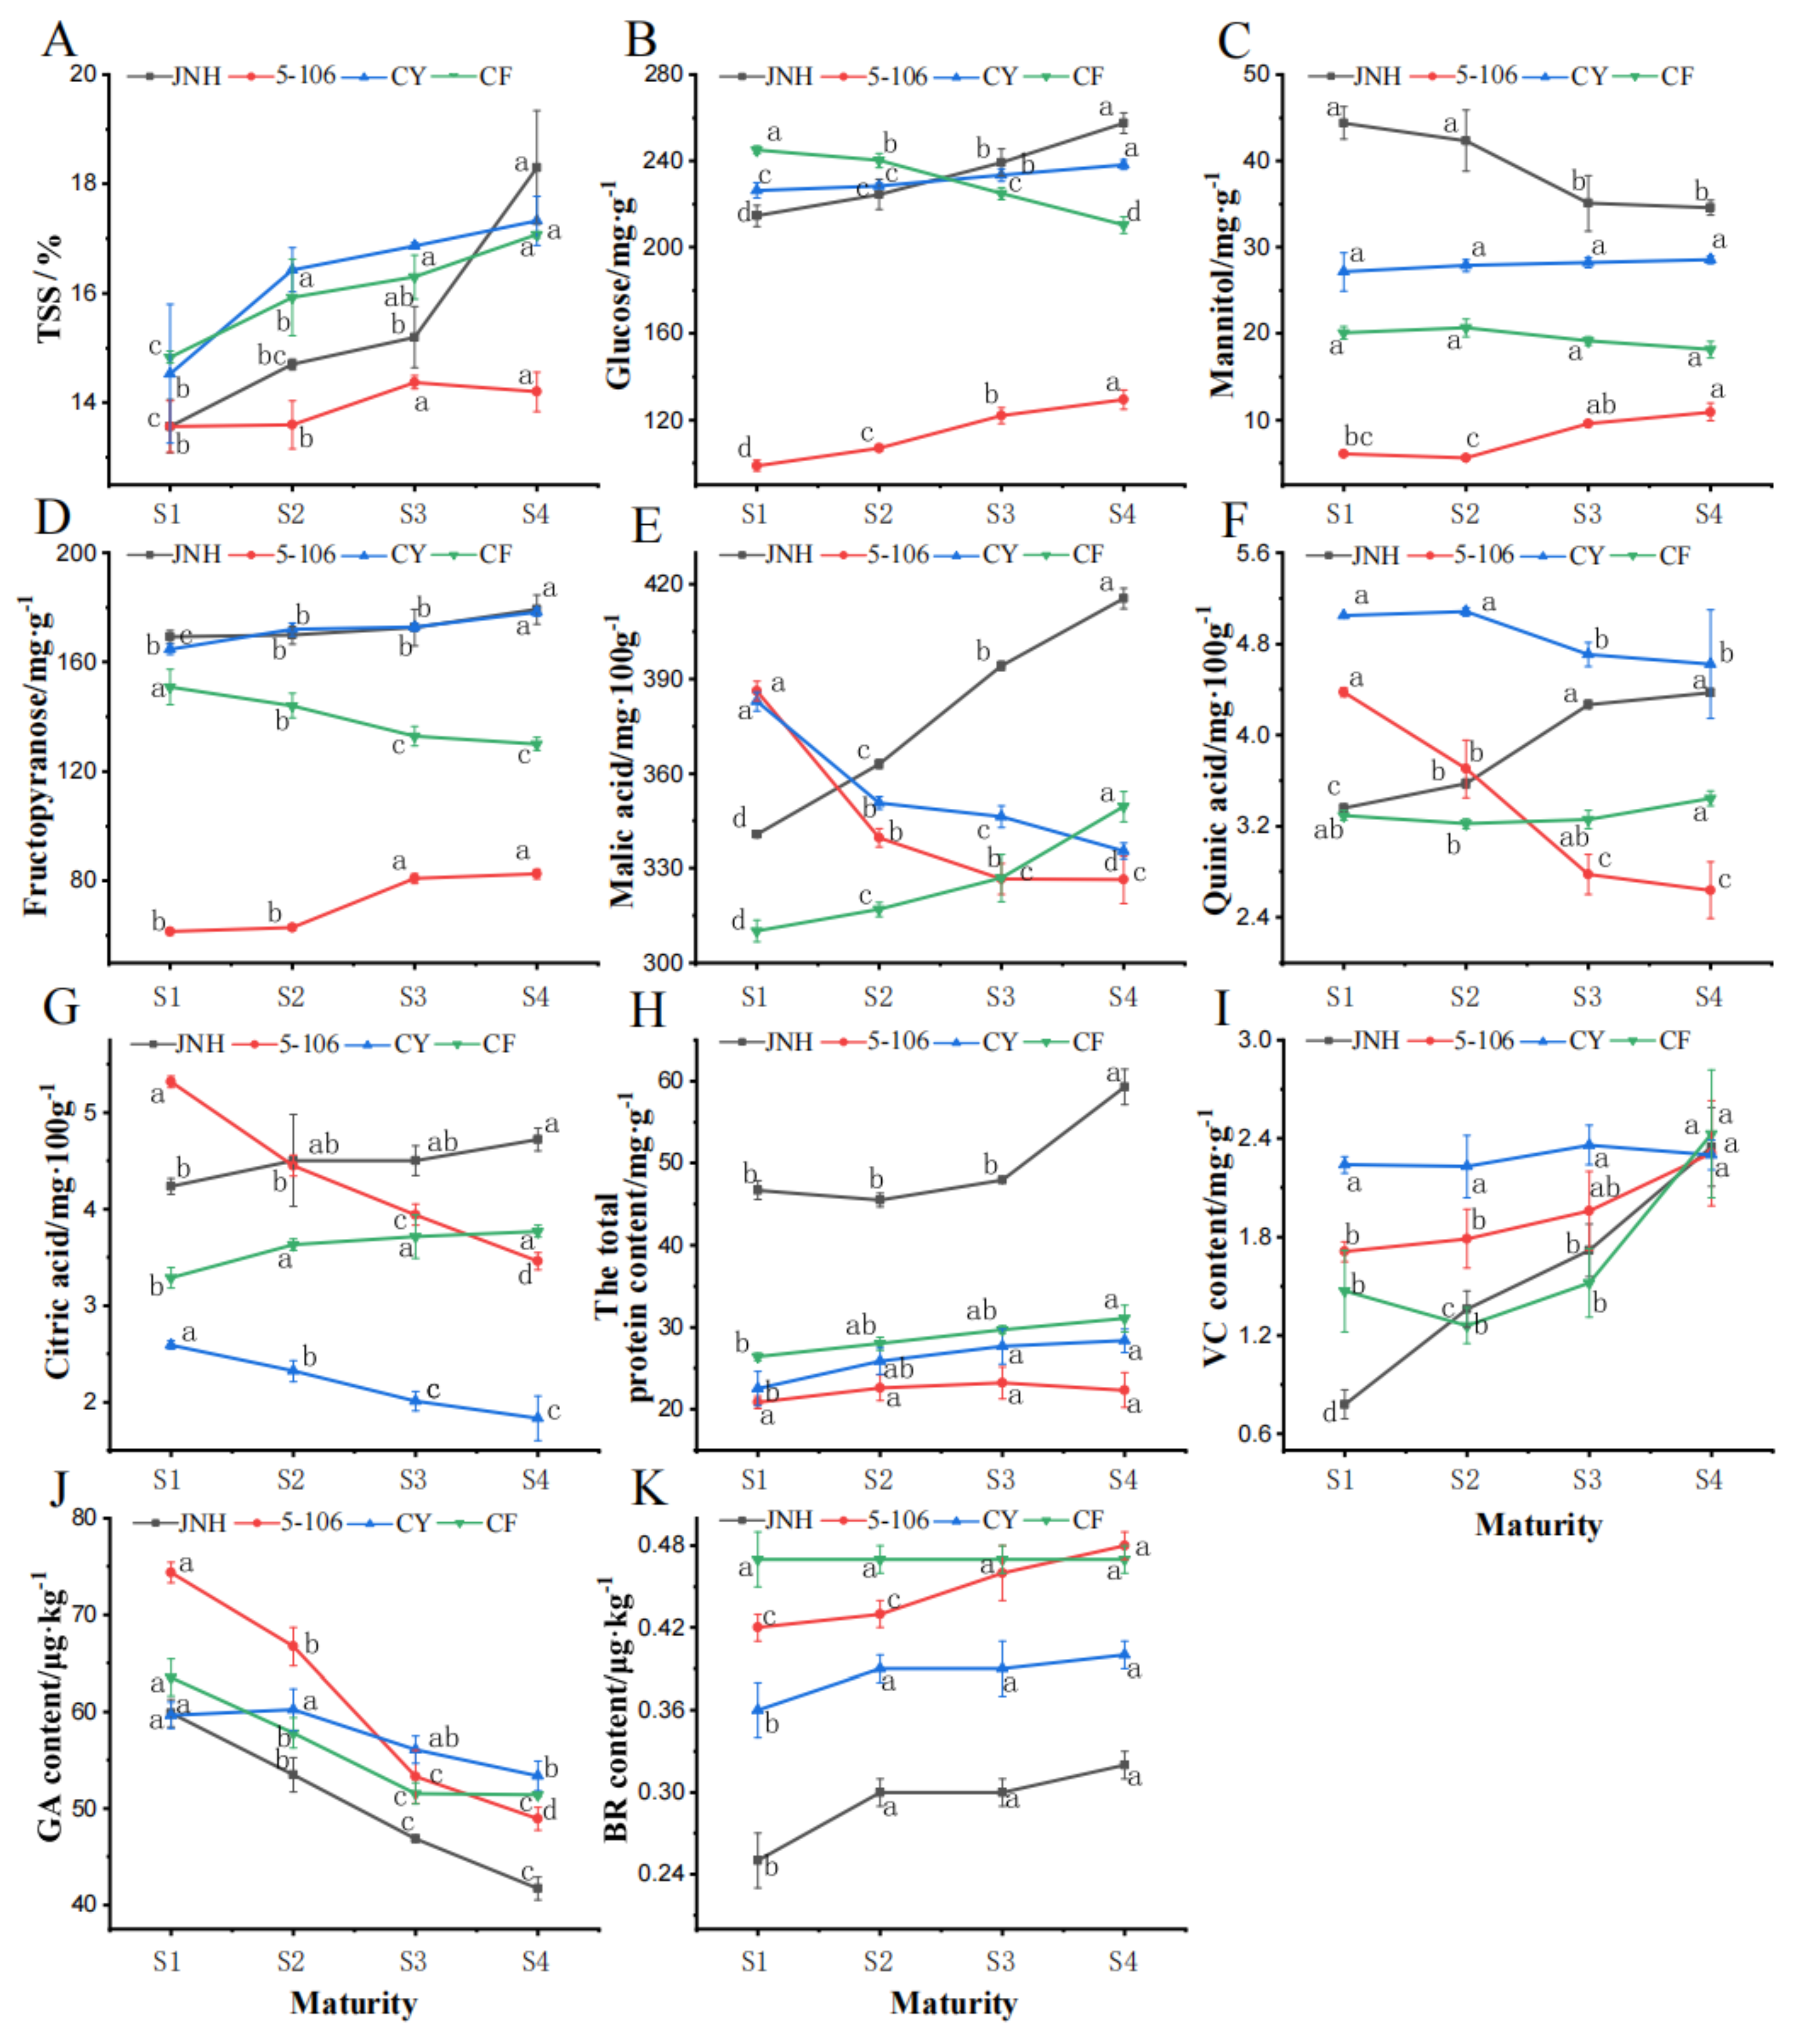
Figure 4.
Differential expression analysis of transcription factors. (A) MYB transcription factors. (B) bHLH transcription factors. (C) WD40 transcription factors.
Figure 4.
Differential expression analysis of transcription factors. (A) MYB transcription factors. (B) bHLH transcription factors. (C) WD40 transcription factors.
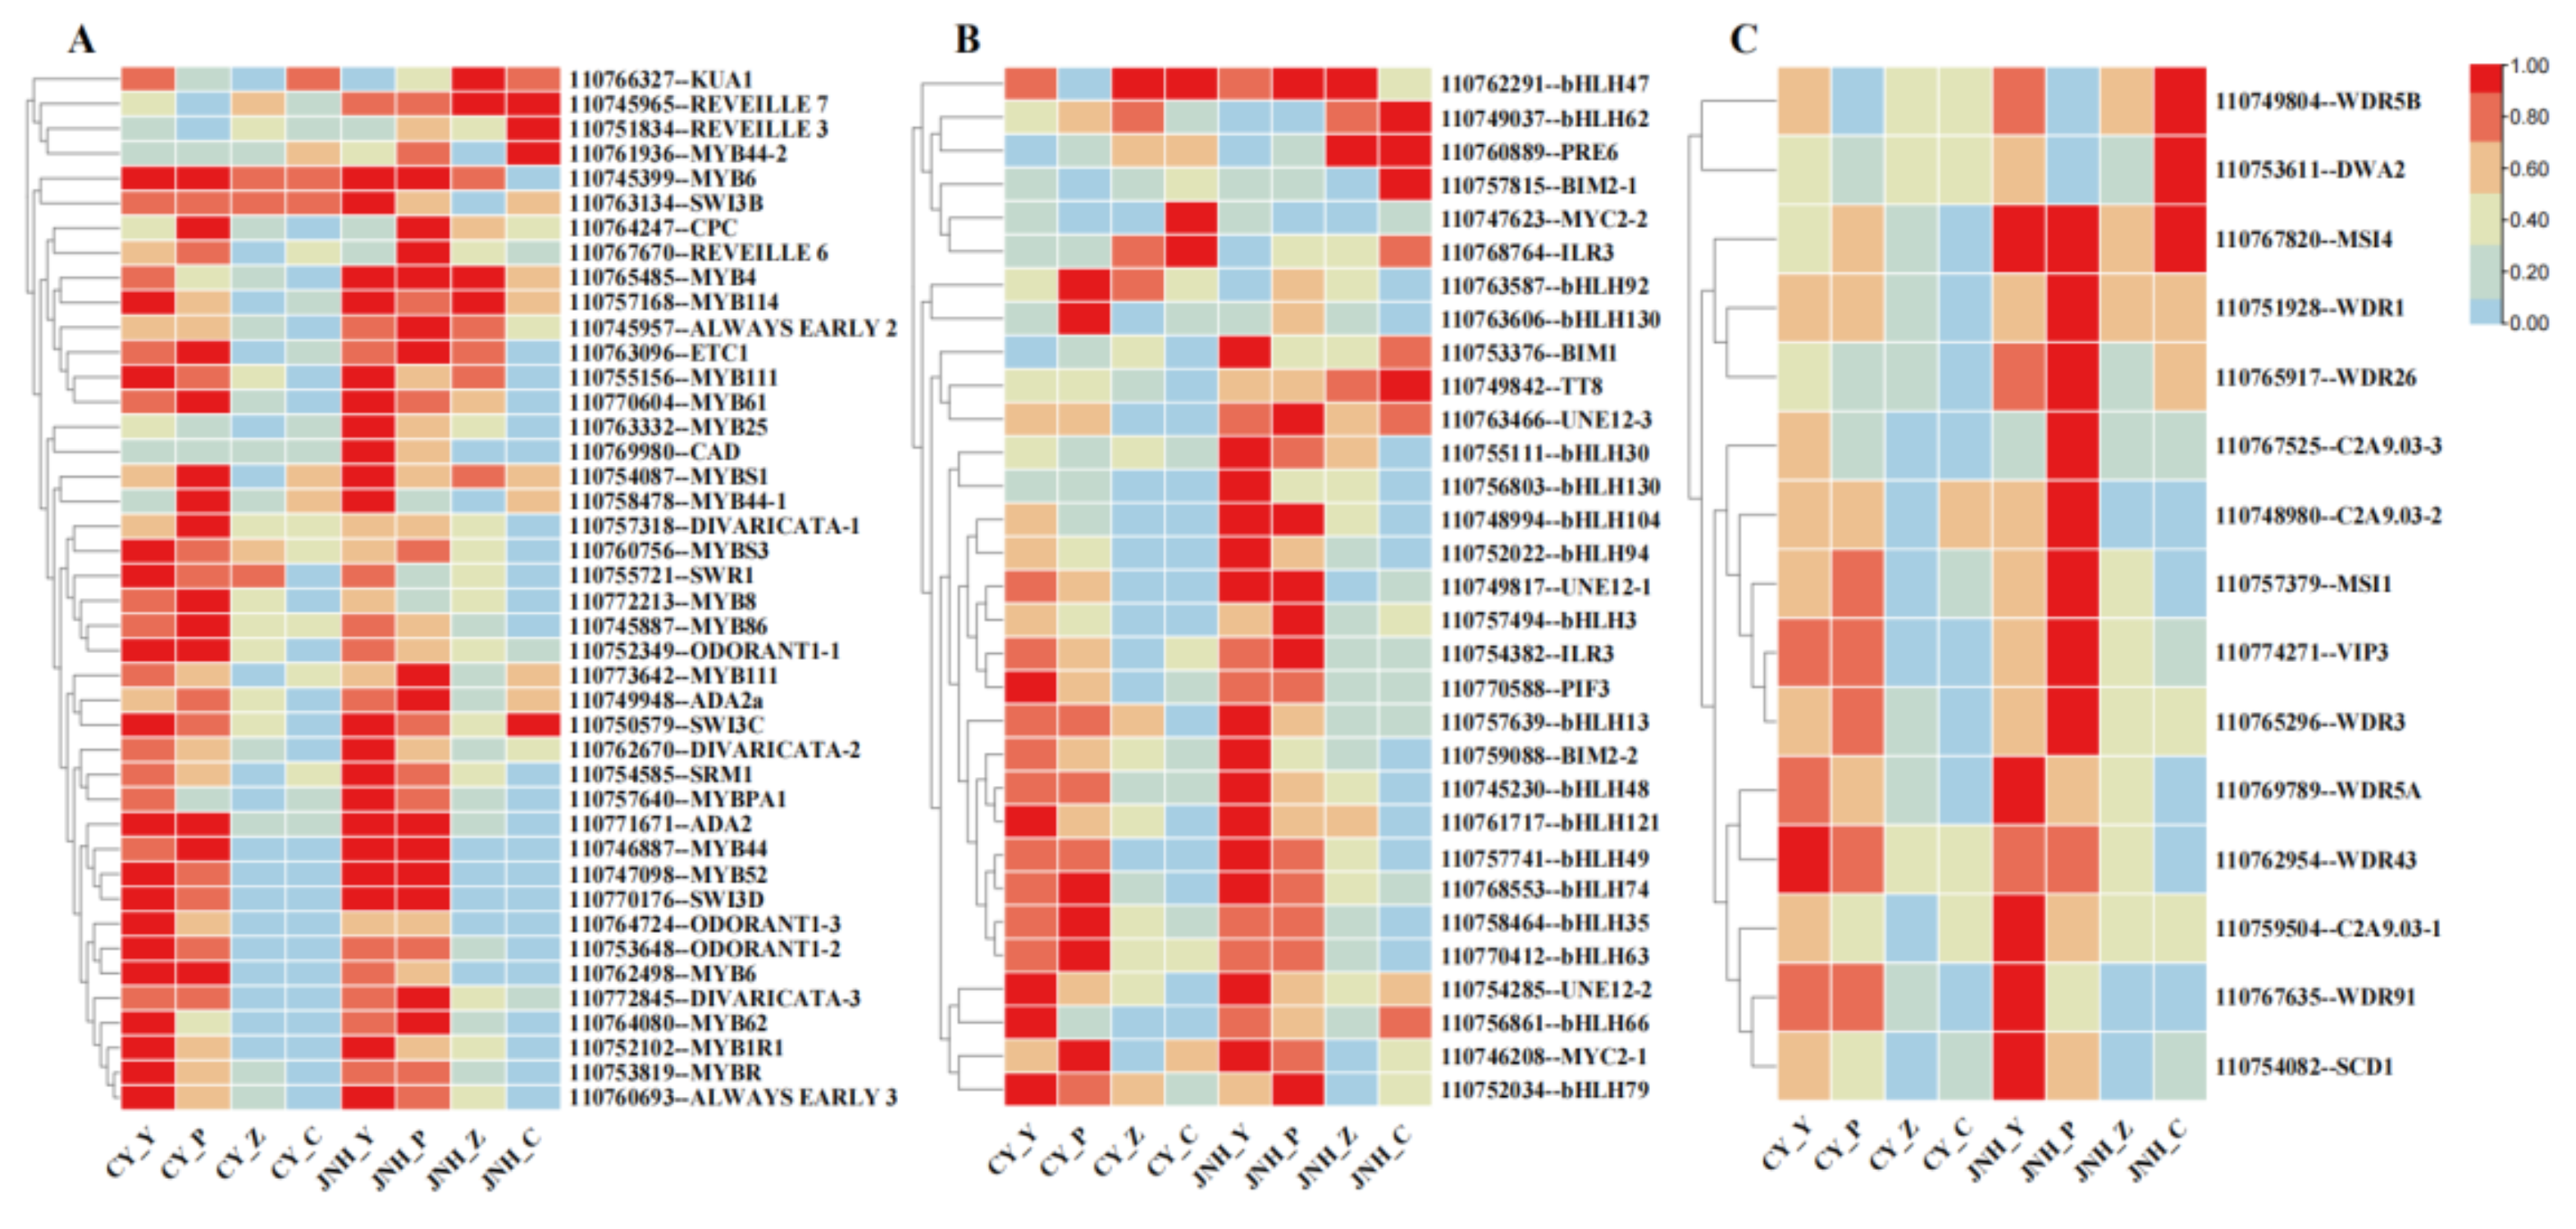
Figure 5.
WGCNA analysis of different developmental stages and varieties of sweet cherry. (A) Cluster diagram of co-expression modules. Different colors correspond to different co-expression modules. (B) Relationships between modules and traits. The values in the cells in which the rows and columns cross represent the correlation coefficient between modules and phenotypes, and the numbers in brackets are p values.
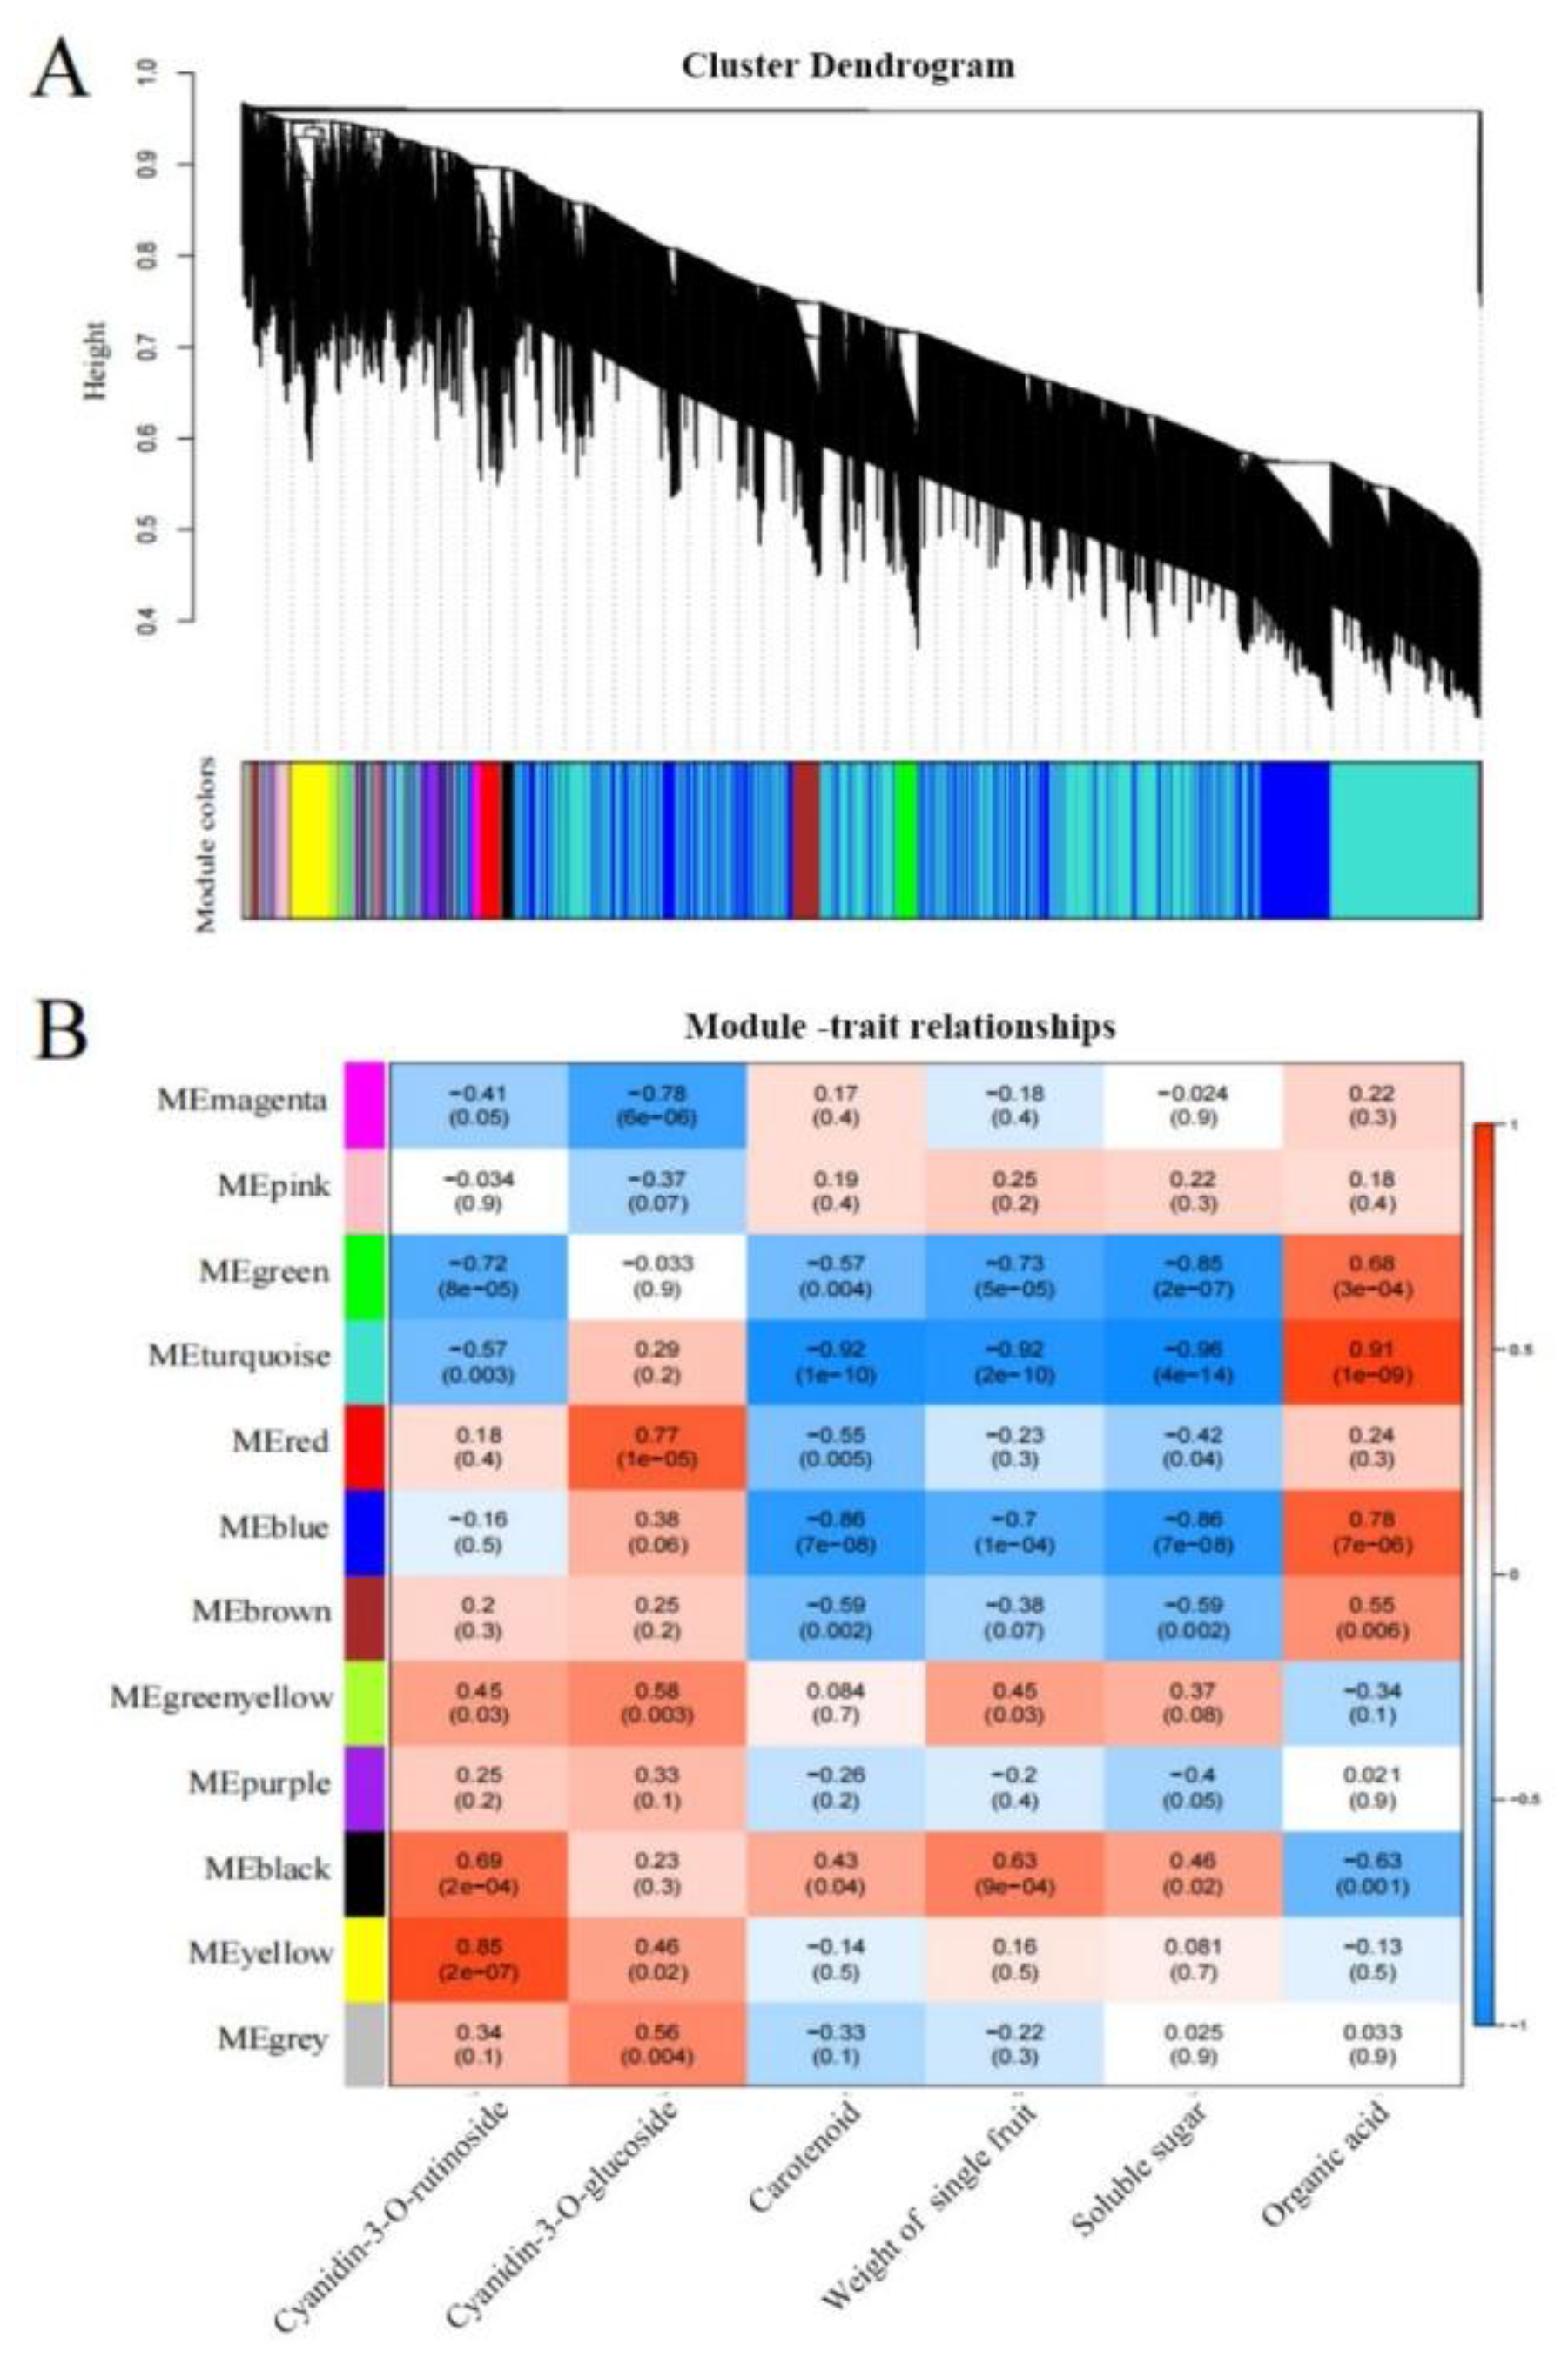

Table 1.
Color parameters of sweet cherry fruits at different maturity levels.
| Cultivar | Color parameter | S1 | S2 | S3 | S4 |
|---|---|---|---|---|---|
| JNH | L* | 48.50±3.68a | 36.63±3.24b | 27.31±2.17c | 22.10±2.12d |
| a* | 36.98±3.21b | 40.74±2.01a | 30.94±3.17c | 13.97±2.21d | |
| b* | 24.33±2.18a | 20.07±2.01b | 11.88±1.43c | 2.72±1.31d | |
| 5-106 | L* | 64.35±3.65a | 51.95±1.37b | 45.63±1.60c | 36.86±3.30d |
| a* | 21.20±5.62c | 39.59±1.25b | 42.61±1.35a | 42.89±2.06a | |
| b* | 34.44±3.31a | 26.43±0.30b | 22.77±1.86bc | 21.05±2.66c | |
| CY | L* | 72.44±0.77a | 69.17±2.14b | 62.07±2.55bc | 58.89±1.44c |
| a* | 3.73±0.84c | 7.31±0.98b | 13.82±1.68a | 14.75±1.02a | |
| b* | 39.29±1.60a | 39.22±1.48a | 39.68±1.65a | 39.73±0.85a | |
| CF | L* | 71.67±2.67a | 56.76±3.52b | 40.77±1.78c | 30.03±2.67d |
| a* | 24.61±1.48d | 32.14±2.86c | 44.06±2.40a | 36.84±2.21b | |
| b* | 31.74±2.97a | 27.18±2.94b | 23.82±1.85c | 14.59±1.46d |
Note: S1, S2, S3, S4 refers to different maturity level. L* is the light and dark value, a* is the red and green value, and b* is the yellow and blue value. Values are mean ± standard error (SE) of three biological replicates (n=3). Means followed by different lowercase superscripts are significantly different at p < 0.05.
Table 2.
Anthocyanin content of sweet cherry.
| Cultivar | Maturity | Cyanidin-3-O-Rutinoside (μg·g-1 FW) | Cyanidin-3-O-Glucoside (μg·g-1 FW) | Pelargonidin 3-glucoside (μg·g-1 FW) |
|---|---|---|---|---|
| JNH | S1 | 111.07±5.17d | 1.13±0.04d | ud |
| S2 | 837.70±15.12c | 1.70±0.02c | ud | |
| S3 | 1424.16±7.56b | 4.29±0.05b | 0.09±0.01b | |
| S4 | 3909.32±112.67a | 13.54±0.28a | 0.23±0.01a | |
| 5-106 | S1 | 19.64±1.22d | 0.83±0.09d | ud |
| S2 | 185.10±19.25c | 1.16±0.07c | ud | |
| S3 | 239.80±34.48b | 1.46±0.05b | ud | |
| S4 | 354.08±32.94a | 1.67±0.03a | ud | |
| CY | S1 | 1.35±0.23c | 0.94±0.03ab | ud |
| S2 | 1.44±0.12c | 1.07±0.16a | ud | |
| S3 | 6.25±0.44b | 0.74±0.11b | ud | |
| S4 | 7.63±0.44a | 0.83±0.06b | ud | |
| CF | S1 | 182.20±7.04d | 1.22±0.09d | ud |
| S2 | 367.59±8.39c | 1.61±0.08c | ud | |
| S3 | 798.92±36.69b | 1.96±0.03b | ud | |
| S4 | 1247.53±18.65a | 2.14±0.02a | 0.11±0.01a |
Note: ud, the substance was not detected. Values are mean ± standard error (SE) of three biological replicates (n=3). Means followed by different lowercase superscripts are significantly different at p < 0.05.
Disclaimer/Publisher’s Note: The statements, opinions and data contained in all publications are solely those of the individual author(s) and contributor(s) and not of MDPI and/or the editor(s). MDPI and/or the editor(s) disclaim responsibility for any injury to people or property resulting from any ideas, methods, instructions or products referred to in the content. |
© 2025 by the authors. Licensee MDPI, Basel, Switzerland. This article is an open access article distributed under the terms and conditions of the Creative Commons Attribution (CC BY) license (http://creativecommons.org/licenses/by/4.0/).
Copyright: This open access article is published under a Creative Commons CC BY 4.0 license, which permit the free download, distribution, and reuse, provided that the author and preprint are cited in any reuse.


