
Submitted:
02 January 2025
Posted:
03 January 2025
You are already at the latest version
Abstract
The lack of extensive, varied, and thoroughly annotated datasets impedes the advancement
of Artificial Intelligence (AI) for medical applications, specially colorectal cancer detection. Models
trained with limited diversity often display biases, especially when utilized on disadvantaged
groups. Generative models (e.g., DALL-E 2, VQ-GAN) ‘have been used to generate images, but
not colonoscopy data for intelligent data augmentation. This study developed an effective method
for producing synthetic colonoscopy image data, which can be used to train advanced medical
diagnostic models for robust colorectal cancer detection and treatment. Text-to-image synthesis was
performed using fine-tuned Visual LLMs. Stable Diffusion and DreamBooth Low Rank Adaptation
produce images that look authentic, with an average Inception score of 2.36 across three datasets.
The validation accuracy of various classification models– BiT, FixResNeXt, and EfficientNet– were
92%, 91%, and 86%, respectively. ViT and DeiT had an accuracy rate of 93%. Secondly, for the
segmentation of polyps, the ground truth masks are generated using SAM. Then, five segmentation
models (U-Net, PSNet, FPN, LinkNet, and MANet) were adopted. FPN produced excellent results,
with an IoU of 0.64, an F1-score of 0.72, a recall of 0.87, and a Dice Coefficient of 0.72. This highlights
how AI-generated medical images can improve colonoscopy analysis, which is critical for early
colorectal cancer detection.
Keywords:
medical imaging synthesis
; polyp detection
; text-to-image generation
; image segmentation
; stable Diffusion
; Vision Transformers
; healthcare AI
; DreamBooth LoRa
1. Introduction
Artificial intelligence (AI) has initiated substantial transformations in the analysis of medical imaging. In gastroenterology, the scientific study of the health and diseases of the stomach, small intestine, colon, and rectum, AI-assisted colonoscopy has demonstrated the potential to improve the diagnosis of colon cancer and reduce the incidence of colorectal cancer (CRC) [1]. The efficacy of artificial intelligence models is fundamentally dependent on the quantity and quality of training image data for colon cancer. A fundamental drawback in the advancement of successful models for medical imaging and image interpretation is the lack of sufficient training and testing data. The challenges of generating large datasets include privacy concerns, invasive methodologies, and the labor intensive nature of professional data annotation [2].
The absence of extensive, varied, and thoroughly annotated datasets hinders the training and development of sophisticated AI-assisted colonoscopy technologies [3,4]. The inaccessibility of data in this context leads to the creation of severely defective AI models or algorithms with intrinsic bias when used for vulnerable populations [5]. The scarcity of ample high-quality training data undermines AI’s efficacy in improving the identification and prevention of colorectal cancer, particularly among groups facing health care disparities. Like prior research, there has been an effort to utilize Generative Adversarial Networks (GANs) for the synthesis of text-to-image mapping, among other methodologies [6,7,8]. Recent evaluations have emphasized the refinement of large language models based on vision, including SD, CLIP, and DB, for the creation of medical images [9]. However, the application of these algorithms to generate a comprehensive array of high-quality colonoscopy images remains unexplored. The issue is the lack of a robust framework for generating synthetic colonoscopy images to enhance training data for more effective diagnostic algorithms.
Researchers are exploring various approaches (GANs, VQGAN, CLIP, BLIP) to address these issues by improving and diversifying medical imaging databases [10,11,12]. This study examines the use of artificial intelligence for text-to-image synthesis and intelligent data augmentation to improve AI models and promote demographic equity. Inception score (IS) and Fréchet Inception Distance (FID) are utilized to evaluate synthetic images generated by fine-tuning the stable diffusion (SD), CLIP and DB + LoRa models. Furthermore, advanced classification models such as BiT, ViT, FixResNeXt, EfficientNet, and DeiT are employed to train the generated images. Assessments of these models are based on standard metrics, including the F1 score, accuracy, precision, recall, and AUC, among others. All of this manifests itself as a structured plan to improve the standards of imaging and medical diagnosis.
2. Related Work
In recent years, artificial intelligence has demonstrated potential in medical image processing, improving the precision and efficacy of various diagnostic procedures, including colonoscopy [1].Recent advances in AI for medical imaging have shown promising developments in various approaches. Pengxiao et al. [13] introduced LDMLR, which addresses long-tailed recognition challenges through latent-based diffusion models. Du et al. [14] developed ArSDM, focusing on the scarcity of annotated medical image data through adaptive refinement semantic diffusion. Earlier work by Ku et al. [15] established TextControlGAN to improve image quality with text control. In 2024, Ejiga Peter et al. [9] conducted a comparative analysis of multiple approaches, including CLIP and Stable Diffusion, while Iqbal et al. [16] developed a CGAN for facial expressions.
In the specific domain of gastrointestinal imaging, several notable contributions emerged. Shin et al. [17] and Qadir et al. [18] implemented CNN-based approaches for polyp detection, while Dong et al. [19] introduced a transformer-based solution. Clinical applications have shown remarkable progress, Repici et al. [20] demonstrating the efficacy of GI-Genius in colonoscopy and Kudo et al. [21] developing EndoBRAIN for polyp detection. Zhou et al. [22] contributed ENDOANGEL for real-time assessment, while Mahmood et al. [23] focused on depth estimation in endoscopy. Goceri [24] provided a comprehensive review of data augmentation techniques across different medical imaging modalities. This work investigates generative artificial intelligence in the context of colonoscopy imaging interpretation, specifically focusing on text-to-image generation and advanced data augmentation techniques. Early detection during colonoscopy is crucial to avert colon cancer, a major global health problem [5].
Kim et al. [3] investigated the generation of synthetic image data within a scientific framework, specifically focusing on medical image diagnostics and laboratory techniques, utilizing the OpenAI text-to-image model DALL-E 3. However, the model exhibited low precision due to intrinsic bias inside the system. They additionally examined the ethical implications of producing synthetic data. This research was constrained by the lack of an iterative generation process, which included erroneous or extraneous features, duplication of existing images, and reliance on proxy features. In a similar vein, Yang et al. [25] created an AI-generated image model to serve as a data source for synthetic data. Upon thorough examination, Yang et al. [25] employed CovNets and transformer-based models. Convolutional neural network models, such as ResNet-50 and ResNet-101, demonstrate substantial improvements. Transformers demonstrate improvements in ViT-S/16, DeiT-S, and DeiT-B. The larger versions typically exhibit superior overall performance. Our strategy emphasizes text-to-image synthesis utilizing fine-tuned Large Language models for the development of synthetic colonoscopy images and Classification models for polyp detection, facilitating the early identification of colorectal cancer.
Cao et al. [26] examined AI-generated content (AIGC) and its historical evolution from Generative Adversarial Networks (GAN) to contemporary ChatGPT, emphasizing the unimodality and multimodality of generative AI models. Bandi et al. [27] conducted a survey of various GAN-based designs for AIGC and examined the fundamental needs for the development of AIGC, including the input-output format of the model, the evaluation metrics, and the associated obstacles. However, the analyses presented in both [26] and Bandi et al. [27] were purely theoretical and devoid of practical application; therefore, our research transcends qualitative examination by incorporating the practical implementation of AIGC with cutting-edge models such as SD. Bendel [28] examined image synthesis (image production) from an ethical perspective. Elements of creation can also facilitate destruction, which is why Bendel [28] advocated the ethical application of generative AI in image synthesis. The significant potential of image synthesis models entails a considerable duty to guarantee ethical utilization. Bendel [28] used Midjourney, SD and DALL-E2 models to analyze the topic from the point of view of risk and opportunity. In a comparable context, Ray et al. [28] addressed the meticulous supervision required to realize the potential of generative AI in precise medical diagnostics and neurointerventional surgery, while mitigating the risk of encountering pitfalls. Both works lack practical application and are purely theoretical. However, ethical considerations were implemented during the construction and testing of the models in our research.
Derevyanko et al. [29]conducted a comparative examination of SD, Midjourney, and DALL-E, advocating for its implementation due to its educational use. The study demonstrated that neural network applications can improve the teaching of students in design-related fields. Mahmood et al. Al [23] developed a depth estimator utilizing an extensive dataset of synthetic images produced through a precise forward model of an endoscope and an anatomically accurate colon. Their studies revealed the following enhancements in porcine colon data: an 88% improvement in SSIM for depth estimation, a 48% improvement in SSIM for phantom colon data depth estimation, and approximately a 125% improvement compared to the prior dictionary learning method. Additional validation of various medical imaging tasks and modalities would enhance the broader application.
Iqbal et al. [16] developed a synthetic image generation model using Conditional GAN for single-sample face images. The research achieved an initial accuracy of 76% on individual neutral images and a final accuracy of 99% after the fine-tuning of synthetic expressions, representing a 23% improvement over the original accuracy recorded. This method presents possibilities to address the difficulty of SSPP in facial recognition systems. However, it is limited solely to variations in expression and can necessitate the integration of additional motions to capture other forms of facial alterations for applicability in different contexts.
Du et al. [14] used the adaptive refinement semantic diffusion model (ArSDM) for the synthesis of colonoscopy images. Polyp segmentation exhibited the greatest enhancement with PraNet (6.0% mDice, 5.7% mIoU), succeeded by SANet and Polyp-PVT. CenterNet demonstrated the most significant gain in average precision (9.1%) and the greatest improvement in the F1 score (6. 1%) for the diagnosis of polyps. The research indicates that the use of synthetic images generated by ArSDM for training significantly enhances the results in both polyp segmentation and detection tasks. The methodology effectively addresses weakly annotated medical imaging data.
Ku et al. [15] present a novel methodology for text-to-image synthesis that improves image quality and adherence to textual descriptions compared to previous methods.Compared to the CUB dataset, the model improved the Inception Score by 17.6% and decreased the Fréchet Inception Distance by 36.6% relative to the GAN-INT-CLS model based on cGAN.The model is limited to bird images at a relatively low resolution (128x128) and was assessed only on a single dataset, CUB.
Ejiga Peter et al. [9] employed three methodologies for medical image synthesis: DB + LoRA, fine-tuned SD and CLIP. They analyzed numerous advanced strategies and tackled the need for dynamic generation of medical images from textual descriptions. The models were evaluated using single-center and multicenter datasets. SD beat other Fréchet Inception Distance techniques. The highest multicenter score of 0.064 indicated excellent image quality. DB + LoRA outperformed CLIP (1.568) and SD (2.362) in the initial score. SD produced diversified and high-quality images efficiently, beating FID and competing in IS. Their analysis did not evaluate the images generated clinically or diagnostically. The research shows the potential of AI-generated medical imaging, but it also stresses the need for clinical trials and ethical considerations.
Sanchez et al. [30] explored how deep learning has improved colonoscopy polyp identification. CNN is the most popular architecture for end-to-end applications; hybrid methods are less popular. The biggest issues are large, annotated datasets, and inconsistent evaluation metrics. Their research shows that these methods can improve the identification of adenoma but require clinical validation. Standardization of assessment methods, semisupervised learning, elimination of HD colonoscopy images, and improved access to large public datasets can result.
Goceri [24] conducted an extensive evaluation of data enhancement methodologies for medical imaging. The efficacy of augmentation techniques varies according to the specific medical imaging modality used. Shearing and translation proved to be most effective for brain MRI, lung CT, and breast mammography, but noise-based methods often faltered. The most precise components of brain MRI were translation, shearing, and rotation, with an accuracy of 88.24%. Translation by shearing exhibited optimal performance on lung CT at 85.74%. Translation, shearing, and rotation were the most beneficial for breast mammography (83.34%). The results for color shift, sharpening, and contrast modification were most pronounced in the classification of the eye fundus, with a precision of 88.24%. Shearing and noise performed poorly, but the combinations performed better. Fundus images had the greatest improvement in color and contrast. GAN-based methods are more diverse, yet suffer from gradient vanishing [31,32]. The assessment stresses image categorization and the selection of task-related augmentation techniques.
Wang et al. [33] used deep learning in real time to identify colonoscopy polyps. In addition to 27,113 images and videos, 1,290 patient records confirmed findings. The approach performed well in datasets, with per-image sensitivity from 88.24% to 94.38% and specificity from 95.40% to 95.92%. Please note that the confirmed polyp videos were 100% sensitive. The gadget can handle 25 frames per second with low latency for real-time clinical applications. This method allows endoscopists to test their polyp detecting skills.
This pilot study by Misawa et al. [34] evaluates a computer-aided detection (CADe) system for the real-time identification of polyps during colonoscopy. Although previous CADe systems were capable of recognizing over 90% static images and 70% videos, the extract failed to include the performance characteristics of the system. Expanding datasets and including video-based analysis could improve the practical importance of this research. The absence of performance metrics in the passage is concerning. The initiative aims to reduce human error in polyp detection, thus improving adenoma diagnosis and perhaps decreasing the rates of colorectal cancer in intervals.
Dong et al. [19] used Polyp-PVT and a transformer encoder that incorporates CFM, CIM, and SAM to segment polyps, achieving a score of 0.900 Dice and 0.833 IoU on the Endoscene dataset, surpassing previous approaches in five datasets. The models appear to be resilient to variations in appearance, tiny objects, and rotation, demonstrating strong performance on hitherto unseen data. The limits of polyps are difficult to see due to overlapping light and shadow, as well as numerous false positives from the reflection point. The model surpasses polyp segmentation techniques in recommending colonoscopy applications.
Guo et al. [35] introduced Dilated ResFCN and SE-Unet, two innovative fully convolutional neural network (FCNN) architectures for the segmentation of colonoscopy polyps. The average Dice score was 0.8343, the standard deviation was 0.1837, and only three polyps were overlooked. The strategies mentioned above secured victories in the GIANA tournaments in 2017 and 2018. The study was beneficial; however, the temporal dependencies of colonoscopy records should enhance future research.
Qadr et al. [18] used Mask R-CNN to identify and segment colonoscopy polyps, to reduce the physician 25% missed rate. Multiple CNN feature extractors and additional training data were evaluated to construct Mask R-CNN. An ensemble method for enhancement was proposed. The segmentation of the leading model was performed on the 2015 MICCAI dataset, with the following results: recall 72.59%, accuracy 80%, dice coefficient 70.42%, and Jaccard index 61.24%. The study elucidates the trade-offs between model complexity and dataset quality for improved polyp identification and segmentation.The results are promising, but automated polyp recognition should be improved.
Borgli et al. [36] tested CNN architectures for gastrointestinal endoscopy using 110,079 images and 374 movies for multiclass classification. Size, diversity, segmentation masks, and bounding boxes help, but class imbalance and interobserver variability hurt. ResNet-152 and DenseNet-161 achieved amazing results with microaveraged F1 scores of 0.910, macroaveraged of 0.617, and Matthews Correlation Coefficients of 0.902. Despite its appeal, the model struggled to distinguish esophagitis from ulcerative colitis. The material is suitable for AI-assisted gastrointestinal endoscopic diagnostic tools; however, classification accuracy needs to be improved.
Kudo et al. [21] used a large training dataset to test EndoBRAIN, an AI system that detects colorectal polyps from endocytoscopic images. The model outperformed the trainee and professional endoscopists in stained image analysis with 96.9% sensitivity, 100% specificity and 98% precision. Size and various imaging modalities are benefits, but retrospective design and Japanese center concentration are weaknesses. EndoBRAIN’s 100% positive and 94.6% negative predictive scores improve colorectal polyp diagnosis. More prospective trials are needed to prove that AI can improve endoscopic diagnostics.
Zhou et al. [22] developed ENDOANGEL, a deep convolutional neural network-based method to assess the quality of intestinal preparation through precise image and video analysis. This model surpassed human endoscopists, achieving 93.33% accuracy on conventional images and 80. 00% accuracy on bubble images. The video examination demonstrated an accuracy of 89.04%. The benefits of ENDOANGEL include an objective and consistent evaluation, immediate colonoscopy scoring, and enhanced image and video quality. The study had limitations, including the use of retrospective data collection for training and restricted video assessment. The reproducible evaluation of intestinal preparation as a continuous variable during colonoscopy withdrawal is an innovative approach that enhances the potential to improve colonoscopy results and standardize the evaluation of stool preparation quality.
The literature review shows that AI for colonoscopy analysis, particularly polyp detection and categorization, has advanced. However, significant gaps and constraints remain due to the bias of the models resulting from the reduced variability of the training dataset [3,25]. Some studies have examined novel AI-generative systems for the generation of medical images [9,14]. The lack of comprehensive systems that incorporate segmentation, classification, and image creation for colonoscopy analysis [14,25] and the lack of studies on artificial data augmentation and model fairness among demographic groups [30] are major problems. The study is expected to contribute significantly to AI-assisted colonoscopy analysis, as these prospects fit with the research objectives and questions.
3. Materials and Methods
The research technique employs a complete framework for the interpretation of medical images, with a specific emphasis on colonoscopy imaging. This framework incorporates three fundamental components: image production and augmentation, classification, and segmentation, utilizing cutting-edge deep learning models to establish a resilient system for colonoscopy image processing and analysis. Our methodology integrates contemporary artificial intelligence tools with conventional medical imaging practices to improve the detection and categorization of polyps in colonoscopy images, as seen in Figure 1. Originally trained on the LAION-5B dataset [37], the SD model offers a wealth of information from a wide spectrum of image-text combinations. Comprising 5.85 billion CLIP-filtered image-text pairs: 2.3 billion English samples, 2.2 billion from more than 100 additional languages, and 1 billion with language-agnostic text, LAION5B is a vast collection.
This study uses a dataset of 15,428 images categorized into three main groups. The initial dataset comprises 5,914 images obtained from reputable medical imaging repositories that include the Image CLEF, CP-CHILD, and Binary Polyps datasets. To enhance the diversity and robustness of the dataset, we generated 1,800 synthetic images using fine-tuned Stable Diffusion and created 7,714 augmented images through various data augmentation methods. The complete dataset is partitioned using a 70-20-10 split ratio for training, testing, and validation, respectively, ensuring an equitable distribution of polyp and nonpolyp images in each segment to promote impartial model training and assessment. The 70:20:10 split allocates 70% for training data to learn patterns, 20% for validation to tune hyperparameters and prevent overfitting, and 10% for testing to evaluate final model performance. This balanced ratio ensures sufficient training while maintaining independent validation and testing sets.
The image generating pipeline utilizes Stable Diffusion 1.5, obtained by Hugging Face, as its principal model. The system employs two advanced fine-tuning methodologies: DreamBooth (DB) for subject-specific customization and Low-Rank Adaptation (LoRA) for efficient parameter modifications. Our training parameters used a 4-step batch size with 8-bit Adam optimization, integrating gradient checkpointing and bfloat16 precision. The training procedure executes for 1000 iterations utilizing logit normal weighting to guarantee optimal convergence. To improve contextual awareness and the quality of image formation, we used the Contrastive Language Image Pre-training (CLIP) method, utilizing its zero-shot transfer abilities and natural language supervision attributes. See Figure 2.
The image processing pipeline starts with a thorough standardization procedure, in which all images are resized to 256x256 pixels with LANCZOS resampling, subsequently converting them to RGB color space.Resizing to 256x256 ensures consistent memory usage and fixed network inputs while preserving features for subsequent 224x224 random cropping during training. All images are stored in PNG format to preserve image quality through lossless compression. The training set is subjected to further augmentation techniques, including color jittering, random rotation of ±15 degrees, random horizontal flipping, and random scaled cropping to 224x224 pixels. The model sees slightly different versions of the same image during training, improving its robustness and generalization capabilities.. All images are subsequently normalized using standard ImageNet normalization parameters and processed in batches via PyTorch DataLoader with a batch size of 32 for optimal training efficiency.
We executed and assessed five cutting-edge models for classification tasks: Vision Transformer (ViT), Big Transfer (BiT), FixResNeXt, Data-efficient Image Transformer (DeiT) and EfficientNet. Each model possesses distinct advantages for the classification challenge, with transformers that deliver strong feature extraction skills and convolutional networks that facilitate effective spatial relationship processing. The segmentation component of our approach employs five distinct architectures. U-Net, PSPNet, Feature Pyramid Network (FPN), LinkNet, and MANet. The models were chosen for their demonstrated efficacy in segmenting medical images and their ability to address the unique problems posed by colonoscopy images.
The training methodology utilizes the AdamW optimizer with weight decay and CrossEntropyLoss as a loss function. To avoid overfitting and guarantee optimal model performance, we established an early stopping mechanism based on the plateau of validation loss, consistently retaining the best validation model weights during the training phase. This method guarantees that our models preserve their generalizability while attaining superior performance on the designated task. The binary cross-entropy loss function for classification is defined as
where N represents the number of samples, is the true label, and is the predicted probability for the positive class. For the LoRA adaptation process, the weight matrix transformation is computed as:
where represents the original weight matrix, B and A are low-rank decomposition matrices and is the update matrix. The Dice coefficient, used for evaluating segmentation performance, is calculated as:
where X and Y represent the predicted and ground truth segmentation masks, respectively, TP denotes true positives, FP denotes false positives and FN denotes false negatives.
where X and Y represent the predicted and ground truth segmentation masks, respectively, TP denotes true positives, FP denotes false positives, and FN denotes false negatives. Our evaluation approach integrates many metrics to thoroughly evaluate distinct facets of the system’s performance. The quality of images is assessed by the Inception Score (IS) and Fréchet Inception Distance (FID), which offer quantifiable metrics for the caliber of synthetic image synthesis. Classification performance is evaluated using many metrics, such as accuracy, precision, recall (sensitivity), F1 score, and area under the ROC curve (AUC-ROC). For segmentation tasks, we assess quality by Intersection over Union (IoU), Dice coefficient, Peak Signal-to-Noise Ratio (PSNR), and Structural Similarity Index (SSIM), guaranteeing a comprehensive evaluation of segmentation precision and dependability [38,39,40,41,42,43,44]. The CLEF data comprises of text-image pairs as seen in Figure 3.
Figure 3. displays image-text pairs in which a number of descriptive text prompts are paired with each colonoscopy image. In addition to having distinct labels (such as 064086616.png and 040086376.png), each image features a set of text questions that offer several approaches to describing or creating comparable medical situations. This pairing structure produces a comprehensive dataset with detailed descriptions of every medical image from various textual perspectives. The instructions in each image address a variety of topics related to the medical scene, from identifying locations and image features to describing apparent instruments and discoveries. This creates a rich image-text relationship in which a single medical image is connected to multiple relevant text descriptions, each highlighting different aspects of the same clinical scenario.
The preprocessing pipeline coordinates the data preprocessing process through a strategic multihierarchical procedure.The first step is to turn the file that contains image locations and prompts into a structured framework using the pandas library by sorting out the data for polyps and none-polyps. This becomes the structural format of organized data that can feed other pre-processing and training model data stages. In the data partitioning process, random shuffling is employed to have equal distribution over training, testing, and validation. The images are analyzed using the Python Imaging Library and each step of the pipeline is designed to support different classification models to achieve the best performance.Our methodology can be formalized as follows.
| Algorithm 1 Advancing colonoscopy analysis through text-to-image synthesis using generative AI | |
| |
| Helper Functions: | |
| FineTune(G, D): | Fine-tune model using DreamBooth and LoRA |
| SynthesizeImages(G, prompts, n): | Generate n images using G |
| GenerateMasks(D, SAM): | Generate masks for images in D using SAM |
| TrainClassifier(M, D): | Train classifier M on dataset D |
| EvaluateClassifier(C, D): | Evaluate classifier C |
| TrainSegmentation(S, D): | Train segmentation model S on dataset D |
| EvaluateSegmentation(S, D): | Evaluate segmentation model S |
This algorithm presents the complete pipeline of our methodology, from data preparation through model training and evaluation. The algorithm takes as input colonoscopy images, custom prompts, and pre-trained models and outputs the best performing classifier and segmentation model along with their respective performance metrics. Each function in the algorithm represents a distinct phase in our pipeline, with the main process divided into the data preparation, synthesis, classification training, and segmentation model training stages. For the purpose of reproducibility and for convenience in case of further investigations of this topic, all code - including models, training procedures scripts, and assessment schemes – is committed to the repository [45]. The datasets included in this study are available through their respective platforms. CLEF [46], CP-CHILD [47], and binary polyp data [48]. The synthesized images produced and their associated prompts can be accessed at [45]. The repository contains a detailed documentation of all implementation specifics, including hyperparameters and model setups, to facilitate the replication of our results and the advancement of the approach.
The experiment used an advanced hardware configuration that included a 40GB NVIDIA A100 GPU and a g2-standard-48 computer with four NVIDIA L4 GPUs, 48 vCPUs and 192GB of RAM. Python was used to carry out the implementation on Vertex Workbench and Google Colab Pro, with Accelerator (0.16.0), Torch Vision, and Transformers (4.25.1) as essential dependencies. With pretrained Stable Diffusion 1.5 and SAM models for image synthesis and segmentation, this configuration facilitated a thorough colonoscopy analysis pipeline that was assessed using a variety of classifier architectures (ViT, BiT, FixResNeXt, DeiT, EfficientNet) and segmentation models (U-Net, PSPNet, FPN, LinkNet, MANet).
4. Results
The results and a discussion of the research are presented in this chapter, which details both software and hardware specifications. Table 1 presents a comparison of performance metrics (FID scores and average inception scores) in three different models (CLIP, SD and DB + LoRa) in three different datasets (single, multi and both). The FID scores range from 0.06 to 0.12, with SD showing the best performance (lowest FID scores) across all datasets. For Inception Scores (IS avg), DB + LoRa consistently achieves the highest values (2.36), followed by SD (2.33), while CLIP shows the lowest IS avg (1.57). Each model maintains consistent performance across different datasets, with only minor variations in FID scores.
Table 2 presents a detailed evaluation of model performance using Inception Score Groups (G1-G10) in three different models (CLIP, SD, and DB+LoRa) and three dataset configurations (single, multi, and both).
The scores show that CLIP consistently maintains lower values (around 1.51-1.57) across all groups, while SD and DB+LoRa achieve higher scores (ranging from 2.22-2.77). In particular, SD shows greater variability with peaks in G2-G4 (≈2.40) and G10 (2.77), while DB+LoRa demonstrates more stable performance between groups with slight improvements in G4 (2.41) and G9 (2.46).
4.1. Image Generation Results
The synthesized images were measured using the Inception score and the Fréchet Inception Distance.
Among the three models, CLIP has the highest Fréchet FID score: 0. 114 for 0.128 and 0. 124 for three (3) datasets [9]. These higher ratings indicate poorer image quality and realism as CLIP-generated images seem less like real photos than other models.Figure 4 shows the final image. The higher FID score for the multicenter dataset indicates that CLIP struggles to create realistic images when trained on a diverse dataset from numerous medical facilities. High FID scores indicate that in this case, CLIP is not the best approach to obtain high-quality medical images.
The implementation combines stable diffusion pre-trained, DreamBooth, and LoRA for the synthesis of colonoscopy images, optimized with a resolution of 512 pixels, a learning rate of , and specialized medical prompts. This architecture efficiently handles medical imaging complexity while minimizing computational resources through LoRA’s targeted modifications and DreamBooth’s instance-specific adaptations. Indicating better image quality and realism, the lowest FID scores for fine-tuned SD are "0.099" (single center), "0.064" (multicenter) and "0.067" (combined datasets) [9]. The reduced score of the multicenter dataset implies better performance of healthcare facilities. Although somewhat inferior to Fine-tuned DB + LoRa, SD offers a high amount of visual diversity and quality, averaging "2.33" across all datasets. The consistency of SD across datasets shows its ability to function regardless of the data source. In general, Fine-tuned SD produces high-quality, diversified medical images. Figure 5 shows the result.
The FID scores of "0.11" (single center), "0.073" (multicenter), and "0.076" (combined datasets) obtained by fine-tuning DB + LoRa show a high level of image quality and accuracy. With a wider range of training data, the multicenter score is more favorable. However, scores are higher than for SD, which has been fine-tuned, indicating a good level of quality overall. Regardless of the data source, the Inception Score of "2.36" remains constant across all datasets, indicating strong image diversity and quality [9]. Figure 6 shows the result of the text-to-image synthesis using DB and LoRa.
In terms of image variety and value, these scores are slightly better than those of SD. Fine-tuned SD achieves higher FID scores, but fine-tuned DB + LoRA strikes a better balance between diversity and realism, potentially making it the best choice for medical imaging tasks that require high-quality and diverse image generation.
4.2. Model Comparison
Figure 7 and Figure 8 show the evaluation of each visual generative AI model in terms of FID and IS in 3 datasets.
While Finetuned DB and LoRa produce high-quality, lifelike images, Finetuned SD beats CLIP and Finetuned DB in generating such images. Its superiority is shown by producing the lowest FID values among all tests. With an average Inception Score of 2.36, the DB + LoRa model ranks highest followed by Finetuned SD, with an average of 2.33. The average starting score for CLIP is the lowest. However, fine-tuned DB + LoRA achieves a better balance between diversity and realism, so it may be the perfect solution for medical imaging positions that require both high-quality and diverse image generation.
4.3. Image Segmentation Results
This section comprises two primary tasks, namely: Image mask generation and image segmentation.
Image masks were created for shapes identified with the Segment Anything Model (SAM) [54]. The technique starts with initializing SAM with a pre-trained checkpoint and finds circles and outlines in the input image that mimic polyps. Input points are produced along the boundary of every form found. see Figure 9
Once these points are accumulated, the SAM predictor creates a mask. To anticipate segmentation masks, SAM uses input points and their corresponding labels, such as background and foreground. This enables SAM to produce precise masks for each shape by using reduced contours and points from known circles as input. The final mask for the entire image was created by combining these many masks, as shown in Figure 16.
The analyses of the five segmentation models showed that the metrics used had varying effects on each model’s performance. With the highest IoU (0.6373), the F1 score (0.7238), the recall (0.8716) and the dicure coefficient (0.7238) as shown in Figures 20 and 18, respectively, FPN showed the best overall performance. With outstanding results for IoU and F1 score, U-Net took second place. Although both LinkNet and PSPNet did not do very well, PSPNet was somewhat better than LinkNet in most categories. However, MANet’s total performance was the poorest, particularly in IoU and Recall. In particular, every model achieved a perfect SSIM score of 1.0000, signifying a high degree of structural similarity between the projected masks and the ground truth. The PSNR values of all models were consistently high, with FPN attaining the highest average PSNR of 385.8368. Despite its poor performance on other parameters, MANet has the highest precision (0.7359) of all models, with extremely consistent precision scores.
Figure 10 shows the FPN segmentation findings for an endoscopic polyp image.
A pink growth is shown against a crimson intestinal lining in the original photograph. The real mask displays the polyp area as white. The segmentation of the FPN is shown in black on the expected mask. Green indicates a valid identification, red indicates a missing area, and yellow indicates a false positive. The overlay contrasts the results. FPN accurately depicts the polyp’s form and position, but overestimates its size, especially around the edges. FPN’s multiscale feature recognition and over-segmentation are shown here. Perhaps fine-tuning or postprocessing could sharpen edges. The results of this study are shown in Table 3. Table 3. shows the coefficients of the dice. The five segmentation algorithms were thoroughly evaluated using the synthetic colonoscopy dataset, yielding the following results: FPN had better overall performance, achieving the highest scores in IoU (0.6373), F1 score (0.7238), and Dice coefficient (0.7238), as seen in Table 3.
Since the Dice coefficient is analogous to the F1 score, it evaluates the overlap between two samples. A score of 0.72 achieved by FPN on a scale of 0-1 is a good score. This means that it is close to complete overlap. The FPN F1 score shows a balanced measure of segmentation performance that considers precision and recall. It ranges from 0 to 1, with 1 representing the highest score. A higher IoU indicates improved segmentation accuracy; hence, the FPN models show a higher accuracy compared to the other models.
4.4. Image Classification Results
Advanced classification models, including ViT, BiT, FixResNeXt, DeiT, and EfficientNet, were trained using images generated from this investigation. Conventional metrics were used to evaluate these models. This comprehensive strategy aims to improve medical diagnosis and imaging technology. Figure 11 illustrates a 5x2 grid of original colonoscopy data randomly selected. Figure 12 illustrates the results of the models based on the original data.
EfficientNet has a pronounced superiority in all performance criteria used. Each metric confirmed that EfficientNet has one of the highest accuracy of 97% and an F1 measure of 96.79% and is superior to all the models used. FixResNeXt was slightly less successful with a maximum validation accuracy of 86% and an F1 score of 85.95%. ViT’s results are the second best of all networks, although they are far less impressive than EfficientNet’s 96.79% AUC ratings.
Loss measurements shed more light on this discrepancy in performance: FixResNeXt has a validation loss of 0.36, while the remaining models have even higher levels of loss. The validation loss of EfficientNet is 0.11, making it the best performing model. Precision and recall also retain the same traits and are presented as follows. EfficientNet validation precision and recall of EfficientNet: 96.8%, 96.8%; validation of the second best model, FixResNeXt: 86.2%, 85.9%. Specifically, most of the models demonstrate low discrepancies between the training and validation performance. EfficientNet demonstrates better adaptability to the data of this set, as well as higher efficiency in terms of all scores. The large accuracy margin points to the fact that the EfficientNet architecture is learning features and patterns in the data that other architectures are unable to; therefore, making EfficientNet suitable for tasks such as the ones used in this initial dataset.
Figure 13 shows a 5x2 grid of randomly sampled synthetic colonoscopy data. Looking at the metrics in Figure 14, EfficientNet is smoother in almost all metrics, although not as dominant as it was with the initial data.
The percentage accuracy of the training was 80 %, the accuracy of the validation was 79 % and the F1 scores for the training and validation were 79.9% and 79.1%, respectively, which are comparatively lower than the scores obtained on the original data. Other models demonstrate better relative performance, specifically based on the metrics from the validation sets. FixResNeXt takes second place with the best validation accuracy of 71%, and an F1 score of 70.8%. Both BiT achieved a fantastic validation precision of 75.64% and ViT with a validation precision of 75.47% which is higher than the training precisions of 64.98% and 61.46% separately.
Loss metrics further illustrate the narrowed gap: FixResNeXt’s 0.58 loss as well as other models’ losses are much closer to the validation loss of 0.5133, which belongs to EfficientNet.
An evaluation of overall performance highlights the fact that, with most models obtaining percentage scores within the range of 60-70% for the different evaluation criteria, synthetic data seem more difficult. This results from heightened complexity, variety, and noise in the synthetic data production process. The results suggest that the performance discrepancies between the models and the synthetic data stem from possible deficiencies not present in the actual data. Synthetic data may effectively enhance the evaluation of a model’s robustness and its ability to generalize to novel occurrences.
Figure 15 shows a 5x5 grid of randomly sampled augmented colonoscopy data (combination of original and synthetic data). The augmented dataset causes a significant reversal in the performance of the various models and shows the variation in the data characteristics that affect the model performance. In this case, DeiT and ViT are the best that demonstrate high accuracy and F1 score, as well as the lowest error rate. Training precision was achieved 98% with a validation accuracy of 93%, while F1 scores achieved 97. 94% in training and 92. 89% in validation as shown in Figure 26. The DeiT has shown the following performance which shows a great improvement compared to the previous models. ViT achieved 93% validation accuracy and a 92.51% F1 score, in contrast, BiT achieved 92% validation accuracy with a 92.38% F1 score. This shows that the augmented dataset is well suited for transformer-based architectures.
In contrast, EfficientNet outperformed all other models in the previous datasets but has the lowest validation in this case, which is a precision score 86%. This change in the improvement rate is stark and underlines the importance of specific dataset attributes for model effectiveness. Loss metrics also point to these performance changes. Figure 16 shows that DeiT validation loss is 0.20, which is less than Efficient Net’s 0.38 and the opposite of what has been seen in previous datasets. Relative performance can also be seen in the AUC scores, where DeiT achieved 92.90%, while EfficientNet achieved 86.05%.
One unique feature of the intelligent data results is that most models had validation scores greater than 90% (EfficientNet not included). Training and validation performance are also closely matched for the top models with relatively little gap. For example, the training accuracy of 98% compared to the validation accuracy of 93% shows that DeiT and ViT have great generalization as seen in Figure 16.
These results indicate that the intelligent dataset contains distinguishable patterns, which makes transformer-based models highly effective. The high overall scores, as well as the proximity to the training validation performance, indicate that this dataset is more ’teachable’ in gross terms, but with certain attributes that tend to benefit a given architectural design. This scenario proves that the structure of the model should correspond to the type of data and the qualitative difference that occurs in the work of the model in different sets.
This research captures major variations in the performance of the various models. Looking at the performance of the models in the original dataset, EfficientNet has the highest accuracy score and the highest F1 score (97% accuracy, 96.79% F1). FixResNeXt comes next shortly, followed by other models ranging from at most 75-80% on most of the metrics.
In the case of the synthetic dataset, overall model performances were comparatively lower than those achieved on the original dataset. EfficientNet retains a sample advantage over FixRexNet, although the score boundaries are significantly lower (79% validation accuracy). The performance difference decreases with FixResNeXt and VIT as close competitors, but there are differences in the validation precision: 71% for FixResNeXt and 75. 47% for VIT, as seen in Figure 17 and Figure 18
The Augmented dataset shows a complete transition. The result shows that ViT and DeiT are the most accurate models with a validation accuracy of 93% and having the highest f1 score of 92.89%.
The other two architectures, FixResNeXt and BiT, follow slightly behind ViT and DeiT. In contrast, here the validation metrics look worse for the accuracy of EfficientNet (86%). Notably, most customer variants demonstrate enhanced accuracy on the Augmented dataset compared to the synthetic and original datasets, thus containing more learnable patterns. The difference between Training and Validation scores, which affect a model’s capacity to generalize, is the smallest for the augmented dataset. By comparing the outcomes, the results show that EfficientNet, one of the most variable networks, performs worst in Intelligent but better in the original dataset. Conversely, in the Augmented dataset, the transformer-based structure (DeiT, ViT) performs much better overall. Intelligent Data Augmentation produced the best overall results for the following reasons:
-
High PerformanceThe augmented dataset demonstrated exceptional performance, consistently achieving accuracy metrics above 92% in different models and evaluation metrics. This indicates robust and reliable model behavior across various architectural implementations.
-
Performance ConsistencyA notable pattern emerged in the comparative analysis. The original dataset showed inconsistent performance, with only one model achieving high accuracy (EfficientNet at 97% validation accuracy). The synthetic dataset consistently showed lower performance across all models. In contrast, the augmented dataset maintained consistently high performance across multiple architectures, suggesting improved data quality and representation.
-
Strong GeneralizationThe minimal gap between training and validation accuracy in the augmented dataset (typically within 2-3 percentage points) indicates effective knowledge transfer, reduced overfitting, and robust model generalization capabilities.
-
Architecture-Agnostic PerformanceUnlike the original and synthetic datasets, which showed significant performance variations between different architectures, the augmented dataset demonstrated more balanced performance. This suggests reduced architecture-specific bias in the learning process.
-
Enhanced Model ApplicabilityThe consistent high performance across diverse architectural approaches suggests that the knowledge extracted from the augmented dataset is more universally applicable. The learned features are more generalizable across different model architectures, and the dataset provides robust training signals for various deep learning approaches.
Although the score accrued from the initial dataset was the maximum (97% for EfficientNet), intelligent data offered the highest precision of performance with model consistency and generic precision. This makes it the most valuable from a machine learning perspective because in addition to offering a clear separation for analyzing the data, it can also inform the best choice for model selection and could translate to superior accuracy in real-world applications.
5. Discussion
This study created a novel strategy to address the lack of medical imaging data, especially when it comes to colonoscopy operations for underrepresented groups. The main objective of the study was to improve CRC detection models by combining several data augmentation approaches with sophisticated machine learning and deep learning techniques to synthesize colonoscopy images. To produce realistic artificial colonoscopy images, the researchers modified and improved a number of visual generative AI models, such as CLIP, Stable Diffusion (SD), and DreamBooth (DB) with LoRA. The Fréchet Inception Distance and Inception Scores were used to thoroughly assess the quality of these produced images. The research used several models for image classification tasks, including EfficientNet, FixResNeXt, Big Transfer, Vision Transformer, and Data-efficient Image Transformers. The study used original, augmented, and synthetic datasets for testing and training. And also for image segmentation tasks, the study implemented U-Net, PSNet, FPN, LinkNet, and MANet. With lower FID scores across all datasets, the results showed that DreamBooth in conjunction with LoRA created the most realistic photos. ViT and DeiT models achieved 93% validation precision and 92. 89% F1 scores in classification tasks, according to the expanded dataset. This showed that creating synthetic images from high-quality data can improve model performance and generalizability across various demographic subgroups.
The CLIP, SD, and DB LoRa models were all successfully used for colonoscopy image generation in the study. Fine-tuned SD and DB LoRa produced the lowest FID scores for the datasets in terms of image originality and quality. The adapted models achieved optimal results when generating several images of synthetic colonoscopy. Inception scores were used to prove the diversity and realism of the generated image. DB LoRa received the highest average IS value of 2.36 for all datasets, indicating good image variety and quality. The quality and clinical usefulness of the images generated have therefore been quantitatively assessed using FID and IS metrics. The FID scores remained below 15 while the IS values were above 2 in all different datasets, which is an indication of the high quality and diversification of the images synthesized. The researchers were able to train and test the ViT, BiT, FixResNeXt, DeiT, and EfficientNet models using synthetic, original, and augmented data. The augmented data strengthened the results in addition to yielding a higher validation accuracy with ViT and DeiT both having; an accuracy of 93% F1 score of 92. 89%, which means that synthetic data augmentation is effective. For the image segmentation task, the study adopted and assessed the performance of U-Net, PSNet, FPN, LinkNet, MANet. The FPN model yielded the highest results in IoU: 0.6373, F1 score: 0.7238, and Dice coefficient: 0.7238.
The study clearly showed both improved performance and fairness of the model with augmented synthetic data. The augmented dataset performed steadily better than both the original and synthetic datasets for all models and measures, indicating lower bias and better generalization. All research objectives were met systematically, indicating general research contributions in the areas of synthetic image generation, improved model performance, and possible elimination of bias when using AI-enabled analysis of colonoscopy images. By improving AI-based colonoscopy screening with improved training datasets, this study significantly reduces health disparities in CRC therapy outcomes. In addition to demonstrating how artificial data augmentation can improve the effectiveness and equity of AI models for polyp recognition and classification, the study advances the field of generative AI in medical imaging. The innovative approach to medical picture synthesis, thorough evaluation techniques, improved model performance, and important implications for healthcare equity are just a few of its strengths. The study extensively evaluated a number of state-of-the-art models in a variety of fields and showed increased validation accuracy using better datasets. However, the study also has drawbacks, especially when it comes to a thorough clinical validation and moral issues around the use of artificial data in healthcare settings, which need further investigation before practical implementation.
6. Conclusions
In conclusion, this work has shown that generative AI, text-to-image synthesis, and intelligent data augmentation can be applied to overcome limitations arising from a limited number of colonoscopy images and data bias. This study demonstrated a novel way to generate a diverse and realistic number of synthetic colonoscopy images that could reflect a rather wide range of patients by improving state-of-the-art models such as CLIP, DB LoRa and SD. The comparative analysis of these synthetic images computed via FID and IS metrics, as well as the outcome of classification and segmentation models trained to utilize augmented datasets, prove the critical enhancements in AI model effectiveness and non-bias. The proposed augmentation method using original and synthetic images showed better performance than original and purely synthetic datasets for several models and evaluation metrics. This study helps address the problem of minority representation in both the identification and treatment of CRC by improving the training datasets of AI-supported colonoscopy technologies. It also pushes the point of generative AI in analyzing colonoscopy and medical imaging at large moving with more than colonoscopy applications. However, some limitations must be investigated in subsequent studies, for example, the requirement for clinical evaluation of synthesized images and some ethical concerns about incorporating AI-generated medical data. Nevertheless, this work sets a robust framework upon which future studies can build to enhance the efficiency of applying Artificial Intelligence to the analysis of Medical Images and to overcome disparities affecting health in different nations. The study recommends using augmented datasets in AI model training for colonoscopy assistance tools, as synthetic image generation has produced promising results. Augmented datasets improve developer resources, model accuracy, and generalization, while also reducing discrimination caused by racial minorities’ underrepresentation in medical imaging data. Clinical validation studies in real-world settings are critical for determining the effectiveness of these methods and addressing potential risks before deployment. Future research should focus on large-scale clinical validation of AI models trained on augmented datasets, the development of ethical guidelines for the use of synthetic medical images in clinical and training settings, and the application of synthetic data augmentation techniques to other medical imaging modalities besides colonoscopy. General implementation requires careful consideration of practical challenges, approval processes, and integration into existing ones.
Author Contributions
Author Contributions: Conceptualization, O.O.E.P, O.T.A and M.M.R; methodology, M.M.R,F.K,O.O.E.P and A.M.J,; software, O.O.E.P.; validation, O.O.E.P., F.K. and M.M.R.; formal analysis, O.O.E.P.; investigation, O.O.E.P.; resources, F.K. and M.M.R; data curation, O.O.E.P and M.M.R; writing—original draft preparation, F.K. and M.M.R, O.O.E.P; writing—review and editing,O.T.A, A.M.J, F.K. and M.M.R.; visualization, O.O.E.P and O.T.A; supervision, F.K. and M.M.R.; project administration, F.K. and M.M.R.; funding acquisition, F.K. and M.M.R. All authors have read and agreed to the published version of the manuscript
Funding
This work was supported by the National Science Foundation (NSF) grant (ID. 2131307) “CISE-MSI: DP:IIS: III: Deep Learning-Based Automated Concept and Caption Generation of Medical Images to Develop Effective Decision Support ’.
Institutional Review Board Statement
Not applicable
Informed Consent Statement
This work used publicly available data
Data Availability Statement
The data presented in this study are openly available. The source code and implementation details can be found in GitHub repository. The datasets used in this study are accessible through secure cloud storage. The complete dataset collection is available in dataset repository. The synthetic dataset, original dataset, augmented dataset, and CLEF dataset can be accessed through their respective repositories
Conflicts of Interest
The authors declare no conflicts of interest.
Abbreviations
The following abbreviations are used in this manuscript:
| AI | Artificial Intelligence |
| AIGC | AI-Generated Content |
| ArSDM | Arbitrary-Style Diffusion Model |
| AUC | Area Under the Curve |
| BiT | Big Transfer |
| BLIP | Bootstrapping Language-Image Pre-training |
| CADe | Computer-aided Detection |
| CFM | Cross Fusion Module |
| cGAN | Conditional Generative Adversarial Network |
| CIM | Cross Interaction Module |
| CLIP | Contrastive Language-Image Pre-Training |
| CNN | Convolutional Neural Network |
| CRC | Colorectal Cancer |
| DB | DreamBooth |
| DeiT | Data-efficient Image Transformers |
| DL | Deep Learning |
| DR | Adenoma Detecting Rate |
| FCNN | Fully Convolutional Neural Network |
| FID | Fréchet Inception Distance |
| FPN | Feature Pyramid Network |
| GANs | Generative Adversarial Networks |
| HD | High Definition |
| IS | Inception Score |
| LDM | Latent Diffusion Model |
| LinkNet | Link Network |
| LoRA | Low-Rank Adaptation |
| MANet | Multi-scale Attention Network |
| Mask R-CNN | Mask Region-based Convolutional Neural Network |
| mDice | Mean Dice Coefficient |
| mIoU | Mean Intersection over Union |
| ML | Machine Learning |
| Polyp-PVT | Polyp Pyramid Vision Transformer |
| PRISMA | Preferred Reporting Items for Systematic Reviews and Meta-Analyses |
| PSPNet | Pyramid Scene Parsing Network |
| SAM | Spatial Attention Module |
| SD | Stable Diffusion |
| SSPP | Single Sample Per Person |
| U-Net | U-shaped Network |
| VQGAN | Vector Quantized Generative Adversarial Network |
References
- Wang, P.; et al. Real-time automatic detection system increases colonoscopic polyp and adenoma detection rates: a prospective randomised controlled study. Gut 2019, 68, 1813–1819. [CrossRef]
- Bernal, J.; et al. Comparative Validation of Polyp Detection Methods in Video Colonoscopy: Results from the MICCAI 2015 Endoscopic Vision Challenge. IEEE Trans Med Imaging 2017, 36, 1231–1249. [CrossRef]
- Kim, J.J.H.; Um, R.S.; Lee, J.W.Y.; Ajilore, O. Generative AI can fabricate advanced scientific visualizations: ethical implications and strategic mitigation framework. AI and Ethics 2024. [CrossRef]
- Videau, M.; Knizev, N.; Leite, A.; Schoenauer, M.; Teytaud, O. Interactive Latent Diffusion Model. In Proceedings of the Genetic and Evolutionary Computation Conference; ACM: New York, NY, USA, 2023; pp. 586–596. [CrossRef]
- Bray, F.; Ferlay, J.; Soerjomataram, I.; Siegel, R.L.; Torre, L.A.; Jemal, A. Global cancer statistics 2018: GLOBOCAN estimates of incidence and mortality worldwide for 36 cancers in 185 countries. CA Cancer J Clin 2018, 68, 394–424. [CrossRef]
- S. K. Alhabeeb and A. A. Al-Shargabi, "Text-to-Image Synthesis with Generative Models: Methods, Datasets, Performance Metrics, Challenges, and Future Direction," IEEE Access, vol. 1, pp. 1-1, Jan. 2024, . [CrossRef]
- Y. X. Tan, C. P. Lee, N. Mai, K. M. Lim, J. Y. Lim, and A. Alqahtani, "Recent Advances in Text-to-Image Synthesis: Approaches, Datasets and Future Research Prospects," IEEE Access, vol. 11, pp. 88099-88115, Jan. 2023, . [CrossRef]
- G. Iglesias, E. Talavera, and A. Díaz-Álvarez, "A survey on GANs for computer vision: Recent research, analysis and taxonomy," Computer Science Review, vol. 48, pp. 100553-100553, May 2023, . [CrossRef]
- Peter, O.O.E.; Rahman, M.M.; Khalifa, F. Advancing AI-Powered Medical Image Synthesis: Insights from MedVQA-GI Challenge Using CLIP, Fine-Tuned Stable Diffusion, and Dream-Booth + LoRA. In Conference and Labs of the Evaluation Forum 2024. [Online]. Available: https://api.semanticscholar.org/CorpusID:271772323.
- R. Najjar, "Redefining Radiology: A Review of Artificial Intelligence Integration in Medical Imaging," Diagnostics, vol. 13, pp. 2760, Aug. 2023, . [CrossRef]
- O. Abdullah, B. N. Jagadale, A. Naji, M. Ghaleb, Ahmed, A. Aqlan, and D. Esmail, "Efficient artificial intelligence approaches for medical image processing in healthcare: comprehensive review, taxonomy, and analysis," Artificial Intelligence Review, vol. 57, Jul. 2024, . [CrossRef]
- A. Arora et al., "The value of standards for health datasets in artificial intelligence-based applications," Nature Medicine, vol. 29, pp. 1-10, Oct. 2023, . [CrossRef]
- Pengxiao, H.; Changkun, Y.; Jieming, Z.; Jing, Z.; Hong, J.; Xuesong, L. Latent-based Diffusion Model for Long-tailed Recognition. In IEEE/CVF Conference on Computer Vision and Pattern Recognition Workshops 2024.
- Du, Y.; et al. ArSDM: Colonoscopy Images Synthesis with Adaptive Refinement Semantic Diffusion Models. MICCAI 2023. [CrossRef]
- Ku, H.; Lee, M. TextControlGAN: Text-to-Image Synthesis with Controllable Generative Adversarial Networks. Applied Sciences 2023, 13, 5098. [CrossRef]
- Iqbal, M.A.; Jadoon, W.; Kim, S.K. Synthetic Image Generation Using Conditional GAN-Provided Single-Sample Face Image. Applied Sciences 2024, 14, 5049. [CrossRef]
- Shin, Y.; Qadir, H.A.; Aabakken, L.; Bergsland, J.; Balasingham, I. Automatic Colon Polyp Detection using Region based Deep CNN and Post Learning Approaches. 2019. [CrossRef]
- Qadir, H.A.; Shin, Y.; Solhusvik, J.; Bergsland, J.; Aabakken, L.; Balasingham, I. Polyp Detection and Segmentation using Mask R-CNN: Does a Deeper Feature Extractor CNN Always Perform Better? In International Symposium on Medical Information and Communication Technology (ISMICT); IEEE, 2019; pp. 1–6. [CrossRef]
- Dong, B.; Wang, W.; Fan, D.-P.; Li, J.; Fu, H.; Shao, L. Polyp-PVT: Polyp Segmentation with Pyramid Vision Transformers. 2021. [CrossRef]
- Repici, A.; et al. Efficacy of Real-Time Computer-Aided Detection of Colorectal Neoplasia in a Randomized Trial. Gastroenterology 2020, 159, 512-520.e7. [CrossRef]
- Kudo, S.; et al. Artificial Intelligence-assisted System Improves Endoscopic Identification of Colorectal Neoplasms. Clinical Gastroenterology and Hepatology 2020, 18, 1874-1881.e2. [CrossRef]
- Zhou, J.; et al. A novel artificial intelligence system for the assessment of bowel preparation (with video). Gastrointest Endosc 2020, 91, 428-435.e2. [CrossRef]
- Mahmood, F.; Chen, R.; Durr, N.J. Unsupervised Reverse Domain Adaptation for Synthetic Medical Images via Adversarial Training. IEEE Trans Med Imaging 2018, 37, 2572–2581. [CrossRef]
- Goceri, E. Medical image data augmentation: techniques, comparisons and interpretations. Artif Intell Rev 2023, 56, 12561–12605. [CrossRef]
- Yang, Z.; Zhan, F.; Liu, K.; Xu, M.; Lu, S. AI-Generated Images as Data Source: The Dawn of Synthetic Era. arXiv 2023. [CrossRef]
- Cao, Y.; et al. A Comprehensive Survey of AI-Generated Content (AIGC): A History of Generative AI from GAN to ChatGPT. arXiv 2023. [CrossRef]
- Bandi, A.; Adapa, P.V.S.R.; Kuchi, Y.E.V.P.K. The Power of Generative AI: A Review of Requirements, Models, Input–Output Formats, Evaluation Metrics, and Challenges. Future Internet 2023, 15, 260. [CrossRef]
- Bendel, O. Image synthesis from an ethical perspective. AI Soc 2023. [CrossRef]
- Derevyanko, N.; Zalevska, O. Comparative analysis of neural networks Midjourney, Stable Diffusion, and DALL-E and ways of their implementation in the educational process of students of design specialities. Scientific Bulletin of Mukachevo State University Series "Pedagogy and Psychology" 2023, 9, 36–44. [CrossRef]
- Sánchez-Peralta, L.F.; Bote-Curiel, L.; Picón, A.; Sánchez-Margallo, F.M.; Pagador, J.B. Deep learning to find colorectal polyps in colonoscopy: A systematic literature review. Artif Intell Med 2020, 108, 101923. [CrossRef]
- Salimans, T.; et al. Improved Techniques for Training GANs. In Advances in Neural Information Processing Systems; Lee, D., Sugiyama, M., Luxburg, U., Guyon, I., Garnett, R., Eds.; Curran Associates, Inc., 2016.
- Heusel, M.; Ramsauer, H.; Unterthiner, T.; Nessler, B.; Hochreiter, S. GANs Trained by a Two Time-Scale Update Rule Converge to a Local Nash Equilibrium. In Advances in Neural Information Processing Systems; Guyon, I., Von Luxburg, U., Bengio, S., Wallach, H., Fergus, R., Vishwanathan, S., Garnett, R., Eds.; Curran Associates, Inc., 2017.
- Wang, P.; et al. Development and validation of a deep-learning algorithm for the detection of polyps during colonoscopy. Nat Biomed Eng 2018, 2, 741–748. [CrossRef]
- Misawa, M.; et al. Artificial Intelligence-Assisted Polyp Detection for Colonoscopy: Initial Experience. Gastroenterology 2018, 154, 2027-2029.e3. [CrossRef]
- Guo, Y.; Bernal, J.; Matuszewski, B.J. Polyp Segmentation with Fully Convolutional Deep Neural Networks—Extended Evaluation Study. J Imaging 2020, 6, 69. [CrossRef]
- Borgli, H.; et al. HyperKvasir, a comprehensive multi-class image and video dataset for gastrointestinal endoscopy. Sci Data 2020, 7, 283. [CrossRef]
- Beaumont, R. LAION-5B: A NEW ERA OF OPEN LARGE-SCALE MULTI-MODAL DATASETS. 2022. [Online]. Available: https://laion.ai/blog/laion-5b/.
- Chicco, D.; Jurman, G. The advantages of the Matthews correlation coefficient (MCC) over F1 score and accuracy in binary classification evaluation. BMC Genomics 2020, 21, 6. [CrossRef]
- Fawcett, T. An introduction to ROC analysis. Pattern Recognit Lett 2006, 27, 861–874. [CrossRef]
- Rezatofighi, H.; Tsoi, N.; Gwak, J.; Sadeghian, A.; Reid, I.; Savarese, S. Generalized Intersection Over Union: A Metric and A Loss for Bounding Box Regression. In IEEE/CVF Conference on Computer Vision and Pattern Recognition (CVPR); IEEE, 2019; pp. 658–666. [CrossRef]
- Powers, D.M.W. Evaluation: from precision, recall and F-measure to ROC, informedness, markedness and correlation. CoRR 2020, abs/2010.16061.
- Hore, A.; Ziou, D. Image Quality Metrics: PSNR vs. SSIM. In International Conference on Pattern Recognition; IEEE, 2010; pp. 2366–2369. [CrossRef]
- Wang, Z.; Bovik, A.C.; Sheikh, H.R.; Simoncelli, E.P. Image Quality Assessment: From Error Visibility to Structural Similarity. IEEE Transactions on Image Processing 2004, 13, 600–612. [CrossRef]
- Taha, A.A.; Hanbury, A. Metrics for evaluating 3D medical image segmentation: analysis, selection, and tool. BMC Med Imaging 2015, 15, 29. [CrossRef]
- Ejiga, P.O.; Oluwafemi, O. Text-Guided Synthesis for Colon Cancer Screening. GitHub repository 2024. https://github.com/Ejigsonpeter/Text-Guided-Synthesis-for-Colon-Cancer-Screening.
- Hicks, S.; Storås, A.; Halvorsen, P.; De Lange, T.; Riegler, M.; Thambawita, V. Overview of ImageCLEFmedical 2023 - Medical Visual Question Answering for Gastrointestinal Tract. 2023. [Online]. Available: https://ceur-ws.org/Vol-3497/paper-107.pdf.
- Wang, W.; Tian, J. CP-CHILD records the colonoscopy data. figshare 2020. https://figshare.com/articles/dataset/CP-CHILD_zip/12554042?file=23383508.
- Rahman, M.S. Binary Polyps Classification. 2024. [Online]. Available: https://www.kaggle.com/datasets/mdsahilurrahman71/binary-polyps-classification?resource=download.
- Ronneberger, O.; Fischer, P.; Brox, T. U-Net: Convolutional networks for biomedical image segmentation. arXiv (Cornell University) 2015. [CrossRef]
- Zhao, H.; Shi, J.; Qi, X.; Wang, X.; Jia, J. Pyramid Scene Parsing Network. arXiv.org 2017. https://arxiv.org/abs/1612.01105.
- Lin, T.; Dollár, P.; Girshick, R.; He, K.; Hariharan, B.; Belongie, S. Feature Pyramid Networks for Object Detection. arXiv (Cornell University) 2016. [CrossRef]
- Chaurasia, A.; Culurciello, E. LinkNet: Exploiting encoder representations for efficient semantic segmentation. IEEE Visual Communications and Image Processing (VCIP) 2017. https://arxiv.org/abs/1707.03718.
- Safari, F.; Savić, I.; Kunze, H.; Ernst, J.; Gillis, D. A Review of AI-based MANET Routing Protocols. IEEE WiMob 2023, 43-50. [CrossRef]
- HuggingFace. Mask Generation. 2024. [Online]. Available: https://huggingface.co/docs/transformers/tasks/mask_generation.
Figure 1.
Comprehensive flow diagram of the research methodology, illustrating the sequential process from dataset preparation through model development and evaluation.
Figure 1.
Comprehensive flow diagram of the research methodology, illustrating the sequential process from dataset preparation through model development and evaluation.
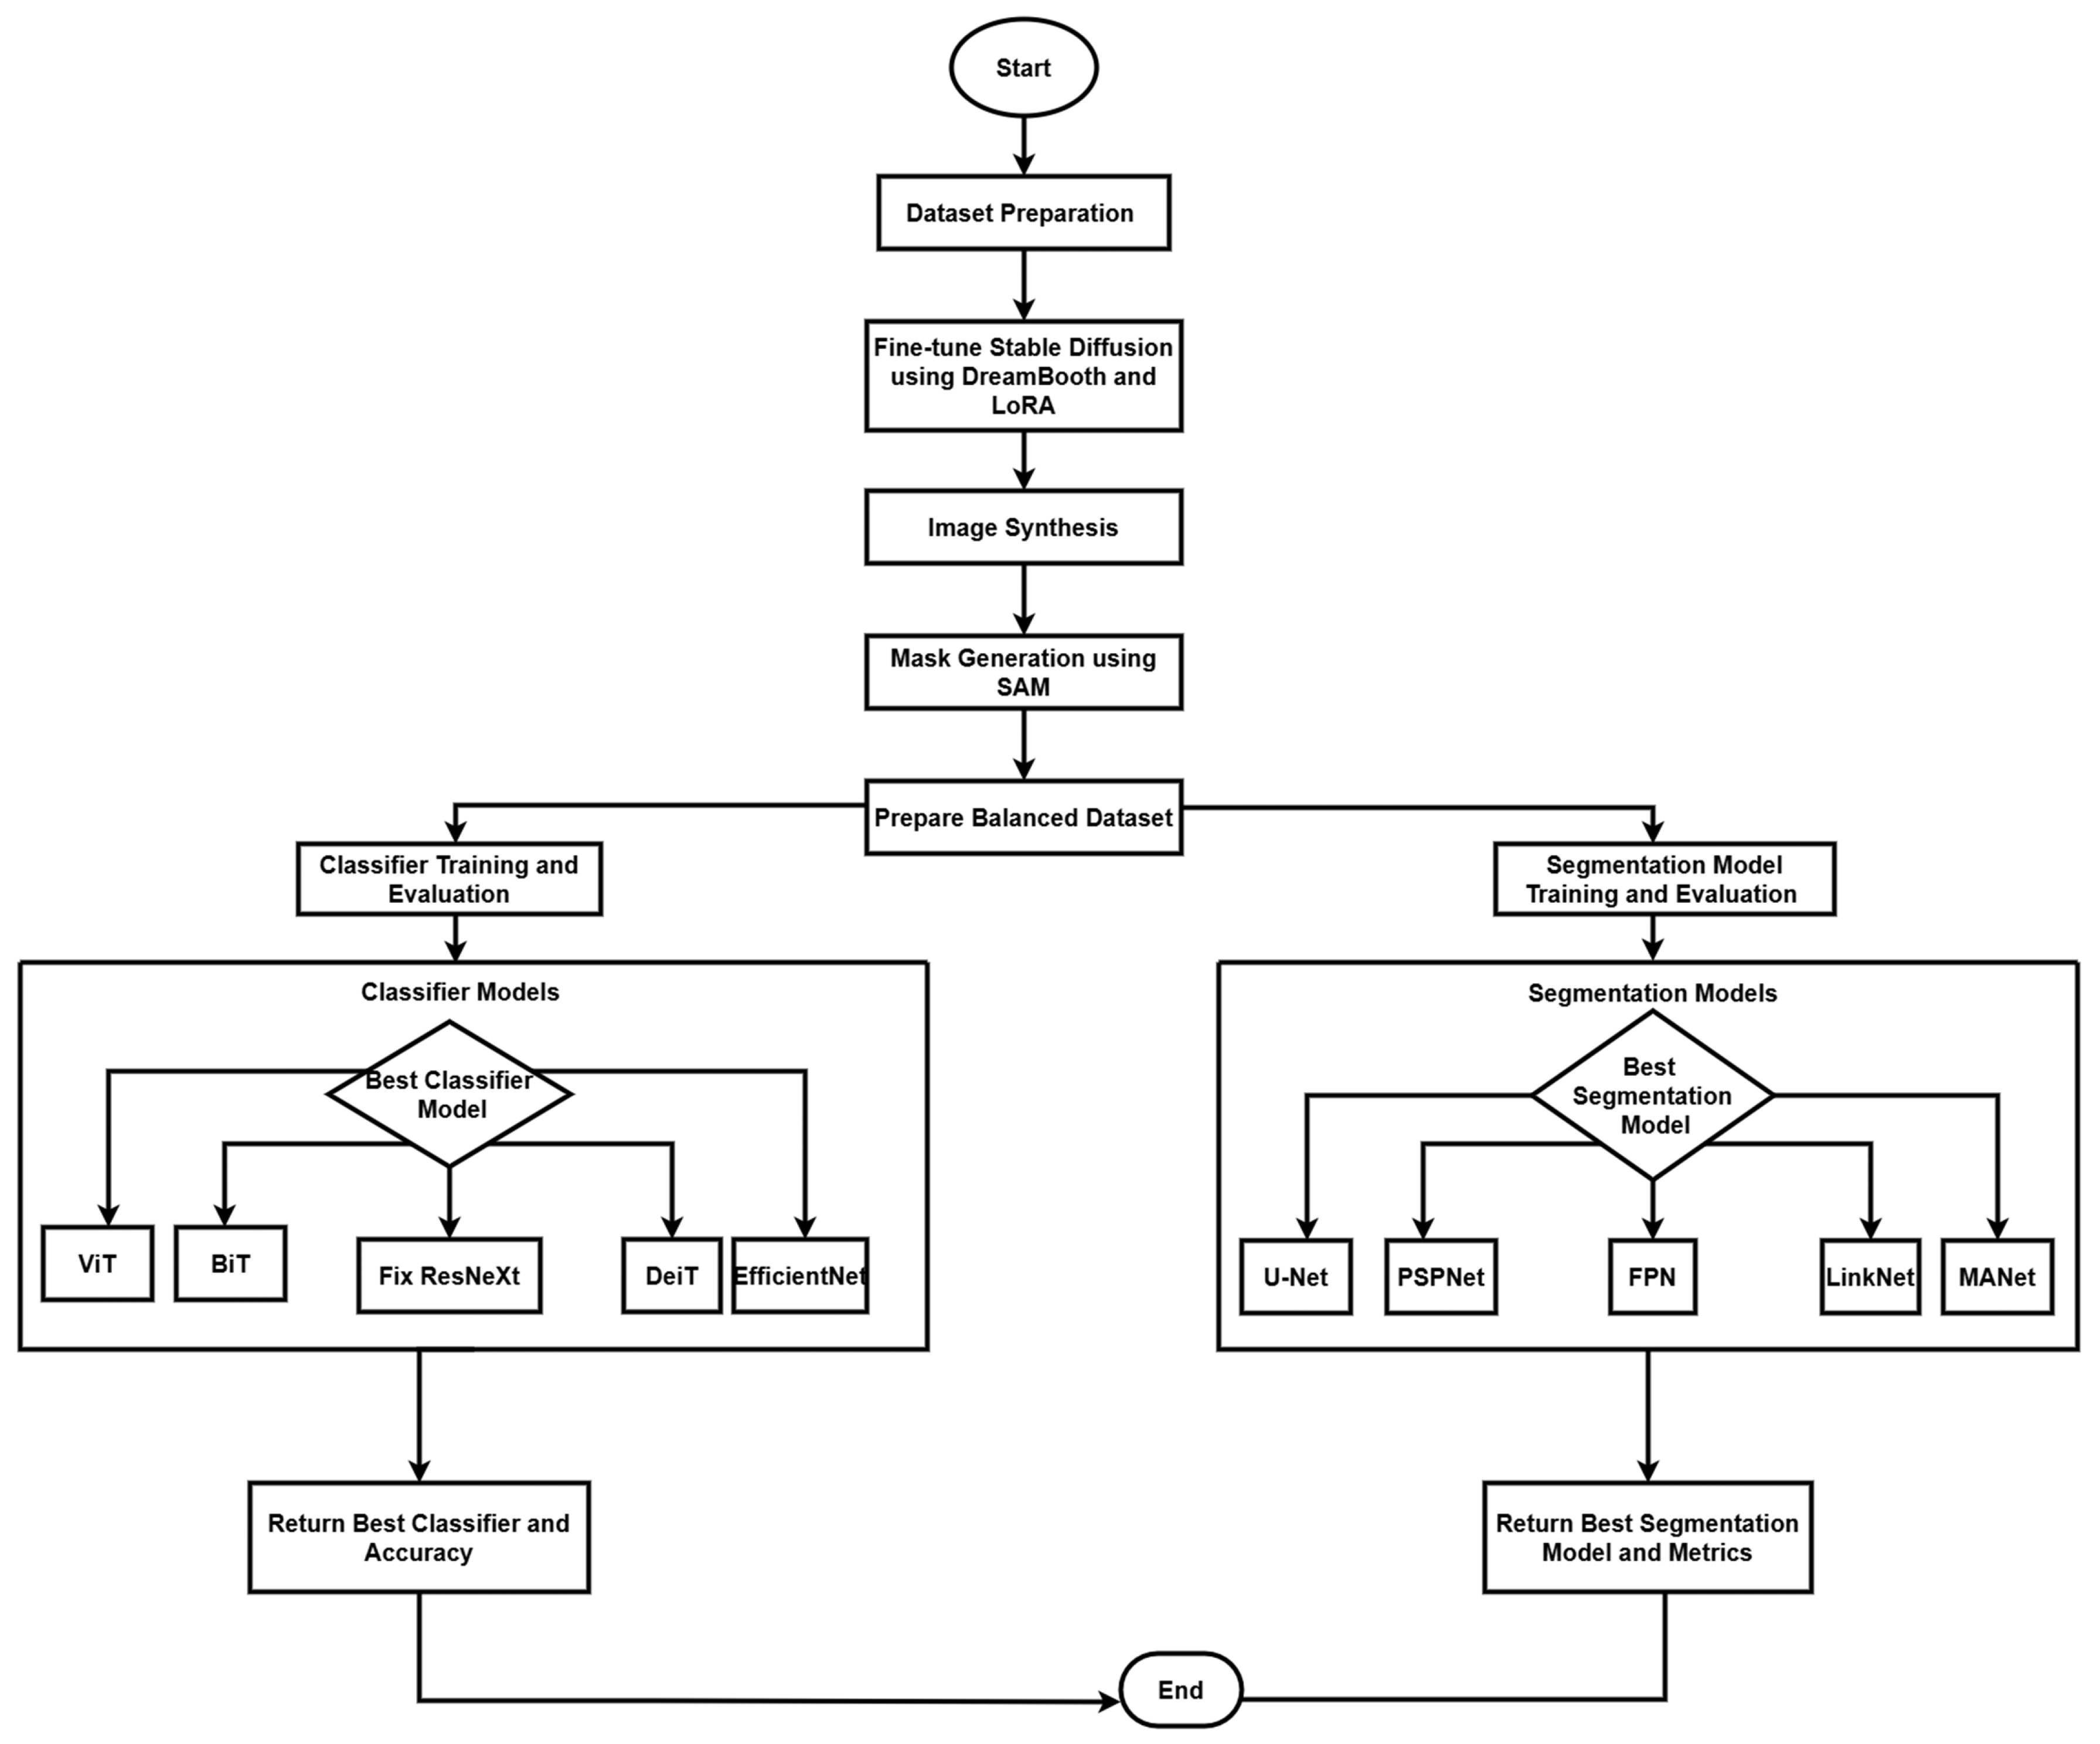
Figure 2.
DB fine-tunes text-to-image model with few polyp images to generate personalized colonoscopy images
Figure 2.
DB fine-tunes text-to-image model with few polyp images to generate personalized colonoscopy images
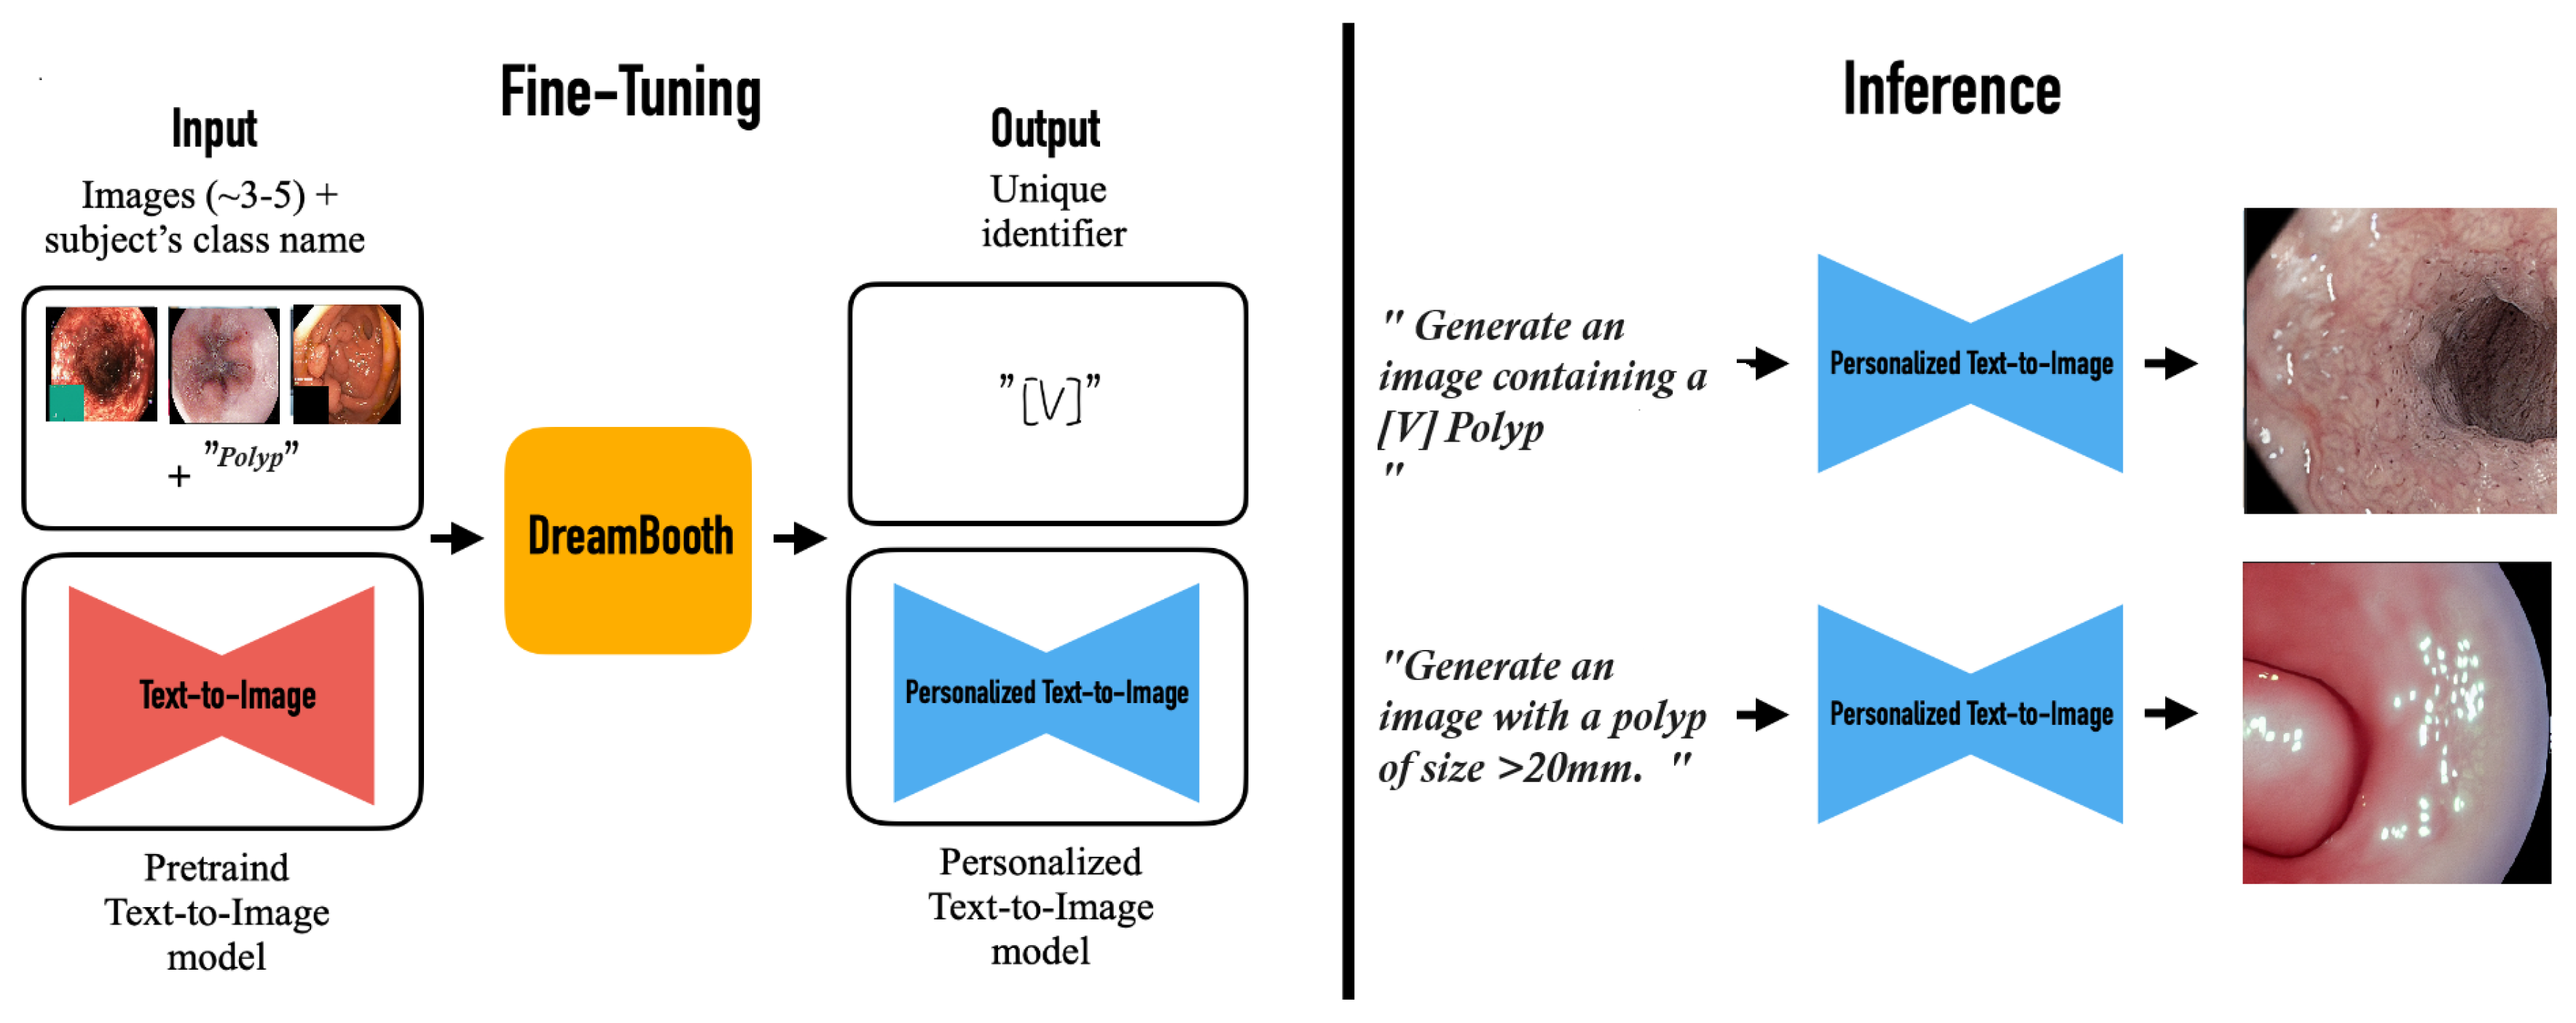
Figure 3.
The dataset shows image-text pairs where each colonoscopy image is matched with multiple descriptive text prompts images
Figure 3.
The dataset shows image-text pairs where each colonoscopy image is matched with multiple descriptive text prompts images
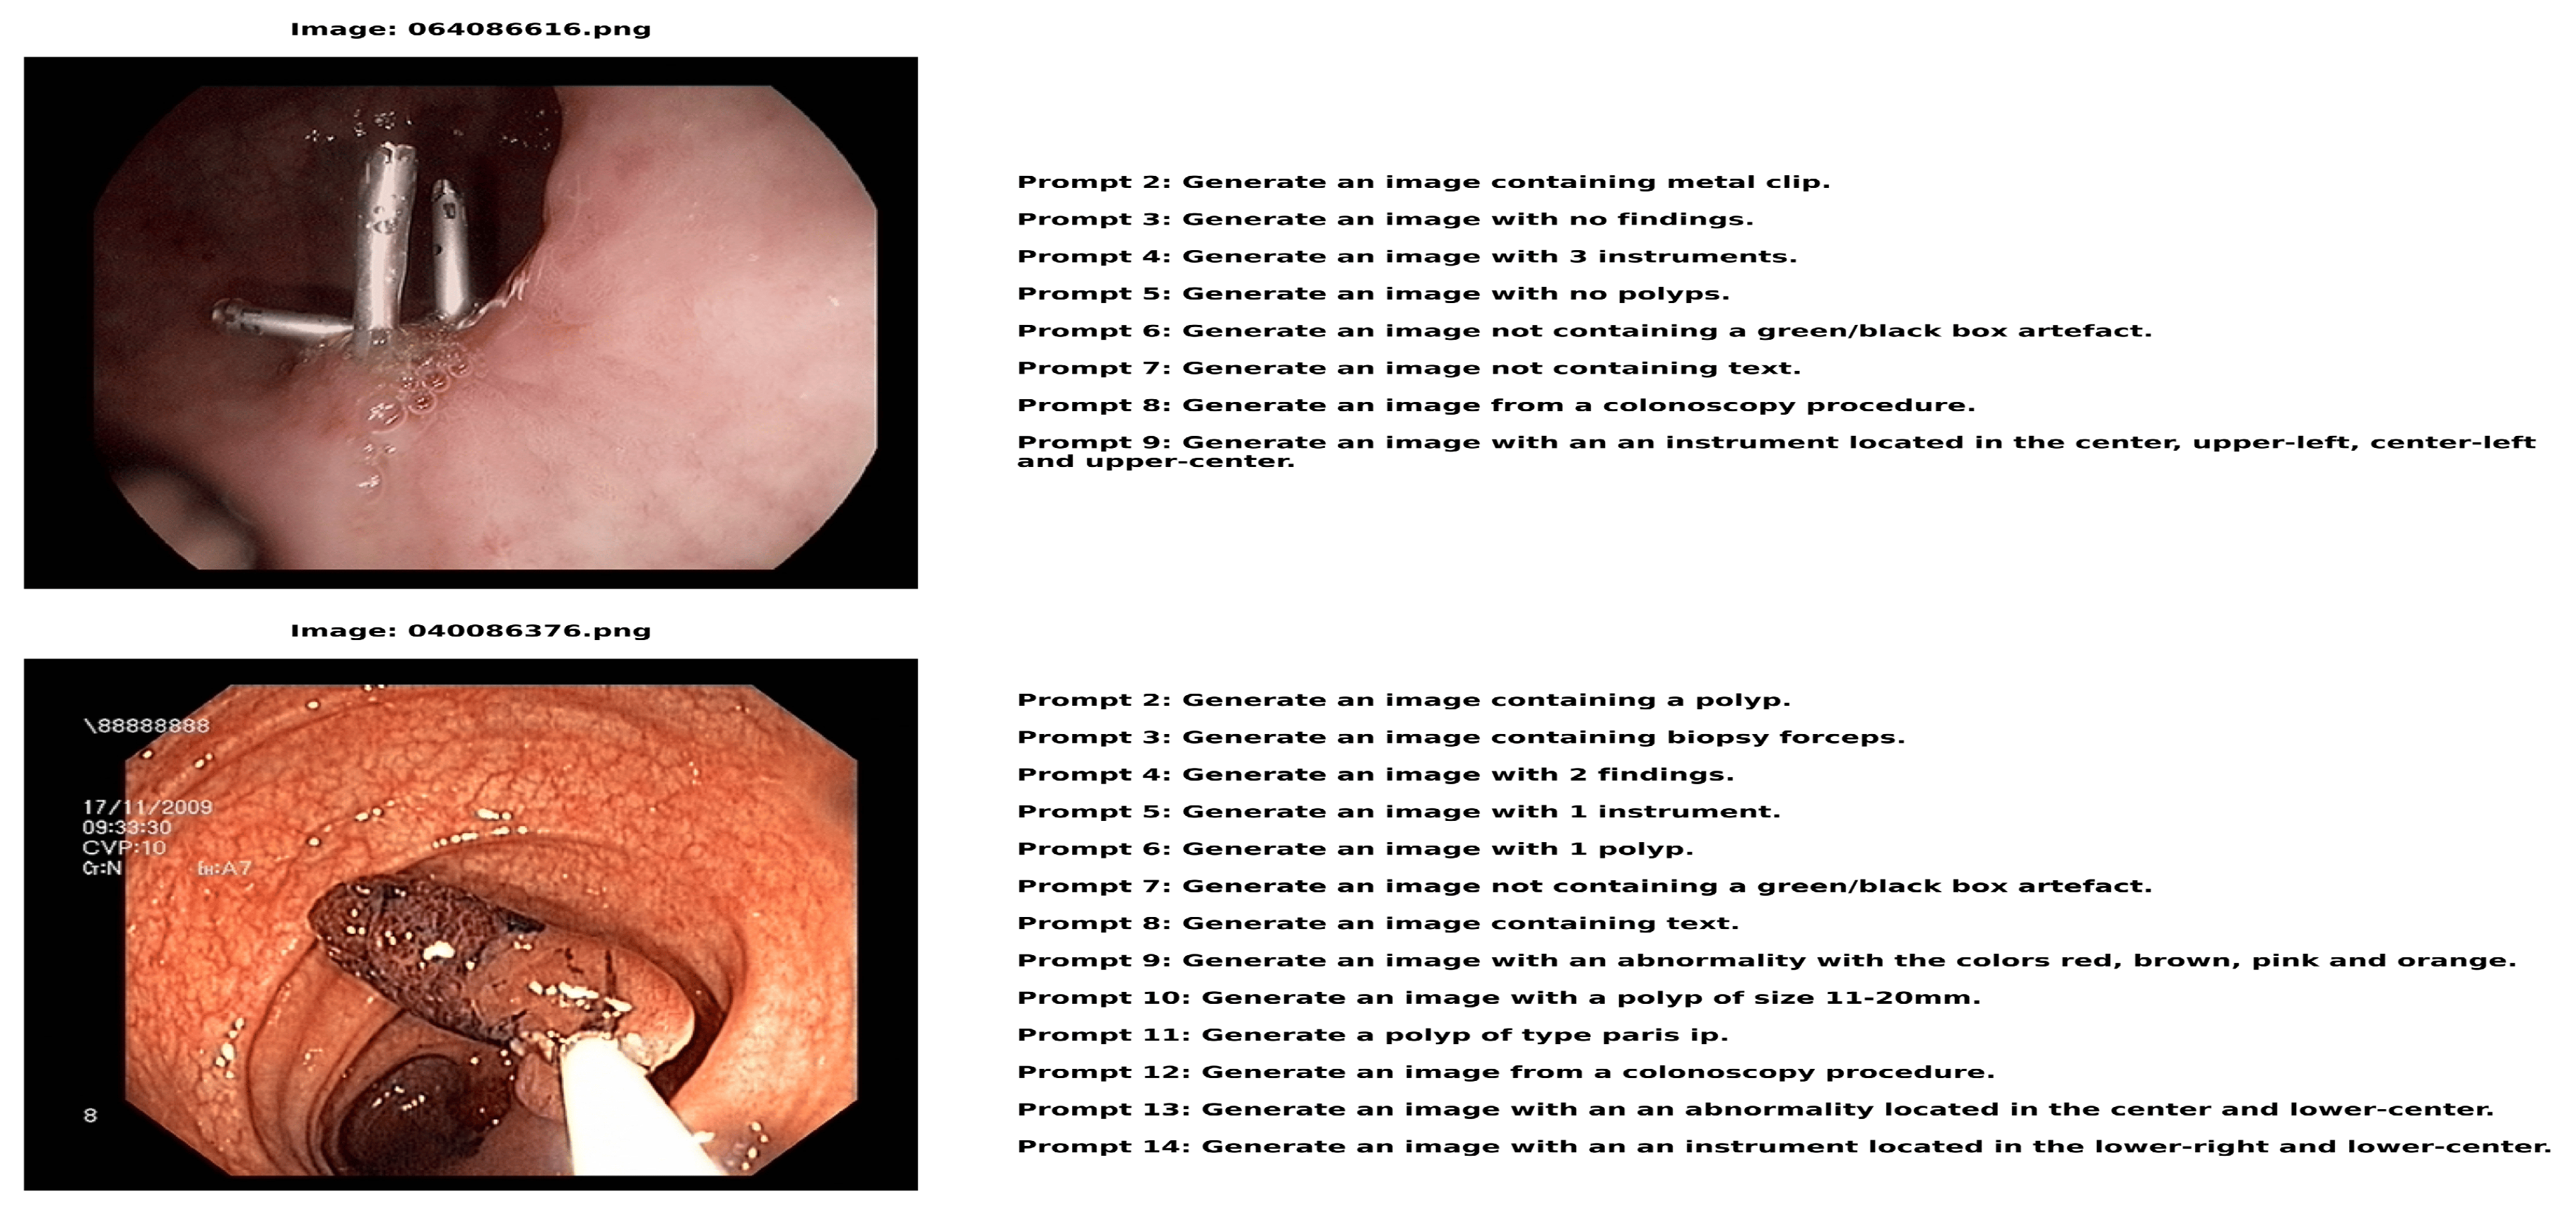
Figure 4.
CLIP text-to-image-based colonoscopy image generation
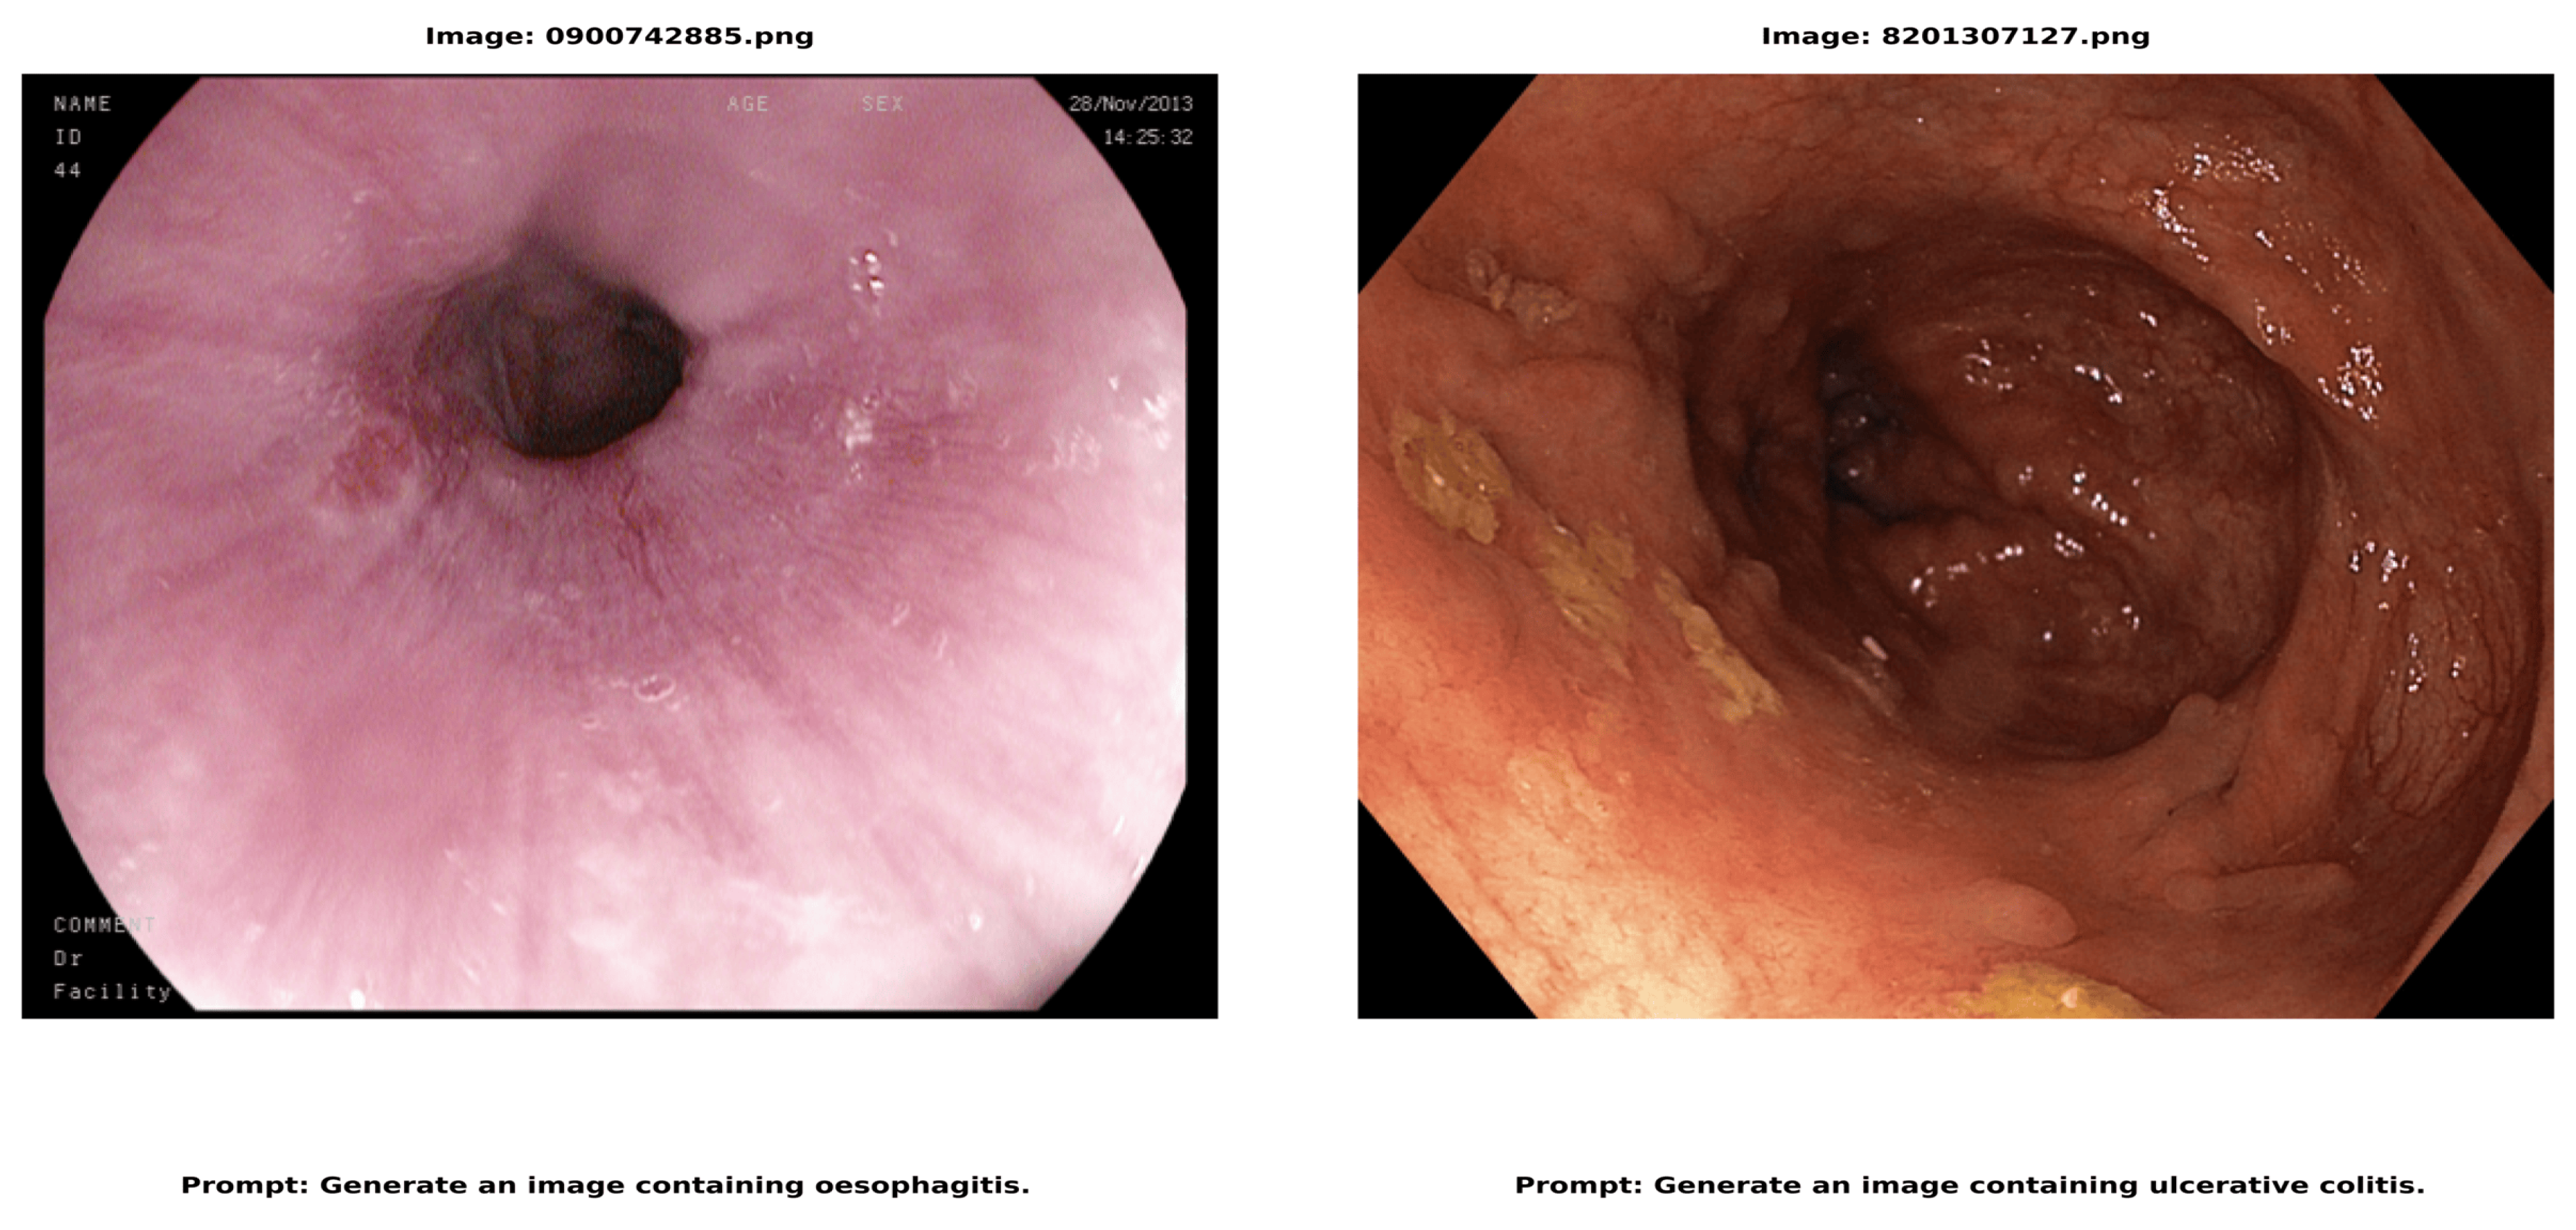
Figure 5.
Finetuned SD Text-to-image-based colonoscopy image generation
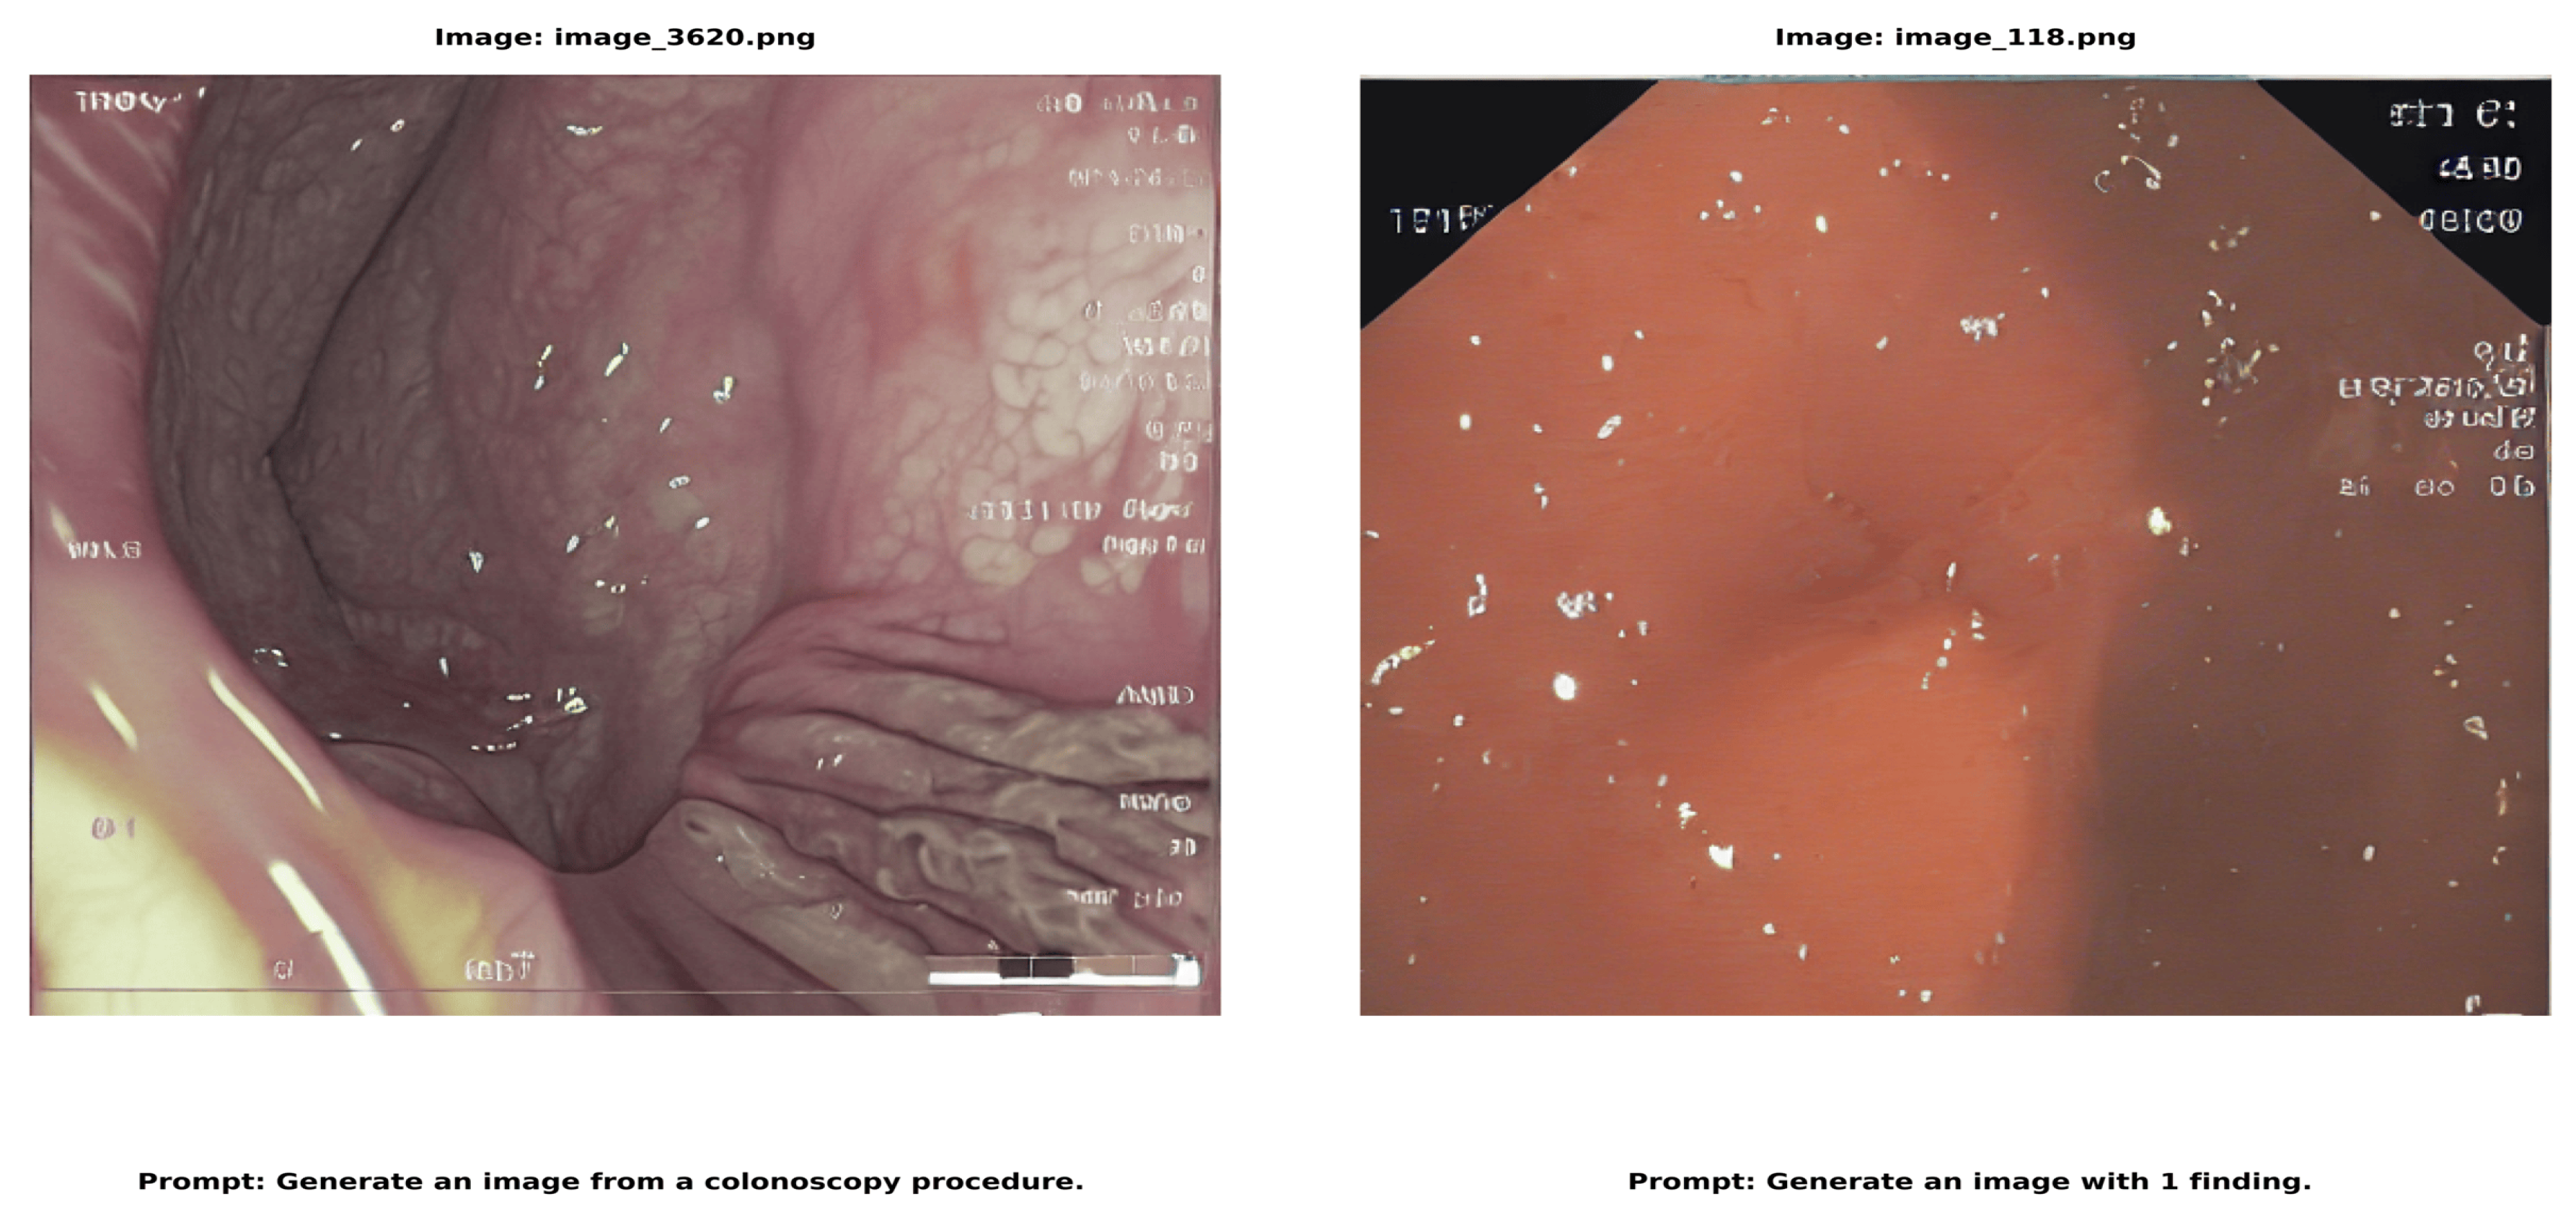
Figure 6.
DB and LoRa Text-to-image-based colonoscopy image generation
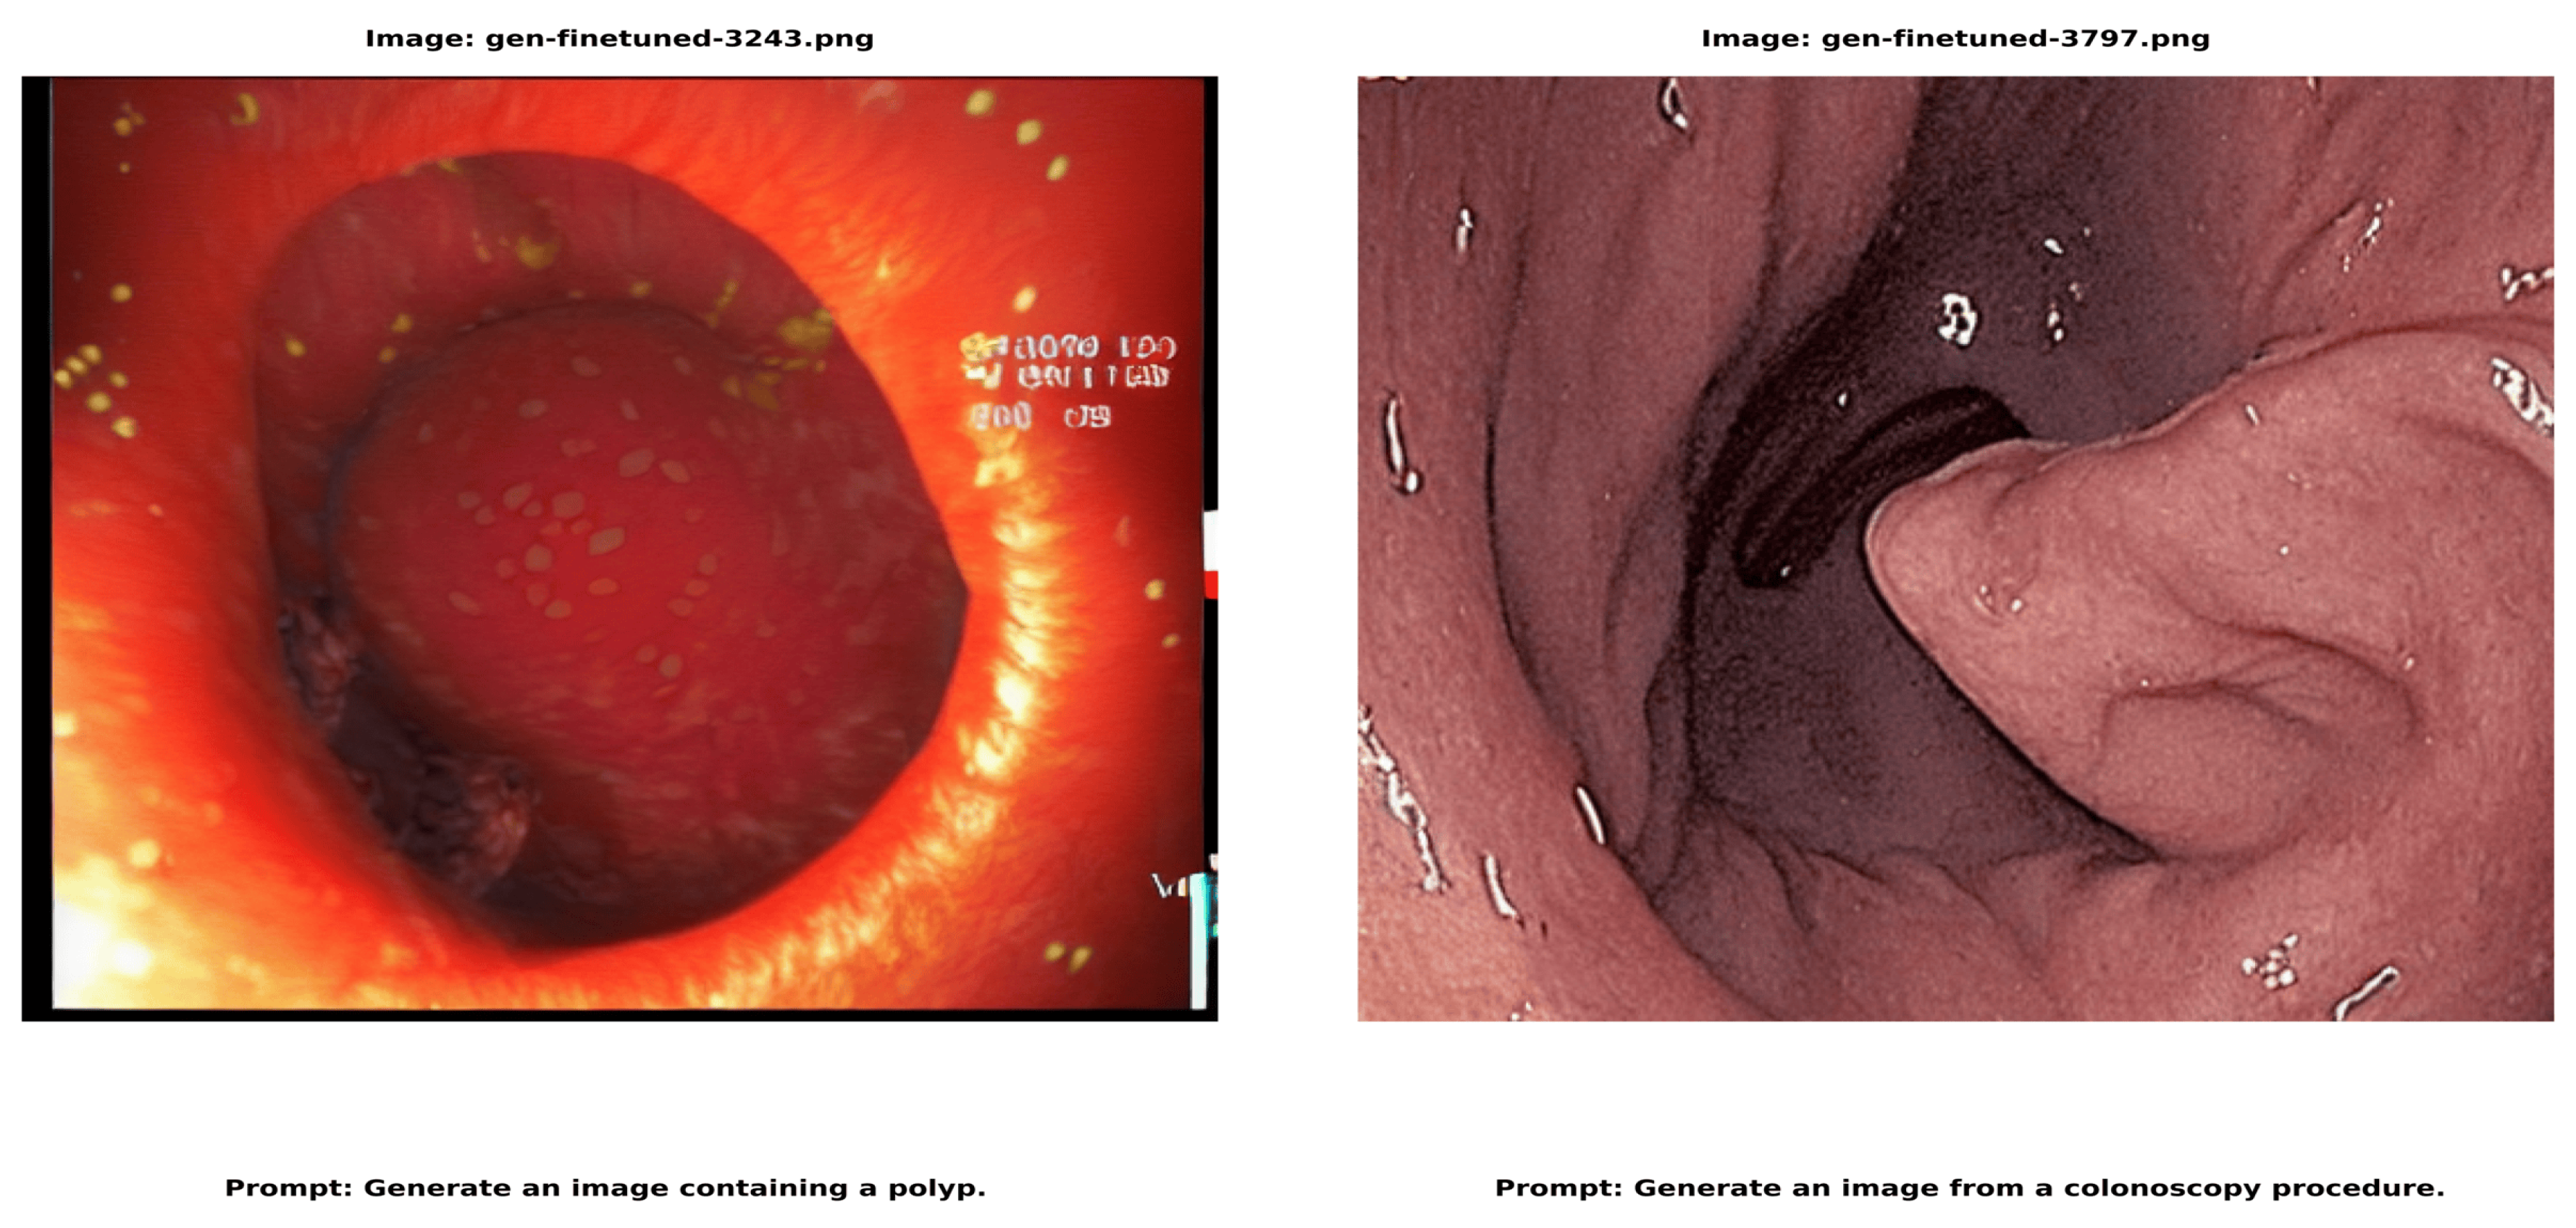
Figure 7.
FID comparison across three models and three datasets
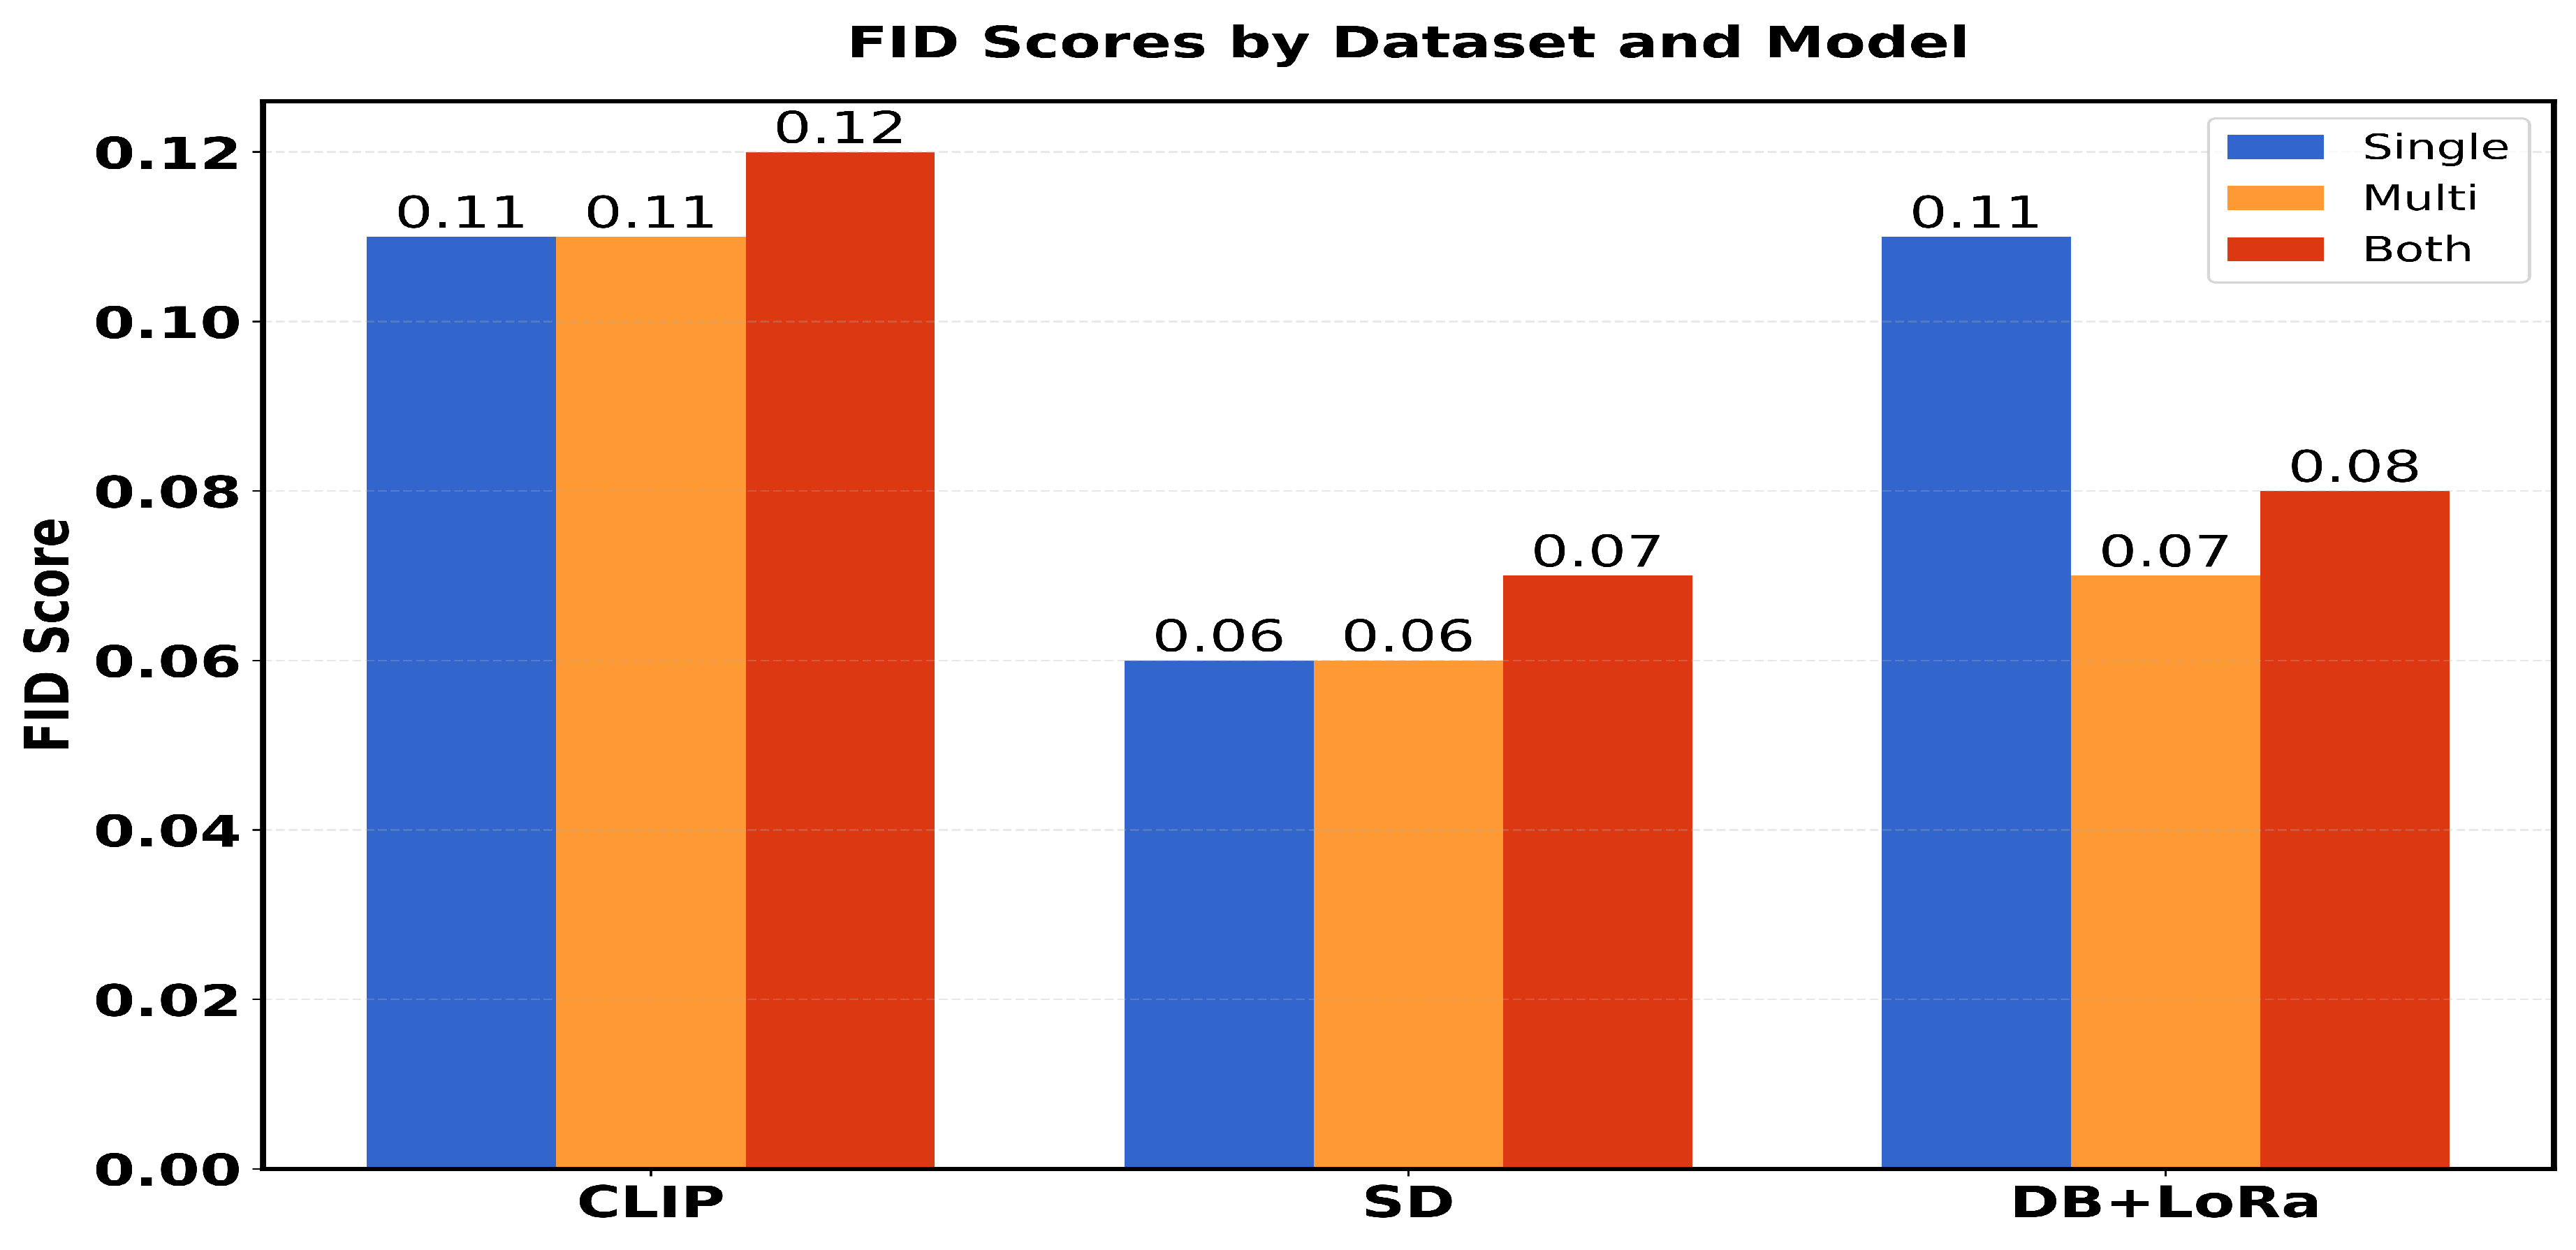
Figure 8.
IS comparison across three models and three datasets
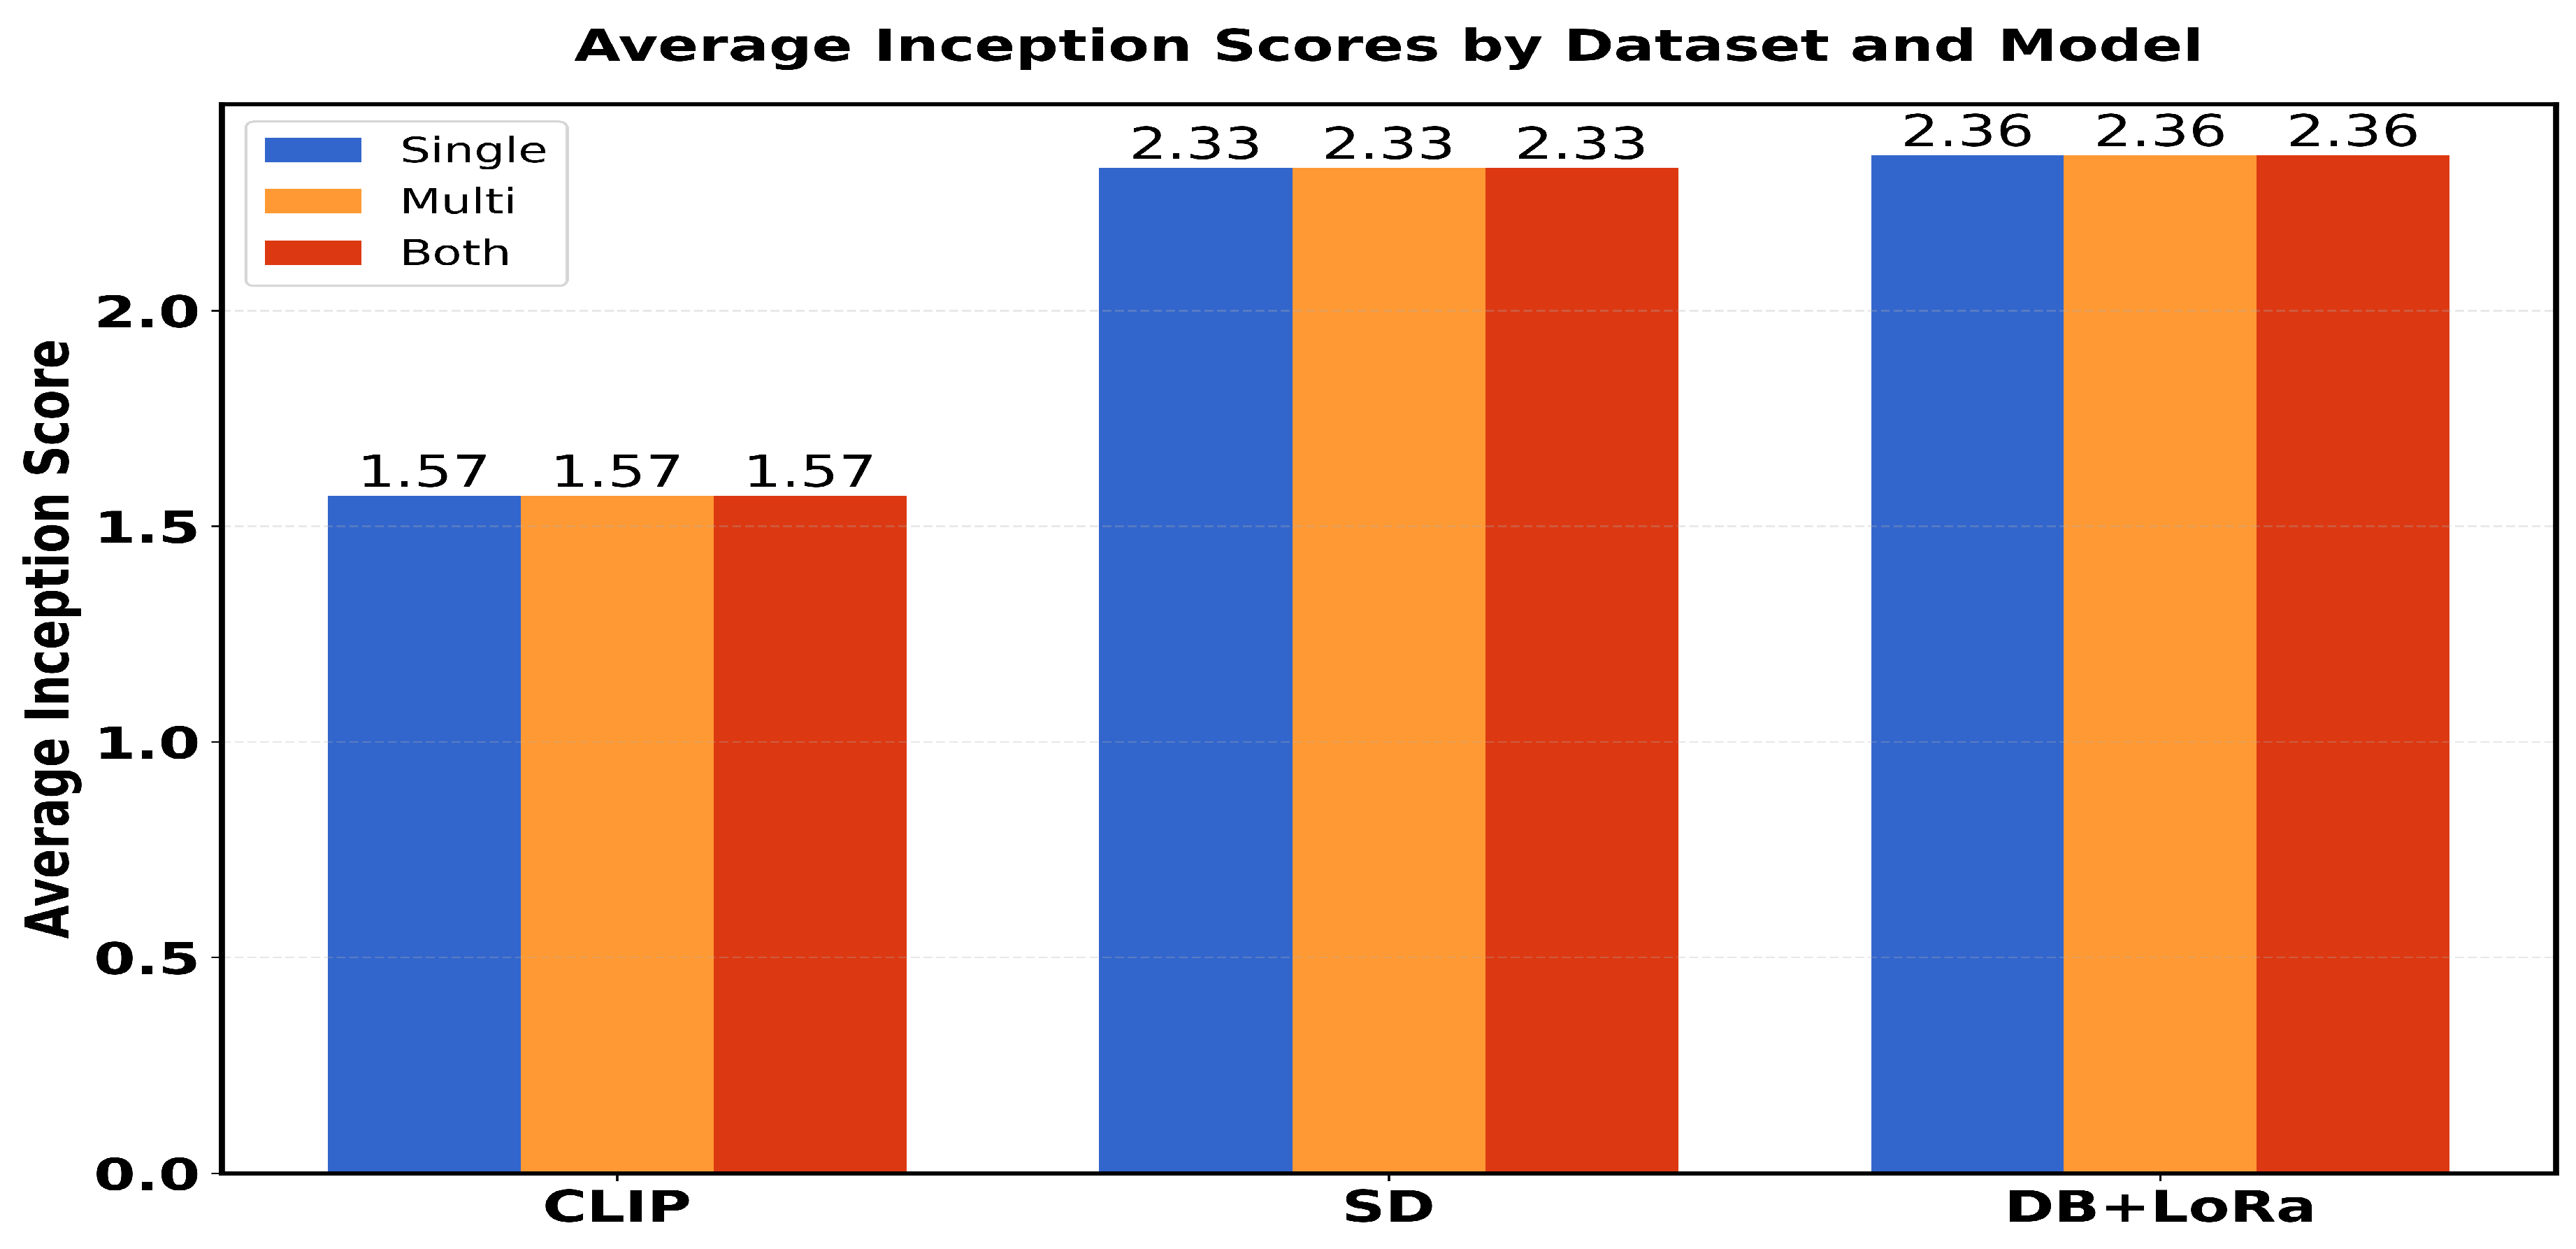
Figure 9.
Synthetic Image vs. Synthetic Image Mask generated by SAM
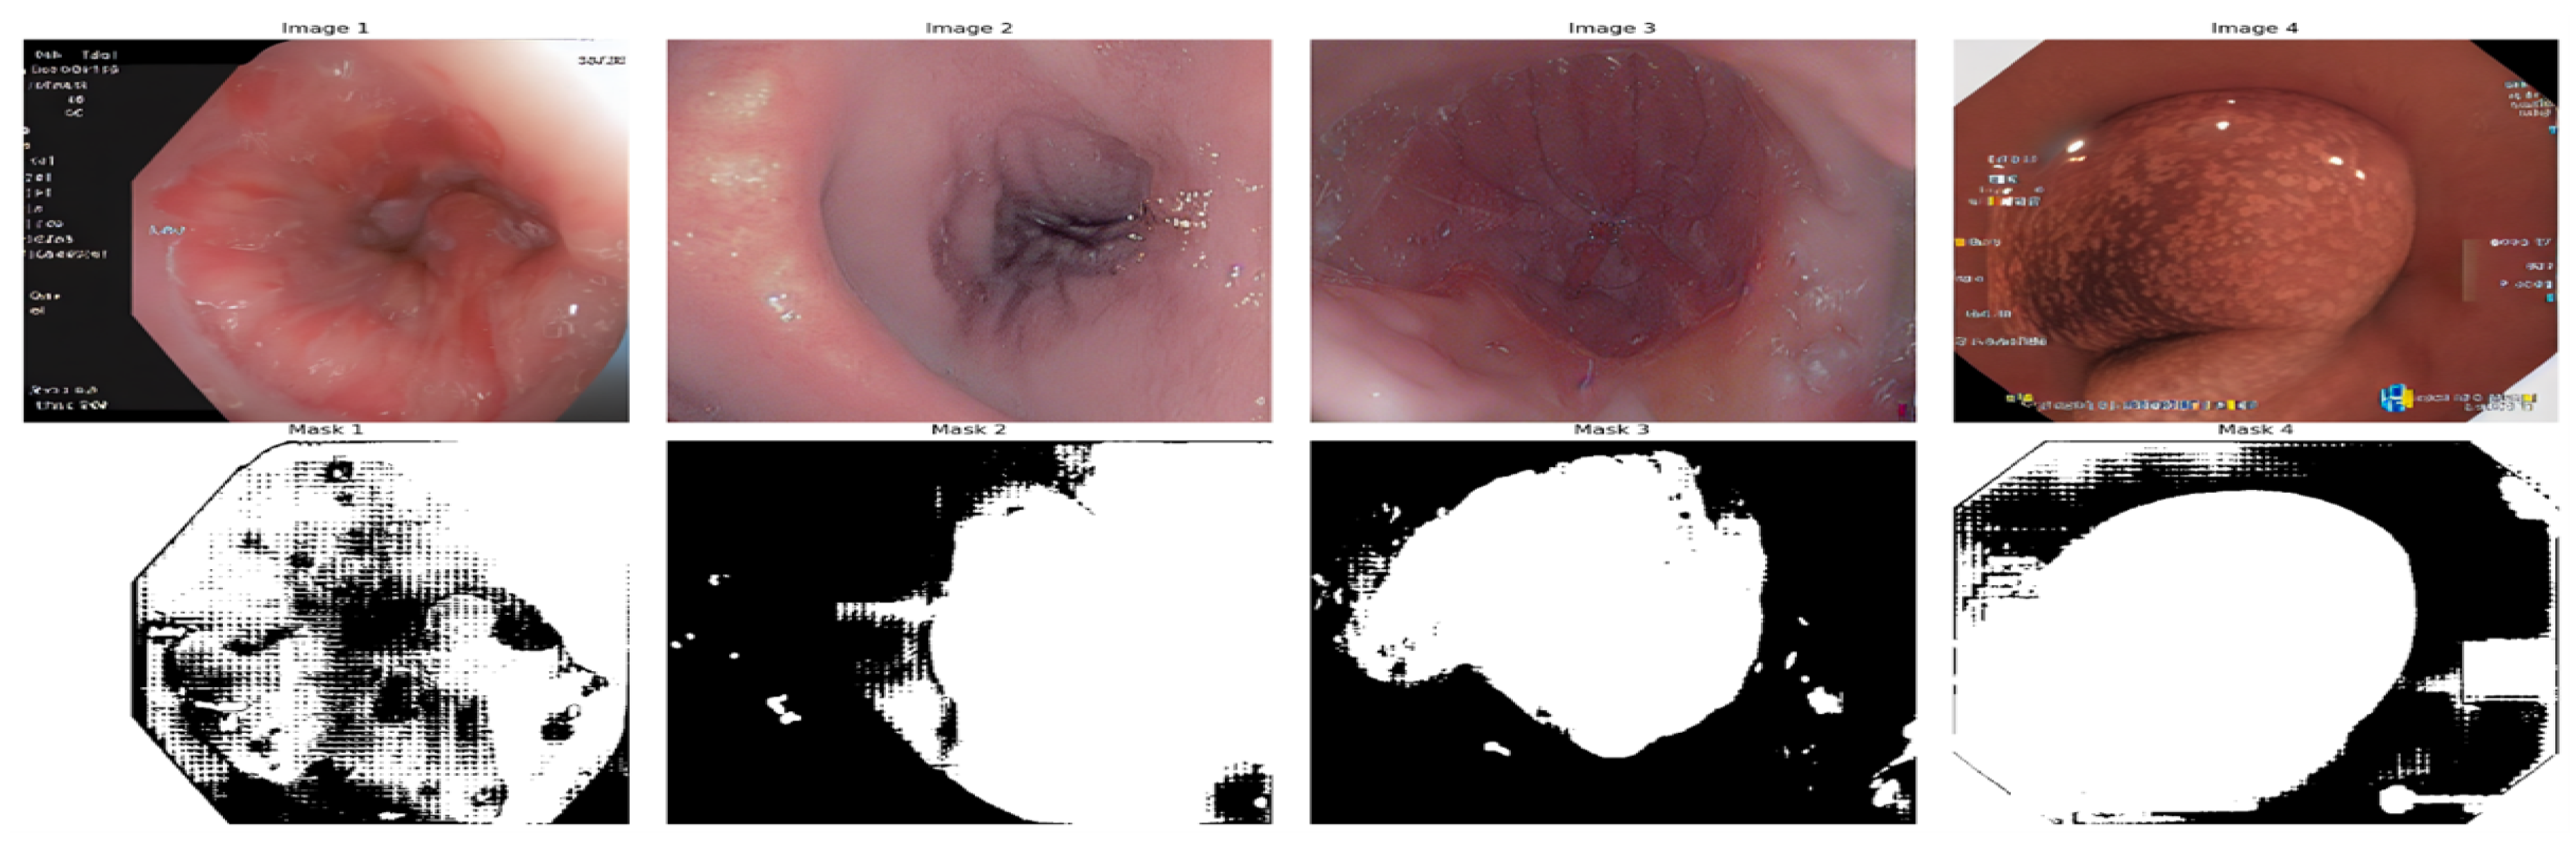
Figure 10.
FPN segmentation results visualization: (a) Original colonoscopy image showing a polyp, (b) Ground truth binary mask indicating the polyp region, (c) Model-predicted segmentation mask, and (d) Overlay visualization comparing the ground truth (green) and predicted (red) segmentation regions.
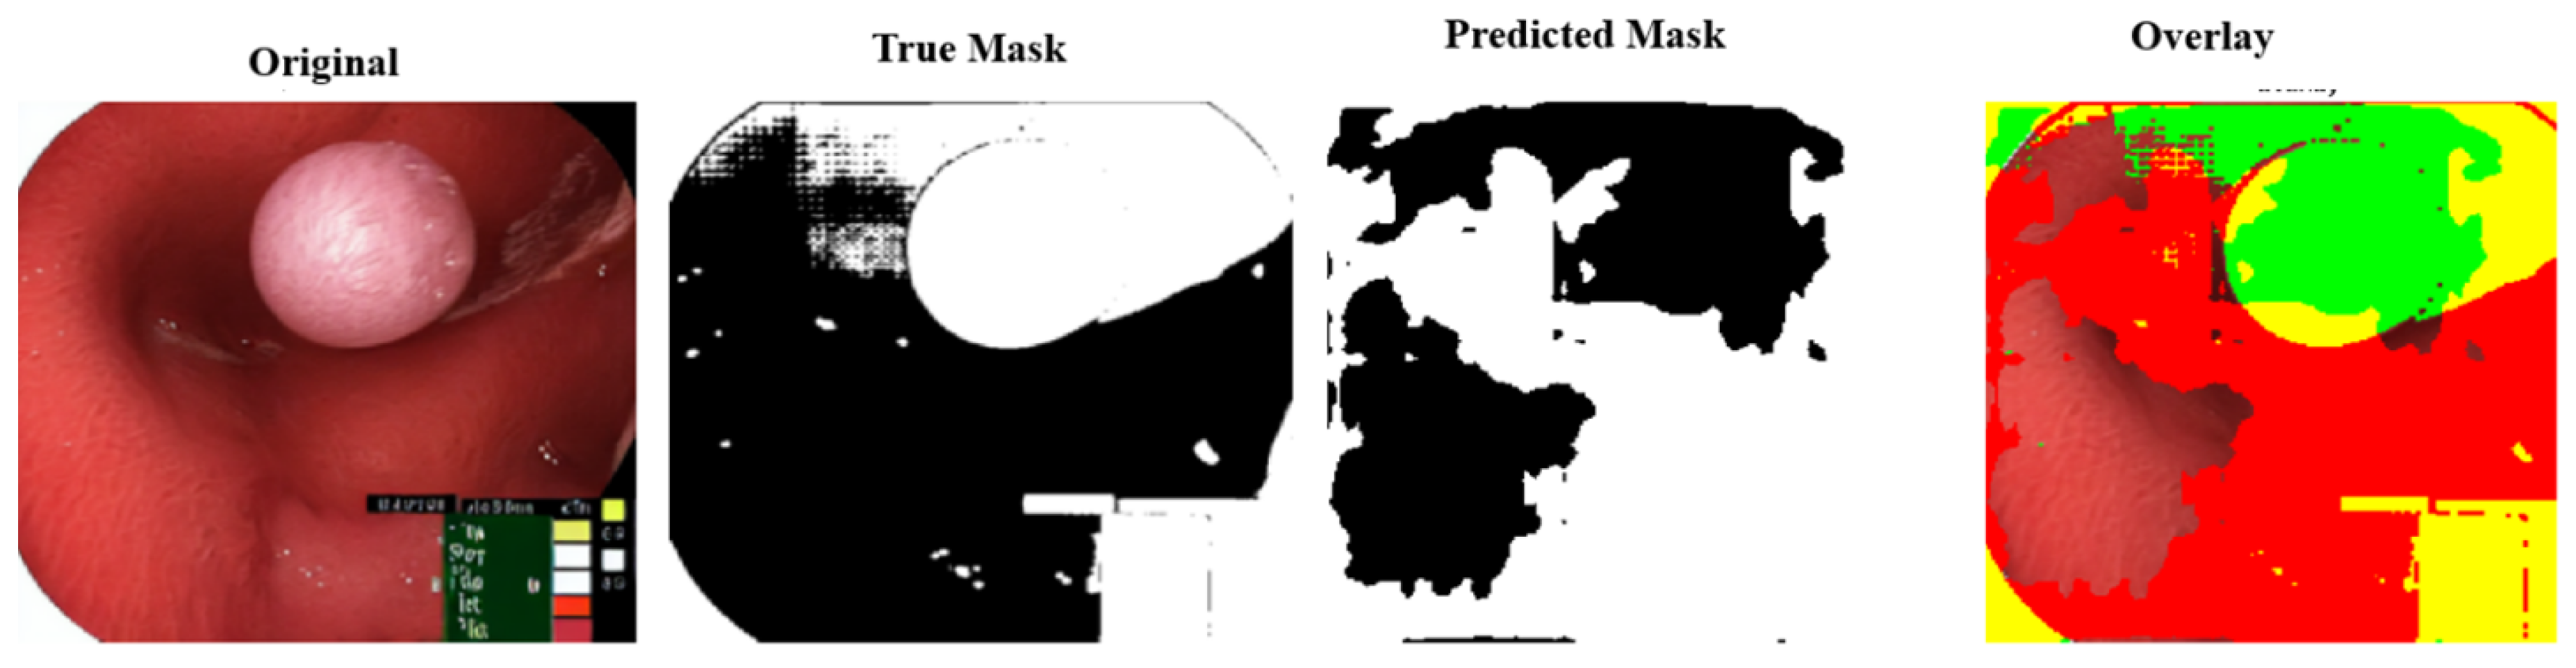
Figure 11.
Endoscopic views from a colonoscopy procedure showing various segments and mucosal patterns of the colon interior
Figure 11.
Endoscopic views from a colonoscopy procedure showing various segments and mucosal patterns of the colon interior
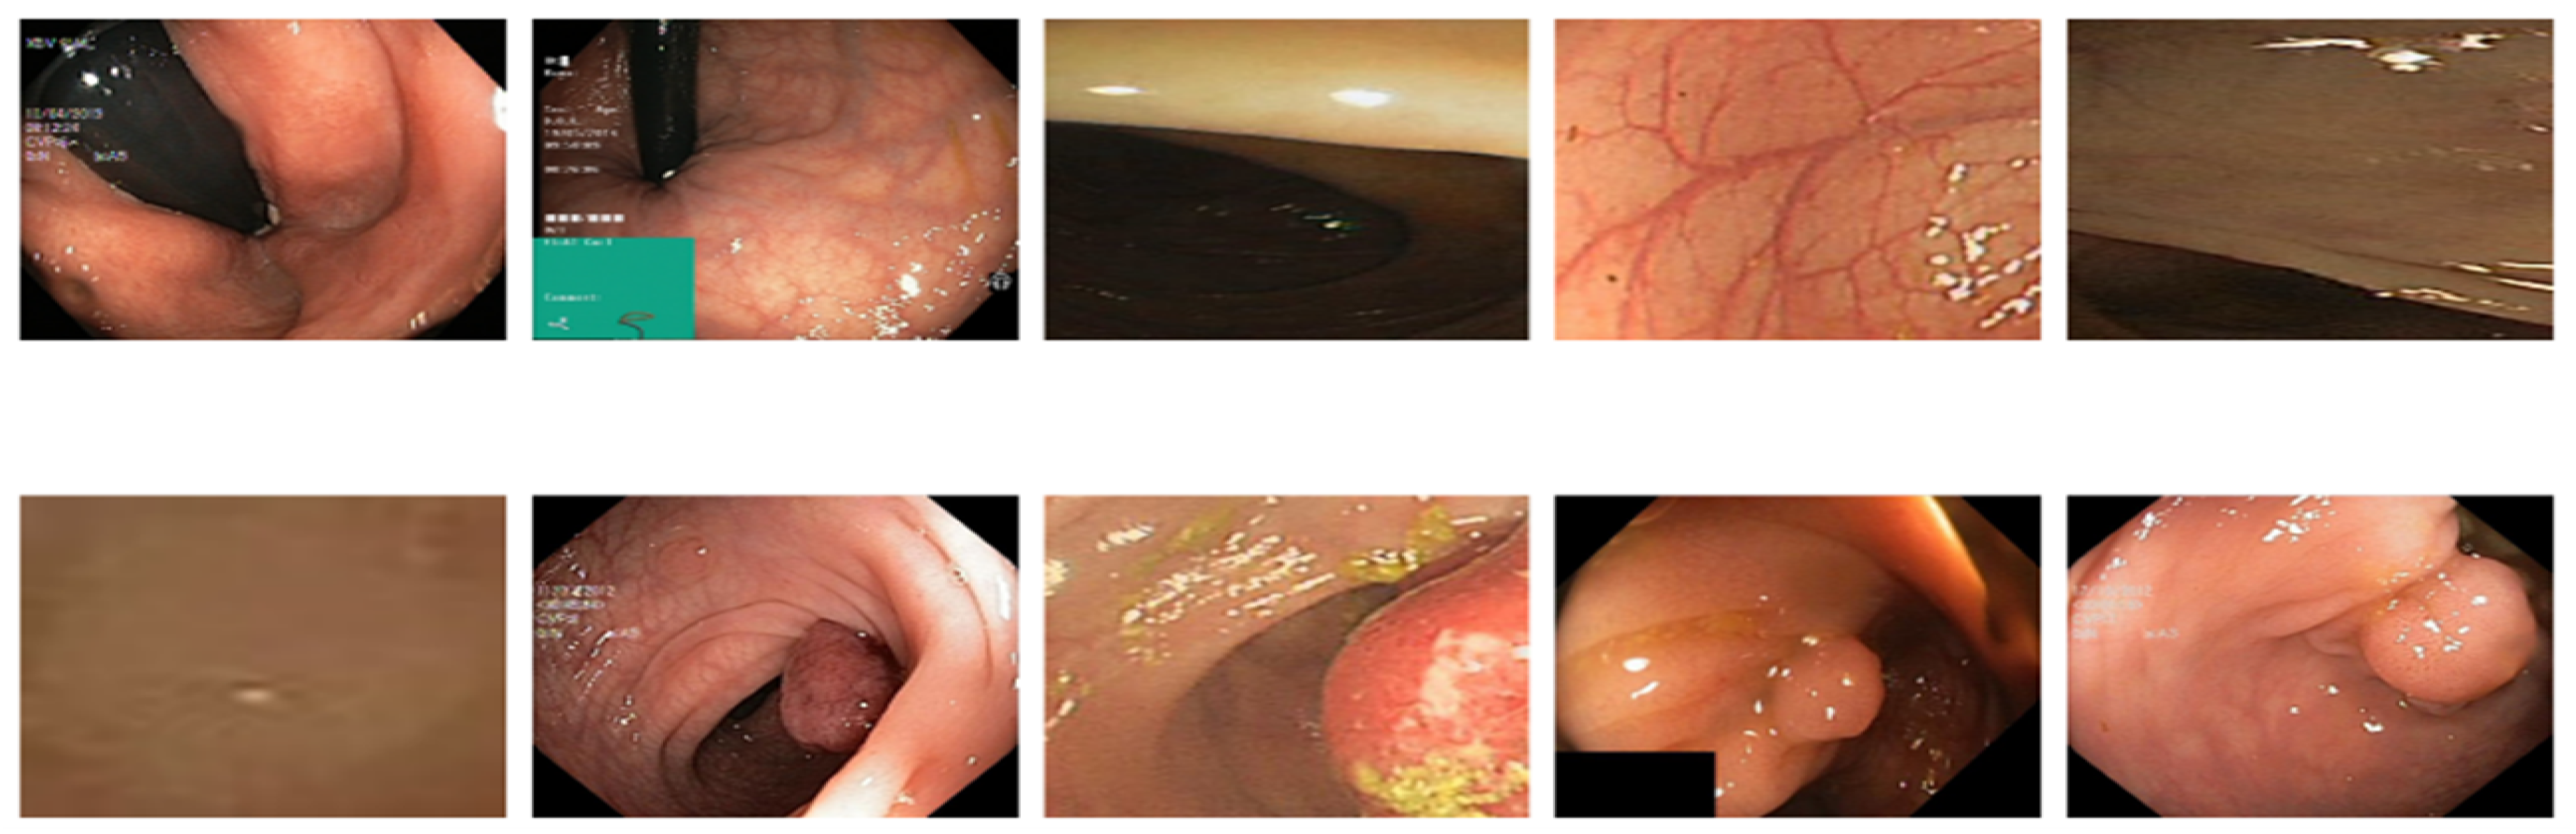
Figure 12.
Performance comparison of deep learning and transformer based models across multiple evaluation metrics, showing EfficientNet achieving superior performance across all measures on the original image dataset
Figure 12.
Performance comparison of deep learning and transformer based models across multiple evaluation metrics, showing EfficientNet achieving superior performance across all measures on the original image dataset
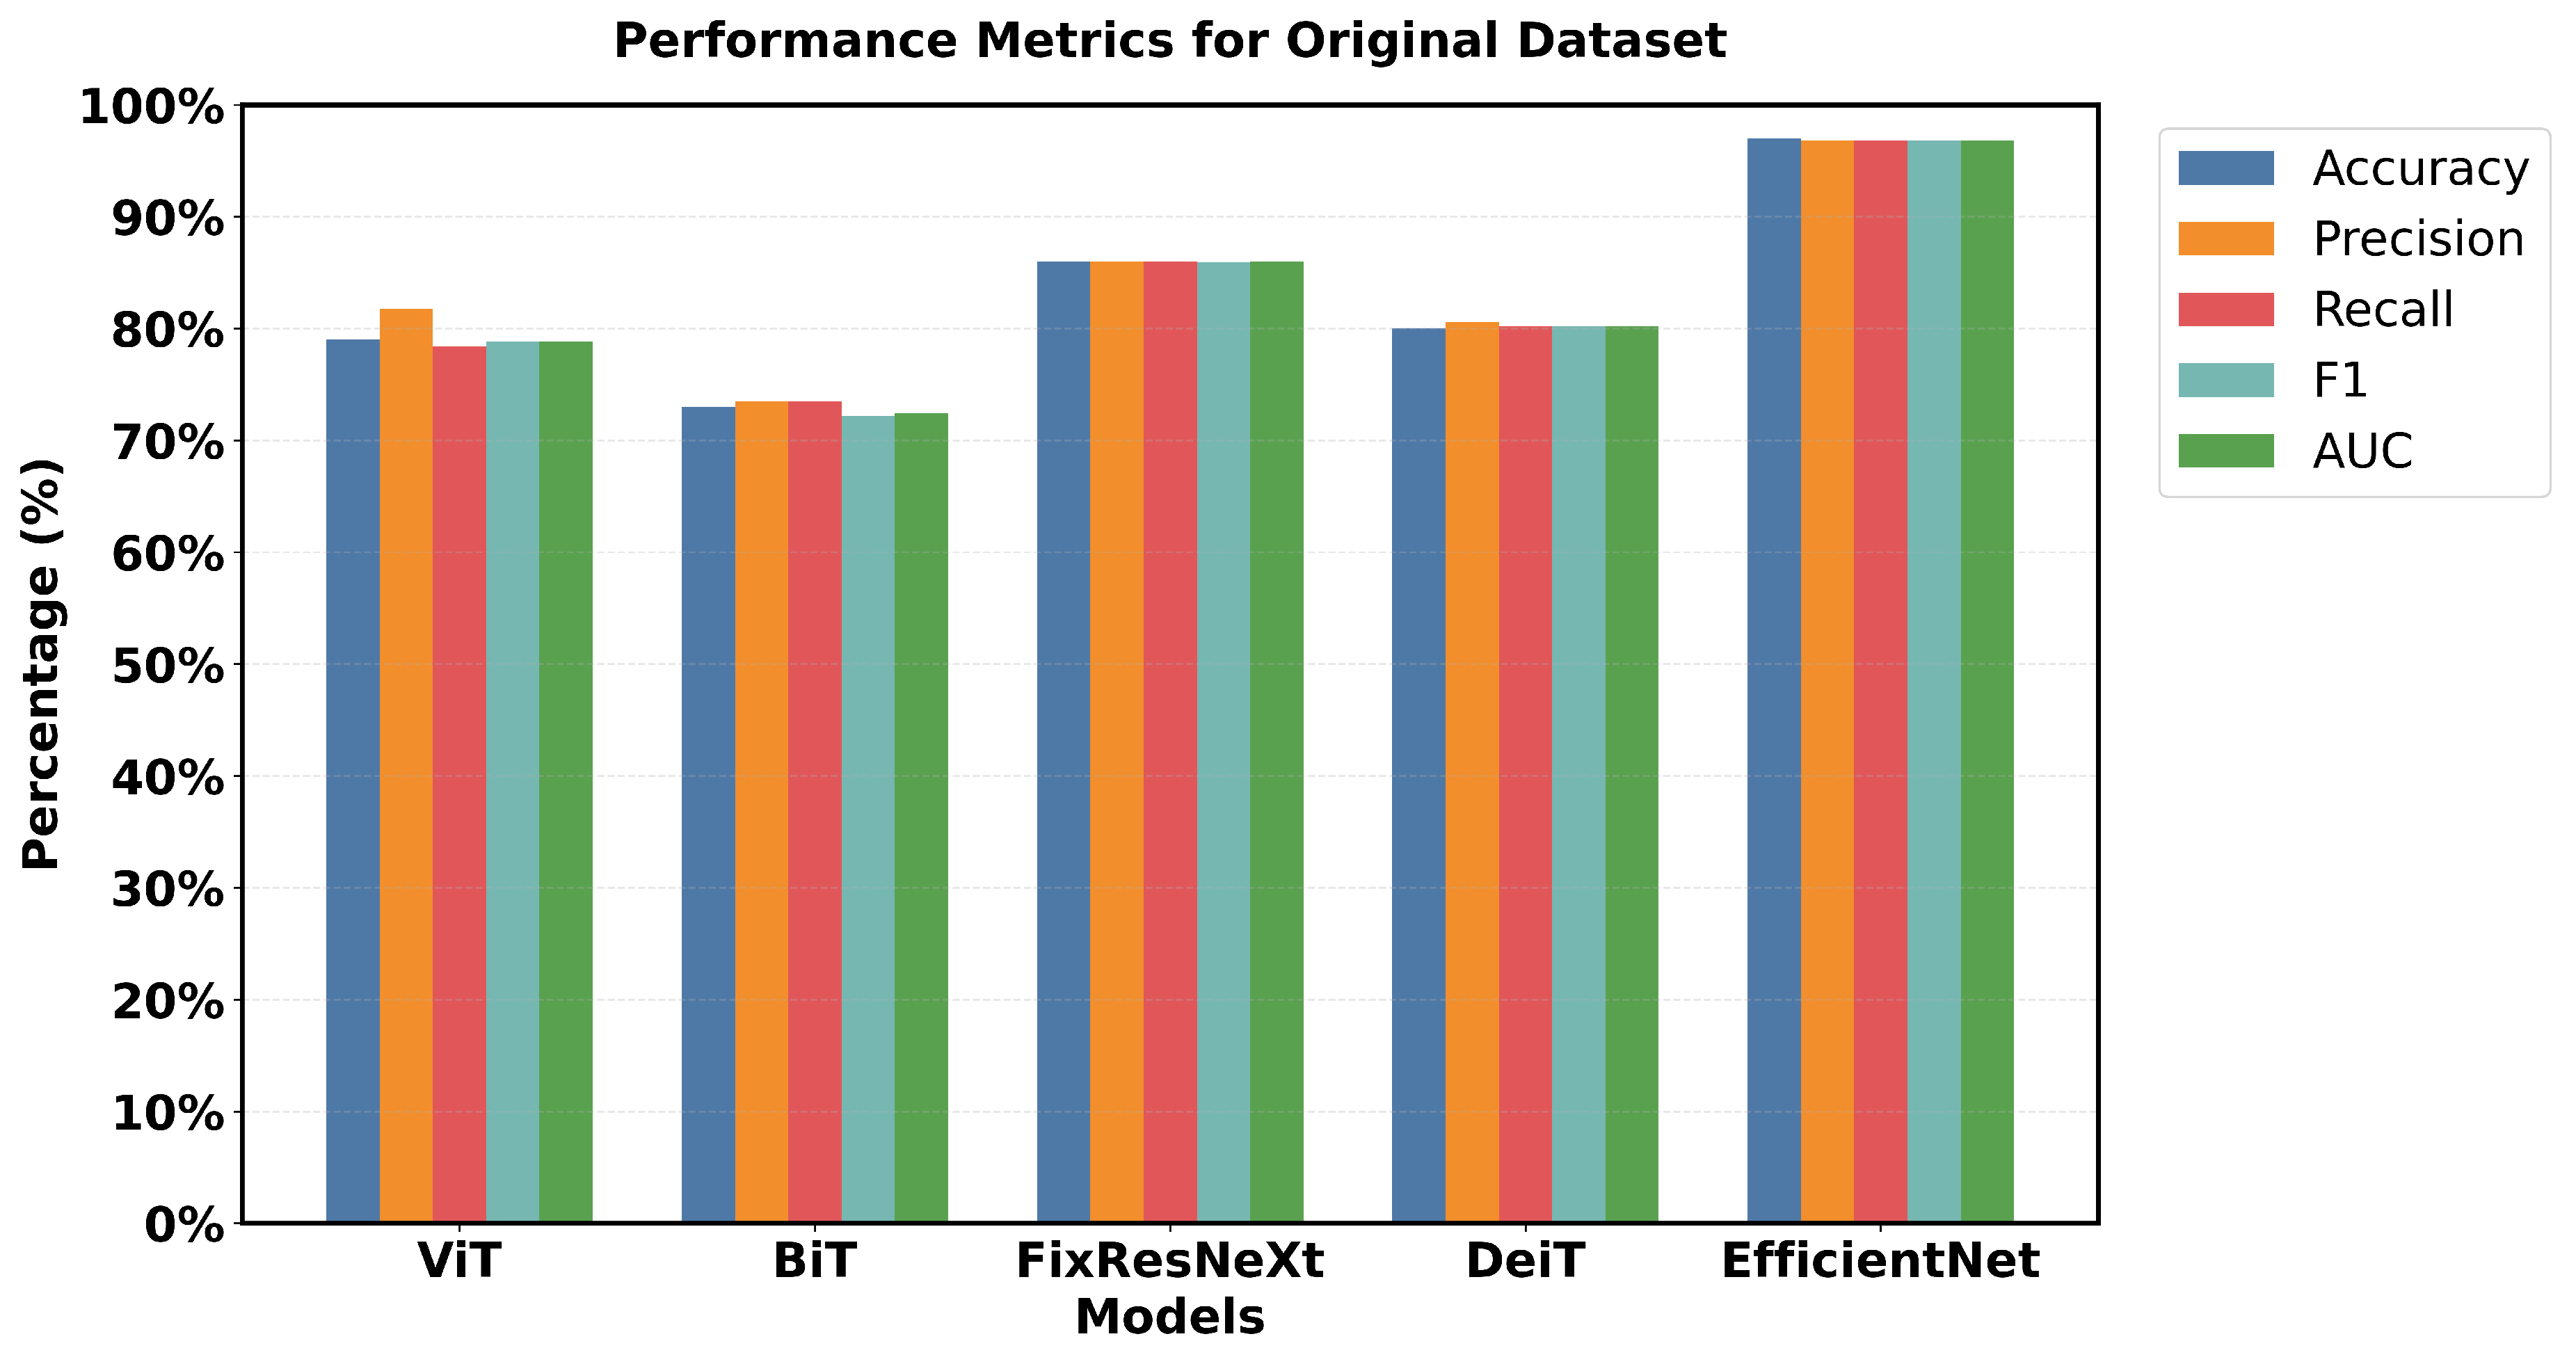
Figure 13.
Synthetic endoscopic images generated to simulate various views and conditions encountered during medical endoscopy procedures
Figure 13.
Synthetic endoscopic images generated to simulate various views and conditions encountered during medical endoscopy procedures
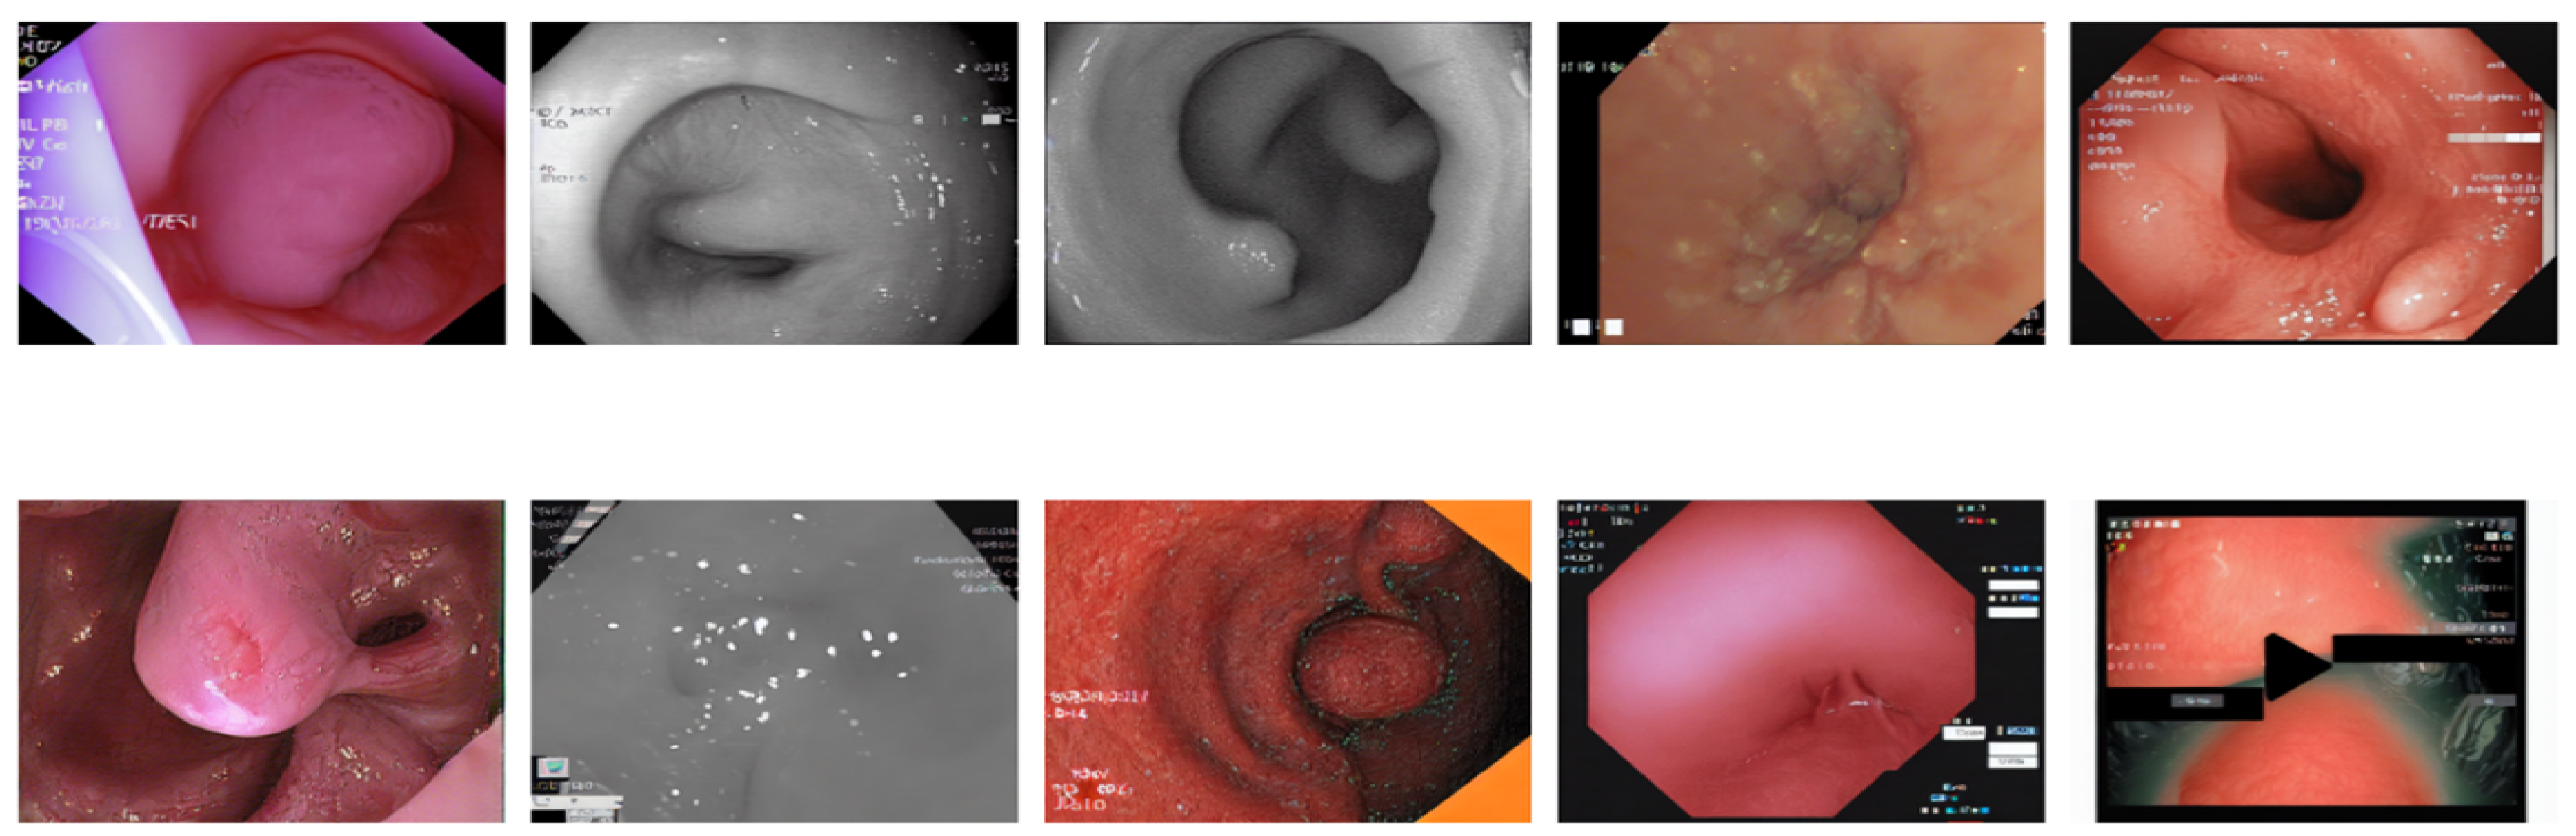
Figure 14.
Performance evaluation of five deep learning and transformer based models on AI generated colonoscopy data, demonstrating generally lower but more consistent performance across models compared to original data, with EfficientNet maintaining superior accuracy but showing more metric variation
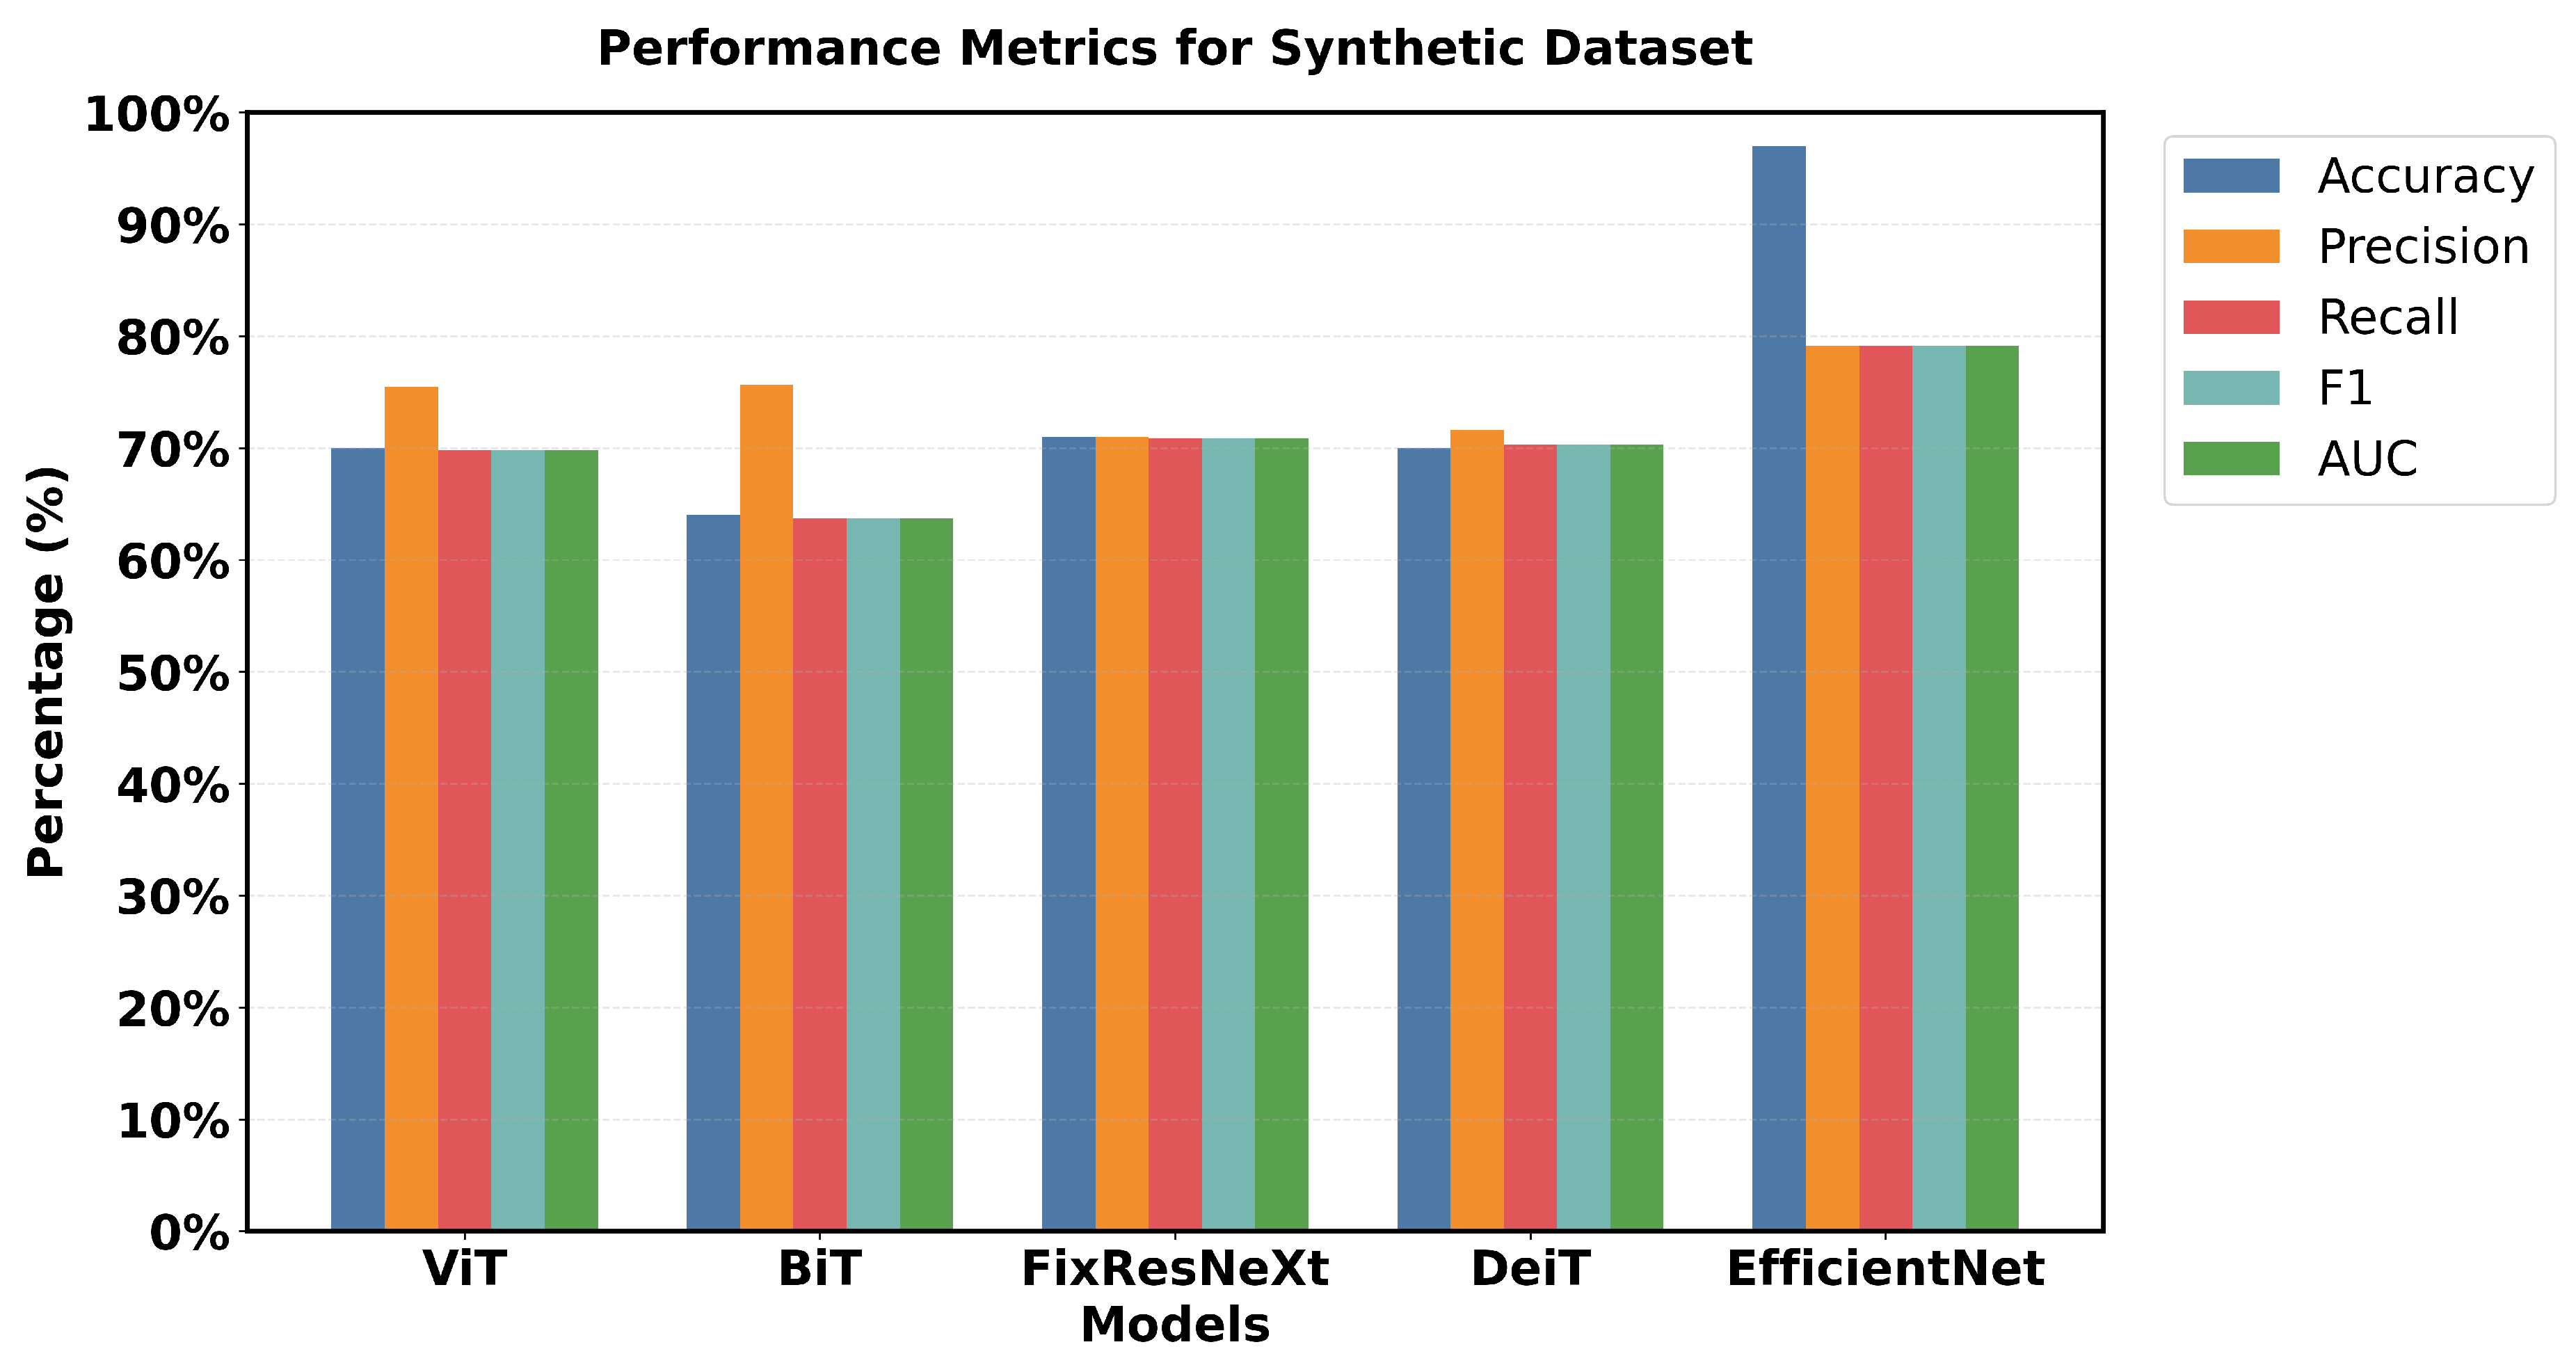
Figure 15.
Combined dataset of real and synthetically generated endoscopic images, demonstrating the visual similarity between actual endoscopic findings and artificially generated medical imaging data
Figure 15.
Combined dataset of real and synthetically generated endoscopic images, demonstrating the visual similarity between actual endoscopic findings and artificially generated medical imaging data
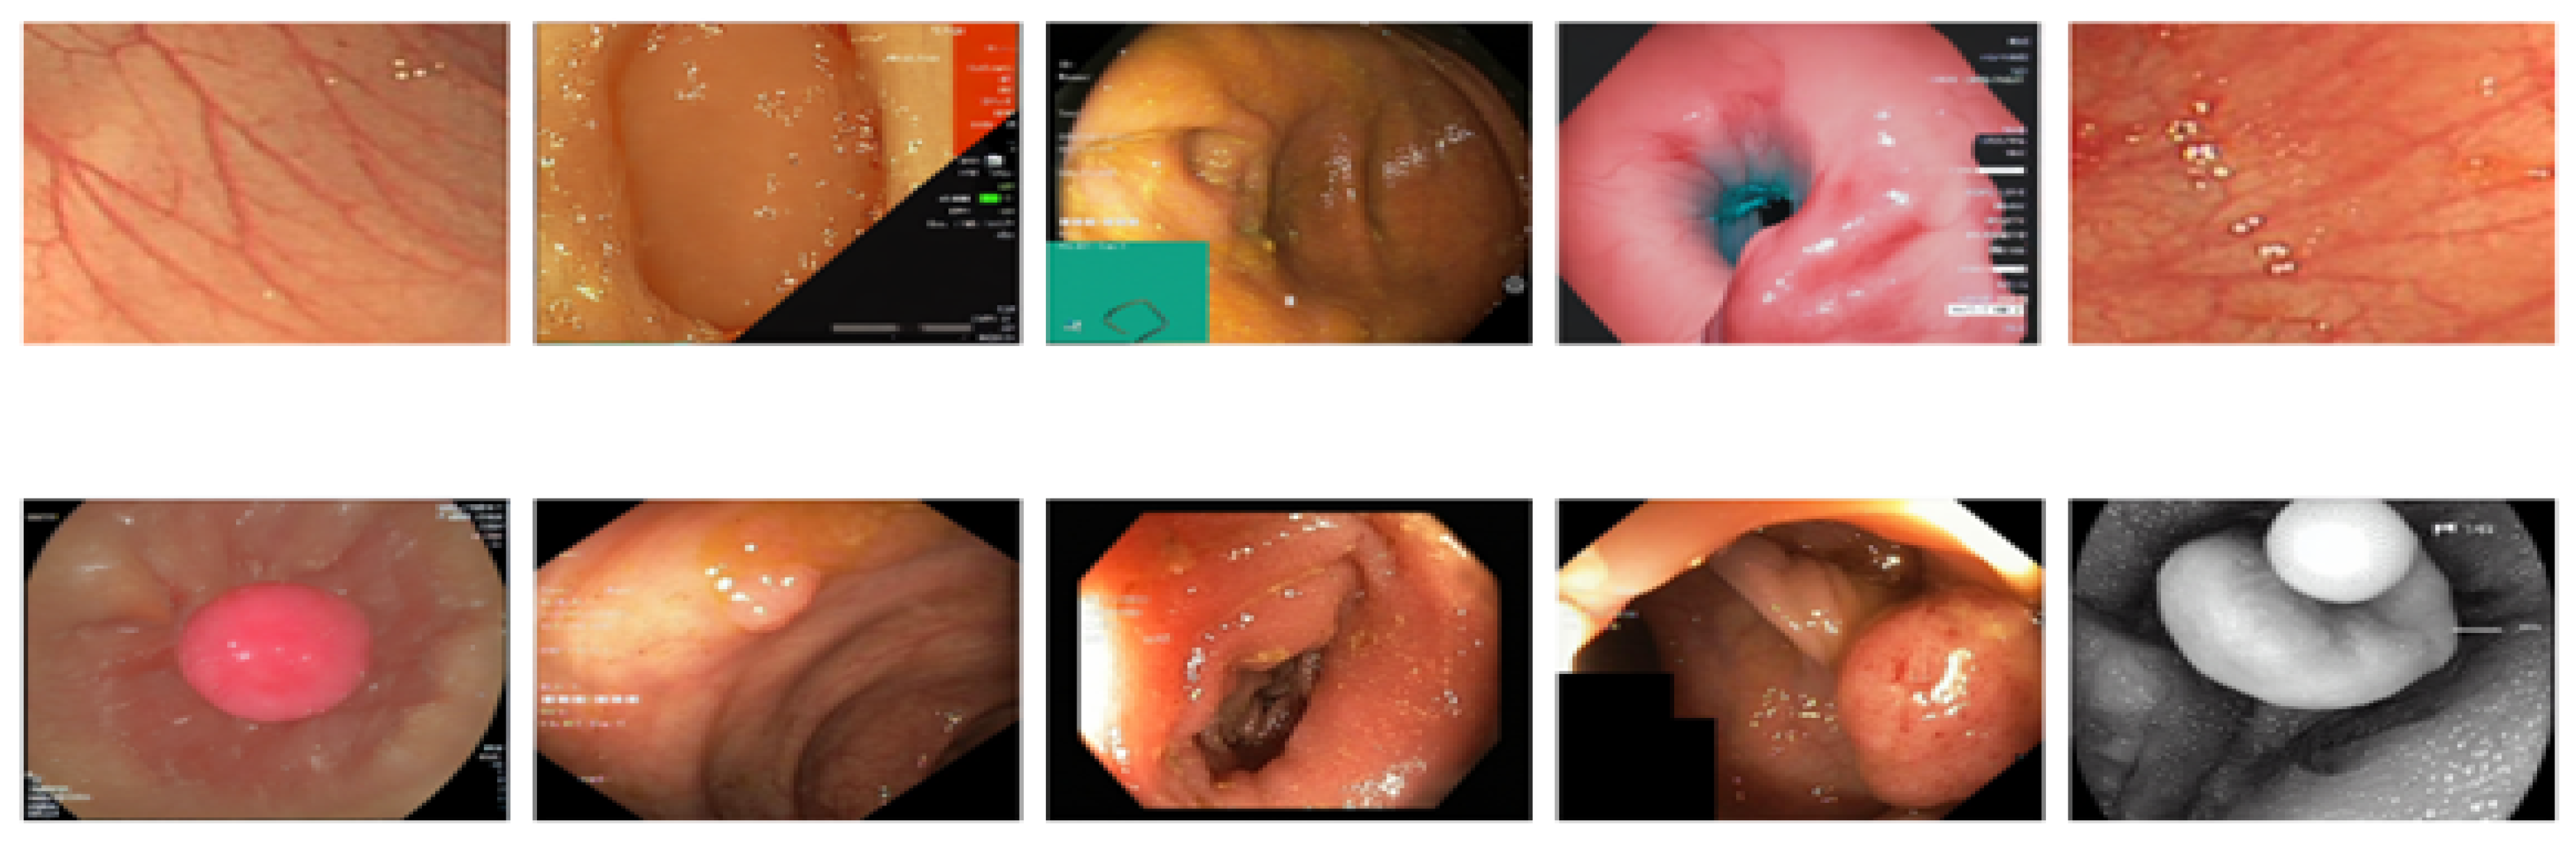
Figure 16.
Performance evaluation of deep learning models on an augmented endoscopic dataset, showing substantially improved and more uniform performance across all models and metrics compared to both original and synthetic datasets, with most models achieving approximately 90% across all evaluation measures
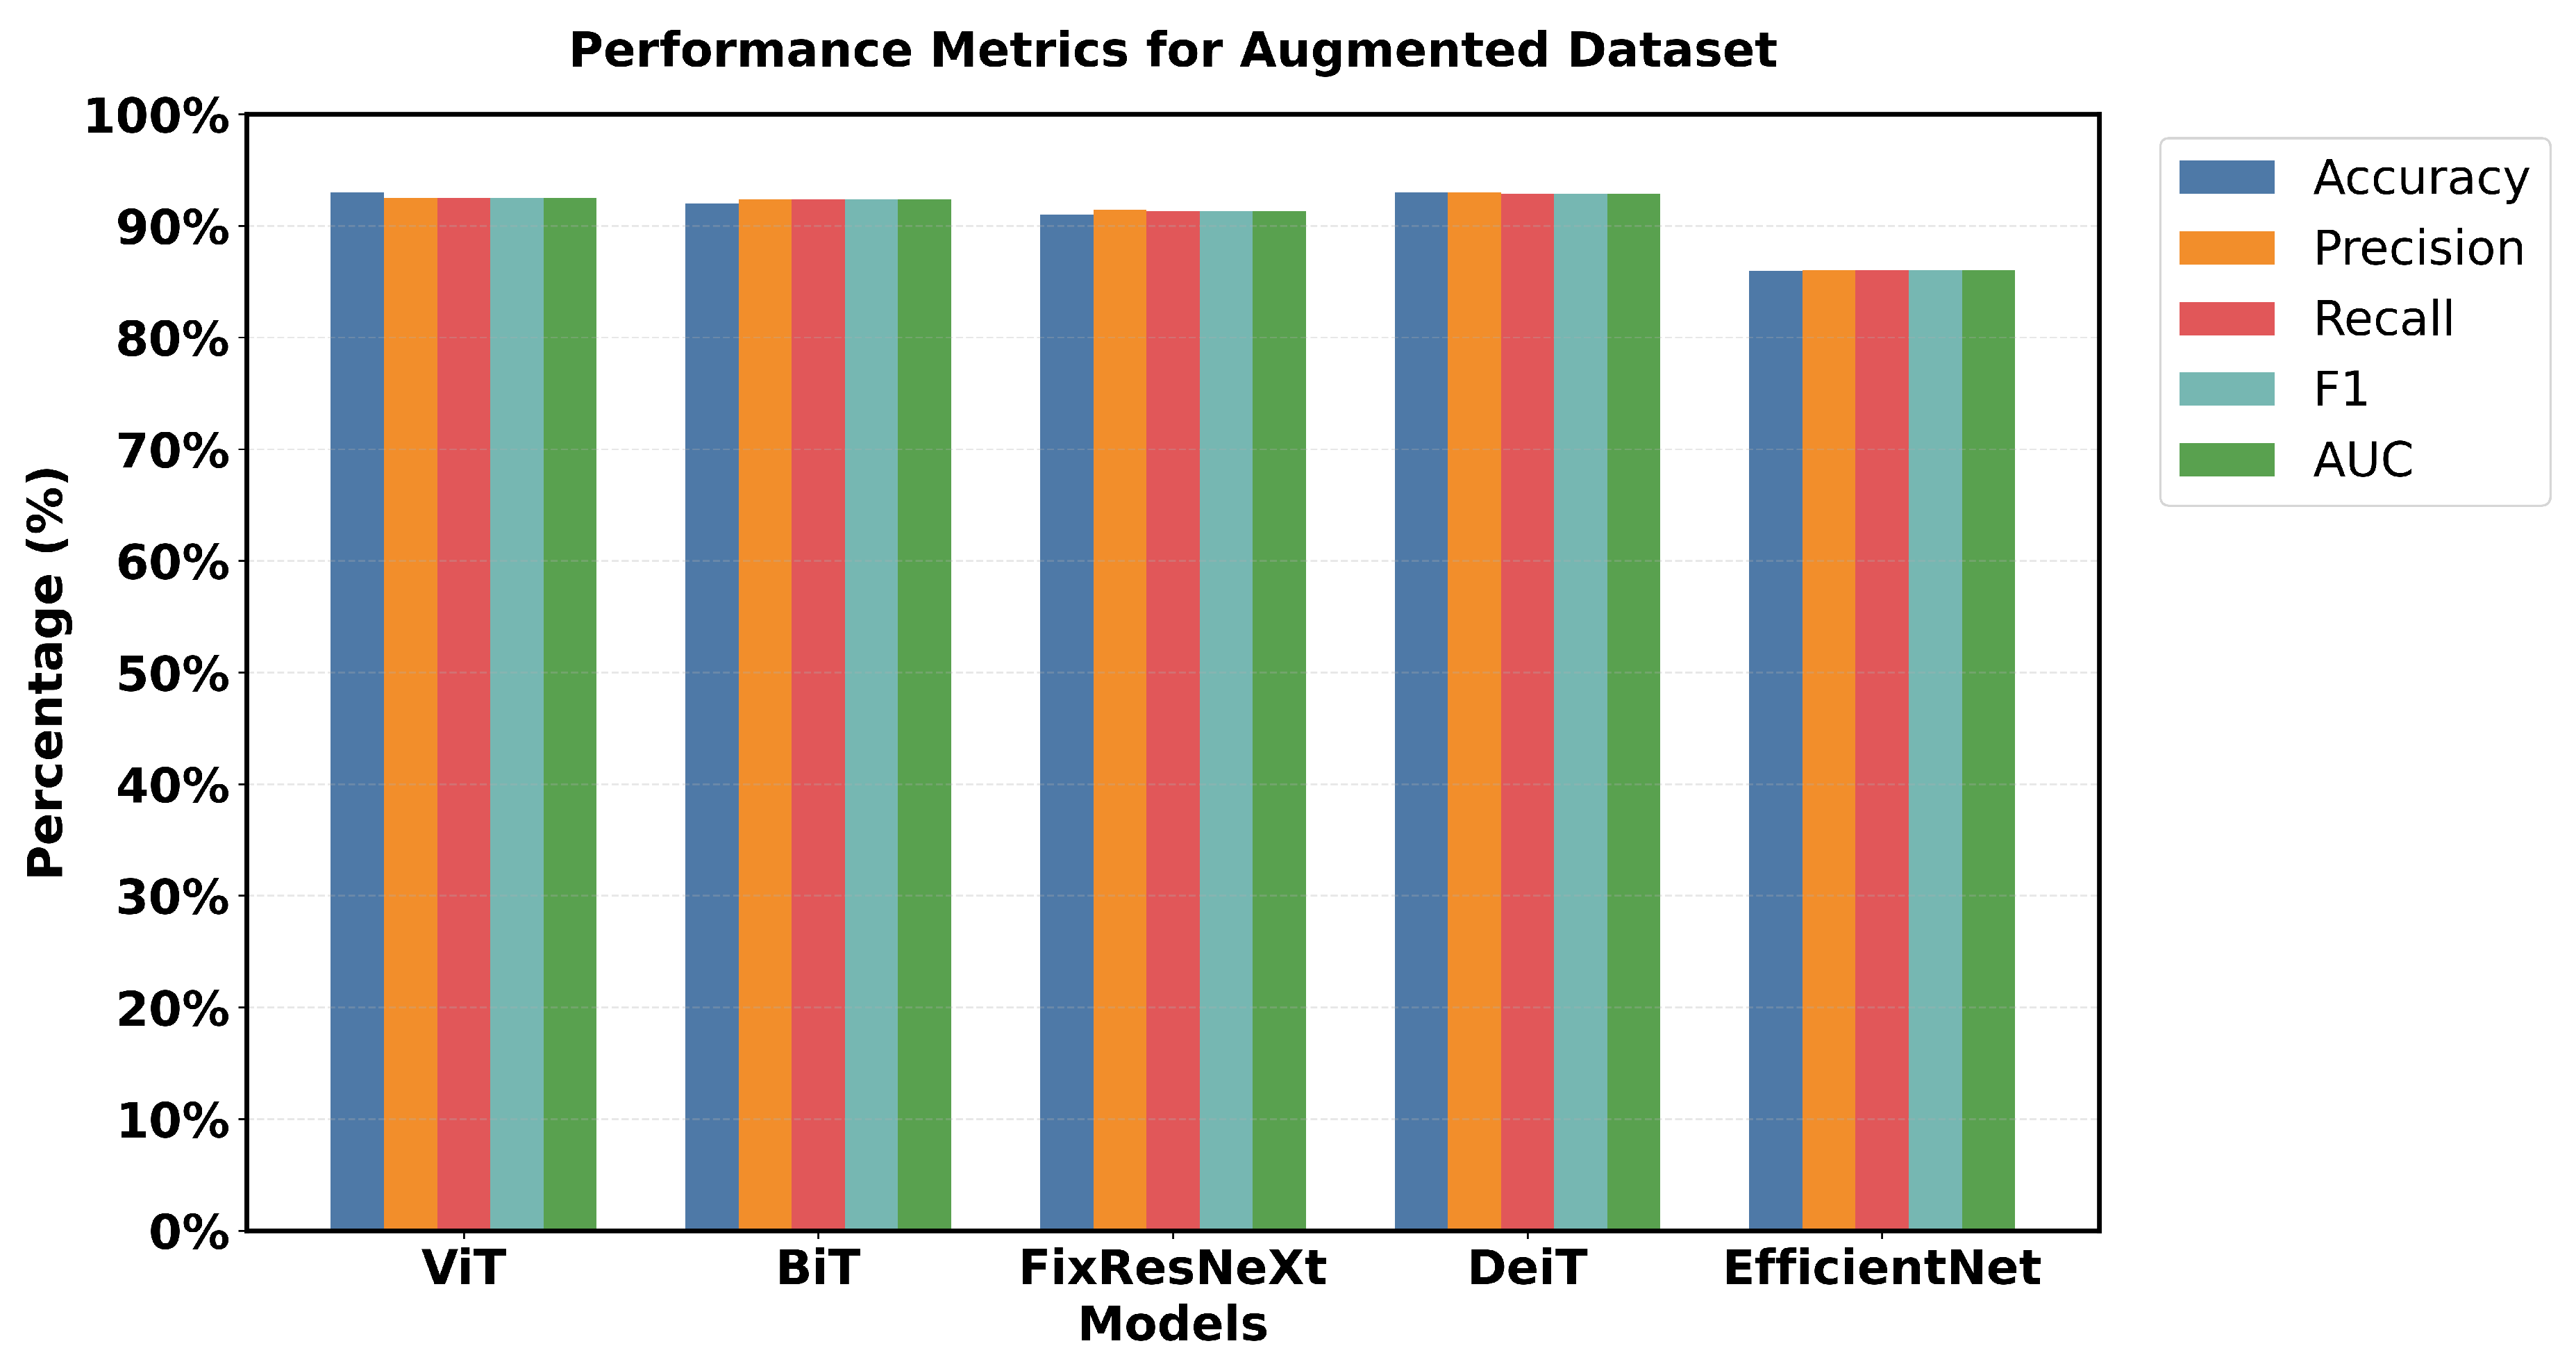
Figure 17.
Validated accuracy comparison across the 3 datasets
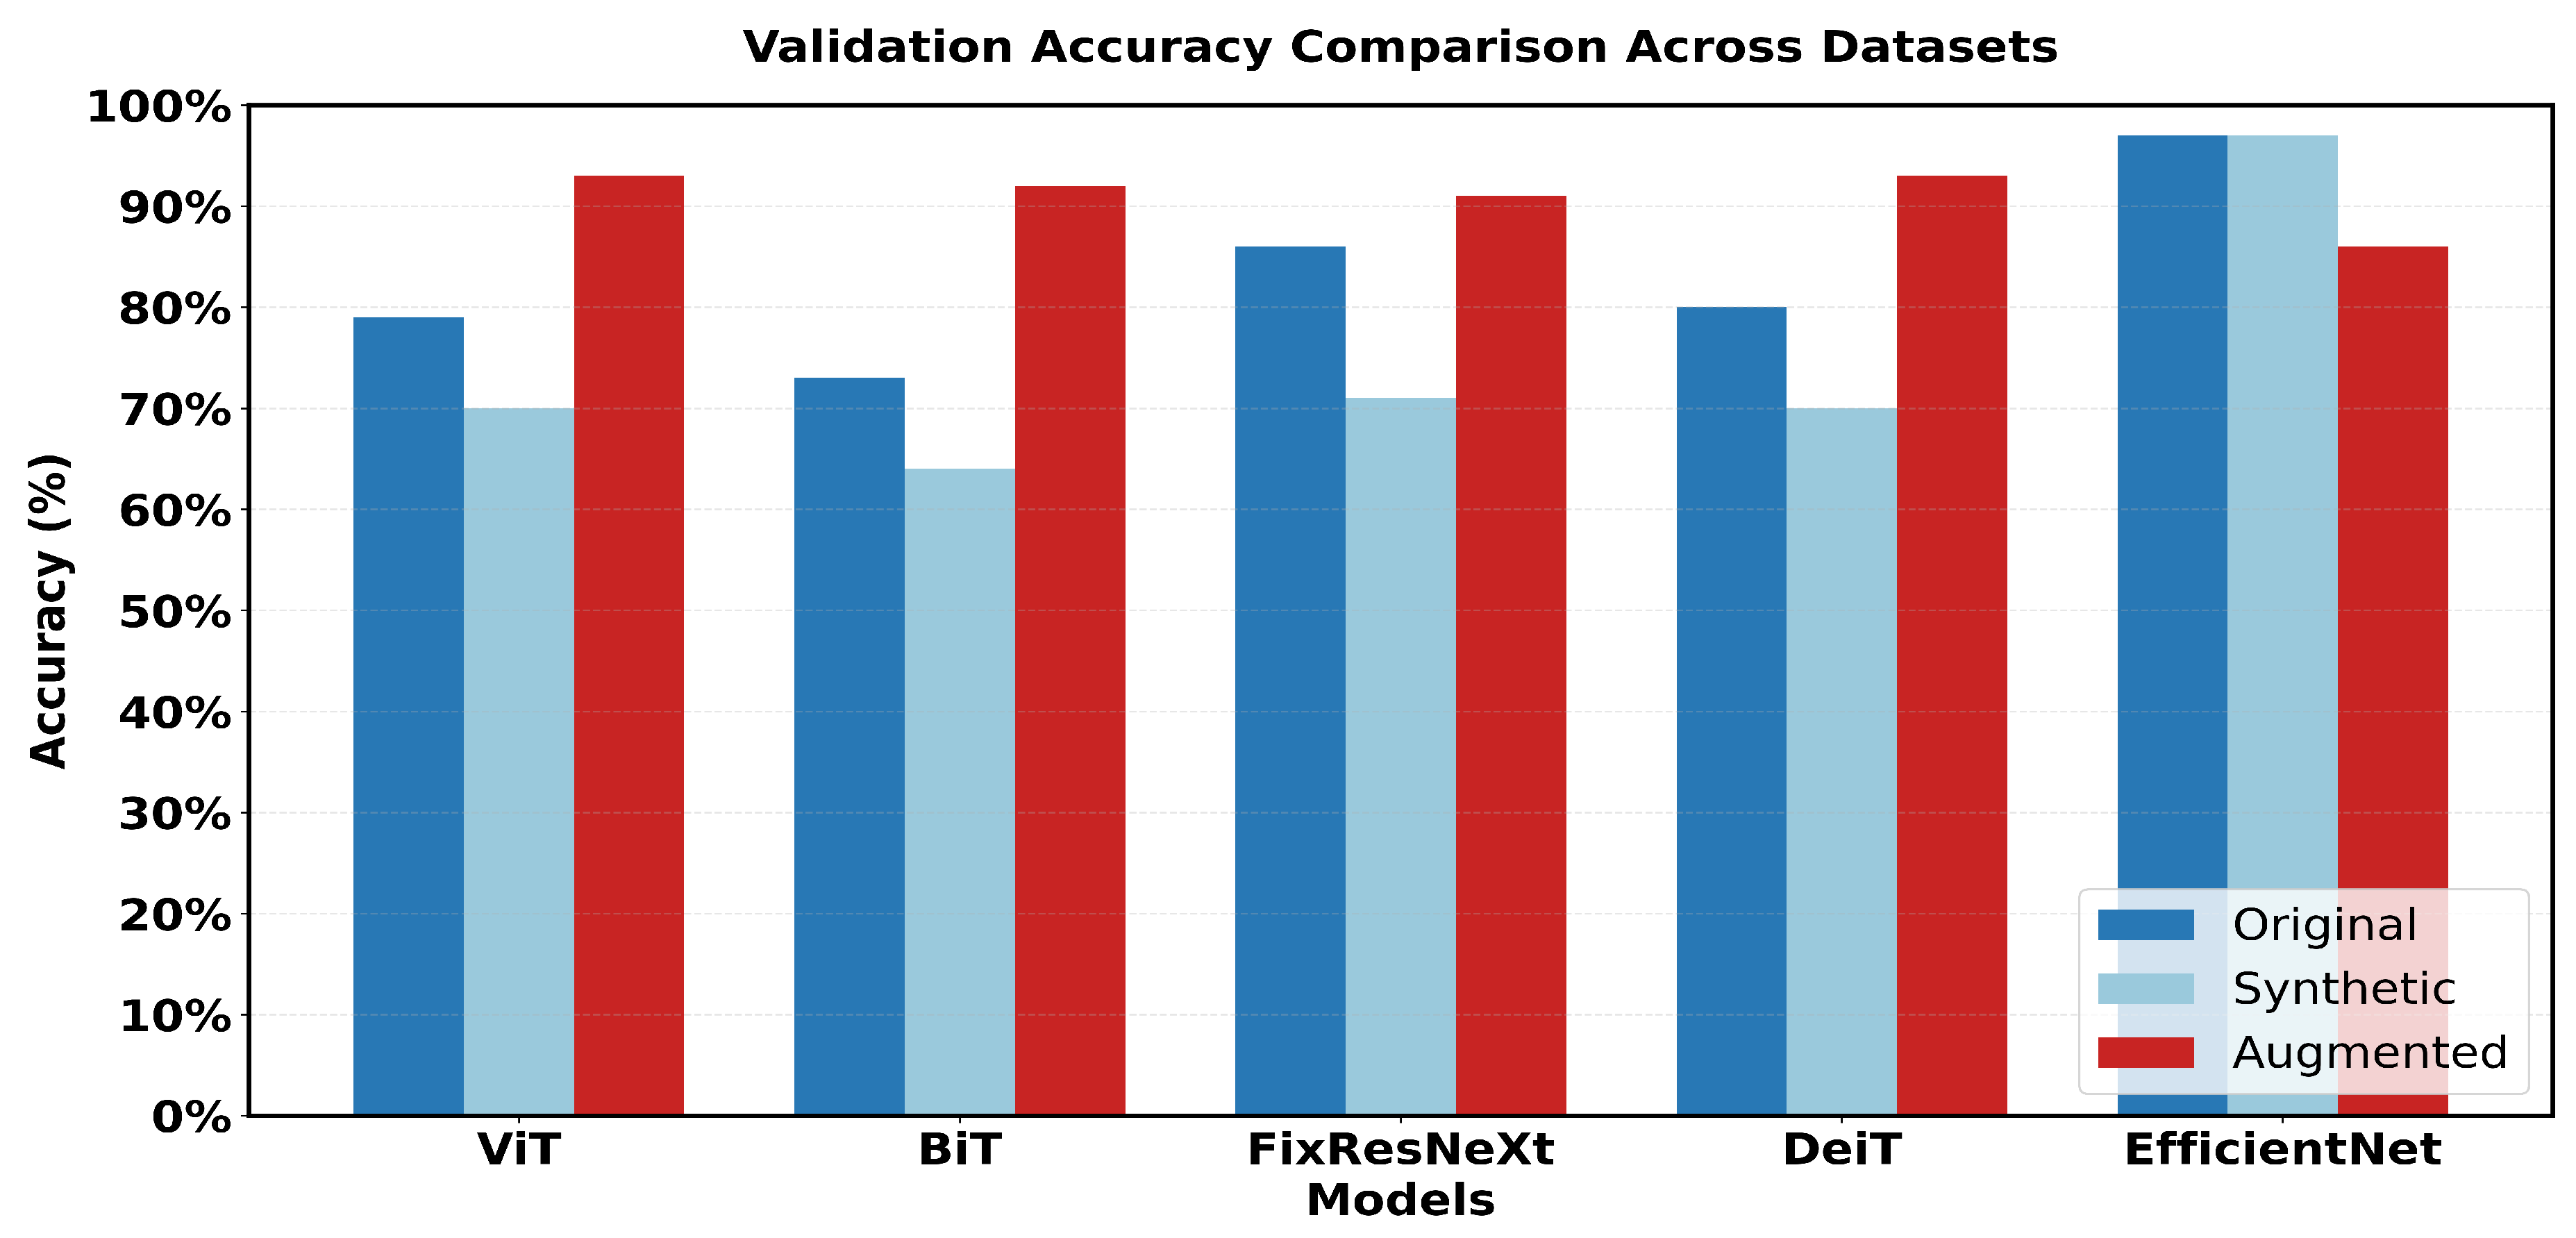
Figure 18.
Validated accuracy comparison across the 3 datasets
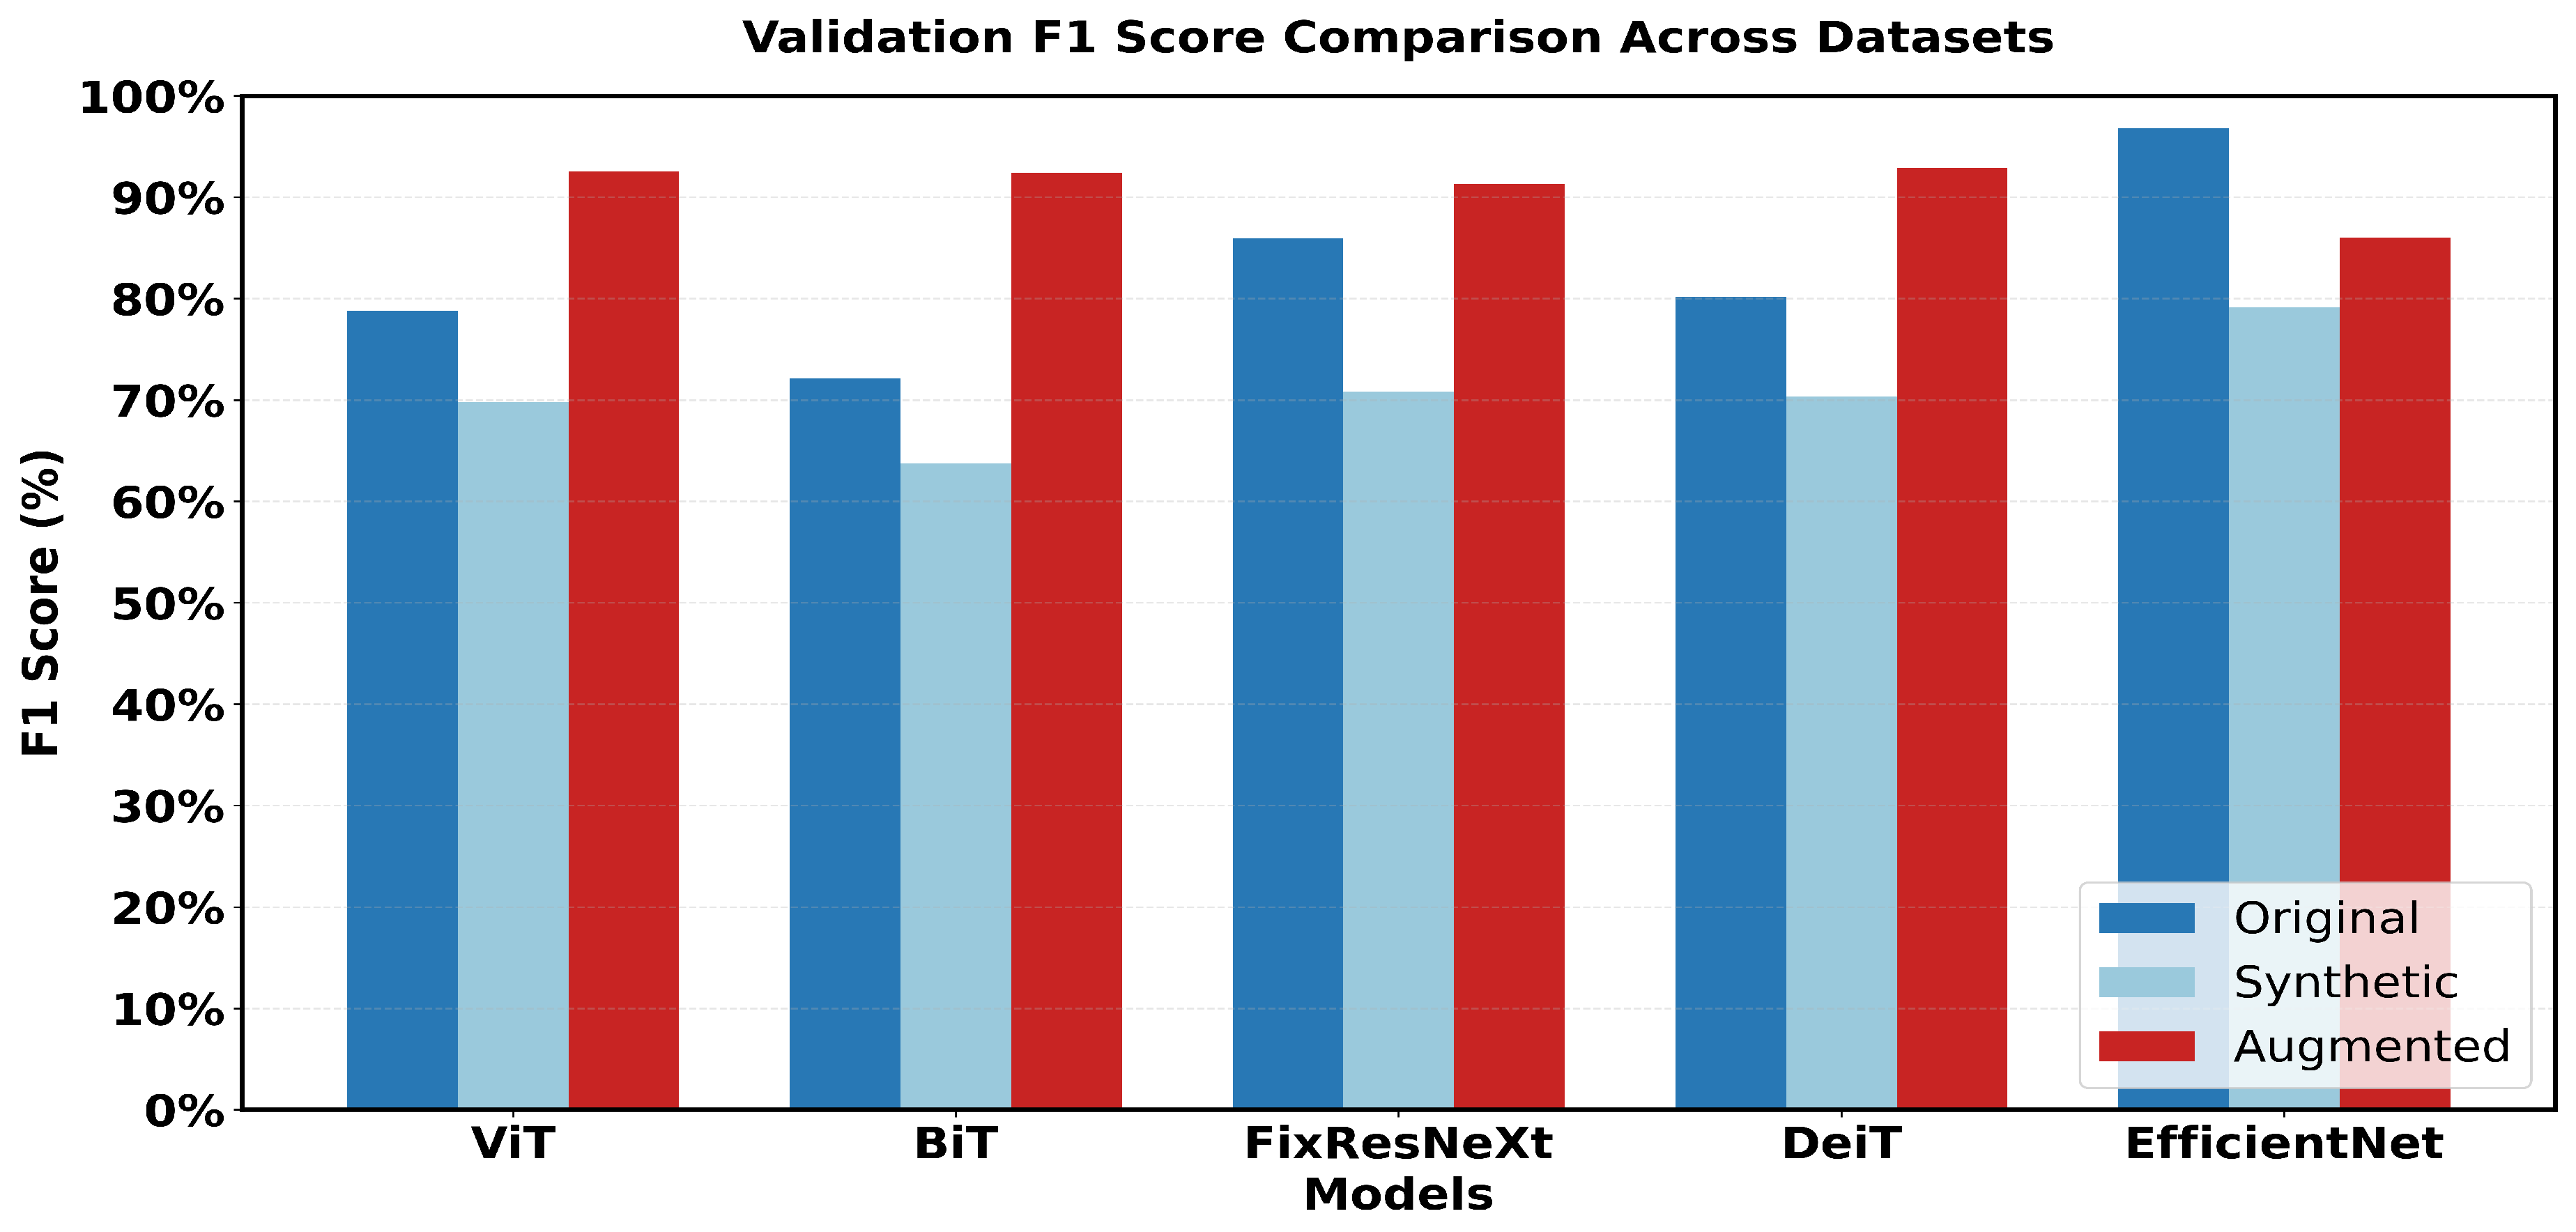

Table 1.
Performance comparison of different models across datasets. The evaluation metrics include FID scores (lower is better) and Inception Score (IS) measurements including average (avg), standard deviation (std), and median (med) values.
Table 1.
Performance comparison of different models across datasets. The evaluation metrics include FID scores (lower is better) and Inception Score (IS) measurements including average (avg), standard deviation (std), and median (med) values.
| Dataset | Model | FID | IS avg | IS std | IS med |
|---|---|---|---|---|---|
| single | CLIP | 0.11 | 1.57 | 0.03 | 1.56 |
| multi | CLIP | 0.11 | 1.57 | 0.03 | 1.56 |
| both | CLIP | 0.12 | 1.57 | 0.03 | 1.56 |
| single | SD | 0.06 | 2.33 | 0.07 | 2.34 |
| multi | SD | 0.06 | 2.33 | 0.07 | 2.34 |
| both | SD | 0.07 | 2.33 | 0.07 | 2.34 |
| single | DB+LoRa | 0.11 | 2.36 | 0.05 | 2.36 |
| multi | DB+LoRa | 0.07 | 2.36 | 0.05 | 2.36 |
| both | DB+LoRa | 0.08 | 2.36 | 0.05 | 2.36 |
Table 2.
Detailed Inception Score evaluation across different groups (G1-G10) for each model and dataset combination. Groups represent different aspects of image quality assessment, showing model consistency across evaluation dimensions.
Table 2.
Detailed Inception Score evaluation across different groups (G1-G10) for each model and dataset combination. Groups represent different aspects of image quality assessment, showing model consistency across evaluation dimensions.
| Dataset | Model | G1 | G2 | G3 | G4 | G5 | G6 | G7 | G8 | G9 | G10 |
|---|---|---|---|---|---|---|---|---|---|---|---|
| single | CLIP | 1.56 | 1.55 | 1.55 | 1.57 | 1.55 | 1.55 | 1.54 | 1.54 | 1.56 | 1.51 |
| multi | CLIP | 1.56 | 1.55 | 1.55 | 1.57 | 1.55 | 1.55 | 1.54 | 1.54 | 1.56 | 1.51 |
| both | CLIP | 1.56 | 1.55 | 1.55 | 1.57 | 1.55 | 1.55 | 1.54 | 1.54 | 1.56 | 1.51 |
| single | SD | 2.37 | 2.40 | 2.40 | 2.39 | 2.24 | 2.26 | 2.31 | 2.22 | 2.25 | 2.77 |
| multi | SD | 2.37 | 2.40 | 2.40 | 2.39 | 2.24 | 2.26 | 2.31 | 2.22 | 2.25 | 2.77 |
| both | SD | 2.37 | 2.40 | 2.40 | 2.39 | 2.24 | 2.26 | 2.31 | 2.22 | 2.25 | 2.77 |
| single | DB+LoRa | 2.35 | 2.27 | 2.39 | 2.41 | 2.31 | 2.33 | 2.34 | 2.36 | 2.46 | 2.38 |
| multi | DB+LoRa | 2.35 | 2.27 | 2.39 | 2.41 | 2.31 | 2.33 | 2.34 | 2.36 | 2.46 | 2.38 |
| both | DB+LoRa | 2.35 | 2.27 | 2.39 | 2.41 | 2.31 | 2.33 | 2.34 | 2.36 | 2.46 | 2.38 |
Table 3.
Comprehensive performance evaluation of segmentation models with results demonstrating varying capabilities across different architectures with FPN achieving superior performance in most metrics.
Table 3.
Comprehensive performance evaluation of segmentation models with results demonstrating varying capabilities across different architectures with FPN achieving superior performance in most metrics.
| Model | IoU | F1 Score | Precision | Recall | PSNR | SSIM | Dice Coef. |
|---|---|---|---|---|---|---|---|
| UNet [49] | 0.4253 | 0.5599 | 0.7208 | 0.5300 | 382.8118 | 1.0000 | 0.5599 |
| PSPNet [50] | 0.2212 | 0.3451 | 0.7048 | 0.3053 | 381.5486 | 1.0000 | 0.3451 |
| FPN [51] | 0.6373 | 0.7238 | 0.7143 | 0.8716 | 385.8368 | 1.0000 | 0.7238 |
| LinkNet [52] | 0.1863 | 0.3095 | 0.7123 | 0.2359 | 381.7352 | 1.0000 | 0.3095 |
| MANet [53] | 0.0775 | 0.1406 | 0.7359 | 0.0842 | 381.9626 | 1.0000 | 0.1406 |
Disclaimer/Publisher’s Note: The statements, opinions and data contained in all publications are solely those of the individual author(s) and contributor(s) and not of MDPI and/or the editor(s). MDPI and/or the editor(s) disclaim responsibility for any injury to people or property resulting from any ideas, methods, instructions or products referred to in the content. |
© 2025 by the authors. Licensee MDPI, Basel, Switzerland. This article is an open access article distributed under the terms and conditions of the Creative Commons Attribution (CC BY) license (http://creativecommons.org/licenses/by/4.0/).
Copyright: This open access article is published under a Creative Commons CC BY 4.0 license, which permit the free download, distribution, and reuse, provided that the author and preprint are cited in any reuse.


