
Submitted:
23 October 2025
Posted:
24 October 2025
You are already at the latest version
Abstract
Rapidly growing medical imaging volumes have led to an increasing workload for radiologists, creating the need for automated tools that can support interpretation and reduce reporting delays. Vision-language models (VLMs) can generate clinically relevant captions to accelerate report drafting, but their varying parameter scales require evaluation for clinical utility. This study evaluated fine-tuned VLMs on the Radiology Objects in Context version 2 (ROCOv2) dataset containing 116,635 images across multiple modalities. We compared four Large VLMs (LVLMs) (LLaVA-Mistral-7B, LLaVA-Vicuna-7B, LLaVA-1.5-LLaMA-7B, IDEFICS-9B) against four Smaller VLMs (SVLMs) (MoonDream2, Qwen 2-VL, Qwen-2.5, SmolVLM) alongside two fully fine-tuned baseline architectures (VisionGPT2 and CNN-Transformer). Low-Rank Adaptation (LoRA), applied to fewer than 1% of selected model parameters, proved the optimal performance among adaptation strategies, outperforming broader LoRA configurations that we evaluated. LLaVA-Mistral-7B achieved the highest performance (Relevance: 0.516, Factuality: 0.118), substantially exceeding VisionGPT2 baseline (0.325, 0.028). Among SVLMs, MoonDream2 reached a relevance score of 0.466, surpassing LLaVA-1.5 (0.462) despite using approximately 74% fewer parameters. Models showed distinct performance hierarchy with LVLMs (0.273–0.317 overall), SVLMs (0.188–0.279), and baselines (0.154–0.177). To investigate performance enhancement strategies, we prepended ResNet-50-predicted image modality labels at inference time for underperforming SVLMs. This intervention produced variable results, with SmolVLM showing marginal improvement, Qwen-2.5 gaining 6.4%, but Qwen 2-VL experiencing a 21.6% performance reduction. Our results provide quantitative guidance for VLM selection in medical imaging. Although model size strongly influences performance, the findings indicate that architectural design and lightweight adaptation can enable select small models to achieve viable performance for resource-constrained screening scenarios.
Keywords:
vision-language models
; medical image captioning
; radiology report generation
; low-rank adaptation
; clinical AI caption quality
; prompt injection
; CNN-Transformer
1. Introduction
Radiology occupies a central role in contemporary healthcare, serving as a fundamental tool in the diagnosis, treatment planning, and monitoring of a myriad of diseases [1]. Despite its importance, the field is facing an imbalance between the demand for imaging diagnosis and the supply of radiologists. The number of diagnostic studies has exploded exponentially over the past decade while the radiologist workforce remains nearly stagnant, resulting in substantially increased workload per radiologist [2]. Furthermore, technological advances in medical imaging have led to examinations that generate hundreds of images per study, compounding the interpretation burden beyond what simple case numbers suggest [3]. Such heavy caseloads can translate into significant delays in report turnaround times with overburdened specialists struggling to keep pace with ever-expanding worklists [4]. Moreover, interpretation variability is an inherent challenge as different radiologists may provide differing descriptions or even miss findings under stress, leading to inconsistencies in diagnostic reports [5]. These workflow bottlenecks and potential discrepancies in reporting highlight a pressing need for automated tools that can generate preliminary image captions or draft reports, helping to reduce turnaround time and standardize diagnostic descriptions across practitioners [6]. In this context, automated radiology image captioning has emerged as an important research direction, aiming to have Artificial Intelligence (AI) systems produce clinically relevant descriptions of medical images that can assist radiologists and mitigate delays in care [7,8].
Recent advances in AI offer promising avenues to address these challenges. In particular, VLMs have shown remarkable capabilities in translating images into text by combining visual processing with natural language generation [9]. By integrating vision and language modalities, VLMs achieve a more holistic understanding of complex data and can perform sophisticated image captioning task. General-purpose VLMs like Large Language and Vision Assistants (LLaVA) [10], DeepMind’s Flamingo [11], and Contrastive Language–Image Pre-training (CLIP) [12] have demonstrated high performance on broad image–text benchmarks. Building on these successes, specialized medical VLMs are now emerging. For example, BioViL [13], Med-Flamingo [14], and RadFM [15] adapt multimodal pretraining to clinical data and have been shown to better capture the nuanced visual–textual patterns of medical imagery. Using knowledge from large-scale multimodal pre-training, VLMs can assist in detecting subtle abnormalities on imaging that might be difficult for the human eye to spot [16]. The appeal of VLM-based captioning in radiology is thus twofold: it could expedite the reporting process by automatically generating draft descriptions of findings, and it could provide more consistent, standardized captions that reduce subjective variability [17].
Importantly, VLMs today span a wide spectrum of model sizes and complexities [18]. On one end are large-scale VLMs with many billions of parameters (for instance, while the original IDEFICS model contains 80B parameters and represents the upper extreme, more practical variants like IDEFICS-9B offer a balance of capability and deployability) [19]. These larger models often achieve state-of-the-art (SOTA) accuracy and can produce very detailed, fluent image descriptions. However, their size comes with substantial drawbacks. They require enormous computing resources for training and inference, typically needing multiple high-memory GPUs or specialized hardware accelerators. Integrating such a model into a clinical pipeline can be computationally prohibitive, as these systems tend to be resource-intensive and difficult to deploy on standard workstations. On the other end are lightweight VLMs with on the order of a few hundred million to a few billion parameters [20]. These compact models are designed for efficiency and easier deployment. They can often run on a single commodity GPU, making them attractive for smaller hospitals or research labs without access to extensive computing infrastructure. The trade-off, however, is that smaller models may exhibit lower raw performance. They may miss finer details or produce less fluent captions compared to their larger counterparts. This dichotomy between large and small VLMs raises an important challenge for the field, namely the need to balance model accuracy and descriptive detail with considerations of computational efficiency and resource availability [21]. Resolving this trade-off will be critical for facilitating the practical integration of AI-based image captioning systems into clinical workflows.
A key limitation of the LVLMs is the difficulty of fine-tuning and deploying them in typical clinical research settings [22]. Fully fine-tuning a multi-billion-parameter model for a specific task (such as radiology captioning) is computationally expensive and memory-intensive, often to the point of impracticality [23]. For many clinical settings, it is not feasible to dedicate the necessary GPU clusters or prolonged training time required for traditional fine-tuning of a giant model on local data [24]. Furthermore, even after training, inference with an LVLM can be slow and require significant GPU memory, impeding real-time use [25]. These factors have motivated a shift toward methods that favor deployability on standard hardware over brute-force model training [26]. In practice, it is often more desirable to take a strong pre-trained VLM and adapt it in a lightweight manner that can run on an everyday workstation, rather than to re-train or heavily fine-tune it requiring specialized hardware [27].
In response, researchers have developed parameter-efficient fine-tuning (PEFT) techniques that significantly reduce the resources needed to adapt large models [24]. PEFT approaches adjust only a small fraction of the model’s parameters while keeping most weights of the pre-trained model frozen. This drastically lowers the computational and memory overhead of training, making it possible to fine-tune large models on modest hardware [28]. Among these methods, Low-Rank Adaptation (LoRA) [29] has gained particular prominence for vision–language applications. LoRA inserts a pair of low-rank trainable weight matrices into each layer of the model, which are learned during fine-tuning instead of modifying the full weight matrices [30]. This approach effectively injects task-specific knowledge into the model with only a few million additional parameters, all while preserving the original model’s weights. Our experiments demonstrate that PEFT with LoRA can surpass fully fine-tuned traditional architectures, validating the effectiveness of this approach. The growing use of PEFT means that even LVLMs containing tens of billions of parameters can be adapted to niche tasks like medical image captioning using standard GPU, without needing to retrain the entire network from scratch [24]. This is a crucial step toward making advanced multimodal AI accessible in clinical settings.
Despite rapid progress in VLM development, there are gaps in understanding how model scale and tuning strategies impact performance in medical image captioning [31]. First, there is a lack of unified, head-to-head comparisons of different sized models on the same clinical imaging dataset [7]. Much of the prior work evaluates models in isolation or on differing data, which makes it difficult to objectively determine how a 500-million-parameter model stacks up against a 9-billion-parameter model under similar conditions [32]. As a result, the field has had an unclear picture of the true trade-offs between clinical utility (caption quality) across the spectrum of model sizes. Second, existing image captioning studies in radiology have rarely assessed how well models generalize across multiple imaging modalities. Many works focus on a single modality (e.g., chest X-rays); far fewer have tested models on diverse modalities (e.g., X-rays, MRI, CT, etc.) to ensure the captioning approach is broadly applicable [7]. Indeed, models trained on one modality often struggle to interpret others without additional training. This modality-specific focus leaves open the question of how a given model’s performance might change when confronted with different image types or anatomies, an important consideration for real-world deployment. Third, to our knowledge, the published literature lacks a systematic comparison of parameter-efficient adaptation strategies for VLMs that empirically identifies optimal configurations for radiology captioning performance [32]. Additionally, inference-time augmentations, which are simple strategies applied at the time of caption generation to guide the model, have not been thoroughly investigated in this domain. For example, explicitly telling a model the modality of the image such as prepending the phrase “Radiograph:” or “CT:” to the input could, in theory, provide helpful context to a VLM [33]. Intuitively, this modality-aware prompting might remind the low performing SVLMs of relevant domain knowledge and improve caption accuracy. Our investigation explores whether such interventions can compensate for reduced model capacity, potentially enabling smaller models to achieve competitive performance.
To address these gaps, we evaluate a spectrum of VLMs on a unified radiology image captioning task using LoRA. The evaluation spans models ranging from large, SOTA multimodal systems to smaller alternatives, all tested on the ROCOv2 dataset. On the larger end, we assess LVLMs such as LLaVA variants with Mistral-7B and Vicuna-7B backbones, LLaVA-1.5, as well as IDEFICS-9B. On the smaller end, we include MoonDream2, Qwen 2-VL, Qwen-2.5, and SmolVLM. By evaluating models spanning nearly a 19-fold range in parameter count, we quantify how model scale influences performance in radiology captioning. To provide additional context we also benchmark these parameter-efficient fine-tuned VLMs against two baseline image captioning architectures from prior research [34]. The first is a fully fine-tuned CNN–Transformer model that uses a CNN network encoder similar to CheXNet paired with a Transformer-based decoder for language. This approach reflects traditional image captioning pipelines developed before the emergence of large multimodal models. The second is a fully fine-tuned custom VisionGPT2 model that employs a pre-trained GPT-2 language model conditioned on visual features–previously compared against a LoRA-adapted LLaVA-1.6-Mistral-7B in our preliminary investigation [21]. Including these baselines allows us to directly assess the performance gains of recent VLMs relative to earlier techniques.
We also investigate the effectiveness of modality-aware prompting as an inference-time intervention for the underperforming SVLMs [33]. In these experiments, the model is prepended with a text prompt indicating the image type (for instance, supplying “MRI:” or “ultrasound:” before the image is processed) to provide additional context. Our results show that this leads to only minor improvements in the fluency of captions generated by a few SVLMs, and does not meaningfully close the performance gap relative to the larger models. In other words, while adding modality cues can make a caption slightly more coherent or tailored for some models, it is not a substitute for the richer internal knowledge that LVLMs bring. The larger models consistently produce more detailed and clinically accurate captions, highlighting that model scale (and the breadth of training data it entails) remains a dominant factor in captioning quality.
Overall, this study provides a comparative benchmark of VLMs fine-tuned with LoRA for radiology captioning. By systematically evaluating models across scales from LVLMs to SVLMs, and reporting both parameter counts and adaptation targets, we clarify how model size and tuning strategies affect performance. In doing so, our work addresses gaps in prior studies by offering a comparison across model scales and establishing a reference point for future research. The following sections outline our methodology, present experimental results, and discuss their implications for advancing medical image captioning.
2. Methodological Approach
The methodological framework of the study which comprises of four consecutive phases: data preparation, model preparation, training environment preparation, and post-training evaluation methods. Further discussions on this section, given below, will demonstrate the corresponding details of each phase.
2.1. Data Preparation
The study employs the Radiology Objects in Context version 2 (ROCOv2) dataset [35], comprising 116,635 radiological images from PubMed Central publications. The dataset is partitioned into training (80,091 images), validation (17,277 images), and test (19,267 images) sets, with each image paired with a caption and Unified Medical Language System (UMLS) concept annotations. UMLS provides standardized medical terminology through Concept Unique Identifiers (CUIs) [36]. This standardization enables consistent semantic representation of medical concepts across different vocabularies. Captions typically describe the imaging modality, anatomical region, and relevant findings, with an average length of 20.91 words.
The dataset encompasses eight imaging modalities, as summarized in Table 1. Computed Tomography (CT) (40,913) and Radiography/X-ray (31,827) constitute the majority, followed by Magnetic Resonance Imaging (MRI) (18,570) and Ultrasound (17,147). The smaller categories, namely Angiography (6,055), Positron Emission Tomography (PET) (1,134), combined PET/CT (580), and Optical Coherence Tomography (OCT) (409), were grouped under Other due to their limited distribution. This grouping was also adopted when developing a ResNet-50 [37] classifier used to predict image modality labels for lower-performing SVLMs at inference time.
Medical concept annotations include 1,949 unique UMLS concepts in the training set, with smaller vocabularies in validation (716) and test (702) sets to support generalization assessment. The concepts span pathological findings (e.g., fluid accumulation, neoplasms, cysts), anatomical structures (e.g., cardiac, hepatic, cerebral regions), and imaging modalities categorized as diagnostic procedures (e.g., CT, X-ray, MRI), thus covering a broad clinical range for caption generation. The medical concepts constitute core components within captions that models learn to identify and integrate when generating structured outputs.
Figure 1 illustrates the complete data preparation pipeline, encompassing image preprocessing to standardized 600×600 dimensions and text normalization procedures including punctuation removal and numeric token replacement. Collectively, this composition makes the dataset suitable for evaluating VLMs across multiple dimensions. Its modality diversity enables testing generalization across different imaging physics, caption variability challenges models to handle linguistic complexity, and the dataset’s size and structured partitioning provide a robust foundation for architectural comparisons.
2.2. Model Preparation
Multimodal learning for medical image captioning utilizes large model architectures that integrates medical imagery and clinical text generation [21,38,39]. The architectural landscape can be grouped into large models that support complex medical reasoning and compact models designed for efficiency. Our experimental framework included three categories of multimodal architectures as shown in Figure 2 and summarized in Table 2. Figure 3 illustrates the conceptual frameworks of these architectures. The first group includes LVLMs with 7 to 9 billion parameters. The second group includes SVLMs with 0.5 to 3 billion parameters. The third group covers two baseline encoder–decoder architectures with fewer than 250 million parameters. Despite the differences in scale, VLMs [40] share core components for image captioning. Each uses a vision encoder for feature extraction, a language decoder for text generation, and connector or fusion module for cross-modal alignment.
2.2.1. Large Vision-Language Models (LVLMs)
All the variants of LLaVA [10] architecture family use CLIP ViT-L/14 [41] vision encoder with approximately 430 million parameters, which processes input images through 24 transformer layers using patch decomposition. The vision encoder generates 576 visual tokens that capture spatial features at multiple scales. These features are then aligned with language representations through projection layers combined with cross-attention mechanisms (20–50 M parameters, Table 2) to bridge the vision-language gap.
- LLaVA v1.6 Mistral-7B [42] pairs the CLIP ViT-L/14 encoder with Mistral-7B-Instruct as its language decoder. The Mistral backbone introduces Sliding Window Attention (SWA), which reduces computational complexity from to and supports a context length of tokens. It also applies Grouped-Query Attention (32 query heads mapped to 8 key-value heads), lowering inference memory requirements by about 75% while preserving generation quality. A two-layer MLP connector (20-50M parameters) projects 1024-dimensional vision features into the 4096-dimensional language space, enabling cross-modal integration.
- LLaVA v1.6 Vicuna-7B [43] substitutes Vicuna-7B as the language backbone while maintaining identical vision encoding and projection mechanisms. Vicuna-7B features 32 transformer layers with RMSNorm normalization and SwiGLU activation functions, supporting context lengths up to 4096 tokens. Both Mistral and Vicuna variants use a similar training protocol. The models first align visual features with language embeddings using filtered image-caption pairs, and subsequently undergo visual instruction tuning.
- LLaVA v1.5 with LLaMA-7B features LLaMA-7B [44] decoder containing 32 transformer layers utilizing RMSNorm normalization, SwiGLU activation functions, and Rotary Position Embeddings (RoPE). The architecture supports a 2048-token context window and incorporates standard multi-head self-attention with 32 heads, each operating on 128-dimensional representations. Cross-modal alignment is achieved through similar linear projection strategy, demonstrating that, with appropriate instruction tuning, complex fusion mechanisms are not required for effective performance.
- IDEFICS-9B [19] Instruct combines a CLIP ViT-H/14 vision encoder with LLaMA-7B [44]. Its distinguishing feature is the Perceiver Resampler module containing approximately 250M trainable parameters, which compresses variable-length visual inputs into exactly 64 visual tokens regardless of input size. The Perceiver operates through learned latent queries that extract fixed-size representations via cross-attention, reducing computational complexity to where latent tokens and M visual features. This design ensures constant processing cost independent of image dimensions. Additionally, the model integrates Gated Cross-Attention Dense layers (approximately 500M parameters) inserted every fourth transformer block, using gating to stabilize multimodal fusion during training.
2.2.2. Small Vision-Language Models (SVLMs)
The emergence of SVLMs addresses the need for deployable multimodal systems in resource-constrained clinical environments. Recent advances in model compression and architectural efficiency have enabled these compact models to achieve competitive performance while requiring less computational resources than their larger counterparts [24]. These models typically range from 0.5B to 3B parameters, making them suitable for deployment in settings where computational infrastructure is limited [31]
- Qwen 2-VL [45] employs Native Dynamic Resolution (NaViT) processing, eliminating fixed-resolution constraints. The custom Qwen Vision Transformer (ViT) processes images at native resolutions, producing 4 to 16,384 visual tokens per image with 2D-RoPE positional encoding. A lightweight token merger aggregates spatially adjacent patches through MLP compression before language model fusion.
- Qwen 2.5-3B-Instruct [46] extends this architecture with window attention for computational efficiency and SwiGLU activations in vision MLPs, aligning encoder structure with modern language models. The PatchMerger component provides additional token compression through dedicated MLP sublayers. Notably, it implements Multimodal Rotary Position Embedding (M-RoPE), decomposing positions across temporal, height, and width dimensions for unified spatial-temporal reasoning. Both models support 32,768 token context windows, with Qwen 2.5-3B-Instruct offering enhanced positional encoding strategies optimized for variable-resolution multimodal processing.
- MoonDream2 [47] combines SigLIP-base vision encoding with Phi-1.5 language model [48]. The architecture replaces CLIP’s softmax loss with pairwise sigmoid loss, eliminating global batch dependencies and improving zero-shot performance. The lightweight projection layer (per Table 2) requires minimal computational overhead while maintaining effective cross-modal alignment.
- SmolVLM-500M-Instruct [49] is the most compact model evaluated, employing aggressive visual token compression by reducing the number of visual tokens through pixel shuffle strategies. The Idefics3Connector projects high-dimensional vision features (12,288-dimensional) into a 960-dimensional language space, achieving approximately a 9× reduction in token representation while maintaining captioning quality.
2.2.3. Baseline Architectures
- CNN-Transformer Fusion uses a pre-trained CheXNet [34] (DenseNet121) as the CNN feature extractor. A transformer encoder further contextualizes the extracted embeddings, which are then refined by a tiny transformer decoder [21]. The decoder generates captions through multi-head self-attention and cross-attention with the visual features. The architecture capitalizes on the spatial sensitivity of CNNs and the global sequence modeling power of transformers, linked by a parameter-efficient feature fusion layer.
The parameter distributions in Table 2 reveal underlying design philosophies, where LVLMs dedicate 75–90% of parameters to language modeling, while SVLMs maintain more balanced vision-language distributions, directly impacting computational requirements from sub-1GB (SmolVLM) to 32GB+ (LVLMs) for deployment [52]
2.3. Training Environment Preparation
Traditional full fine-tuning of VLMs updates all parameters during training, which can be computationally prohibitive for models with billions of parameters. For instance, fully fine-tuning a 7B parameter model requires substantial GPU memory (>32GB) and risks catastrophic forgetting of pre-trained representations [53]. This is particularly problematic in medical domains where preserving general visual-linguistic understanding alongside domain-specific knowledge is crucial [54]. PEFT [55] methods address these limitations by modifying only a small subset of model parameters while keeping the majority frozen. Recent studies demonstrate that PEFT achieves 95-98% of full fine-tuning performance while reducing trainable parameters by 99% and memory usage by up to 12-fold, making deployment viable in resource-constrained clinical settings [55,56]. Among PEFT techniques, LoRA has emerged as particularly effective for vision-language tasks [24].
LoRA decomposes weight updates into low-rank matrices, with adapted weights computed as:
where represents frozen pre-trained weights, (down-projection) and (up-projection) are trainable matrices with rank . The forward pass becomes:
Here, the rank r governs the adaptation’s capacity and parameter count, while the scaling factor controls the update magnitude to stabilize training, with adapter scaling modulating how strongly the LoRA layer adapts to new data [29].
2.3.1. Adaptation Strategy Selection
We evaluated three adaptation strategies to identify optimal configurations for medical image captioning:
- (1)
- Targeted LoRA focuses on core transformation layers, targeting the query (), key (), and value () projections within the attention mechanisms, the multimodal connector layers (), and the gate (), up (), and down () projections of the MLP, while leaving the output projections and embedding layers unchanged. This configuration modifies only a tiny selected subset of overall model parameters.
- (2)
- Extended LoRA expands the adaptation to include output projections () and the fully connected layers of MLP, increasing trainable parameters to a greater count.
- (3)
- Hybrid Strategy combines LoRA with full fine-tuning of language model head and token embeddings, reaching significantly greater trainable parameters and training time.
Preliminary experiments on representative architectures demonstrated that targeted LoRA consistently outperformed broader strategies, achieving superior Image-Caption Similarity (0.870 vs 0.786 for extended) and better preserving medical terminology (UMLS F1: 0.154 vs 0.129) of LLaVA-Mistral, as demonstrated in Section 3.1. Based on empirical optimization, we implemented differentiated configurations for model categories defined in Table 3.
2.3.2. Adaptive Full Fine-Tuning for Baseline Models
The baseline architectures employed progressive full fine-tuning to prevent catastrophic forgetting while adapting from general to medical-specific representations. For VisionGPT2, training began with the ViT encoder and GPT-2 decoder in a frozen state, updating only cross-attention modules that align image features with textual outputs. After initial progress, the encoder was unfrozen for joint tuning of image representations. The final phase activated the GPT-2 decoder for full-network refinement. The learning rate followed a OneCycleLR schedule [57], base value , with training in fp16 via GradScaler [58]. Effective batch size reached 32 by gradient accumulation. Data was augmented using random flipping, brightness, contrast, and rotation changes. While, the CNN-Transformer Fusion sequence started with only the transformer decoder trainable and CheXNet (DenseNet121) fixed [34]. Once captions are stabilized, CNN layers became trainable for radiology-specific adaptation. The last stage fine-tuned all components together: CNN backbone, transformer encoder, and decoder. Scheduling ramped the learning rate to in early steps. Sparse categorical cross-entropy loss incorporated padding mask and Vocabulary included 33,227 specialist and domain tokens.
Both baseline models monitored validation perplexity for early stopping (patience of 5 epochs) and saved best-performing checkpoints based on validation loss. This progressive approach proved essential for smaller architectures enabling them to achieve reasonable performance despite full parameter updates.
2.3.3. Training Configuration of Vision Language Models
Training configurations were tailored to model capacity and memory constraints. All VLMs were fine-tuned with mixed precision training (bfloat16) [59] and Flash Attention 2 [60] to accelerate computation and reduce memory overhead during attention operations. AdamW Optimization [61] (=0.9, =0.999, =, weight decay=0.01) is used with learning rates assigned as follows: for LVLMs (LLaVA-v1.6-Mistral-7B, LLaVA-v1.6-Vicuna-7B, IDEFICS-9B-Instruct 4-bit); for LLaVA-1.5-7B; for SmolVLM-500M; for Qwen-2B and Qwen-2.5-3B; for MoonDream2 (cosine scaling). Model progression was tracked using early stopping by observing validation loss. Patience was set to 3 evaluations for LVLMs and 6 for SVLMs. Typical convergence occurred within 3,000-10,000 steps for the models. The training environment configuration, shown in Figure 4, enabled systematic evaluation across model families and comparison between parameter-efficient and full fine-tuning approaches.
2.3.4. Modality-Aware Prompting for SVLMs
Given the performance gap between large and small VLMs observed in preliminary experiments, we investigated whether providing explicit modality information could enhance caption generation for under-performing SVLMs without requiring additional training. This approach reflects clinical practice where radiologists know the imaging modality before interpretation.
ResNet-50 [37] based classifier was employed for automated modality classification across five imaging modalities of ROCOv2 such as CT, MRI, Radiograph, Ultrasound, and Others. The Others category consolidated less frequent modalities including angiography, PET, PET/CT, and OCT, which collectively represented 7.0% of the dataset (Table 1). This grouping addressed the class imbalance that would have resulted from treating these infrequent modalities independently. The architecture utilized standard ResNet-50 topology without ImageNet pretraining, ensuring features were learned exclusively from medical images [62]. The final fully connected layer was modified to produce five outputs corresponding to the target modalities. Each modality class was downsampled to 8,178 images to match the smallest consolidated class size, addressing dataset class imbalance.The classifier underwent training using cross-entropy loss [63] and Adam optimization [64]. Its validation metrics demonstrated robust performance with accuracy of 96.46%, and balanced precision, recall, and F1-scores all approximating 0.964. Distributional analysis of test set predictions confirmed balanced outputs across all five modalities.
Inference-Time Implementation: The modality-aware prompting strategy was implemented as a two-stage inference pipeline exclusively for the three underperforming SVLMs (SmolVLM-500M, Qwen 2-VL, and Qwen-2.5-3B). In the first stage, the trained ResNet-50 [37] classifier predicted the imaging modality for each test image. In the second stage, during caption generation, the predicted modality label was prepended to the input prompt using the template: “[Modality] image: Describe the medical image.” This resulted in prompts such as “CT image: Describe the medical image” or “MRI image: Describe the medical image.” The modality-conditioned prompting aimed to guide models toward appropriate domain-specific vocabulary and structural patterns characteristic of each imaging type.
Design Considerations: Modality information was incorporated solely during inference, not during model training. This design preserved modularity, as captioning models retained their functionality without architectural modifications or retraining. The decision to exclude modality prompting from LVLMs was based on their stronger baseline performance metrics, suggesting adequate implicit modality understanding. The inference-only augmentation strategy provided a practical approach to potentially enhance performance while maintaining system simplicity and the option to disable prompting if adverse effects were observed.
2.4. Post-Training Evaluation
The quality of generated captions for the test images was evaluated using a comprehensive suite of metrics to measure relevance to the reference caption and clinical factuality. This evaluation framework, introduced in ImageCLEFmedical 2025 [65] and illustrated in Figure 5, computes individual metric scores for each caption that are then averaged over the test set. Three aggregate measures are reported: Relevance Average (mean of four relevance metrics), Factuality Average (mean of two factuality metrics), and Overall Average (mean of all six metrics), providing a single summary score across relevance and factuality. By incorporating measures that capture lexical overlap, semantic alignment, image–text correspondence, and concept-level accuracy, the evaluation provides a balanced assessment of caption quality and clinical utility.
2.4.1. Relevance Metrics
Relevance is quantified using four complementary approaches, which are described below.
- (1)
- Image-Caption Similarity: Computed by mapping the image and candidate caption into a shared embedding space using MedImageInsight [66], a medical VLM trained across X-ray, CT, MRI, OCT, and ultrasound modalities, and calculating their cosine similarity. This metric assesses whether the caption content aligns with the visual signal without requiring reference text.
- (2)
- BERTScore: Applied in its recall-oriented configuration with inverse document frequency weighting, following established best practices for caption evaluation [67]. Contextual embeddings were generated using a DeBERTa-XLarge-MNLI encoder [68], selected for its demonstrated correlation with human quality judgments.
- (3)
- ROUGE-1: F-measure calculated to assess lexical overlap through unigram matching between the candidate and reference captions [69].
- (4)
- BLEURT: Applied using the BLEURT-20 checkpoint to obtain learned quality scores that approximate human preferences for caption quality [70].
To minimize formatting artifacts and focus evaluation on semantic content, captions for BERTScore, ROUGE, and BLEURT underwent preprocessing including lowercasing, punctuation removal, numeric token replacement with "number," and single-sentence treatment regardless of original segmentation.
2.4.2. Factuality Metrics
Clinical factuality was assessed using two metrics targeting correctness at different levels of granularity.
- (1)
- UMLS Concept F1: Quantified preservation of key medical entities through comparison of concept sets extracted from candidate and reference captions. Medical concepts were identified using MedCAT [71] and filtered according to clinically relevant semantic types specified in the MEDCON framework [72].
- (2)
- AlignScore: Generated consistency scores by evaluating factual claims in candidate captions against reference standards using a RoBERTa-based alignment model [73]. The metric decomposes captions into claims and aligns them with supporting evidence, producing averaged alignment scores.
The evaluation metrics balance surface overlap, semantic similarity, image–text alignment, and concept-level correctness, which together are important for caption usefulness in radiology. The final ranking of systems relied on the Overall Average, with Relevance Average and Factuality Average reported to separate linguistic similarity from clinical accuracy. Framing the evaluation in this way facilitates comparison not only across different model families but also between fine-tuning strategies. It establishes a standardized protocol for assessing caption quality, making the reported results interpretable beyond the scope of a single dataset or task.
3. Experimental Results
3.1. Optimal Adaptation Strategy Selection
Before conducting cross-model comparisons, we evaluated LoRA strategies to identify optimal configurations for parameter-efficient fine-tuning. Using the LLaVA architecture with two different language model backbones (Mistral-7B and Vicuna-7B) as representative examples, we compared adaptation approaches varying in complexity and parameter count. For LLaVA Mistral-7B, we evaluated: (1) LoRA selectively applied to attention mechanisms and MLP blocks (40.1M parameters, 0.53% of model), (2) extended LoRA including output projections and multimodal connector layers (98.4M parameters, 1.28%), and (3) a hybrid approach combining LoRA with full fine-tuning of language head and embeddings (350.6M parameters, 4.58%). For LLaVA Vicuna-7B, we compared targeted LoRA (34.4M parameters, 0.48%), inclduing multimodal projections, against the hybrid approach (346.7M parameters, 4.85%). The layer targets for each configuration are provided in the methodology.
Figure 6 and Figure 7 show the results across six evaluation metrics. For LLaVA Mistral-7B, the targeted LoRA achieved the highest Image Caption Similarity score of 0.870, compared to 0.786 for extended LoRA and 0.827 for the hybrid approach, corresponding to relative drops of 9.7% and 5.0%, respectively. A similar trend was observed across relevance-oriented metrics, with BERTScore showing minimal variation (0.628, 0.623, 0.625) but ROUGE and BLEURT exhibiting clearer advantages for targeted adaptation. ROUGE scores decreased from 0.251 (targeted) to 0.238 (extended) and 0.244 (hybrid), while BLEURT scores followed a similar declining pattern from 0.315 to 0.308 to 0.313.
The performance differences were more pronounced in factuality metrics. UMLS Concepts F1, which measures the preservation of medical terminology, decreased from 0.154 (targeted) to 0.129 (extended) and 0.140 (hybrid), representing 16.2% and 9.1% reductions. Similarly, AlignScore dropped from 0.081 to 0.069 (14.8% reduction) and 0.070 (13.6% reduction), respectively. These metrics are clinically salient because they reflect preservation of medical terminology and factual consistency.
The LLaVA Vicuna-7B results reinforced this pattern. The LoRA configuration (34.4M parameters) outperformed the hybrid approach (346.7M parameters) despite using one-tenth of the trainable parameters. Image Caption Similarity decreased from 0.830 to 0.728 (12.3% reduction), while UMLS Concepts F1 dropped from 0.142 to 0.107 (24.6% reduction) and AlignScore fell from 0.076 to 0.059 (22.4% reduction). The substantial degradation in factuality metrics with expanded adaptation complexity further suggests that modifying larger parameter sets can disrupt the model’s learned medical knowledge representations rather than enhancing them.
Overall, increasing the number of trainable parameters does not necessarily improve performance across relevance and factuality dimensions. The targeted LoRA approach, which modifies only a small and selective subset of the pre-trained model’s parameters, achieved comparable or superior task-specific adaptation. This suggests that modest and targeted intervention in the model’s parameter space is sufficient to retain general pre-trained representations while enabling effective incorporation of domain-specific knowledge. Consequently, all subsequent cross-model comparisons report results for the targeted adaptation variant of each VLM, favoring configurations that balance performance with computational efficiency.
3.2. Cross-Model Performance Comparison
Having established that targeted LoRA provides optimal performance-efficiency trade-offs, we evaluated eight vision-language models and two baseline architectures on the radiology image captioning task. All models employed their best configurations as determined by preliminary experiments. Table 4 presents comprehensive performance metrics across all evaluated systems.
The results reveal a clear performance hierarchy across model categories. Among LVLMs, LLaVA Mistral-7B achieved the highest overall average (0.317), with particularly strong performance in Image Caption Similarity (0.870) and relevance metrics (0.516 average). This corresponds to a 79.1% gain in Overall Average relative to the strongest baseline (VisionGPT2), despite using only 0.53% trainable parameters compared to the baseline’s full fine-tuning approach. LLaVA Vicuna-7B followed closely with an overall average of 0.306, showing comparable performance with even fewer trainable parameters (0.48%). IDEFICS-9B, achieved intermediate performance (0.290 overall), while LLaVA-1.5 showed lower scores (0.273), likely reflecting its older architecture and training setup.
Among SVLMs, MoonDream2 emerged as the strongest performer with an overall average of 0.279, attaining performance comparable to LLaVA-1.5 (0.273) while using approximately 74% fewer total parameters. Notably, MoonDream2’s relevance average (0.466) approached that of some LVLMs, with its Image Caption Similarity (0.757) and BLEURT scores (0.303) demonstrating competitive semantic alignment. Moreover, MoonDream2’s factuality metrics (0.093) also outperformed LLaVA-1.5 (0.083), suggesting that architectural innovations and training strategies can partially compensate for reduced model size. However, the top-performing LLaVA Mistral-7B maintains clear advantages with factuality scores of 0.118, indicating that while efficient architectures narrow the gap, fundamental capacity differences remain for the most demanding clinical applications. Qwen 2-VL, SmolVLM, and Qwen-2.5 showed progressively lower performance with 0.232, 0.200, and 0.188 average overall scores respectively. Interestingly, Qwen-2.5 achieved the lowest overall average (0.188) among SVLMs, even underperforming SmolVLM (0.200) which has fewer total parameters (0.5B vs 3.1B). This counterintuitive result suggests that model architecture and pre-training quality may be more determinative than raw parameter count for smaller models. Qwen 2-VL presents another anomaly, achieving the highest AlignScore (0.109) among all models including LVLMs, while having relatively weaker overall performance (0.232). This unusually strong factual claim consistency despite weak relevance metrics (0.372) suggests that Qwen 2-VL may have been pre-trained on data distributions that emphasize factual alignment over semantic similarity, though this comes at the cost of overall caption quality.
The baseline models performed substantially below all LoRA-adapted VLMs. VisionGPT2, the stronger baseline with an overall average of 0.177, was outperformed by even the lowest performing SVLM (Qwen-2.5 at 0.188). The CNN-Transformer baseline showed the weakest performance (0.154 overall), with particularly poor ROUGE scores (0.044) indicating limited n-gram overlap with reference captions. These results demonstrate that parameter-efficient adaptation of pre-trained VLMs consistently outperforms traditional fine-tuned baselines, even when the LVLMs and SVLMs use less than 1% and 9% of the total trainable parameters, respectively.
Figure 8 illustrates the performance distribution across model categories by overall average. There is a distinctive separation between LVLMs (0.273–0.317 range), SVLMs (0.188–0.279 range), and baselines (0.154–0.177 range). Notably, MoonDream2 bridges the gap between small and large models, achieving performance comparable to LLaVA-1.5 despite its significantly smaller size.
To further examine how linguistic relevance relates to clinical factuality, we analyzed the relationship between the two aggregated metrics across all evaluated models. Figure 9 presents a scatter plot of Relevance Average against Factuality Average with an overlaid regression line. We computed Spearman’s rank correlation coefficient () [74] to measure the strength of the monotonic association between the two metrics. This non-parametric measure was selected given our sample size (n = 10) as it makes no distributional assumptions and is more robust to outliers than parametric alternatives [75]. The coefficient was obtained by ranking models separately on their relevance and factuality scores, then calculating the correlation between these ranks using the scipy.stats.spearmanr function. The high correlation value indicates that models achieving stronger semantic alignment consistently demonstrate better preservation of medical concepts, with the rank ordering being nearly perfectly preserved across both dimensions. The fitted regression line shown in the figure provides additional visual insight into the linear trend. The regression analysis, performed using ordinary least squares, demonstrates that the relationship between relevance and factuality is not only monotonic but also approximately linear across the range of observed values. This strong association validates the multi-metric evaluation approach, suggesting that improvements in linguistic similarity could be associated with accurate preservation of clinical information.
The scatter plot reveals distinct clustering patterns. LVLMs occupy the upper-right quadrant (relevance 0.462–0.516, factuality 0.083–0.118), while baselines cluster in the lower-left region (relevance 0.284–0.325, factuality 0.024–0.028). SVLMs show greater variability between these extremes. MoonDream2 represents a particularly interesting case, achieving relevance comparable to IDEFICS-9B (0.466 vs. 0.482) while maintaining factuality (0.093) that exceeds LLaVA-1.5 (0.083). This performance profile, where a 1.86B parameter MoonDream2 matches or exceeds certain 7B+ models on both dimensions, demonstrates that model efficiency can be achieved without proportional sacrifices in caption quality. These findings establish distinct performance tiers for clinical deployment consideration. The top performing LVLMs (LLaVA Mistral-7B and Vicuna-7B) are suitable for diagnostic applications requiring high accuracy. MoonDream2 occupies a unique position, offering performance that rivals some LVLMs while maintaining computational efficiency suitable for resource-constrained screening applications. The remaining SVLMs show mixed capabilities, with Qwen 2-VL’s strong factual alignment but weak relevance suggesting specialized use cases where claim consistency is prioritized over semantic fluency. Baseline models, with overall averages below 0.18, demonstrate the clear advantages of modern VLM architectures over traditional approaches.
3.3. Modality-Aware Prompting for Performance Enhancement in SVLMs
Given the performance gap between SVLMs and LVLMs, we investigated whether providing explicit modality information at inference time could enhance SVLM performance. In clinical practice, radiologists always know the imaging modality before interpretation, suggesting this contextual information could help models generate more appropriate captions. To test this hypothesis, we trained a ResNet-50 classifier on our dataset to predict image modality (CT, MRI, Radiograph, Ultrasound, Other), and then prepended these predicted labels to the input during inference for three low-performing SVLMs: SmolVLM, Qwen 2-VL, and Qwen-2.5-Instruct.
Table 5 shows that modality-aware prompting produced mixed results. SmolVLM improved slightly, with the overall score rising from 0.200 to 0.207, which is an increase of 3.5%. The largest changes were in factuality metrics: UMLS F1 rose from 0.016 to 0.031, an increase of 93.8%, and AlignScore increased from 0.060 to 0.096, a gain of 60.0%. Although these percentages are large, the absolute scores remain very low, which limits their clinical significance. Qwen-2.5 also showed modest improvement, with the overall score increasing from 0.188 to 0.200, equivalent to a 6.4% gain. This improvement was primarily in relevance, where the average increased from 0.320 to 0.351 (9.7%), supported by gains in Image Caption Similarity from 0.449 to 0.502 (11.8%). However, factuality declined from 0.056 to 0.049, a reduction of 12.5%.
In contrast, Qwen 2-VL experienced relative declination in performance. Its overall score decreased from 0.232 to 0.182, a reduction of 21.6%. Both relevance and factuality dropped sharply: Image Caption Similarity fell from 0.570 to 0.364, representing a 36.1% decrease, while UMLS F1 fell from 0.074 to 0.017, a reduction of 77.0%. This suggests that the addition of modality labels might have conflicted with the model’s pre-trained representations or that it already encoded modality implicitly, making the explicit label distracting.
Taken together, these results show that modality-aware prompting cannot bridge the gap between SVLMs and LVLMs. At best, SmolVLM and Qwen-2.5 gained modest improvements, but their absolute scores remain well below those of even the weakest LVLM. The performance decline of Qwen 2-VL further illustrates the risks of inference-time interventions without model-specific validation. Overall, providing image modality during caption prediction at inference time may offer small benefits in certain cases. However, it cannot substitute for the architectural advantages of LVLMs and does not represent a reliable strategy for enhancing SVLMs in clinical applications.
4. Discussion
VLMs offer potential as automated interpretation tools to accelerate report generation through clinically meaningful image captions. In this study, we compared LVLMs and SVLMs fine-tuned on the ROCOv2 dataset to assess their clinical utility. The comprehensive evaluation of VLMs for radiology image captioning reveals findings that merit closer examination on model scaling and adaptation strategies. Performance varied by model scale, with larger architectures generally outperforming smaller ones. However, lightweight adaptation using LoRA proved effective across the models.
Additionally, our investigation of inference-time interventions revealed that modality-aware prompting cannot compensate for fundamental architectural limitations in small models. While marginal improvements were observed for SmolVLM and Qwen-2.5, the absolute performance gains remained clinically insignificant. Moreover, simple radiologic findings were accurately captured by most models, while complex cases requiring multiple abnormality detection revealed clear performance stratification. These observations inform deployment strategies, with different model categories suitable for distinct clinical tasks ranging from initial abnormality detection to comprehensive diagnostic reporting. Overall, the study findings guide the selection of VLMs for resource-constrained medical imaging applications.
4.1. The Parameter Efficiency Paradox
Contrary to intuitive expectations, targeted LoRA using 0.48-0.53% of model parameters outperformed hybrid approaches that modified up to 4.85% of parameters. The results become clearer when examining the specific components targeted by each approach. Targeted adaptation focused on attention mechanisms and MLP layers while preserving output projections and embedding layers intact. Hybrid approaches additionally performed full fine-tuning on language heads and embeddings, which appears to disrupt pre-trained knowledge representations.
The preservation of medical terminology, evidenced by higher UMLS Concept F1 scores in selective adaptation for LLaVA Mistral-7B and LLaVA Vicuna-7B, suggests that targeted parameter modification maintains semantic understanding essential for clinical applications. Recent work in medical NLP has similarly demonstrated that extensive parameter modification increases catastrophic forgetting, particularly when target domains diverge substantially from pre-training distributions [76]. In medical imaging, where both visual patterns and terminology differ markedly from natural images, preserving foundational knowledge while introducing focused adaptations appears superior to aggressive fine-tuning strategies.
4.2. Performance Patterns Across Caption Complexity
Two representative test cases from the dataset’s most prevalent modalities (i.e., CT scan and X-ray scan) demonstrate how model capabilities translate to real-world performance. The chest X-ray case (Figure 10) illustrates an example of the nature of model performance. Table 6 presents detailed component analysis for this example. LVLMs generally identified core components such as image modality, anatomical location, and pathological findings with high fidelity for simple cases [16]. However, multiple LVLMs also introduced the descriptor large, which was absent from the ground truth. Additionally, most models correctly identified laterality (right-sided) and reproduced visual markers (parenthetical arrow descriptions), though these elements aid clinical interpretation but are not represented as UMLS concepts. This pattern appeared in other test cases as well, indicating a tendency of these models to amplify the perceived prominence of findings. Among SVLMs, performance varied considerably. MoonDream2 retained most components accurately despite the simplified visual marker. In contrast, Qwen 2.5 failed entirely by misidentifying both modality (CT instead of X-ray) and anatomy (kidney instead of chest), despite having a greater parameter count than Qwen 2-VL and SmolVLM.
The CT case in Figure 11 and Table 7 exposed more pronounced performance stratification. Only LLaVA-Mistral-7B reproduced all components including the exact measurement (19.27 mm). LLaVA-Vicuna-7B also captured the pathological finding and measurement correctly, although it substituted pulmonary angiogram for pulmonary embolus study, which is a variation in clinical terminology. LLaVA-1.5 and IDEFICS-9B correctly identified both the modality and the pulmonary context, matching the study type, though neither detected the actual pathological finding of pericardial effusion. LLaVA-1.5 incorrectly described a pulmonary embolism in the right lower lobe as the primary finding, while IDEFICS-9B produced a truncated and incomplete description.
Among SVLMs, MoonDream2 correctly identified the modality and general anatomical region (chest) but misinterpreted the finding as a large mass in the right upper lobe. Qwen 2-VL correctly identified the modality but described a vague right-sided mass without proper anatomical context. Both failed to identify the pericardial effusion. Qwen 2.5 failed completely by mislabeling the study as an axial T2 MRI. SmolVLM demonstrated partial success by correctly identifying the modality, chest anatomy, and extracting the precise measurement 19.27 mm, though it completely misattributed the measurement’s clinical context, suggesting surface-level pattern matching without semantic understanding. Thus, the performance degradation in Qwen 2-VL when modality prompting was applied underscores the need for careful validation before implementing augmentation strategies in clinical workflows. Analysis of caption generation across varying complexity levels exposed consistent patterns in model behavior.
The baseline models showed mixed performance. VisionGPT2 partially identified the modality (CT component of PET/CT) but misidentified the anatomy as hepatic. CNN-Transformer correctly identified the modality but described an incorrect finding (liver lesion). These fundamental errors in pathological finding identification underscore the limitations of traditional architectures even with full fine-tuning.
Overall, the LVLMs outperform SVLMs, which in turn exceed the fully fine-tuned baseline models. This performance stratification was evident in both component-level accuracy and overall caption coherence, as demonstrated in the two representative cases. The pattern holds across both simple and complex cases, with LVLMs achieving Overall Average scores of 0.273-0.317, SVLMs scoring 0.188-0.279, and baselines at 0.154-0.177. However, within each model family, performance comparisons become more nuanced. Among LVLMs, LLaVA-Mistral-7B outperformed IDEFICS-9B despite being smaller, while in the SVLM category, MoonDream2 exceeded Qwen 2.5 by a substantial margin. These intra-family variations indicate that when comparing models of similar scale, architectural design choices and pre-training quality become more determinative of performance than parameter count alone.
4.3. MoonDream2: Bridging the Efficiency Gap
In addition, MoonDream2’s performance profile demonstrates that efficient architectures can bridge the gap between model size and capability. It achieved relevance scores (0.466) comparable to IDEFICS-9B (0.482) and exceeded LLaVA-1.5 (0.462), despite being approximately 74% smaller than LLaVA-1.5. This efficiency likely stems from architectural optimizations in its SigLIP vision encoder and Phi-1.5 language backbone. Although MoonDream2 failed on complex multi-component captions, its reasonable performance on simpler cases positions it as a viable option for screening applications prioritizing basic abnormality detection over detailed characterization.
5. Conclusions and Future work
Parameter-efficient fine-tuning of VLMs offers a practical pathway toward automated radiology reporting in clinical settings. Our empirical evaluation on 116,635 radiological images demonstrates that targeted LoRA, modifying less than 1% of model parameters, outperforms both extended adaptation strategies and traditional fully fine-tuned architectures. LLaVA-Mistral-7B with LoRA achieved the highest performance metrics (Relevance: 0.516, Factuality: 0.118), establishing a benchmark for medical image captioning. The observed performance hierarchy across model scales provides pathways for implementation strategies. LVLMs remain optimal for comprehensive diagnostic support where accuracy is paramount. These outcomes highlight that model design and efficient tuning can offset scale limitations.
The benchmarks established in this study provide empirical foundations for developing AI-assisted radiology systems that enhance diagnostic efficiency while maintaining clinical accuracy. However, the evaluation relies on the ROCOv2 dataset, which may not capture all clinical scenarios, particularly given the dataset’s distribution toward CT, X-ray, MRI, and ultrasound images. The absence of radiologist evaluation limits understanding of clinical utility, as automated metrics may not fully capture diagnostic relevance. The work focused solely on English captions, excluding potential multilingual applications valuable in global healthcare contexts. Future work should integrate radiologist evaluation, investigate more complex datasets with greater modality diversity, and explore ensemble approaches that combine architectural strengths. As healthcare systems face increasing imaging volumes with constrained radiologist resources, parameter-efficient adaptation of VLMs presents a viable approach for augmenting clinical expertise and standardizing diagnostic reporting.
Author Contributions
Conceptualization, M.H., M.M.R., and F.K.; methodology, M.H. and M.M.R.; software, M.H., R.N.C., and M.R.H.; validation, M.H., R.N.C., M.R.H., and O.O.E.P.; formal analysis, M.H.; investigation, M.H. and R.N.C.; resources, M.M.R.; data curation, R.N.C., M.R.H., M.H., and O.O.E.P.; writing—original draft preparation, M.H.; writing—review and editing, all authors; visualization, M.R.H., M.H., and O.O.E.P.; supervision, M.M.R. and F.K.; project administration, M.M.R.; funding acquisition, M.M.R. and F.K. All authors have read and agreed to the published version of the manuscript.
Funding
This work was supported by the National Science Foundation (NSF) grant (ID. 2131307) “CISE-MSI: DP: IIS: III: Deep Learning-Based Automated Concept and Caption Generation of Medical Images Towards Developing an Effective Decision Support System."
Data Availability Statement
The Radiology Objects in Context version 2 (ROCOv2) dataset used in this study was obtained through ImageCLEFmed Caption Prediction Task at https://www.imageclef.org. The dataset comprises radiological images and captions derived from PubMed Central open-access publications. Access requires registration with ImageCLEF.
Acknowledgments
During the preparation of this manuscript, the authors used QuillBot paraphrasing tool for improving the linguistic quality and clarity of the text. The authors have reviewed and edited the output and take full responsibility for the content of this publication.
Conflicts of Interest
The authors declare no conflicts of interest.
References
- Afshari Mirak, S.; Tirumani, S.H.; Ramaiya, N.; Mohamed, I. The growing nationwide radiologist shortage: current opportunities and ongoing challenges for international medical graduate radiologists. Radiology 2025, 314, e232625. [Google Scholar] [CrossRef] [PubMed]
- Rawson, J.V.; Smetherman, D.; Rubin, E. Short-term strategies for augmenting the national radiologist workforce. American Journal of Roentgenology 2024, 222, e2430920. [Google Scholar] [CrossRef]
- Smith-Bindman, R.; Miglioretti, D.L.; Larson, E.B. Rising use of diagnostic medical imaging in a large integrated health system. Health affairs 2008, 27, 1491–1502. [Google Scholar] [CrossRef]
- Achour, N.; Zapata, T.; Saleh, Y.; Pierscionek, B.; Azzopardi-Muscat, N.; Novillo-Ortiz, D.; Morgan, C.; Chaouali, M. The role of AI in mitigating the impact of radiologist shortages: a systematised review. Health and Technology 2025, pp. 1–13.
- Dreyer, R.; Van der Merwe, C.; Nicolaou, M.; Richards, G. Assessing and comparing chest radiograph interpretation in the Department of Internal Medicine at the University of the Witwatersrand medical school, according to seniority. African journal of thoracic and critical care medicine 2023, 29, 12–17. [Google Scholar] [CrossRef] [PubMed]
- Ejiga Peter, O.O.; Adeniran, O.T.; John-Otumu, A.M.; Khalifa, F.; Rahman, M.M. Text-Guided Synthesis in Medical Multimedia Retrieval: A Framework for Enhanced Colonoscopy Image Classification and Segmentation. Algorithms 2025, 18, 155. [Google Scholar] [CrossRef]
- Beddiar, D.R.; Oussalah, M.; Seppänen, T. Automatic captioning for medical imaging (MIC): a rapid review of literature. Artificial intelligence review 2023, 56, 4019–4076. [Google Scholar] [CrossRef]
- Adeniran, O.T.; Ojeme, B.; Ajibola, T.E.; Peter, O.O.E.; Ajala, A.O.; Rahman, M.M.; Khalifa, F. Explainable MRI-Based Ensemble Learnable Architecture for Alzheimer’s Disease Detection. Algorithms 2025, 18, 163. [Google Scholar] [CrossRef]
- Reale-Nosei, G.; Amador-Domínguez, E.; Serrano, E. From vision to text: A comprehensive review of natural image captioning in medical diagnosis and radiology report generation. Medical Image Analysis 2024, 97, 103264. [Google Scholar] [CrossRef]
- Li, T.; Wang, J.; Jin, L. Enhancing Visual Information Extraction with Large Language Models Through Layout-Aware Instruction Tuning. In Proceedings of the Chinese Conference on Pattern Recognition and Computer Vision (PRCV). Springer; 2024; pp. 276–289. [Google Scholar]
- Alayrac, J.B.; Donahue, J.; Luc, P.; Miech, A.; Barr, I.; Hasson, Y.; Lenc, K.; Mensch, A.; Millican, K.; Reynolds, M.; et al. Flamingo: a visual language model for few-shot learning. Advances in neural information processing systems 2022, 35, 23716–23736. [Google Scholar]
- Radford, A.; Kim, J.W.; Hallacy, C.; Ramesh, A.; Goh, G.; Agarwal, S.; Sastry, G.; Askell, A.; Mishkin, P.; Clark, J.; et al. Learning transferable visual models from natural language supervision. In Proceedings of the International conference on machine learning. PmLR; 2021; pp. 8748–8763. [Google Scholar]
- Bannur, S.; Hyland, S.; Liu, Q.; Perez-Garcia, F.; Ilse, M.; Castro, D.C.; Boecking, B.; Sharma, H.; Bouzid, K.; Thieme, A.; et al. Learning to exploit temporal structure for biomedical vision-language processing. In Proceedings of the Proceedings of the IEEE/CVF Conference on Computer Vision and Pattern Recognition, 2023, pp. 15016–15027.
- Moor, M.; Huang, Q.; Wu, S.; Yasunaga, M.; Dalmia, Y.; Leskovec, J.; Zakka, C.; Reis, E.P.; Rajpurkar, P. Med-flamingo: a multimodal medical few-shot learner. In Proceedings of the Machine Learning for Health (ML4H). PMLR; 2023; pp. 353–367. [Google Scholar]
- Wu, C.; Zhang, X.; Zhang, Y.; Hui, H.; Wang, Y.; Xie, W. Towards generalist foundation model for radiology by leveraging web-scale 2d&3d medical data. Nature Communications 2025, 16, 7866. [Google Scholar]
- Ryu, J.S.; Kang, H.; Chu, Y.; Yang, S. Vision-language foundation models for medical imaging: a review of current practices and innovations. Biomedical Engineering Letters 2025, pp. 1–22.
- Zhao, W.; Li, F.; Diao, Y.; Fan, P.; Chen, Z. Cap2Seg: leveraging caption generation for enhanced segmentation of COVID-19 medical images. Frontiers in Physics 2024, 12, 1439122. [Google Scholar] [CrossRef]
- Rau, A.; Endo, M.; Aklilu, J.; Heo, J.; Saab, K.; Paderno, A.; Jopling, J.; Holsinger, F.C.; Yeung-Levy, S. Systematic evaluation of large vision-language models for surgical artificial intelligence. arXiv preprint arXiv:2504.02799, arXiv:2504.02799 2025.
- Laurençon, H.; Saulnier, L.; Tronchon, L.; Bekman, S.; Singh, A.; Lozhkov, A.; Wang, T.; Karamcheti, S.; Rush, A.; Kiela, D.; et al. Obelics: An open web-scale filtered dataset of interleaved image-text documents. Advances in Neural Information Processing Systems 2023, 36, 71683–71702. [Google Scholar]
- Kurz, C.F.; Merzhevich, T.; Eskofier, B.M.; Kather, J.N.; Gmeiner, B. Benchmarking vision-language models for diagnostics in emergency and critical care settings. npj Digital Medicine 2025, 8, 423. [Google Scholar] [CrossRef]
- Hoque, M.; Hasan, M.R.; Emon, M.I.S.; Oluwafemi, E.P.O.; Rahman, M.M.; Khalifa, F. Comparative Analysis of Fine-Tuned Multimodal Models in Radiology Image Captioning. In Proceedings of the 2025 IEEE 4th International Conference on Computing and Machine Intelligence (ICMI); 2025; pp. 1–6. [Google Scholar] [CrossRef]
- Busch, F.; Hoffmann, L.; Rueger, C.; van Dijk, E.H.; Kader, R.; Ortiz-Prado, E.; Makowski, M.R.; Saba, L.; Hadamitzky, M.; Kather, J.N.; et al. Current applications and challenges in large language models for patient care: a systematic review. Communications Medicine 2025, 5, 26. [Google Scholar] [CrossRef]
- Shi, Y.; Shu, P.; Liu, Z.; Wu, Z.; Li, Q.; Liu, T.; Liu, N.; Li, X. MGH Radiology Llama: A Llama 3 70B Model for Radiology, 2024, [arXiv:cs.CL/2408.11848].
- Danish, S.; Sadeghi-Niaraki, A.; Khan, S.U.; Dang, L.M.; Tightiz, L.; Moon, H. A comprehensive survey of Vision-Language Models: Pretrained models, fine-tuning, prompt engineering, adapters, and benchmark datasets. Information Fusion 2025, p. 103623.
- Alsinglawi, B.; McCarthy, C.; Webb, S.; Fluke, C.; Saidy, N.T. A Lightweight Large Vision-language Model for Multimodal Medical Images, 2025, [arXiv:cs.CV/2504.05575]. arXiv:cs.CV/2504.05575].
- Mei, X.; Shun, J.; Chao, K. Efficient Fine-Tuning with Low-Rank Adaptation for Large-Scale AI Models. Available at SSRN 5173161 2024.
- Li, Y.; Ghahremani, M.; Wachinger, C. MedBridge: Bridging Foundation Vision-Language Models to Medical Image Diagnosis, 2025, [arXiv:cs.CV/2505.21698].
- Chen, S.; Gu, J.; Han, Z.; Ma, Y.; Torr, P.; Tresp, V. Benchmarking robustness of adaptation methods on pre-trained vision-language models. Advances in Neural Information Processing Systems 2023, 36, 51758–51777. [Google Scholar]
- Hu, E.J.; Shen, Y.; Wallis, P.; Allen-Zhu, Z.; Li, Y.; Wang, S.; Wang, L.; Chen, W.; et al. Lora: Low-rank adaptation of large language models. ICLR 2022, 1, 3. [Google Scholar]
- Zanella, M.; Ben Ayed, I. Low-rank few-shot adaptation of vision-language models. In Proceedings of the Proceedings of the IEEE/CVF Conference on Computer Vision and Pattern Recognition, 2024, pp. 1593–1603.
- Hartsock, I.; Rasool, G. Vision-language models for medical report generation and visual question answering: A review. Frontiers in artificial intelligence 2024, 7, 1430984. [Google Scholar] [CrossRef] [PubMed]
- Li, Y.; Lai, Z.; Bao, W.; Tan, Z.; Dao, A.; Sui, K.; Shen, J.; Liu, D.; Liu, H.; Kong, Y. Visual Large Language Models for Generalized and Specialized Applications, 2025, [arXiv:cs.CV/2501.02765].
- Zhao, Y.; Braytee, A.; Prasad, M. DualPrompt-MedCap: A Dual-Prompt Enhanced Approach for Medical Image Captioning, 2025, [arXiv:cs.CV/2504.09598].
- Rajpurkar, P.; Irvin, J.; Zhu, K.; Yang, B.; Mehta, H.; Duan, T.; Ding, D.; Bagul, A.; Langlotz, C.; Shpanskaya, K.; et al. Chexnet: Radiologist-level pneumonia detection on chest x-rays with deep learning. arXiv preprint arXiv:1711.05225 2017.
- Rückert, J.; Bloch, L.; Brüngel, R.; Idrissi-Yaghir, A.; Schäfer, H.; Schmidt, C.S.; Koitka, S.; Pelka, O.; Abacha, A.B.; G. Seco de Herrera, A.; et al. Rocov2: Radiology objects in context version 2, an updated multimodal image dataset. Scientific Data 2024, 11, 688.
- Bodenreider, O. The unified medical language system (UMLS): integrating biomedical terminology. Nucleic acids research 2004, 32, D267–D270. [Google Scholar] [CrossRef]
- He, K.; Zhang, X.; Ren, S.; Sun, J. Deep residual learning for image recognition. In Proceedings of the Proceedings of the IEEE conference on computer vision and pattern recognition, 2016, pp. 770–778.
- Hasan, M.R. Transformer and Convolutional Neural Network Based Hybrid Approaches in Medical Image Classification, Caption Generation, and Retrieval Processes. Master’s thesis, Morgan State University, 2024.
- Nam, Y.; Kim, D.Y.; Kyung, S.; Seo, J.; Song, J.M.; Kwon, J.; Kim, J.; Jo, W.; Park, H.; Sung, J.; et al. Multimodal Large Language Models in Medical Imaging: Current State and Future Directions. Korean Journal of Radiology 2025, 26, 900. [Google Scholar] [CrossRef] [PubMed]
- Van, M.H.; Verma, P.; Wu, X. On large visual language models for medical imaging analysis: An empirical study. In Proceedings of the 2024 IEEE/ACM Conference on Connected Health: Applications, Systems and Engineering Technologies (CHASE). IEEE, 2024, pp. 172–176.
- OpenAI. CLIP ViT-L/14 Model. https://huggingface.co/openai/clip-vit-large-patch14, 2021. Accessed: 2024-05-28.
- Liu, H. LLaVA v1.6 Mistral 7B. https://huggingface.co/liuhaotian/llava-v1.6-mistral-7b, 2023. Published: December 2023. Accessed: 2024-05-28.
- LMSYS. Vicuna 7B, Version 1.3. https://huggingface.co/lmsys/vicuna-7b-v1.3, 2023. Accessed: 2024-05-28.
- Touvron, H.; Lavril, T.; Izacard, G.; Martinet, X.; Lachaux, M.A.; Lacroix, T.; Rozière, B.; Goyal, N.; Hambro, E.; Azhar, F.; et al. Llama: Open and efficient foundation language models. arXiv preprint arXiv:2302.13971 2023.
- Bai, J.; Bai, S.; Chu, Y.; Cui, Z.; Dang, K.; Deng, X.; Fan, Y.; Ge, W.; Han, Y.; Huang, F.; et al. Qwen technical report. arXiv preprint arXiv:2309.16609 2023.
- Bai, S.; Chen, K.; Liu, X.; Wang, J.; Ge, W.; Song, S.; Dang, K.; Wang, P.; Wang, S.; Tang, J.; et al. Qwen2. 5-vl technical report. arXiv preprint arXiv:2502.13923 2025.
- Korrapati, V. Moondream2: A small vision-language model. https://huggingface.co/vikhyatk/moondream2, 2024. Accessed: 2024-05-28.
- Li, Y.; Bubeck, S.; Eldan, R.; Del Giorno, A.; Gunasekar, S.; Lee, Y.T. Textbooks Are All You Need II: phi-1.5 technical report. arXiv preprint arXiv:2309.05463 2023.
- Marafioti, A.; Zohar, O.; Farré, M.; Noyan, M.; Bakouch, E.; Cuenca, P.; Zakka, C.; Allal, L.B.; Lozhkov, A.; Tazi, N.; et al. Smolvlm: Redefining small and efficient multimodal models. arXiv preprint arXiv:2504.05299 2025.
- Dosovitskiy, A.; Beyer, L.; Kolesnikov, A.; Weissenborn, D.; Zhai, X.; Unterthiner, T.; Dehghani, M.; Minderer, M.; Heigold, G.; Gelly, S.; et al. An image is worth 16x16 words: Transformers for image recognition at scale. arXiv preprint arXiv:2010.11929 2020.
- Radford, A.; Wu, J.; Child, R.; Luan, D.; Amodei, D.; Sutskever, I.; et al. Language models are unsupervised multitask learners. OpenAI blog 2019, 1, 9. [Google Scholar]
- Shinde, G.; Ravi, A.; Dey, E.; Sakib, S.; Rampure, M.; Roy, N. A Survey on Efficient Vision-Language Models. Wiley Interdisciplinary Reviews: Data Mining and Knowledge Discovery 2025, 15, e70036. [Google Scholar] [CrossRef]
- Jin, F.; Zhang, J.; Zong, C. Parameter-efficient tuning for large language model without calculating its gradients. In Proceedings of the Proceedings of the 2023 Conference on Empirical Methods in Natural Language Processing, 2023, pp. 321–330.
- Li, M.; Jiang, Y.; Zhang, Y.; Zhu, H. Medical image analysis using deep learning algorithms. Frontiers in public health 2023, 11, 1273253. [Google Scholar] [CrossRef]
- Liu, H.; Tam, D.; Muqeeth, M.; Mohta, J.; Huang, T.; Bansal, M.; Raffel, C.A. Few-shot parameter-efficient fine-tuning is better and cheaper than in-context learning. Advances in Neural Information Processing Systems 2022, 35, 1950–1965. [Google Scholar]
- Prottasha, N.J.; Mahmud, A.; Sobuj, M.S.I.; Bhat, P.; Kowsher, M.; Yousefi, N.; Garibay, O.O. Parameter-efficient fine-tuning of large language models using semantic knowledge tuning. Scientific Reports 2024, 14, 30667. [Google Scholar] [CrossRef]
- Al-Kababji, A.; Bensaali, F.; Dakua, S.P. Scheduling techniques for liver segmentation: Reducelronplateau vs onecyclelr. In Proceedings of the International conference on intelligent systems and pattern recognition. Springer; 2022; pp. 204–212. [Google Scholar]
- Micikevicius, P.; Narang, S.; Alben, J.; Diamos, G.; Elsen, E.; Garcia, D.; Ginsburg, B.; Houston, M.; Kuchaiev, O.; Venkatesh, G.; et al. Mixed Precision Training, 2018, [arXiv:cs.AI/1710.03740].
- Kalamkar, D.; Mudigere, D.; Mellempudi, N.; Das, D.; Banerjee, K.; Avancha, S.; Vooturi, D.T.; Jammalamadaka, N.; Huang, J.; Yuen, H.; et al. A Study of BFLOAT16 for Deep Learning Training, 2019, [arXiv:cs.LG/1905.12322].
- Dao, T. FlashAttention-2: Faster Attention with Better Parallelism and Work Partitioning, 2023, [arXiv:cs.LG/2307.08691].
- Loshchilov, I.; Hutter, F. Decoupled Weight Decay Regularization, 2019, [arXiv:cs.LG/1711.05101].
- Cai, L.; Gao, J.; Zhao, D. A review of the application of deep learning in medical image classification and segmentation. Annals of translational medicine 2020, 8, 713. [Google Scholar] [CrossRef]
- Mao, A.; Mohri, M.; Zhong, Y. Cross-Entropy Loss Functions: Theoretical Analysis and Applications, 2023, [arXiv:cs.LG/2304.07288].
- Kingma, D.P.; Ba, J. Adam: A Method for Stochastic Optimization. CoRR 2014, abs/1412.6980.
- Damm, H.; Pakull, T.M.; Becker, H.; Bracke, B.; Eryilmaz, B.; Bloch, L.; Brüngel, R.; Schmidt, C.S.; Rückert, J.; Pelka, O.; et al. Overview of ImageCLEFmedical 2025–medical concept detection and interpretable caption generation. CLEF, 2025.
- Codella, N.C.; Jin, Y.; Jain, S.; Gu, Y.; Lee, H.H.; Abacha, A.B.; Santamaria-Pang, A.; Guyman, W.; Sangani, N.; Zhang, S.; et al. Medimageinsight: An open-source embedding model for general domain medical imaging. arXiv preprint arXiv:2410.06542 2024.
- Zhang, T.; Kishore, V.; Wu, F.; Weinberger, K.Q.; Artzi, Y. Bertscore: Evaluating text generation with bert. arXiv preprint arXiv:1904.09675 2019.
- He, P.; Liu, X.; Gao, J.; Chen, W. DEBERTA: DECODING-ENHANCED BERT WITH DISENTANGLED ATTENTION. In Proceedings of the International Conference on Learning Representations, 2021.
- Lin, C.Y. Rouge: A package for automatic evaluation of summaries. In Proceedings of the Text summarization branches out, 2004, pp. 74–81.
- Sellam, T.; Das, D.; Parikh, A.P. BLEURT: Learning robust metrics for text generation. arXiv preprint arXiv:2004.04696 2020.
- Kraljevic, Z.; Searle, T.; Shek, A.; Roguski, L.; Noor, K.; Bean, D.; Mascio, A.; Zhu, L.; Folarin, A.A.; Roberts, A.; et al. Multi-domain clinical natural language processing with MedCAT: the medical concept annotation toolkit. Artificial intelligence in medicine 2021, 117, 102083. [Google Scholar] [CrossRef]
- Yim, W.w.; Fu, Y.; Ben Abacha, A.; Snider, N.; Lin, T.; Yetisgen, M. Aci-bench: a novel ambient clinical intelligence dataset for benchmarking automatic visit note generation. Scientific data 2023, 10, 586. [Google Scholar] [CrossRef] [PubMed]
- Liu, Y.; Ott, M.; Goyal, N.; Du, J.; Joshi, M.; Chen, D.; Levy, O.; Lewis, M.; Zettlemoyer, L.; Stoyanov, V. Roberta: A robustly optimized bert pretraining approach. arXiv preprint arXiv:1907.11692 2019.
- Puth, M.T.; Neuhäuser, M.; Ruxton, G.D. Effective use of Spearman’s and Kendall’s correlation coefficients for association between two measured traits. Animal Behaviour 2015, 102, 77–84. [Google Scholar] [CrossRef]
- Eden, S.K.; Li, C.; Shepherd, B.E. Nonparametric estimation of Spearman’s rank correlation with bivariate survival data. Biometrics 2022, 78, 421–434. [Google Scholar] [CrossRef] [PubMed]
- Xie, Q.; Chen, Q.; Chen, A.; Peng, C.; Hu, Y.; Lin, F.; Peng, X.; Huang, J.; Zhang, J.; Keloth, V.; et al. Me-llama: Foundation large language models for medical applications. Research square 2024, pp. rs–3.
Figure 1.
Data preparation pipeline showing image standardization and text normalization procedures.
Figure 1.
Data preparation pipeline showing image standardization and text normalization procedures.
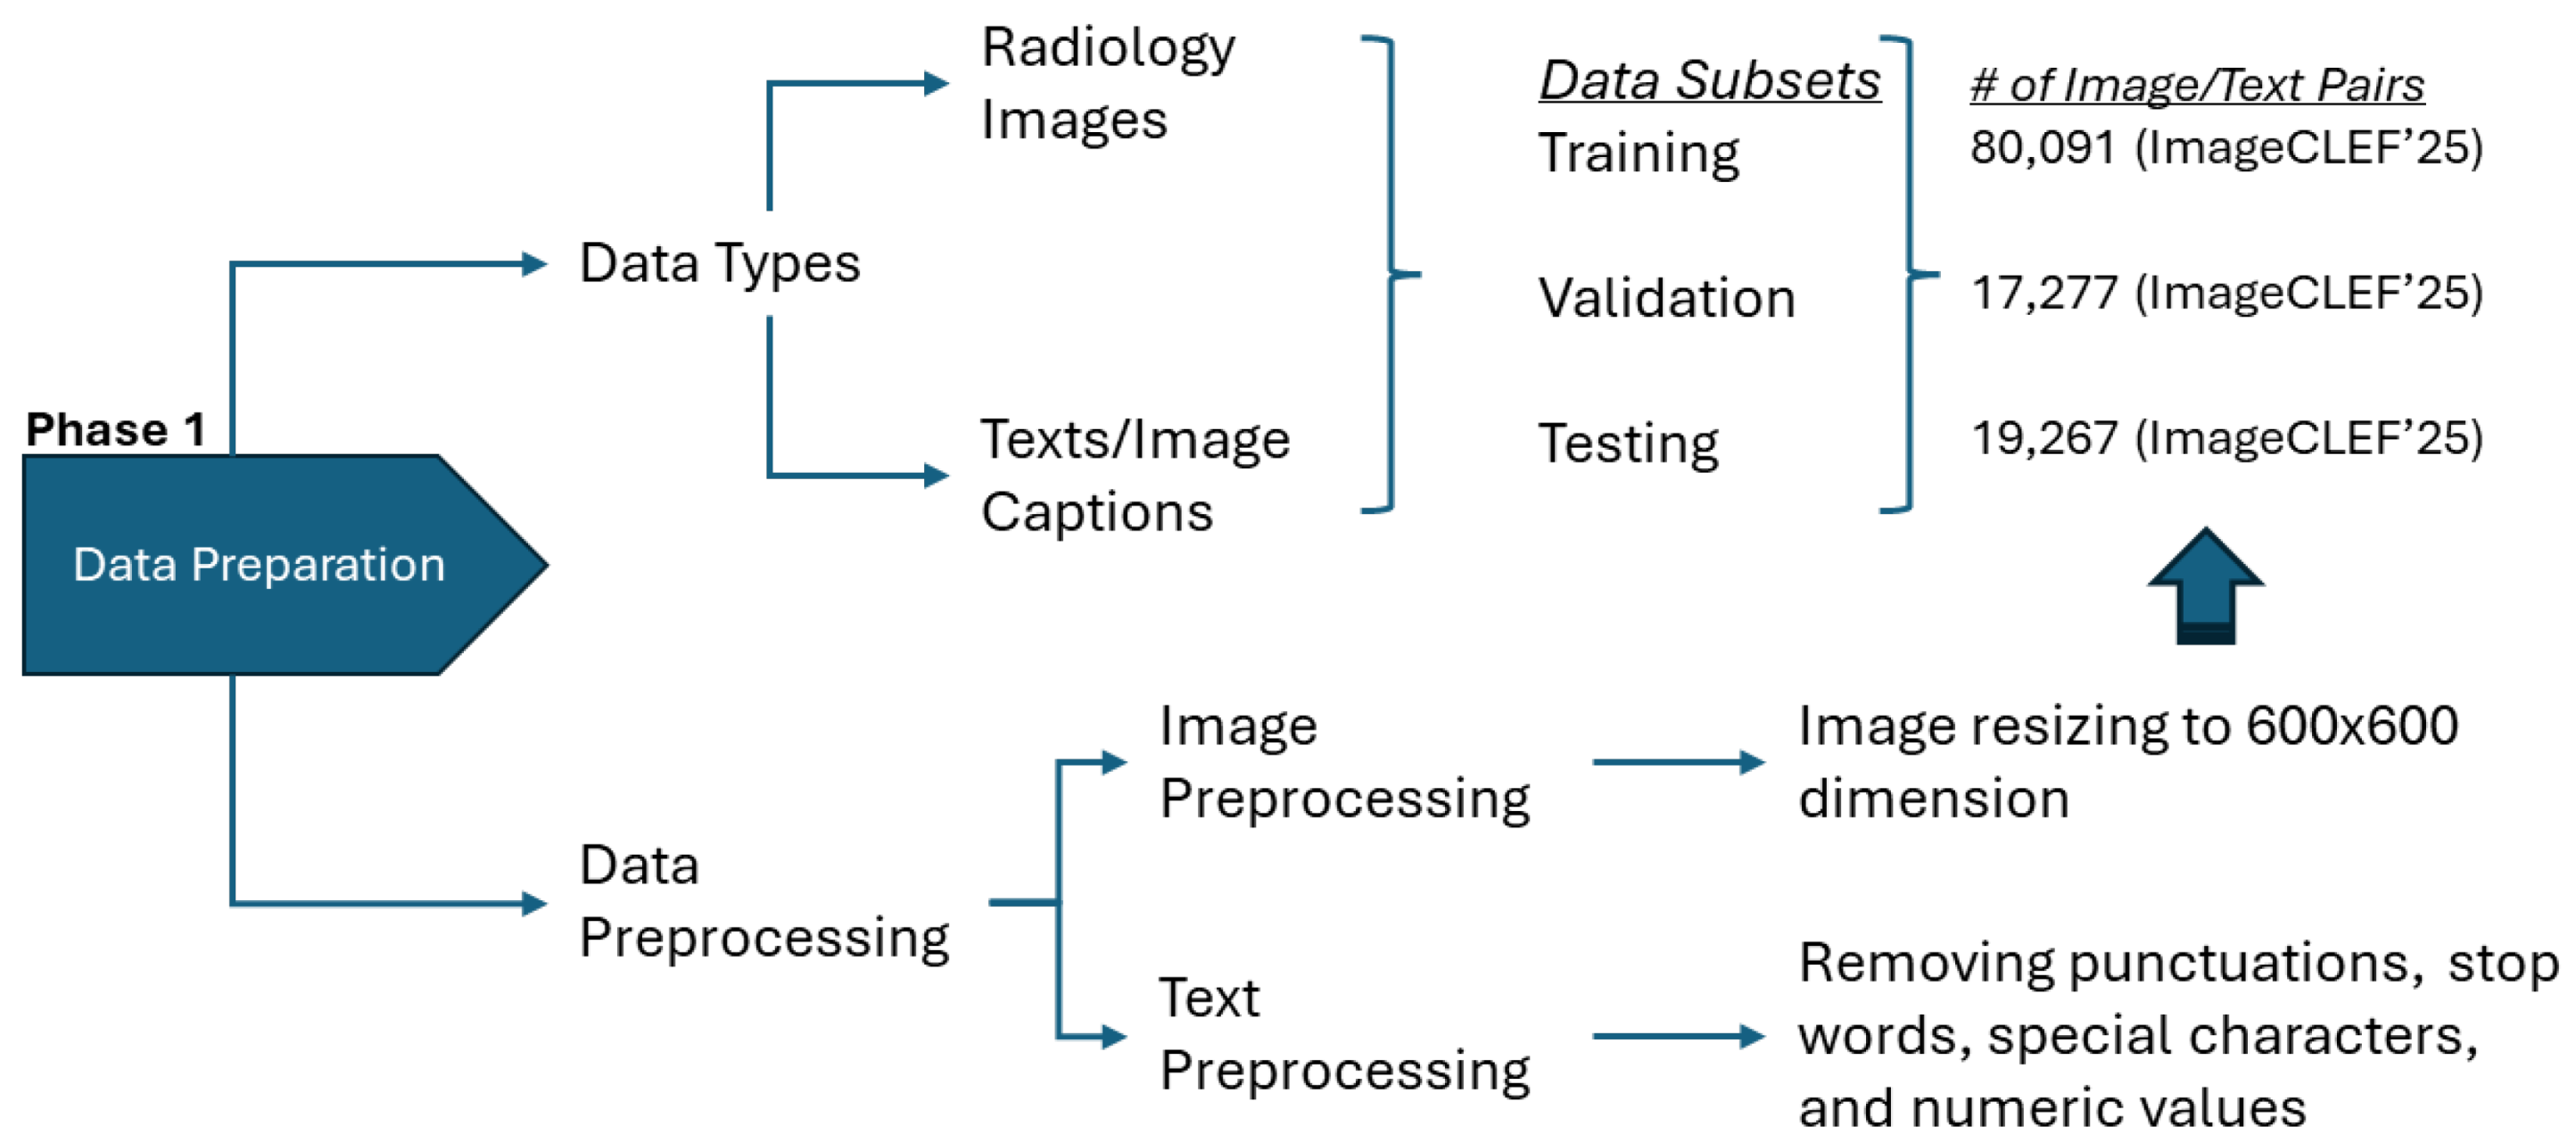
Figure 2.
Model preparation taxonomy: categorization of LVLMs, SVLMs, and baseline architectures evaluated.
Figure 2.
Model preparation taxonomy: categorization of LVLMs, SVLMs, and baseline architectures evaluated.
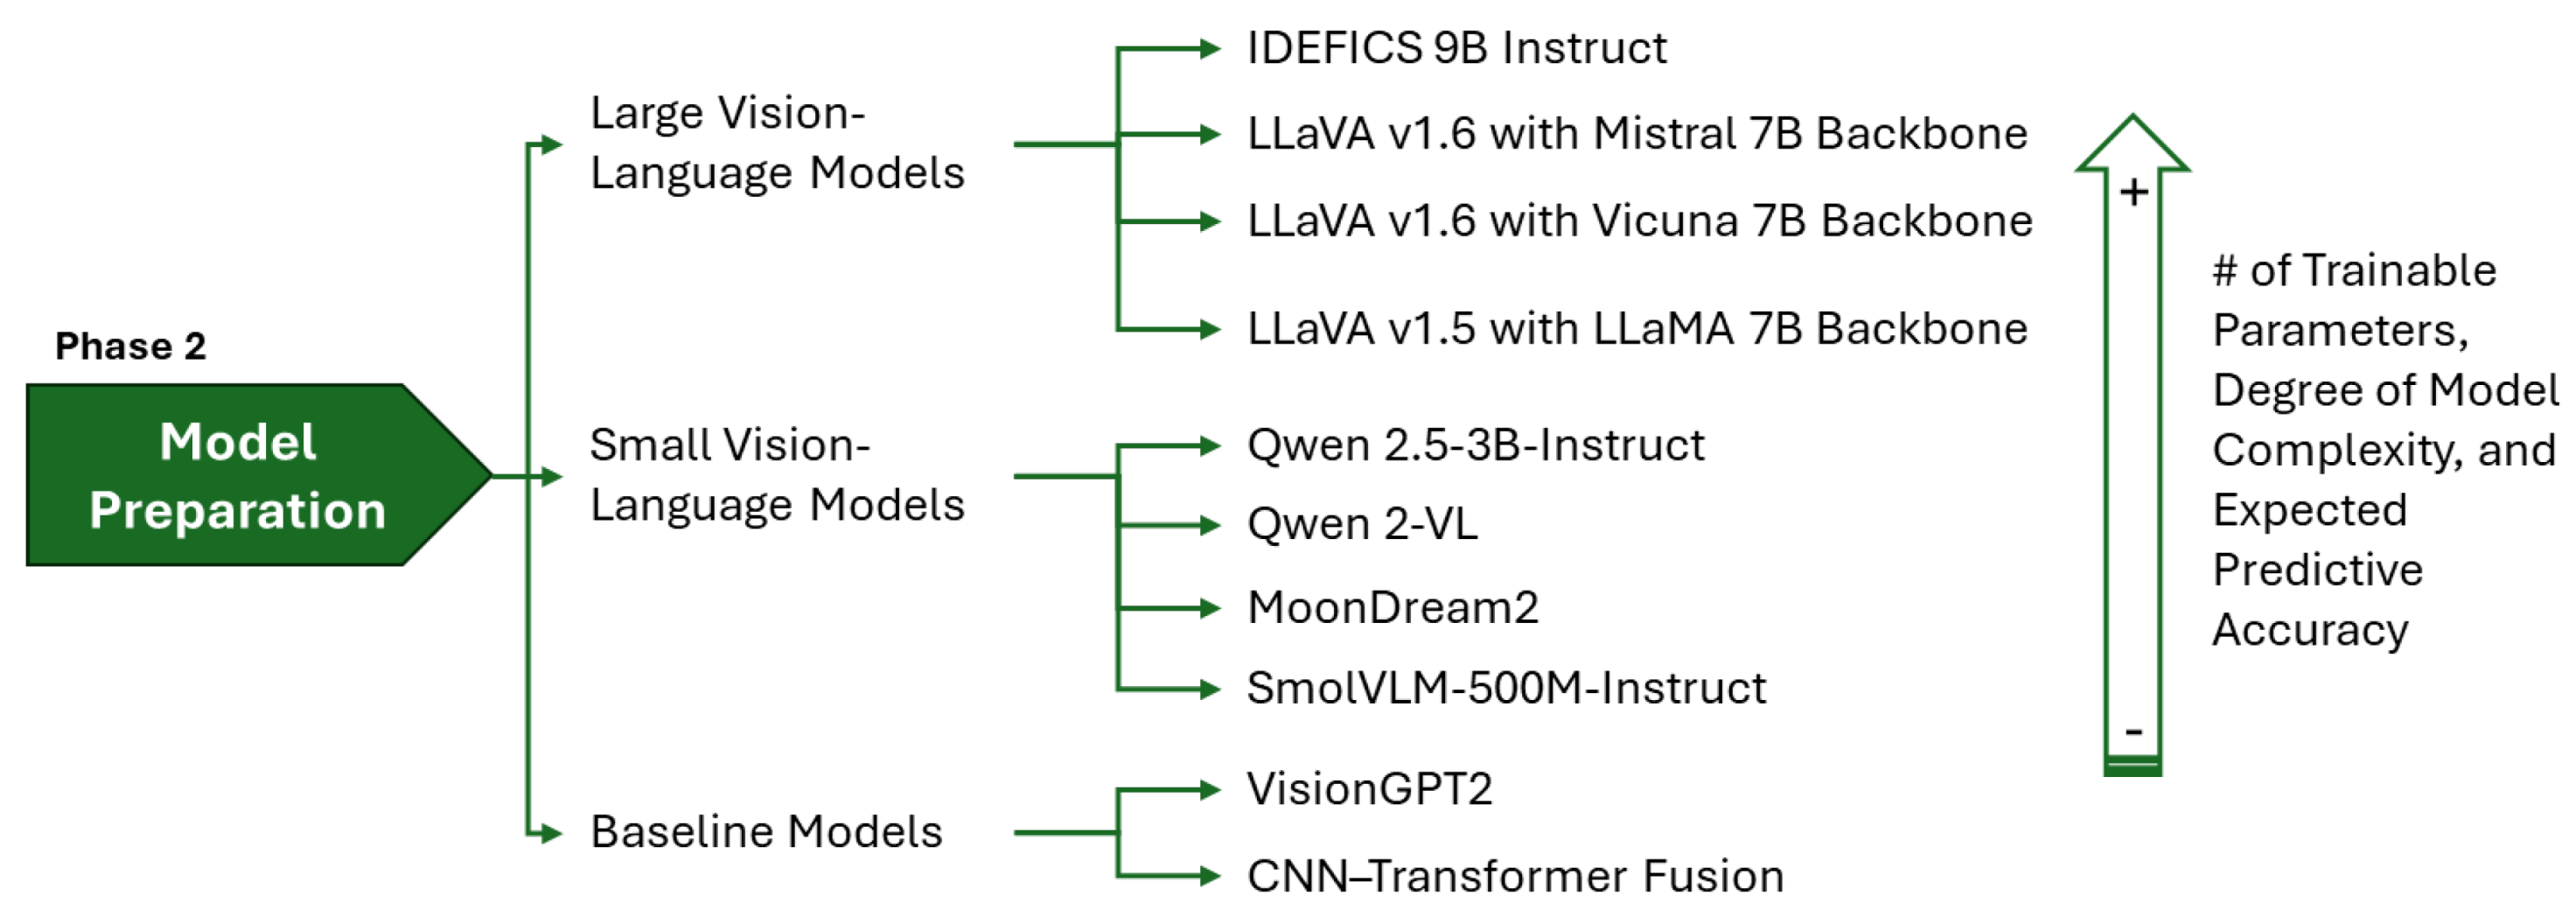
Figure 3.
Conceptual frameworks of the corresponding LVLMs, SVLMs, and baseline architectures.
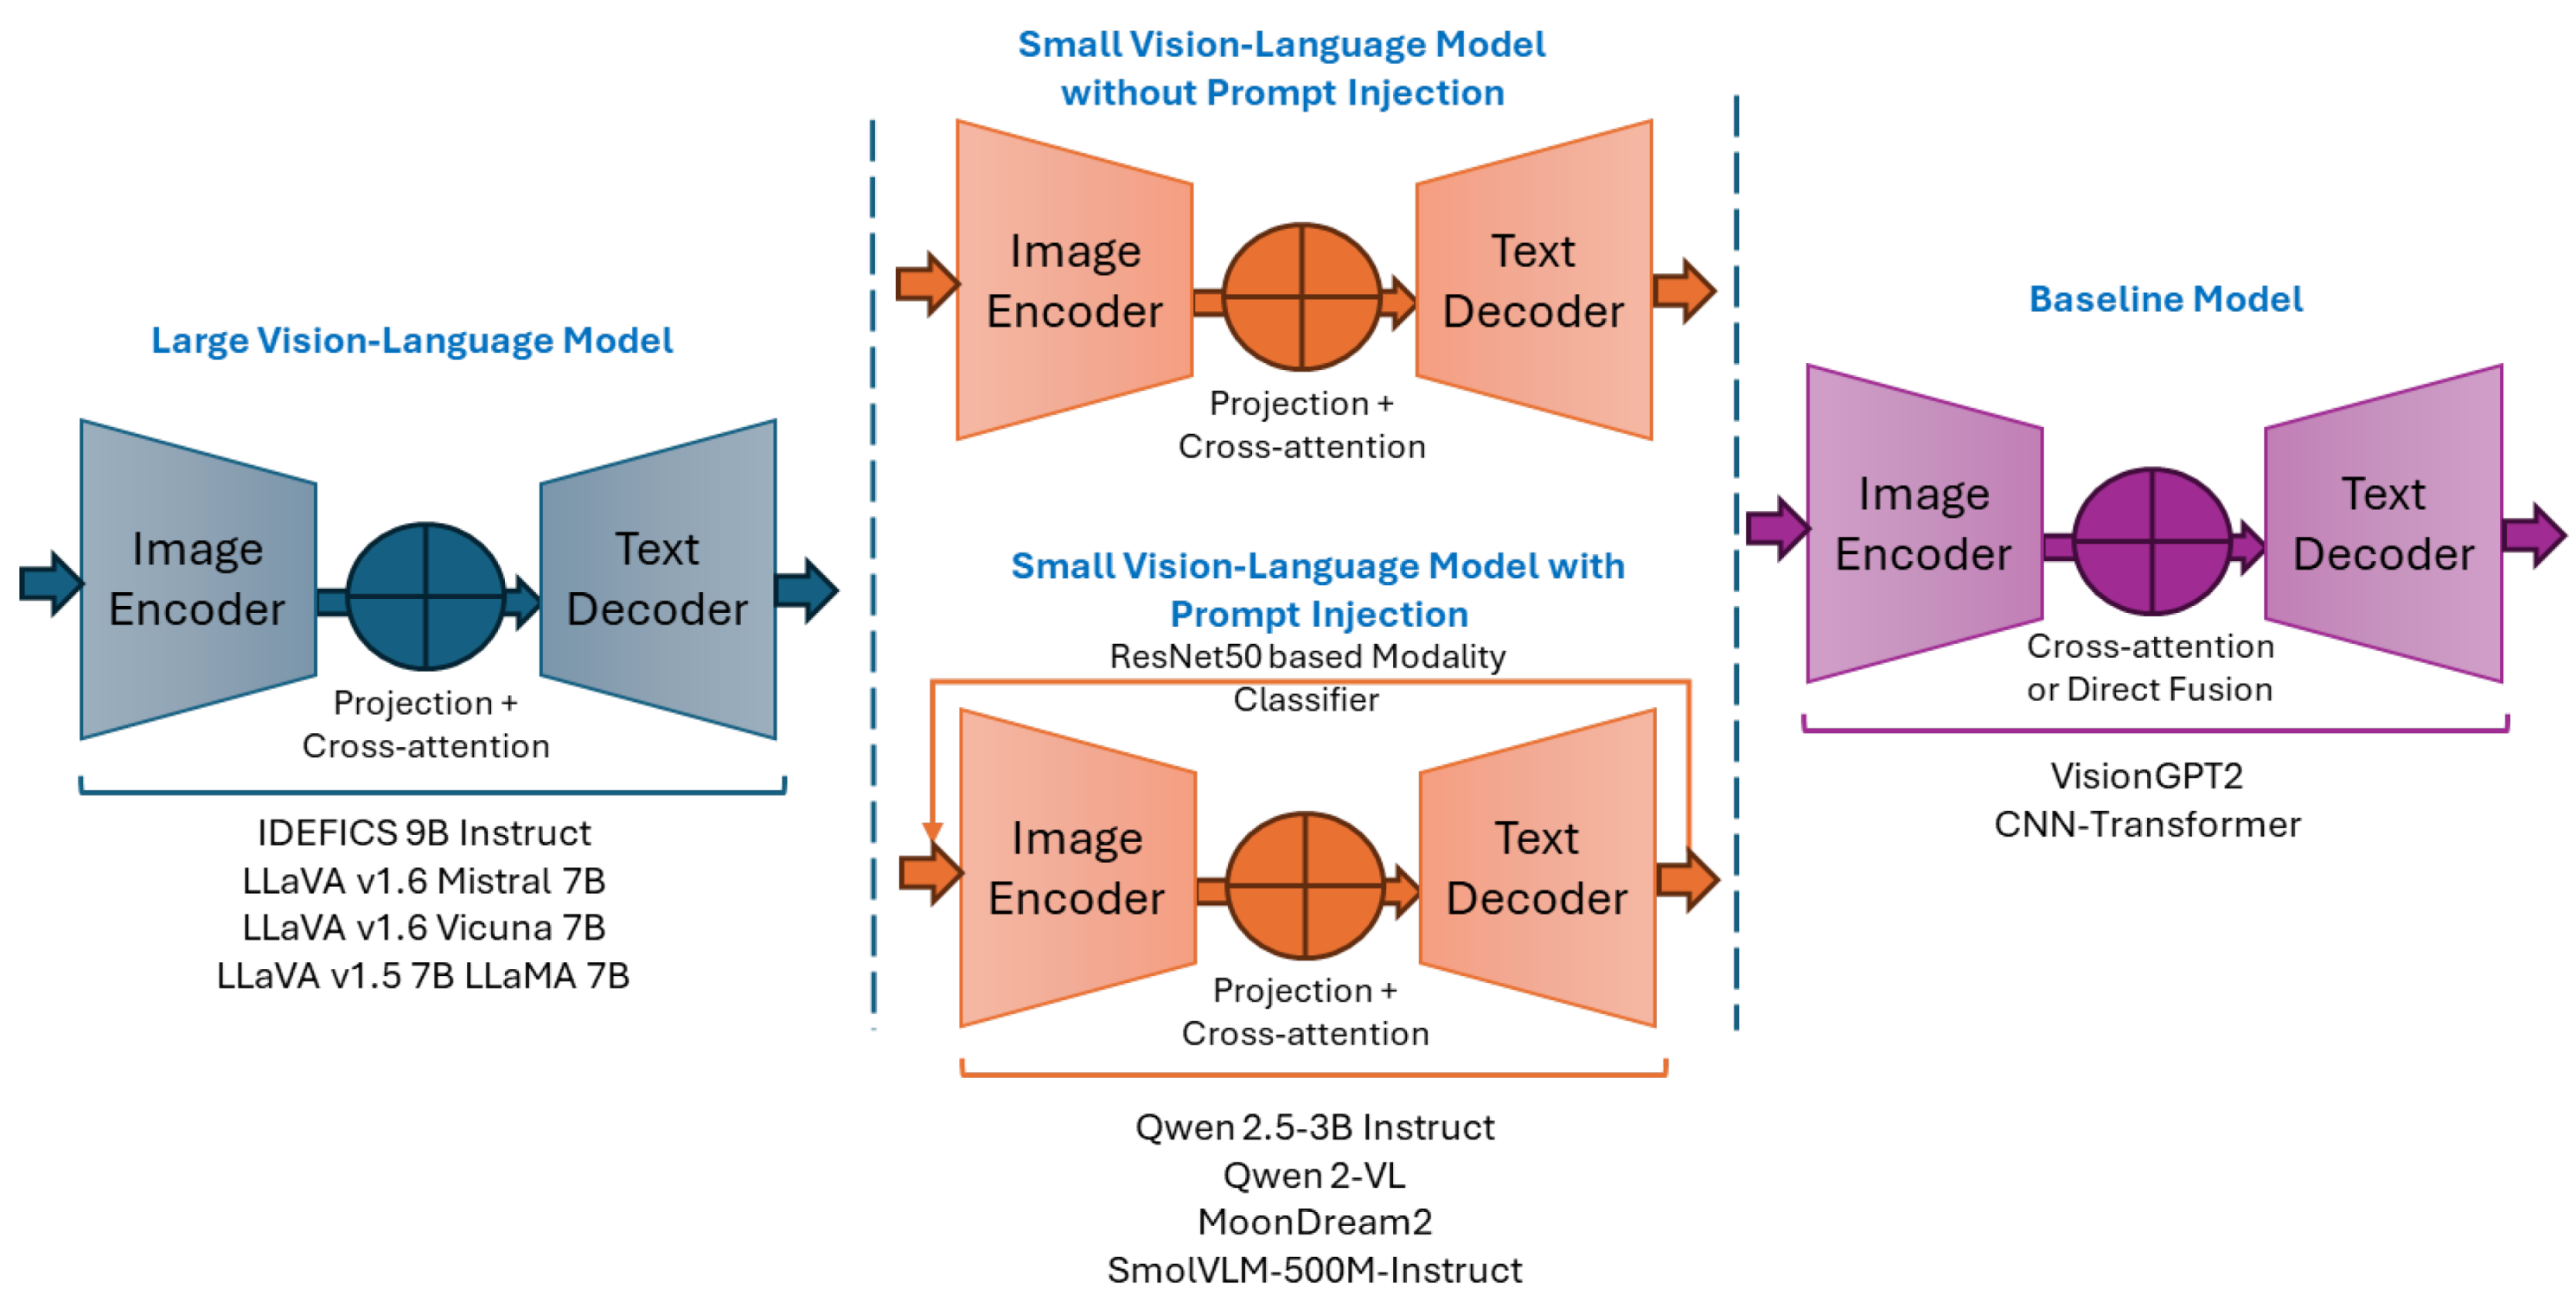
Figure 4.
Training strategy allocation for baselines models and VLMs.
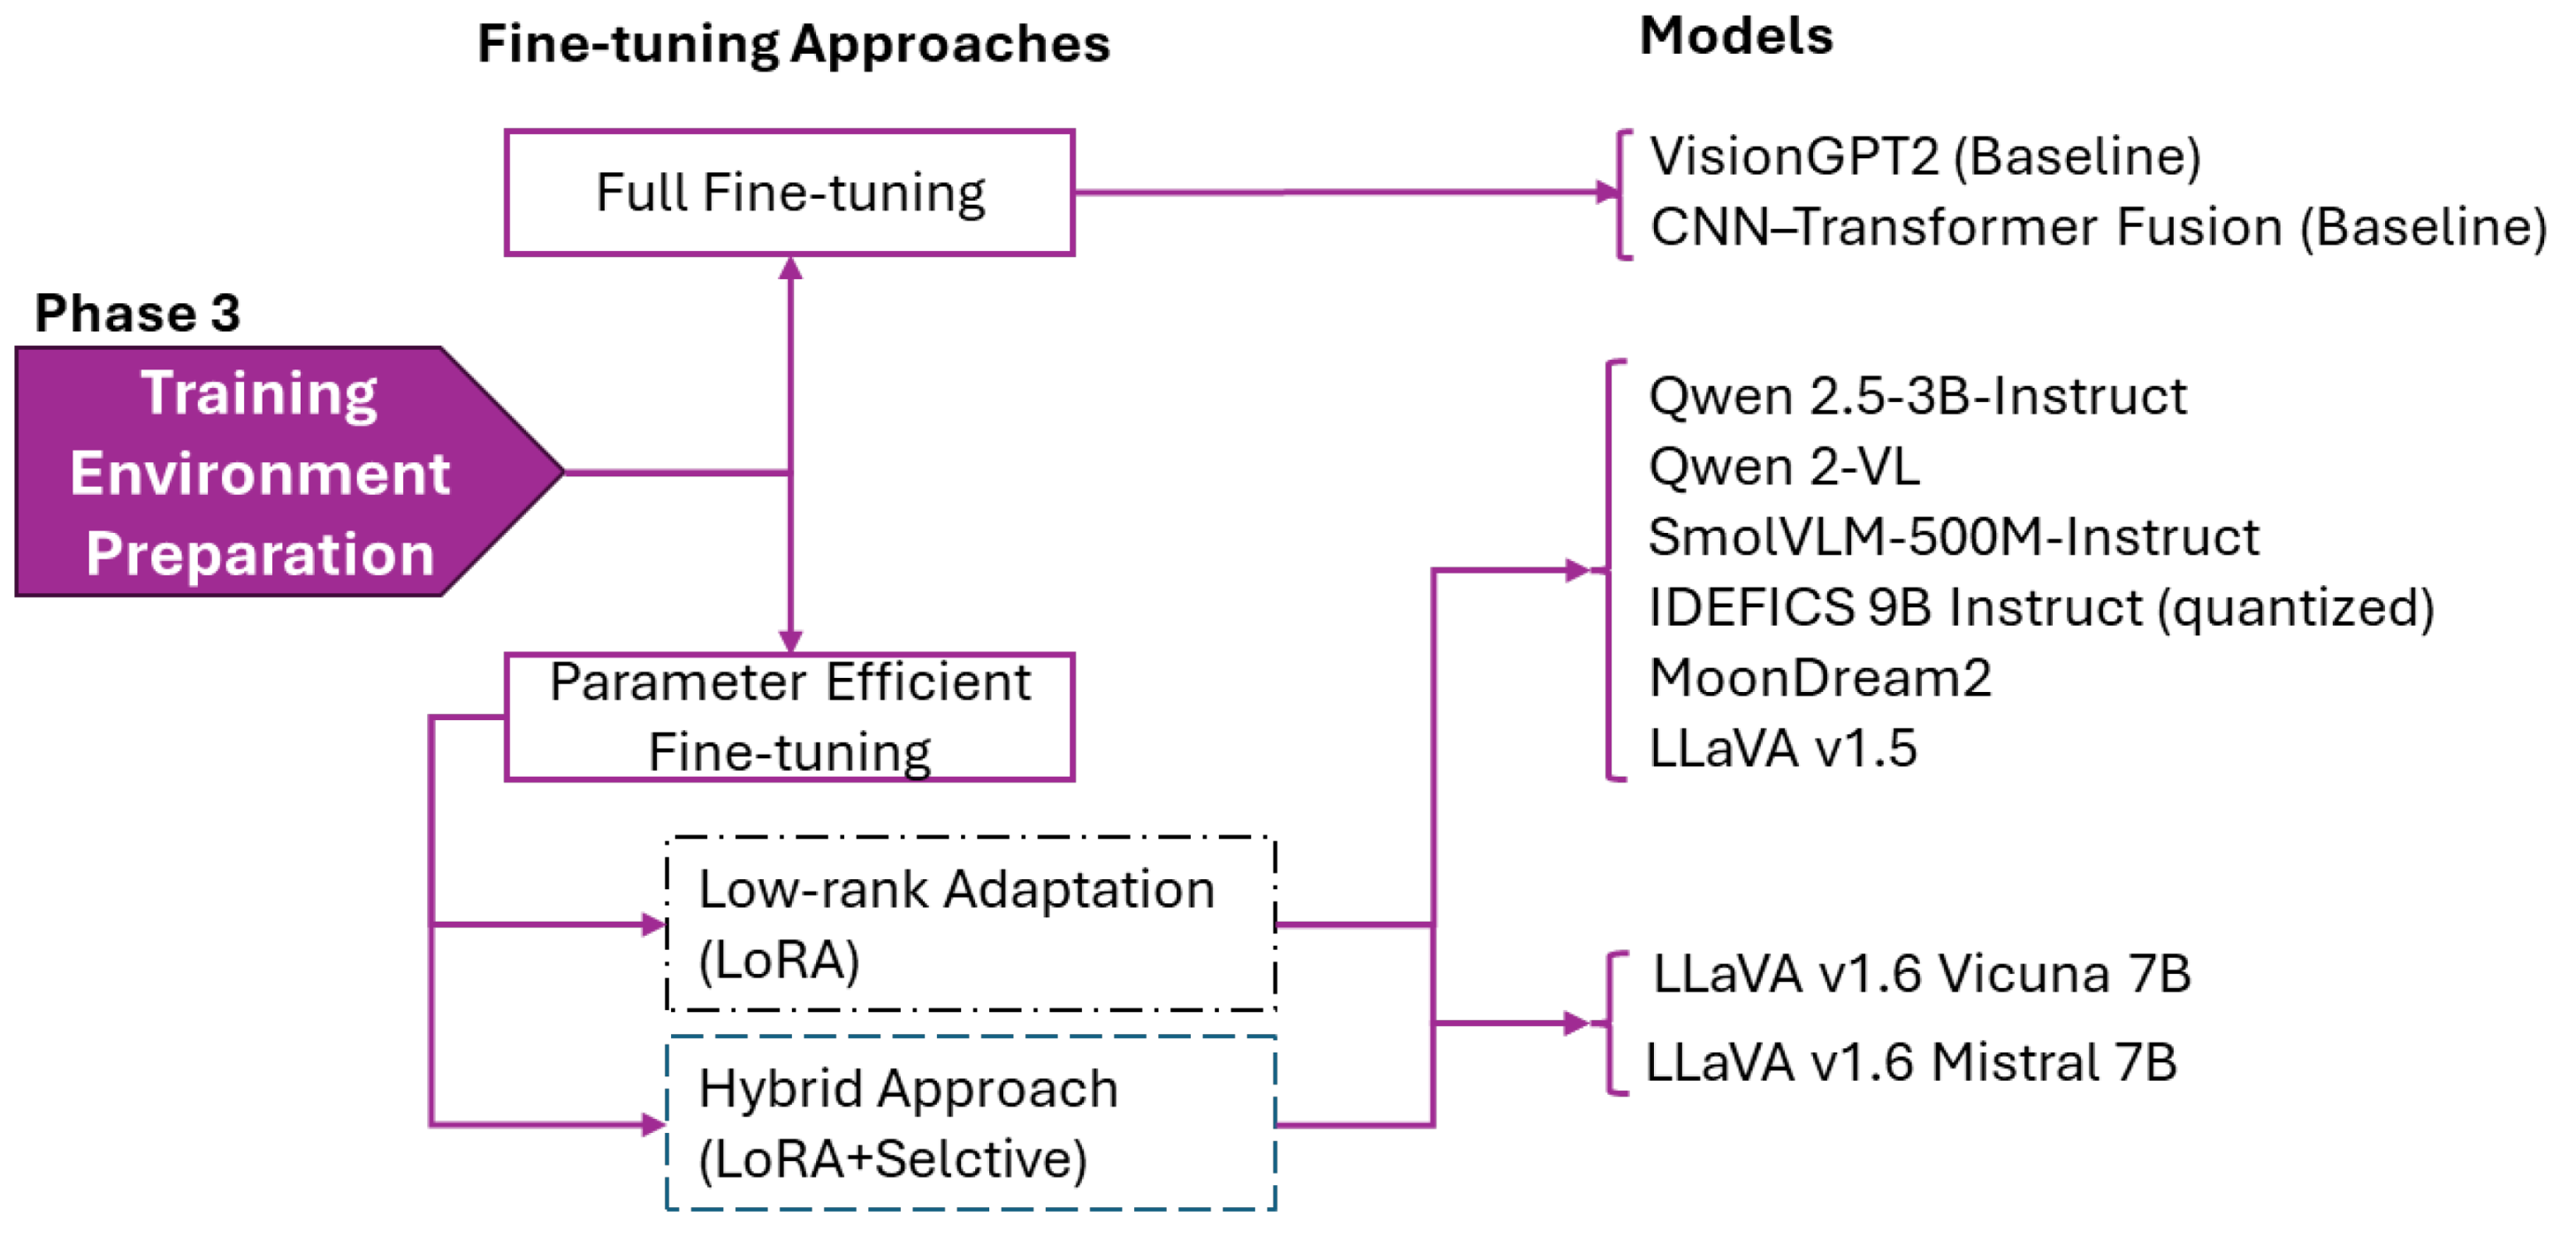
Figure 5.
Evaluation framework with relevance metrics used to assess caption quality.
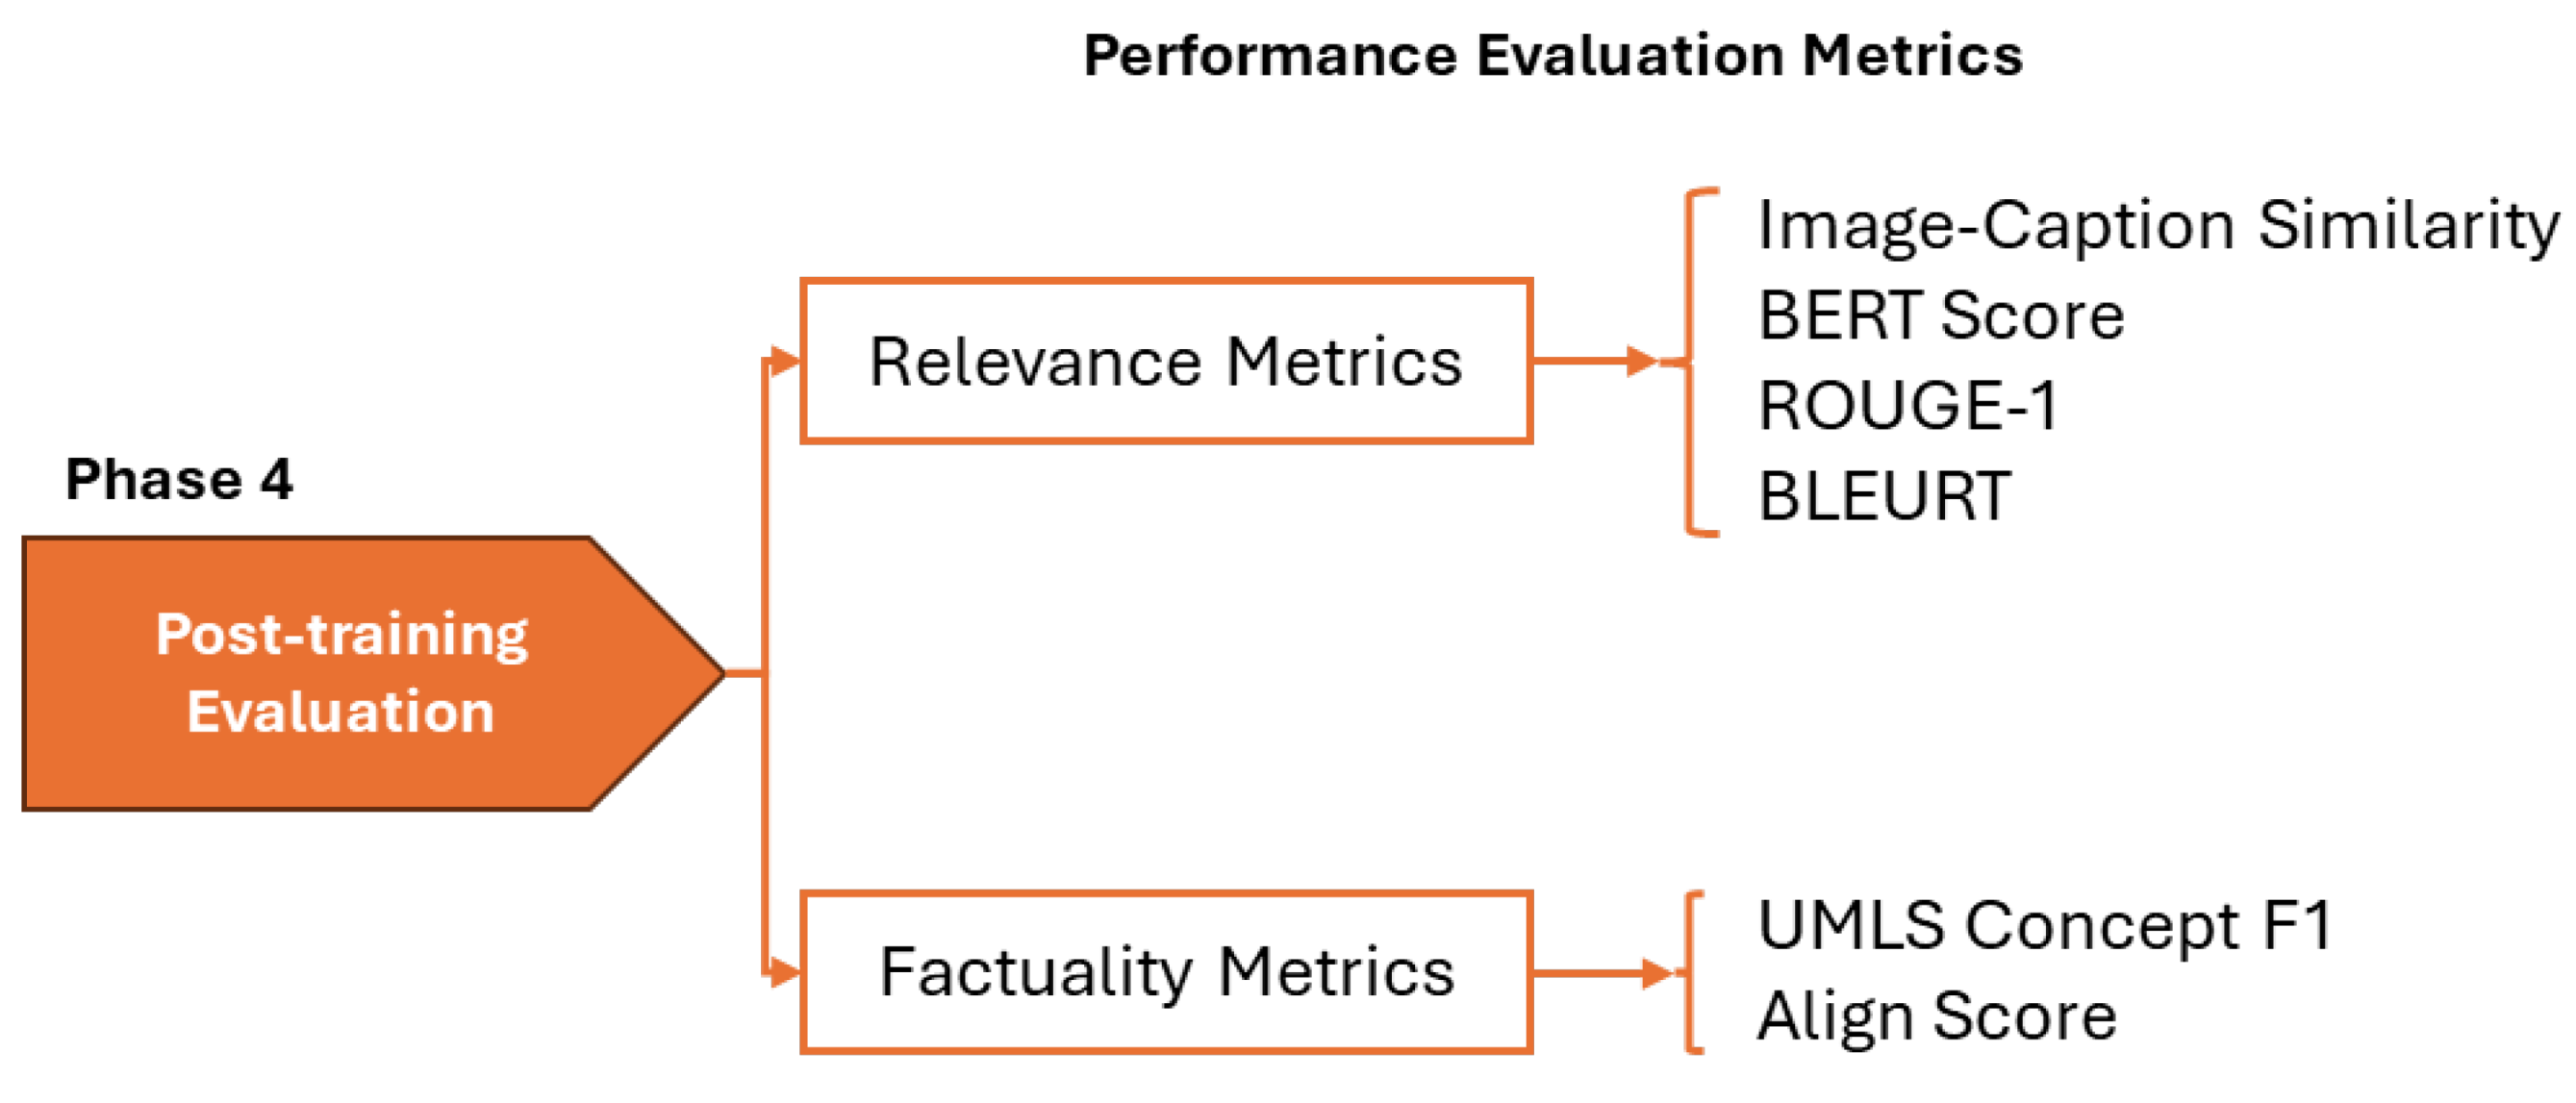
Figure 6.
Comparison of targeted, extended, and hybrid adaptation strategies for LLaVA-1.6 Mistral-7B across six evaluation metrics. The targeted approach, with 40.1M trainable parameters (0.53%), achieves the highest image-caption similarity and shows competitive performance on BERTScore, ROUGE, BLEURT, and the factuality metrics (UMLS Concepts F1 and AlignScore).
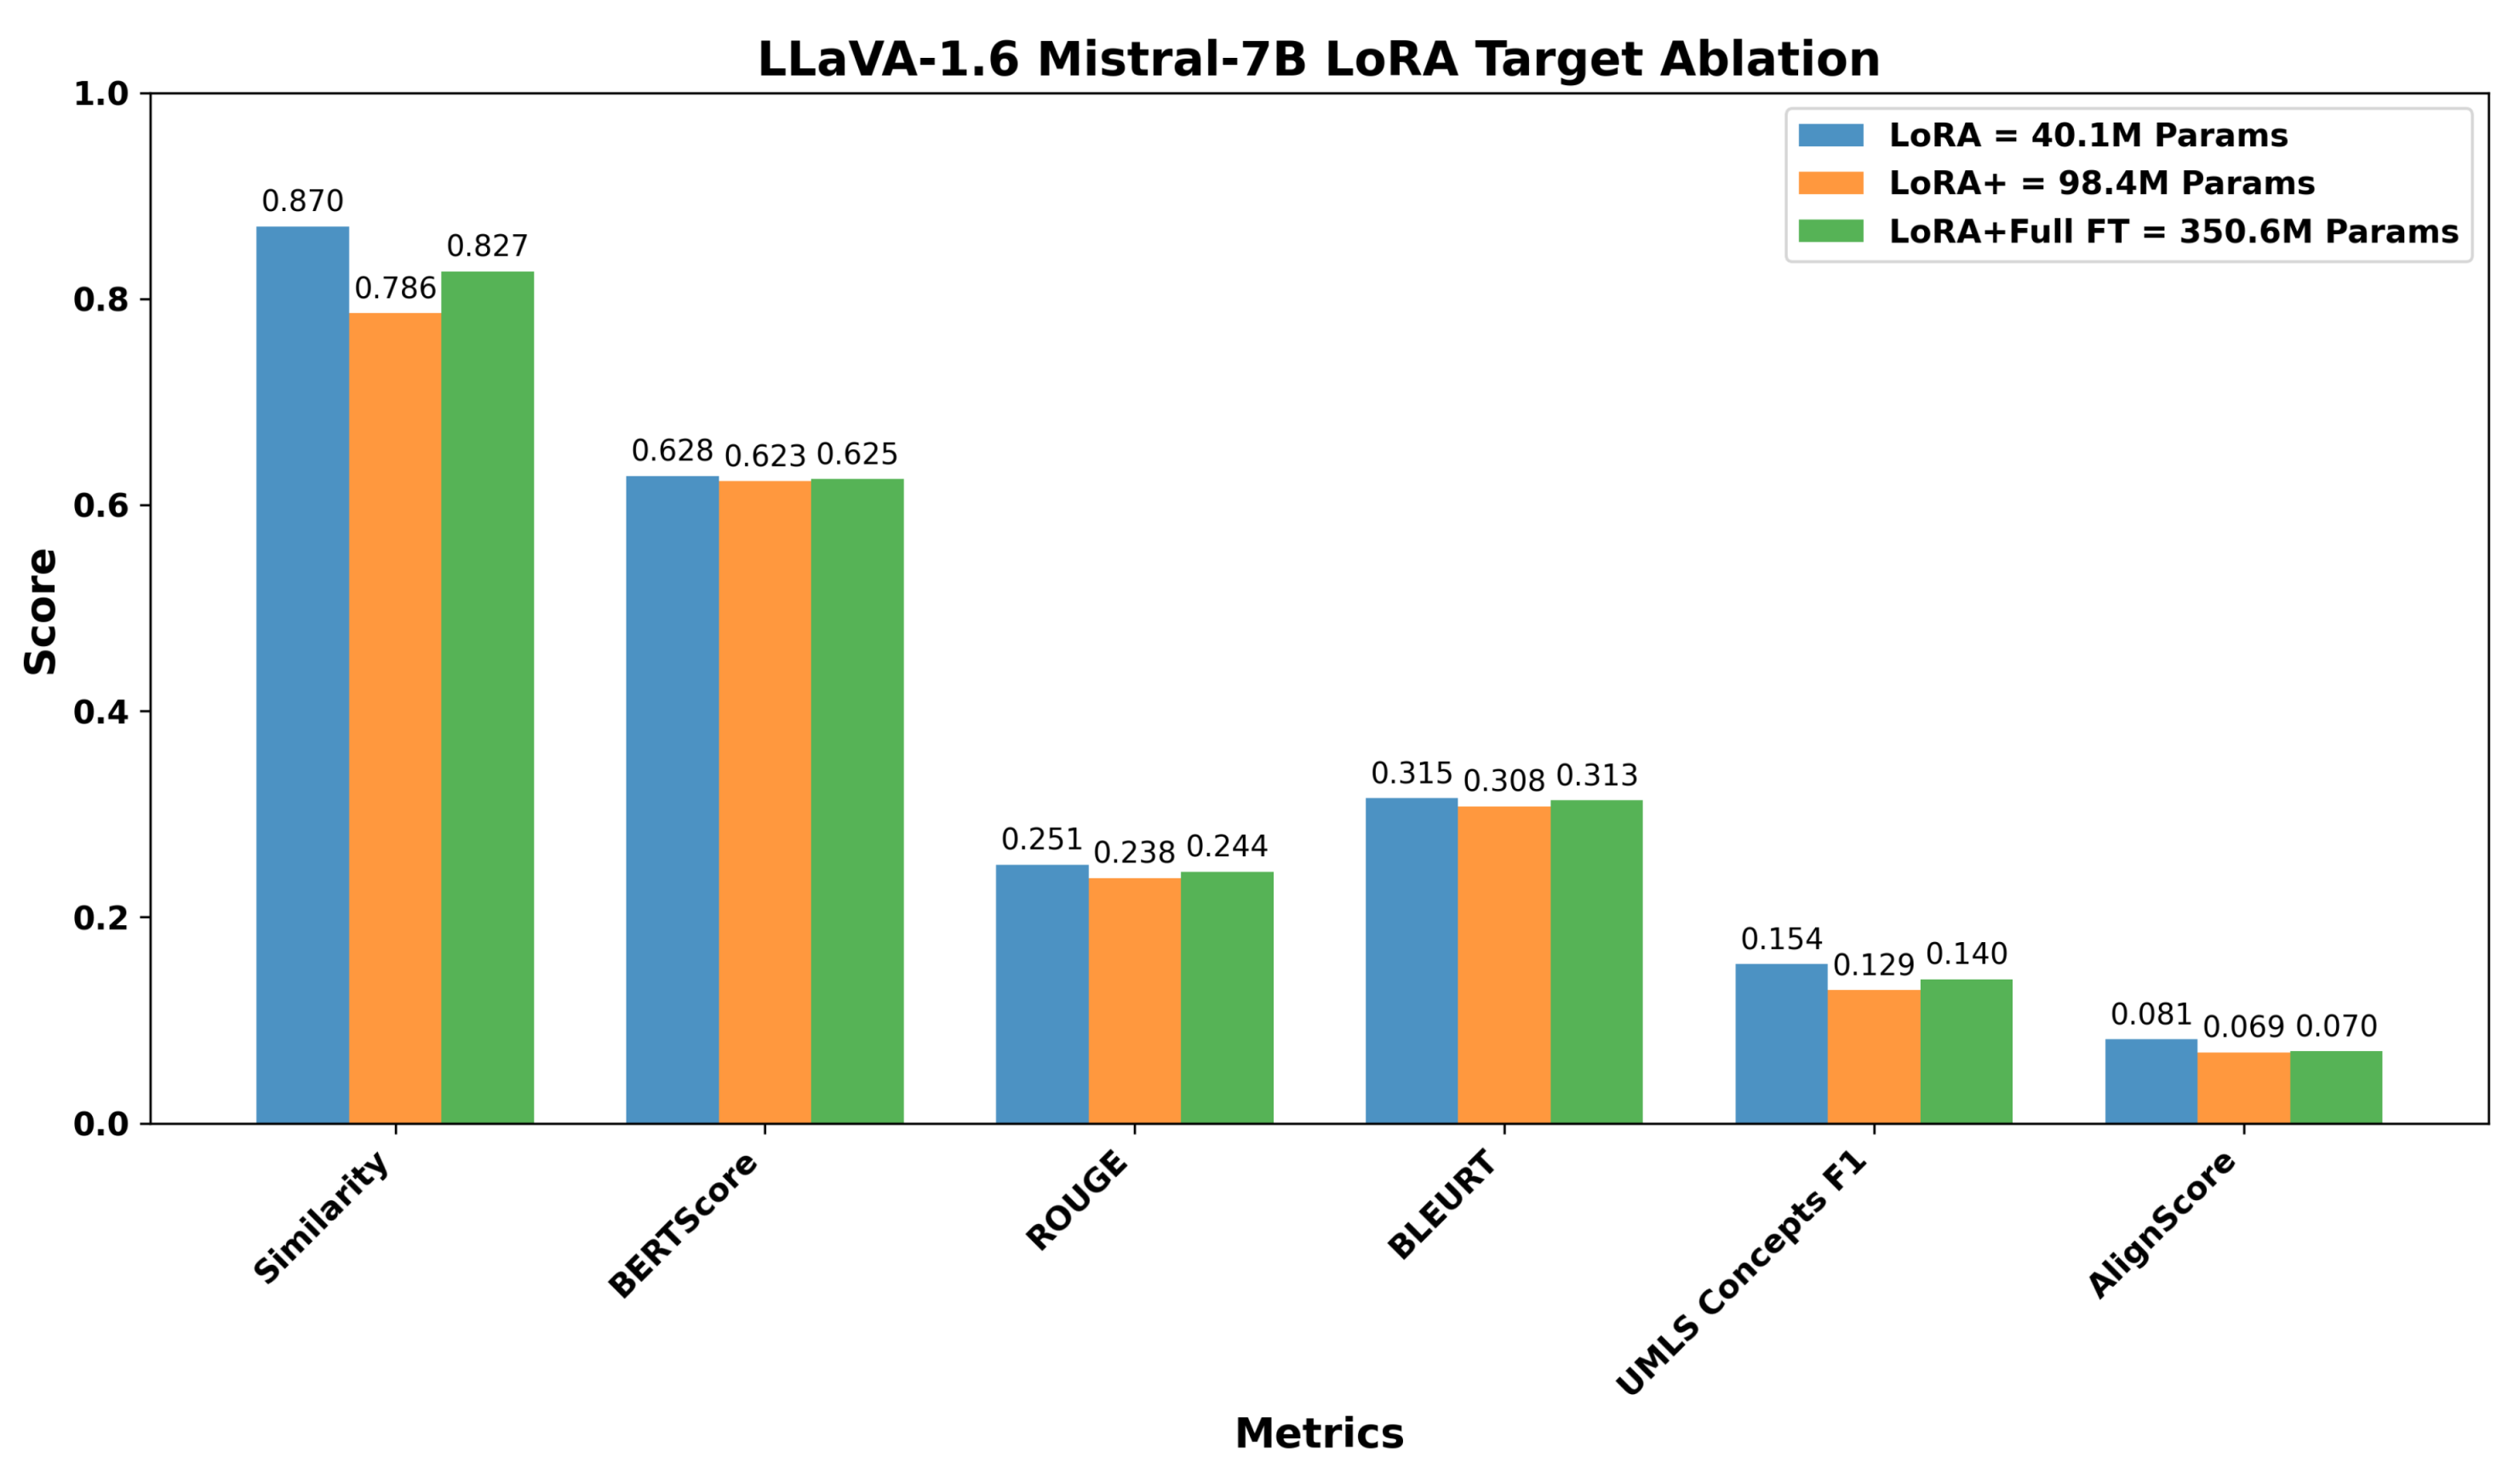
Figure 7.
Comparison of targeted and hybrid adaptation strategies for LLaVA-1.6 Vicuna-7B across six evaluation metrics. The targeted LoRA, with 34.4M trainable parameters (0.48%), consistently achieves stronger image-caption similarity and higher scores in BERTScore, ROUGE, BLEURT, as well as improved factuality (UMLS Concepts F1 and AlignScore), compared to the hybrid strategy that trains ten times more parameters.
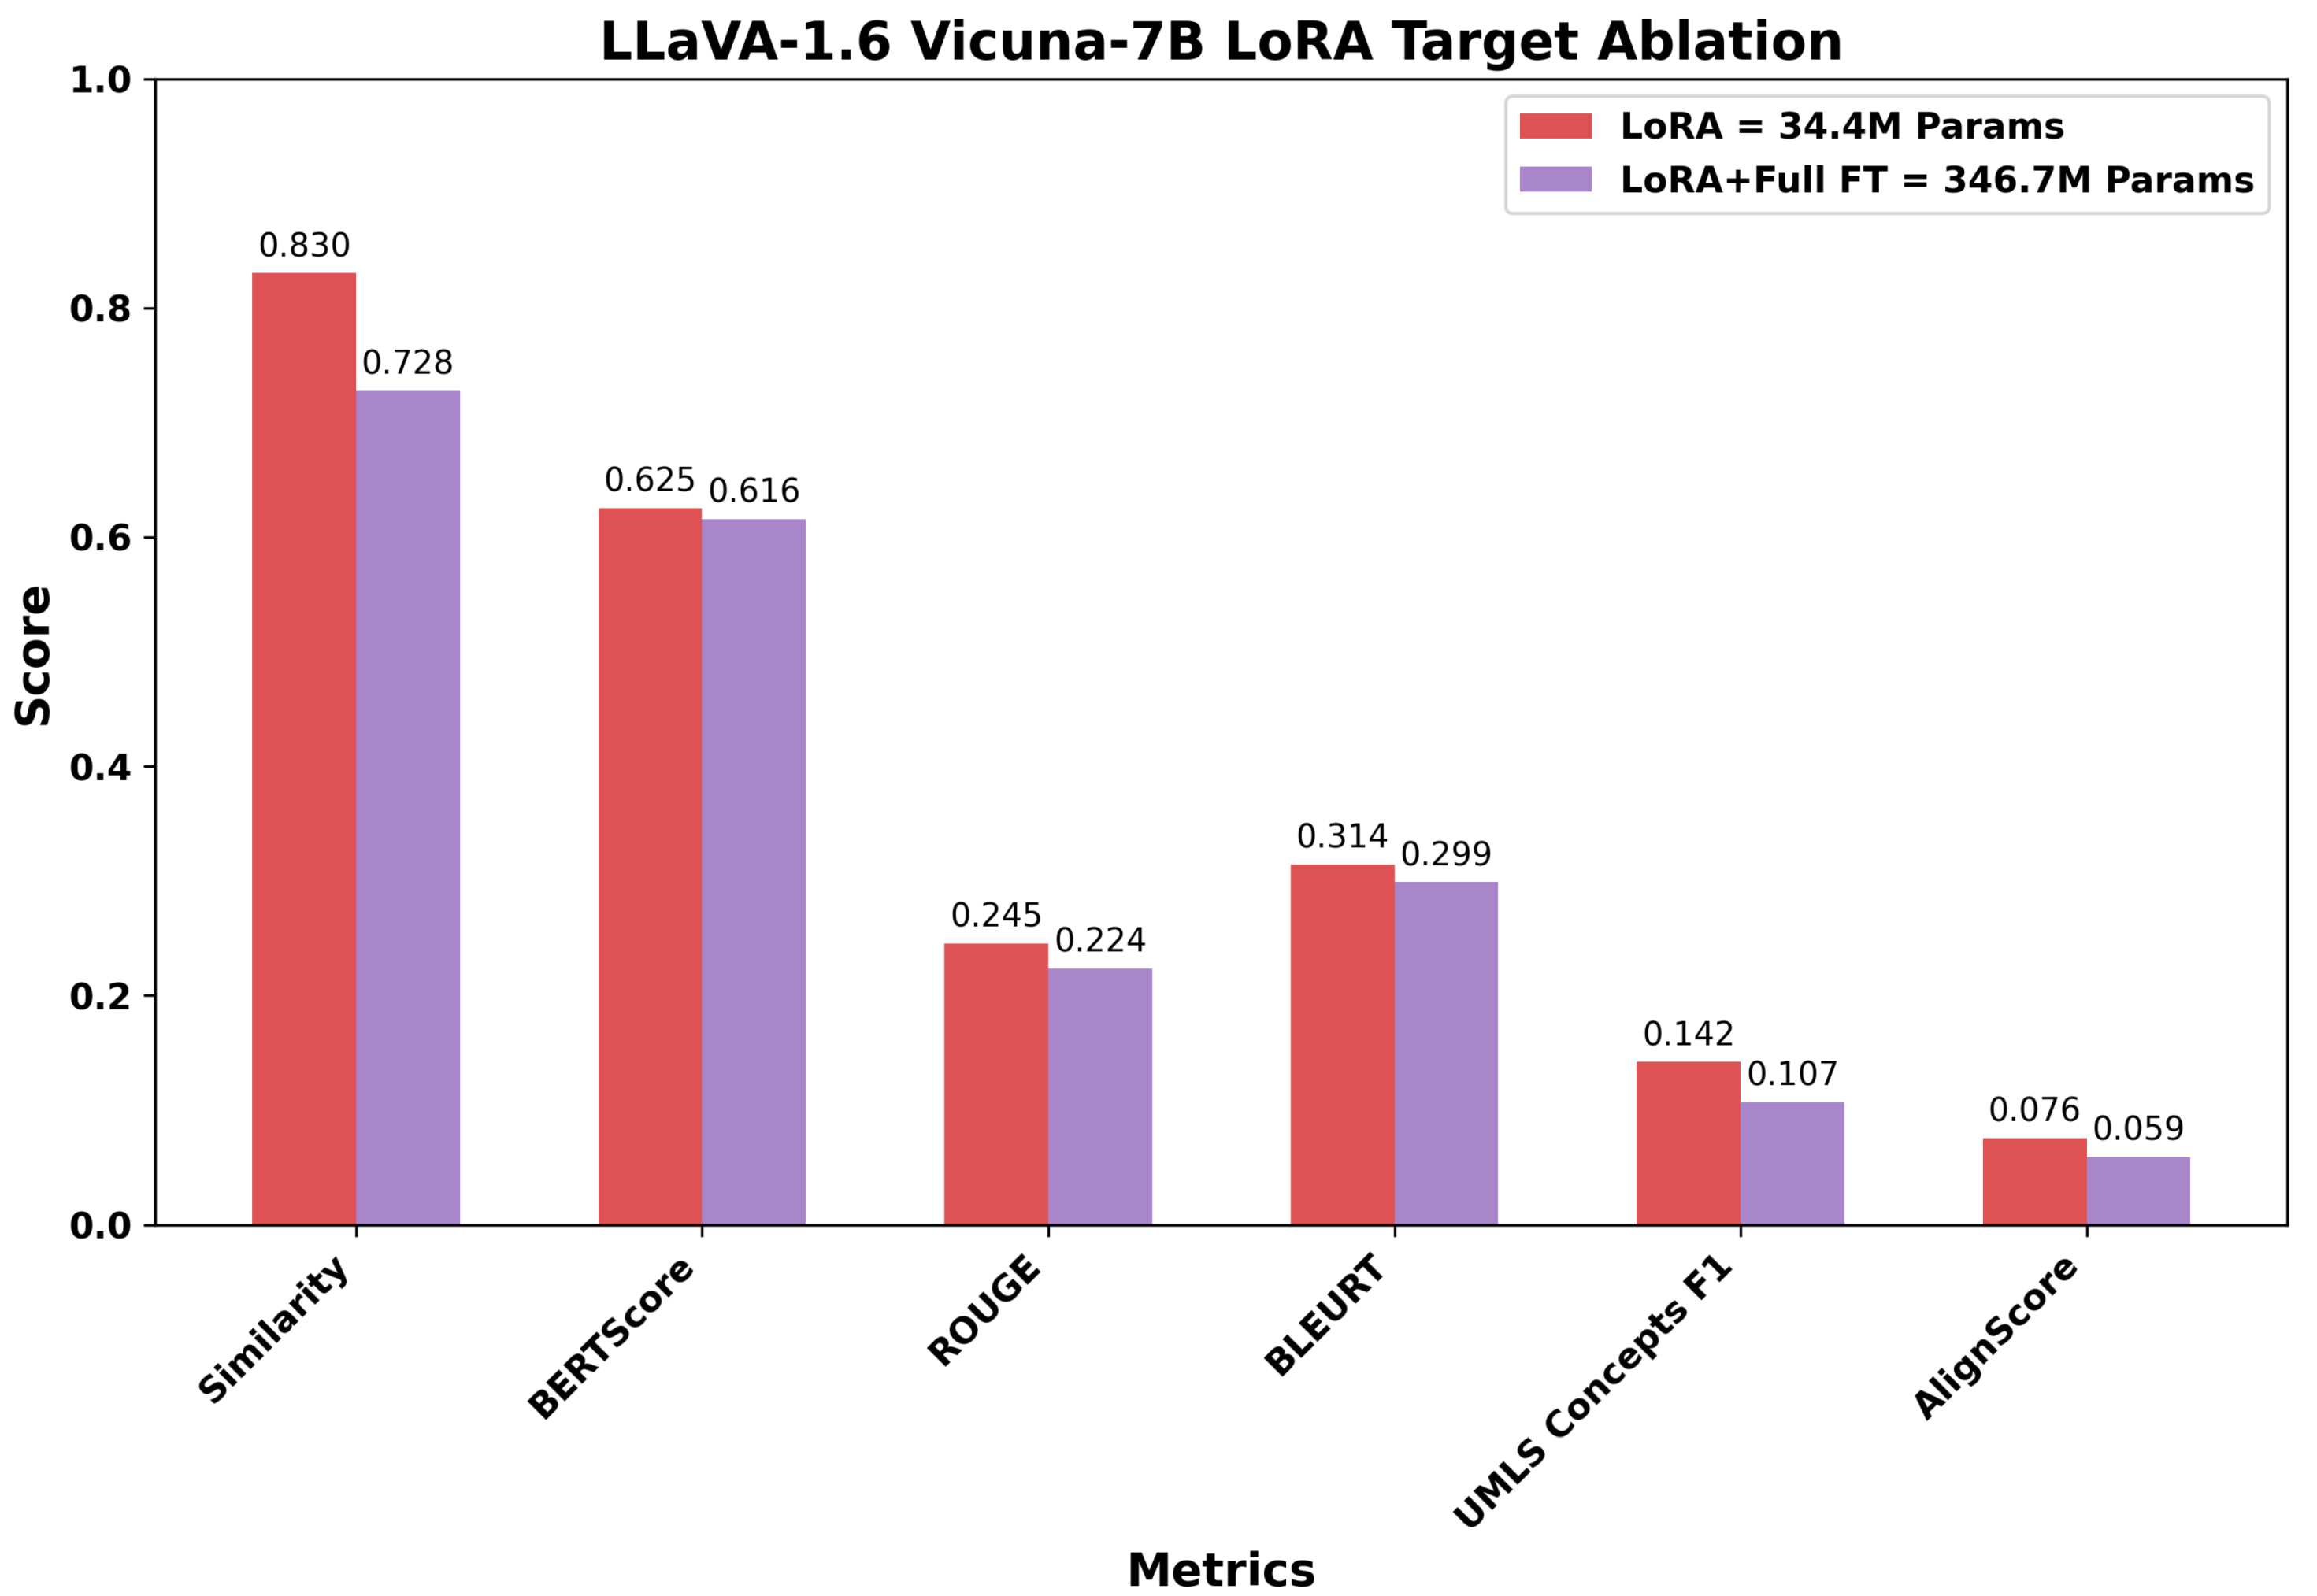
Figure 8.
Overall performance scores across model categories. LVLMs (blue) and SVLMs (orange) consistently outperform baseline models (red). The dashed line indicates the VisionGPT2 baseline performance (0.177), showing all LoRA-adapted models exceed this threshold. While LVLMs generally achieve higher performance than SVLMs, MoonDream2 represents a notable exception, achieving performance comparable to LLaVA-1.5 despite having approximately 74% fewer parameters.
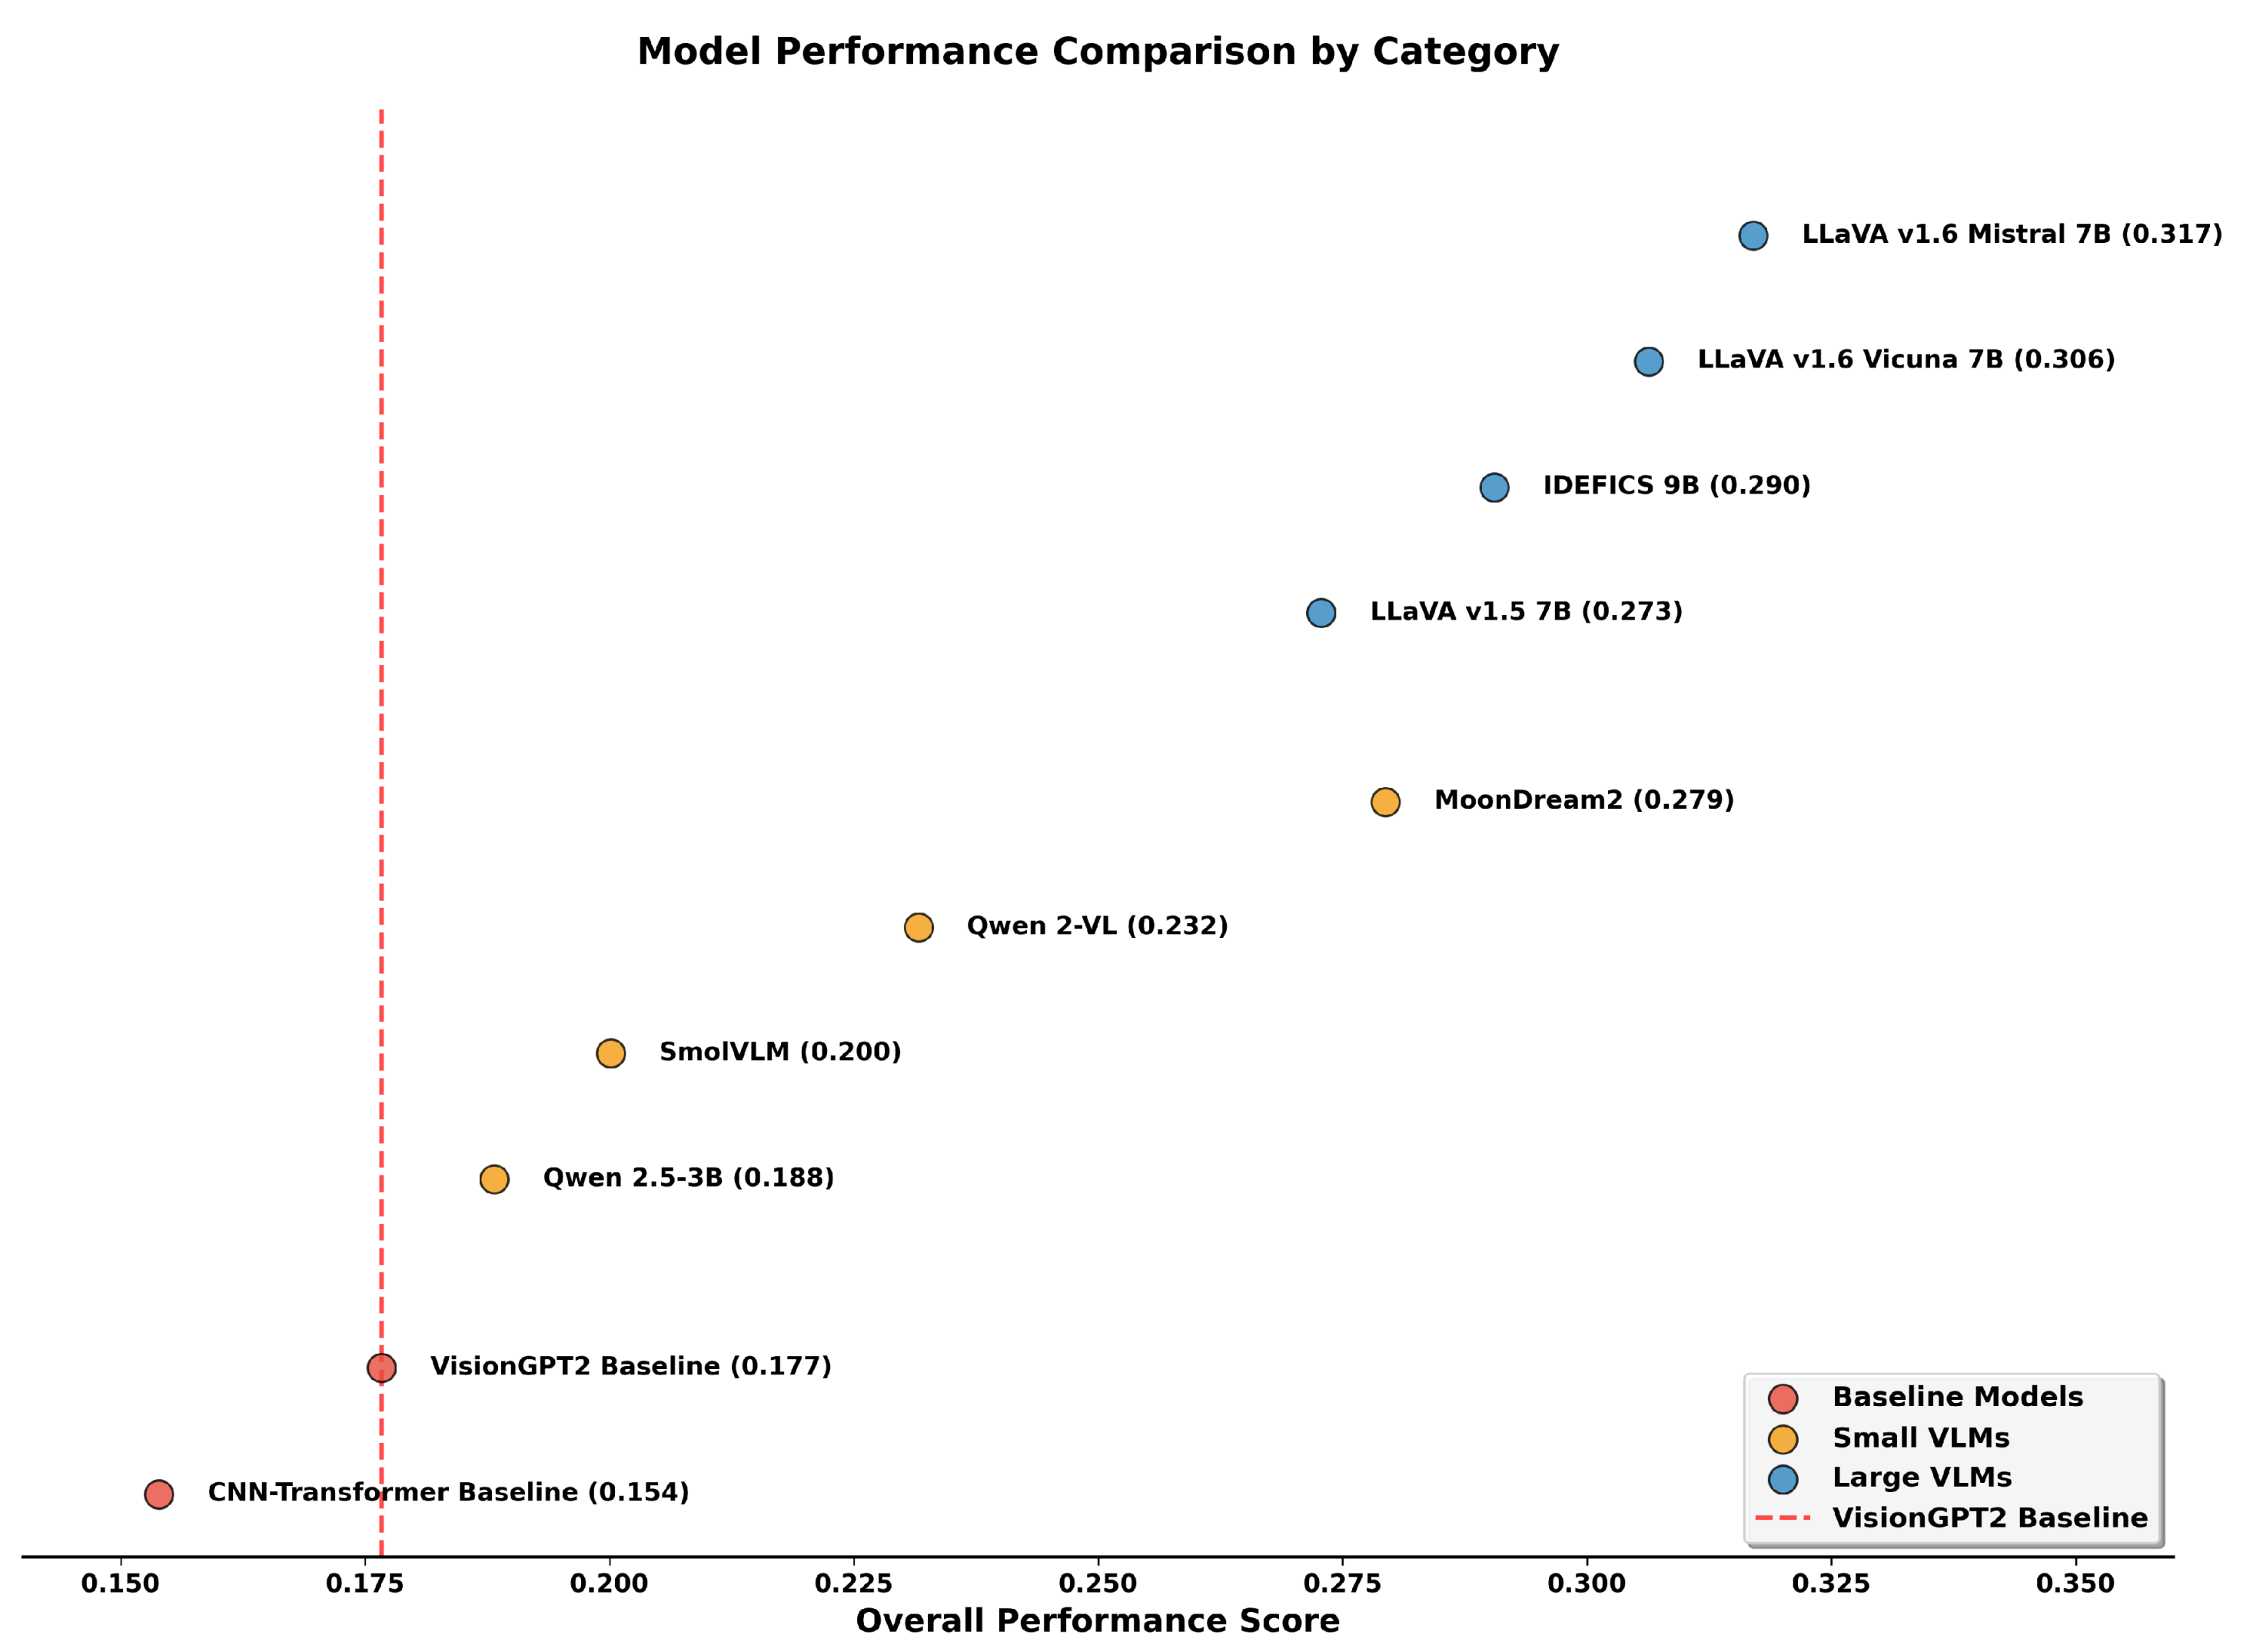
Figure 9.
Relationship between relevance and factuality performance across models. Spearman’s rank correlation coefficient () indicates a strong monotonic relationship between the two dimensions. The fitted regression line explains approximately 85% of the variance (). Large VLMs (blue) cluster in the upper-right quadrant, demonstrating superior performance on both dimensions, while baseline models (red) occupy the lower-left region.
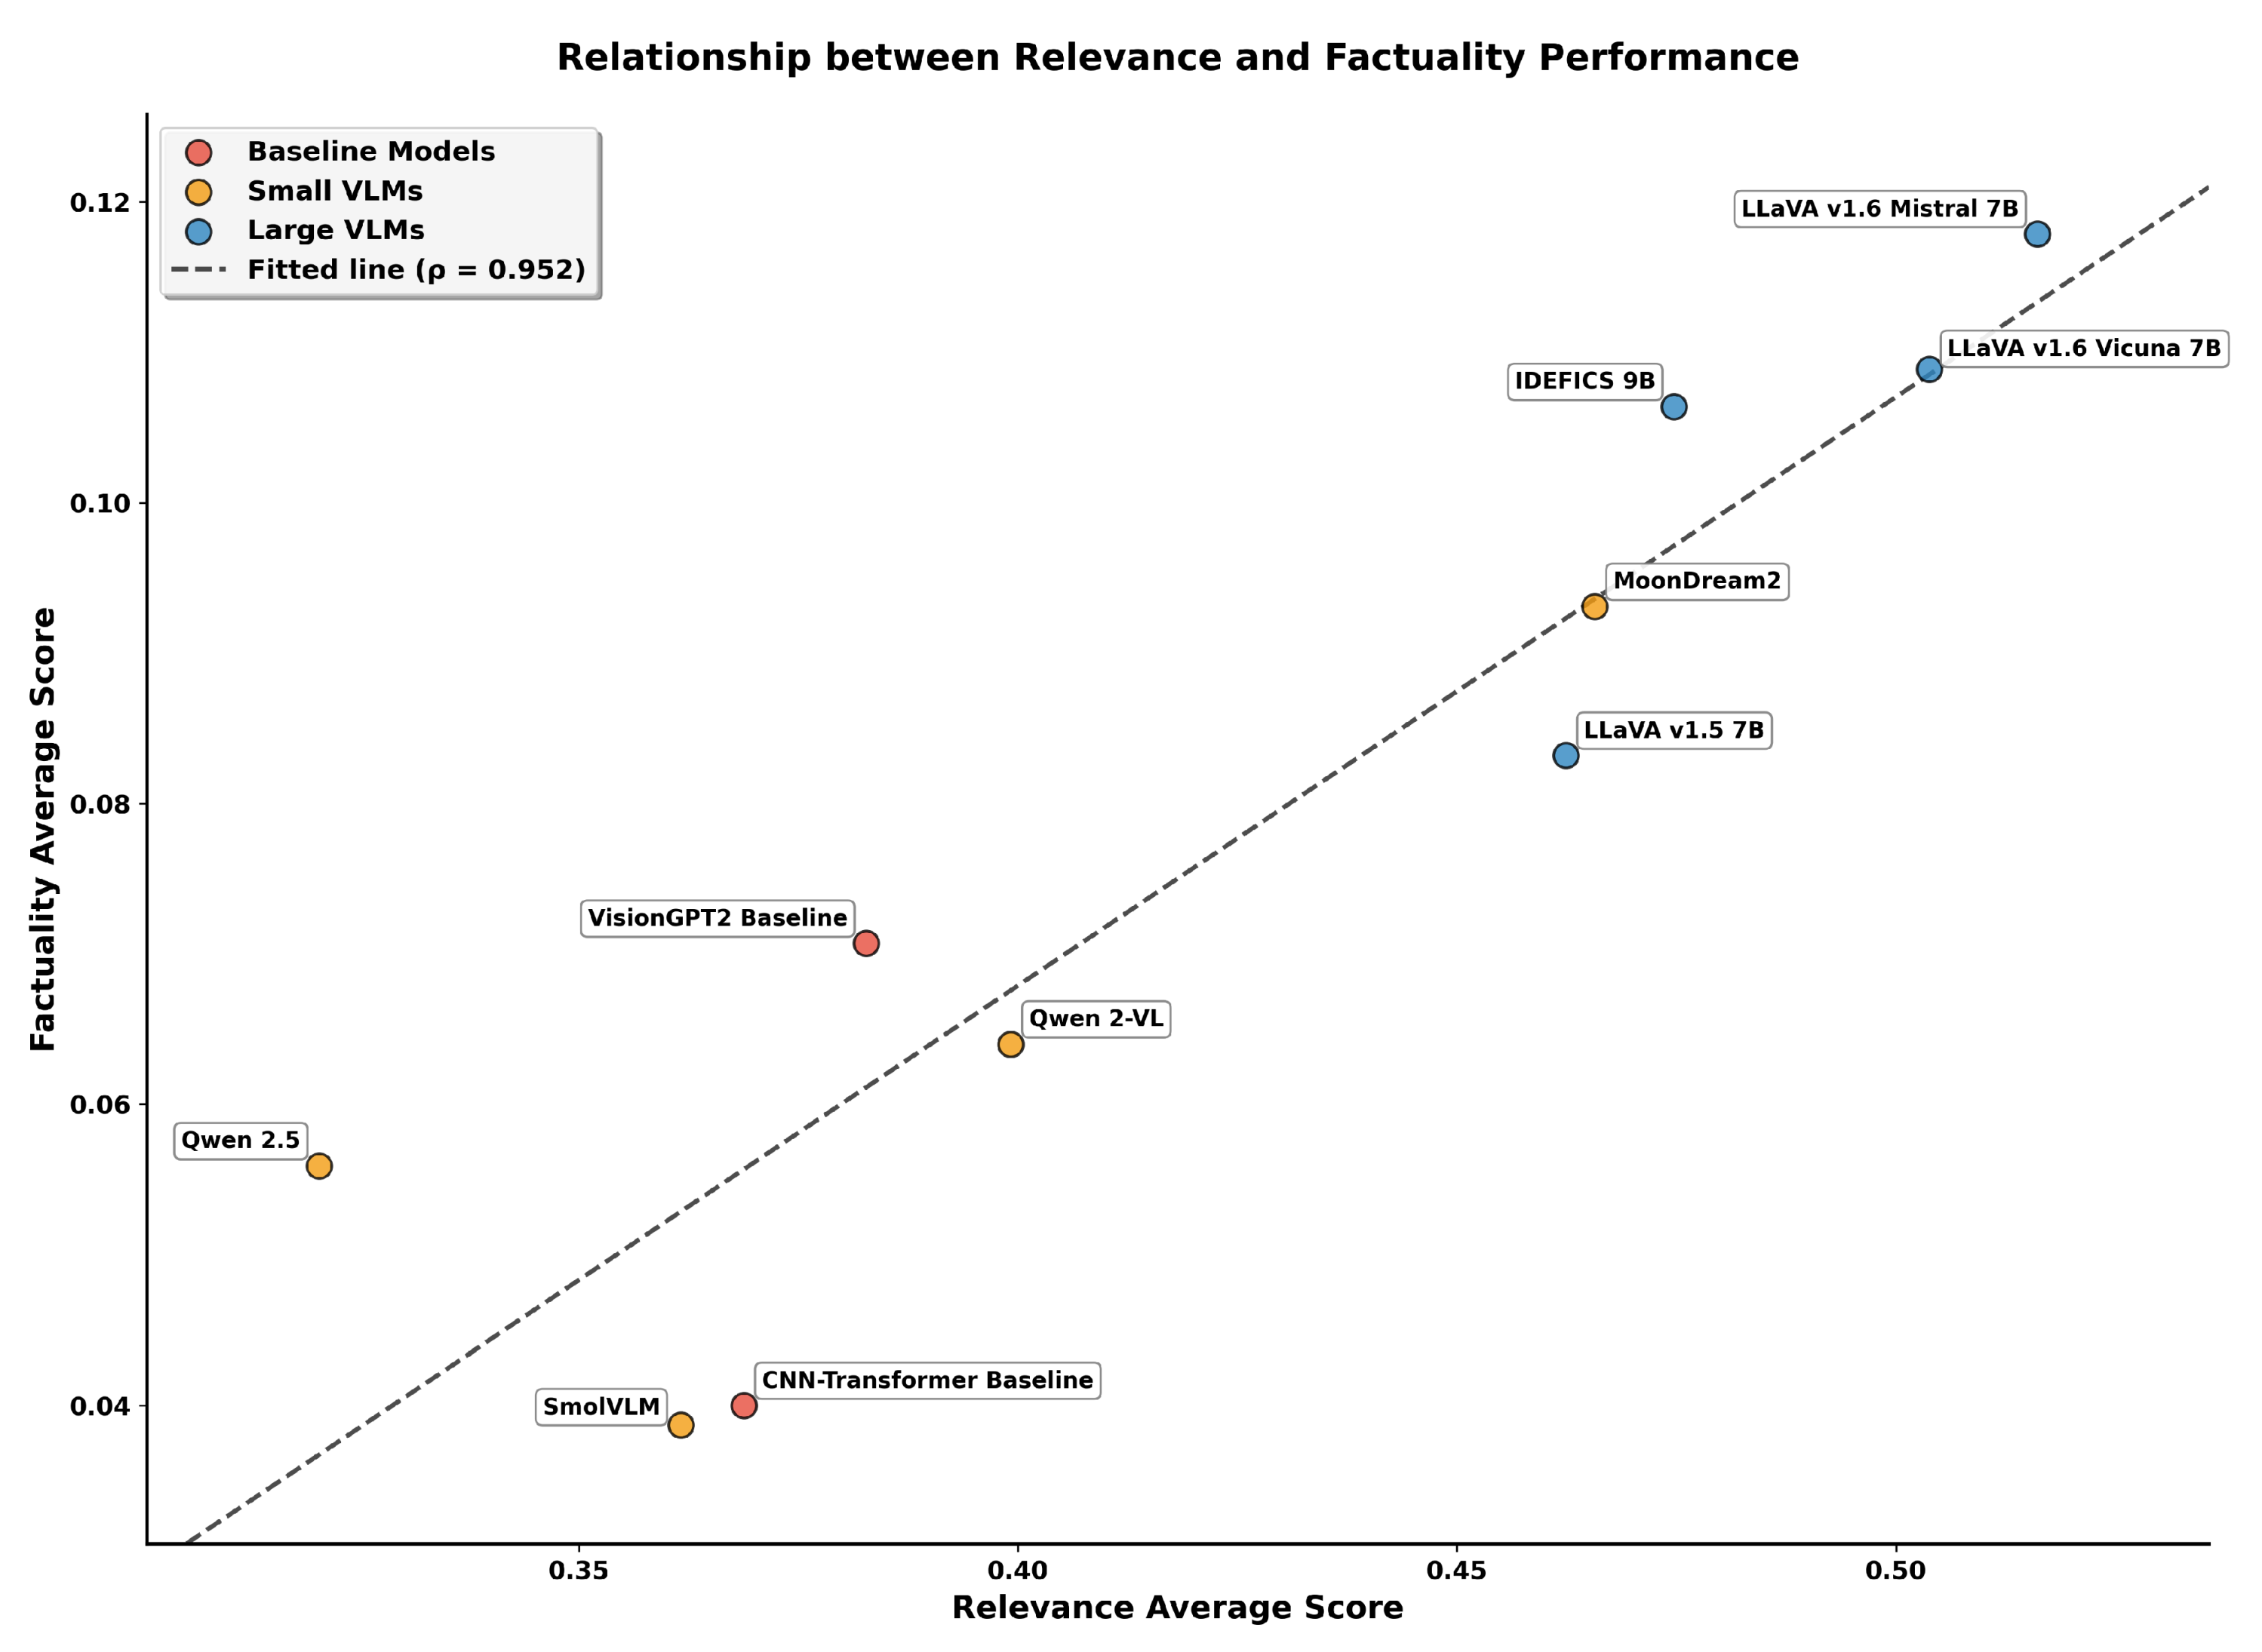
Figure 10.
Representative chest X-ray example from the test set with green arrow indicating a right-sided pleural effusion.
Figure 10.
Representative chest X-ray example from the test set with green arrow indicating a right-sided pleural effusion.
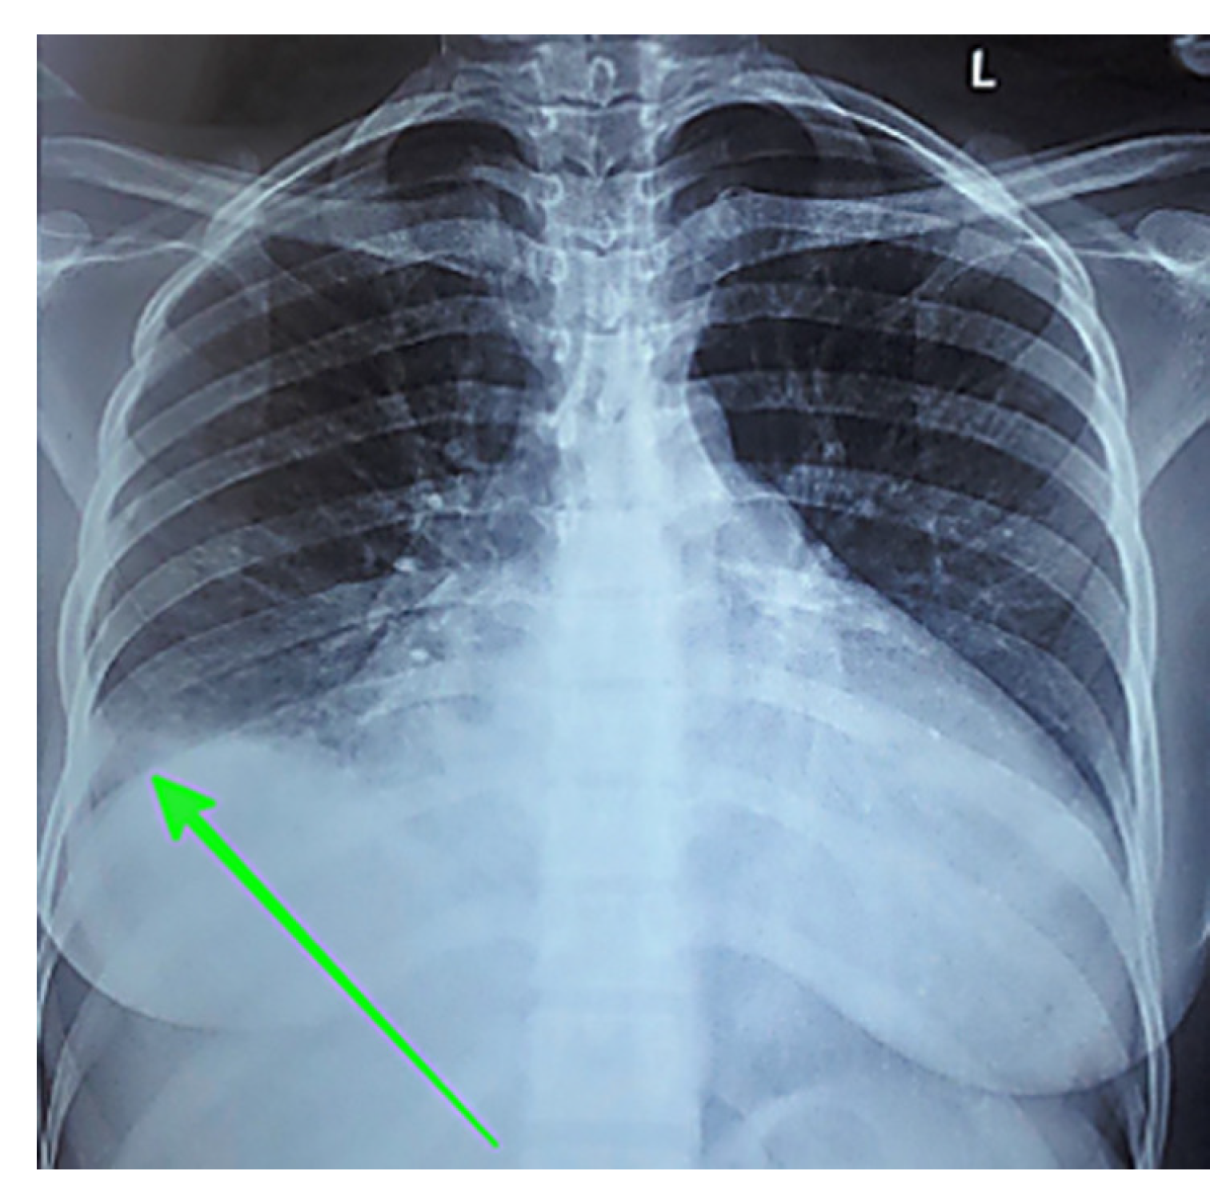
Figure 11.
Representative CT pulmonary embolus study from the test set showing pericardial effusion measuring 19.27 mm.
Figure 11.
Representative CT pulmonary embolus study from the test set showing pericardial effusion measuring 19.27 mm.
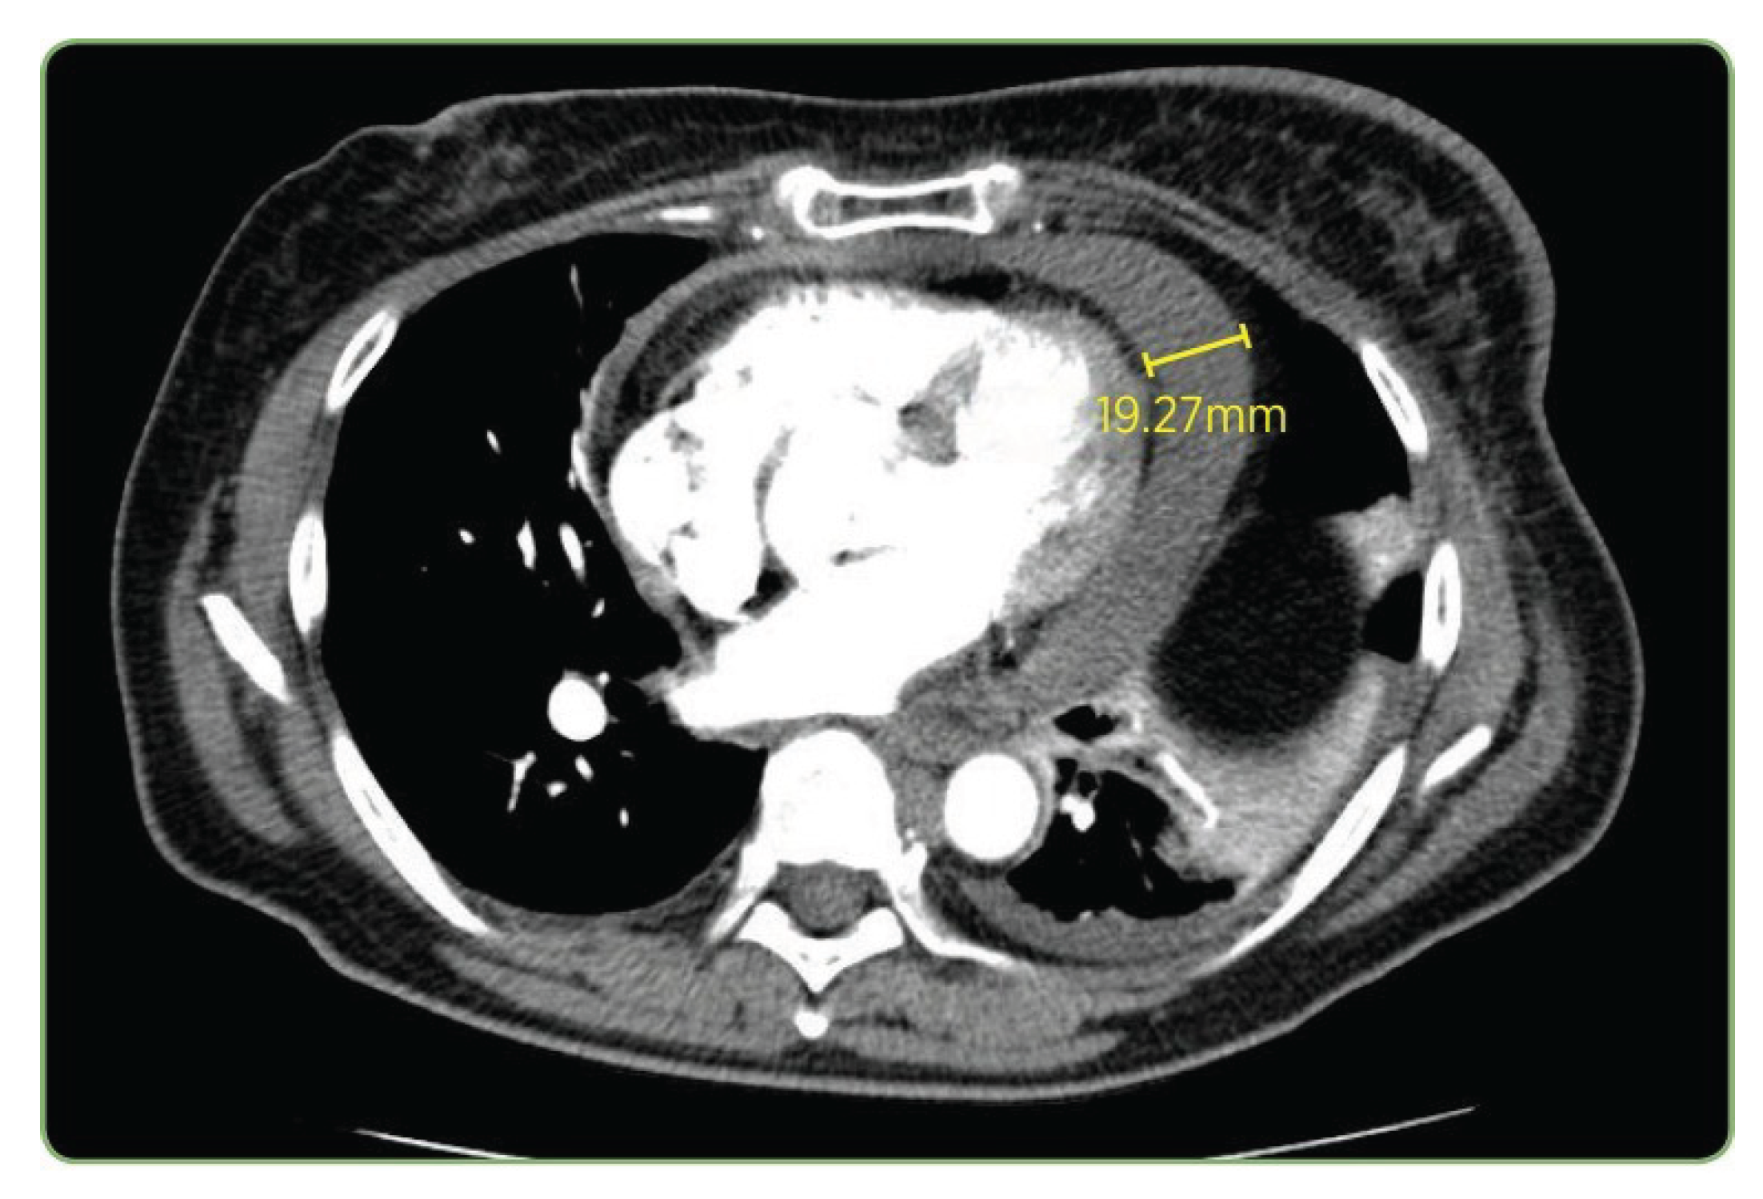

Table 1.
Distribution of imaging modalities in the ROCOv2 dataset.
| Primary Modalities | Count | Percentage |
|---|---|---|
| CT | 40,913 | 35.1% |
| X-ray | 31,827 | 27.3% |
| MRI | 18,570 | 15.9% |
| Ultrasound | 17,147 | 14.7% |
| Other* | 8,178 | 7.0% |
* Other includes Angiography, PET, PET/CT, and OCT.
Table 2.
Comparison of VLMs: encoders, decoders, connectors, and parameters.
| Model | Image Encoder | Text Decoder | Connector / Fusion | # Params (approx.) |
|---|---|---|---|---|
| IDEFICS 9B Instruct | CLIP ViT-H/14 ( 1.3B) | LLaMA-7B ( 7.0B) | Perceiver + gated cross-attn ( 0.75B) | 9.0B |
| LLaVA v1.6 Mistral 7B | CLIP ViT-L/14 (∼0.43B) | Mistral-7B (∼7.0B) | Projection + cross-attn (∼20–50M) | 7.6B |
| LLaVA v1.6 Vicuna 7B | CLIP ViT-L/14 (∼0.43B) | Vicuna-7B (∼6.7B) | Projection + cross-attn (∼20–50M) | 7.1B |
| LLaVA v1.5 with LLaMA 7B | CLIP ViT-L/14 (∼0.43B) | LLaMA-7B (∼6.7B) | Projection + cross-attn (∼20–50M) | 7.1B |
| Qwen 2.5-3B-Instruct | Custom ViT (∼0.3B) | Qwen LM (∼2.8B) | Projection + cross-attn (∼50M) | 3.1B |
| Qwen 2-VL | Custom ViT (∼0.3B) | Qwen LM (∼1.9B) | Projection + cross-attn (∼20M) | 2.2B |
| MoonDream2 | SigLIP-base (∼0.15B) | Phi-1.5 (∼1.7B) | Projection + cross-attn (∼10M) | 1.86B |
| SmolVLM-500M-Instruct | SigLIP-base (∼0.15B) | Tiny LM (∼0.35B) | Projection + cross-attn (∼10M) | 0.5B |
| VisionGPT2 | ViT (∼0.05B) | GPT2 small (∼0.12–0.15B) | Cross-attention (∼5–10M) | 0.21B |
| CNN–Transformer Fusion | Tiny CNN (∼10M) | Tiny Transformer (∼30–35M) | Direct feature fusion (∼3M) | 0.048B |
Table 3.
LoRA configuration parameters of the models.
| Model | Params Trained | % of Total | Adapter Scaling | Target Modules |
|---|---|---|---|---|
| LVLMs | ||||
| LLaVA-Mistral-7B | 40.1M | 0.53 | 2.0 | q,k,v + MLP |
| LLaVA-Vicuna-7B | 34.4M | 0.48 | 1.0 | q,k,v + MLP + mm_proj |
| LLaVA-1.5 | 84.6M | 1.18 | 1.0 | q,k,v,o + MLP + mm_proj |
| IDEFICS-9B | 22.0M | 0.24 | 2.0 | q,k,v only |
| SVLMs | ||||
| Qwen-2.5-3B | 57.0M | 1.87 | 0.5 | All attention + MLP |
| Qwen-2-VL | 54.0M | 2.46 | 1.0 | All attention + MLP |
| MoonDream2 | 74.4M | 3.85 | 0.25 | All linear + proj |
| SmolVLM-500M | 41.7M | 8.34 | 2.0 | All linear |
| Baselines | ||||
| VisionGPT2 | 210M | 100 | – | Progressive full FT |
| CNN-Transformer | 48M | 100 | – | Progressive full FT |
Table 4.
Performance comparison of vision-language models and baseline architectures.
| Model | Parameters Trained (%) | Similarity | BERTScore | ROUGE | BLEURT | UMLS Concept F1 | AlignScore | Relevance | Factuality | Overall |
|---|---|---|---|---|---|---|---|---|---|---|
| Large VLMs (LoRA Adapter) | ||||||||||
| LLaVA Mistral-7B | 0.53 | 0.870 | 0.628 | 0.251 | 0.315 | 0.154 | 0.081 | 0.516 | 0.118 | 0.317 |
| LLaVA Vicuna-7B | 0.48 | 0.830 | 0.625 | 0.245 | 0.314 | 0.142 | 0.076 | 0.504 | 0.109 | 0.306 |
| IDEFICS-9B | 0.24 | 0.781 | 0.621 | 0.229 | 0.296 | 0.128 | 0.070 | 0.482 | 0.099 | 0.290 |
| LLaVA-1.5 | 1.18 | 0.720 | 0.617 | 0.218 | 0.295 | 0.108 | 0.059 | 0.462 | 0.083 | 0.273 |
| Small VLMs (LoRA Adapter) | ||||||||||
| MoonDream2 | 3.85 | 0.757 | 0.586 | 0.216 | 0.303 | 0.120 | 0.066 | 0.466 | 0.093 | 0.279 |
| Qwen 2-VL | 2.46 | 0.570 | 0.518 | 0.160 | 0.238 | 0.074 | 0.109 | 0.372 | 0.091 | 0.232 |
| SmolVLM | 8.34 | 0.414 | 0.536 | 0.136 | 0.252 | 0.016 | 0.060 | 0.362 | 0.038 | 0.200 |
| Qwen-2.5 | 1.87 | 0.449 | 0.453 | 0.124 | 0.256 | 0.048 | 0.064 | 0.320 | 0.056 | 0.188 |
| Baselines (Full Finetune) | ||||||||||
| VisionGPT2 | All | 0.389 | 0.546 | 0.118 | 0.247 | 0.022 | 0.035 | 0.325 | 0.028 | 0.177 |
| CNN-Transformer | All | 0.399 | 0.414 | 0.044 | 0.277 | 0.018 | 0.030 | 0.284 | 0.024 | 0.154 |
Table 5.
Impact of modality-aware prompting on SVLM performance. Modality labels were predicted by a ResNet-50 classifier and added at inference time.
Table 5.
Impact of modality-aware prompting on SVLM performance. Modality labels were predicted by a ResNet-50 classifier and added at inference time.
| Model | Configuration | Similarity | BERTScore | ROUGE | BLEURT | UMLS F1 | AlignScore | Relevance Avg | Factuality Avg | Overall |
|---|---|---|---|---|---|---|---|---|---|---|
| SmolVLM | Base | 0.414 | 0.536 | 0.136 | 0.252 | 0.016 | 0.060 | 0.362 | 0.038 | 0.200 |
| SmolVLM | +Modality | 0.418 | 0.532 | 0.144 | 0.266 | 0.031 | 0.096 | 0.365 | 0.048 | 0.207 |
| Change | +1.0% | -0.7% | +5.9% | +5.6% | +93.8% | +60.0% | +0.8% | +26.3% | +3.5% | |
| Qwen 2-VL | Base | 0.570 | 0.518 | 0.160 | 0.238 | 0.074 | 0.109 | 0.372 | 0.091 | 0.232 |
| Qwen 2-VL | +Modality | 0.364 | 0.456 | 0.121 | 0.311 | 0.017 | 0.086 | 0.313 | 0.052 | 0.182 |
| Change | -36.1% | -12.0% | -24.4% | +30.7% | -77.0% | -21.1% | -15.9% | -42.9% | -21.6% | |
| Qwen-2.5 | Base | 0.449 | 0.453 | 0.124 | 0.256 | 0.048 | 0.064 | 0.320 | 0.056 | 0.188 |
| Qwen-2.5 | +Modality | 0.502 | 0.461 | 0.122 | 0.268 | 0.032 | 0.065 | 0.351 | 0.049 | 0.200 |
| Change | +11.8% | +1.8% | -1.6% | +4.7% | -33.3% | +1.6% | +9.7% | -12.5% | +6.4% |
Table 6.
Caption component analysis for the chest X-ray. Components are highlighted as: Image Modality, Pathological Finding, Anatomical Location, Laterality, Visual marker. Laterality and visual markers are caption elements that aid clinical interpretation but are not UMLS concepts.
Table 6.
Caption component analysis for the chest X-ray. Components are highlighted as: Image Modality, Pathological Finding, Anatomical Location, Laterality, Visual marker. Laterality and visual markers are caption elements that aid clinical interpretation but are not UMLS concepts.
| Ground Truth | chestX-ray showing a right pleural effusion (green arrow) |
|---|---|
| LLaVA-Mistral-7B | ChestX-ray showing a right-sided pleural effusion (green arrow) |
| LLaVA-Vicuna-7B | ChestX-ray showing a large right-sided pleural effusion (green arrow) |
| LLaVA-1.5 | ChestX-ray showing a large right-sided pleural effusion |
| IDEFICS-9B | ChestX-ray showing a large right-sided pleural effusion (green arrow) |
| MoonDream2 | ChestX-ray showing a right-sided pleural effusion (arrow) |
| Qwen 2-VL | ChestX-ray of the patient shows an enlarged right-sided infiltrate in the right lower lobe (arrow) |
| SmolVLM | An arrow pointing to a mass in the patient’s chest on a chest x-ray |
| Qwen 2.5 | CT scan of the left kidney showing a renal cystic lesion (arrow) |
| VisionGPT2 | A chest X-ray showing a large right-sided pneumothorax |
| CNN-Transformer | Chestx ray in sagittal |
Table 7.
Caption component analysis for the CT scan. Components are highlighted as: Image Modality, Pathological Finding, Anatomical Location, Clinical Measurement. Clinical measurements are caption elements that aid clinical interpretation but are not UMLS concepts.
Table 7.
Caption component analysis for the CT scan. Components are highlighted as: Image Modality, Pathological Finding, Anatomical Location, Clinical Measurement. Clinical measurements are caption elements that aid clinical interpretation but are not UMLS concepts.
| Ground Truth | CTpulmonary embolus study showing pericardial effusion measuring 19.27 mm in this plane |
|---|---|
| LLaVA-Mistral-7B | CTpulmonary embolus study showing pericardial effusion measuring 19.27 mm in this plane |
| LLaVA-Vicuna-7B | CTpulmonary angiogram showing pericardial effusion measuring 19.27 mm in this plane |
| LLaVA-1.5 | CTpulmonary embolism showing a large right lower lobe pulmonary embolism |
| IDEFICS-9B | CTpulmonary embolism study showing [truncated/incomplete] |
| MoonDream2 | CT scan of the chest showing a large mass in the right upper lobe |
| Qwen 2-VL | Computed tomography scan showed a large right-sided mass in the right side |
| SmolVLM | A cross-section of a CT scan of the chest and abdomen, with a yellow square pointing to the 19.27 mm measurement |
| Qwen 2.5 | Axial T2 magnetic resonance imaging of patient |
| VisionGPT2 | PET-CT scan showing a large right hepatic cyst in the right hepatic lobe |
| CNN-Transformer | CT scan showing enlargement in liver lesion |
Disclaimer/Publisher’s Note: The statements, opinions and data contained in all publications are solely those of the individual author(s) and contributor(s) and not of MDPI and/or the editor(s). MDPI and/or the editor(s) disclaim responsibility for any injury to people or property resulting from any ideas, methods, instructions or products referred to in the content. |
© 2025 by the authors. Licensee MDPI, Basel, Switzerland. This article is an open access article distributed under the terms and conditions of the Creative Commons Attribution (CC BY) license (http://creativecommons.org/licenses/by/4.0/).
Copyright: This open access article is published under a Creative Commons CC BY 4.0 license, which permit the free download, distribution, and reuse, provided that the author and preprint are cited in any reuse.


