
Submitted:
02 January 2025
Posted:
03 January 2025
You are already at the latest version
Abstract
As population growth and climate change intensify pressures on agriculture, innovative strategies are vital for ensuring food security, optimizing resources, and protecting the environment. This study introduces a novel approach to predictive agriculture by utilizing the unique properties of terpenes, specifically S(-)-limonene, emitted by plants under stress. Advanced sensors capable of detecting subtle limonene variations offer the potential for early stress diagnosis and precise crop interventions. This research marks a significant leap in sensor technology, introducing an innovative active sensing material that combines molecularly imprinted polymer (MIP) technology with electrospinning. S(-)-limonene-selective MIP nanoparticles, engineered using methacrylic acid (MAA) and ethylene glycol dimethacrylate (EGDMA), were synthesized with an average diameter of ~160 nm and integrated into polyvinylpyrrolidone (PVP) nanofibers reinforced with multiwall carbon nanotubes (MWCNTs). This design produced a conductive and highly responsive sensing layer. The sensor exhibited rapid stabilization (200 s), a detection limit (LOD) of 190 ppb, and a selectivity index of 73% against similar monoterpenes. Optimal performance was achieved at 55% relative humidity, highlighting environmental conditions' importance. This pioneering use of polymeric MIP membranes in chemiresistive sensors for limonene detection opens new possibilities for monitoring VOCs, with applications in agricultural stress biomarkers, contaminant detection, and air quality monitoring, advancing precision agriculture and environmental protection.
Keywords:
molecular imprinted polymers
; BVOCs
; monoterpenes
; electrospinning
; nanoparticles
; nanofibers
; conductive sensors
; limonene
; predictive agriculture
1. Introduction
With a growing global population and climate change intensifying pressures on agriculture, innovative strategies are critical to boost crop productivity by 70% by 2050 (FAO, 2009, Global Agriculture towards 2050 the Challenge) [1]. Ensuring food security while conserving resources and protecting the environment requires improving nutrient uptake and use efficiency (NUE) [2,3] and reducing crop losses caused by both biotic and abiotic stresses, for example, through pests and phytopathogen control agents [4,5,6]. Sustainable solutions include eco-smart biocontrol agents [7,8], crop genetic resistance to pathogens [9] and enhancing the tolerance to drought, high temperatures, waterlogging, and soil salinization [10], respectively. These approaches are essential for meeting future food demands while mitigating climate impacts. Monitoring crop health and detecting early signs of plant nutrient deficiency and plant stress, biotic and abiotic, is an approach to improving or preserving yields by preventing crop losses [11].
Several studies have explored methods to monitor adverse events affecting crops, but conventional approaches are often invasive, costly, and time-consuming. These methods rely on sample collection, laboratory processing, and destructive procedures, which can trigger stress responses and fail to provide accurate spatial data [12,13].
Recently, non-destructive technologies have emerged as a promising alternative. While sometimes less precise, they offer significant advantages, such as being non-invasive, providing ecosystem-wide data, and covering larger areas, from individual plants to entire fields [14]. These tools can detect crop health changes, such as nutrient deficiencies or diseases, and quantify symptom severity, enabling more efficient application of treatments like fertilizers or pest control agents. This aligns with precision agriculture goals to optimize resource use and reduce environmental impact [15]. However, these sensing technologies often require careful calibration and tailored sampling systems to achieve reliable results.
Remote sensing is among the most widely used non-invasive and non-destructive technologies for monitoring plant parameters over large areas and across temporal and spatial scales [14,16,17,18].
It integrates various sensors, including RGB optical, multispectral, hyperspectral, thermal (TH), and active sensors like LiDAR, to assess plant health. These sensors provide valuable data on fluorescence, spectral reflectance, thermal properties, and structural changes, offering insights into plant condition and stress factors like insect activity [14,19]. Advanced tools, such as portable Raman-based sensors, can detect stress-related metabolites, reducing agrochemical use and optimizing yields [20]. Additionally, electronic noses (e-noses) are gaining traction for detecting plant-released volatile organic compounds (VOCs), helping to identify nutrient deficiencies [21], assess fruit maturity [22] and detect pathogen attacks [23,24]. Most of the efforts in monitoring plant health, anyway, have been carried out to obtain an early and accurate detection of biotic stressors, such as pathogens and pests [25,26,27,28], and abiotic stressors, like high irradiance and thermal stress [29,30]. These approaches enable timely interventions to mitigate yield losses and improve crop management.
Volatile organic compounds (VOCs) are chemicals released into the atmosphere from both human activities and natural processes, such as those in soil, oceans, and vegetation. Biogenic VOCs (BVOCs), defined as organic trace gases excluding carbon dioxide, carbon monoxide, and methane [31], include isoprenoids (isoprene and monoterpenes), alkanes, alkenes, carbonyls, alcohols, esters, ethers, and acids. Terrestrial vegetation produces around 90% of global VOC emissions [32]. Plants emit thousands of VOC species, with isoprene (70%) and monoterpenes (11%) being the most common, followed by sesquiterpenes, methanol, and acetonel. Plants emit thousands of VOC species (PVOCs), mostly isoprene (C5H8) and monoterpenes (C10H16), the most representative (70% and 11%, respectively), sesquiterpenes (C15H24), methanol (CH3OH), and acetone (CH3COCH3) [33].
Terpenes are emitted by plants in response to biotic stresses (e.g., pathogens, pests, and weeds) and abiotic stresses (e.g., drought, temperature changes, light, and salinity) [34,35,36] but also upon phenological statuses, like fruit ripening, plant age and organs [37,38,39]. Acting as signalling molecules, terpenes facilitate plant interactions with bacteria, fungi, and insects, playing roles in defence and in both antagonistic and mutualistic relationships [40,41,42].
This opens up opportunities to develop selective sensors tailored to specific terpenes. For instance, limonene, a compound released by plants, can serve as a valuable biomarker for monitoring plant health and detecting early signs of stress or disease. For instance, in grapevines, limonene is crucial during nematode attacks and in response to water stress [43,44]. Similarly, in olive trees, limonene emissions are associated with fruit ripening and act as a repellent against the olive fruit fly (Bactrocera oleae (Rossi)) during oviposition [45,46,47,48]. Therefore, developing selective sensors to monitor limonene emissions could provide precise diagnostics, directly tied to the stressors impacting plant health.
In developing sensors for specific terpenes, the use of molecularly imprinted polymers (MIPs), a class of biomimetic artificial receptors, represents a promising approach for selective detection. MIPs replicate the highly specific molecular recognition process found in natural biological macromolecules, such as enzyme-substrate or antibody-antigen interactions, by utilizing tailored interactions to recognize specific ligands [49]. The MIP synthesis is based on the creation of template-induced formation of complementary recognition cavities within a polymer matrix, shaped for a particular template molecule that result then specific in shape, size and functionality for the target chemical or biological molecule used as the template. During polymerization, monomers and crosslinkers assemble around the template molecule, which is subsequently removed, leaving behind a highly specific and complementary empty active site. As a result, MIPs exhibit highly selective interactions with target analytes and provide greater chemical and thermal stability compared to biological systems, owing to the high degree of crosslinking in the polymer matrix [50,51].
MIPs bind analytes through non-covalent interactions, such as hydrogen bonding, π-π interactions, and van der Waals forces, offering high discrimination and precise quantification. These non-covalent interactions enable repeated binding and release of VOCs, ensuring durability across multiple uses. Moreover, MIP-based sensors exhibit superior chemical and thermal stability compared to biomolecules, providing reliable performance under various conditions [50]. MIP technology has been widely used to develop advanced selective sensors for VOC detection. Based on such technology, these sensors incorporate tailored binding sites that precisely match the molecular configurations of VOCs like terpenes. The MIP cavities function through a lock-and-key mechanism, utilizing size, shape, or functional group compatibility [52].
MIP-based VOC sensors have been developed in various forms, including chemiresistors, piezoelectric sensors, and optical sensors [53]. Among them, MIP-based chemiresistors have demonstrated greater versatility in fabrication and superior sensing performance [53]. Such performances have been further enhanced significantly by combining MIPs with conductive polymers (e.g., polyaniline, polypyrrole, poly(3-hexylthiophene)) [54], carbon-based nanomaterials (e.g., nanotubes, nanowires, nanoflakes, nanopowders), or metals/metal oxides [55,56,57,58,59,60,61,62,63]. These combinations enable the design of highly specific VOC binding sites, enhancing the selectivity of the resulting sensors and minimizing interference from other substances. These specific interactions lead to significant changes in the electrical properties of the conductive polymer, such as alterations in charge distribution or morphology. As a result, the combination of molecularly imprinted polymers (MIPs) with conductive materials creates highly effective sensors, often referred to as c-MIPs. These sensors exhibit several advantages: first, they are highly specific and selective for volatile organic compounds (VOCs) due to the MIP-based binding sites; second, they show increased sensitivity because the MIP sites form pores and cavities that match the size and shape of the template, which enhances the polymer’s surface area and interaction with target molecules, improving sensor responsiveness; third, they are more conductive and capacitive, as the imprinting process aligns functional monomers around the template, creating a pre-organized charge distribution that remains even after the template is removed. This persistent charge distribution alters the polymer’s local electronic environment, affecting properties like conductivity and capacitance. Lastly, these sensors are less susceptible to interference from other substances, further enhancing their reliability.
Additionally, the robustness of MIPs ensures stability and consistent performance under diverse environmental conditions. The versatility of this approach allows for the customization of both the conductive polymer and the MIPs, tailoring them to desired electrical properties and specific VOC recognition, respectively.
Following the importance of monitoring terpene release in the atmosphere, such as for limonene, for agricultural purposes, and the possibility of developing highly selective MIP-based sensors, a series of studies have highlighted the effectiveness of MIP-based limonene sensors. Essentially, the sensitive material for limonene and other terpenes with a similar structure was designed using MAA as the functional monomer, EGDMA as the crosslinker, and AIBN as the initiator to develop thin coatings for QCM [64] achieving limit of detection of a few ppm (10 ppm) and a selectivity of around 55% (distinguishing limonene from limonene oxide and α-pinene) up to 58.16% [65] in real samples (mangoes) under controlled humidity and temperature. The thin films were obtained by directly depositing a few microliters of the ethanol polymeric solution (according to a molar ratio of 1:4:20, limonene, MAA and EGDMA, respectively) onto the functionalized surface of the metallic electrode, and heating at 60°C under nitrogen. Mango ripeness was also monitored using a MIP sensor array properly designed to recognize limonene, α-pinene, β-pinene, α-terpinene, γ-terpinene, and 3-carene [66]. The polymeric molar ratio adopted was 1:5:20. Multiarray devices QCM-based were designed and used also to recognize limonene and other terpenes from fresh and dry grass [67] and from wood borers infested Platycladus orientalis trunks [68]. In these studies, the QCM coatings were prepared similarly to the previous ones but changing the polymer solutions solvent (methanol-acetonitrile mixture). Since the solvent influences the strength and specificity of non-covalent interactions (e.g., hydrogen bonding, van der Waals forces) between the template and the functional monomer, as well as the polymerization rate and resulting polymer porosity, using different solvents enabled the design of diverse sensing films. R(+)-limonene released by citrus infected (Batrocera dorsalis) was also successfully detected by a MIP-QCM sensor designed to identify the pest-infested fruit [69]. A capacitive sensor was designed spin-coating a MIP solution based on MAA, EGDMA, and AIBN diluted in THF, onto gold IDEs and polymerized under UV light [70] to recognize selected terpenes released from mangoes ripeness. The development of a conductive molecularly imprinted polymer (cMIP) sensor capable of detecting R(+)-limonene at concentrations as low as 50 ppm was achieved blending polystyrene-based MIPs with poly(3-hexylthiophene) (P3HT) and using QCM and interdigitated electrodes (IDEs) as transducers. This study revealed that the sensor’s response was influenced by the ratio of limonene to styrene, with an optimal molar ratio of 2.0:2.6 enhancing performance, while higher concentrations inhibited polymerization [71]. Enantiomers of limonene in various essential oils were recognized using a molecularly imprinted polymer (MIP) film prepared via the electropolymerization of a pyrrole-containing solution onto the electrodes of an electrochemical sensor achieving the limits of detection (LOD) of 1.4 × 10⁻¹² mol L⁻¹ [72]
The design of nanostructured MIP-based materials typically follows two main approaches: top-down and bottom-up. Nanostructures are often preferred due to their high surface-area-to-volume ratio, which provides more accessible binding sites, enhances interaction with target analytes, and improves sensitivity and specificity.
The top-down strategy involves creating a bulk material with specific cavities, which is then ground down to achieve micro- or nanoscale dimensions. In contrast, the bottom-up approach involves direct polymerization of nanoparticles, eliminating the grinding step and simplifying the production process.
Over time, MIP development has employed various methods, including bulk, precipitation, and emulsion polymerization, as well as sol-gel techniques and electro-polymerization [73,74].
These nanostructures can be used alone or integrated with polymer matrices through various processing techniques, including dip coating, spin coating, casting, and electrospinning.
Among the various techniques for sensor fabrication, electrospinning is a versatile and cost-effective electrodynamic method that enables the production of both micro- and nanofibers, which can be adapted to different substrates for sensor design and integration. Additionally, electrospinning supports a broad range of polymers, including eco-friendly options, thus promoting sustainability in sensor production [75,76,77,78]. The advantages of incorporating nanoscale features from electrospun fibres in high-performance sensor fabrication have been extensively documented [79,80,81,82,83]. Thus, combining molecularly imprinted polymer (MIP) technology with electrospinning (ES) holds significant potential for developing advanced chemosensors for VOC recognition [84]. Nanofibrous structures incorporating MIPs enable the creation of more complex architectures, improving their properties compared to bulk matrices or thin films [84,85,86,87,88,89,90,91].
On the other hand, integrating MIP and ES technologies poses challenges due to their different processing methodologies; thus, ensuring compatibility between these techniques is crucial. One prominent approach involves embedding MIP nanoparticles within electrospun fibres, demonstrating promising results for VOC detection [92,93,94,95,96,97,98,99].
In a preliminary study, the authors presented the design of S(-)-limonene-templated molecularly imprinted nanoparticles (MINPs) embedded within polyvinylpyrrolidone (PVP) nanofibers alongside multiwall carbon nanotubes (MWCNTs) to create a selective and conductive sensor [100]. In the present work, a fine-tuning of the parameters of each process enabled the optimization of final architectures and enhancement of recognition performance.
The proposed strategy was compared to a previously described approach by the authors [101], where pre-formed polymers (polyacrylic acid, PAA, and polyvinylpyrrolidone, PVP) were used instead of monomers, and functional cavities for limonene were imprinted directly within the fibres through a UV-crosslinking process.
To the best of our knowledge, the use of polymeric MIP nanofibrous membranes as active materials in chemiresistive sensors for limonene detection remains largely unexplored, and this innovative approach offers significant potential for detecting a diverse range of molecules, including biomarkers, contaminants, and air pollutants in the gas phase.
2. Materials and Methods
2.1. Materials
Polyvinylpyrrolidone (PVP, Mw 1300000, Mw 30000), methacrylic acid (MAA, Mw 86.09), 2-2'-azobis(2-methyl-propionitrile) (AIBN, Mw 164.21), ethylene glycol dimethacrylate (EGDMA, Mw 198.22), multiwalled carbon nanotubes (MWCNT >99% carbon basis, O.D. x length 6-13 nm x 2.5-20 μm), S(-)-limonene (S-Lim 96%, Mw 136,23), α-pinene (α-Pin 98%, Mw 136.23), Linalool (Lin 97%, Mw 154,25), absolute ethanol (EtOH, ≥99.8%, ACS reagent, Mw 46.07), acetonitrile (MeCN ≥99.5%, ACS reagent, Mw 41.05) and N-N-dimethylformamide (DMF 99.8% ACS reagent, Mw 73.09) were purchased by Merck KGaA (Darmstadt, Germany) and used without further purification.
2.2. Molecular Imprinted Nanoparticles (MIP-NPs)
Molecularly imprinted nanoparticles (MIP-NPs) were synthesized using methacrylic acid (MAA) as the monomer, ethylene glycol dimethacrylate (EGDMA) as the crosslinker, azobisisobutyronitrile (AIBN) as the free radical initiator, and acetonitrile as the porogen solvent. The effect of the monomer-to-crosslinker ratio on the final polymer properties is well-documented [102]. Additionally, the monomer-to-solvent ratio is crucial for obtaining nanoparticles. This study used S (-) limonene (S-Lim) as the template molecule, with an S-Lim:MAA:EGDMA molar ratio of 1:4:8, respectively. AIBN was used at 2 wt.% of the total reaction mixture. Polymerization was carried out in a round-bottom flask containing 50 mL of acetonitrile. A solution of 0.5 mmol of S (-)-limonene, 2 mmol of MAA, and 4 mmol of EGDMA was stirred magnetically for 5 min. The dispersion was then sonicated for 20 min using an ultrasonic probe sonicator (Sonics and Materials Inc., Newtown, CT, USA) set at 15% amplitude, followed by an additional 20 min cooling by magnetic stirring. Once the temperature dropped below 25°C, AIBN was added, and the mixture was purged with nitrogen for 15 min to minimize oxygen interference during polymerization. The polymerization was conducted at 60°C for 6 h, then the mixture was cooled and stored at 5°C. Non-imprinted nanoparticles (NIP-NPs) were synthesized following the same procedure but without the template molecule. Finally, the entrapped S(-)-limonene molecules were removed from the imprinted nanoparticles through four cycles of washing with cyclohexane and centrifugation at 5500 rpm.
2.3. MWCNT Dispersion
A dispersion of MWCNTs (0.7 wt.%) in DMF was prepared by alternating between ultrasonic probe sonication set at 30% amplitude and magnetic stirring, with PVP K30 used to enhance the stability of the dispersion, following a previously reported method [103].
2.4. Electrospinning Solution
Electrospinning solutions containing MIP-NPs were prepared by suspending 10 mg of MIP-NPs in 1 mL of the MWCNT dispersion, followed by 25 min ultrasonic probe sonication set at 10% amplitude. The resulting MIP/MWCNT dispersion was mixed with 4 mL of a 12 wt.% PVP solution (Mw 1.3 KDa) under magnetic stirring and further sonicated for 25 min in an ultrasound bath. The non-imprinted polymer (NIP) solution was prepared using the same procedure, but with NIP-NPs instead of MIP-NPs.
2.5. Electrospinning Conditions and Device Fabrication
Electrospinning deposition was carried out using a Fluidnatek® LE-50 machine (Bioinicia, Paterna, Valencia, Spain). The distance between the needle tip and the collector was optimized through testing to produce uniform, dry fibres, with 14 cm determined as the optimal distance. The solution flow rate was 200 µL/h for MIP and NIP nanofibers (RH: 35%, T: 20 °C). The setup included two high-voltage sources: +8 kV applied to the needle and -2 kV to the collector. The deposition time was fixed at 3 min to achieve a homogeneous coating of the transducer microelectrodes connected to the collector using metallic tape.
2.6. Interdigitated Electrodes (IDEs)
Interdigitated electrodes (IDEs), supplied by Micrux Technologies (Gijón, Spain), were fabricated on a borosilicate substrate (dimensions: 10 × 6 × 0.75 mm). The Pt/Ti electrodes featured 120 pairs with dimensions of 10 μm in width, 3500 μm in length, and 150 nm in thickness, with a 10 μm gap between them. Before use, the surface of the IDEs was cleaned by rinsing with soap, followed by immersion in a "base piranha" solution (3:1 v/v mixture of ammonia and hydrogen peroxide) at 60°C for approximately 60 min. The electrodes were then thoroughly rinsed with Milli-Q water (~18 MΩ·cm), washed with isopropyl alcohol, and dried with a nitrogen stream.
2.7. UV-Crosslinking Process
PVP nanofibers housing MIP- and NIP-NPs were irradiated for 10 min by a 180 nm to visible spectrum range emitting 500 W UV-lamp (Polymer Helios Italquartz, Cambiago, MI, Italy). UV irradiation induced crosslinking within the PVP matrix, creating a more interconnected, hydrophobic and robust polymer network [101,104]
2.8. Scanning Electron Microscopy (SEM)
Fibres morphological analyses were carried out using Scanning Electron Microscopy (SEM) micrographs. The electrospun nanofibrous fabrics deposited on thin SiO2 wafers and sputter-coated with gold in a Balzers MED 010 unit were analysed for SEM by a JEOL JSM 6010LA electron microscope (High Equipment Centre, University of Tuscia, Viterbo, Italy) and by an ESEM FEG XL30, Philips under low vacuum conditions (at University of Insubria, Como, Italy). SEM image analyses were investigated using the free licence software ImageJ, Diameter J Plugin.
2.9. Atomic Force Microscopy (AFM)
The nanostructured layer topography was characterised by Atomic Force Microscopy (AFM, Nanosurf Flex-AFM, version 5 - C3000, Liestal, Switzerland), which captured images of the layer surface in tapping mode using 190 Al-G tips, 190 kHz, 26 N/m over image areas of 400 and 100 µm2 (20 × 20 and 10 × 10µm, respectively). Topography images were processed using Gwyddion© 2.64 software.
2.10. Transmission Electron Microscope (TEM)
Transmission Electron Microscopy (TEM) micrographs were captured at 200 keV using a transmission electron microscope equipped with an analytical double-tilt holder. After removal from the collector, the electrospun nanofibers were placed onto Lacey-Carbon copper TEM grids by simple adherence. A Zeiss LIBRA200FE microscope was used to carry out TEM analyses.
2.11. Focused Ion Beam (FIB)
A fibre sample deposited onto an aluminium substrate was cut using a dual beam (Gallium ion beam) Tescan GAIA 3 FIB-SEM to produce a sample section and ultra-thin lamella. The lamella was then checked and analysed by a TEM Thermo Scientific Talos F200X (ICCOM-CNR, Sesto Fiorentino, Italy).
2.12. Electrical and Sensing Measurements
The chemiresistors (MIP-NFs/IDEs) were enclosed in a measurement chamber (~1 mL volume) and connected to an electrometer (Keithley 6517, Solon, Ohio, USA) for powering and recording their electrical outputs, with data transmitted to a PC running LabVIEW 2014 software (National Instruments, Austin, TX, USA). Clean air (5.0, Nippon gases) was used to record the current under controlled humidity and temperature conditions, applying potential values ranging from −4.0 to +4.0 V. The resistance (R) of the fibrous coating, within the linear range, was calculated using Ohm’s Law.
Dynamic sensor measurements were conducted at 25 °C by applying a +3 V potential between the interdigitated electrodes. A 4-channel MKS 247 system was used to control up to four MKS mass flow controllers (MFCs) with flow rates set between 0 and 200 sccm. Pure air, humidified through a Nafion© tube inside a sealed glass jar saturated with water vapor, modulated the carrier gas's humidity through the system. Relative humidity and temperature were measured using a HIH 4602 sensor (Honeywell). Incoming air was mixed with known concentrations of terpenes (S-Lim, Lin, α-Pin). Both clean and vapour-saturated air streams converged in a 10 mL mixing chamber before entering the measurement chamber. Analyte flow passed through a gas bubbler containing the analytes before mixing with the carrier flow and entering the measurement chamber. Each measurement was initiated after fully recovering the baseline current under clean airflow. IDE responses were calculated as ΔI/I0, where ΔI represents the current variation, and I0 is the baseline current obtained during the airflow cleaning process. A scheme of the measurement setup is depicted in Figure 6,(A). The recovery and reproducibility of the sensor were evaluated over 8 cycles, alternating the exposure to 70 ppm of S(-)-limonene and the air cleaning at 55% relative humidity (RH). To assess the long-term stability of the MIP-based nanofibrous sensor for S(-)-limonene, some measurements of this monoterpene were conducted over one year.
3. Results and Discussion
3.1. Particles Characterization
The morphology of NIP and MIP nanoparticles was investigated using SEM (Figure 1), which highlighted a globular morphology in both NIP-NPs (Figure 1,A) and MIP-NPs (Figure 1,B) with low variation in mean diameter (Figure 1,C,D and Table 1). Notably, NIP particles were approximately 35% smaller than the larger MIP particles, indicating that the imprinting process may contribute to an increase in particle size (Table 1). This size difference is likely attributable to the presence of the target molecule during the polymerization process. While numerous studies have explored the polymerization of MIP and NIP nanoparticles, the specific impact of template molecules on particle size has yet to be extensively investigated.
The weak interactions between the template molecules of S (-) limonene and the monomers could lead to the larger size of MIP nanoparticles. In this case, the physicochemical olefin properties of the template molecule (slight water solubility) prevent the direct interaction with the hydroxyl or carboxyl groups in MAA and EGDMA, presumably contributing to the larger particle diameter observed in the MIPs than the NIPs.
Both NIP-NPs and MIP-NPs displayed a rough and porous surface in SEM micrographs (Figure 1,A,B). Incidentally, NIP-NPs presented larger pores and relatively large tortuous and interconnected cavities around tens of nanometres (Figure 1,B).
TEM analyses of both NIP-NPs and MIP-NPs confirmed the homogeneity in size of these nanoparticles (Figure 2,A,C). However, these particles sometimes showed a slight fusion of adjacent spheres (shape inhomogeneity) and frequent apparent polymer leakage at contact points with TEM support grids and between contiguous nanoparticles (Figure 2,B,D), underpinning the observed particle aggregation previously described (Figure 1,A,B).
Both nanoparticle types displayed a "soft morphology" in TEM micrographs, characterized by diffuse or poorly defined edges, likely due to the absence of the ordered lattice structure typical of crystalline materials. Such nanoparticles are generally classified as amorphous [105]. Amorphous materials scatter electrons diffusely, leading to lower contrast and less defined boundaries, contributing to the perception of softness [106]. The irregular and flexible structures of amorphous polymers or crosslinked networks further accentuate this soft morphology, often producing rounded particles.
The softness of MIP nanoparticles likely arises from the high molar ratio of MAA (functional monomer) to EGDMA (crosslinker), which reduces network rigidity [107]. EGDMA's longer alkyl chains contribute to this softness by: (i) introducing flexibility through their ability to rotate and bend in amorphous regions, (ii) lowering crosslinking density due to reduced efficiency, and (iii) creating less defined surface boundaries in the nanoparticles. These factors collectively decrease stiffness and rigidity, resulting in a softer morphology[108].
The softness of nanoparticles, linked to the flexibility of the polymer matrix and its ability to undergo conformational changes, improves their capacity to accommodate, interact with, and release target analytes. This makes them particularly suitable for applications such as sensing, drug delivery, and separations. In VOC sensors (e.g., for detecting S(-)-limonene), this property is especially advantageous as it enhances both sensitivity and reusability.
3.2. Fibre Characterization
The fibre morphology housing MIP-NPs (MIP-NFs) was first investigated using scanning electron microscopy (SEM). The SEM micrographs of MIP-NFs displayed in Figure 3 depict a complex but ordered three-dimensional network of nanofibers achieved by electrospinning the PVP-MWCNT-MIP suspension onto silicon wafers. The fibres, ranging in diameter from 45 nm to 285 nm, with an average diameter of 134 ± 42 nm (Figure 3,C, inset), are well-distributed and intertwined, forming a continuous structure. The network demonstrates high interconnectivity, with several junctions and overlapping points (Figure 3, A-C). The pores within the network, measured over an area of 5.75 × 3.9 μm, are irregular in both shape and size, as expected in nonwoven and unaligned deposition, with an average pore area of 0.04 ± 0.047 μm². Some fusiform-shaped beads, characterized by the absence of branching and the continuation of the fiber, display minor diameters ranging from 0.65 to 3.65 μm (mean diameter: 1.21 ± 0.73 μm). This phenomenon is commonly attributed to high local surface tension or fluctuations in viscosity and electrical charge during the electrospinning process. The presence of MIP-NPs in the polymer matrix may contribute to these irregularities, either because the average fibre diameter is smaller than the one of the MIP-NPs or due to the inhomogeneous distribution of MIP-NPs along the fibres.
To better understand the internal structure of possible polymer beads along the fibres, we used a FIB-SEM to cut a thin transversal lamella (Figure 4 A-C). The SEM analysis in (dark) STEM mode [109] (Figure 4D) highlights several spherical nanoparticles dispersed within the fusiform bead form, suggesting the presence of the MIP-NPs. These particles are also visible in the fibre sections above the bead (see the arrows in Figure 4A, D). Bright-field STEM analysis of the thin lamella ((Figure 4,E) also confirms the presence of multi-walled carbon nanotubes (MWCNTs) segments within the bead matrix.
More detailed topographical information of the PVP/MWCNT/MIP-NP nanofibers (MIP-NFs) at the nanoscale was provided by AFM micrographs (Figure 5,A,B) in amplitude mode [110], revealing pronounced surface protrusions. These distinctive features prove the presence of heterogeneous complexes within the fibres, attributed to the incorporation of both MIP-NPs and MWCNTs. The protrusions on the fibre surfaces exhibit irregular sizes and shapes, confirming variations in the distribution of MIP-NPs throughout the polymer matrix. This uneven distribution may contribute to the rough texture of the fibres, enhancing their surface area (Figure 5,A,B).
The shape and distribution of MWCNTs are evident in TEM micrographs (Figure 5, C-E). The nanotubes are dispersed throughout the fibres in various configurations: i) aligned longitudinally with the fibre axis (Figure 5,D), ii) forming spiral structures (Figure 5,C), and iii) wrapping around the fibres in a spring-like arrangement (Figure 5,E). Typically, the dispersion state of carbon nanotubes in the electrospinning solution is reflected in their distribution within the fibres [103]. The alignment of MWCNTs within electrospun polymer nanofiber composites is influenced by the forces involved in the formation of nanofibers in the electrospinning process, like electrostatic forces and strong shear forces during the elongation process as also observed in the case of nanowire alignment within nanofibers [111]. Besides, it is heavily dependent on the stability of the carbon nanotube dispersion in the solution [112]. Factors such as solution viscosity, flow rate, type of collector, solvent, and the interactions among the polymer, nanoparticles, and nanotubes all play significant roles in this process [113]. Furthermore, inherent structural defects, like polymer dislocations and vacancies, may cause irregularities in the configuration of nanotubes in the nanofibers [114]. In addition to all the aforementioned factors, the different configurations observed are also due to the presence of MIP-NPs in the electrospinning solution, which could affect nanotube dispersion all along the nanofibers, thus altering their arrangement therein. An evident example of the possible interaction between MWCNTs and MIP-NPs is the spiral configuration of the MWCNTs displayed in Figure 5,C, where the nanotubes seem to tangle around a globose object that appears as an MIP-NP aggregate. Evidences of interactions between MIP-NPs and MWCNTs are also visible in Figure 4,E.
3.3. Electrical Properties
The measurement setup is illustrated and described in Figure 6,(A). The MIP- and NIP-NF-coated IDEs current-voltage (I-V) curves carried out at 55% RH and T: 25°C are shown in Figure 6,(B) and. The plot reveals non-linear shapes for both the chemiresistors. As shown in Figure 6,(B), when the voltage was increased in the positive direction, the current for both MIP- and NIP-NFs remained steady until it reached a threshold around +1 V, indicating the onset of a charge carrier injection into the nanocomposite. Beyond this point, a sharp rise in current was observed, suggesting the formation of a Schottky barrier at the electrode interface, leading to semiconductor-like behaviour with nonlinear characteristics. A similar trend was observed with a negative sign when a negative voltage was applied. At higher positive and negative voltages, the current increased linearly for both IDEs, albeit with different slopes. The resistance values measured at the working potential (+3V) indicated that both fibrous systems were highly resistive, with RNIP being comparable to RMIP (Table 3), though slightly higher. The sheet resistivity of the fibrous layer was calculated by measuring the electrical resistivity of the device and considering the dimensions of the electrodes as follows [115]:
where Rs is sheet resistance [Ω/□], R is electrical resistance [Ω]; W is the width of electrode fingers (10 µm); L is the length of electrode fingers (3500 µm) and np is the number of pairs of fingers (120). The results are summarised in Table 2.
The conductivity mechanism in the studied nanocomposites is likely a result of charge transport within the polymer matrix, facilitated by conductive pathways formed by multi-walled carbon nanotubes (MWCNTs) [116]. The incorporation of MWCNTs into the polyvinylpyrrolidone (PVP) matrix significantly enhanced electrical conductivity, despite the inherently low conductivity of PVP. This improvement may be further supported by the nitrogen heteroatoms in PVP, which facilitate electron acceptance and form charge-transfer complexes. Since the MWCNT concentration is below the percolation threshold, charge transport is presumably dominated by tunnelling effects [117,118,119,120,121]. Additional factors, such as the formation of a Schottky barrier at the MWCNT-PVP interfaces and imperfections at the nanofiber-electrode boundary, may also influence the observed conductivity. The IV-curves for the tested materials showed similar shapes, though higher values were recorded for NIP nanofibers, potentially due to differences in nanofiber network density [122].
Fibres loaded with 1.45 wt.% of MWCNTs exhibited high resistivity, consistent with previous findings on PVP/MWCNT nanocomposites. This behaviour aligns with the established percolation threshold of approximately 4 wt.% for similar systems [123,124]. The electrical conductivity of such composites is strongly influenced by the distribution of nanotubes within the polymer matrix. When MWCNTs are well-dispersed, tunnelling conduction predominates, leading to higher resistivity [119]. Conversely, the formation of MWCNT agglomerates facilitates direct contact between nanotubes, creating additional conductive pathways [118] that enable electrical percolation and electronic conduction [117].
The hydrophilic nature of PVP can facilitate moisture absorption from the environment, creating hydration layers and then enhancing ionic mobility, too. Additionally, MIP nanoparticles introduce specific binding sites for target analytes, and these interactions may locally influence ionic conductivity, generating measurable signal changes upon analyte recognition. In this study, MWCNT concentrations were deliberately kept below the percolation threshold to optimize the sensing mechanism, which relies primarily on changes in the fibres’ ionic conduction. Exceeding the percolation threshold shifts the conduction mechanism to electronic conduction, which could dominate the response and obscure ionic signals, ultimately compromising sensor performance (data not shown).
3.4. Sensor Features
In contrast to the most existing S(-)-limonene sensors based on MIPs, which typically use polymer films, this study adopts a novel approach to enhance sensing sites, surface area, and overall performance. While this strategy deviates from the typical requirements for QCM sensors (the most commonly used for limonene detection—Table 3), which favour thin, uniform coatings to minimize viscoelastic damping, it offers significant advantages. Specifically, an S-Lim-to-MAA molar ratio of 1:4 was used to synthesize MIP nanoparticles with a high density of specific binding sites, improving sensitivity. These MIP-NPs were incorporated into a nanofibrous framework with a high specific surface area to further enhance sensitivity and outperform bulk MIP coatings. Additionally, MWCNTs were included to boost conductivity and provide extra surface area for VOC adsorption.
Table 3 summarizes some key parameters of limonene sensors based on MIP technology and mentioned in Introduction paragraph. The most investigated molecularly imprinted thin films used MAA, EGDMA, and AIBN and were mainly paired with quartz crystal microbalances (QCM) to detect mass changes, bypassing the need for conductive polymers. The relationship between analyte concentration and sensor response remained linear across different ranges, as shown in the table. It was attributed to the MIP components molar ratio, the adopted solvents and the layer thickness which contributed to the final sensor architecture. It is observed that while MIPs are designed to be highly selective and capable of linear responses at high concentrations, their sensitivity may fall short when detecting the trace levels of VOCs emitted by plants, particularly under variable environmental conditions [64,65,66,67,69,70,71]. In contrast, the nanofibrous and conductive sensor based on PVP-PAA-MWCNT nanofibers, molecularly imprinted via UV-crosslinking (referred to as the MINF sensor), demonstrated a narrower linear range of 1–60 ppm (following a Langmuir-type response curve) but achieved a promising LOD of 226 ppb [101]. On the other hand, the latter presented certain limitations, including the need for precise control of UV exposure time to ensure effective photopolymerization.
In the present study, the nanostructured MIP-NF sensor exhibited rapid responses to S(-)-limonene, characterized by a swift increase in current, indicating high reactivity (Figure 7, A). Notably, the sensor reached a steady state, defined as t90 (the time required to achieve 90% of the response), in approximately 180 seconds at 30 ppm S(-)-limonene under controlled conditions: constant airflow, 55% relative humidity (RH), and a temperature of 25°C. The response kinetics reflected swift and efficient analyte detection, apparently without hysteresis. Indeed, the sensors consistently returned to baseline levels when exposed to clean air, highlighting their repeatability and reliability (Figure 7,A). The calibration curve for the MIP sensor, ranging between 10 and 100 ppm (Figure 7,B), indicates that increasing current changes occurred in response to increasing S(-)-limonene partial pressure, according to a non-linear model, like a Langmuir-type adsorption [125], with a gradual increase in response that approaches saturation only at higher analyte concentrations.
Therefore, sensor sensitivity, defined as the change in response per unit change in analyte concentration, was derived from the slope of the linear region of the Langmuir-like calibration curve (S = ΔInorm/C, where ΔInorm is the normalised change in current from its baseline, and C is the analyte concentration). For the MIP-NF sensor, the calculated sensitivity between 10-20 ppm (i.e. where the most rapid increase occurs) was S10-20: 0.102 ± 0.022 ppm⁻¹. LOD (Limit of Detection) and LOQ (Limit of Quantification) are two critical parameters for assessing the sensor's sensitivity and its ability to operate effectively in low-concentration environments. LOD represents the lowest concentration of an analyte that the sensor can reliably detect (equation 2), and it is the threshold at which the sensor response can be distinguished from background noise. LOQ, on the other hand, is the lowest concentration at which the sensor can not only detect but also accurately quantify the analyte with acceptable precision and accuracy (equation 3). These two parameters were calculated according to:
where SENS is the sensitivity, α is the slope of the response curve, is the standard deviation of the sensor’s baseline noise, LOD is the limit of detection, LOQ is the limit of quantification. Table 4 presents a comparison of these parameters between the MIP-NF and MINF sensors, with the latter (S-Lim sensor) utilizing the same polymer fibres and conductivity principles (PVP-MWCNTs) but featuring molecular imprinting of the template directly on the fibres [101].
Comparing the features of the sensor developed in the present study with those of the best-performing sensor previously fabricated and referred to as MINF sensor, a nearly three times higher sensitivity and a lower limit of detection (LOD) can be observed [101]. This finding highlights that incorporating MIP-NPs specific for S(-)-limonene recognition in the MIP-NF sensor enhances the detection performance towards this VOC significantly, albeit with a trade-off of increased response time likely due to their structural design.
The MIP nanoparticles in the MIP-NF sensor are engineered to provide a high density of binding sites, accounting for the superior sensitivity. The different sensitivity of the two sensors is reasonably affected by the global number of binding sites for S(-)-limonene molecules present in the two configurations. The higher sensitivity of MIP-NFs vs MINFs highlights that a higher number of MIP sites for S(-)-limonene is present in MIP-NFs than in MINFs. The combination of this outcome with that of lower LOD also suggests a more uniform distribution of these binding sites all along the MIP-NFs. These findings highlight that incorporating MIP-NPs specific for S(-)-limonene recognition in nanofiber to develop advanced targeted sensors enhances the detection of this VOC significantly. Notwithstanding the improved performances on MIP-NFs, the path required for S(-)-limonene molecules to reach the binding sites is greater than in MIPNF and generates a delay in response times (ranging from 30% to 70%, depending on VOC concentration).
About the kind of electrical signal generated by S(-)-limonene adsorption, some authors reported that including limonene as a dopant in a polyelectrolyte matrix enhances ionic conductivity due to interactions between the methyl and methylene groups of limonene (acting as electron donors) and the matrix, which improves ionic mobility and thus increases conductivity [126]. Therefore, adding limonene as an additive not only increases ionic conductivity but also reduces bulk resistance, creating additional conductive pathways within the polymer matrix [127]. In this study, the presence of hydroxyl groups from MAA and EGDMA, along with UV crosslinking in the air (which may ionise the carbonyl groups of PVP), likely contributes to the observed increase in conductivity in the presence of limonene.
To determine the selectivity and the effectiveness of the sensor to S-Lim, MIP- and NIP-NF based sensors were exposed to three different terpenes with similar structures. Measurements were performed using the experimental setup shown in Figure 7,A). Alpha-pinene and linalool were selected for the similarities of their structure (they are all monoterpenes, i.e. with 10 carbon atoms, and derived from similar building blocks, specifically isoprene units) which makes them structurally related, although they differ in specific functional groups (e.g., alcohol group in linalool vs. hydrocarbon structure in limonene and alpha-pinene). The normalised response of the sensor at 15 ppm of S(-)-limonene was observed to be approximately 4 times higher than the sensor response at the same concentration of linalool and more than 11 times higher than that of alpha-pinene (Figure 8,A). The higher response to linalool compared to α-pinene is presumably attributed to the hydroxyl group present in the linalool structure. Both the imprinted polyacrylate and PVP contain polar functional groups that can interact with linalool’s hydroxyl (-OH) group, thereby enhancing non-specific interactions. These polar interactions may lead to unintended binding of linalool on the sensor surface, even though the sensor is primarily selective for limonene. Consequently, the polar groups in both linalool and the sensor materials increase the likelihood of cross-reactivity, producing a measurable response despite the sensor's high selectivity for limonene.
An estimation of sensor selectivity [128] among the tested VOCs was described by the selectivity index (SI) (Equation (4)):
where Rtarget is the sensor response to a defined concentration of the analyte and RVOCs is the sensor response to the other chemicals within the measured pattern. The selectivity index of the MIP-NF sensor was 73% for S(-)-limonene when mixed with other terpenes, as depicted in the pie chart of Figure 8,(B), and itis a little higher than the one of MINF sensor for the same monoterpene (72%) reported by Macagnano et al. (2024) [101]. Such a slight increase in selectivity suggests that the nano-in-nano strategy adopted here enhanced the sensor’s analyte recognition properties. Simultaneously, the IDE coated with NIP-NFs provided a very low response to S(-)-limonene (Figure 8,C) and to all the other tested chemicals without any apparent selectivity, confirming the efficiency of the imprinting method (data not shown).
SI(%) = (Rtarget/∑RVOCs)× 100
The recovery and reproducibility of the sensor were evaluated over 8 cycles to 70 ppm. After each cycle, the MIP-NF sensor demonstrated a mean response value of 3.25 with a maximum variation of 5%. The assessment of the long-term stability of the MIP-based nanofibrous sensor for S(-)-limonene showed that the response curve consistently followed that one of the MIP-NF sensor measuring S(-)-limonene over short periods, indicating that the MIP-NF sensor maintained stability for at least one year (data not shown).
3.5. Humidity Interference
Environmental humidity is one of the most common interferents in polymer sensors, significantly affecting sensing characteristics such as response dynamics, selectivity, and sensitivity. Hence, evaluating the sensor's performance under varying relative humidity conditions is crucial to determining its optimal operating environment.
When comparable volumes of ambient air saturated with water vapor (Figure 9, blue bar) and S(-)-limonene vapours (Figure 9, brown bar) were introduced into the sensor chamber, the results confirmed the sensor's high selectivity for S(-)-limonene. Only minor increases in conductivity were observed in response to water vapor, with the change being less than 5% of the electrical signal generated by S-limonene vapor.
In the present study, the MIP-NF sensor was tested at 100 ppm of S(-)-limonene under relative humidity levels of 30%, 55%, and 80% to identify the most suitable measuring conditions. At 30% humidity, the sensor exhibited significant noise and a very weak electrical signal (data not shown). The optimal response was achieved at 55% relative humidity, where the sensor demonstrated superior performance. At 80% relative humidity, although conductivity was three orders of magnitude higher, resulting in less noisy measurements, the ΔI/I₀ ratio was lower, and response times were slower. Figure 10 illustrates the comparison of response dynamics under these conditions.
The conduction mechanism in the MIP-NF sensor can be attributed to the interaction of polar molecules, such as water, with the PVP polymer. Due to nitrogen atoms in PVP, water molecules are readily absorbed, particularly under higher humidity level [129]. At low relative humidity, only few water molecules are adsorbed onto the PVP surface, producing a small amount of H+ ions. In this case, the intrinsic electrons of PVP primarily govern conductivity. As relative humidity increases, more water molecules are absorbed, leading to the generation of additional H+ ions and a shift towards ion conduction as the dominant mechanism.
Shinde et al. [130] further supported this mechanism through molecular simulations, demonstrating that significant interactions occur when PVP chains are arranged so that hydrogen-bonded protons can be shared between adjacent carbonyl groups. If these carbonyl groups are tightly packed, they restrict the mobility of other species and facilitate proton transfer via the Grotthuss mechanism, enhancing the overall conductivity of the sensor.
In Figure 10, the sensor responses demonstrate environmental humidity's significant influence on response time and sensitivity. The proposed mechanism is illustrated in the same figure (Figure 10, right). An increase in water ions enhances conductivity, which impacts the sensor's sensitivity. However, excessive water vapor saturates the molecular recognition sites, hindering efficient access to S(-)-limonene and leading to nonspecific interactions (refer to the schematic in Figure 10, right). At approximately 55% relative humidity, S(-)-limonene can effectively access these recognition sites. When the sensor was exposed to 100 ppm of S(-)-limonene and the relative humidity decreased from 80% to 55%, there was a marked improvement in performance. The ΔI/I₀ ratio increased from 1.0 to 3.6, and the response time (t90) significantly decreased from 325 s to 135 s.
5. Conclusions
This study presents significant advancements in the development and optimization of molecularly imprinted nanofiber (MINF) sensors for detecting volatile organic compounds (VOCs), with a particular focus on limonene as a biomarker for plant health. In addition, this study highlights the potential of molecularly imprinted polymer (MIP) technology as a powerful tool to mimic natural recognition mechanisms, enhancing sensor sensitivity and selectivity. Although MIP-based chemiresistors for monoterpene detection remain relatively unexplored, our findings demonstrate their promise in detecting VOCs as biomarkers, contaminants, and pollutants. By integrating electrospinning, molecular imprinting, and conductive nanomaterials, this work addresses critical challenges in sensor fabrication, including the creation of highly specific recognition sites through a “nano-in-nano” strategy, resulting in a streamlined process with improved performance. The proposed sensor, comprising polyvinyl pyrrolidone (PVP) nanofibers reinforced with multiwalled carbon nanotubes (MWCNTs) and incorporating MIP nanoparticles tailored for S(-)-limonene, exhibited high sensitivity and rapid response times (steady-state achieved within 200 s) under controlled humidity conditions (~55% RH). The sensor’s encouraging performance metrics—LOD of 190 ppb, LOQ of 630 ppb, a high selectivity index (SI) of 73% among similar terpenes, and excellent reproducibility (±5%)—underscore its potential for applications in agriculture, enabling precise and reliable monitoring of S-limonene as a biomarker for plant health. However, since humidity is a key contributor to electrical and sensing signals, variations in environmental humidity emphasise the need for refined sensor design and operational strategies. Potential solutions include integrating Nafion®-based cartridges or saline-bathed tubing to stabilise humidity, as well as implementing humidity compensation algorithms or auxiliary humidity sensors to ensure consistent performance. Future research should focus on enhancing the sensor’s functionality across broader humidity ranges and achieving greater linearity over an expanded detection range. Investigating less hydrophilic polymers than PVP and optimising the mass ratio between the host polymer and MIP nanoparticles could improve sensor performance. The effects of thermal excursions on the sensor's performance shall also be investigated. This work establishes a foundation for advancing VOC sensing technologies, with far-reaching implications for precision agriculture, air quality monitoring, and disease detection. It also contributes to broader applications within the Internet of Things (IoT) ecosystem.
Author Contributions
For research articles with several authors, a short paragraph specifying their individual contributions must be provided. The following statements should be used “Conceptualization, A.M. and FN.M.; methodology, A.M. and FN.M.; validation, FN.M and F.DC..; formal analysis, M.M, R.C., E.B., S.S.; investigation, FN.M., A.M.; resources, A.M.; data curation, FN.M.; writing—original draft preparation, FN.M., F.DC., A.M.; writing—review and editing, A.M., FN.M., M.M., F.DC.; supervision, A.M.; funding acquisition, A.M. All authors have read and agreed to the published version of the manuscript.
Funding
This research was co-funded by Project “MOSSA”—European Regional Development Fund POR FESR Lazio 2014–2020, N. T0002E0001 and Project “TERRE” – Strategic Research Projects@CNR 2020-2022, N. SAC.AD002.173.041
Institutional Review Board Statement
Not applicable
Data Availability Statement
The raw data supporting the conclusions of this article will be made available by the authors on request.
Acknowledgments
Many thanks to A. Capocecera for his excellent technical support and Tiziana Davanzo, F. Battistelli and S. Berti for their constant collaboration in administrative, managerial, and financial management.
Conflicts of Interest
The authors declare no conflicts of interest. The funders had no role in the design of the study, in the collection, analyses, or interpretation of data, in the writing of the manuscript, or in the decision to publish the results.
References
- Çakmakçı, R.; Salık, M.A.; Çakmakçı, S. Assessment and Principles of Environmentally Sustainable Food and Agriculture Systems. Agriculture 2023, 13, 1073. [CrossRef]
- Weih, M.; Hamnér, K.; Pourazari, F. Analyzing Plant Nutrient Uptake and Utilization Efficiencies: Comparison between Crops and Approaches. Plant Soil 2018, 430, 7–21. [CrossRef]
- Salim, N.; Raza, A. Nutrient Use Efficiency (NUE) for Sustainable Wheat Production: A Review. J Plant Nutr 2020, 43, 297–315. [CrossRef]
- Savary, S.; Willocquet, L.; Pethybridge, S.J.; Esker, P.; McRoberts, N.; Nelson, A. The Global Burden of Pathogens and Pests on Major Food Crops. Nat Ecol Evol 2019, 3, 430–439. [CrossRef]
- Oerke, E.-C.; Dehne, H.-W. Safeguarding Production—Losses in Major Crops and the Role of Crop Protection. Crop Protection 2004, 23, 275–285. [CrossRef]
- OERKE, E.-C. Crop Losses to Pests. J Agric Sci 2006, 144, 31–43. [CrossRef]
- Haq, I.U.; Rahim, K.; Yahya, G.; Ijaz, B.; Maryam, S.; Paker, N.P. Eco-Smart Biocontrol Strategies Utilizing Potent Microbes for Sustainable Management of Phytopathogenic Diseases. Biotechnology Reports 2024, 44, e00859. [CrossRef]
- Anaduaka, E.G.; Uchendu, N.O.; Asomadu, R.O.; Ezugwu, A.L.; Okeke, E.S.; Chidike Ezeorba, T.P. Widespread Use of Toxic Agrochemicals and Pesticides for Agricultural Products Storage in Africa and Developing Countries: Possible Panacea for Ecotoxicology and Health Implications. Heliyon 2023, 9, e15173. [CrossRef]
- Poland, J.; Rutkoski, J. Advances and Challenges in Genomic Selection for Disease Resistance. Annu Rev Phytopathol 2016, 54, 79–98. [CrossRef]
- Palmgren, M.; Shabala, S. Adapting Crops for Climate Change: Regaining Lost Abiotic Stress Tolerance in Crops. Frontiers in Science 2024, 2. [CrossRef]
- Roper, J.M.; Garcia, J.F.; Tsutsui, H. Emerging Technologies for Monitoring Plant Health in Vivo. ACS Omega 2021, 6, 5101–5107. [CrossRef]
- Oerke, E.-C. Remote Sensing of Diseases. Annu Rev Phytopathol 2024, 58, 225–252. [CrossRef]
- Fahey, T.; Pham, H.; Gardi, A.; Sabatini, R.; Stefanelli, D.; Goodwin, I.; Lamb, D.W. Active and Passive Electro-Optical Sensors for Health Assessment in Food Crops. Sensors 2020, 21, 171. [CrossRef]
- Galieni, A.; D’Ascenzo, N.; Stagnari, F.; Pagnani, G.; Xie, Q.; Pisante, M. Past and Future of Plant Stress Detection: An Overview From Remote Sensing to Positron Emission Tomography. Front Plant Sci 2021, 11. [CrossRef]
- Richard, B.; Qi, A.; Fitt, B.D.L. Control of Crop Diseases through Integrated Crop Management to Deliver Climate-smart Farming Systems for Low- and High-input Crop Production. Plant Pathol 2022, 71, 187–206. [CrossRef]
- Weiss, M.; Jacob, F.; Duveiller, G. Remote Sensing for Agricultural Applications: A Meta-Review. Remote Sens Environ 2020, 236, 111402. [CrossRef]
- Victor, N.; Maddikunta, P.K.R.; Mary, D.R.K.; Murugan, R.; Chengoden, R.; Gadekallu, T.R.; Rakesh, N.; Zhu, Y.; Paek, J. Remote Sensing for Agriculture in the Era of Industry 5.0—A Survey. IEEE J Sel Top Appl Earth Obs Remote Sens 2024, 17, 5920–5945. [CrossRef]
- Oerke, E.-C. Remote Sensing of Diseases. Annu Rev Phytopathol 2020, 58, 225–252. [CrossRef]
- Alsadik, B.; Ellsäßer, F.J.; Awawdeh, M.; Al-Rawabdeh, A.; Almahasneh, L.; Oude Elberink, S.; Abuhamoor, D.; Al Asmar, Y. Remote Sensing Technologies Using UAVs for Pest and Disease Monitoring: A Review Centered on Date Palm Trees. Remote Sens (Basel) 2024, 16, 4371. [CrossRef]
- Gupta, S.; Huang, C.H.; Singh, G.P.; Park, B.S.; Chua, N.-H.; Ram, R.J. Portable Raman Leaf-Clip Sensor for Rapid Detection of Plant Stress. Sci Rep 2020, 10, 20206. [CrossRef]
- Gouinguené, S.P.; Turlings, T.C.J. The Effects of Abiotic Factors on Induced Volatile Emissions in Corn Plants. Plant Physiol 2002, 129, 1296–1307. [CrossRef]
- Vinicius da Silva Ferreira, M.; Barbosa, J.L.; Kamruzzaman, M.; Barbin, D.F. Low-Cost Electronic-Nose (LC-e-Nose) Systems for the Evaluation of Plantation and Fruit Crops: Recent Advances and Future Trends. Analytical Methods 2023, 15, 6120–6138. [CrossRef]
- Fundurulic, A.; Faria, J.M.S.; Inácio, M.L. Advances in Electronic Nose Sensors for Plant Disease and Pest Detection. In Proceedings of the CSAC 2023; MDPI: Basel Switzerland, September 20 2023; p. 14.
- Ali, A.; Mansol, A.S.; Khan, A.A.; Muthoosamy, K.; Siddiqui, Y. Electronic Nose as a Tool for Early Detection of Diseases and Quality Monitoring in Fresh Postharvest Produce: A Comprehensive Review. Compr Rev Food Sci Food Saf 2023, 22, 2408–2432. [CrossRef]
- Kashyap, B.; Kumar, R. Sensing Methodologies in Agriculture for Monitoring Biotic Stress in Plants Due to Pathogens and Pests. Inventions 2021, 6, 29. [CrossRef]
- Alsadik, B.; Ellsäßer, F.J.; Awawdeh, M.; Al-Rawabdeh, A.; Almahasneh, L.; Oude Elberink, S.; Abuhamoor, D.; Al Asmar, Y. Remote Sensing Technologies Using UAVs for Pest and Disease Monitoring: A Review Centered on Date Palm Trees. Remote Sens (Basel) 2024, 16, 4371. [CrossRef]
- Gold, K.M. Plant Disease Sensing: Studying Plant-Pathogen Interactions at Scale. mSystems 2021, 6. [CrossRef]
- Silva, G.; Tomlinson, J.; Onkokesung, N.; Sommer, S.; Mrisho, L.; Legg, J.; Adams, I.P.; Gutierrez-Vazquez, Y.; Howard, T.P.; Laverick, A.; et al. Plant Pest Surveillance: From Satellites to Molecules. Emerg Top Life Sci 2021, 5, 275–287. [CrossRef]
- Virnodkar, S.S.; Pachghare, V.K.; Patil, V.C.; Jha, S.K. Remote Sensing and Machine Learning for Crop Water Stress Determination in Various Crops: A Critical Review. Precis Agric 2020, 21, 1121–1155. [CrossRef]
- Perdomo, S.A.; Valencia, D.P.; Velez, G.E.; Jaramillo-Botero, A. Advancing Abiotic Stress Monitoring in Plants with a Wearable Non-Destructive Real-Time Salicylic Acid Laser-Induced-Graphene Sensor. Biosens Bioelectron 2024, 255, 116261. [CrossRef]
- Kesselmeier, J.; Staudt, M. Biogenic Volatile Organic Compounds (VOC): An Overview on Emission, Physiology and Ecology. J Atmos Chem 1999, 33, 23–88. [CrossRef]
- Guenther A, H.C.E.D.F.R.G.C.G.T.H.P.K.L.L.M.M.W.P.T.S.B.S.R.T.R.T.J., Z.P. A Global Model of Natural Volatile Organic Compound Emissions. J Geophys Res 1995, 100, 8873–8892. [CrossRef]
- Sindelarova, K.; Granier, C.; Bouarar, I.; Guenther, A.; Tilmes, S.; Stavrakou, T.; Müller, J.-F.; Kuhn, U.; Stefani, P.; Knorr, W. Global Data Set of Biogenic VOC Emissions Calculated by the MEGAN Model over the Last 30 Years. Atmos Chem Phys 2014, 14, 9317–9341. [CrossRef]
- Dudareva, N.; Negre, F.; Nagegowda, D.A.; Orlova, I. Plant Volatiles: Recent Advances and Future Perspectives. CRC Crit Rev Plant Sci 2006, 25, 417–440. [CrossRef]
- Maffei, M.E. Sites of Synthesis, Biochemistry and Functional Role of Plant Volatiles. South African Journal of Botany 2010, 76, 612–631. [CrossRef]
- Eirini, S.; Paschalina, C.; Ioannis, T.; Kortessa, D.-T. Effect of Drought and Salinity on Volatile Organic Compounds and Other Secondary Metabolites of Citrus Aurantium Leaves. In Proceedings of the NATURAL PRODUCT COMMUNICATIONS; SAGE PUBLICATIONS INC: 2455 TELLER RD, THOUSAND OAKS, CA 91320, April 5 2017; pp. 193–196. [CrossRef]
- Bracho-Nunez, A.; Welter, S.; Staudt, M.; Kesselmeier, J. Plant-Specific Volatile Organic Compound Emission Rates from Young and Mature Leaves of Mediterranean Vegetation. J Geophys Res 2011, 116, D16304. [CrossRef]
- Brillante, L.; Martínez-Lüscher, J.; Kurtural, S.K. Applied Water and Mechanical Canopy Management Affect Berry and Wine Phenolic and Aroma Composition of Grapevine ( Vitis Vinifera L., Cv. Syrah) in Central California. Sci Hortic 2018, 227, 261–271. [CrossRef]
- Chen, J.; Tang, J.; Yu, X. Environmental and Physiological Controls on Diurnal and Seasonal Patterns of Biogenic Volatile Organic Compound Emissions from Five Dominant Woody Species under Field Conditions. Environmental Pollution 2020, 259, 113955. [CrossRef]
- Toffolatti, S.L.; Maddalena, G.; Passera, A.; Casati, P.; Bianco, P.A.; Quaglino, F. Role of Terpenes in Plant Defense to Biotic Stress. In Biocontrol Agents and Secondary Metabolites; Elsevier, 2021; pp. 401–417. [CrossRef]
- Boncan, D.A.T.; Tsang, S.S.K.; Li, C.; Lee, I.H.T.; Lam, H.-M.; Chan, T.-F.; Hui, J.H.L. Terpenes and Terpenoids in Plants: Interactions with Environment and Insects. Int J Mol Sci 2020, 21, 7382. [CrossRef]
- Loreto, F.; Schnitzler, J.-P. Abiotic Stresses and Induced BVOCs. Trends Plant Sci 2010, 15, 154–166. [CrossRef]
- Kovalenko, Y.; Tindjau, R.; Madilao, L.L.; Castellarin, S.D. Regulated Deficit Irrigation Strategies Affect the Terpene Accumulation in Gewürztraminer (Vitis Vinifera L.) Grapes Grown in the Okanagan Valley. Food Chem 2021, 341, 128172. [CrossRef]
- Castorina, G.; Grassi, F.; Consonni, G.; Vitalini, S.; Oberti, R.; Calcante, A.; Ferrari, E.; Bononi, M.; Iriti, M. Characterization of the Biogenic Volatile Organic Compounds (BVOCs) and Analysis of the PR1 Molecular Marker in Vitis Vinifera L. Inoculated with the Nematode Xiphinema Index. Int J Mol Sci 2020, 21, 4485. [CrossRef]
- Malheiro, R.; Casal, S.; Cunha, S.C.; Baptista, P.; Pereira, J.A. Identification of Leaf Volatiles from Olive (Olea Europaea) and Their Possible Role in the Ovipositional Preferences of Olive Fly, Bactrocera Oleae (Rossi) (Diptera: Tephritidae). Phytochemistry 2016, 121, 11–19. [CrossRef]
- Ninkuu, V.; Zhang, L.; Yan, J.; Fu, Z.; Yang, T.; Zeng, H. Biochemistry of Terpenes and Recent Advances in Plant Protection. Int J Mol Sci 2021, 22, 5710. [CrossRef]
- Aina, O.; Bakare, O.O.; Fadaka, A.O.; Keyster, M.; Klein, A. Plant Biomarkers as Early Detection Tools in Stress Management in Food Crops: A Review. Planta 2024, 259, 60. [CrossRef]
- Notario, A.; Sánchez, R.; Luaces, P.; Sanz, C.; Pérez, A.G. The Infestation of Olive Fruits by Bactrocera Oleae (Rossi) Modifies the Expression of Key Genes in the Biosynthesis of Volatile and Phenolic Compounds and Alters the Composition of Virgin Olive Oil. Molecules 2022, 27, 1650. [CrossRef]
- Herrera-Chacón, A.; Cetó, X.; del Valle, M. Molecularly Imprinted Polymers - towards Electrochemical Sensors and Electronic Tongues. Anal Bioanal Chem 2021, 413, 6117–6140. [CrossRef]
- Cieplak, M.; Kutner, W. Artificial Biosensors: How Can Molecular Imprinting Mimic Biorecognition? Trends Biotechnol 2016, 34, 922–941. [CrossRef]
- Malitesta, C.; Mazzotta, E.; Picca, R.A.; Poma, A.; Chianella, I.; Piletsky, S.A. MIP Sensors – the Electrochemical Approach. Anal Bioanal Chem 2012, 402, 1827–1846. [CrossRef]
- Wasilewski, T.; Orbay, S.; Brito, N.F.; Sikora, K.; Melo, A.C.A.; Melendez, M.E.; Szulczyński, B.; Sanyal, A.; Kamysz, W.; Gębicki, J. Molecularly Imprinted Polymers for the Detection of Volatile Biomarkers. TrAC Trends in Analytical Chemistry 2024, 177, 117783. [CrossRef]
- Hua, Y.; Ahmadi, Y.; Kim, K.-H. Molecularly Imprinted Polymers for Sensing Gaseous Volatile Organic Compounds: Opportunities and Challenges. Environmental Pollution 2022, 311, 119931. [CrossRef]
- Kim, W.; Noh, B.-I.; Cha, Y.L.; Chang, Y.-H.; Dai, S.; Kim, S.H.; Kim, D.-J. Development of Molecularly Imprinted Polymer Electrochemical Sensors for Strawberry Sweetness Biomarker Detection. ACS Appl Polym Mater 2024, 6, 8084–8092. [CrossRef]
- Antwi-Boampong, S.; Mani, K.S.; Carlan, J.; BelBruno, J.J. A Selective Molecularly Imprinted Polymer-Carbon Nanotube Sensor for Cotinine Sensing. Journal of Molecular Recognition 2014, 27, 57–63. [CrossRef]
- Tang, X.; Raskin, J.-P.; Lahem, D.; Krumpmann, A.; Decroly, A.; Debliquy, M. A Formaldehyde Sensor Based on Molecularly-Imprinted Polymer on a TiO2 Nanotube Array. Sensors 2017, 17, 675. [CrossRef]
- Koudehi, M.F.; Pourmortazavi, S.M.; Zibaseresht, R.; Mirsadeghi, S. << MEMS-Based PVA/PPy/MIP Polymeric- Nanofiber Sensor Fabricated by LIFT-OFF Process for Detection 2,4-Dinitrotoluene Vapor. IEEE Sens J 2021, 21, 9492–9499. [CrossRef]
- Alizadeh, T.; Rezaloo, F. Toluene Chemiresistor Sensor Based on Nano-Porous Toluene-Imprinted Polymer. Int J Environ Anal Chem 2013, 93, 919–934. [CrossRef]
- Alizadeh, T.; Rezaloo, F. A New Chemiresistor Sensor Based on a Blend of Carbon Nanotube, Nano-Sized Molecularly Imprinted Polymer and Poly Methyl Methacrylate for the Selective and Sensitive Determination of Ethanol Vapor. Sens Actuators B Chem 2013, 176, 28–37. [CrossRef]
- Dong, X.; Zhang, C.; Du, X.; Zhang, Z. Recent Advances of Nanomaterials-Based Molecularly Imprinted Electrochemical Sensors. Nanomaterials 2022, 12, 1913. [CrossRef]
- Garcia-Cruz, A.; Ahmad, O.S.; Alanazi, K.; Piletska, E.; Piletsky, S.A. Generic Sensor Platform Based on Electro-Responsive Molecularly Imprinted Polymer Nanoparticles (e-NanoMIPs). Microsyst Nanoeng 2020, 6, 83. [CrossRef]
- Wang, L.; Pagett, M.; Zhang, W. Molecularly Imprinted Polymer (MIP) Based Electrochemical Sensors and Their Recent Advances in Health Applications. Sensors and Actuators Reports 2023, 5, 100153. [CrossRef]
- Rahman, S.; Bozal-Palabiyik, B.; Unal, D.N.; Erkmen, C.; Siddiq, M.; Shah, A.; Uslu, B. Molecularly Imprinted Polymers (MIPs) Combined with Nanomaterials as Electrochemical Sensing Applications for Environmental Pollutants. Trends in Environmental Analytical Chemistry 2022, 36, e00176. [CrossRef]
- Kikuchi, M.; Tsuru, N.; Shiratori, S. Recognition of Terpenes Using Molecular Imprinted Polymer Coated Quartz Crystal Microbalance in Air Phase. Sci Technol Adv Mater 2006, 7, 156–161. [CrossRef]
- Ghatak, B.; Ali, S.B.; Naskar, H.; Tudu, B.; Pramanik, P.; Mukherji, S.; Bandyopadhyay, R. Selective and Sensitive Detection of Limonene in Mango Using Molecularly Imprinted Polymer Based Quartz Crystal Microbalance Sensor. In Proceedings of the 2019 IEEE International Symposium on Olfaction and Electronic Nose (ISOEN); IEEE, May 2019; pp. 1–3. [CrossRef]
- Hawari, H.F.; Samsudin, N.M.; Ahmad, M.N.; Shakaff, A.Y.M.; Ghani, S.A.; Wahab, Y.; Za’aba, S.K.; Akitsu, T. Array of MIP-Based Sensor for Fruit Maturity Assessment. Procedia Chem 2012, 6, 100–109. [CrossRef]
- Iqbal, N.; Mustafa, G.; Rehman, A.; Biedermann, A.; Najafi, B.; Lieberzeit, P.A.; Dickert, F.L. QCM-Arrays for Sensing Terpenes in Fresh and Dried Herbs via Bio-Mimetic MIP Layers. Sensors 2010, 10, 6361–6376. [CrossRef]
- Chen, M.; Yazdani, M.; Murugappan, K. Non-Destructive Pest Detection: Innovations and Challenges in Sensing Airborne Semiochemicals. ACS Sens 2024, 9, 5728–5747. [CrossRef]
- Wen, T.; Nie, Q.; Han, L.; Gong, Z.; Li, D.; Ma, Q.; Wang, Z.; He, W.; Wen, L.; Peng, H. Molecularly Imprinted Polymers-Based Piezoelectric Coupling Sensor for the Rapid and Nondestructive Detection of Infested Citrus. Food Chem 2022, 387, 132905. [CrossRef]
- Hawari, H.F.; Samsudin, N.M.; Md Shakaff, A.Y.; Ghani, Supri.A.; Ahmad, M.N.; Wahab, Y.; Hashim, U. Development of Interdigitated Electrode Molecular Imprinted Polymer Sensor for Monitoring Alpha Pinene Emissions from Mango Fruit. Procedia Eng 2013, 53, 197–202. [CrossRef]
- Völkle, J.; Kumpf, K.; Feldner, A.; Lieberzeit, P.; Fruhmann, P. Development of Conductive Molecularly Imprinted Polymers (CMIPs) for Limonene to Improve and Interconnect QCM and Chemiresistor Sensing. Sens Actuators B Chem 2022, 356, 131293. [CrossRef]
- Olsen, B.G.; Stradiotto, N.R. Enantioselective Detection of (D)- and (L)-Limonene from Essential Oil Samples Using a Molecularly Imprinted Polypyrrole Electrochemical Sensor. ECS Meeting Abstracts 2024, MA2024-01, 2667–2667. [CrossRef]
- Fresco-Cala, B.; Batista, A.D.; Cárdenas, S. Molecularly Imprinted Polymer Micro- and Nano-Particles: A Review. Molecules 2020, 25, 4740. [CrossRef]
- Chen, L.; Wang, X.; Lu, W.; Wu, X.; Li, J. Molecular Imprinting: Perspectives and Applications. Chem Soc Rev 2016, 45, 2137–2211. [CrossRef]
- Macagnano, A.; Perri, V.; Zampetti, E.; Bearzotti, A.; De Cesare, F. Humidity Effects on a Novel Eco-Friendly Chemosensor Based on Electrospun PANi/PHB Nanofibres. Sens Actuators B Chem 2016, 232, 16–27. [CrossRef]
- Borah, A.R.; Hazarika, P.; Duarah, R.; Goswami, R.; Hazarika, S. Biodegradable Electrospun Membranes for Sustainable Industrial Applications. ACS Omega 2024, 9, 11129–11147. [CrossRef]
- Soares, R.M.D.; Siqueira, N.M.; Prabhakaram, M.P.; Ramakrishna, S. Electrospinning and Electrospray of Bio-Based and Natural Polymers for Biomaterials Development. Materials Science and Engineering: C 2018, 92, 969–982. [CrossRef]
- Keshvardoostchokami, M.; Majidi, S.S.; Huo, P.; Ramachandran, R.; Chen, M.; Liu, B. Electrospun Nanofibers of Natural and Synthetic Polymers as Artificial Extracellular Matrix for Tissue Engineering. Nanomaterials 2020, 11, 21. [CrossRef]
- Electrospinning for High Performance Sensors; Macagnano, A., Zampetti, E., Kny, E., Eds.; Springer International Publishing: Cham, 2015; ISBN 978-3-319-14405-4. [CrossRef]
- Papa, P.; Zampetti, E.; Molinari, F.N.; De Cesare, F.; Di Natale, C.; Tranfo, G.; Macagnano, A. A Polyvinylpyrrolidone Nanofibrous Sensor Doubly Decorated with Mesoporous Graphene to Selectively Detect Acetic Acid Vapors. Sensors 2024, 24, 2174. [CrossRef]
- Vanaraj, R.; Arumugam, B.; Mayakrishnan, G.; Kim, I.S.; Kim, S.C. A Review on Electrospun Nanofiber Composites for an Efficient Electrochemical Sensor Applications. Sensors 2023, 23, 6705. [CrossRef]
- Macagnano, A.; Avossa, J. Nanostructured Composite Materials for Advanced Chemical Sensors. In Advances in Nanostructured Materials and Nanopatterning Technologies; Elsevier, 2020; pp. 297–332. [CrossRef]
- Avossa, J.; Zampetti, E.; De Cesare, F.; Bearzotti, A.; Scarascia-Mugnozza, G.; Vitiello, G.; Zussman, E.; Macagnano, A. Thermally Driven Selective Nanocomposite PS-PHB/MGC Nanofibrous Conductive Sensor for Air Pollutant Detection. Front Chem 2018, 6. [CrossRef]
- Patel, K.D.; Kim, H.; Knowles, J.C.; Poma, A. Molecularly Imprinted Polymers and Electrospinning: Manufacturing Convergence for Next-Level Applications. Adv Funct Mater 2020, 30. [CrossRef]
- Dong, H.; Tong, L.; Cheng, M.; Hou, S. Utilizing Electrospun Molecularly Imprinted Membranes for Food Industry: Opportunities and Challenges. Food Chem 2024, 460, 140695. [CrossRef]
- Zhu, Y.; Dai, Y.; Rong, J.; Zhang, T.; Xue, S.; Yang, D.; Pan, J.; Qiu, F. “Sandwich-like” Electrospinning Fiber-Based Molecularly Imprinted Membrane Constructed with Electrospun Polyethyleneimine as the Multifunction Interlayer for the Selective Separation of Shikimic Acid. Chemical Engineering Journal 2023, 463, 142501. [CrossRef]
- Li, L.; Liu, H.; Lei, X.; Zhai, Y. Electrospun Nanofiber Membranes Containing Molecularly Imprinted Polymer (MIP) for Rhodamine B (RhB). Advances in Chemical Engineering and Science 2012, 02, 266–274. [CrossRef]
- Mohammadi, V.; Saraji, M.; Jafari, M.T. Direct Molecular Imprinting Technique to Synthesize Coated Electrospun Nanofibers for Selective Solid-Phase Microextraction of Chlorpyrifos. Microchimica Acta 2019, 186, 524. [CrossRef]
- Moraes Segundo, J. de D.P. de; Moraes, M.O.S. de; Brito, W.R.; Matos, R.S.; Salerno, M.; Barcelay, Y.R.; Segala, K.; Fonseca Filho, H.D. da; d’Ávila, M.A. Molecularly Imprinted Membrane Produced by Electrospinning for β-Caryophyllene Extraction. Materials 2022, 15, 7275. [CrossRef]
- Liu, X.; Wang, Y.; Liu, H.; He, R.; Zhao, X.; Wang, Y.; Qin, W.; Yin, S. Molecularly Imprinted Sensors Based on Highly Stretchable Electrospun Membranes for Cortisol Detection. Microchemical Journal 2024, 207, 112115. [CrossRef]
- Zahedi, P.; Fallah-Darrehchi, M.; Nadoushan, S.A.; Aeinehvand, R.; Bagheri, L.; Najafi, M. Morphological, Thermal and Drug Release Studies of Poly (Methacrylic Acid)-Based Molecularly Imprinted Polymer Nanoparticles Immobilized in Electrospun Poly (ε-Caprolactone) Nanofibers as Dexamethasone Delivery System. Korean Journal of Chemical Engineering 2017, 34, 2110–2118. [CrossRef]
- Demirkurt, M.; Olcer, Y.A.; Demir, M.M.; Eroglu, A.E. Electrospun Polystyrene Fibers Knitted around Imprinted Acrylate Microspheres as Sorbent for Paraben Derivatives. Anal Chim Acta 2018, 1014, 1–9. [CrossRef]
- Hassanzadeh, M.; Ghaemy, M.; Amininasab, S.M.; Shami, Z. An Effective Approach for Fast Selective Separation of Cr(VI) from Water by Ion-Imprinted Polymer Grafted on the Electro-Spun Nanofibrous Mat of Functionalized Polyacrylonitrile. React Funct Polym 2018, 130, 70–80. [CrossRef]
- Wu, Y.; Zhang, Y.; Zhang, M.; Liu, F.; Wan, Y.; Huang, Z.; Ye, L.; Zhou, Q.; Shi, Y.; Lu, B. Selective and Simultaneous Determination of Trace Bisphenol A and Tebuconazole in Vegetable and Juice Samples by Membrane-Based Molecularly Imprinted Solid-Phase Extraction and HPLC. Food Chem 2014, 164, 527–535. [CrossRef]
- Liu, F.; Liu, Q.; Zhang, Y.; Liu, Y.; Wan, Y.; Gao, K.; Huang, Y.; Xia, W.; Wang, H.; Shi, Y.; et al. Molecularly Imprinted Nanofiber Membranes Enhanced Biodegradation of Trace Bisphenol A by Pseudomonas Aeruginosa. Chemical Engineering Journal 2015, 262, 989–998. [CrossRef]
- Zhang, L.; Guo, Y.; Chi, W.; Shi, H.; Ren, H.; Guo, T. Electrospun Nanofibers Containing P-Nitrophenol Imprinted Nanoparticles for the Hydrolysis of Paraoxon. Chinese Journal of Polymer Science 2014, 32, 1469–1478. [CrossRef]
- Yoshimatsu, K.; Ye, L.; Lindberg, J.; Chronakis, I.S. Selective Molecular Adsorption Using Electrospun Nanofiber Affinity Membranes. Biosens Bioelectron 2008, 23, 1208–1215. [CrossRef]
- Yoshimatsu, K.; Ye, L.; Stenlund, P.; Chronakis, I.S. A Simple Method for Preparation of Molecularly Imprinted Nanofiber Materials with Signal Transduction Ability. Chemical Communications 2008, 2022. [CrossRef]
- Piperno, S.; Tse Sum Bui, B.; Haupt, K.; Gheber, L.A. Immobilization of Molecularly Imprinted Polymer Nanoparticles in Electrospun Poly(Vinyl Alcohol) Nanofibers. Langmuir 2011, 27, 1547–1550. [CrossRef]
- Molinari, F.N.; De Cesare, F.; Macagnano, A. Housing Molecularly Imprinted Polymer Nanoparticles in Polyvinylpyrrolidone/Multiwall Carbon Nanotube Nanofibers to Detect Chiral Terpene Vapors. In Proceedings of the Eurosensors 2023; MDPI: Basel Switzerland, March 26 2024; p. 96. [CrossRef]
- Macagnano, A.; Molinari, F.N.; Papa, P.; Mancini, T.; Lupi, S.; D’Arco, A.; Taddei, A.R.; Serrecchia, S.; De Cesare, F. Nanofibrous Conductive Sensor for Limonene: One-Step Synthesis via Electrospinning and Molecular Imprinting. Nanomaterials 2024, 14, 1123. [CrossRef]
- Pratama, K.F.; Manik, M.E.R.; Rahayu, D.; Hasanah, A.N. Effect of the Molecularly Imprinted Polymer Component Ratio on Analytical Performance. Chem Pharm Bull (Tokyo) 2020, 68, 1013–1024. [CrossRef]
- Molinari, F.; Medrano, A. V.; Bacigalupe, A.; Escobar, M.M.; Monsalve, L.N. Different Dispersion States of MWCNT in Aligned Conductive Electrospun PCL/MWCNT Composites. Fullerenes, Nanotubes and Carbon Nanostructures 2018, 26, 667–674. [CrossRef]
- Ricca, M.; Foderà, V.; Giacomazza, D.; Leone, M.; Spadaro, G.; Dispenza, C. Probing the Internal Environment of PVP Networks Generated by Irradiation with Different Sources. Colloid Polym Sci 2010, 288, 969–980. [CrossRef]
- Biran, I.; Houben, L.; Kossoy, A.; Rybtchinski, B. Transmission Electron Microscopy Methodology to Analyze Polymer Structure with Submolecular Resolution. The Journal of Physical Chemistry C 2024, 128, 5988–5995. [CrossRef]
- Martin, H.J.; White, B.T.; Wang, H.; Mays, J.; Saito, T.; Dadmun, M.D. Effect of Solvent Quality and Monomer Water Solubility on Soft Nanoparticle Morphology. In; 2018; pp. 117–137. [CrossRef]
- Mueller, A. A Note about Crosslinking Density in Imprinting Polymerization. Molecules 2021, 26, 5139. [CrossRef]
- Golker, K.; Nicholls, I.A. The Effect of Crosslinking Density on Molecularly Imprinted Polymer Morphology and Recognition. Eur Polym J 2016, 75, 423–430. [CrossRef]
- Patel, B.; Pearson, R.; Watanabe, M. Bright Field and Dark Field STEM-IN-SEM Imaging of Polymer Systems. J Appl Polym Sci 2014, 131. [CrossRef]
- Raymo, F. Nanomaterials Synthesis and Applications: Molecule-Based Devices. In Springer Handbook of Nanotechnology; Springer Berlin Heidelberg: Berlin, Heidelberg, 2007; pp. 13–42. [CrossRef]
- Salalha, W.; Dror, Y.; Khalfin, R.L.; Cohen, Y.; Yarin, A.L.; Zussman, E. Single-Walled Carbon Nanotubes Embedded in Oriented Polymeric Nanofibers by Electrospinning. Langmuir 2004, 20, 9852–9855. [CrossRef]
- Dror, Y.; Salalha, W.; Khalfin, R.L.; Cohen, Y.; Yarin, A.L.; Zussman, E. Carbon Nanotubes Embedded in Oriented Polymer Nanofibers by Electrospinning. Langmuir 2003, 19, 7012–7020. [CrossRef]
- Sarabia-Riquelme, R.; Craddock, J.; Morris, E.A.; Eaton, D.; Andrews, R.; Anthony, J.; Weisenberger, M.C. Simple, Low-Cost, Water-Processable n -Type Thermoelectric Composite Films from Multiwall Carbon Nanotubes in Polyvinylpyrrolidone. Synth Met 2017, 225, 86–92. [CrossRef]
- Macagnano, A.; Molinari, F.N.; Mancini, T.; Lupi, S.; De Cesare, F. UV Light Stereoselective Limonene Sensor Using Electrospun PVP Composite Nanofibers. In Proceedings of the Eurosensors 2023; MDPI: Basel Switzerland, April 1 2024; p. 131. [CrossRef]
- Habboush, S.; Rojas, S.; Rodríguez, N.; Rivadeneyra, A. The Role of Interdigitated Electrodes in Printed and Flexible Electronics. Sensors 2024, 24, 2717. [CrossRef]
- Sarabia-Riquelme, R.; Craddock, J.; Morris, E.A.; Eaton, D.; Andrews, R.; Anthony, J.; Weisenberger, M.C. Simple, Low-Cost, Water-Processable n -Type Thermoelectric Composite Films from Multiwall Carbon Nanotubes in Polyvinylpyrrolidone. Synth Met 2017, 225, 86–92. [CrossRef]
- Li, J.; Ma, P.C.; Chow, W.S.; To, C.K.; Tang, B.Z.; Kim, J. -K. Correlations between Percolation Threshold, Dispersion State, and Aspect Ratio of Carbon Nanotubes. Adv Funct Mater 2007, 17, 3207–3215. [CrossRef]
- Behnam, A.; Guo, J.; Ural, A. Effects of Nanotube Alignment and Measurement Direction on Percolation Resistivity in Single-Walled Carbon Nanotube Films. J Appl Phys 2007, 102. [CrossRef]
- Bauhofer, W.; Kovacs, J.Z. A Review and Analysis of Electrical Percolation in Carbon Nanotube Polymer Composites. Compos Sci Technol 2009, 69, 1486–1498. [CrossRef]
- Kovacs, J.Z.; Velagala, B.S.; Schulte, K.; Bauhofer, W. Two Percolation Thresholds in Carbon Nanotube Epoxy Composites. Compos Sci Technol 2007, 67, 922–928. [CrossRef]
- Penu, C.; Hu, G.; Fernandez, A.; Marchal, P.; Choplin, L. Rheological and Electrical Percolation Thresholds of Carbon Nanotube/Polymer Nanocomposites. Polym Eng Sci 2012, 52, 2173–2181. [CrossRef]
- Poulin, P.; Vigolo, B.; Launois, P. Films and Fibers of Oriented Single Wall Nanotubes. Carbon N Y 2002, 40, 1741–1749. [CrossRef]
- Serban, B.-C.; Cobianu, C.; Dumbravescu, N.; Buiu, O.; Bumbac, M.; Nicolescu, C.M.; Cobianu, C.; Brezeanu, M.; Pachiu, C.; Serbanescu, M. Electrical Percolation Threshold and Size Effects in Polyvinylpyrrolidone-Oxidized Single-Wall Carbon Nanohorn Nanocomposite: The Impact for Relative Humidity Resistive Sensors Design. Sensors 2021, 21, 1435. [CrossRef]
- Khan, W.S.; Asmatulu, R.; Eltabey, M.M. Electrical and Thermal Characterization of Electrospun PVP Nanocomposite Fibers. J Nanomater 2013, 2013, 1–9. [CrossRef]
- Swenson, H.; Stadie, N.P. Langmuir’s Theory of Adsorption: A Centennial Review. Langmuir 2019, 35, 5409–5426. [CrossRef]
- Shanmgam, G.; Mathew, V.; Selvaraj, B.; Thanikachalam, P.M.; Kim, J.; Pichai, M.; Natarajan, A.; Almansour, A.I. Influence of Limonene from Orange Peel in Poly (Ethylene Oxide) PEO/I − /I 3 − Based Nanocrystalline Dye-Sensitized Solar Cell. ChemistrySelect 2022, 7. [CrossRef]
- Kandhasamy, M.; Shanmugam, G.; Kamaraj, S.; Selvaraj, B.; Gunasekeran, A.; Sambandam, A. Effect of D-Limonene Additive in Copper Redox-Based Quasi-Solid-State Electrolytes on the Performance of Dye-Sensitized Solar Cells. Mater Today Commun 2023, 35, 105505. [CrossRef]
- Peveler, W.J.; Yazdani, M.; Rotello, V.M. Selectivity and Specificity: Pros and Cons in Sensing. ACS Sens 2016, 1, 1282–1285. [CrossRef]
- Pan, X.; Xue, Q.; Zhang, J.; Guo, Q.; Jin, Y.; Lu, W.; Li, X.; Ling, C. Effective Enhancement of Humidity Sensing Characteristics of Novel Thermally Treated MWCNTs/Polyvinylpyrrolidone Film Caused by Interfacial Effect. Adv Mater Interfaces 2016, 3. [CrossRef]
- Shinde, D.B.; Vlassiouk, I. V.; Talipov, M.R.; Smirnov, S.N. Exclusively Proton Conductive Membranes Based on Reduced Graphene Oxide Polymer Composites. ACS Nano 2019, 13, 13136–13143. [CrossRef]
Figure 1.
SEM images of the synthesised polymeric nanoparticles. (A) Non-imprinted polymer (NIP) nanoparticles, serving as control particles without specific recognition sites and (B) molecularly imprinted polymer (MIP) nanoparticles (NPs), hosting structured recognition sites templated for S(-)-limonene. C) and D) plots illustrate the respective normalized distributions of NIP and MIP particle diameters calculated from 100 samples.
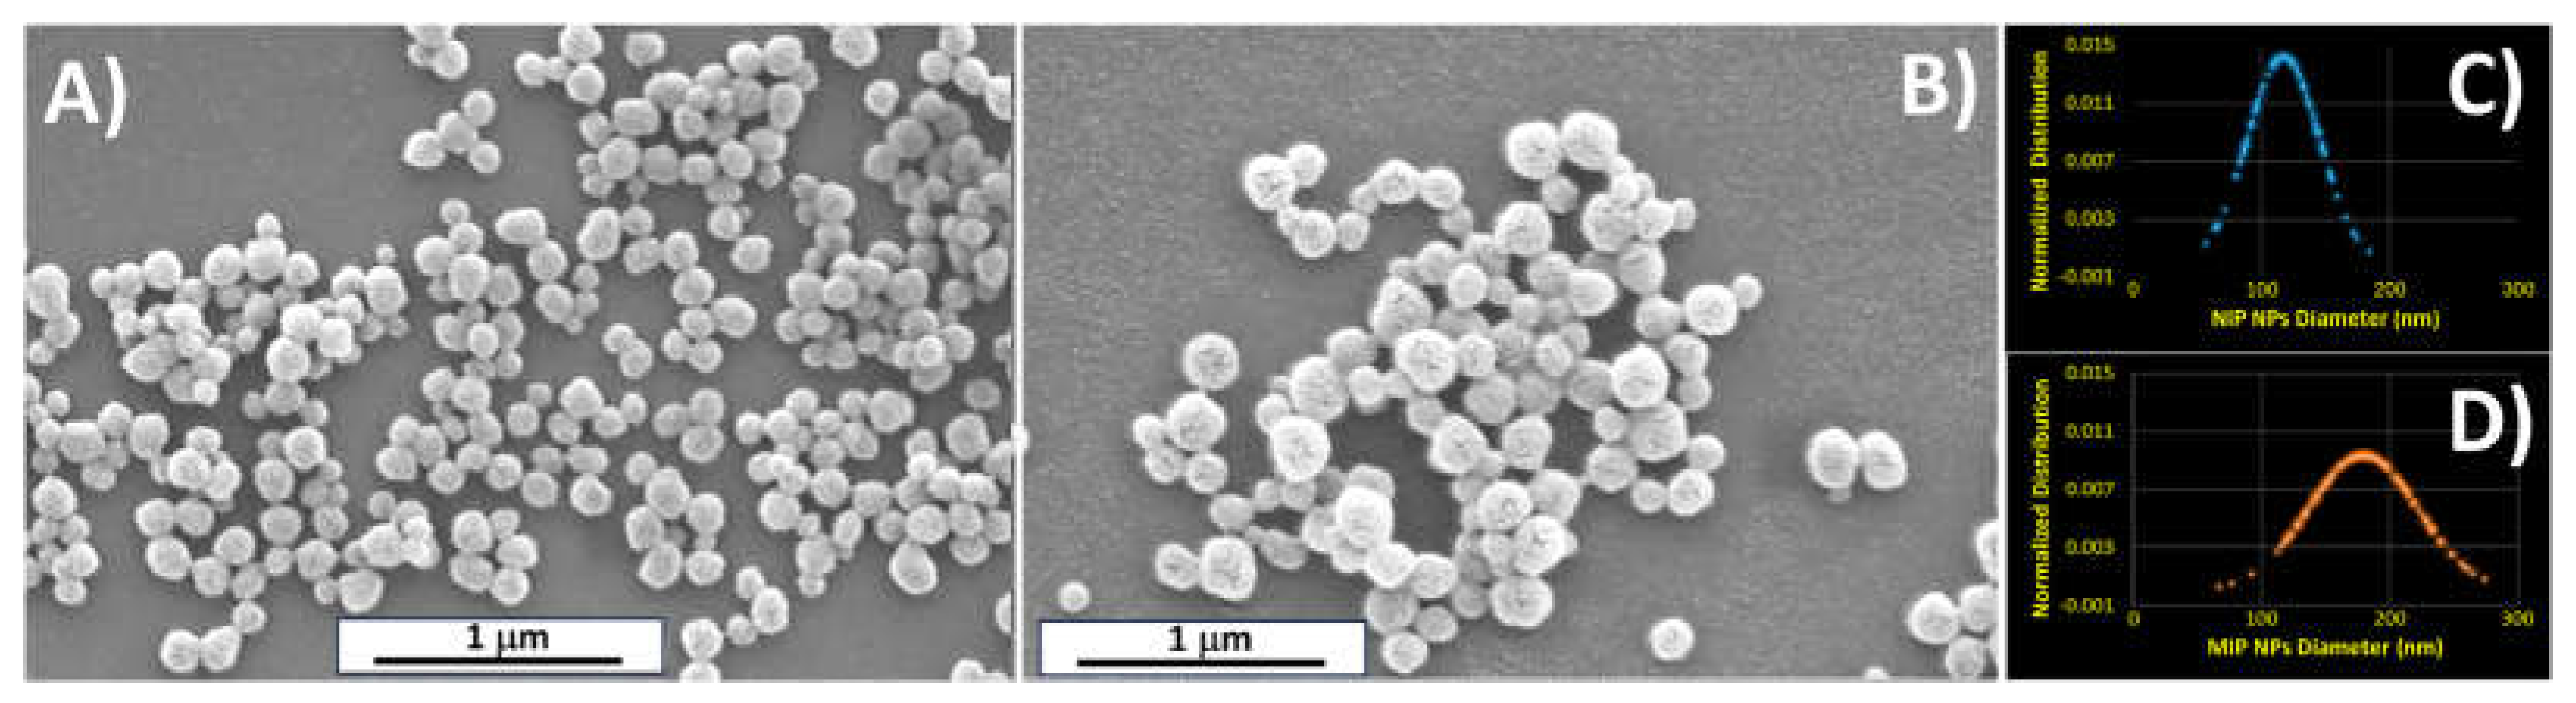
Figure 2.
Transmission electron microscopy (TEM) micrographs showing NIP-NPs drop-cast onto a TEM grid at varying magnifications (A, B) and MIP-NPs (C, D).
Figure 2.
Transmission electron microscopy (TEM) micrographs showing NIP-NPs drop-cast onto a TEM grid at varying magnifications (A, B) and MIP-NPs (C, D).
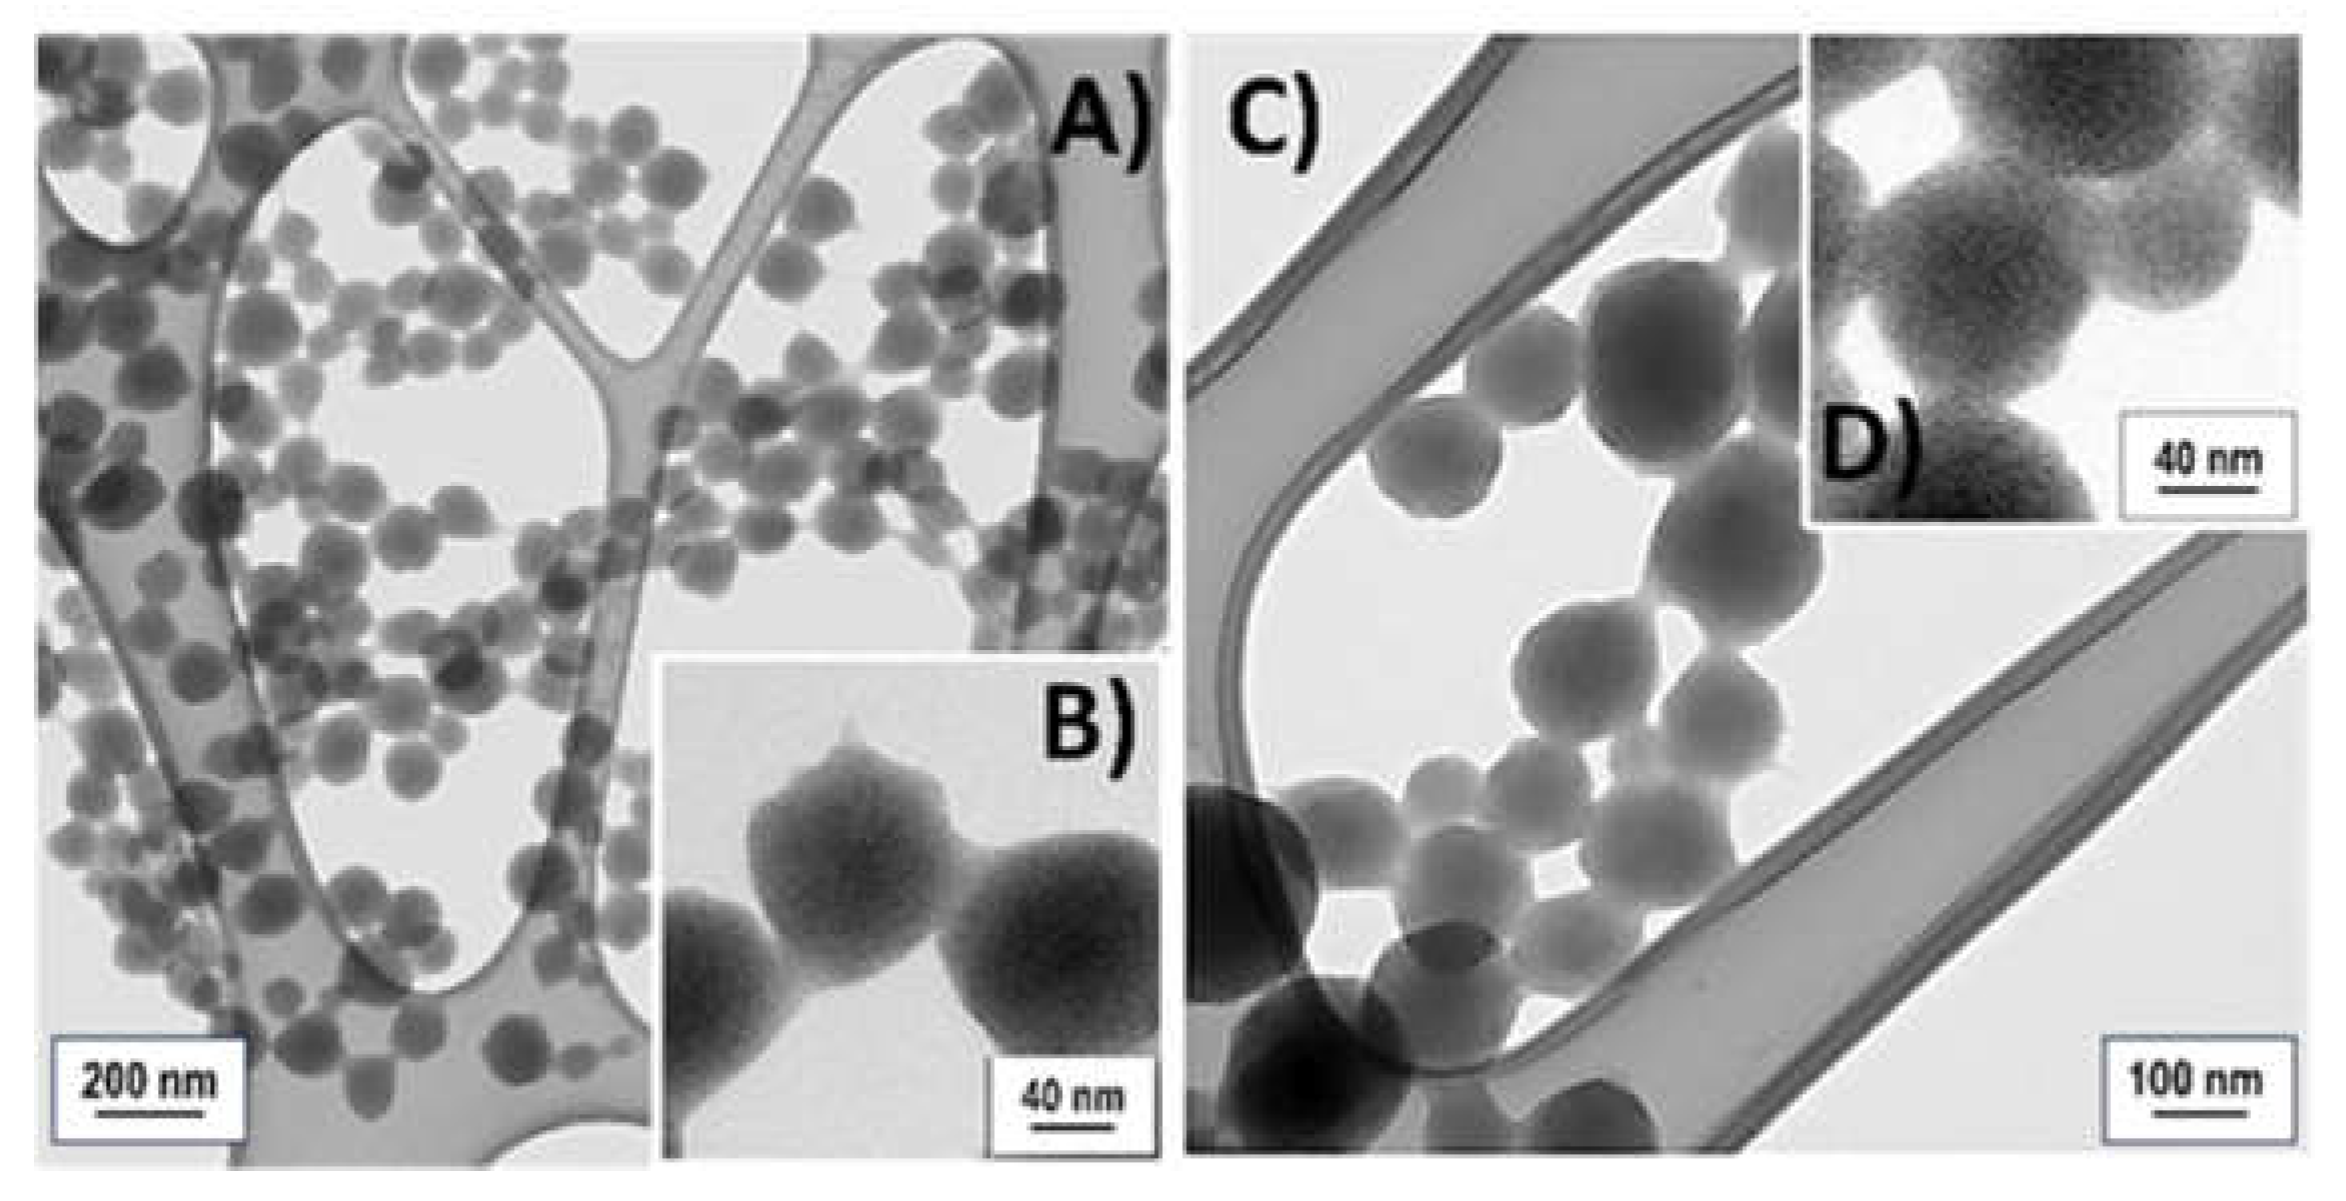
Figure 3.
(A) SEM images of MIP-nanofibers collected on a silicon wafer, displayed at progressively higher magnifications in (B) and (C). Panel (B) highlights a single nanobead structure, while panel (C) showcases the details of the nanofiber architecture. The inset in (B) presents the normalized minor diameter distribution of approximately 50 beads, whereas the inset in (C) illustrates the diameter distribution of one hundred nanofibers.
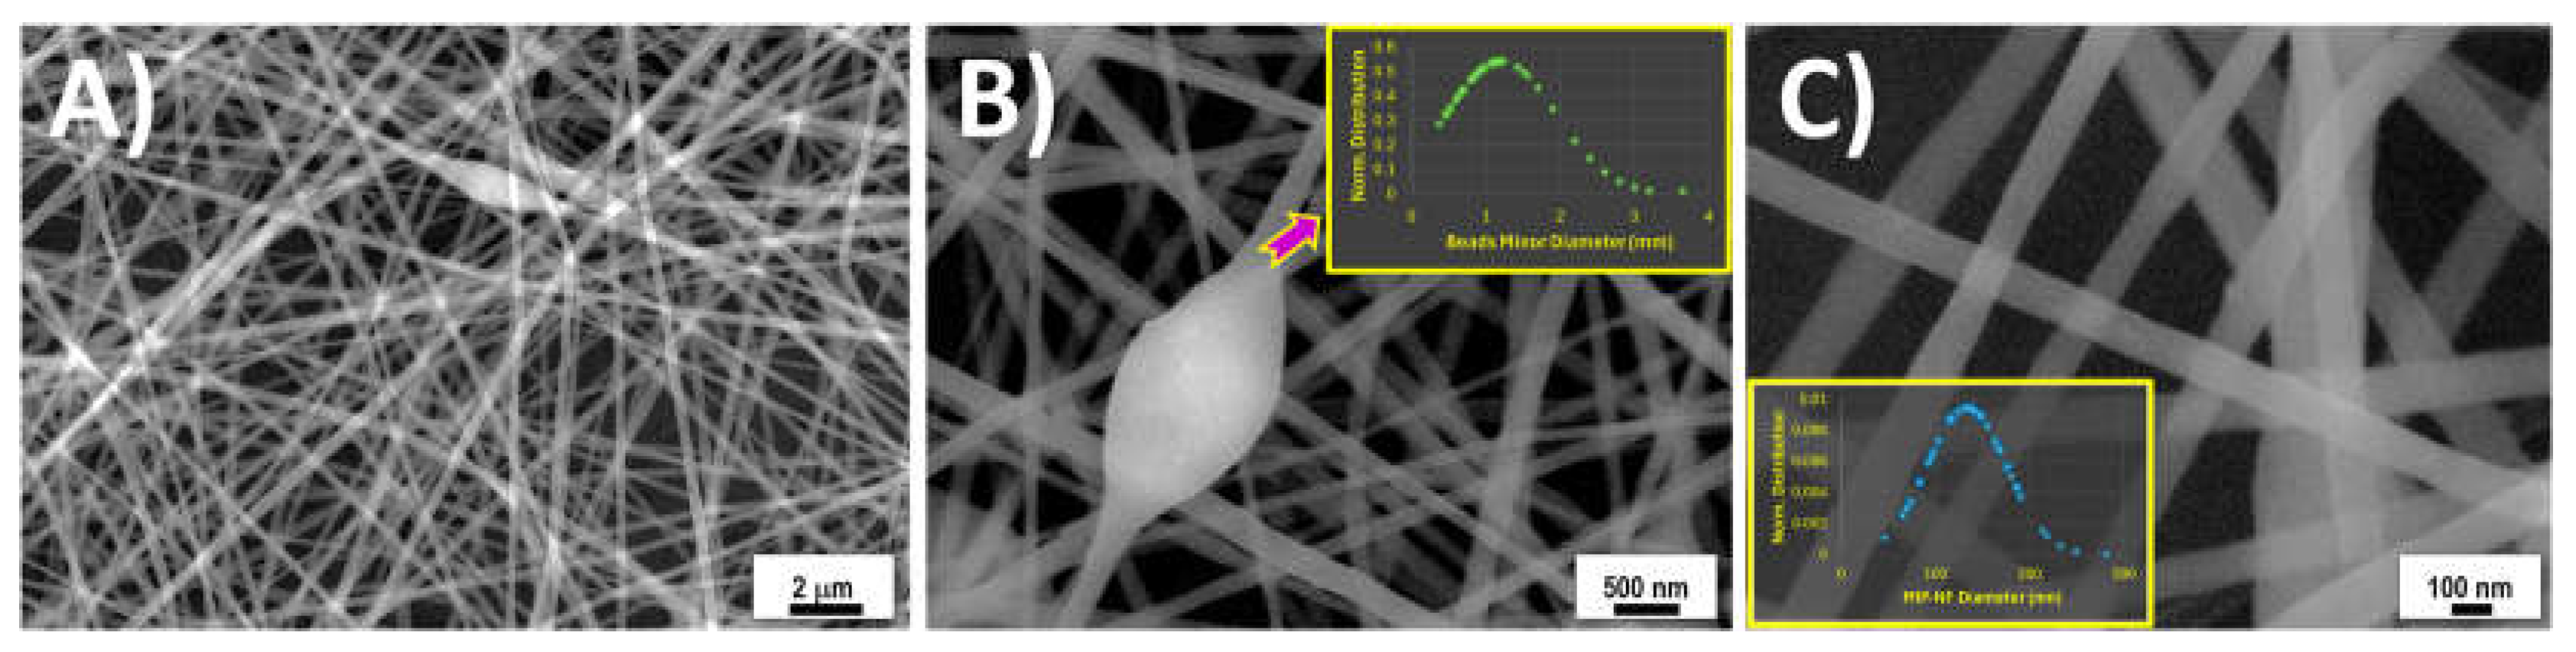
Figure 4.
SEM micrograph of A) the region of interest for the FIB cut and milling, B) the first FIB cut, and C) the final lamella. D) False colour (to highlight the details) of SEM-STEM image in dark mode and E) STEM (by TEM measurement) of the lamella. Yellow arrows indicate the fibres above the bead and their location in the section.
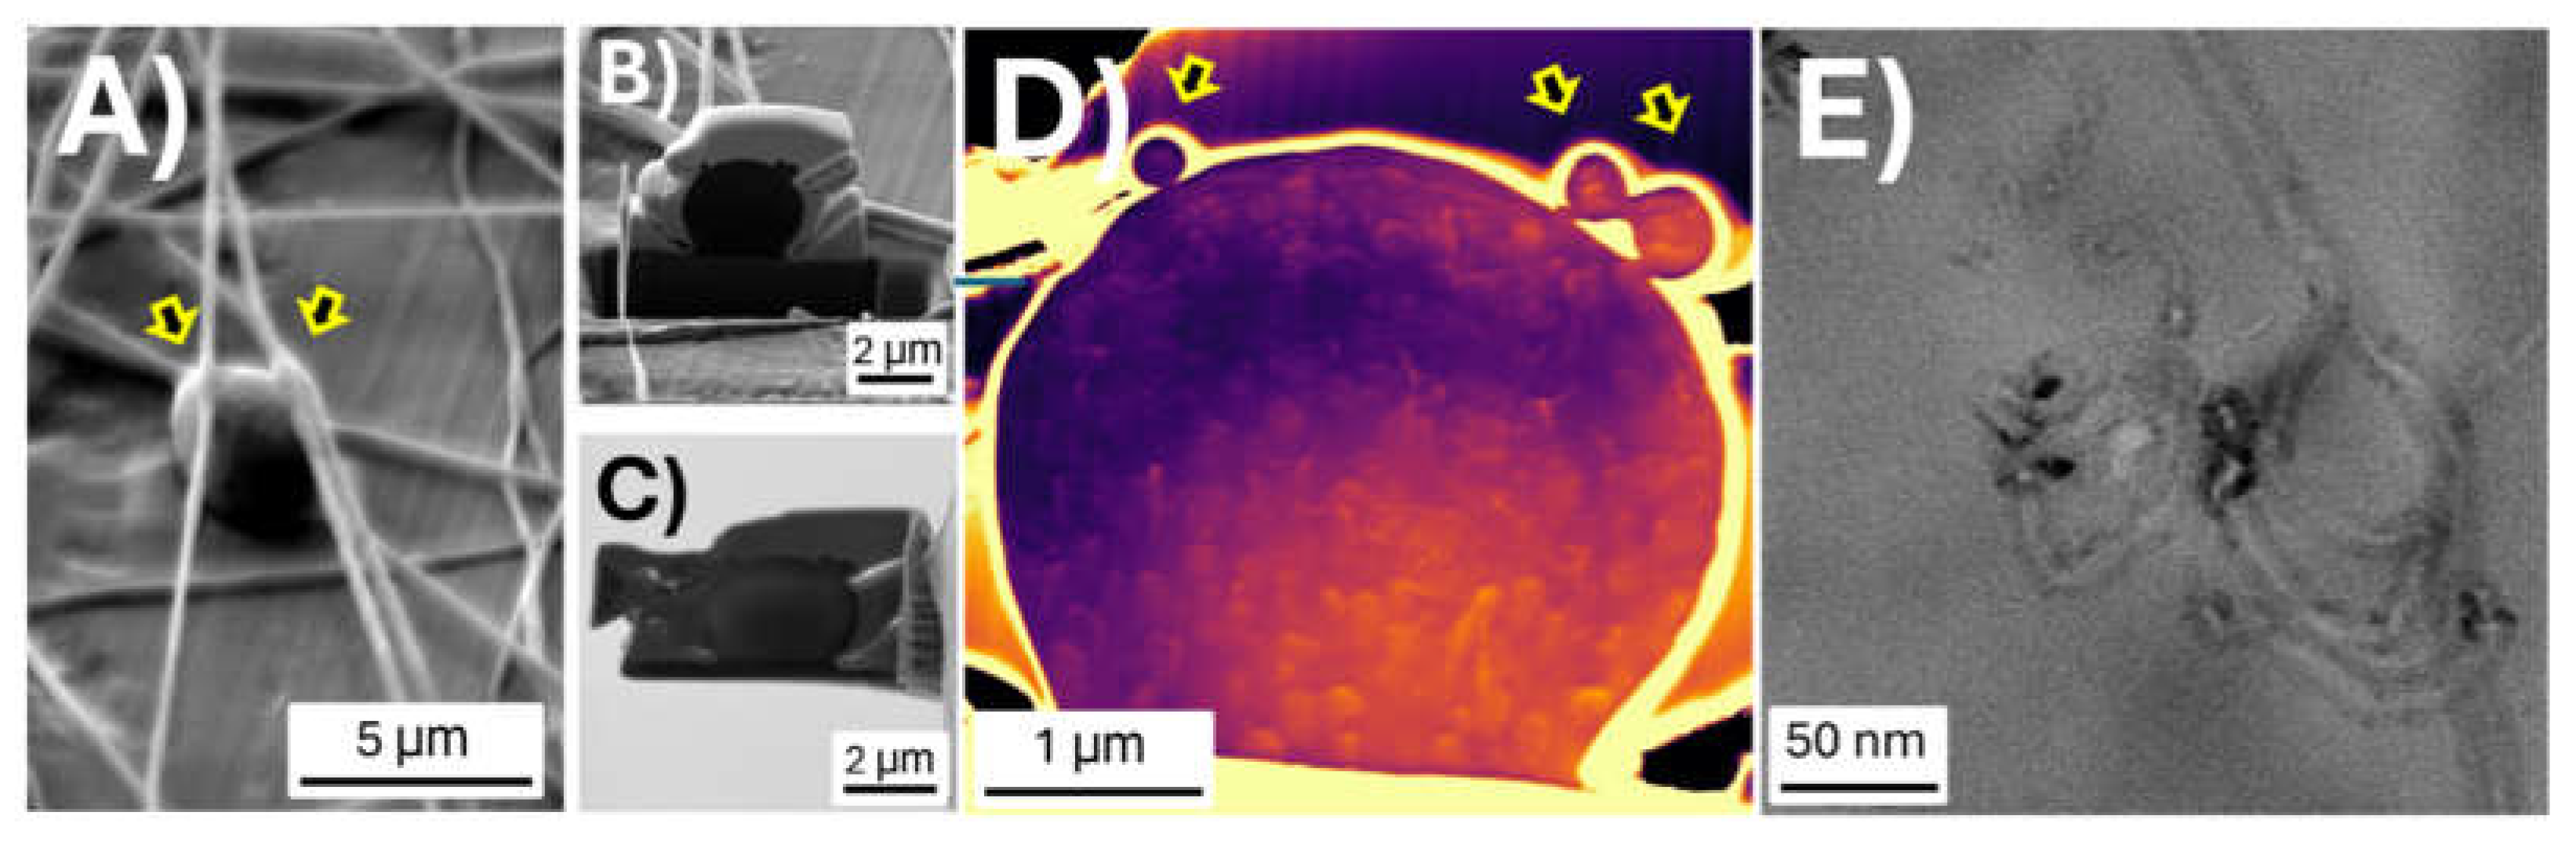
Figure 5.
AFM micrographs of PVP-MWCNT-MIP-NP nanofibers (A) with a higher magnification view (B). TEM micrographs of the nanofibers with different MWCNT distributions along nanofibers, including spiral configurations (C), more aligned structures (D) and spring-like arrangements around polymer (E).
Figure 5.
AFM micrographs of PVP-MWCNT-MIP-NP nanofibers (A) with a higher magnification view (B). TEM micrographs of the nanofibers with different MWCNT distributions along nanofibers, including spiral configurations (C), more aligned structures (D) and spring-like arrangements around polymer (E).
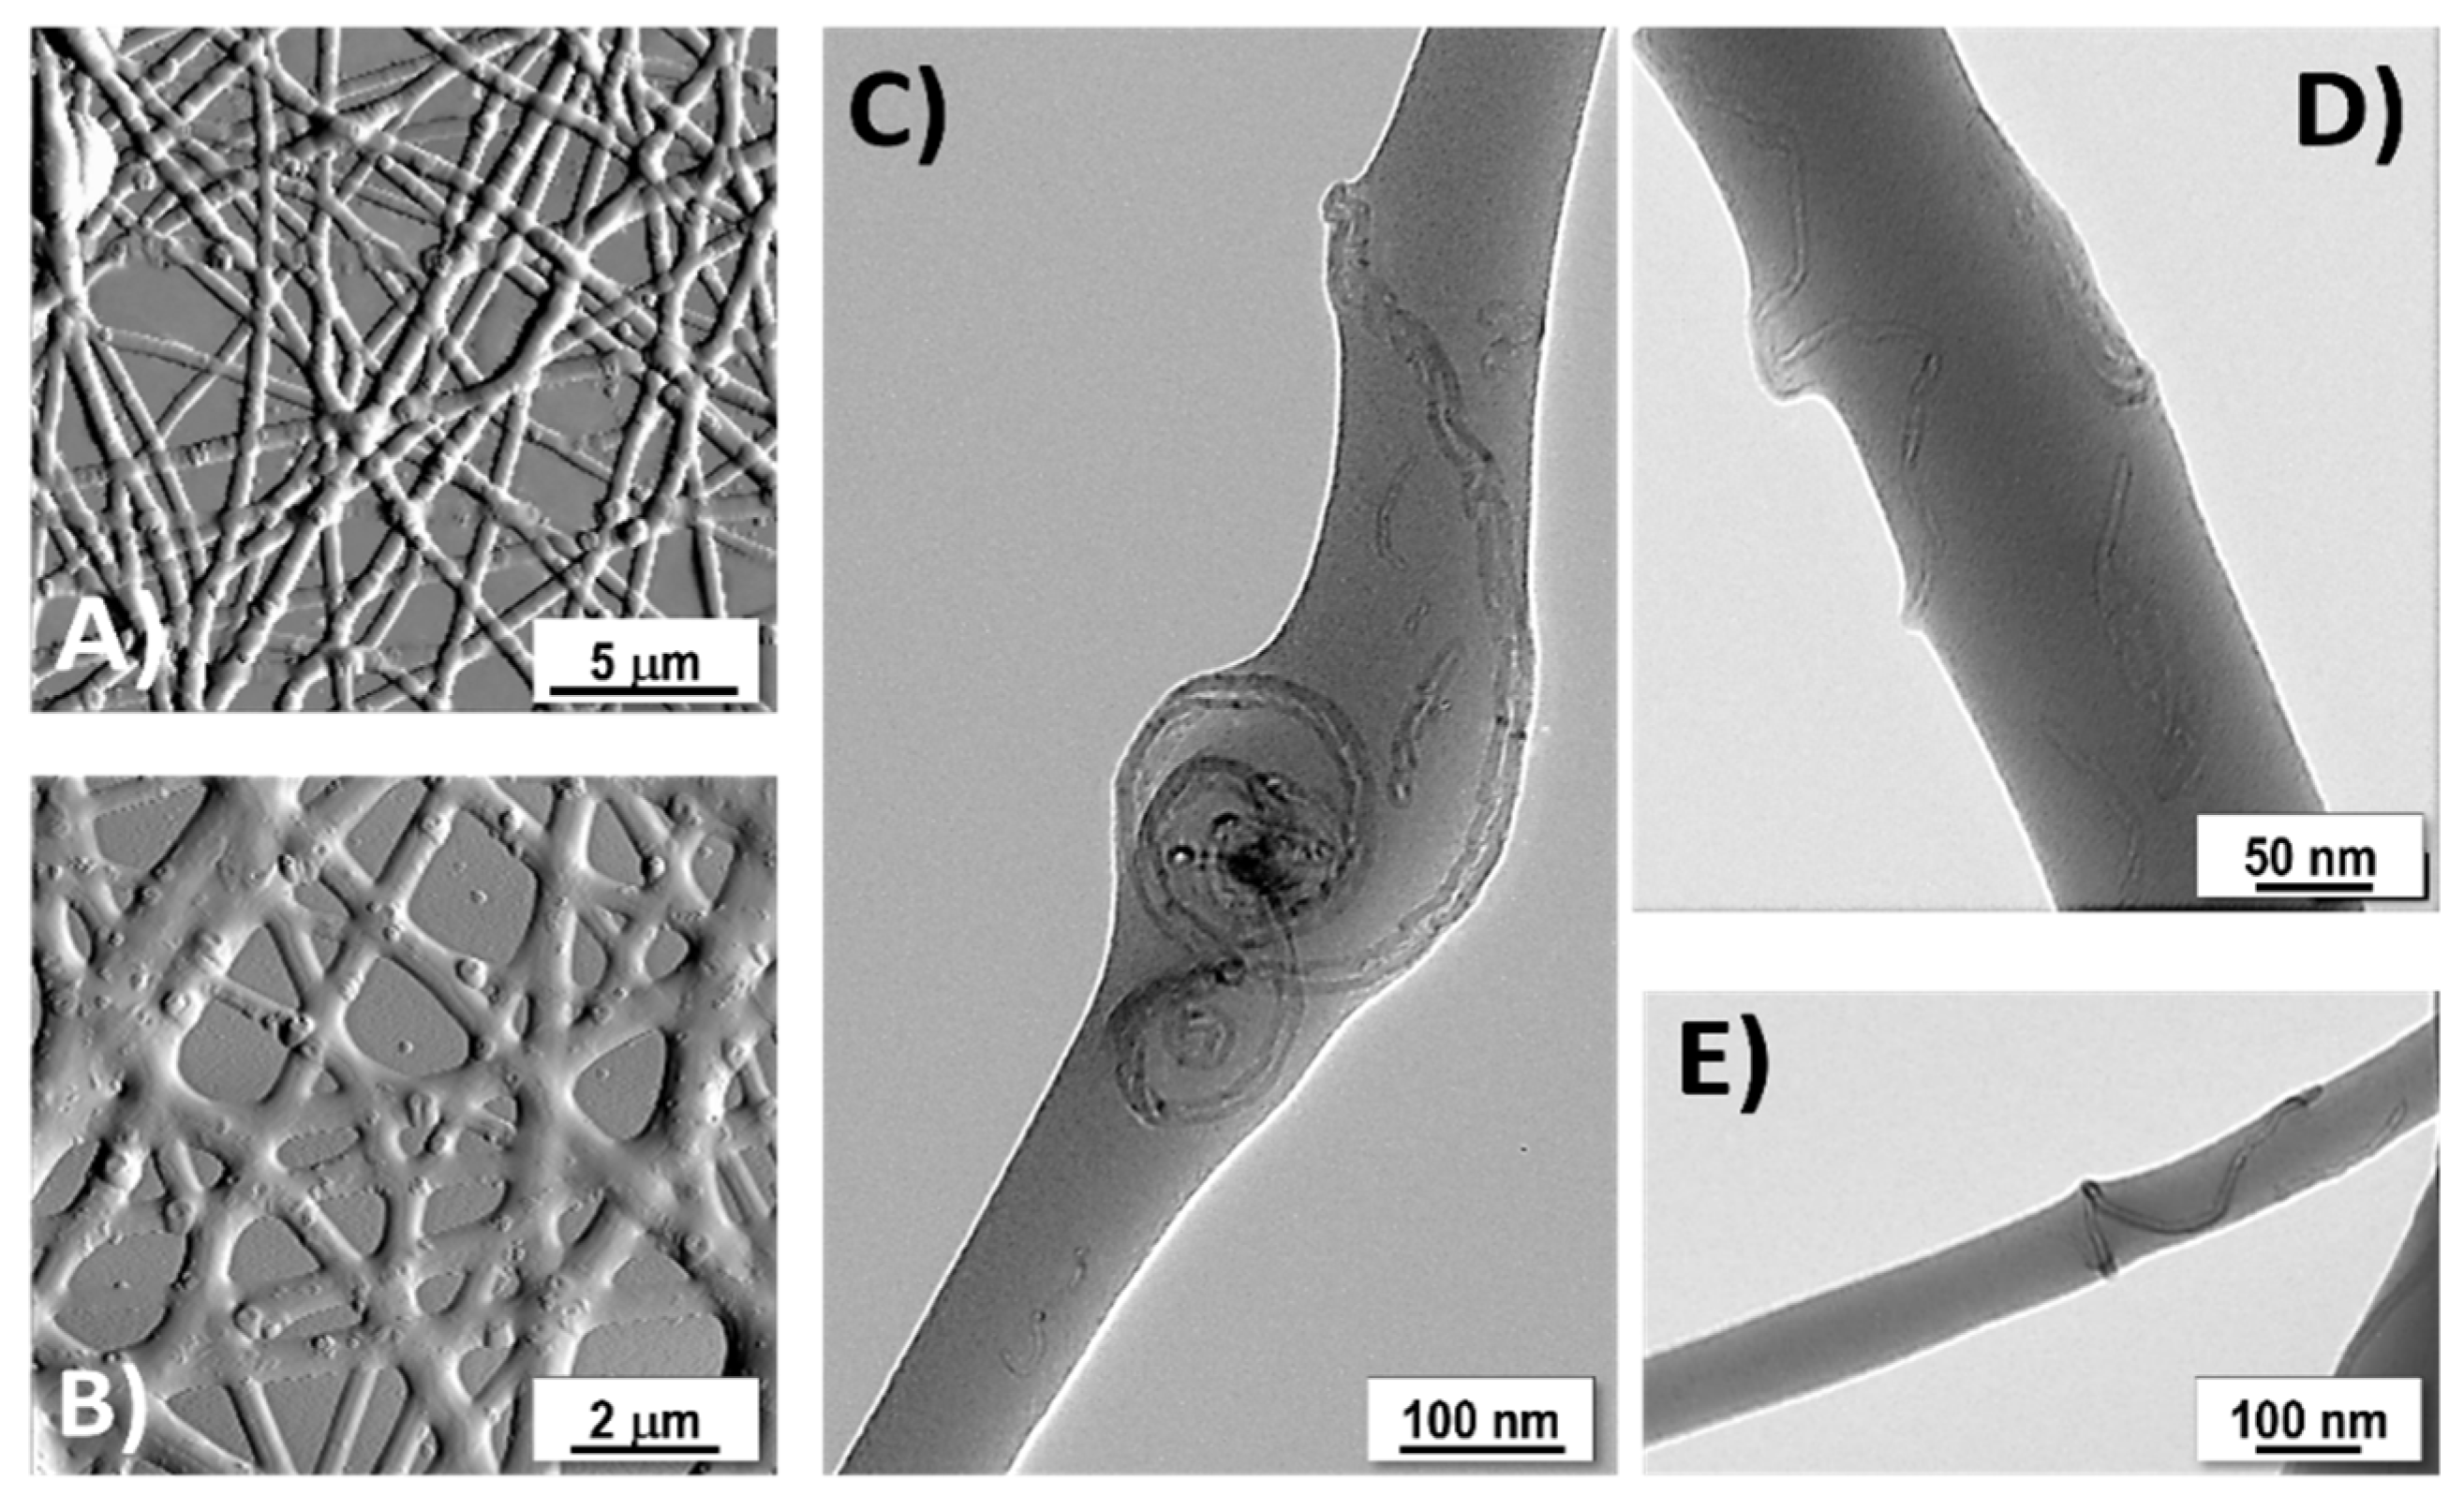
Figure 6.
(A) The experimental setup used in this study includes an air cylinder and a mass flow controller with three channels for precise delivery of dry air, humidified air, and template VOCs at specified ratios into a mixing chamber equipped with temperature and humidity sensors, from which the mixture is directed into a mixing- and then measuring-chamber housing the S(-)-limonene chemosensors. (B) Current-Voltage (I-V) curves for MIP-NF-based (MIP) and NIP-NF-based (NIP) sensors.
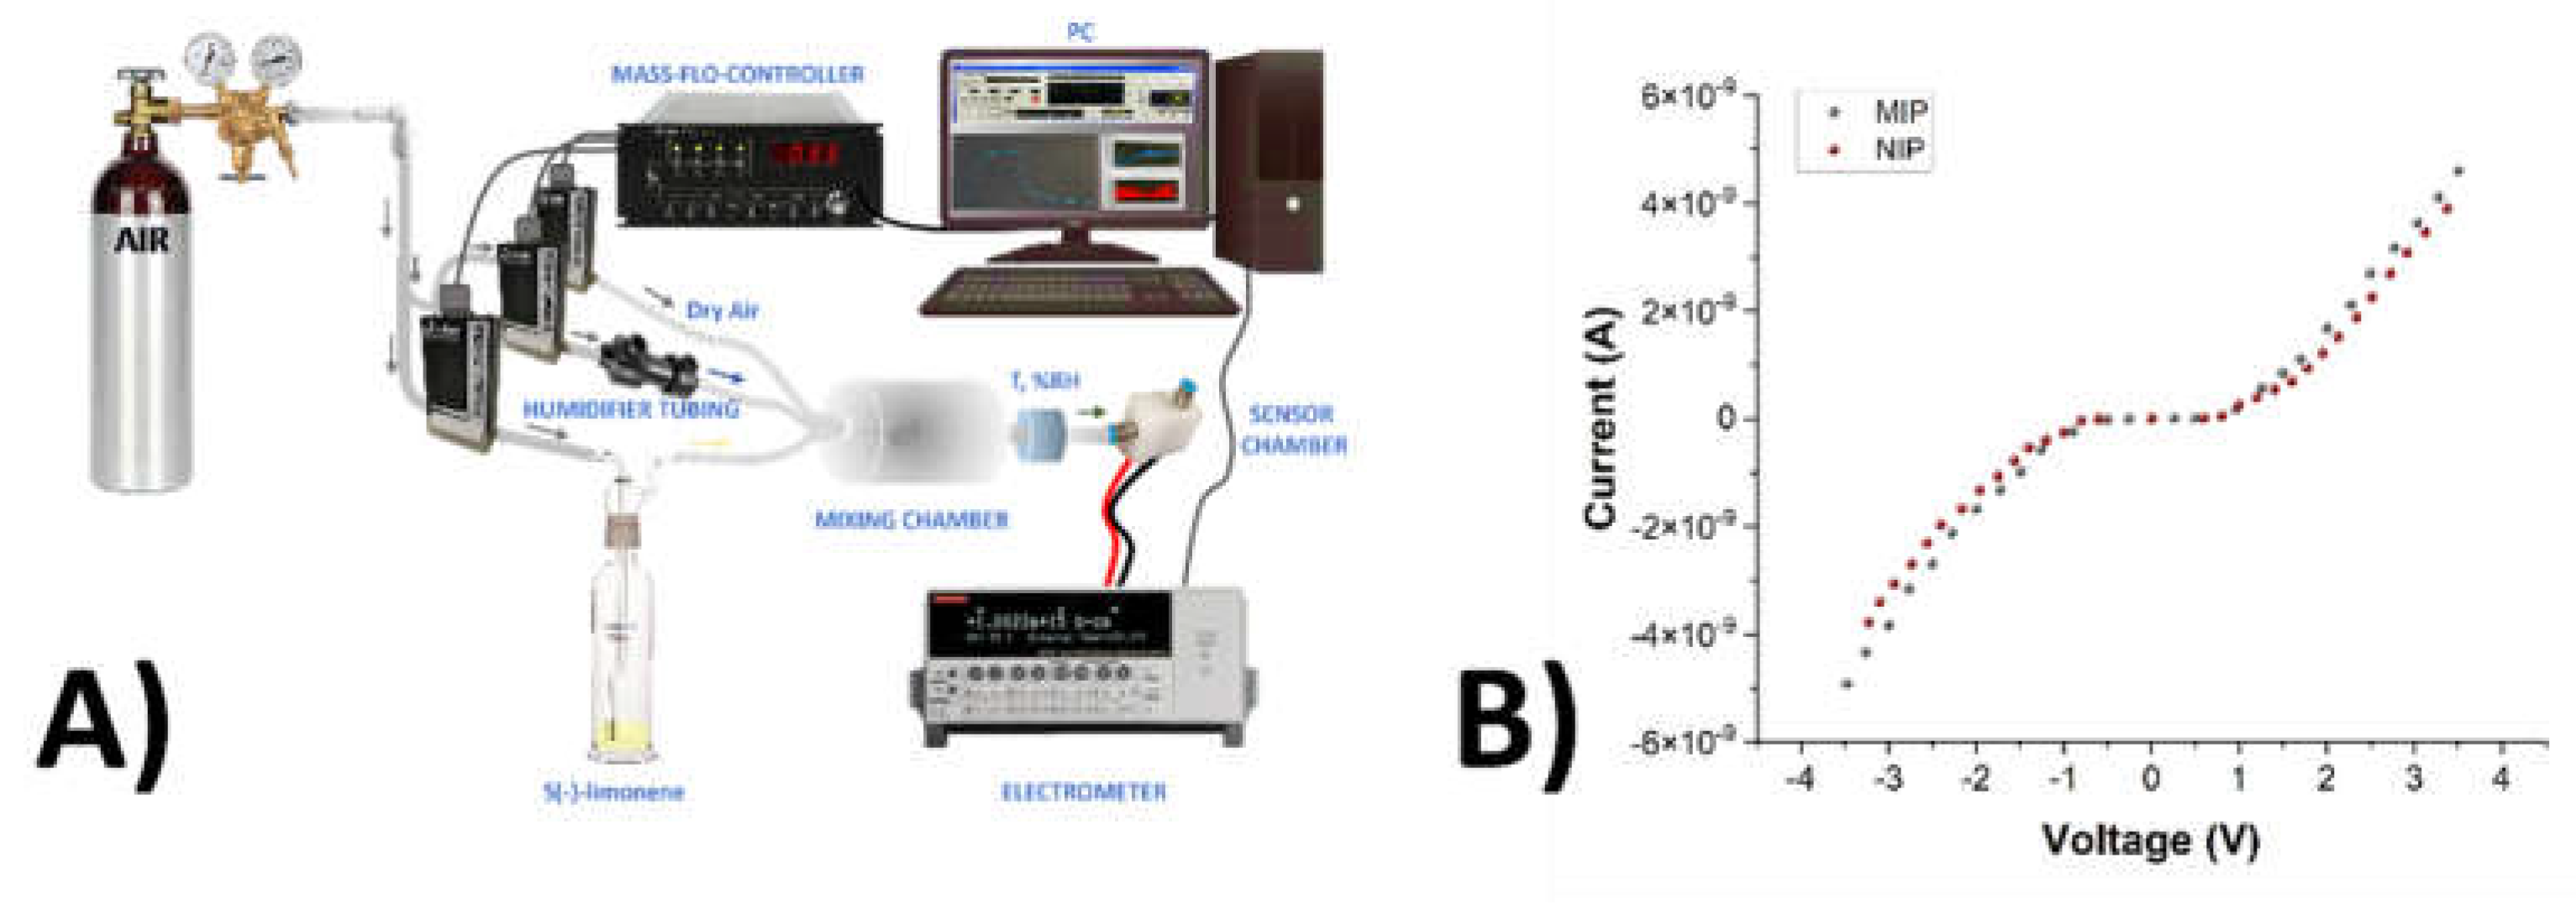
Figure 7.
Transient responses of MIP-NF sensor to increasing concentrations of S-Lim vapours (ranging between 30-60 ppm) (A). Sensor response curve to S(-)limonene from 10 to 100 ppm. All data were provided at 55% of relative humidity (B).
Figure 7.
Transient responses of MIP-NF sensor to increasing concentrations of S-Lim vapours (ranging between 30-60 ppm) (A). Sensor response curve to S(-)limonene from 10 to 100 ppm. All data were provided at 55% of relative humidity (B).
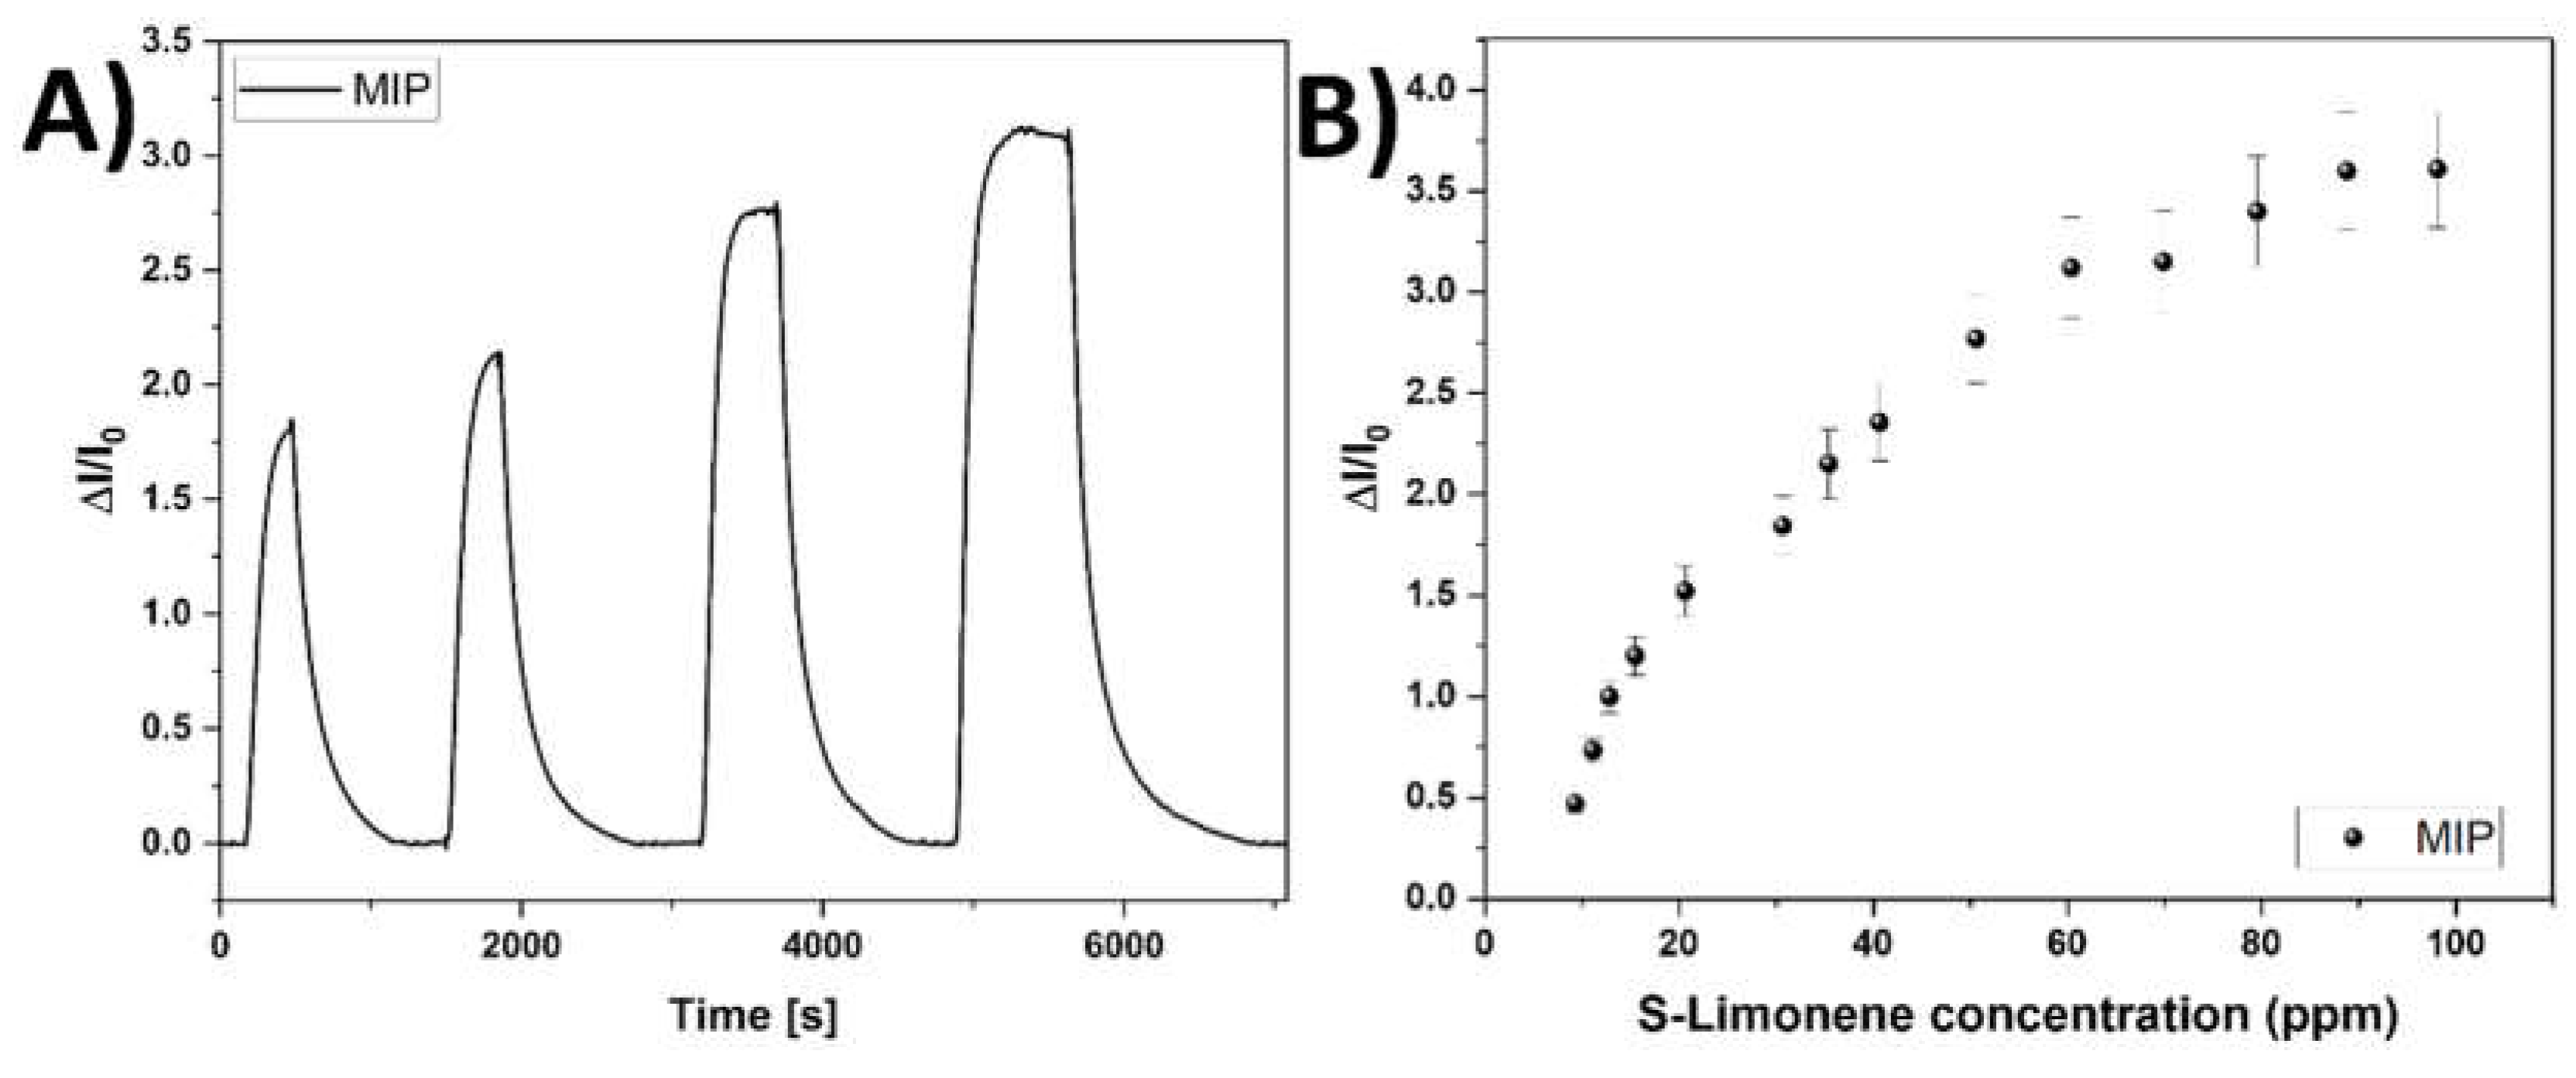
Figure 8.
(A) Bar- (A) plot of the MIP-NF sensor response during exposure to 15 ppm of S(-)-limonene, linalool and alpha-pinene, and (B) pie-plot depicting the related sensor selectivity index. (C) Bar-plot depicting the comparison between MIP-NF and NIP-NF based sensors during the exposure to 15 ppm of S (-) limonene.
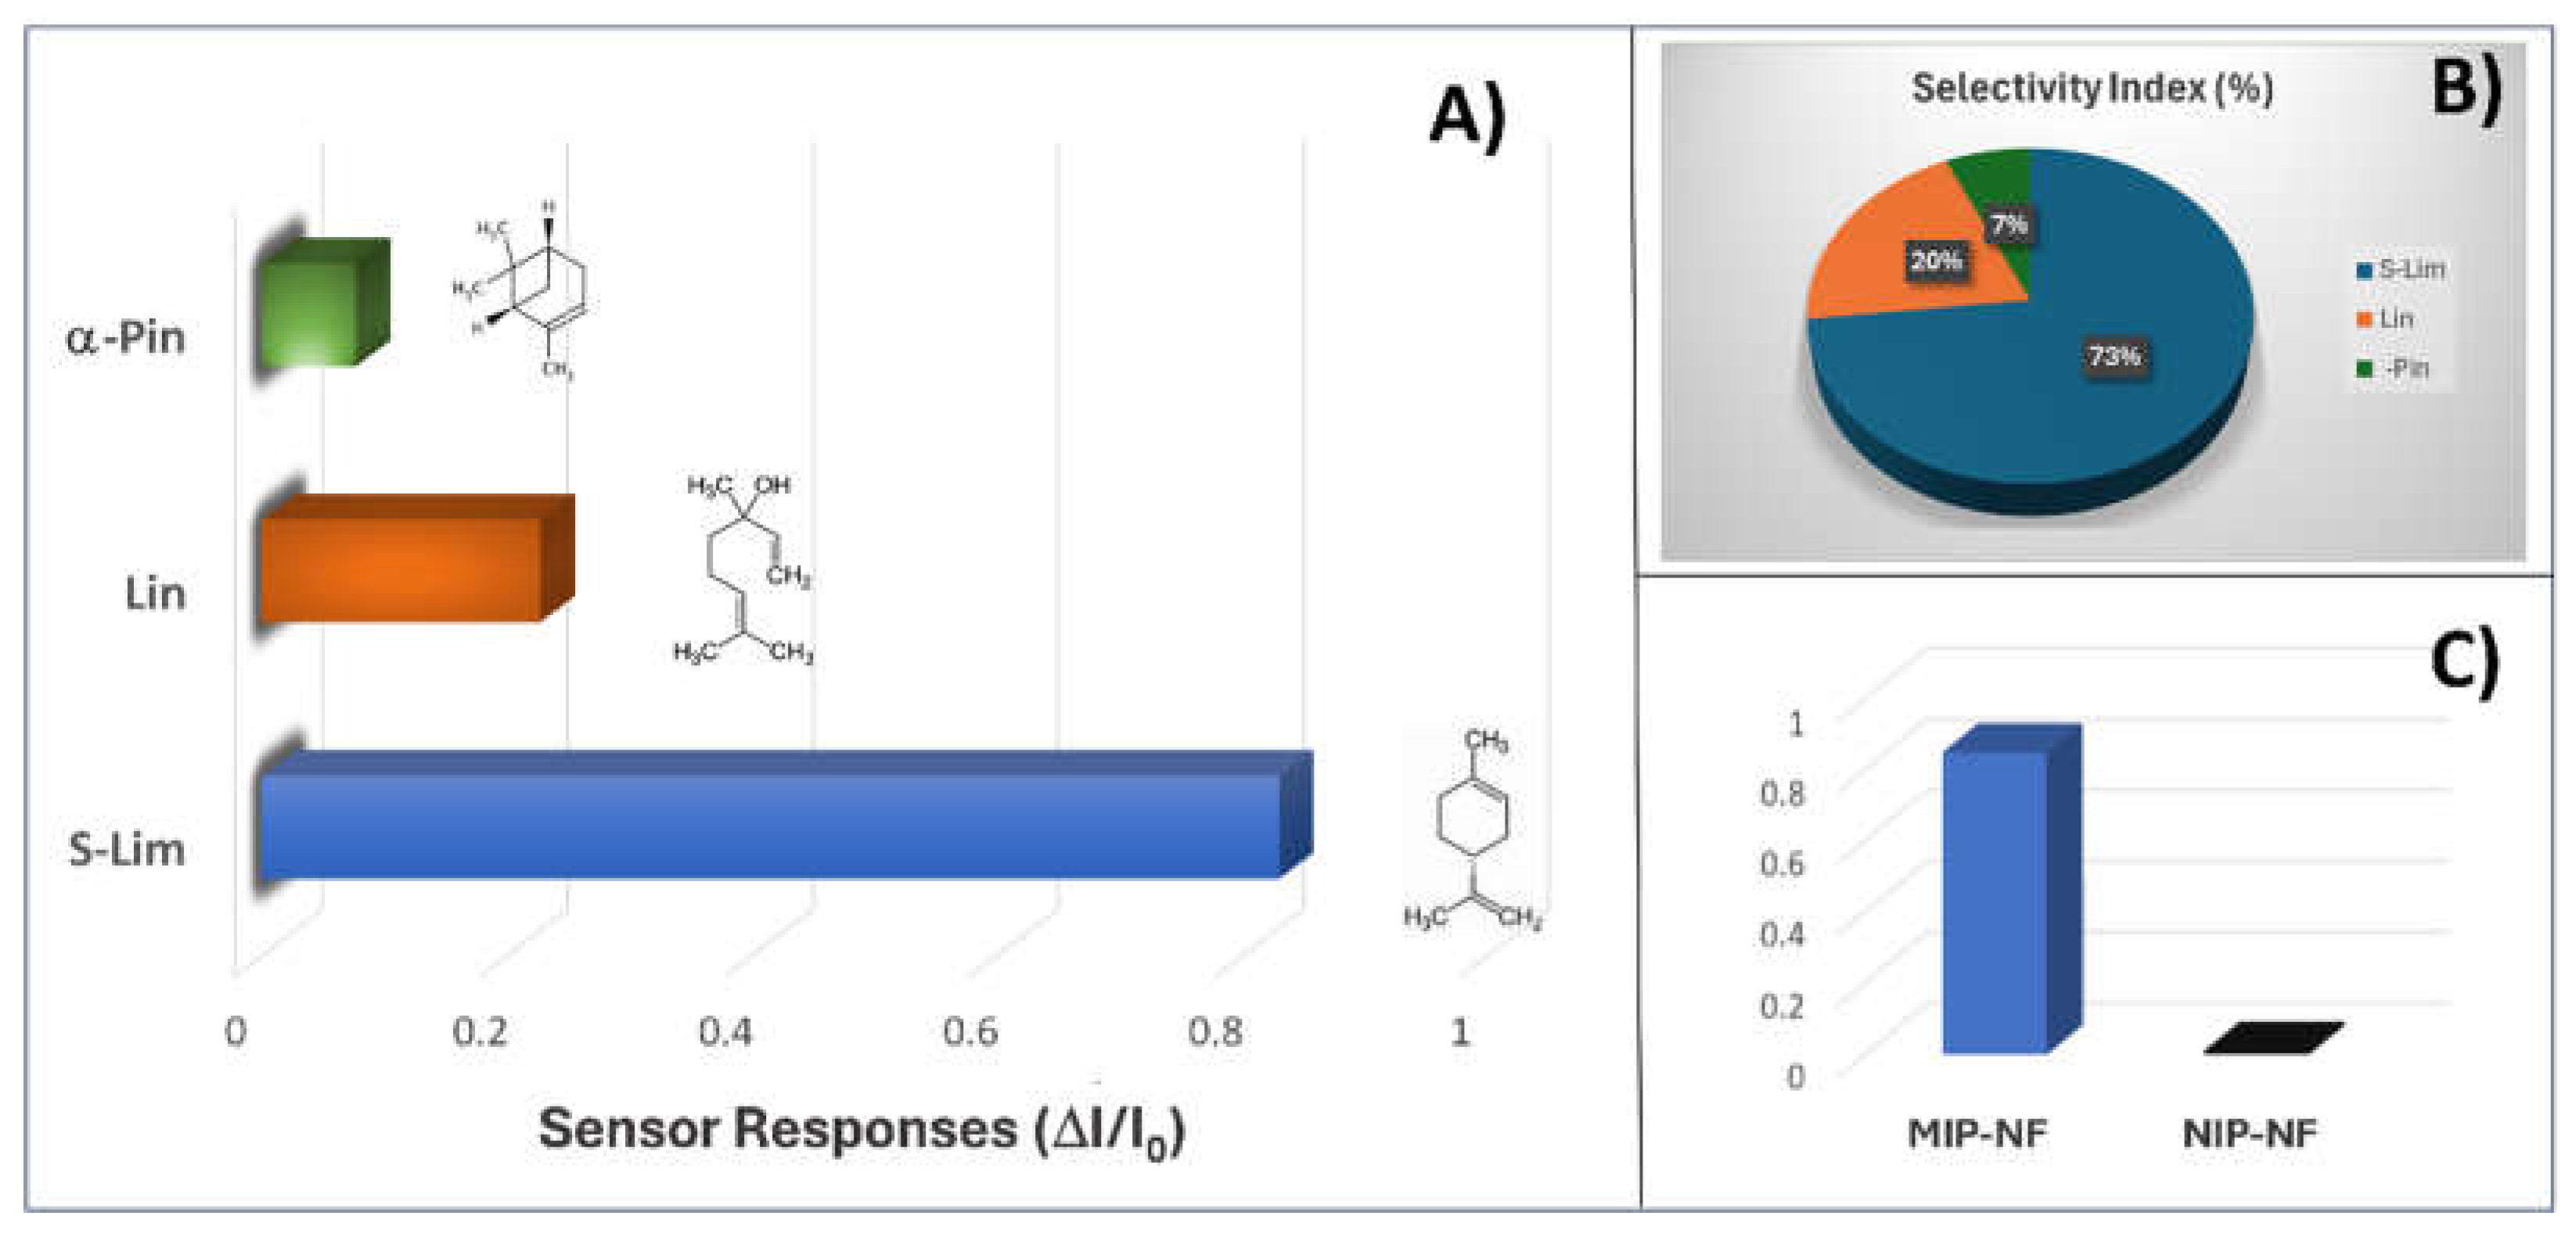
Figure 9.
(A) Eight cycles of MIP-NF sensor transient measurements to 70 ppm of S(-)-limonene at 55% RH; (B) Bar-plot of sensor responses to defined volume-flow percentages (1.8, 2.4 and 3.6 %) of saturated S-Lim (black bar segment) and H2O vapours (light-blue bar segment), at 55% RH.
Figure 9.
(A) Eight cycles of MIP-NF sensor transient measurements to 70 ppm of S(-)-limonene at 55% RH; (B) Bar-plot of sensor responses to defined volume-flow percentages (1.8, 2.4 and 3.6 %) of saturated S-Lim (black bar segment) and H2O vapours (light-blue bar segment), at 55% RH.
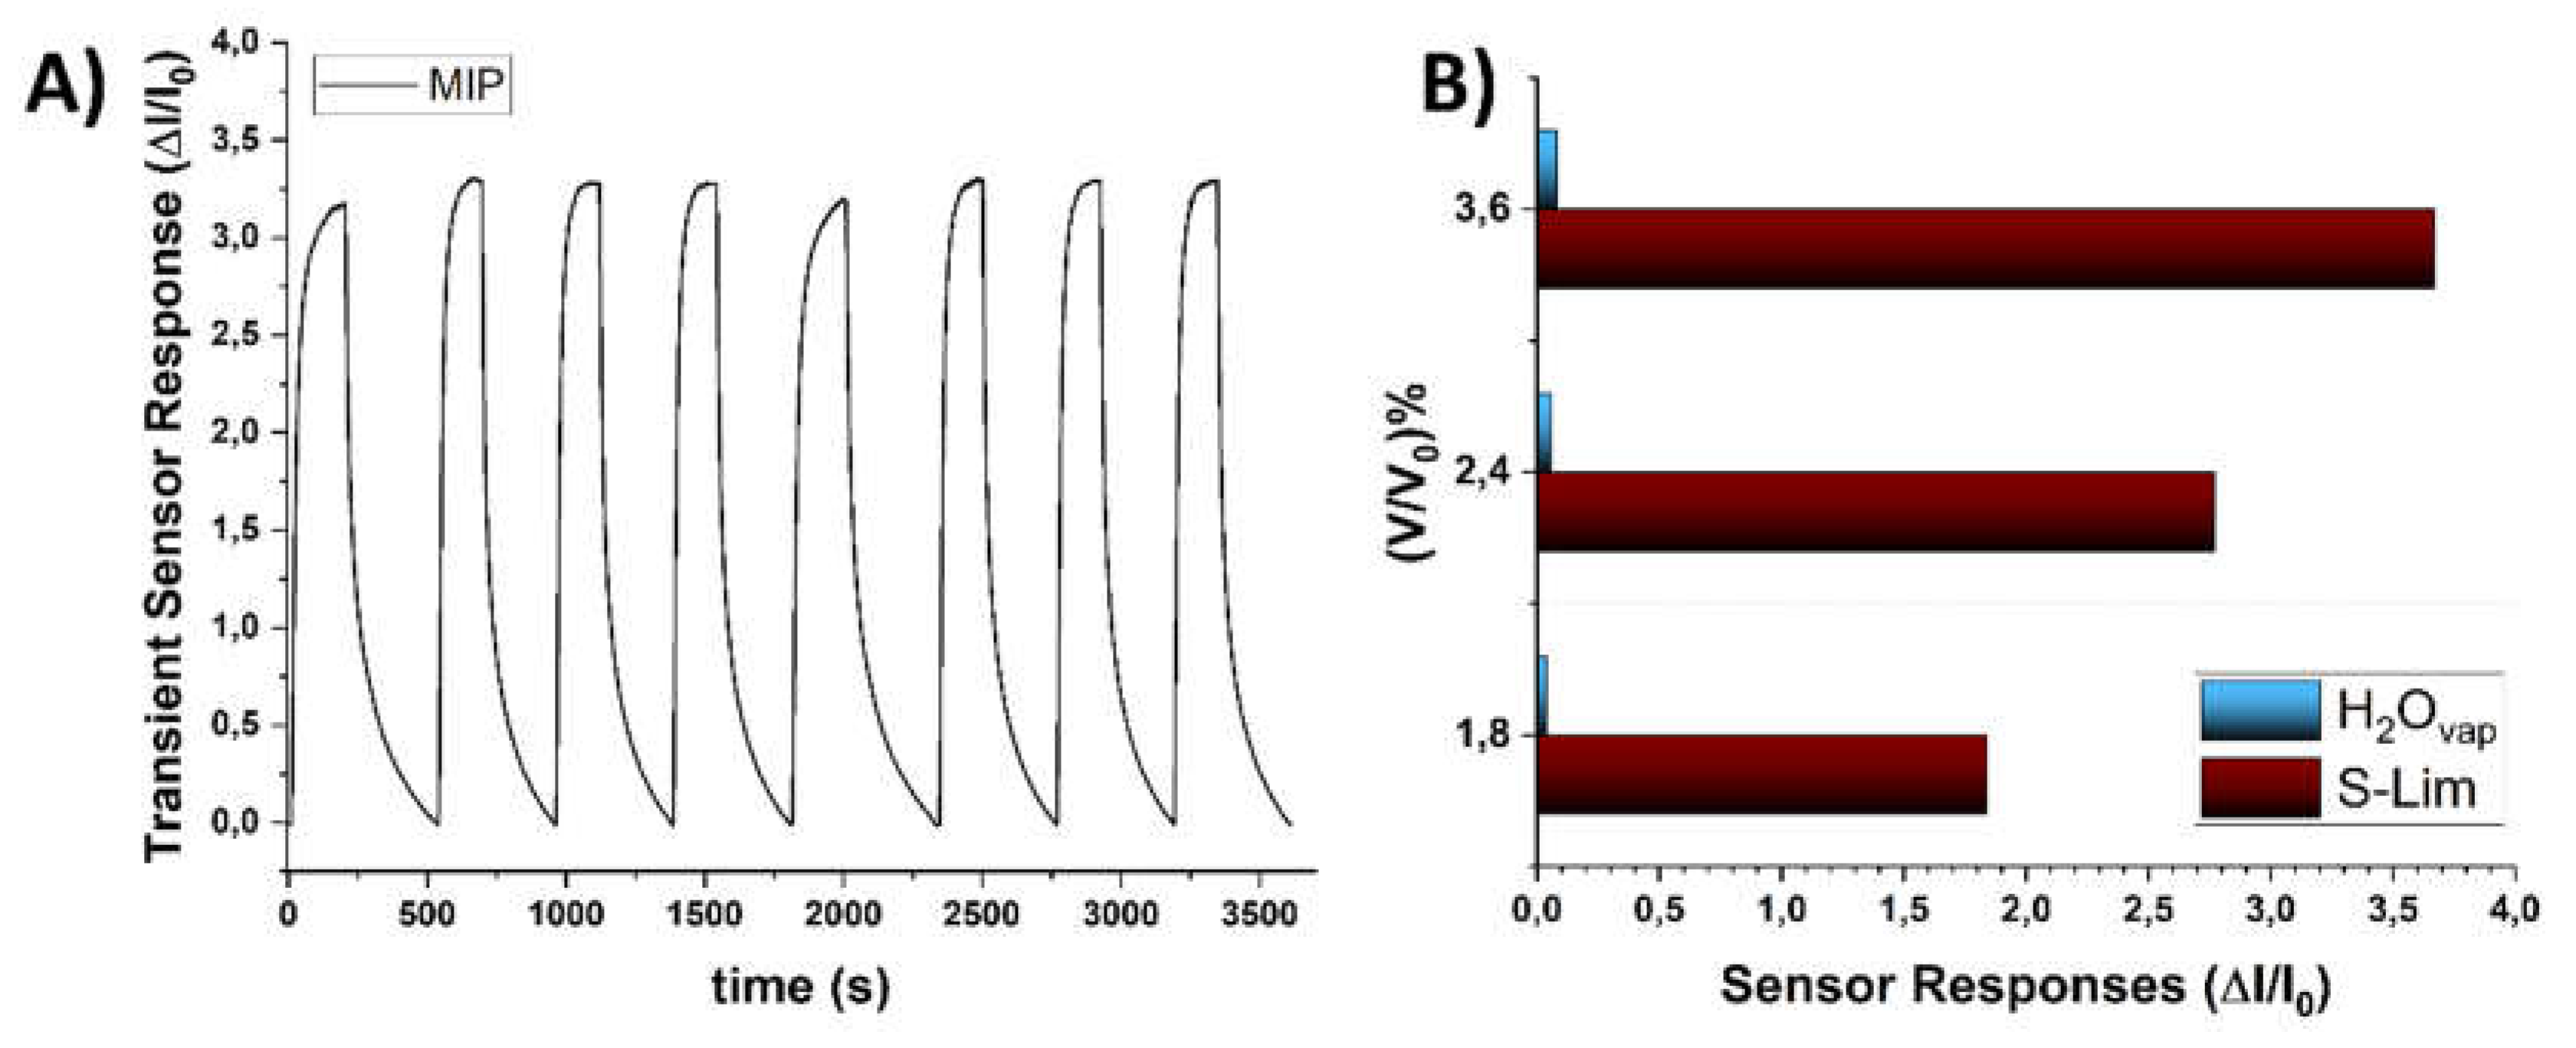
Figure 10.
Dynamic response of the sensor when exposed to 100 ppm of S(-)-Limonene at 55% and 80% relative humidity, including (on the right) a schematic representation of the potential contribution of H₂O molecules to S(-)-Limonene adsorption onto the nanofibers binding sites.
Figure 10.
Dynamic response of the sensor when exposed to 100 ppm of S(-)-Limonene at 55% and 80% relative humidity, including (on the right) a schematic representation of the potential contribution of H₂O molecules to S(-)-Limonene adsorption onto the nanofibers binding sites.
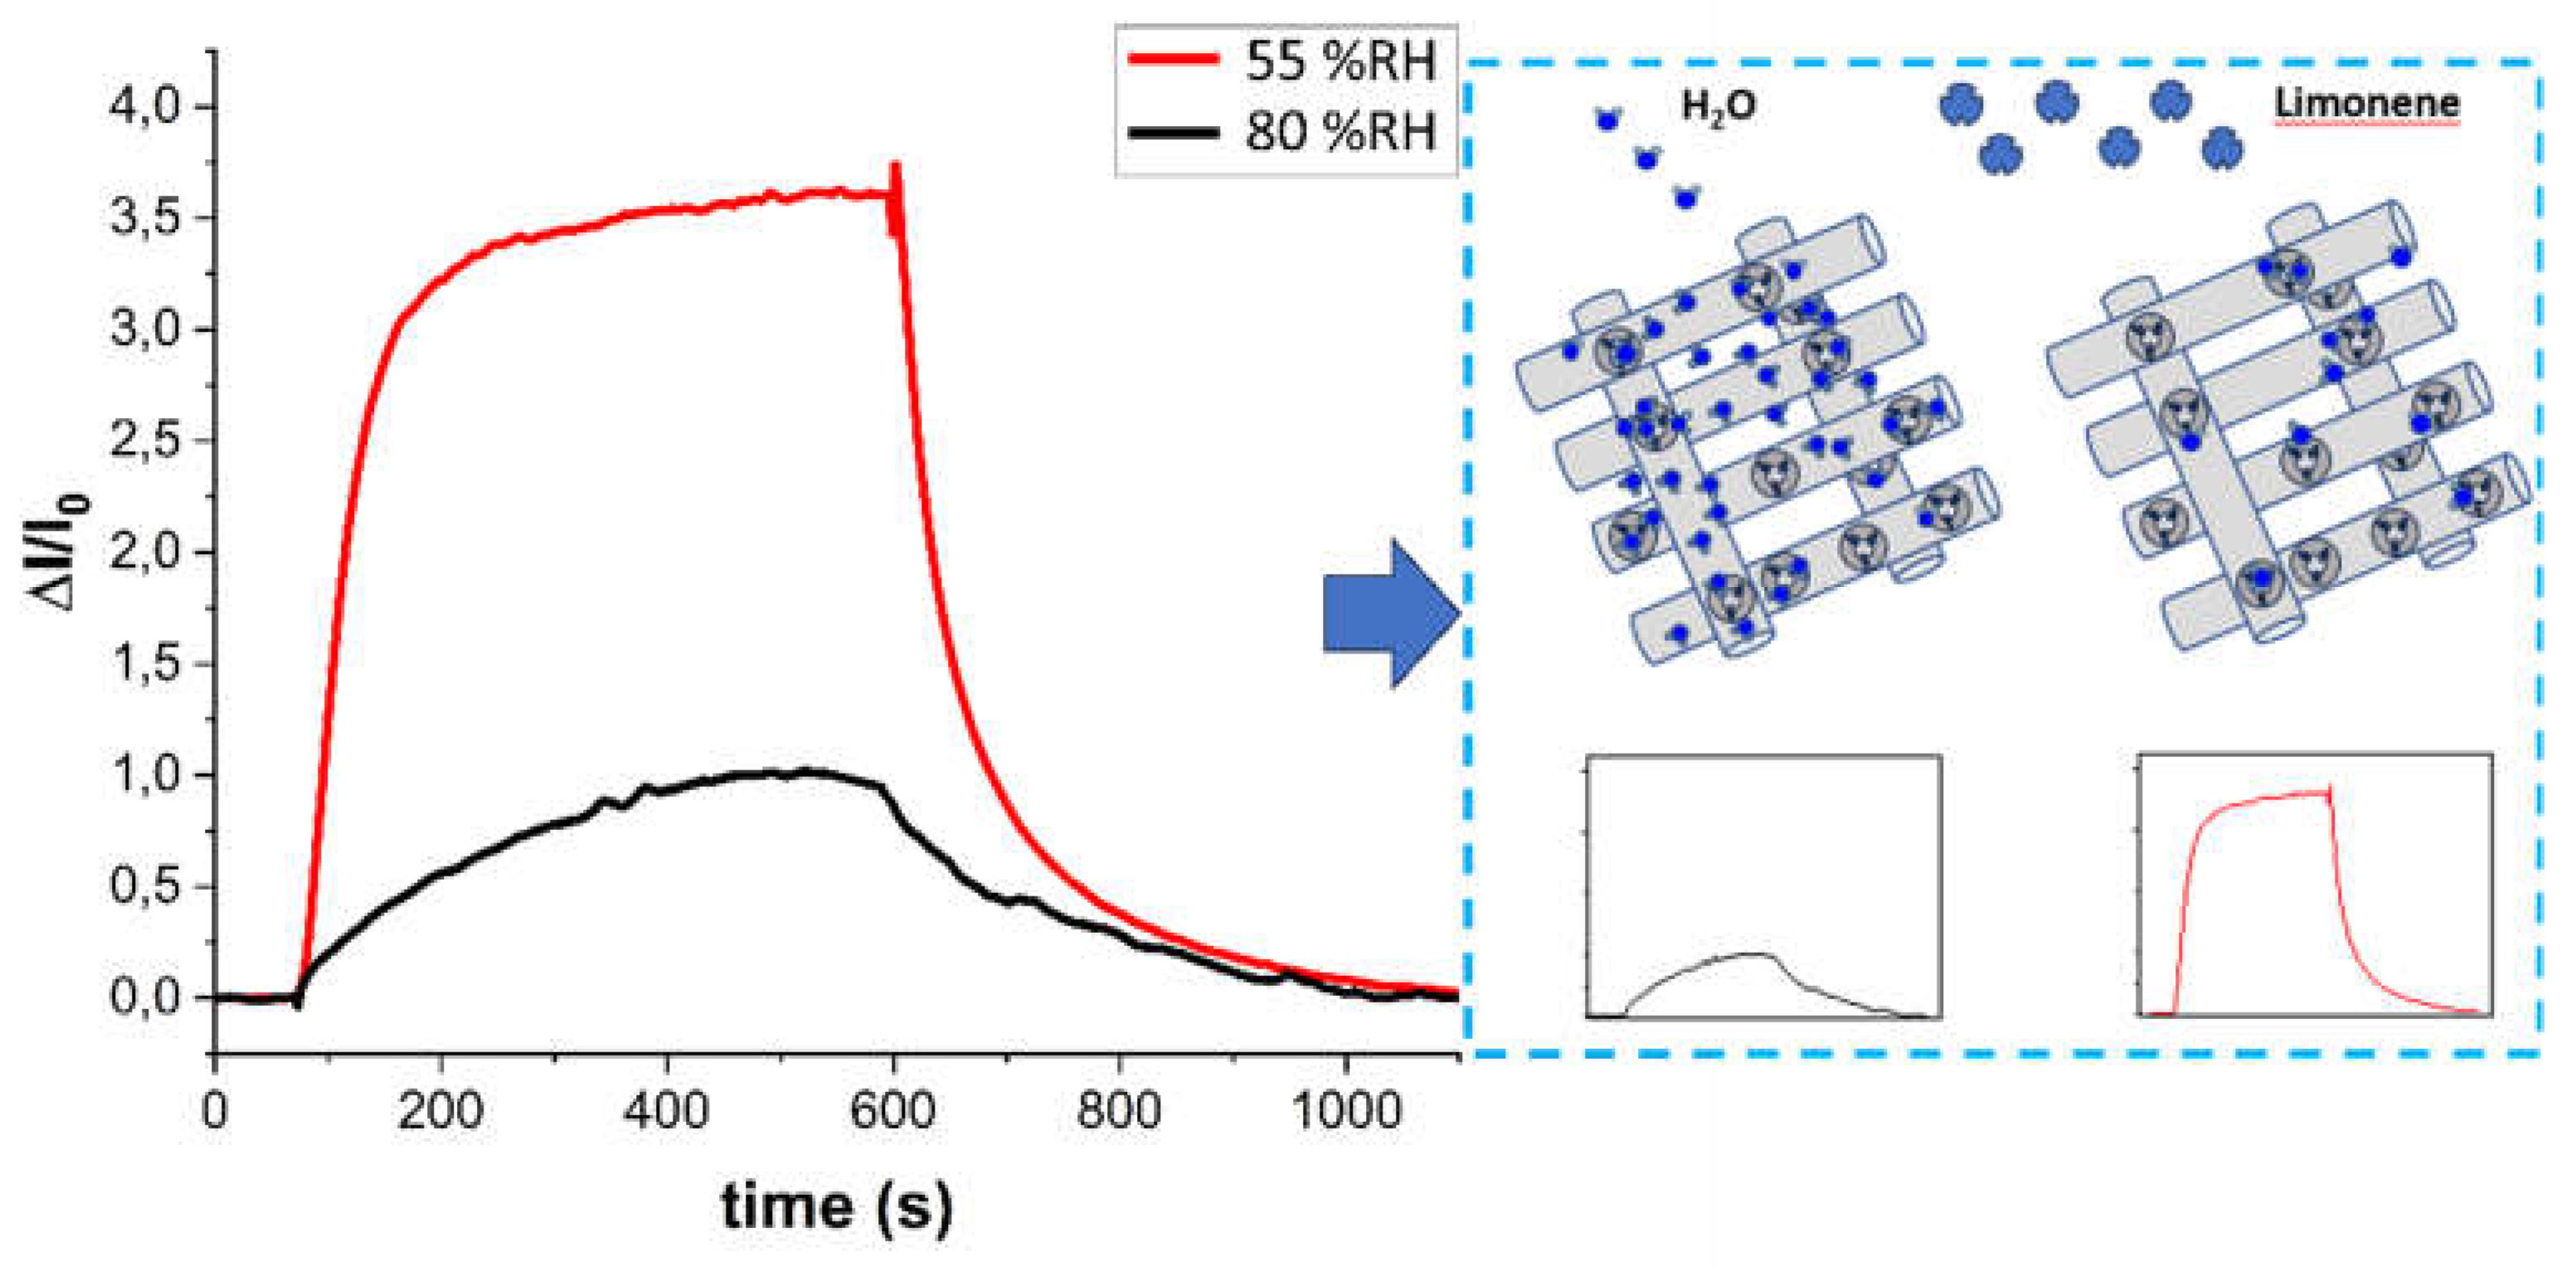

Table 1.
Mean diameter of MIP and NIP nanoparticles.
| Mean diameter [nm] | |
|---|---|
| MIP nps | 179,40 ± 43.00 |
| NIP nps | 117.15 ± 28.00 |
Table 2.
Electrical properties of MIP based nanofibers (T: 25°C; %RH: 55).
| R [Ohm] | W/L [µm] | Rs [Ohm/□] | |
|---|---|---|---|
| MIP fibres | 8.35∙108 ± 1.00∙108 | 2.86∙10-3 | 9.95∙103±1.20∙103 |
| NIP fibres | 1.54∙109 ± 1.85∙108 | 2.86∙10-3 | 18.35∙103±2.30∙103 |
Table 3.
A selection of the most-cited studies on MIP-based sensors specifically targeting limonene detection.
Table 3.
A selection of the most-cited studies on MIP-based sensors specifically targeting limonene detection.
| Type | Molar ratio | Sensing Layer | Transducer | Linear range [ppm] | LOD [ppm] | Reference |
|---|---|---|---|---|---|---|
| T:Styrene:DVB | 0.06:1:1.5 | Film | QCM | 20-250 | 20 | [67] |
| T:MAA:EGDMA | 1:5:20 | Film | QCM | - | - | [66] |
| T:MAA:EGDMA | 1:4:20 | Film | QCM | 300 - 2100 | 7.43 | [69] |
| T:Styrene:DVB | 0.06:1:1.5 | Film | QCM/IDE | 50 | [71] | |
| T:MAA:EGDMA | 1:4:20 | Film | QCM | 1-1000 | - | [65] |
| T:MAA:EGDMA | 1:4:20 | Film | QCM | 10 | [64] | |
| MAA:EGDMA | 1:5:20 | Film | IDE | 1-400 | - | [70] |
| PAA:PVP:MWCNT | 1:4:8 | Nanofibers | IDE | 1-60 | 0.23 | [101] |
Table 4.
Comparison of figures of merit among MIP-NF and MINF sensors.
| Sensors | SENS (ppm-1) | LOD (ppb) | LOQ (ppb) | Reference |
|---|---|---|---|---|
|
MIP-NF sensors MINF sensors |
0.102 ± 0.022 0.037±0.001 |
190 226 |
630 - |
This study |
| [101] |
Disclaimer/Publisher’s Note: The statements, opinions and data contained in all publications are solely those of the individual author(s) and contributor(s) and not of MDPI and/or the editor(s). MDPI and/or the editor(s) disclaim responsibility for any injury to people or property resulting from any ideas, methods, instructions or products referred to in the content. |
© 2025 by the authors. Licensee MDPI, Basel, Switzerland. This article is an open access article distributed under the terms and conditions of the Creative Commons Attribution (CC BY) license (http://creativecommons.org/licenses/by/4.0/).
Copyright: This open access article is published under a Creative Commons CC BY 4.0 license, which permit the free download, distribution, and reuse, provided that the author and preprint are cited in any reuse.


