
Submitted:
31 December 2024
Posted:
02 January 2025
You are already at the latest version
Abstract
Stroke affects approximately 12 million individuals annually, necessitating swift diagnosis to avert fatal outcomes. Current hospital imaging protocols often delay treatment, underscoring the need for portable diagnostic solutions. We have investigated silver nanostars (AgNS) bioconju-gates with human plasma, deposited on a simple aluminum foil substrate and utilizing Sur-face-Enhanced Raman Spectroscopy (SERS) combined with machine learning (ML) to provide a proof-of-concept for rapid differentiation of stroke types. These are the seminal steps for the de-velopment of a low-cost pre-hospital diagnostics at point-of-care, with potential for improving patient outcomes. The proposed SERS assay aims to classify plasma from stroke patients, differ-entiating hemorrhagic from ischemic stroke. Bioconjugates were prepared by combining AgNS with plasma, spiked with glial fibrillary acidic protein (GFAP), a biomarker elevated in hemor-rhagic stroke. SERS spectra were analyzed using ML to distinguish between hemorrhagic and ischemic stroke, mimicked by different concentrations of GFAP. Key innovations include optimized bioconjugate formation, controlled plasma-to-AgNS ratios, and a low-cost aluminum foil substrate, enabling results within 15 minutes. Differential analysis revealed stroke-specific protein profiles, while ML improved classification accuracy through ensemble modeling and feature engineering. The integrated ML model achieved rapid and precise stroke predictions within seconds, demonstrating the assay's potential for immediate clinical decision-making.
Keywords:
silver nanostars (AgNS)
; surface-enhanced Raman spectroscopy (SERS)
; spectral fingerprint
; stroke
; plasma samples
; principal component analysis (PCA)
; machine learning (ML)
1. Introduction
Stroke remains a critical global health issue, caused by impaired blood flow to the brain due to either artery blockages (ischemic stroke) or ruptured vessels (hemorrhagic stroke). This interruption drastically reduces oxygen and nutrient supply to brain tissue, leading to substantial and often irreversible tissue damage. [1,2] Stroke is the second leading cause of mortality worldwide and a primary contributor to long-term adult disability, affecting around 12 million people each year. Outcomes following a stroke are heavily dependent on the location and extension of brain injury, which affect neurological functions, recovery chances, and quality of life. [3,4,5,6] Ischemic strokes account for nearly 85% of cases and generally result from blood clots or plaque that obstruct blood flow to the brain, while the remaining 15% of strokes are hemorrhagic, caused by bleeding due to ruptured cerebral vessels. Stroke patient outcomes greatly depends on therapy onset since delays in treatment increase risks of disability and mortality. [1] In fact, “time is brain” since every minute following a stroke results in the loss of approximately 1.9 million neurons. [7,8,9] However, ischemic and hemorrhagic stroke present similar clinical symptoms and advanced imaging techniques (computed tomography (CT) and magnetic resonance imaging (MRI)) are needed for the differential diagnosis. [10] Identification of stroke type is vital for administering correct therapy since, for example, ischemic stroke treatments administered to hemorrhagic stroke patients can lead to severe complications or dead. Misdiagnosis not only risks patient health but also results in inefficient use of medical resources, stressing the need for diagnostic tools that offer high sensitivity and specificity. [1] Thus, rapid and pre-hospital stroke diagnosis is urgently needed for improving stroke patient management shortening treatment onset and improve final outcomes. Point-of-care testing (PoCT) provides a promising pathway for rapid differential stroke diagnosis, capable of delivering blood sample results within minutes—even on route to the hospital.
Blood plasma, due to its convenient collection and high concentration of analytes, is an optimal biological fluid for SERS-based diagnostics. [11,12,13] SERS has been applied to plasma for cancer biomarker detection, such as identifying exosomal markers for early lung and breast cancer diagnosis, and in detecting viral infections, such as hepatitis or influenza. [14,15,16] Plasma is particularly valuable for identifying biomarkers related to stroke due to its role in vascular events and can support the differentiation of ischemic and hemorrhagic strokes. [7,17]
One promising biomarker for differentiating between stroke types is Glial Fibrillary Acidic Protein (GFAP). This proteolytic enzyme is primarily expressed in astrocytes and plays key roles in cell-cell communication, namely astrocyte-neuron interactions and the maintenance of blood-brain barrier (BBB) integrity. In hemorrhagic stroke (HS), the disruption of the BBB leads to astrocyte damage and the subsequent release of GFAP into the bloodstream. [7,18] This release occurs rapidly due to the acute disruption of the BBB, contrasting with the slower and less pronounced release observed in ischemic stroke (IS). This temporal and quantitative difference makes GFAP a valuable biomarker for distinguishing between stroke types, particularly in the early stages of stroke biological events.[7,19,20] There is a strong correlation between GFAP blood levels and hematoma size, with significantly elevated concentrations observed in HS compared to IS during the first 24 hours after stroke onset. This correlation has demonstrated good sensitivity and specificity, particularly in cases involving larger hematomas, making GFAP a promising indicator for stroke differentiation in clinical diagnostics. [7,21].
To understand the potential of SERS in stroke diagnostics, it is important to first understand the basics of Raman spectroscopy. In this technique, a monochromatic laser is directed at a sample, causing the light to scatter. Most photons undergo elastic (Rayleigh) scattering, but a fraction experiences Raman scattering, where energy shifts due to molecular vibrations, revealing the molecular structure of the sample. [22,23,24] Traditional Raman spectroscopy, however, has limitations in sensitivity due to the inherently low probability of Raman scattering from individual molecules. SERS overcomes this challenge by amplifying Raman signals from molecules adsorbed to metal nanostructures, at “hot spots” up to 1012-fold. [22,23,25]
Silver nanostars (AgNS) are a particularly effective nanostructure in SERS applications due to their unique star-shaped morphology, which provides numerous sharp tips and edges, “hotspots”, where the electromagnetic field is significantly enhanced due to localized surface plasmon resonance (LSPR). [26,27,28] This enhancement allows AgNS to amplify Raman signals to a degree that enables the detection of even trace amounts of biomolecules, which is especially beneficial for point-of-care diagnostic applications where rapid and accurate detection is needed. [26,27,29]. This is particularly relevant for stroke diagnostics, where the rapid and sensitive detection of specific plasma biomarkers can provide essential information about the type and severity of stroke. The ability to tailor AgNS surfaces to selectively interact with target molecules further increases the diagnostic utility of this approach. Recent developments in artificial intelligence (AI) and machine learning (ML) complement the use of AgNS in SERS by allowing rapid processing and analysis of the complex data generated, further increasing diagnostic accuracy and making this method suitable for real-time, point-of-care applications. [19,20,30]
Principal Component Analysis (PCA) is a widely applied statistical method in SERS, simplifying complex spectral data by identifying patterns, clusters, or outliers. PCA transforms spectral data into principal components that capture the most significant variance in the data, enabling deeper analysis with important applications in the biomedical field. [26,31] Integration of machine learning with SERS further enhances diagnostic accuracy by allowing for the analysis of complex data sets and pattern identification in SERS spectra that might otherwise go undetected. [32,33] This is especially important for more complex biomedical matrixes (e.g., serum and plasma vs. urine), where ML algorithms further contribute to increase sensitivity and specificity of SERS measurements.
Our proposed stroke diagnostic workflow is illustrated in Figure 1.. Herein, different experimental SERS conditions were optimized, namely substrates, concentrations and time for bioconjugates assembly. For the optimization steps commercial human plasma was used, alone or mixed with recombinant GFAP protein at different concentrations, mimicking ischemic or hemorrhagic stroke patient plasma. Machine Learning Methodology was applied to generate a classifier for distinguishing spectra from different samples. This article presents the first steps for the development of SERS technology as a tool for differential stroke diagnosis, finding future application on a point of care test.
2. Materials and Methods
2.1. Reagents and Materials
The following reagents were used for the synthesis of silver nanostars (AgNSs): sodium hydroxide solution 98% (Fisher, Waltham, MA, USA) and 50% (w/w) hydroxylamine solution in water 99.99% ( Sigma Aldrich, St. Louis, MO, USA), silver nitrate > 99.99% (Sigma Aldrich, St. Louis, MO, USA) and trisodium citrate dihydrate 99% (Merck, Darmstadt, Germany)
Human plasma obtained from Sigma-Aldrich (St. Louis, MO, USA) was reconstituted in ultrapure water (MilliQ®, 18.2 MΩ·cm at 25ºC) and stored in liquid nitrogen aliquots. Before use, plasma aliquots were diluted 1:1 with ultrapure water. Glial Fibrillary Acidic Protein (GFAP), obtained from HyTest, Finland, was diluted to a concentration of 0.1 mg/mL in phosphate-buffered saline (PBS, 1x, pH 7.4, Sigma-Aldrich, St. Louis, MO, USA), prepared with distilled water. Protein concentration was determined by the bicinchoninic acid (BCA) method (based on Smith et al. [34]), using a Sigma-Aldrich kit (St. Louis, MO, USA). For agarose gel electrophoresis (AGE), UltraPure™ Agarose from Bio-Rad and Tris-acetate EDTA (TAE) buffer from Sigma-Aldrich, St. Louis, MO, USA were used. Reagents for SDS-PAGE included TEMED (>98%) from Tokyo Chemical Industry (TCI, Japan), glycine (>98.5%) from Carlo Erba, ammonium persulfate (10% w/v), β-mercaptoethanol (>99.0%), sodium dodecyl sulfate (SDS, >98.5%), Brilliant Blue R-250 (Sigma-Aldrich), glycerol (99.5%) all from Sigma-Aldrich (St. Louis, MO, USA), and bromophenol blue from Panreac AppliChem, Germany. The SDS-PAGE setup utilized 30% (w/v) acrylamide/bisacrylamide solution and the Mini-PROTEAN system kit from Bio-Rad. NZYtech Colour protein marker II molecular weight markers set, was by NZYtech (Portugal).
2.2. Silver Nanostars Synthesis
Silver nanostars were synthesized as described in Garcia-Leis et al. with minor changes [28]. Briefly, a 5.0 ml mixture of equal volumes of 50 mmol·dm−3 sodium hydroxide solution and 60 mmol·dm−3 hydroxylamine solution was prepared in a beaker. Immediately after, a 1 mmol·dm−3 silver nitrate solution was added dropwise (45 mL/min) using a syringe. After 90 seconds, 0.5 ml of a 1.5% wt. trisodium citrate solution was introduced as a second reducing and capping agent. The reaction was carried out in the dark for 3 hours. Following synthesis, the AgNS suspension was centrifuged at 1,600g for 12 minutes, and the resulting pellet was resuspended in ultrapure water before storage in plastic Falcon tubes.
2.3. Estimation of total protein molar concentration in stock human plasma solution
To prepare plasma@AgNS bioconjugates with controlled molar ratios, we determined the total protein molar concentration of plasma on reconstituted samples, to be 55 mg/mL as obtained from BCA total protein determination. This concentration is close to the lower limit of estimated total protein concentration in a living human body (60-80 mg/mL). As an approximation, we used molecular masses and known relative abundances of major plasma proteins, namely, albumin (55%; 66 kDa), globulins (40%; 150 kDa), and fibrinogen (0.05%; 340 kDa), [35] obtaining a weighted plasma proteins molecular weight of 113,3 kDa, and a weighted plasma proteins molar concentration of 0.485 M, i.e., 4.85 x 10⁸ nM.
2.4. Bioconjugates Assembly
Plasma-AgNS and Plasma-GFAP-AgNS bioconjugates were prepared by simple incubation AgNSs (0.05 nM) with specific amounts of plasma and/or GFAP to achieve the desired Plasma to AgNS molar ratios. Incubation was in ultrapure water at 4°C for 15 minutes; 3 hours; or overnight (ca. 16h). The amount of plasma to include in the bioconjugates, was optimized based on a criterium of a more intense SERS spectrum, presenting a maximum of defined vibrations, and was found to be a plasma to AgNS molar ratio of 3.88 x 10⁹, corresponding to a plasma concentration of 0.194 M, i.e., 40% diluted in relation to stock plasma concentration.
2.5. Dynamic Light Scattering Measurements
Dynamic light scattering (DLS) analysis was conducted using a Malvern Zetasizer Nano series (Worcestershire, WR14 1XZ, Malvern, UK). Particle sizes (0.3 nm to 10 µm) were determined with single-scattering detection at a 173° scattering angle using a 532 nm diode-pumped, frequency-doubled laser. Measurements were conducted in a temperature-controlled cuvette holder at 25 °C, with samples pre-equilibrated for 5 minutes. A volume of 800 µL was transferred to a cuvette for DLS (disposable cells). For DLS, each sample was measured in duplicate, with each measurement comprising five acquisitions, while zeta potential, each sample was measured in duplicate, with three acquisitions each.
2.6. Scanning electron microscopy
Scanning electron microscopy (SEM) imaging was employed to confirm the morphology of synthesized AgNSs and Plasma-AgNS bioconjugates. Imaging was performed using a Hitachi Regulus 8220 Scanning Electron Microscope (Mito, Japan) equipped with an Oxford EDS detector. Samples were prepared by drop-casting onto a silicon wafer substrate and allowed to air dry before imaging.
2.7. Agarose Gel Electrophoresis
Agarose gel electrophoresis (AGE) was used to assess the size and charge of bioconjugates, demonstrating its successful formation. A horizontal gel electrophoresis system (Bio-Rad) operated at 80 V (E = 10 V/cm) was used with 0.3% (w/v) agarose (UltraPure™ Agarose, Invitrogen) in 0.5x TAE buffer. Bioconjugates were incubated overnight at 4°C and then centrifuged at 9,500g for 10 minutes at 4°C. Pellets were resuspended in 13.5 µL of potassium phosphate buffer (5 mM, pH 7.4), with 1.5 µL glycerol added to improve sample density and facilitate well loading.
Electrophoretic mobility (µ) was quantified as the migration distance (ν) divided by the electric field strength (E), with variations (Δµ) calculated relative to the maximum mobility band. Migration distances were measured using ImageJ software (https://imagej.nih.gov/ij/). We represent our AGE mobilities as variations relative to the maximum mobility band (∆µ).
2.8. Hill Fitting to AGE Data
As plasma proteins attach to the surfaces of AgNSs, the mass of the resulting conjugate increases, leading to a decrease in electrophoretic mobility and a reduction in surface negative charge. This behavior is observed as slower migration toward the positive electrode. Using ImageJ (https://imagej.nih.gov/ij/), migration distances were calculated for each concentration ratio based on digital images of the electrophoresis gels, and these data were then fitted to a Hill adsorption isotherm (Equation (1)).
In this isotherm model, ∆µ denotes the change in electrophoretic mobility compared to the initial AgNS conjugate before any plasma protein binding, while Kd represents the binding constant (in M), or the concentration of plasma proteins at which half of ∆µmax is achieved. The Hill model incorporates a cooperativity parameter n, which reflects positive cooperativity (n > 1) when binding of additional molecules is promoted, and negative cooperativity (n < 1) when it is inhibited by previous binding. When n=1, there is no cooperativity, allowing the system to be characterized by a Langmuir adsorption isotherm.
2.9. SDS-PAGE
SDS-PAGE gels were prepared with 12 % (v/v) acrylamide for the resolving gel and 5% (w/v) for the stacking gel, enabling protein separation between 12 and 60 kDa. Samples (10 µL) were run alongside low molecular weight (LMW) markers at 150 V for 1.25 hours. Gels were stained with 2% (w/v) Coomassie Blue R-250 and destained until bands were clearly visible. Plasma@AgNS and (Plasma+GFAP)@AgNS bioconjugates were obtained with 15 minutes, 3 hours, or overnight incubation. Control plasma was 10X diluted in relation to the concentration used to incubate with AgNS and control (plasma+GFAP) was at the same concentration used to incubate with AgNS and 0.1 mg/mL GFAP. After incubation, equal volumes of the sample and sample buffer were combined, centrifuged for 2,500g during 10 min at 4ºC, and heated at 100°C for two minutes, before application to the wells. Migration distances from the wells to the samples, which corresponded to the center of the most intense band, were quantified using ImageJ (National Institutes of Health, https://imagej.nih.gov/ij/).
2.10. Raman and SERS Measurements
Spectral acquisition for Surface-Enhanced Raman Spectroscopy (SERS) was conducted using a Renishaw inVia™ QontorTM confocal Raman microscope equipped with a Peltier cooled to -70 ºC for ultra-low noise charge-coupled device (CCD) Centrus 2957T3 detector and a He–Ne laser operating at 17 mW with a wavelength of 633 nm and diffraction grating with 1800 l/mm. Samples were placed on the opaque side of a square piece of aluminum foil (thickness 12 µm, purchased at a local store). The spectroscopic system had a resolution of 0.3 cm⁻¹, and the laser beam was focused through a 20x objective lens. To minimize random background noise from the detector, three scans of 5 seconds each were integrated for all measurements. The incident laser intensity was set at 3.2 mV, and duplicate spectra were recorded for each sample. Between different SERS sessions, calibration of the spectrograph was performed using the Raman line at 521 cm⁻¹ from an internal silicon wafer to mitigate potential fluctuations in the Raman system. Three µL of the plasma@AgNS conjugates were dropped onto an aluminum foil substrate. A SERS map of the sample was acquired, corresponding to 574 spectra in a sample area with the same number of square micrometers, with initial laser focus on the edge of the drop, as in its center focusing was difficult to obtain. Raw data were digitally captured using WireTM 5.6 software for further processing. Vibrational line areas were analyzed using PeakFit software, which facilitated baseline correction and Gaussian deconvolution to pinpoint vibrational levels based on the Lorentzian area.
2.11. Machine Learning methodology
The Machine Learning methodology is illustrated in Figure 2, to train a machine learning model able to classify SERS spectra of plasma with different GFAP concentrations: (i) Data splitting into training and testing sets; (ii) Principal Component Analysis (PCA) and resulting Transformer, for dimensionality reduction; and (iii) LightGBM machine learning framework, and resulting trained classifier. The congregation of these components enable to receive SERS spectra and train a classification model, that is capable of predict in a whole. The outcome is a confusion matrix that enables to evaluate the performance of the developed methodology. For the implementation of a point of care that enables the evaluation of a new spectrum, the Transformer and Trained Classifier are used to provide a prediction of the type of sample.
2.11.1. Data splitting into training and testing sets
One important step in training a machine learning model is splitting the available data into training and testing data. Training data will be used for training the machine learning model, while testing data will enable the performance evaluation of the trained classifier. Shuffling the data before splitting disrupts potential biases or ordering in the dataset, creating a more representative and randomized distribution of samples. This step is particularly crucial for imbalanced or sequential data, ensuring fair performance evaluation.
2.11.2. Principal Component Analysis
Principal Component Analysis (PCA) is a dimensionality reduction technique that transforms a dataset into a smaller set of uncorrelated variables called principal components, while retaining most of the original data's variance. By identifying the directions (components) of maximum variability in the data, PCA simplifies complex datasets, reduces noise, and mitigates issues like multicollinearity. In machine learning, PCA is often used as a pre-processing step to improve model performance, particularly for high-dimensional data, by reducing computational complexity and focusing on the most informative features of the dataset. [36]
2.11.3. Transformer
Once the principal components of the training spectrum are identified by the PCA module, these can be used by a trained or fitted PCA model, so called transformer, to transform datasets. It projects datasets onto the computed principal components, providing in this way a dimensionality reduction, making more efficient the classification of data.
2.11.4. LightGBM Model
Light Gradient Boosting Machine (LightGBM) is a high-performance machine learning framework designed for gradient boosting, optimized for speed and efficiency. It uses a histogram-based algorithm, enabling it to handle large datasets and high-dimensional features effectively. LightGBM supports parallel training and advanced features like leaf-wise tree growth, which enhances accuracy by focusing on areas with higher information gain. This model excels in classification tasks due to its ability to capture complex relationships in data, manage imbalanced datasets, and handle categorical features natively. Its efficiency and predictive power make it ideal for large-scale classification problems. [37]
2.11.5. Trained Classifer
As a result, a trained classification model is obtained. It has learned to recognize patterns in data to assign inputs to specific classes. During the training phase, it analyses labelled training data (identified with the associated class/type) and adjusts its internal parameters to minimize errors in its predictions. Once trained, it can process new, unseen data and predict the most likely class based on the learned patterns. If can perform efficiently and automatically the sk of decision-making of identifying the sample type. Testing spectra are used as input to evaluate the performance of the trained model. The evaluation outputs include a confusion matrix and classification report.
The confusion matrix is a valuable tool for assessing classification performance. It summarizes the number of correct and incorrect predictions for each class, categorizing them into true positives, true negatives, false positives, and false negatives. It provides detailed insight into how well the model differentiate the classes. [38] Based on the confusion matrix results, several metrics are computed to evaluate the performance of the model, namely; (i) Precision, the proportion of true positive predictions among all positive predictions made by the model, highlighting the accuracy of positive classifications; (ii) Recall, or sensitivity, measuring the proportion of actual positive cases that were correctly identified, reflecting the model's ability to detect all relevant instances; and (iii) F1-score, which balances these two metrics, providing a harmonic mean that is particularly useful when there is a trade-off between precision and recall. [39]
3. Results and Discussion
Our proposed stroke diagnostic workflow (Figure 1) begins with the collection of blood plasma from a stroke patient in the ambulance. Plasma is mixed with silver nanostars (AgNSs), nanostructures specifically engineered to amplify the Raman signal through surface-enhanced Raman spectroscopy (SERS). When a 633 nm laser (red) is directed at the sample, it generates a unique SERS spectral fingerprint, that is highly specific to the chemical and structural properties of plasma molecules adsorbed to the AgNSs, including biomarkers associated with different types of strokes. Here we have used commercial human plasma spiked with GFAP at different concentrations, to investigate the diagnostic potential of the GFAP biomarker in a AgNS-SERS detection system, followed by spectral ML analysis. Three distinct GFAP concentrations and incubation times were selected to simulate varying stroke scenarios. A concentration of 0.1 ng/mL was chosen to represent the low levels of GFAP typically associated with ischemic stroke within the first 1–3 hours after symptom onset. While a GFAP concentration of 0.5 ng/mL was used to reflect the intermediate GFAP levels observed in hemorrhagic stroke cases within the first 3 hours. Finally, a high concentration of 1 ng/mL was included to mimic the elevated GFAP levels typically measured about 12-18 hours after an hemorrhagic stroke onset, corresponding to extensive BBB disruption. These concentrations align with clinical data demonstrating the progressive increase in GFAP levels with the severity and time after stroke onset. [21]
3.1. Characterization of Silver Nanostars and AgNSs bioconjugates with Plasma
Silver nanostars (AgNSs) synthesized for this study were thoroughly characterized using scanning electron microscopy (SEM) (Figure 3). Complementary techniques have provided insights into bioconjugation efficiency. Namely, Agarose Gel Electrophoresis (AGE) (Figure S1) and Dynamic Light Scattering (DLS) (Figure S2) were employed to assess bioconjugation stability of AgNSs bioconjugates with plasma samples spiked with GFAP at varying concentrations and to determine the average diameter of AgNSs alone and their bioconjugates. SDS-PAGE of these bioconjugates gave insights into the composition of the protein corona around the AgNSs (Figure S3).
Scanning Electron Microscopy analysis revealed that AgNSs possess a distinctive morphology, characterized by a central core from which multiple elongated spikes radiate outward (Figure 3A). These spikes vary in shape, orientation, and sharpness, leading to a heterogeneous appearance within the same batch. The average diameter of the nanostars was approximately 116 nm, with the observed heterogeneity primarily attributed to variations in spike length and morphology, as seen in the SEM micrograph (Figure 3A).
The formation of bioconjugates between the AgNSs and plasma proteins was observed in the SEM micrographs, where a film of low contrast material around the AgNSs can be observed (Figure 3B-C). This film is the protein corona, a layer of plasma proteins that adsorbs onto the surface of the nanostars during contact with biological fluids. At low incubation times, an initial protein corona forms, which is kinetically labile and consist mainly of the more abundant proteins loosely bound to the AgNS surface (soft corona). This soft corona slowly transforms into a more densely packed layer of high affinity proteins (hard corona), existing in blood at lower concentrations. Interestingly, in SEM micrographs, the protein corona was apparent even after a short incubation period of only 15 minutes (Figure 3B), suggesting that the AgNS surfaces were rapidly and almost completely covered by plasma proteins. This rapid soft corona formation underscores the strong affinity of plasma proteins for AgNS surface. At a longer incubation time (Figure 3C), a thinner and denser hard corona is visible, as compared to the low contrast of the soft corona, as longer incubation can potentially lead to further stabilization or restructuring of the protein corona around AgNSs.
Agarose Gel Electrophoresis is a powerful tool towards identification of bioconjugates. [40] Protein adsorption at the surface of a AgNSs leads to reduced electrophoretic mobility, mainly due to reduction of the surface charge of AgNSs. Electrophoretic mobility data was plotted versus plasma concentration and fitted to an adsorption isotherm of the Hill type (Figure S1), with a binding constant (Kd) of 5.0 x 10⁹ M⁻¹, Δμmax of 7.9 × 10⁻8 m²V⁻¹s⁻¹, and a Hill coefficient (n) of 1.4. The latter indicates that plasma proteins bind to AgNS with positive cooperativity, with one protein favoring the binding of the next (see Materials and Methods for details on the fitting equation). The calculated binding constant (Kd) is within the range of what has been reported using other techniques, as an analysis of the literature shows that there is a significant discrepancy in reported gold or silver nanoparticle−protein binding constants, falling anywhere from 104 to 1011 M−1. [41]
3.2. Characterization of AgNSs bioconjugates with Plasma and GFAP
Dynamic Light Scattering measurements allowed determination of the hydrodynamic diameters from AgNS alone in solution and their respective bioconjugates, at different incubation times (Table S1; Figure S2). For AgNS alone an hydrodynamic diameter of (116 ± 0.8) nm was obtained, in line with published results. [26] The formation of robust bioconjugates is highlighted by the red dashed line in the graph of Figure S2, showing that all bioconjugates have hydrodynamic diameters which are ca. 70 nm higher than AgNS, pointing towards a ca. 60% increase in hydrodynamic diameter caused by the plasma corona. This increase is similar for all conditions tested, with ca. 15% larger values observed for overnight incubations of (Plasma+GFAP)@AgNS bioconjugates, likely due to the progressive formation and maturation of a hard protein corona over that longer time period. These findings highlight the dynamic nature of protein corona formation and its stabilization over time, while also demonstrating the robustness of the Plasma-GFAP-AgNS conjugation process under different experimental conditions.
The protein composition of the protein corona formed on the surface of the AgNSs in bioconjugates, was analyzed as a function of incubation time, using SDS-PAGE. Figure S3 shows results for plasma samples (P) incubated with AgNSs for 15 minutes, 3 hours, and overnight. Panel A is the SDS-PAGE for Plasma@AgNS bioconjugates, while Panel B is the SDS-PAGE for (Plasma+GFAP)@AgNS bioconjugates. SDS-PAGE profiles of the bioconjugates, reveal proteins from plasma which adsorb onto the AgNS surface, forming a protein corona. After 15 minutes of incubation of Plasma@AgNS bioconjugates (Figure S3A), the protein bands corresponding to major plasma proteins such as albumin (~66 kDa) is prominently visible, indicating their preferential adsorption. As incubation time increases to 3 hours and overnight, the protein band from albumin decreases its intensity. This observation hints at a dynamic transition from a "soft" to a "hard" protein corona, with proteins of higher affinity gradually displacing the high abundance and low affinity ones, such as albumin, from the silver nanostars surface. [42] For SDS-PAGE of plasma spiked with GFAP (Figure S3B), and comparing profiles for 15-minute, 3-hour, and overnight incubation times, an intensity increase of the only band is observed with increasing incubation time, the opposite behavior of what was observed in the absence of GFAP. GFAP itself is not visible on any lanes, due, probably to its low amount. In fact, to keep with biologically-relevant amounts of plasma and GFAP, only 0.4 μg of pure GFAP were loaded in the (Plasma+GFAP) control lane, an amount close to the lower detection limit for the SDS-PAGE technique, of 0.3-1 μg of protein per lane. [43] In that control lane, the GFAP band (appearing at ~50 kDa) is probably hidden in the albumin band (~66 kDa band). In the (Plasma+GFAP)@AgNS bioconjugates lanes, no GFAP is visible, probably because the amount of GFAP present in the bioconjugates is much less than what was present in the incubation solution (0.4 μg), this time being well below the lower detection limit for the SDS-PAGE technique. Althought further studies are needed to elucidate the complex protein corona dynamics, it is tempting to speculate that GFAP is a low abundace / high affinity protein, part of the “hard corona” that by preferentially adsorbing with high affinity to the surface of AgNS, can also bind to albumin, keeping it on the bioconjugates for the longer incubation times.
These findings highlight the dynamic and time-dependent nature of protein corona formation. Even at short incubation times (15 minutes), the AgNSs acquire a protein corona capable of supporting biomarker interactions, as seen with GFAP. However, extended incubation times lead to a more complex corona, which may influence the SERS response and biomarker detection sensitivity. These results provide crucial insights into optimizing incubation conditions for point-of-care applications, where rapid corona formation is essential for timely diagnostics.
3.3. SERS of AgNSs bioconjugates with Plasma and GFAP
Surface Enhanced Raman Spectroscopy (SERS) spectra were obtained of bioconjugates of AgNSs with plasma and with plasma spiked with GFAP concentrations of 0.1 ng/mL, 0.5 ng/mL, and 1 ng/mL. These concentrations simulate the different stages of a hemorrhagic stroke: within the first hour, after three hours, and on the following day post-stroke. [21] Additionally, different incubation times—15 minutes, 3 hours, and overnight—were evaluated to assess their impact on the SERS spectral profile. The results revealed that even with the short incubation time of 15 minutes with plasma and any of these three GFAP concentrations, it was possible to detect small but notable differences in the SERS spectrum when comparing with plasma alone, also incubated for the same 15 minutes with AgNSs (Figure 4). These differences became more pronounced with longer incubation periods, with overnight incubation providing the most distinct and well-defined spectral features for differentiating between GFAP concentrations, as it can be observed in Figure S4. However, at the shortest incubation time (15 minutes), specific SERS spectral features characteristic of GFAP could be observed, with obvious potential for rapid, in-ambulance diagnostic applications. Machine Learning data analysis was thus applied only to these 15 minute-incubation samples.
While visual inspection of the spectra for the 15-minute incubation samples with different GFAP concentrations showed some variations in peaks presence and relative intensities, these differences are difficult to quantify based on spectral simulation alone. To detect specific spectral patterns associated with a particular GFAP concentration, machine learning algorithms were employed to detect and classify differences between the three GFAP concentrations, at this shortest incubation time of 15 minutes.
3.4. Machine Learning Analysis of AgNSs bioconjugates with Plasma and GFAP
To evaluate the performance of the proposed methodology, the data set, made up of samples with multiple maps containing various spectra, was divided into training and test sets, as illustrated in Figure 2.. On part 3 of the SI (Table S2; Figures S5-S10), average SERS spectra and standard deviation plots are presented for each map obtained of Plasma@AgNS bioconjugates; GFAP@AgNS bioconjugates, and (Plasma+GFAP)@AgNS bioconjugates, the latter only for 15 minute incubation, as those are the conditions closer to PoC in-ambulance analysis of patient plasma. A control map was also included in the analysis, namely of the aluminium foil where samples were deposited for SERS measurement. Due to the limited number of samples, it was impractical to exclude entire samples for testing without compromising the model's training robustness. Instead, a statistical approach was adopted in which 10% of spectra from each map were randomly selected for testing, while the remaining 90% were used for training. This ensured that the test data remained representative of the overall dataset, while the training set maintained sufficient diversity. To further increase reliability, this training-test split was repeated 1000 times, with the test spectra shuffled in each iteration. After each split, the dataset was randomized to avoid clustering by spectral type. The final evaluation was based on the average performance of all iterations, providing a robust and unbiased assessment of the model's generalization capabilities. This method made effective use of the available data while maintaining statistical rigor.
After training the LightGBM Classifier, confusion matrixes are obtained for each of the 1000 splits of training and test data. An example of the resulting confusion matrix for one split is presented in Figure 5. A classification report is built and presented in Table 1, showing results for the proposed metrics, each value being the average of 1000 obtained values. Results for the testing data demonstrate strong performance of the Classifier, with an overall accuracy of 83%. The model excels in distinguishing the aluminium foil substrate and GFAP with AgNSs, achieving near-perfect precision and recall, which indicates high reliability in identifying this class. Most other classes also show solid results, with GFAP with Plasma 1 ng/mL achieving a precision of 0.92 and an F1-score of 0.84. However, Plasma shows slightly lower precision (0.72) with good recall (0.84), resulting in an F1-score of 0.78. The confusion matrix highlights that misclassifications primarily occur within the GFAP with Plasma classes, particularly between the 0.1 ng/mL, 0.5 ng/mL, and 1 ng/mL variants, as well as between plasma and other GFAP categories. These results suggest that while the model performs well overall, further improvements could be made by addressing these misclassifications. With future refinements, such as hyperparameter optimization and data augmentation, the model’s ability to predict classes with higher accuracy can be enhanced. In stroke prediction, precision is critical because false positives can result in misdiagnosis, unnecessary medical interventions, increased costs, and undue stress for patients. It becomes vastly dangerous if a hemorrhagic stroke patient is misdiagnosed as ischemic stroke, since its therapy enhances hemorrhage, which can even lead to patient death. A high precision ensures that predictions are trustworthy and minimizes the risks associated with incorrect positive diagnoses. This, in turn, could improve its generalization and reduce errors, which is promising for future applications, including the prediction of stroke nature: Ischemic Stroke (IS) and Intra-Cerebral Haemorrhage (ICH). As the model continues to evolve, it may become a valuable tool in early stroke detection, where distinguishing between various biomarkers and their concentration levels is critical for accurate diagnosis and timely intervention.
4. Conclusions
Characterization results of AgNS and their bioconjugates with plasma and GFAP, using SEM, AGE, DLS and SDS-PAGE, demonstrate that the synthesized AgNSs possess the needed structural features and stability required for efficient SERS analysis. The rapid formation of a protein corona upon exposure to human plasma, highlights the suitability of these AgNSs as sensitive probes, deposited on a low-cost aluminum foil substrate for SERS-based diagnostic assays.
To detect specific spectral patterns associated with a particular GFAP concentration, machine learning algorithms were employed to detect and classify differences between the three GFAP concentrations, at this shortest incubation time of 15 minutes. This approach holds significant promise for point-of-care diagnostics, as it enables rapid analysis and early-stage discrimination of GFAP levels with minimal incubation. Such rapid diagnostic capability is critical in stroke management, as faster biomarker detection can directly inform treatment strategies, particularly in pre-hospital or emergency settings.
Once a transformer (fitted PCA) is determined and the classifier is trained, a Point of Care (PoC) can be built and used to rapidly evaluate a SERS spectrum from a patient and classify stroke type. This PoC can be integrated into portable devices for clinical use, enabling real-time analysis and facilitating medical decision-making in emergency scenarios. In addition, the implementation of PoC promotes greater efficiency in diagnosis, reducing the time between analysis and treatment, especially in critical care environments.
Supplementary Materials
The following supporting information can be downloaded at the website of this paper posted on Preprints.org, Figure S1. Agarose Gel Electrophoresis of Plasma@AgNS bioconjugates at varying plasma to AgNS molar ratios.; Table S1. DLS determination of Z-average and standard deviations of hydrodynamic diameters of AgNS alone and Plasma(+GFAP)@AgNS Bioconjugates at three different incubation times.; Figure S2. Bar graph representation of Table S1; Figure S3. SDS-PAGE of (Plasma)@AgNS and (Plasma+GFAP)@AgNS bioconjugates prepared with increasing incubation times (15 min, 3h, and overnight).; Figure S4. SERS spectra of plasma samples mixed with AgNS and varying concentration of GFAP (0.1 ng/mL, 0.5 ng/mL, and 1 ng/mL) after 3 h or overnight incubation.; Figure S5-S10. Plots of averaged SERS spectra and standard deviations for each SERS map.
Author Contributions
Conceptualization, R.F., H.L.A.V., E.P.; methodology, R.F., E.P., G.S., J.E., L.S., and D.N.; software, G.S., J.E. and L.S.; formal analysis, C.F., G.S., J.E. ,L.S., and R.F.; investigation, C.F., M.E., D.N., G.S., J.E., L.S. and R.F.; resources, H.A., ., E.F., R.M., E.P., H.L.A.V., L.S., and R.F.; data curation, C.F., G.S., J.E., L.S., and R.F; writing—original draft preparation, C.F., G.S., and R.F.; writing—review and editing, R.F., E.P., M.E., H.A., E.F., R.M., H.L.A.V., G.S., J.E., and L.S..; visualization, C.F., G.S., J.E., D.N., L.S., and R.F.; supervision, R.F., H.L.A.V., E.P., G.S., and L.S.; funding acquisition, R.F., E.P., H.L.A.V., H.A., E.F., R.M., and L.S. All authors have read and agreed to the published version of the manuscript.
Funding
This research was funded by Portuguese funds from Fundação para a Ciência e a Tecnologia, I.P., in the scope of projects UIDB/04111/2020 of COPELABS; UIDP/04378/2020, and UIDB/04378/2020 of UCIBIO, UIDB/50006/2020 and UIDP/50006/2020 of LAQV and LA/P/0140/2020 of the Associate Laboratory Institute for Health and Bioeconomy- i4HB and LA/P/0037/2020, UIDP/50025/2020 and UIDB/50025/2020 of the Associate Laboratory Institute of Nanostructures, Nanomodelling and Nanofabrication—i3N. M.E. acknowledges LAQV for her Post-Doc grant ref. REQUIMTE 2022-06.
Data Availability Statement
The data used in the present research is publicly available in the following link: https://github.com/deisi-r-d/sers-repo.
Acknowledgments
Raquel Carvalho, Biochemistry Undergraduate at Faculdade de Ciências e Tecnologia, Universidade NOVA de Lisboa (Caparica, Portugal), is acknowledged for her experimental execution in the presented work. Prof. Carlos Lodeiro and MSc. Frederico Duarte from LAQV/REQUIMTE (Caparica, Portugal), are acknowledged for their assistance on using Malvern Zetasizer Nano series.
Conflicts of Interest
The authors declare no conflicts of interest.
References
- D. Hovsepian e S. Karceski, «Stroke, tPA, and physician decision-making», Neurology, vol. 81, n.o 13, set. 2013. [CrossRef]
- «About Stroke», www.stroke.org. Acedido: 13 de novembro de 2024. [Online]. Disponível em: https://www.stroke.org/en/about-stroke.
- R. G. Kowalski et al., «Rapid Activation of Neuroinflammation in Stroke: Plasma and Extracellular Vesicles Obtained on a Mobile Stroke Unit», Stroke, vol. 54, n.o 3, mar. 2023. [CrossRef]
- The GBD 2016 Lifetime Risk of Stroke Collaborators, «Global, Regional, and Country-Specific Lifetime Risks of Stroke, 1990 and 2016», N. Engl. J. Med., vol. 379, n.o 25, pp. 2429–2437, dez. 2018. [CrossRef]
- A. Lekoubou, C. Nguyen, M. Kwon, A. D. Nyalundja, e A. Agrawal, «Post-stroke Everything», Curr. Neurol. Neurosci. Rep., vol. 23, n.o 11, pp. 785–800, nov. 2023. [CrossRef]
- F. Shehjar et al., «Stroke: Molecular mechanisms and therapies: Update on recent developments», Neurochem. Int., vol. 162, p. 105458, jan. 2023. [CrossRef]
- L. Di Biase, A. Bonura, P. M. Pecoraro, S. P. Carbone, e V. Di Lazzaro, «Unlocking the Potential of Stroke Blood Biomarkers: Early Diagnosis, Ischemic vs. Haemorrhagic Differentiation and Haemorrhagic Transformation Risk: A Comprehensive Review», Int. J. Mol. Sci., vol. 24, n.o 14, p. 11545, jul. 2023. [CrossRef]
- A. Risitano e D. Toni, «Time is brain: timing of revascularization of brain arteries in stroke», Eur. Heart J. Suppl., vol. 22, n.o Supplement_L, pp. L155–L159, nov. 2020. [CrossRef]
- J. L. Saver, «Time Is Brain—Quantified», Stroke, vol. 37, n.o 1, pp. 263–266, jan. 2006. [CrossRef]
- GBD 2019 Stroke Collaborators, «Global, regional, and national burden of stroke and its risk factors, 1990-2019: a systematic analysis for the Global Burden of Disease Study 2019», Lancet Neurol., vol. 20, n.o 10, pp. 795–820, out. 2021. [CrossRef]
- C. Qin et al., «Proteomic profiling of plasma biomarkers in acute ischemic stroke due to large vessel occlusion», J. Transl. Med., vol. 17, n.o 1, p. 214, dez. 2019. [CrossRef]
- D. R. Parachalil, J. McIntyre, e H. J. Byrne, «Potential of Raman spectroscopy for the analysis of plasma/serum in the liquid state: recent advances», Anal. Bioanal. Chem., vol. 412, n.o 9, pp. 1993–2007, abr. 2020. [CrossRef]
- W. G. Balogun, H. Zetterberg, K. Blennow, e T. K. Karikari, «Plasma biomarkers for neurodegenerative disorders: ready for prime time?», Curr. Opin. Psychiatry, vol. 36, n.o 2, pp. 112–118, mar. 2023. [CrossRef]
- R. Beeram, K. R. Vepa, e V. R. Soma, «Recent Trends in SERS-Based Plasmonic Sensors for Disease Diagnostics, Biomolecules Detection, and Machine Learning Techniques», Biosensors, vol. 13, n.o 3, p. 328, fev. 2023. [CrossRef]
- A. Bonifacio et al., «Surface-enhanced Raman spectroscopy of blood plasma and serum using Ag and Au nanoparticles: a systematic study», Anal. Bioanal. Chem., vol. 406, n.o 9–10, pp. 2355–2365, abr. 2014. [CrossRef]
- S. K. Das, T. S. Bhattacharya, M. Ghosh, e J. Chowdhury, «Probing blood plasma samples for the detection of diabetes using SERS aided by PCA and LDA multivariate data analyses», New J. Chem., vol. 45, n.o 5, pp. 2670–2682, 2021. [CrossRef]
- J. P. Marto et al., «Proteomics to Identify New Blood Biomarkers for Diagnosing Patients With Acute Stroke», J. Am. Heart Assoc., vol. 12, n.o 22, p. e030021, nov. 2023. [CrossRef]
- C. Foerch, «Serum glial fibrillary acidic protein as a biomarker for intracerebral haemorrhage in patients with acute stroke», J. Neurol. Neurosurg. Psychiatry, vol. 77, n.o 2, pp. 181–184, fev. 2006. [CrossRef]
- L. Vázquez-Iglesias et al., «SERS sensing for cancer biomarker: Approaches and directions», Bioact. Mater., vol. 34, pp. 248–268, abr. 2024. [CrossRef]
- R. Xiao et al., «Non-invasive detection of hepatocellular carcinoma serum metabolic profile through surface-enhanced Raman spectroscopy», Nanomedicine Nanotechnol. Biol. Med., vol. 12, n.o 8, pp. 2475–2484, nov. 2016. [CrossRef]
- O. S. Mattila et al., «Ultra-Early Differential Diagnosis of Acute Cerebral Ischemia and Hemorrhagic Stroke by Measuring the Prehospital Release Rate of GFAP», Clin. Chem., vol. 67, n.o 10, pp. 1361–1372, out. 2021. [CrossRef]
- L. Long, W. Ju, H.-Y. Yang, e Z. Li, «Dimensional Design for Surface-Enhanced Raman Spectroscopy», ACS Mater. Au, vol. 2, n.o 5, pp. 552–575, set. 2022. [CrossRef]
- P. L. Stiles, J. A. Dieringer, N. C. Shah, e R. P. Van Duyne, «Surface-Enhanced Raman Spectroscopy», Annu. Rev. Anal. Chem., vol. 1, n.o 1, pp. 601–626, jul. 2008. [CrossRef]
- D. M. Solís, J. M. Taboada, F. Obelleiro, L. M. Liz-Marzán, e F. J. García De Abajo, «Optimization of Nanoparticle-Based SERS Substrates through Large-Scale Realistic Simulations», ACS Photonics, vol. 4, n.o 2, pp. 329–337, fev. 2017. [CrossRef]
- A. Araújo et al., «Highly efficient nanoplasmonic SERS on cardboard packaging substrates», Nanotechnology, vol. 25, n.o 41, p. 415202, out. 2014. [CrossRef]
- M. P. De Almeida et al., «Silver Nanostar-Based SERS for the Discrimination of Clinically Relevant Acinetobacter baumannii and Klebsiella pneumoniae Species and Clones», Biosensors, vol. 13, n.o 2, p. 149, jan. 2023. [CrossRef]
- M. P. De Almeida, N. Leopold, R. Franco, e E. Pereira, «Expedite SERS Fingerprinting of Portuguese White Wines Using Plasmonic Silver Nanostars», Front. Chem., vol. 7, p. 368, mai. 2019. [CrossRef]
- A. Garcia-Leis, J. V. Garcia-Ramos, e S. Sanchez-Cortes, «Silver Nanostars with High SERS Performance», J. Phys. Chem. C, vol. 117, n.o 15, pp. 7791–7795, abr. 2013. [CrossRef]
- L. Rodríguez-Lorenzo, R. A. Álvarez-Puebla, F. J. G. De Abajo, e L. M. Liz-Marzán, «Surface Enhanced Raman Scattering Using Star-Shaped Gold Colloidal Nanoparticles», J. Phys. Chem. C, vol. 114, n.o 16, pp. 7336–7340, abr. 2010. [CrossRef]
- S. Tripathy, S. Chavva, G. L. Coté, e S. Mabbott, «Modular and handheld Raman systems for SERS-based point-of-care diagnostics», Curr. Opin. Biomed. Eng., vol. 28, p. 100488, dez. 2023. [CrossRef]
- T. Moisoiu et al., «SERS Liquid Biopsy Profiling of Serum for the Diagnosis of Kidney Cancer», Biomedicines, vol. 10, n.o 2, p. 233, jan. 2022. [CrossRef]
- L. Cui et al., «Deep Learning in Ischemic Stroke Imaging Analysis: A Comprehensive Review», BioMed Res. Int., vol. 2022, pp. 1–15, nov. 2022. [CrossRef]
- S. D. Iancu et al., «SERS liquid biopsy in breast cancer. What can we learn from SERS on serum and urine?», Spectrochim. Acta. A. Mol. Biomol. Spectrosc., vol. 273, p. 120992, mai. 2022. [CrossRef]
- P. K. Smith et al., «Measurement of protein using bicinchoninic acid», Anal. Biochem., vol. 150, n.o 1, pp. 76–85, out. 1985. [CrossRef]
- M. Leeman, J. Choi, S. Hansson, M. U. Storm, e L. Nilsson, «Proteins and antibodies in serum, plasma, and whole blood—size characterization using asymmetrical flow field-flow fractionation (AF4)», Anal. Bioanal. Chem., vol. 410, n.o 20, pp. 4867–4873, 2018. [CrossRef]
- C. J. Jolliffe IT, «Principal component analysis: a review and recent developments». Acedido: 20 de dezembro de 2024. [Online]. Disponível em: http://dx.doi.org/10.1098/rsta.2015.0202. [CrossRef]
- G. Ke et al., «LightGBM: A Highly Efficient Gradient Boosting Decision Tree», Adv Neural Inf Process Syst. [CrossRef]
- M. Heydarian, T. E. Doyle, e R. Samavi, «MLCM: Multi-Label Confusion Matrix», IEEE Access, vol. 10, pp. 19083–19095, 2022. [CrossRef]
- B. J. Erickson e F. Kitamura, «Magician’s Corner: 9. Performance Metrics for Machine Learning Models», Radiol. Artif. Intell., vol. 3, n.o 3, p. e200126, mai. 2021. [CrossRef]
- R. Franco e E. Pereira, «Gold Nanoparticles and Proteins, Interaction», em Encyclopedia of Metalloproteins, R. H. Kretsinger, V. N. Uversky, e E. A. Permyakov, Eds., New York, NY: Springer, 2013, pp. 908–915. [CrossRef]
- S. P. Boulos et al., «Nanoparticle–Protein Interactions: A Thermodynamic and Kinetic Study of the Adsorption of Bovine Serum Albumin to Gold Nanoparticle Surfaces», Langmuir, vol. 29, n.o 48, pp. 14984–14996, dez. 2013. [CrossRef]
- I. Lynch e K. A. Dawson, «Protein-nanoparticle interactions», Nano Today, vol. 3, n.o 1, pp. 40–47, fev. 2008. [CrossRef]
- S. Gallagher e J. Sasse, «Protein analysis by SDS-PAGE and detection by Coomassie blue or silver staining», Curr. Protoc. Pharmacol., vol. Appendix 3, p. 3B, mai. 2001. [CrossRef]
Figure 1.
Schematic representation of a stroke diagnostic workflow using surface-enhanced Raman spectroscopy (SERS) and artificial intelligence (AI). Blood plasma is collected from a patient suspected of stroke. Plasma is mixed with silver nanostars (AgNSs) to generate SERS spectra. Thousands of these SERS spectra are analyzed, and a Machine Learning Classifier can help to provide a diagnosis of stroke. Created in Biorender.com.
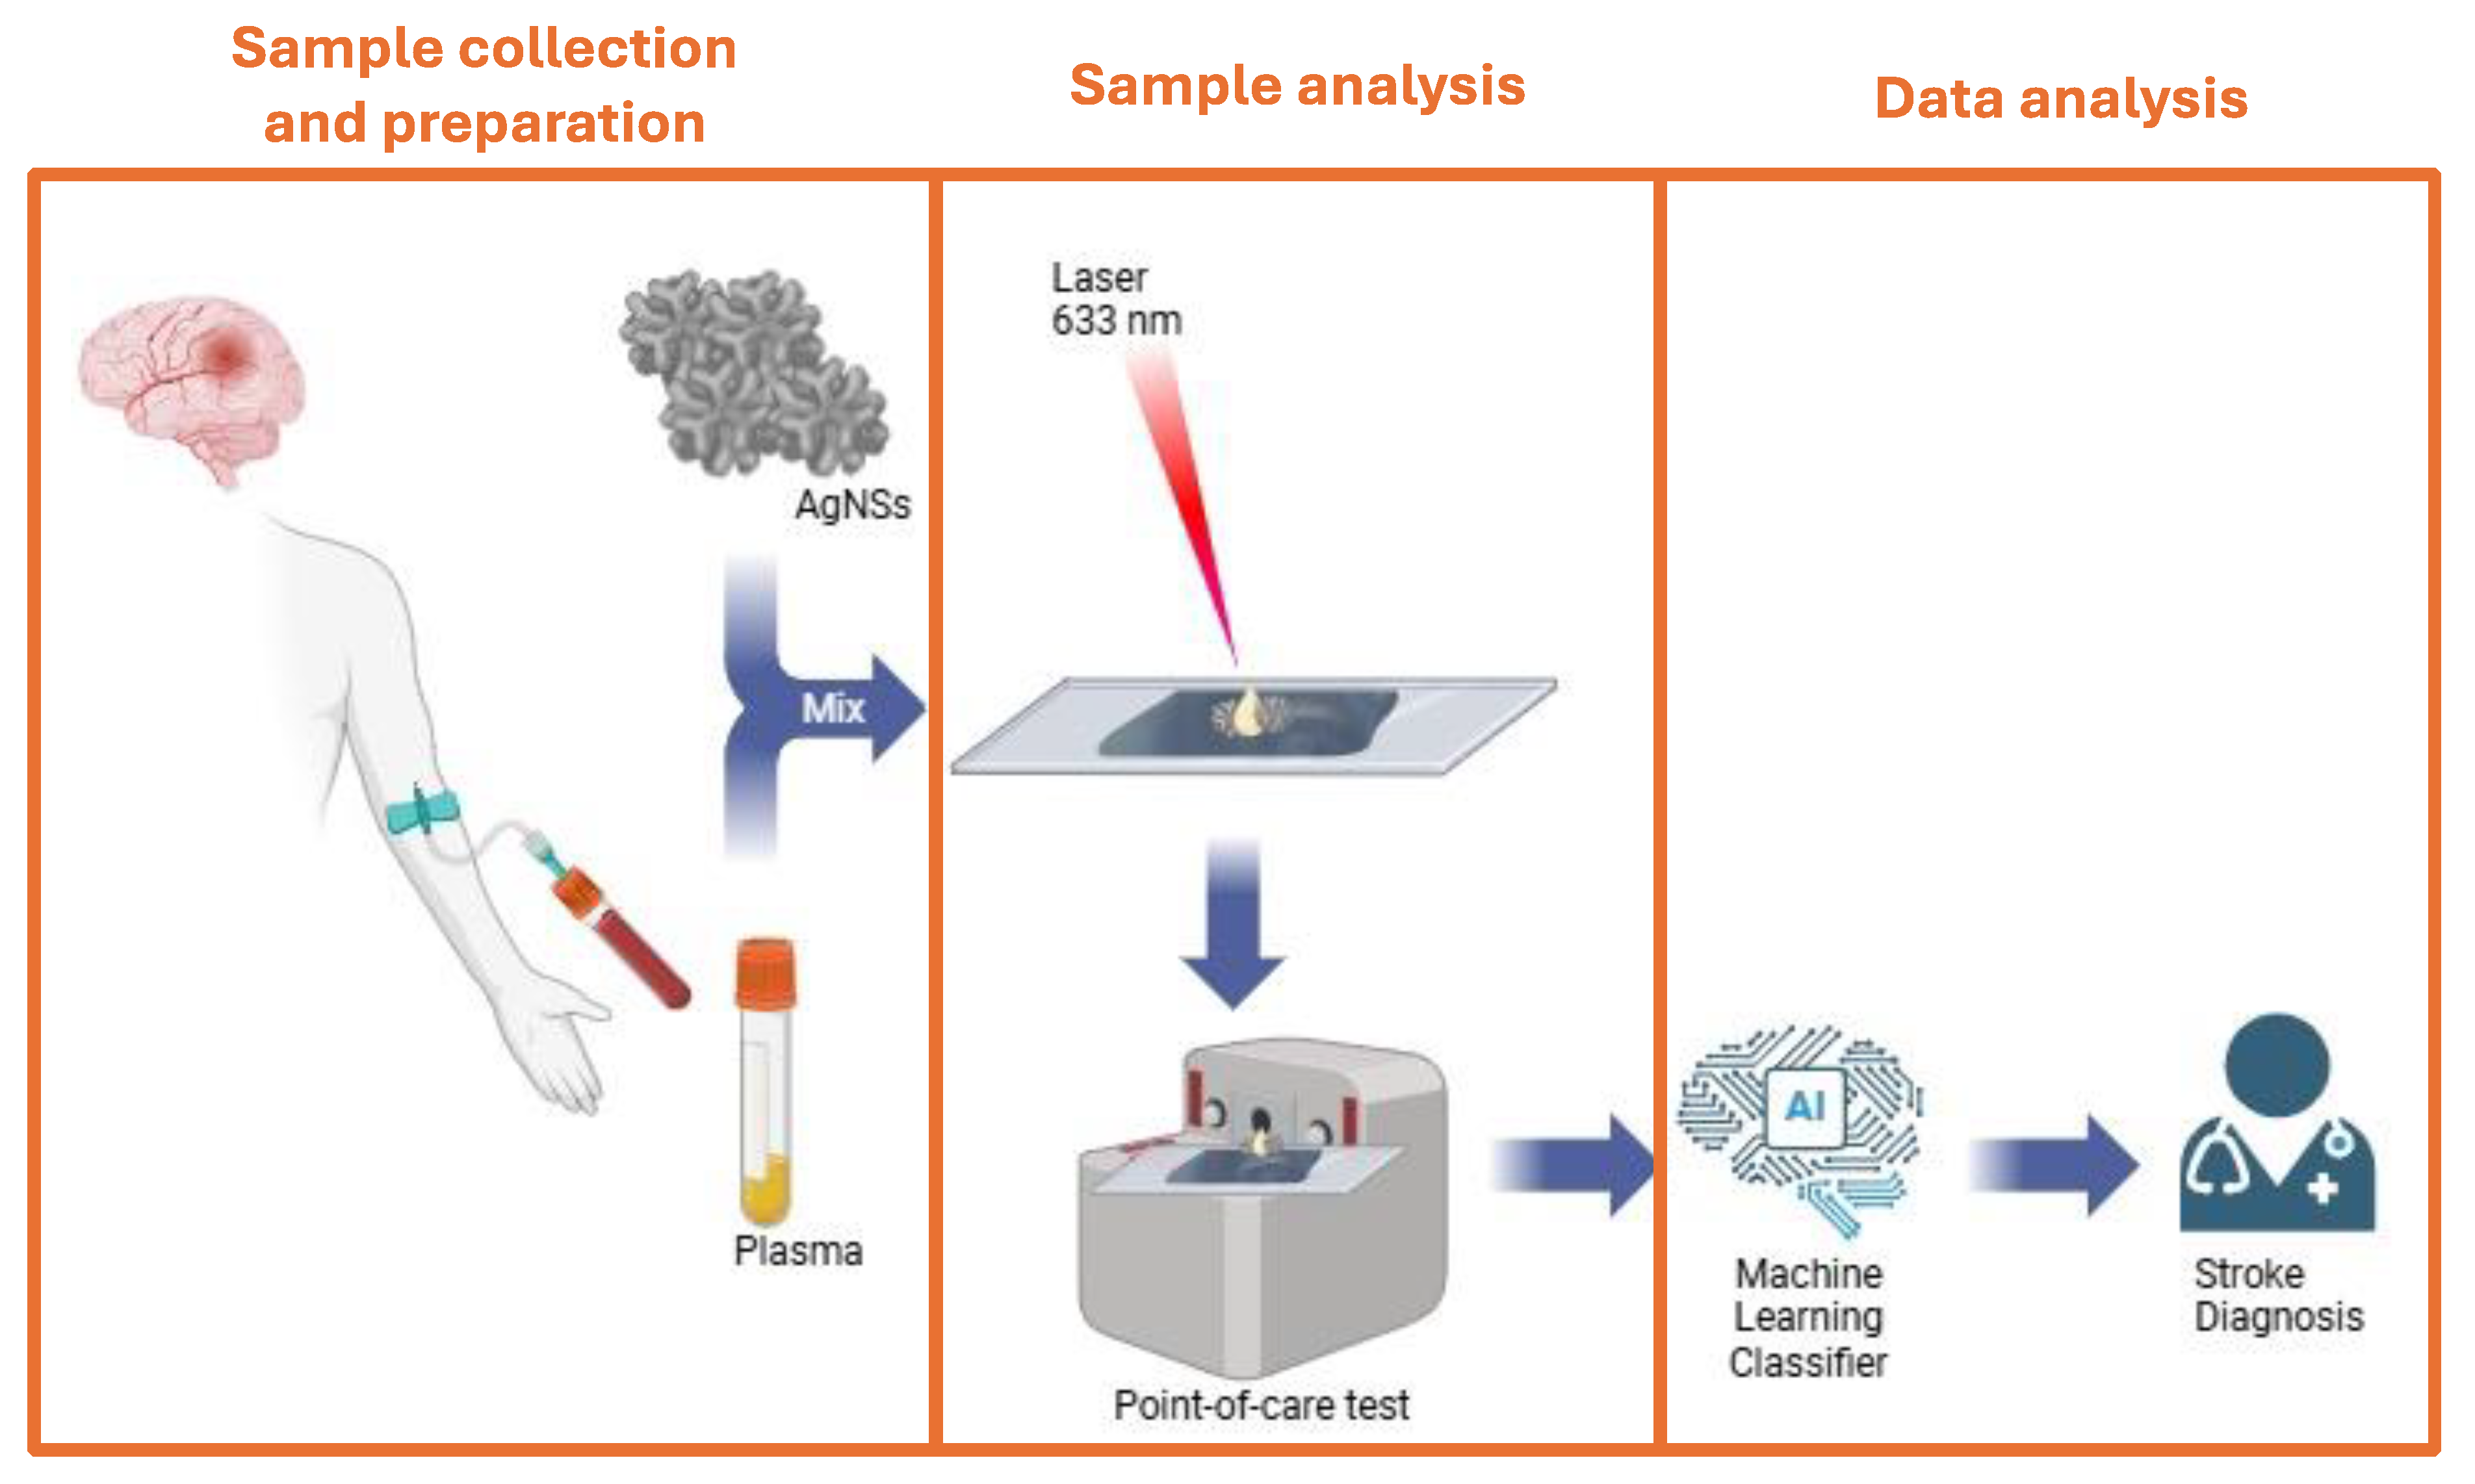
Figure 2.
Workflow to classify SERS spectra of bioconjugates of AgNS with plasma.
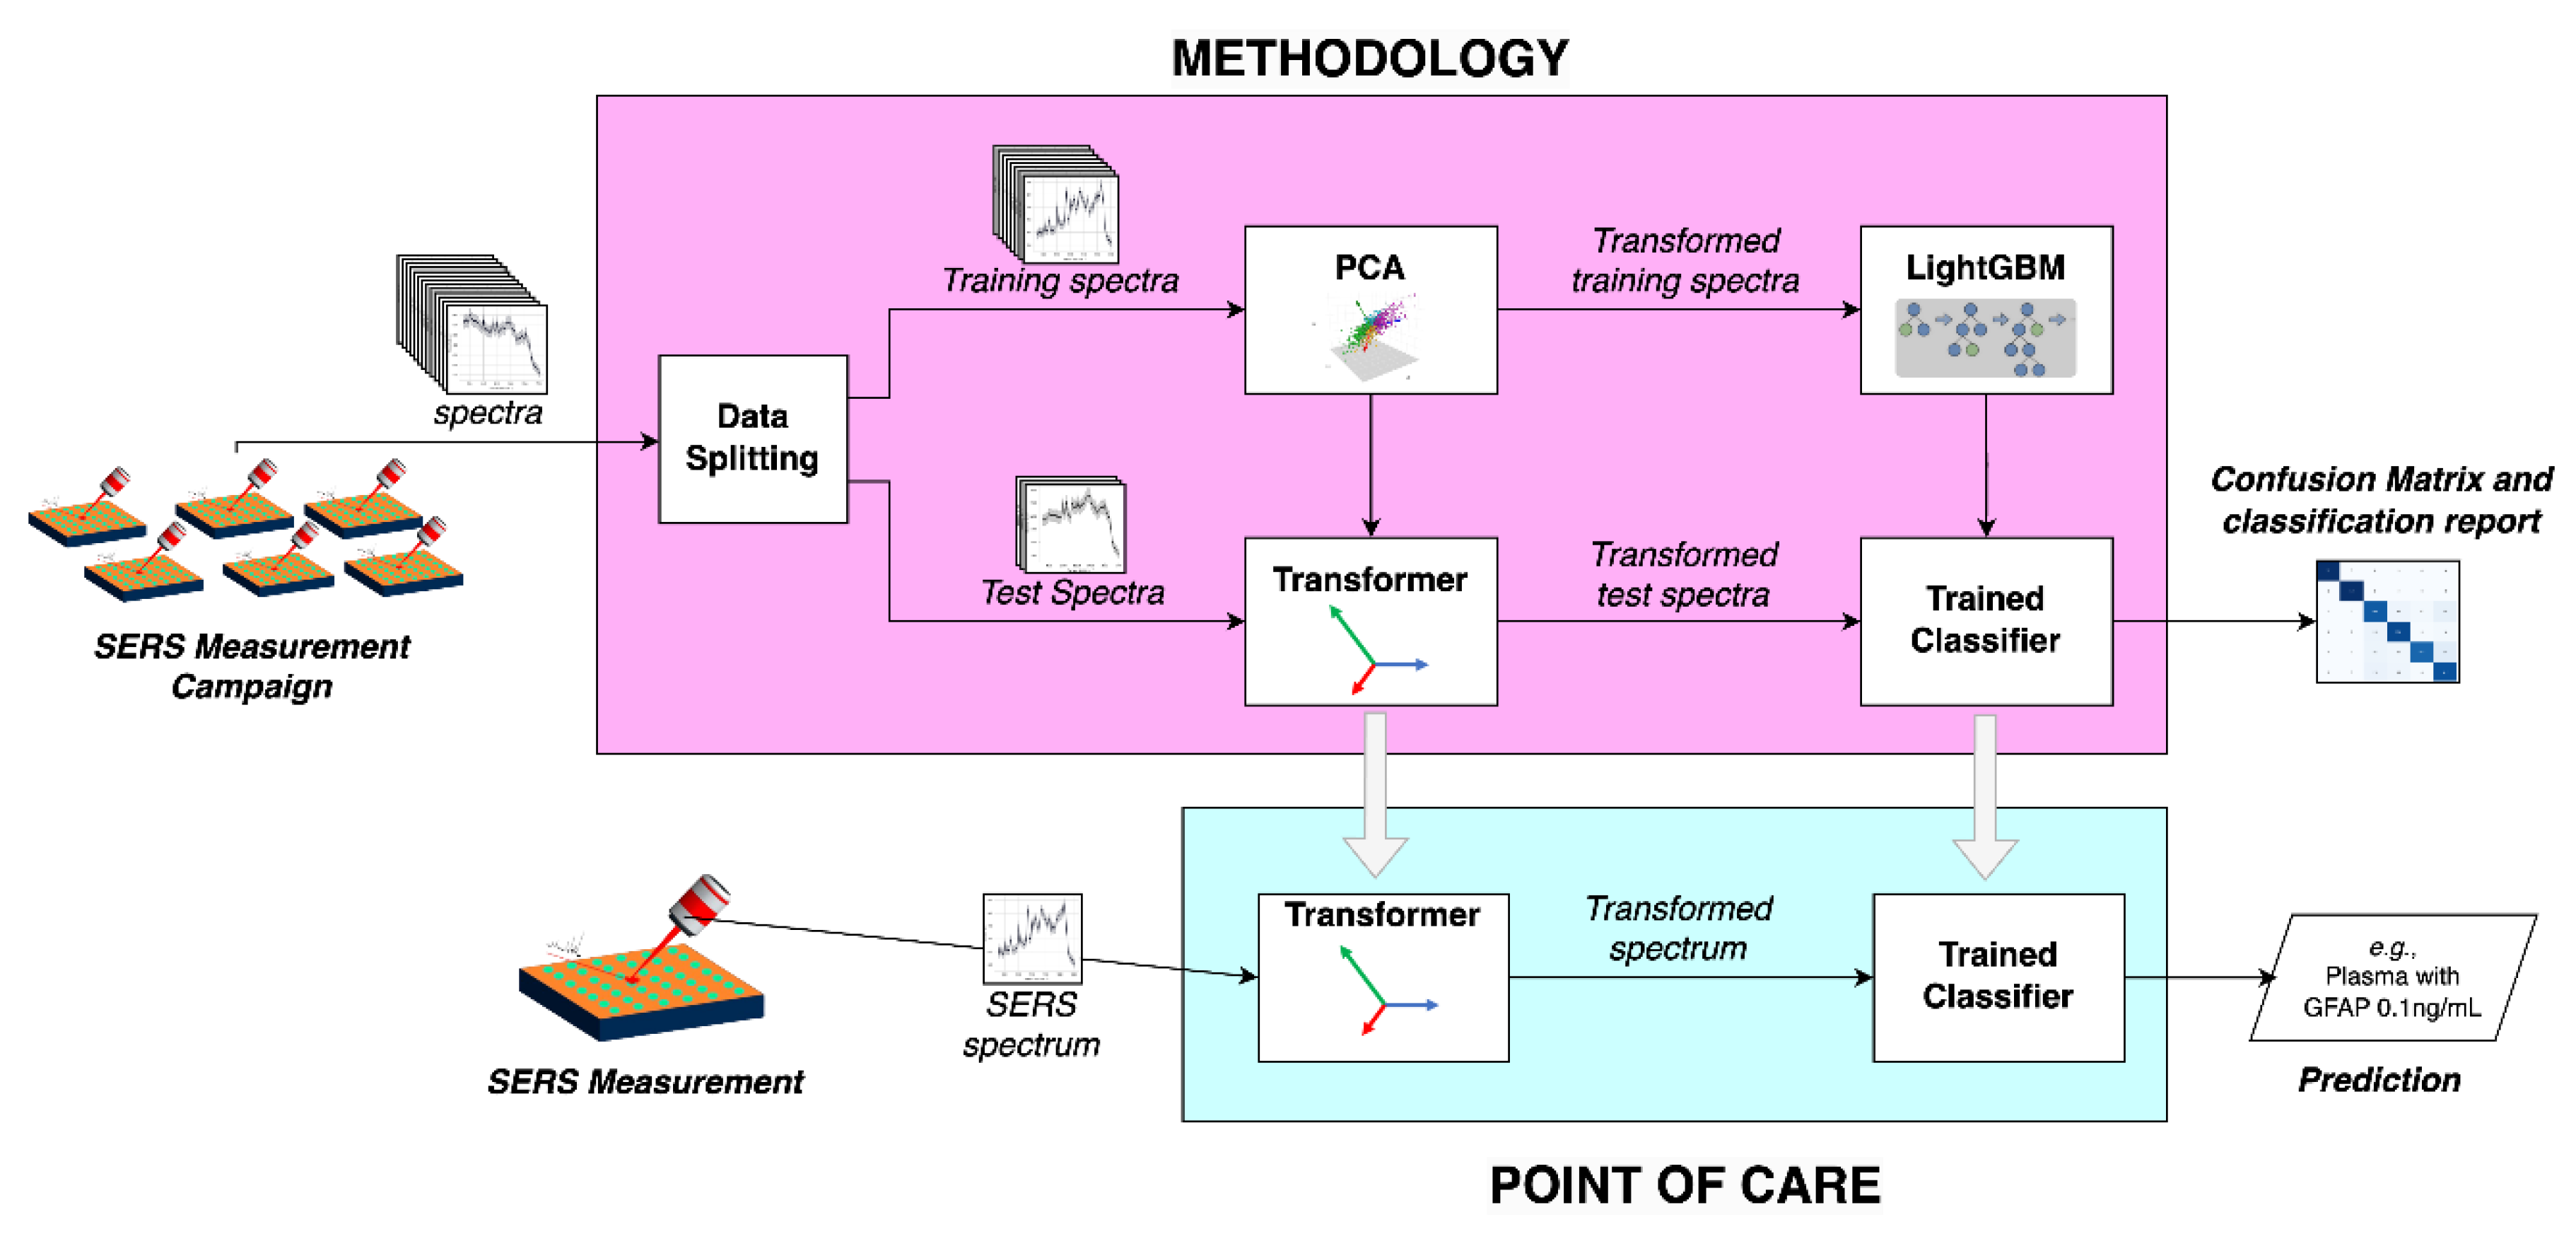
Figure 3.
Scanning electron microscopy (SEM) representative micrographs, illustrating the morphological characteristics of native AgNSs, or plasma-AgNS bioconjugates. A. AgNS in their native form. B. AgNS conjugated with plasma following 15 min of incubation. C. AgNS conjugated with plasma after overnight incubation.
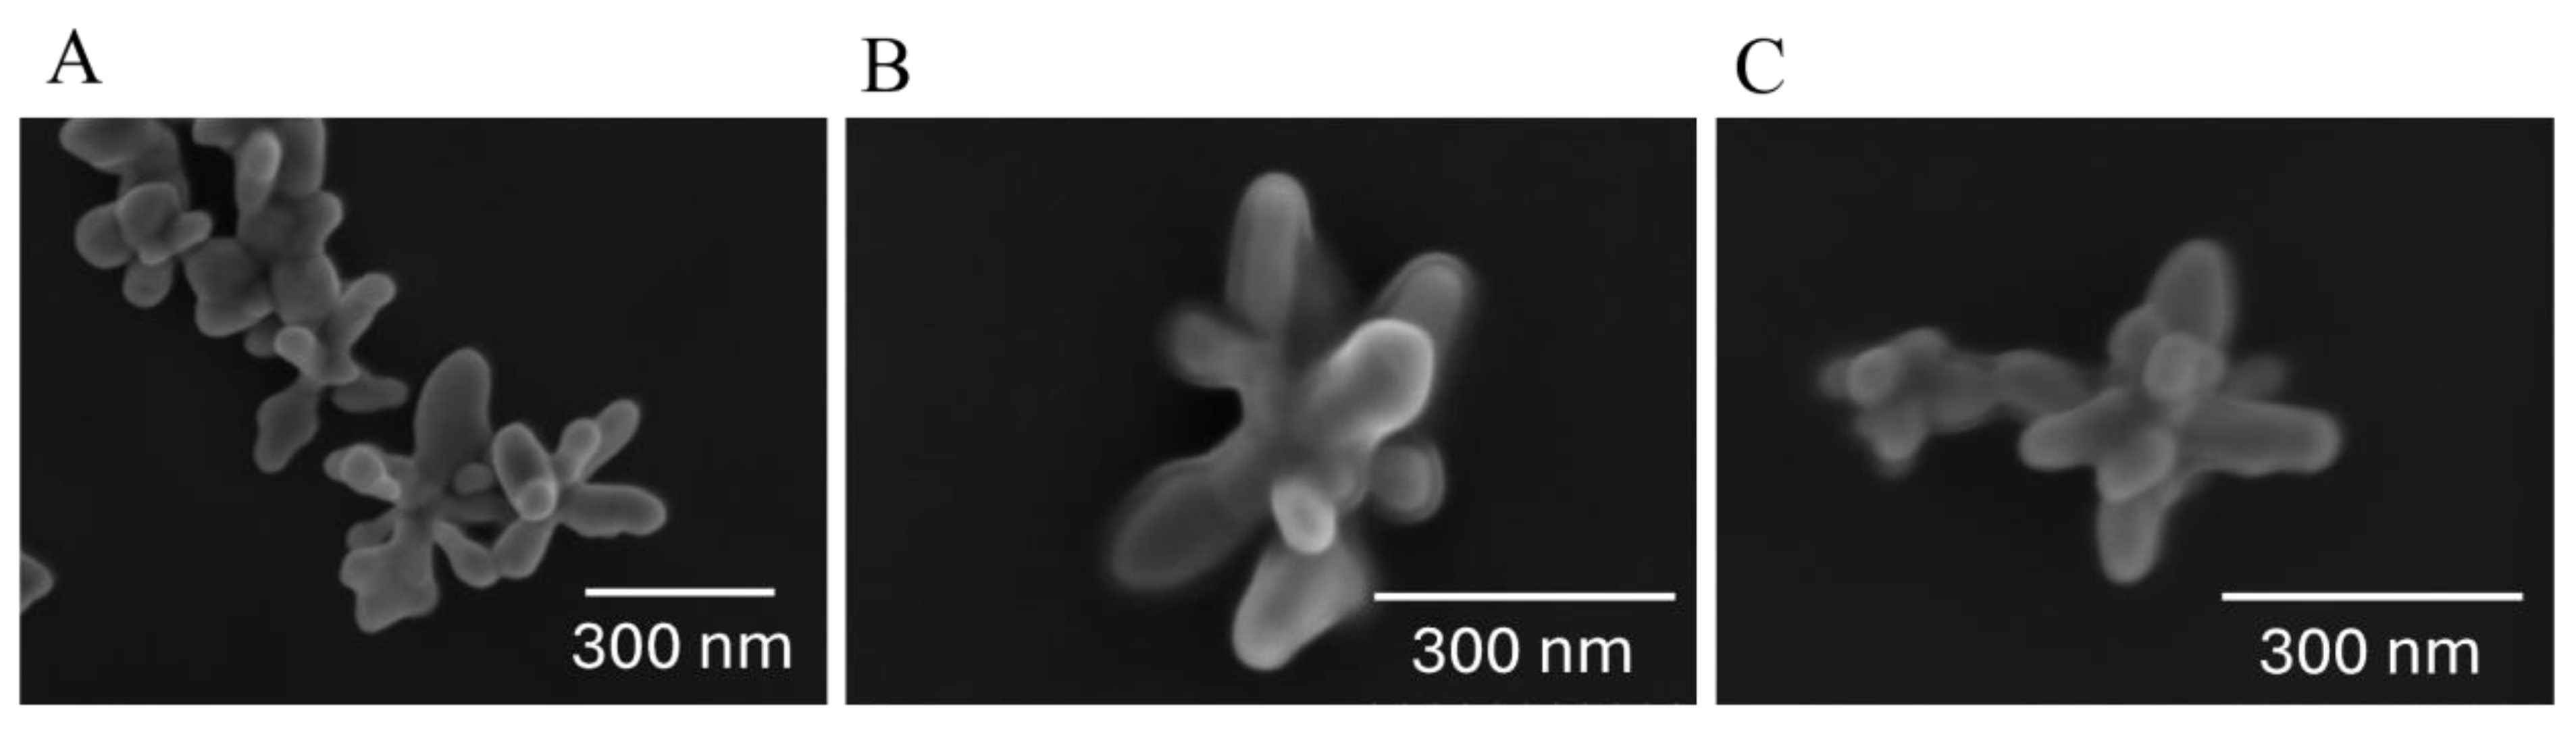
Figure 4.
SERS spectra of plasma samples mixed with AgNS and varying concentration of GFAP (0.1 ng/mL, 0.5 ng/mL, and 1 ng/mL) after 15 min of incubation. The spectrum of plasma without GFAP is shown for comparison.
Figure 4.
SERS spectra of plasma samples mixed with AgNS and varying concentration of GFAP (0.1 ng/mL, 0.5 ng/mL, and 1 ng/mL) after 15 min of incubation. The spectrum of plasma without GFAP is shown for comparison.
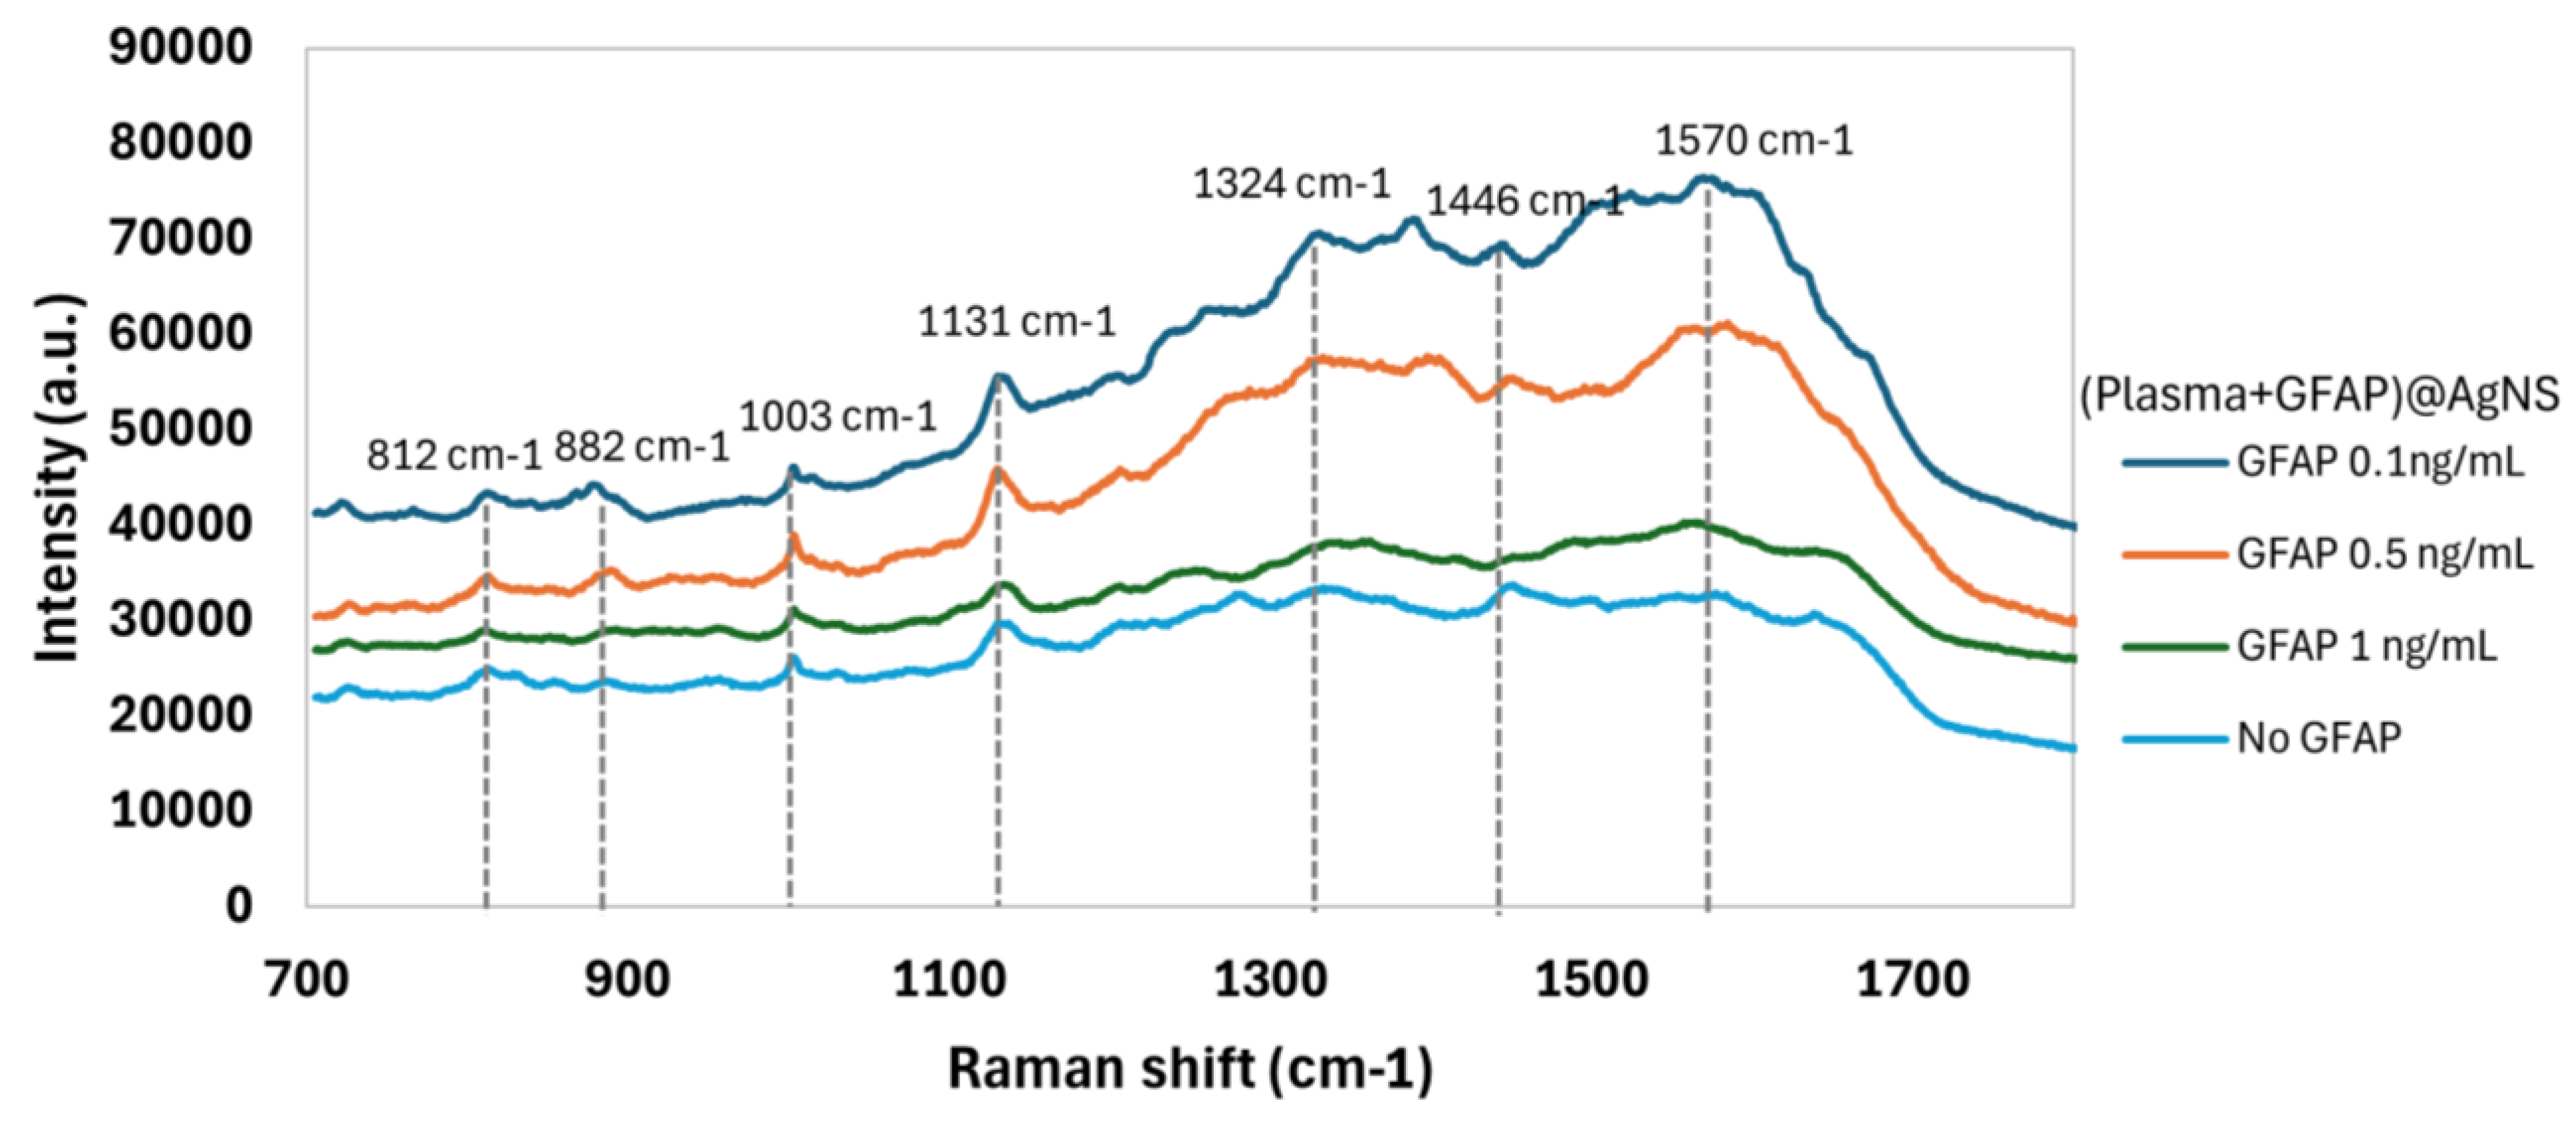
Figure 5.
Confusion matrix for one of the testing data sets.
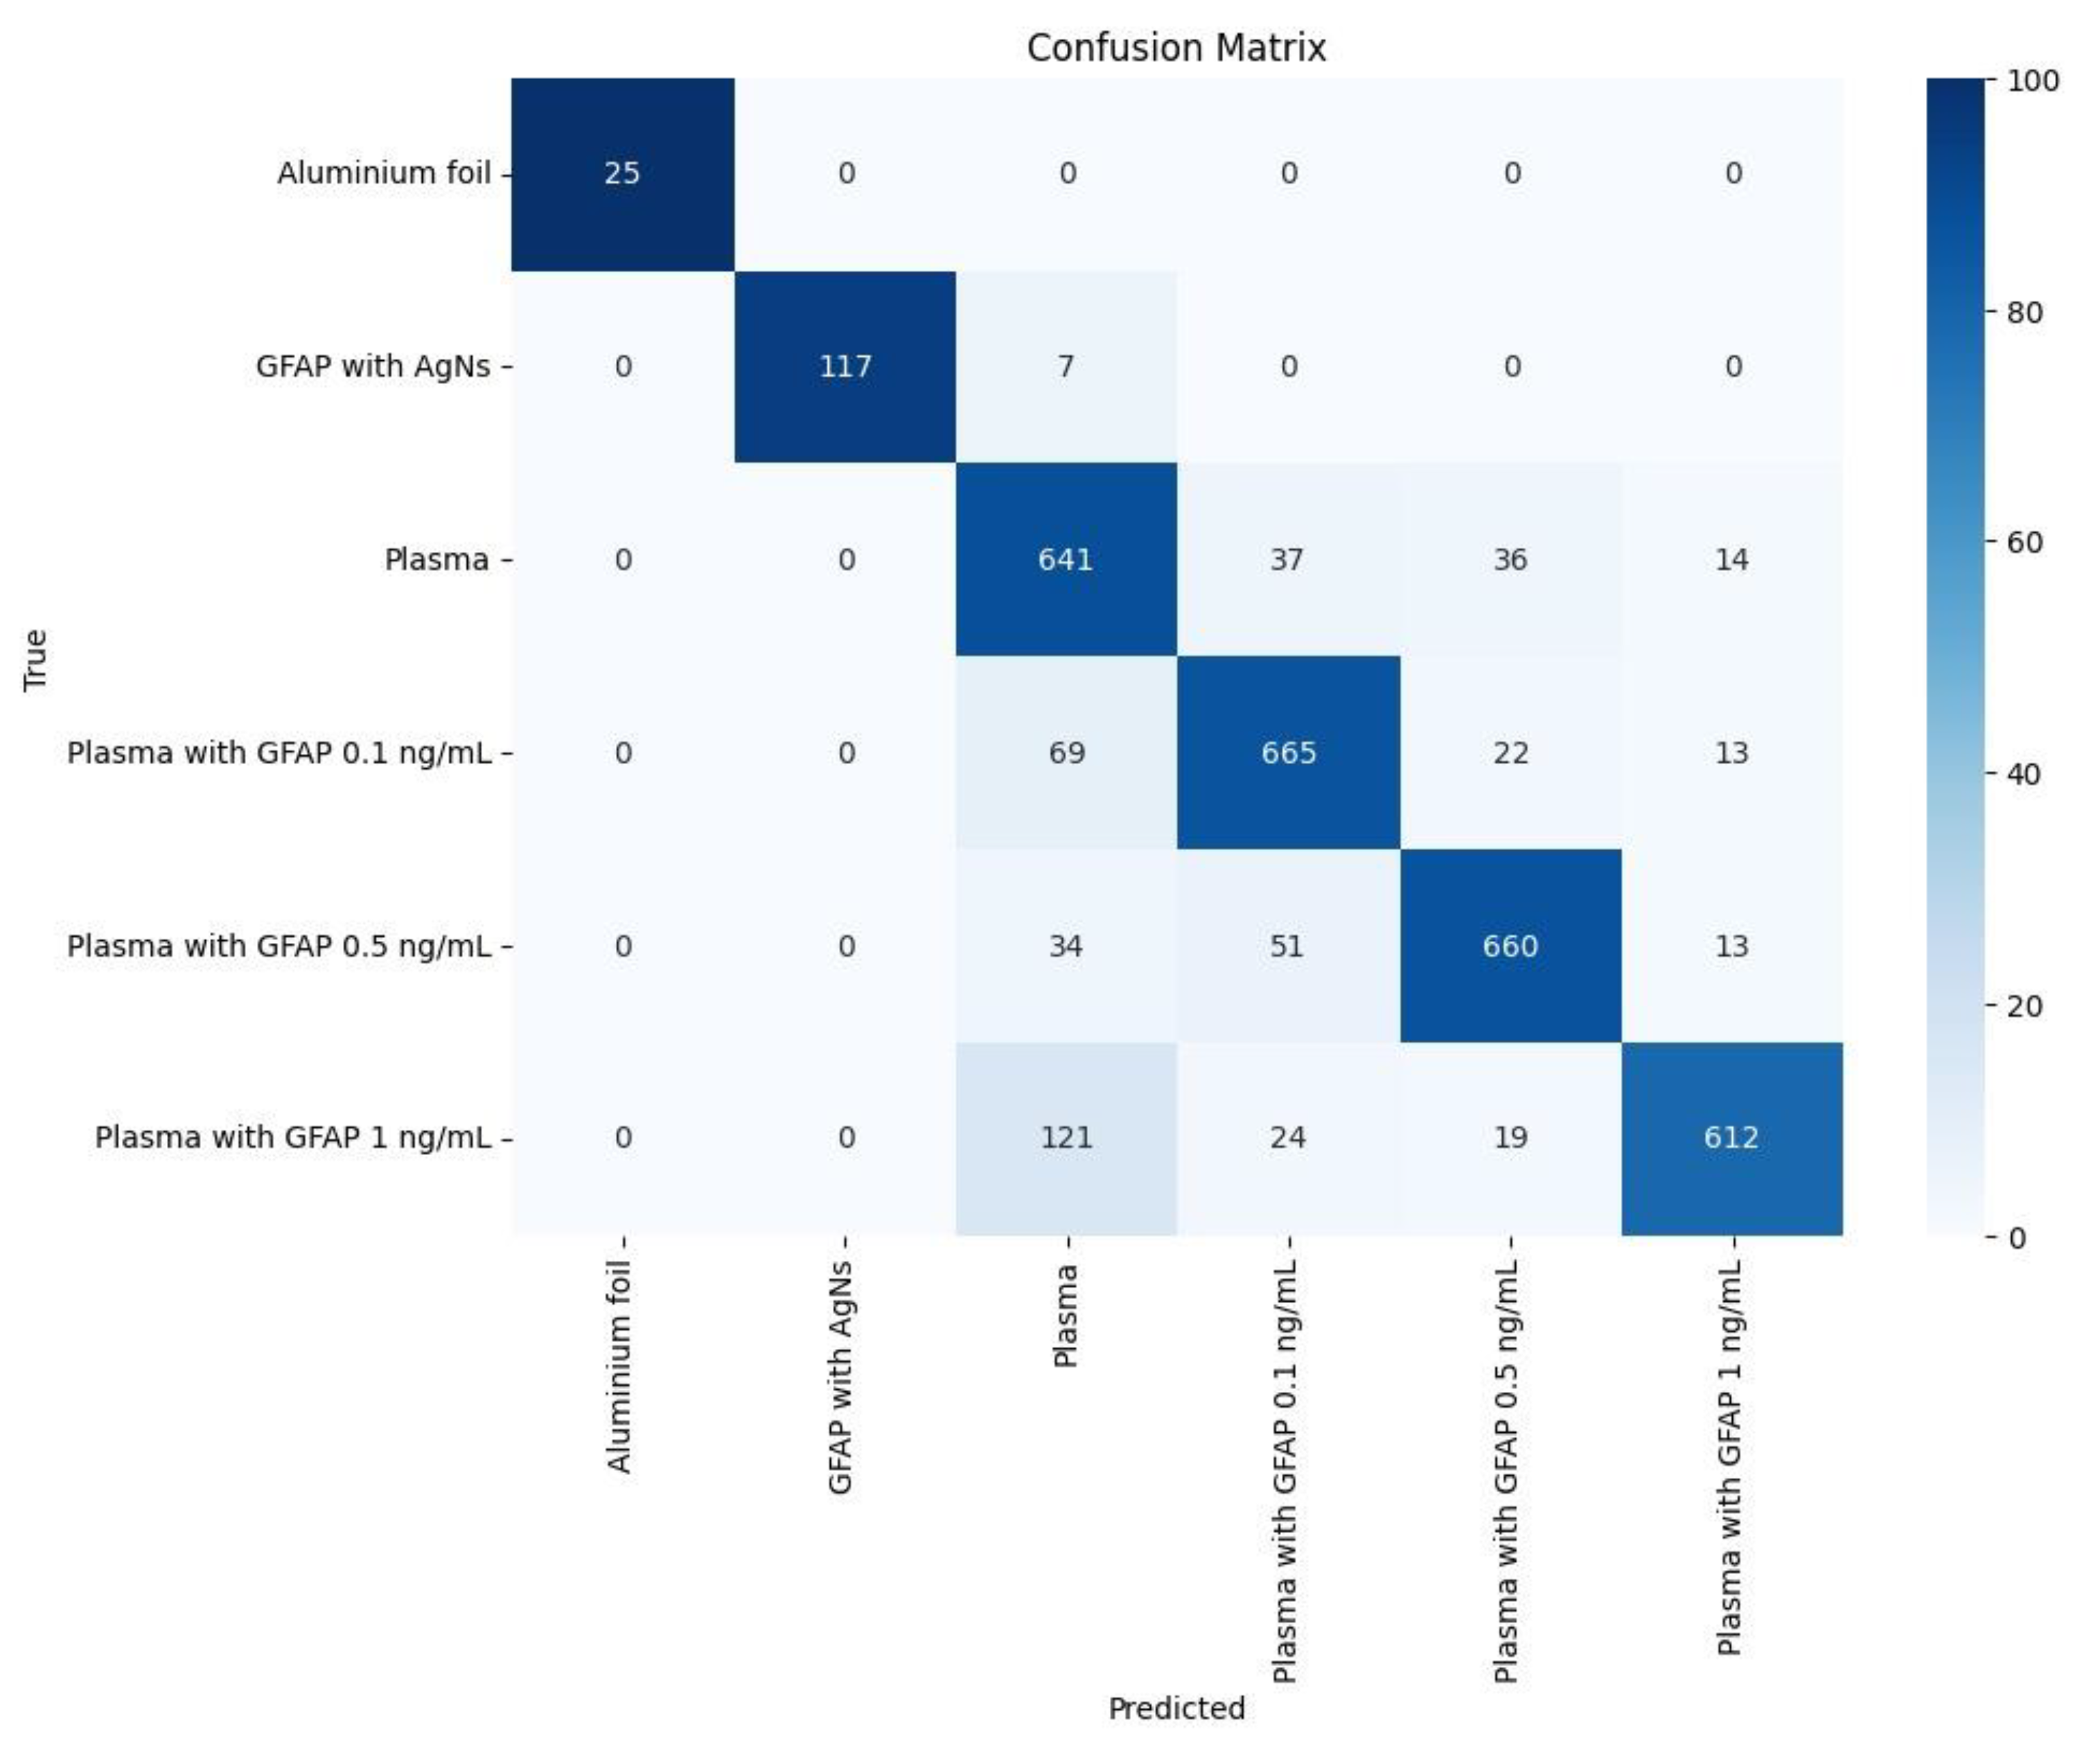

Table 1.
LGBM classification report.
| Sample Type | Precision | Recall | F1-Score | Support |
| Aluminium foil | 1.00 | 0.98 | 0.99 | 25 |
| GFAP with AgNS | 0.99 | 0.98 | 0.98 | 124 |
| Plasma | 0.72 | 0.84 | 0.78 | 728 |
| Plasma with GFAP 0.1ng/mL | 0.82 | 0.84 | 0.83 | 769 |
| Plasma with GFAP 0.5ng/mL | 0.87 | 0.85 | 0.86 | 758 |
| Plasma with GFAP 1ng/mL | 0.92 | 0.77 | 0.84 | 776 |
| Accuracy | 0.83 | 3180 | ||
| Macro Avg | 0.89 | 0.88 | 0.88 | 3180 |
| Weighted Avg | 0.84 | 0.83 | 0.83 | 3180 |
Disclaimer/Publisher’s Note: The statements, opinions and data contained in all publications are solely those of the individual author(s) and contributor(s) and not of MDPI and/or the editor(s). MDPI and/or the editor(s) disclaim responsibility for any injury to people or property resulting from any ideas, methods, instructions or products referred to in the content. |
© 2025 by the authors. Licensee MDPI, Basel, Switzerland. This article is an open access article distributed under the terms and conditions of the Creative Commons Attribution (CC BY) license (http://creativecommons.org/licenses/by/4.0/).
Copyright: This open access article is published under a Creative Commons CC BY 4.0 license, which permit the free download, distribution, and reuse, provided that the author and preprint are cited in any reuse.


