
Submitted:
01 January 2025
Posted:
02 January 2025
You are already at the latest version
Abstract
The Coffea canephora species has been gaining prominence in national coffee production due to its high productive potential, adaptability, and beverage quality potential. Productive genotypes and clones of Coffea canephora with sensory quality adapted to irrigated systems in the Savanna region are pressing demands, aligned with technological innovation. In this context, the aim of this study was to characterize Coffea canephora (Conilon) clones based on agronomic and chemical traits of the beans and to assist in selecting promising materials for use in the genetic improvement program of irrigated Coffea canephora in the Savanna. During the 2019/20 and 2020/21 harvest seasons, 33 and 35 Coffea canephora genotypes, respectively, were evaluated for productivity, morpho-agronomic traits, and concentrations of chlorogenic acid, sucrose, caffeine, citric acid, and trigonelline in raw beans. The data were subjected to cluster analysis based on the Canberra genetic distance matrix, and grouping was performed using Ward's method. The means were subjected to non-parametric univariate analysis using the Kruskal-Wallis test. In the first year, five groups were defined, with Group G1 showing the best rank numbers for the evaluated traits. In the second year, six groups were identified, with Group G6 standing out for morpho-agronomic traits associated with productivity and Group G5 excelling in the levels of chemical compounds evaluated, as well as productivity and physical grain characteristics. The genotypes L3.L16.P6 (22) and L4.L25.P123 (31), present in the groups that stood out in both years, were identified as promising, showing high potential for the genetic improvement program of irrigated conilon coffee in the Savanna, in both morphoagronomic and grain quality aspects.
Keywords:
Coffea canephora Pierre ex Froehner
; plant breeding
; genetic resources
1. Introduction
Brazil stands out on the global stage as the world’s largest coffee producer and the second-largest producer of Coffea canephora coffee [1]. Among the commercially grown coffee species, Coffea canephora (Pierre ex Froehner) has gained prominence in the national coffee industry, primarily due to its high productive potential, adaptability to new environments, and, more recently, its potential for beverage quality.
Currently, various studies have been focused on the introduction of Coffea canephora in areas previously considered unsuitable for its cultivation, either as an alternative for Arabica coffee producers, who already have harvesting and post-harvesting infrastructure, or as an innovation for regions with altitudes and edaphoclimatic conditions different from those where the crop is traditionally established, such as the Central Savanna [2].
The edaphoclimatic conditions of the Savanna region allow for the production of high-quality coffee, as the harvest period coincides with the mid-year dry season, reducing the risk of undesirable fermentation, particularly during the drying process [3]. Additionally, the possibility of irrigation and the use of region-specific technologies, such as controlled water stress to synchronize flowering, increase the likelihood of a higher proportion of ripe cherries at harvest [4]. Improvements in the irrigated coffee production system in the Savanna are also evident in the reduction of malformed beans and lower harvesting costs.
However, the body of knowledge regarding Coffea canephora production technology in the Savanna still requires extensive research across various technical and scientific fields, particularly in genetic improvement. Studies are underway to identify more productive genotypes and clones with superior agronomic traits, higher concentrations of chemical components related to quality, and better adaptation to irrigated systems [5,6]. These aspects represent urgent demands aligned with technological innovation and producers’ needs. Therefore, a deeper understanding of Coffea canephora genetic resources is crucial, particularly elite genotypes developed in breeding programs.
In this context, the objective of this study was to characterize Conilon coffee clones based on agronomic and chemical traits of the beans and, through multivariate analysis and non-parametric tools, support the selection of promising materials for quality and competitiveness to be incorporated into the breeding program for irrigated Conilon coffee in the Savanna.
2. Materials and Methods
The study was conducted at the experimental field and the Food Science and Technology Laboratory of Embrapa Cerrados. Clones from the elite coffee collection of the species Coffea canephora, botanical variety Conilon, were evaluated. The mother plants originated from an open-pollination field of clones from Incaper - ES, followed by the production of seminal seedlings from the Robusta Tropical cultivar (EMCAPA 8151) [7].
After an initial selection cycle at the unit, the cloned genotypes were established in February 2017 at the experimental field of Embrapa Cerrados in Planaltina, Federal District, located at 15°35′57″ South latitude, 47°42′38″ West longitude, and an altitude of 1,007 m, on a typical dystrophic Red Latosol with clay texture, irrigated by a central pivot system. The region’s climate is classified as Aw according to the Köppen-Geiger climate classification. Irrigation management followed the Savanna Irrigation Monitoring Program proposed [8]. To synchronize flowering, water stress management was applied [9].
Soil preparation included liming with two tons of dolomitic limestone per hectare, divided into equal doses—one applied before plowing and the other before harrowing—to increase base saturation to 60%, along with the application of two tons of agricultural gypsum. At planting, 120 g of triple superphosphate, 50 g of magnesium thermophosphate (Yoorin®), and 24.5 g of micronutrients (FTE BR 12) were added per planting hole. Maintenance fertilization consisted of 450 kg ha⁻¹ of nitrogen (urea), 450 kg ha⁻¹ of K₂O (potassium chloride) applied in four equal portions in September, December, February, and March, and 300 kg ha⁻¹ of P₂O₅ (simple superphosphate) applied in two-thirds in September and one-third in December.
In the experimental field, 43 genotypes were planted with a spacing of 3.5 m between rows and 0.5 m between plants, with plots ranging from 1 to 10 cloned plants in a completely randomized design. For the evaluations, up to three plants from each genotype were randomly selected.
For the morphoagronomic analyses, the following traits were evaluated on the same plants over two consecutive years: plant height, and the number of vegetative and reproductive nodes on the plagiotropic branches in December 2019, as well as plant height, the number of nodes on plagiotropic branches, the number of plagiotropic branches, the length of the plagiotropic branches, the length of the internodes of the plagiotropic branches, and the length of the internode of the orthotropic branch in December 2020. Evaluations were performed in the middle third of the plant using two plagiotropic branches from each plant, one on the east side and the other on the west side, with a tape measure and a caliper. The average of these measurements was used for analysis.
For yield, income, and chemical analyses, coffee beans were harvested manually in 2020 and 2021. For the chemical analysis, only fruits in the cherry stage were selected. After harvest, the fruits were processed via dry processing on a conventional drying area, being turned daily for uniform drying. The moisture content of the fruits was monitored weekly with a Multi-GrainTM moisture meter from DICKEY-john. When the moisture content reached 11%, the fruits were removed from the drying area. The dried fruits were stored in paper bags and kept in a cold chamber at 5°C until the time of analysis.
The samples were weighed, processed (hulled), and weighed again to determine the yield of cherry coffee beans into processed coffee (income). Productivity was extrapolated according to the plant spacing, and the grain moisture was corrected to 13%. Income was calculated by dividing the mass after processing by the mass of the beans before processing. Moisture content was determined with a GEHAKA G610i meter.
For chemical analyses, defects were removed from the beans to minimize environmental interference. The beans of each sample were then ground in a hammer mill, sieved through a 20 mesh sieve, and dried in an oven at 40°C until a constant weight was achieved for chemical analysis. From the prepared samples, the levels of sucrose, caffeine, trigonelline, chlorogenic acid (caffeoylquinic acid – 5-ACQ), and citric acid were determined using Near-Infrared Spectroscopy (NIRS). The spectra were collected using a FOSS spectrophotometer. The samples were analyzed by reflectance in the spectral range between 1108 and 2492.8 nm, with spectra obtained as averages of three scans using the ISIscan spectroscopy software version 2.85 (Infrasoft International LLC, State College, PA, USA).
For data analysis, 33 genotypes were evaluated in the 2019/20 crop year and 35 genotypes in the 2020/21 crop year. In order to include all genotypes in the analysis, including those with fewer than one plant, the means of all variables from all genotypes were used for each year. The data were subjected to cluster analysis based on the Canberra genetic distance matrix, obtained by summing the differences between two points, a weighted version of the Manhattan distance [10], and the Ward’s method was used as the clustering criterion.
The stop point of the clustering algorithm (cut of the dendrogram) to fix the number of groups was determined based on the average genetic distance between the genotypes. To estimate the fit between the distance matrix and the dendrogram generated, the cophenetic correlation coefficient (r) between the original genetic distances and those represented by the dendrogram among genotype pairs was calculated, as per [11].
After the clusters were generated, they became a new source of variation. The means were then subjected to univariate non-parametric Kruskal-Wallis analysis, as the assumptions of normality and homogeneity of variance required by the F-test of variance analysis were not met. All statistics were performed using the [12] free software, with the help of the PerformanceAnalytics, FactoMineR, ExpDes.pt, and cluster packages.
3. Results
For the 2019/2020 harvest year, the cluster analysis resulted in the formation of five distinct groups based on the classification of the 33 genotypes analyzed: G1 (composed of 7 genotypes), G2 (9 genotypes), G3 (6 genotypes), G4 (4 genotypes), and G5 (7 genotypes), as shown in Figure 11. The value of the cophenetic correlation coefficient (r), which was significant (p ≥ 0.05), was 0.58, as presented in (Figure 1).
The results obtained indicated significant differences between groups G1 to G5 for the evaluated traits (Table 1). In terms of the number of nodes on the plagiotropic branch, group G1 showed the highest average (25.57), while G2 (15.11) and G5 (10.71) had the lowest values (Table 1).
Regarding height, groups G3 (144.94 cm) and G4 (145.75 cm) were the most vigorous, while G2 and G5 presented the lowest values (Table 1).
For yield, G4 stood out with the highest average production (7132.65 kg/ha), followed by G1 (6977.84 kg/ha), group G2, on the other hand, had the lowest yield (3535.67 kg/ha) (Table 1).
For the income percentage (5-ACQ), G4 (26.00%) and G1 (24.14%) led, while G2 had the lowest percentage (8.89%) (Table 1).
In terms of chemical components, groups G1 and G5 had the highest sucrose content, 5.66% and 5.52%, respectively (Table 1). G4 and G5 showed the highest caffeine levels (2.03% and 2.01%), while G1 (1.77%) and G3 (1.81%) had the lowest values (Table 1).
For trigonelline, G1 (1.51%) and G5 (1.40%) had the highest contents, while G3 (1.17%) and G2 (1.21%) had the lowest (Table 1).
For the 2020/21 crop year, cluster analysis grouped the 35 genotypes into six distinct clusters: G1 (4 genotypes), G2 (4 genotypes), G3 (6 genotypes), G4 (10 genotypes), G5 (7 genotypes), and G6 (4 genotypes) (Figure 2). The cophenetic correlation coefficient (r) showed a significant value (p ≥ 0.05), indicating a correlation of 0.51. It is noteworthy that the genotypes were not necessarily grouped in the same clusters as in the previous year, reflecting potential changes in the analyzed traits or the genotype × environment interaction.
By the non-parametric Kruskal-Wallis analysis, a significant difference at a 5% probability level was observed among the groups generated by the cluster analysis for all traits, except for the internode length of the orthotropic branch (Table 2).
The results of the analysis showed that, for the characteristic “height,” group G3 had the highest average (194.50 cm) with a ranking of 30.00, followed by G1 with 189.08 cm and a ranking of 27.00, while group G6 had the lowest average (160.83 cm) and the lowest ranking (5.88) (Table 2).
Regarding the plagiotropic branch length, group G4 stood out with 83.03 cm, achieving a ranking of 28.00, while G6 had the lowest average (66.42 cm) and a ranking of 6.00 (Table 2).
The plagiotropic branch internode length showed the best performance in group G2 (4.96 cm), with a ranking of 32.38, followed by groups G3 (3.83 cm, ranking 21.08) and G1 (3.29 cm, ranking 10.75) (Table 2).
For the orthotropic branch internode length, G2 had the highest average (4.75 cm) and a ranking of 23.63, followed by G1 (4.46 cm, ranking 22.75) (Table 2).
The number of nodes on the plagiotropic branch was highest in group G4 (23.13), which achieved a ranking of 26.10, while group G6 had the lowest average (17.25) and a ranking of 8.38 (Table 2).
The number of plagiotropic branches was greatest in group G1 (43.67, ranking 28.63), followed by G3 (41.00, ranking 25.33), while G6 had the lowest average (33.54) and a ranking of 6.38 (Table 2).
The 2020/21 harvest showed a 40% lower performance compared to the previous harvest, possibly due to bienniality, an intrinsic characteristic of coffee plants due to their phenology. Group G6 achieved the highest ranking with an average of 2938.28 kg/ha, differing only from group G1 (Table 3).
The 2020/2021 harvest results show that genotype G5 stood out in terms of productivity and quality, with the highest yield (2744.41 kg/ha) and the best averages in several chemical characteristics, including sucrose (54.63%), citric acid (0.68%), trigonelline (1.33%), chlorogenic acid (4.31%), and caffeine (2.4%) (Table 3).
This superior performance makes G5 the most balanced genotype in terms of production and quality. Genotype G6, with the highest yield (2938.28 kg/ha), also showed good results in caffeine (2.41%) and trigonelline (1.17%), although it did not stand out as much in the other chemical characteristics (Table 3).
Genotype G3 achieved the highest average sucrose (58.17%) and showed good results in trigonelline (1.11%) and chlorogenic acid (3.91%), but did not perform as well in terms of yield. G2 achieved significant values in sucrose (54.04%) and chlorogenic acid (4.7%), with good production (2546.92 kg/ha), but did not perform as highly as G5 and G6. G4 showed lower results compared to the others, especially in terms of yield (1849.17 kg/ha) and quality, with lower values of sucrose (51.74%) and trigonelline (1.02%), as well as caffeine (2.24%), placing it at a less favorable position relative to the other genotypes (Table 3).
Thus, G5 and G6 stood out for their balance between productivity and quality, while G1 and G4 showed inferior performance in several characteristics during the 2020/2021 harvest.
4. Discussion
The results of the 2019/2020 harvest highlighted the superior performance of groups G1, G3, and G4 in terms of productivity and chemical quality, corroborating studies such as those by [13], which reported higher yields in cultivars with a greater number of nodes on plagiotropic branches (Table 1). The high productivity of these groups can be attributed to the adaptation of genotypes to the specific conditions of the Savanna, such as irrigation [14] and high altitude [15], and aligns with the averages observed by [16] in studies on conilon coffee.
For the characteristic YIELD, groups G1 and G4 showed the highest average values, implying greater efficiency in coffee processing (Table 1). This reflects higher storage capacity and market competitiveness, outperforming other Coffea canephora clones [17]. Furthermore, the higher sucrose levels in group G1 and the performance of group G5 are consistent with [18], who associated this trait with greater sugar synthesis capacity in favorable environments.
In contrast, the low yield and chemical quality results of group G2 differ from [19], who did not observe a direct relationship between shorter plant height and lower yield in coffee cultivars. These findings suggest that group G2 should be evaluated with caution due to its limitations.
In terms of chemical traits, the low caffeine levels in groups G1 and G3, as well as the high trigonelline and citric acid levels in groups G1 and G5, indicate genotypes with desirable characteristics for producing high-quality coffee (Table 1). However, the high caffeine levels in G4 and G5 differ from studies such as [20], which associated higher caffeine content with less productive plants. These variations may be explained by the genotype x environment interaction, a factor that significantly influences the expression of chemical traits.
Overall, the results reinforce the importance of considering multiple variables in the selection of genotypes for different cultivation systems. Groups G1 and G4 proved promising, combining high productivity and chemical quality, making them viable alternatives for high-demand production systems. Meanwhile, group G2 requires attention due to its limitations (Table 1). These findings highlight the potential for a more sustainable and competitive coffee industry, tailored to market demands.
The analysis of morphoagronomic and quality data of conilon coffee highlights the importance of characteristics such as height, branch length, and number of branches for the agronomic performance of the plant (Table 2). Previous studies confirm that vegetative growth, an indicator of plant vigor, is associated with its ability to adapt to the growing environment [21,22]. Height, in particular, reflects not only initial growth but also nutrient absorption efficiency, which is crucial for the development of a productive plant.
Regarding branch length, several studies indicate that greater branching is directly related to higher productive capacity, as branches are responsible for fruit formation [23]. This suggests that genotypes with longer branches have greater productive potential, which is supported by [24], who emphasize the importance of good branch development for conilon coffee productivity.
On the other hand, the relationship between the number of plagiotropic branches and productivity is more complex (Table 2). While some studies suggest that a higher number of branches can increase production, others indicate that this factor does not necessarily translate into a direct increase in productivity [25]. Excessive branching can lead to internal competition for resources such as water and nutrients, which may compromise the plant’s overall development and, consequently, its production.
Furthermore, the selection of genotypes with morphoagronomic characteristics suited to the growing environment is a key factor in coffee genetic improvement. Genotypes with optimized characteristics have a greater ability to adapt, resulting in higher productivity under specific environmental conditions [26]. However, the choice of genotypes must be made carefully, considering that characteristics such as height and number of branches may vary depending on soil type and water regime, which impact the expected results [27].
It is important to understand that the agronomic performance of different coffee genotypes is influenced by various factors, and the interaction between these characteristics should be analyzed in an integrated manner. The use of statistical tools such as cluster analysis and Kruskal-Wallis tests allows for the identification of promising genotypes based on their overall performance, facilitating the selection of genetic material with greater productive potential for different growing regions.
Several studies indicate that the search for genotypes that can balance high productivity with quality traits is a challenge for coffee breeding programs. For some authors, higher productivity does not always translate into superior quality [28,29], while others argue that it is possible to achieve a balance between these two traits through breeding [30]. These results corroborate the trends found in the present study, particularly regarding the performance of genotype G5 (Table 3).
On the other hand, some research suggests that genotypes with high chemical quality may have lower productivity [31], as observed in genotype G3 (Table 3). This phenomenon is explained by the complexity of coffee plant phenology, which may limit productivity but result in superior chemical characteristics [32]. The literature also suggests that, in some conditions, prioritizing quality traits such as sucrose and chlorogenic acid may be more relevant for specific markets, such as the specialty coffee market [33].
The analyses of the 2019/2020 and 2020/2021 harvests showed that genotypes G5 and G6 consistently stood out in terms of productivity and quality. Genotype G5 was the most balanced, with high yield and excellent averages in chemical traits such as sucrose, chlorogenic acid, trigonelline, citric acid, and caffeine. While G6 had the highest yield, it did not stand out as much in chemical traits. G3 showed good results in sucrose, trigonelline, and chlorogenic acid but had lower yield. G2 performed below expectations, with lower yield and quality, despite good levels of sucrose and chlorogenic acid. G4 had the lowest yield and quality, lagging behind other genotypes in several traits. In both years, G5 and G6 stood out for their combination of high productivity and quality, while G2 and G4 showed significant limitations, highlighting the importance of careful evaluation in genotype selection.
5. Conclusions
The cluster analysis, along with non-parametric analysis, proved to be an efficient tool for identifying promising genotypes adapted to the edaphoclimatic conditions of the Savanna. The observed group variation in the characteristics assessed over the two years suggests significant environmental influence on the genotypes’ responses.
In the 2019/20 harvest year, group G1 stood out as superior in all evaluated aspects. In the 2020/21 harvest, group G5 excelled compared to the other groups, mainly due to its chemical component levels, combined with productivity and physical grain classification. Group G6, also in 2020/21, stood out for its desired agronomic traits, along with high productivity.
The genotypes L3.L16.P6 (22) and L4.L25.P123 (31), present in the groups that stood out in both years, were identified as promising, showing high potential for the genetic improvement program of irrigated conilon coffee in the Savanna, in both morphoagronomic and grain quality aspects.
Author Contributions
Conceptualization, Felipe Augusto Alves Brige, Renato Fernando Amabile, Adriano Delly Veiga and Marcelo Fagioli. Methodology, Renato Fernando Amabile, Juaci Vitória Malaquias, Adriano Delly Veiga and Marcelo Fagioli. Software, Juaci Vitória Malaquias. Validation, Renato Fernando Amabile. Formal analysis, Felipe Augusto Alves Brige, Juaci Vitória Malaquias. Investigation, Felipe Augusto Alves Brige, Renato Fernando Amabile. Data curation, Renato Fernando Amabile. Writing-original draft, Felipe Augusto Alves Brige. Writing-review & editing, Arlini Rodrigues Fialho, Adriano Delly Veiga and Marcelo Fagioli. Supervision, Renato Fernando Amabile. Project administration, Renato Fernando Amabile, Adriano Delly Veiga and Marcelo Fagioli. Funding acquisition Renato. All co-authors reviewed the final version and approved the manuscript before submission.
Funding
The first author received a master’s scholarship from CAPES.
Institutional Review Board Statement
Not applicable.
Data Availability Statement
The original contributions presented in the study are included in the article, further inquiries can be directed to the corresponding author..
Acknowledgments
Technical support from Embrapa Cerrados.
Conflicts of Interest
The authors declare no conflicts of interest. The funders had no role in the design of the study; in the collection, analyses, or interpretation of data; in the writing of the manuscript; or in the decision to publish the results.
References
- United States Department of Agriculture. Foreign Agricultural Service. Disponível em: https://www.fas.usda.gov/data. Acesso em: Dez. 2024.
- Campuzano-Duque, L.F.; Blair, M.W. Strategies for robusta coffee (Coffea canephora) improvement as a new crop in Colombia. Agriculture 2022, 12, 1576–1591. [Google Scholar] [CrossRef]
- Souza, C.A.; Rocha, R.B.; Alves, E.A.; Teixeira, A.L.; Dalazen, J.R.; Fonseca, A.F.A. Characterization of beverage quality in Coffea canephora Pierre ex A. Froehner. Coffee Science 2018, 13, 210–218. [Google Scholar] [CrossRef]
- Guerra, A.F.; Rocha, O.C.; Rodrigues, G.C.; Sanzonowicz, C.; Sampaio, J.B.R.; Silva, H.C.; Araújo, M.C. Irrigação do cafeeiro no Cerrado: Estratégia de manejo de água para uniformização de florada. Planaltina: Embrapa Cerrados, 2005. 4 p. (Embrapa Cerrados. Comunicado técnico, 122).
- Santin, M.R.; Amabile, R.F.; Malaquias, J.V.; Veiga, A.D.; Brige, F.A.A.; Sala, P.I.A.L. Maturation and detachment force for mechanized harvesting of irrigated Conilon coffee in the Brazilian Cerrado. Pesquisa Agropecuária Brasileira 2023, 58, e02967. [Google Scholar] [CrossRef]
- Brige, F.A.A.; Celestino, S.M.C.; Amabile, R.F.; Fagioli, M.; Delvico, F.M.; Montalvão, A.P.L.; Sala, P.I.A.L. Genetic variability in conilon coffee related to grain attributes in an irrigated crop in the Cerrado. Pesquisa Agropecuária Brasileira 2019, 54, e00358. [Google Scholar] [CrossRef]
- Ferrão, R.G.; Fonseca, A.F.A.; Ferrão, M.A.G.; Bragança, S.M.; Ferrão, L.M.V. EMCAPA 8151 – Robusta Tropical: Variedade melhorada de café conilon de propagação por sementes para o estado do Espírito Santo. In: SIMPÓSIO BRASILEIRO DE PESQUISA DOS CAFÉS DO BRASIL, 1., 2000, Poços de Caldas. Resumos Expandidos. Poços de Caldas: Embrapa Café, 2000.
- Rocha, O.C.; Guerra, A.F.; Silva, F.A.M.; Machado Júnior, J.R.R.; Araújo, M.C.; Silva, H.C. Programa para monitoramento de irrigação do cafeeiro no Cerrado. In: SIMPÓSIO BRASILEIRO DE PESQUISA EM CAFEICULTURA IRRIGADA, 8., 2006, Araguari. Anais [...]. Viçosa: UFV, 2006. p. 61-64.
- Guerra, A.F.; Rocha, O.C.; Rodrigues, G.C.; Sanzonowicz, C.; Sampaio, J.B.R.; Silva, H.C.; Araújo, M.C. Irrigação do cafeeiro no Cerrado: Estratégia de manejo de água para uniformização de florada. Planaltina: Embrapa Cerrados, 2005. 4 p. (Embrapa Cerrados. Comunicado técnico, 122).
- Lance, G.N.; Williams, W.T. Computer programs for hierarchical polythetic classification (“similarity analyses”). The Computer Journal 1966, 9, 60–64. [Google Scholar] [CrossRef]
- Sokal, R.R.; Rohlf, F.J. The comparison of dendrograms by objective methods. Taxonomy 1962, 11, 30–40. [Google Scholar] [CrossRef]
- R Development Core Team. R: A Language and Environment for Statistical Computing. Vienna: R Foundation for Statistical Computing, 2022. Disponível em: http://www.R-project.org.
- Silva, J.R.; Almeida, T.R.; Barros, L.D. Rendimento em cultivares com maior número de nós em ramos plagiotrópicos na safra 2019/2020. Café em Foco 2019, 10, 55–64. [Google Scholar]
- Partelli, F.L.; Rodrigues, A.F.; Ramos, V.A. Sistema de irrigação no Cerrado: Impacto na produtividade do café na safra 2019/2020. Agropecuária Brasileira 2016, 51, 203–211. [Google Scholar]
- Martins, E.P.; Nascimento, T.C.; Barbosa, A.S. Influência da altitude na produção de café no Cerrado na safra 2019/2020. Pesquisa Agropecuária Tropical 2019, 49, 1–10. [Google Scholar]
- Busato, C.G.; Silva, A.P.; Oliveira, R.L. Impacto da adubação nitrogenada no rendimento de café conilon na safra 2019/2020. Revista Brasileira de Agropecuária 2022, 8, 123–135. [Google Scholar]
- Ramalho, A.P.; Oliveira, C.D.; Fernandes, M.P. Avaliação de clones deCoffea canephora: Qualidade e produtividade na safra 2019/2020. Ciência Rural 2016, 46, 123–132. [Google Scholar]
- Lima, R.T.; Santos, D.C.; Almeida, F.M. Síntese de açúcares em ambientes favoráveis na safra 2019/2020: Implicações para a qualidade do café. Journal of Coffee Research 2020, 12, 200–210. [Google Scholar]
- Carvalho, A.M.; Melo, M.P.; Ferreira, J.C. Relação entre altura e rendimento em cultivares de café arábica na safra 2019/2020. Café e Ciência 2018, 14, 45–55. [Google Scholar]
- Pereira, L.F.; Castro, J.M.; Santos, R.B. Níveis de cafeína e produtividade em cultivares de café na safra 2019/2020. Revista de Estudos do Café 2022, 6, 85–94. [Google Scholar]
- Costa, R.M.; Silva, F.T.; Sousa, D.S. Influência do crescimento vegetativo nas características produtivas do café conilon. Agronomia e Sustentabilidade 2020, 15, 20–28. [Google Scholar]
- Pereira, L.F.; Almeida, G.R.; Souza, T.M. Características agronômicas e sua relação com a produtividade do café conilon. Revista Brasileira de Ciências Agrárias 2017, 12, 45–52. [Google Scholar]
- Silva, E.D.; Costa, F.J.; Almeida, R.P. Relacionamento entre a arquitetura da planta e a produção de café conilon. Revista Brasileira de Agricultura 2016, 24, 132–140. [Google Scholar]
- Sousa, C.D.; Gomes, L.T.; Pereira, D.S. A importância do desenvolvimento das plantas para a produtividade do café. Revista de Agricultura Tropical 2019, 22, 98–104. [Google Scholar]
- Almeida, W.A.; Souza, A.R.; Pereira, R.S. Efeitos da ramificação sobre a produtividade do café conilon. Revista Brasileira de Café e Cacau 2018, 19, 102–110. [Google Scholar]
- Lima, M.A.; Carvalho, L.C.; Ferreira, D.T. Melhoramento genético do café: Fatores determinantes da produtividade e qualidade. Revista de Pesquisa Agropecuária 2021, 12, 56–64. [Google Scholar]
- Santos, P.M.; Silva, M.A.; Moura, R.G. A influência da ramificação na produtividade de cafeeiros conilon. Café e Tecnologia 2018, 23, 78–85. [Google Scholar]
- Marques, J.P. Relação entre o processamento de pós-colheita e atributos químicos e sensoriais de cafés de três locais de Minas Gerais. 2017. Dissertação (Mestrado) – Universidade José do Rosário Vellano (Unifenas), p. 53.
- Pereira, L.L.; Guarçoni, R.C.; Pinheiro, P.F.; Osório, V.M.; Pinheiro, C.A.; Moreira, T.R.; Ten Caten, C.S. New propositions about coffee wet processing: Chemical and sensory perspectives. Food Chemistry 2020, 310, 125943. [Google Scholar] [CrossRef] [PubMed]
- Silva, J.R.; Oliveira, P.A.; Santos, C.L. Produtividade e qualidade em cultivares de café. Revista Brasileira de Agricultura Sustentável 2019, 9, 123–130. [Google Scholar]
- Corrêa, P.C.; Oliveira, G.H.H.; Botelho, F.M.; Treto, P.C.; Alves, E.A. Propriedades físicas e químicas interferentes na pós-colheita do café. Café & Ciência, 2015. [Google Scholar]
- Marques, J.P. Relação entre o processamento de pós-colheita e atributos químicos e sensoriais de cafés de três locais de Minas Gerais. 2017. Dissertação (Mestrado) – Universidade José do Rosário Vellano (Unifenas), p. 53.
- Debona, D.G.; Oliveira, E.C.S.; Caten, C.S.T.; Guarçoni, R.C.; Moreira, T.R.; Pereira, L.L.; Moreli, A.P. Sensory analysis and mid-infrared spectroscopy for discriminating roasted specialty coffees. Journal of Coffee Research 2021, 12, 45–54. [Google Scholar]
Figure 1.
Cluster analysis of 33 conilon coffee genotypes based on the genetic dissimilarity matrix calculated by Canberra distance, using morphoagronomic and chemical quality traits for the 2019/20 crop year. The Ward method was used as the clustering criterion. The cophenetic correlation coefficient (r) value is 0.58. Planaltina, Federal District, 2023.
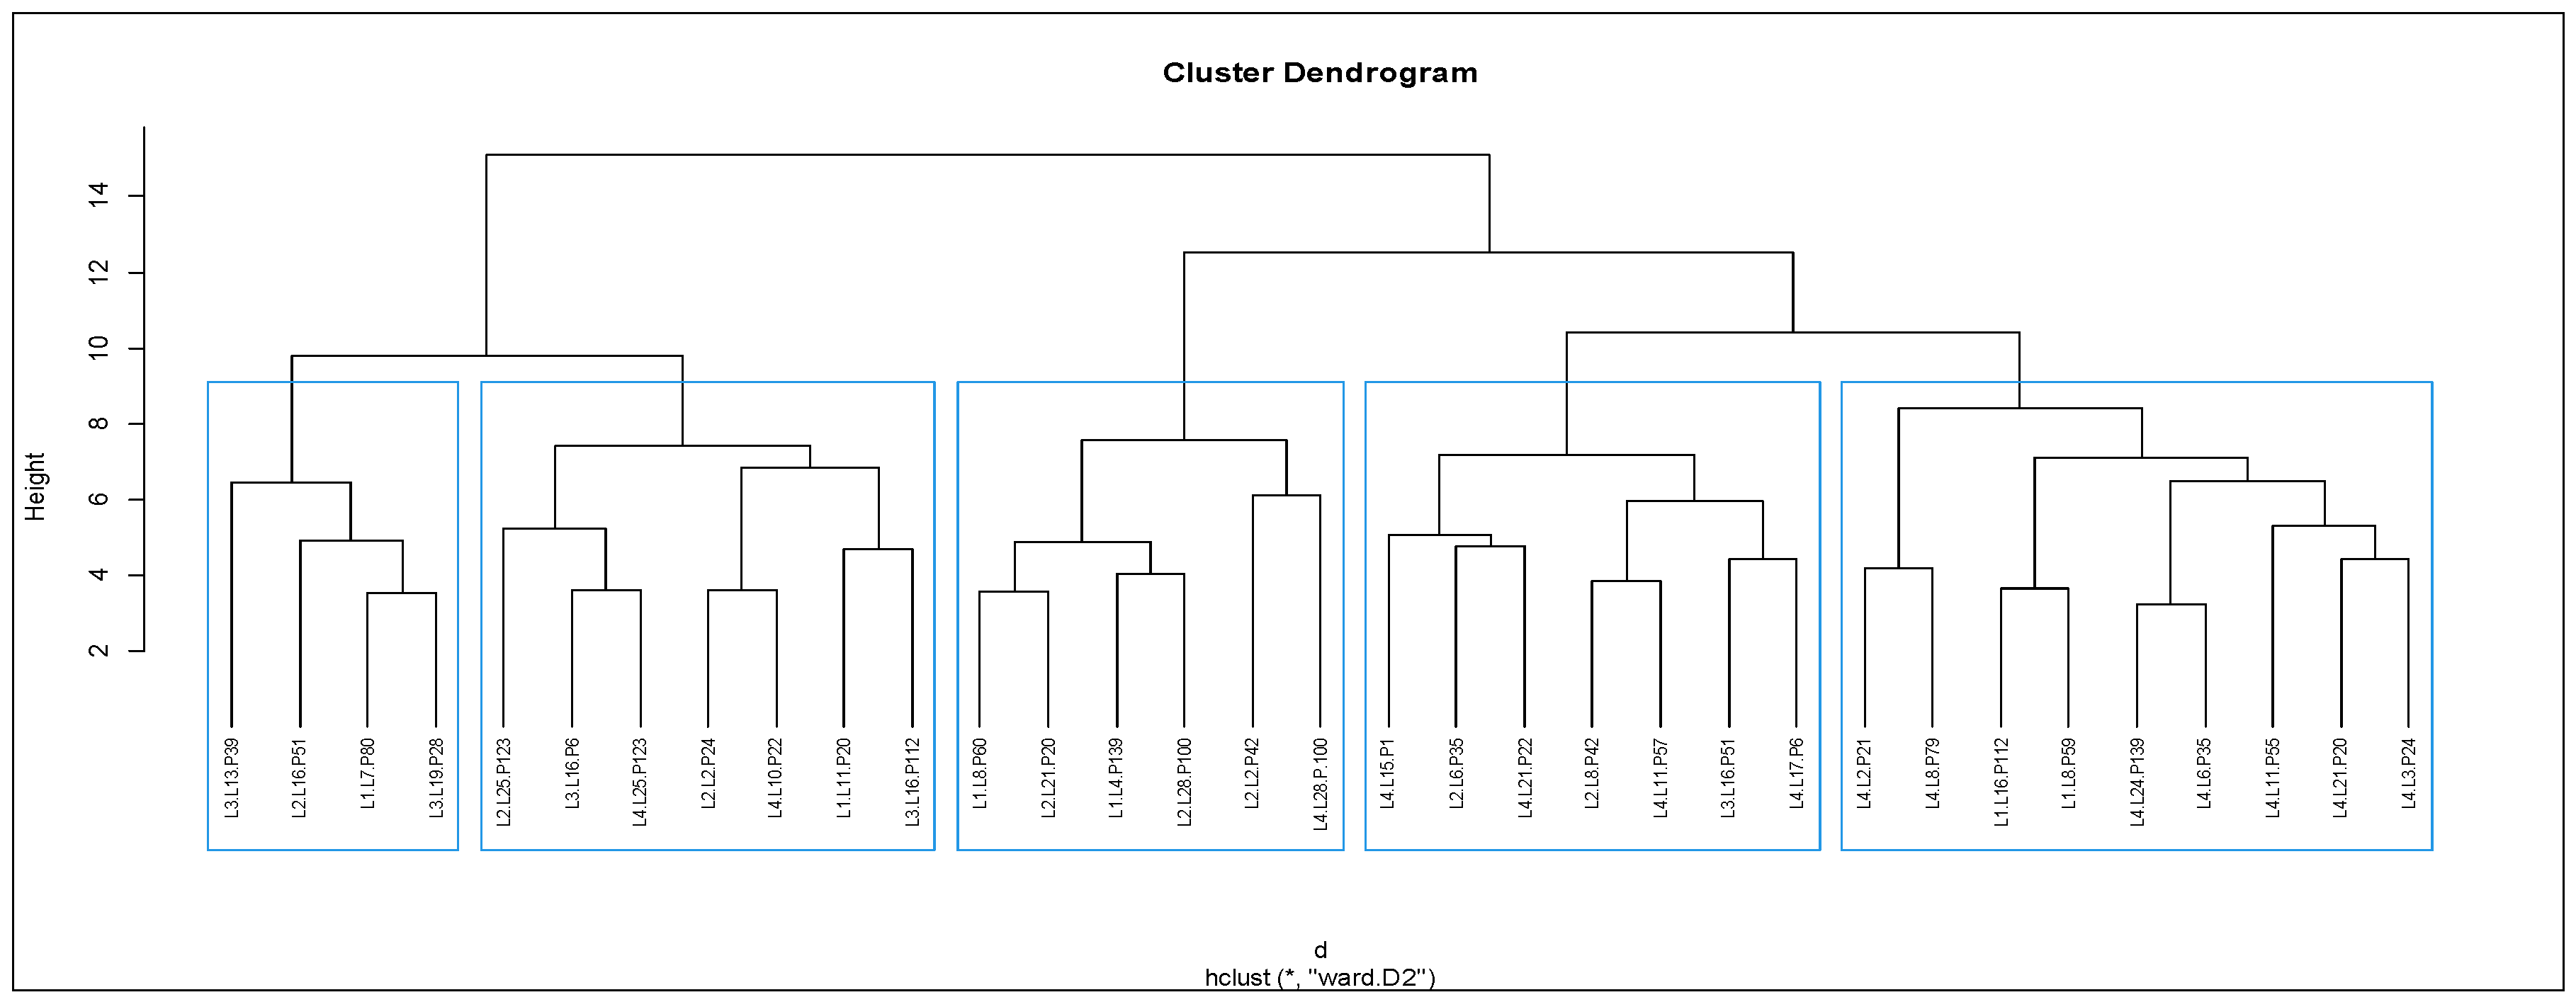
Figure 2.
Cluster analysis of 35 conilon coffee genotypes based on the genetic dissimilarity matrix calculated using the Canberra distance, considering morpho-agronomic and chemical quality traits during the 2020/21 crop year. The Ward method was applied as the clustering criterion. The cophenetic correlation coefficient (r) is 0.51. Planaltina, Federal District, 2023.
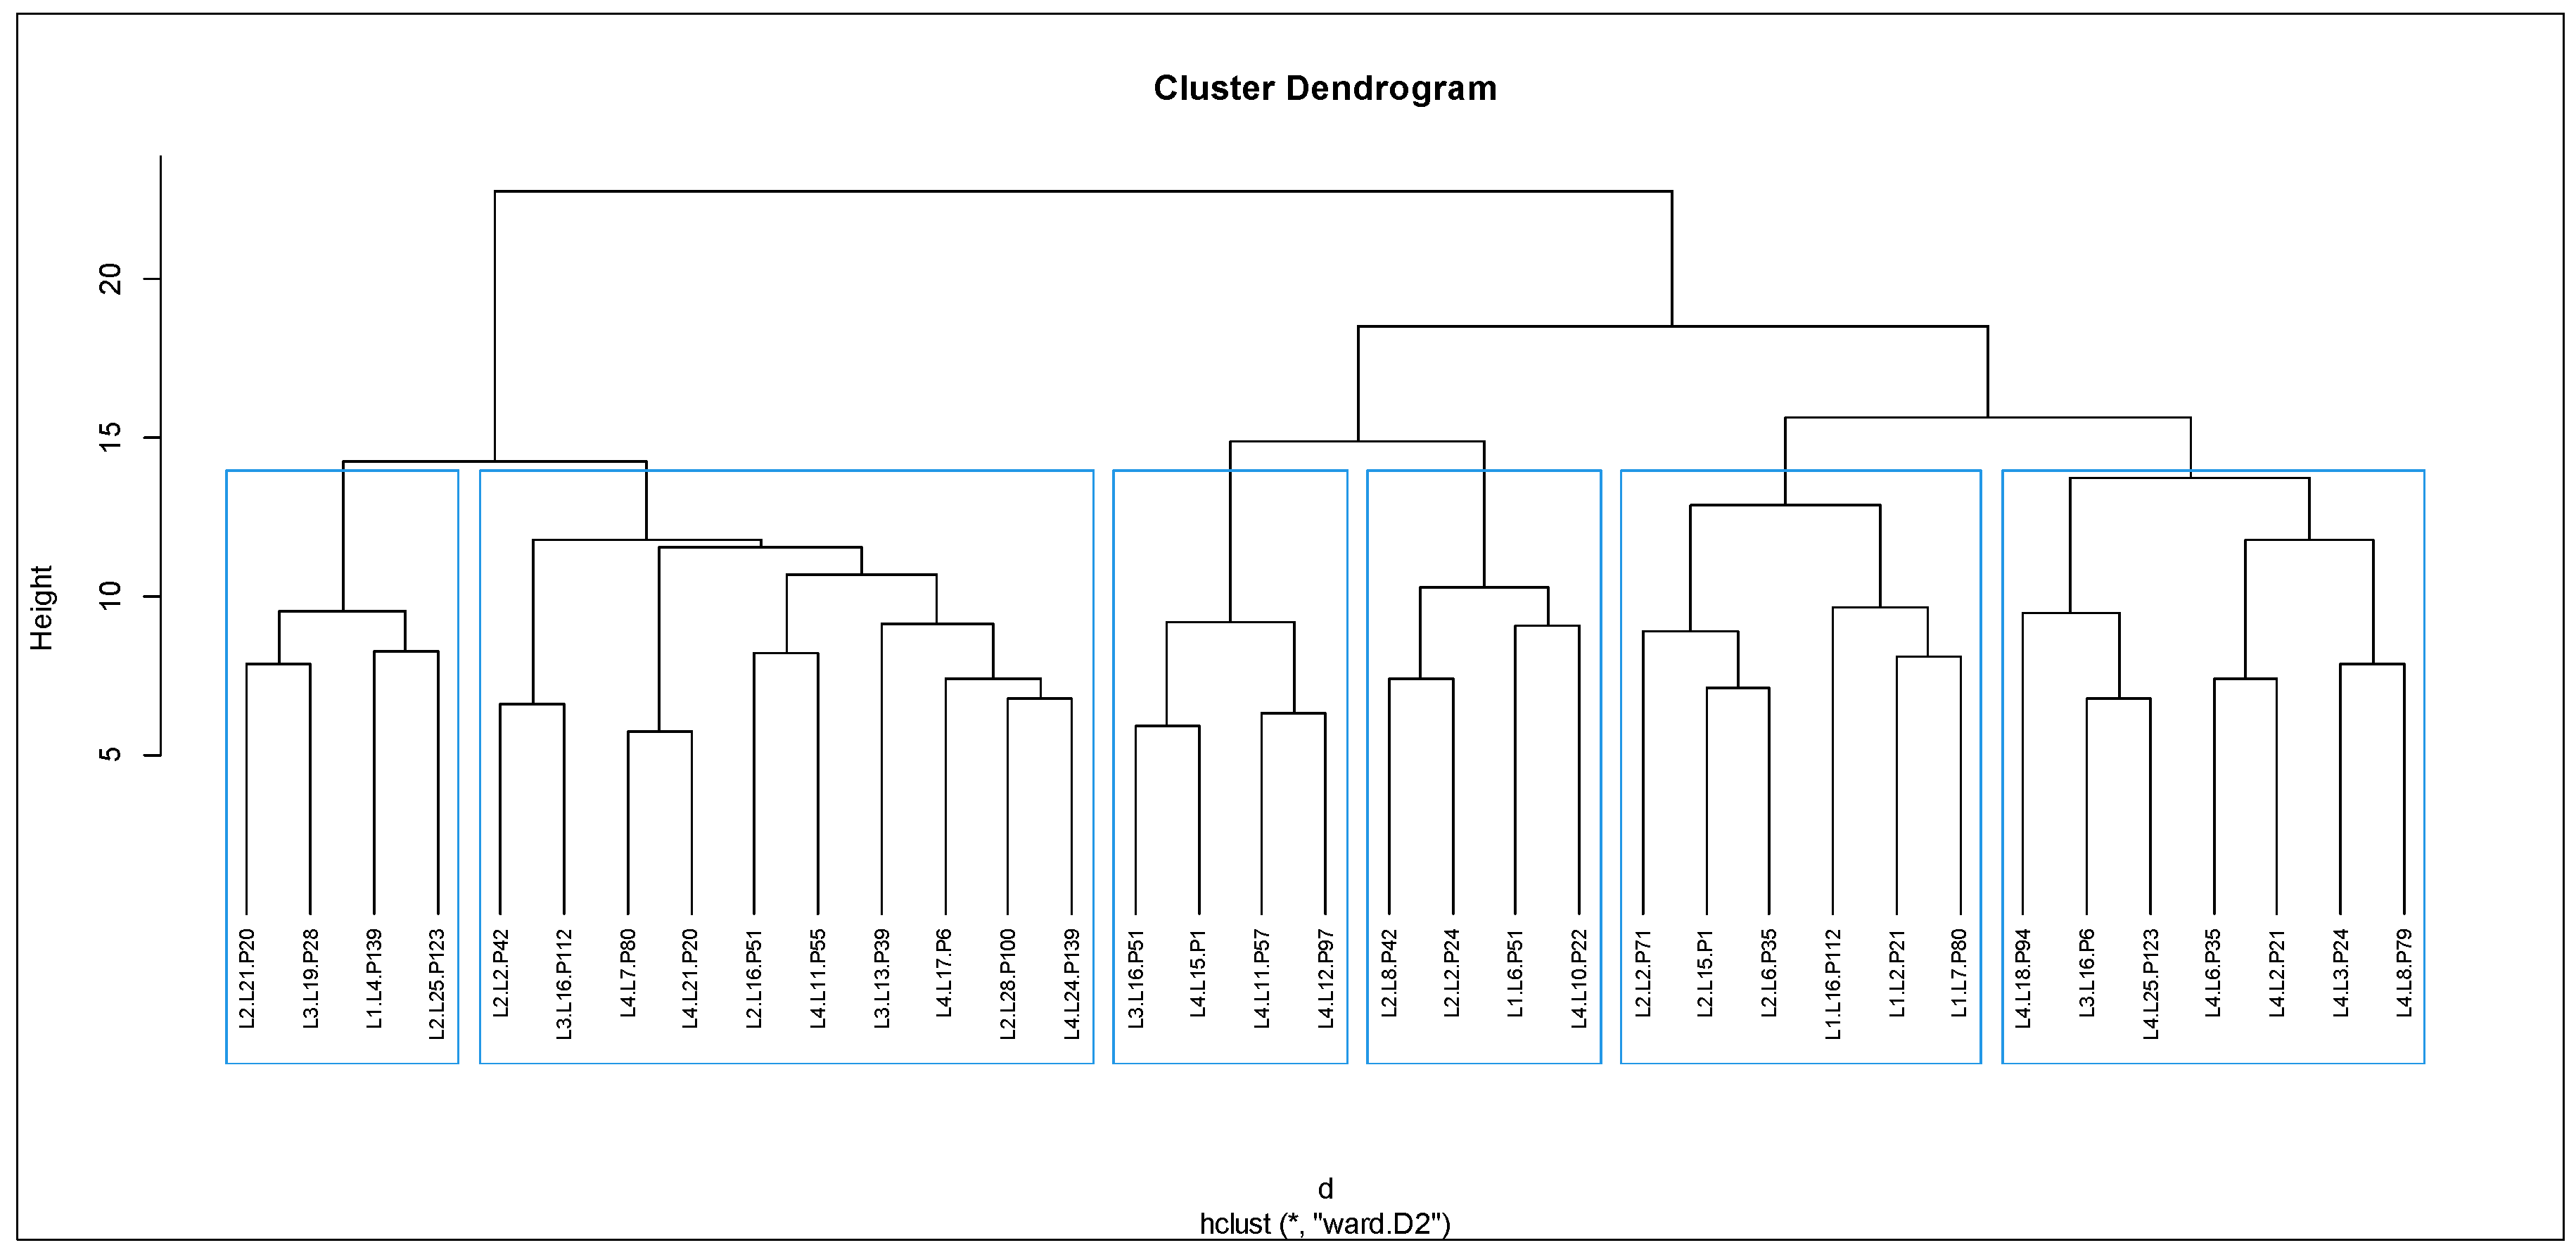

Table 1.
Non-parametric Kruskal-Wallis analysis of conilon coffee genotypes using morpho-agronomic traits and chemical quality characteristics for the 2019/20 harvest year. Planaltina,Federal District, 2023.
Table 1.
Non-parametric Kruskal-Wallis analysis of conilon coffee genotypes using morpho-agronomic traits and chemical quality characteristics for the 2019/20 harvest year. Planaltina,Federal District, 2023.
| GROUP | OUTTURN (%) | NUMBER OF NODES IN THE PLAGIOTROPIC BRANCH | HEIGHT (cm) | ||||||||
| AVERAGE | RANK | AVERAGE | RANK | AVERAGE | RANK | ||||||
| G1 | 63,34 | 25,57 | a | 19,86 | 19,00 | b | 137,67 | 18,50 | ab | ||
| G2 | 58,55 | 15,11 | b | 16,48 | 9,50 | c | 126,96 | 11,44 | b | ||
| G3 | 59,13 | 15,50 | b | 21,94 | 28,25 | a | 144,94 | 23,42 | a | ||
| G4 | 60,86 | 19,50 | ab | 18,25 | 13,50 | bc | 145,75 | 24,25 | a | ||
| G5 | 56,66 | 10,71 | b | 18,74 | 17,00 | bc | 126,62 | 13,00 | b | ||
| GROUP | YIELD* (kg/ha) | 5-ACQ (%) | CITRIC ACID (%) | ||||||||
| AVERAGE | RANK | AVERAGE | RANK | AVERAGE | RANK | ||||||
| G1 | 6977,84 (116) |
24,14 | a | 4,29 | 20,79 | a | 0,95 | 25,29 | a | ||
| G2 | 3535,67 (59) |
8,89 | c | 4,18 | 12,94 | a | 0,67 | 13,56 | bc | ||
| G3 | 6127,77 (102) |
20,42 | ab | 4,24 | 13,58 | a | 0,71 | 14,33 | Bc | ||
| G4 | 7132,65 (118) |
26,00 | a | 4,55 | 22,00 | a | 0,60 | 8,25 | c | ||
| G5 | 4523,35 (75) |
12,21 | bc | 4,42 | 18,50 | a | 0,83 | 20,43 | ab | ||
| GROUP | SUCROSE (%) | CAFFEINE (%) | TRIGONELLINE (%) | ||||||||
| AVERAGE | RANK | AVERAGE | RANK | AVERAGE | RANK | ||||||
| G1 | 5,66 | 24,00 | a | 1,77 | 11,86 | bc | 1,51 | 27,86 | a | ||
| G2 | 5,11 | 13,78 | b | 2,01 | 19,67 | ab | 1,21 | 10,11 | c | ||
| G3 | 4,67 | 4,17 | c | 1,81 | 9,00 | c | 1,17 | 6,67 | c | ||
| G4 | 5,47 | 21,50 | ab | 2,03 | 23,00 | a | 1,33 | 17,50 | b | ||
| G5 | 5,52 | 22,57 | a | 2,01 | 22,14 | a | 1,40 | 23,57 | ab | ||
Means followed by the same letter vertically do not differ according to the Kruskal-Wallis test at a 5% probability level. *Values in parentheses correspond to the yield in 60 kg bags of processed coffee per hectare. 5-ACQ = 5-caffeoylquinic acid.
Table 2.
Non-parametric Kruskal-Wallis analysis of conilon coffee genotypes using morpho-agronomic and chemical quality traits for the 2020/21 crop year. Planaltina, Federal District, 2023.
Table 2.
Non-parametric Kruskal-Wallis analysis of conilon coffee genotypes using morpho-agronomic and chemical quality traits for the 2020/21 crop year. Planaltina, Federal District, 2023.
| GROUP | HEIGHT (cm) | PLAGIOTROPIC BRANCH LENGTH (cm) | PLAGIOTROPIC BRANCH INTERNODE LENGTH (cm) | ||||||||
| AVERAGE | RANK | AVERAGE | RANK | AVERAGE | RANK | ||||||
| G1 | 189,08 | 27,00 | a | 68,67 | 7,50 | c | 3,29 | 10,75 | b | ||
| G2 | 168,25 | 9,50 | bc | 69,42 | 9,63 | c | 4,96 | 32,38 | a | ||
| G3 | 194,50 | 30,00 | a | 75,89 | 19,67 | b | 3,83 | 21,08 | ab | ||
| G4 | 178,02 | 17,05 | b | 83,03 | 28,00 | a | 3,59 | 17,90 | b | ||
| G5 | 176,24 | 15,71 | b | 72,71 | 19,93 | b | 3,52 | 15,36 | b | ||
| G6 | 160,83 | 5,88 | c | 66,42 | 6,00 | c | 3,27 | 11,13 | b | ||
| GROUP | ORTHOTROPIC BRANCH INTERNODE LENGTH (cm) |
NUMBER OF NODES ON THE PLAGIOTROPIC BRANCH |
NUMBER OF PLAGIOTROPIC BRANCHES |
||||||||
| AVERAGE | RANK | AVERAGE | RANK | AVERAGE | RANK | ||||||
| G1 | 4,46 | 22,75 | a | 19,08 | 12,63 | bc | 43,67 | 28,63 | a | ||
| G2 | 4,75 | 23,63 | a | 17,42 | 9,50 | c | 36,33 | 13,88 | cd | ||
| G3 | 3,61 | 14,67 | a | 19,67 | 14,92 | bc | 41,00 | 25,33 | ab | ||
| G4 | 4,09 | 19,60 | a | 23,13 | 26,10 | a | 37,97 | 17,70 | bc | ||
| G5 | 3,88 | 17,36 | a | 21,33 | 22,50 | ab | 36,71 | 15,07 | cd | ||
| G6 | 3,31 | 9,75 | a | 17,25 | 8,38 | c | 33,54 | 6,38 | d | ||
Averages followed by the same letter in the vertical column do not differ from each other according to the Kruskal-Wallis test at a 5% probability level.
Table 3.
Non-parametric Kruskal-Wallis analysis of conilon coffee genotypes using data on productivity, yield of processed coffee (RENDER), percentage of beans with sieve size greater than 16, percentage of defective beans, and levels of sucrose, caffeine, trigonelline, citric acid, and chlorogenic acid (5-ACQ) in the 2020/21 harvest year. Planaltina, Federal District, 2023.
| GROUP | Yield* (kg/ha) | OUTTURN (%) | SUCROSE (%) | CITRIC ACID (%) | ||||||||
| AVERAGE | RANK | AVERAGE | RANK | AVERAGE | RANK | AVERAGE | RANK | |||||
| G1 | 1677,26 (28) | 11 | b | 48,51 | 10,75 | b | 3,84 | 7,25 | b | 0,41 | 12,75 | bc |
| G2 | 2546,92 (43) | 17 | ab | 54,04 | 18,75 | ab | 4,7 | 26 | a | 0,66 | 23,25 | ab |
| G3 | 1906,31 (32) | 16,08 | ab | 58,17 | 29,17 | a | 4,15 | 14,5 | ab | 0,47 | 14,17 | bc |
| G4 | 1849,17 (31) | 16,55 | ab | 51,74 | 13,1 | b | 4,27 | 16,8 | ab | 0,45 | 12,6 | c |
| G5 | 2744,41 (46) | 20,71 | ab | 54,63 | 23,29 | a | 4,7 | 23,86 | a | 0,68 | 28,14 | a |
| G6 | 2938,28 (49) | 27,75 | a | 48,28 | 10,75 | b | 4,34 | 18,75 | ab | 0,53 | 19,5 | abc |
| GROUP | TRIGONELLINE (%) | 5-ACQ(%) | CAFFEINE (%) | |||||||||
| AVERAGE | RANK | AVERAGE | RANK | AVERAGE | RANK | |||||||
| G1 | 1,03 | 13,5 | bc | 4,42 | 23,25 | ab | 2,21 | 11 | b | |||
| G2 | 1,13 | 18,75 | abc | 4,16 | 20,63 | ab | 2,25 | 12,38 | b | |||
| G3 | 1,11 | 19 | abc | 3,91 | 12,17 | b | 2,38 | 22 | ab | |||
| G4 | 1,02 | 10,4 | c | 3,94 | 13,1 | b | 2,24 | 13,05 | b | |||
| G5 | 1,33 | 27,14 | a | 4,31 | 26,29 | a | 2,4 | 24,93 | a | |||
| G6 | 1,17 | 23,25 | ab | 4,04 | 16,63 | ab | 2,41 | 24,88 | a | |||
Means followed by the same letter in the vertical do not differ from each other by the Kruskal-Wallis test at a 5% probability level. *Values in parentheses correspond to the yield in 60 kg bags of processed coffee per hectare 5-ACQ = 5-caffeoylquinic acid.
Disclaimer/Publisher’s Note: The statements, opinions and data contained in all publications are solely those of the individual author(s) and contributor(s) and not of MDPI and/or the editor(s). MDPI and/or the editor(s) disclaim responsibility for any injury to people or property resulting from any ideas, methods, instructions or products referred to in the content. |
© 2025 by the authors. Licensee MDPI, Basel, Switzerland. This article is an open access article distributed under the terms and conditions of the Creative Commons Attribution (CC BY) license (https://creativecommons.org/licenses/by/4.0/).
Copyright: This open access article is published under a Creative Commons CC BY 4.0 license, which permit the free download, distribution, and reuse, provided that the author and preprint are cited in any reuse.


