Preprint
Article

This version is not peer-reviewed.

The AGDAC: Arduino Gasometer Data Acquisition for Advanced Biogas Measurements

Submitted:

16 December 2024

Posted:

03 January 2025

You are already at the latest version

Abstract

This paper presents the Arduino Gasometer Data Acquisition Control (AGDAC), a prototype interface offering a cost-effective and customizable alternative to pricey and restrictive commercial systems such as Rigamo, commonly paired with Ritter Milligas Counters. AGDAC, built on the Arduino Uno and a Python-based control application, enhances experimental flexibility by expanding data acquisition capabilities. It records and displays measurement data, supporting biogas production monitoring at the lab scale. User-friendly and based on open-source software, AGDAC lowers technical barriers, encourages interdisciplinary research, and reduces costs, democratizing data acquisition for scientific applications.

Keywords: 
;  ;  ;  ;  ;  ;  

1. Hardware in Context

In the digital era, there has been a significant rise in the use of instruments for experimental control, especially to meet the demands for efficient data acquisition and storage. These instruments also provide the capability to manipulate a variety of experimental variables, making them valuable across numerous applications. [1].
One highly demanding application is measuring biogas production from anaerobic bioreactors (AD) to assess the potential economic value of a carbon-based substrate. During biogas production monitoring with gasometers, any decrease in output may signal inhibition or failure due to the system’s high sensitivity to various toxic substances and fluctuating parameter conditions. [2,3,4]. Hence, tracking the performance of biogas production by using gasometers helps detecting exceptions and acting accordingly to mitigate or prevent failure before occurring complications in the system [3]. Gasometers can be classified based on flow rate into two categories: (i) industrial gasometers, which are used for high gas-flow rates, and (ii) laboratory gasometers, which are used for low gas-flow rates. Lab-scale bioreactors play a crucial role in microbiological, biotechnological, environmental, and biochemical sciences because processes optimized in experimental settings can be scaled up to pilot and full-scale trials. [5].
Traditionally, laboratory gasometers methods relied on liquid displacement, gas sampling bags, manometers and gas-flow meters, such as the tipping bucket and siphon or solenoid valve methods) [6]. The RITTER MilliGascounter (MGC) is a widely used gas-flow meter based on the tipping bucket principle, especially in semi-continuous or continuously fed digestion experiments [6,7,8,9,10,11,12,13]. Its popularity is attributed to its compact size, minimal barrier solution volume, electronic count display, and compatibility with sophisticated non-free software [14]. However, it remains a costly proprietary system, with prices ranging from $2,181.48 USD to $1,336.66 USD, excluding shipping and import taxes, depending on software inclusion. Additionally, proprietary equipment purchases have long-term ties to manufacturers for maintenance, repairs, and upgrades. For instance, the MGC’s non-replaceable lithium battery necessitates maintenance orders after 4 to 5 years of use [13]. Furthermore, the cost of its licensed data acquisition software, ”Rigamo,” increases with the number of channels, which serves as a data collector. [13]. This reliance on proprietary systems can be problematic, particularly for researchers with limited electronics, software programming, or instrumentation expertise, especially when the biogas research field offers room for innovation.
In response to these challenges, Arduino has gained popularity as an affordable open-source microcontroller board, ideal for rapid prototyping in engineering and academic projects [1,15,16,17,18]. The appeal of Arduino stems from its straightforward assembly process and the affordability of its complementary components [19,20], and its adaptability to various operating systems (e.g., Microsoft, Linux, and Mac OS X). It supports serial communication with computers and other devices via USB and interactions with programs like Python and LabVIEW [18,19].
In an effort to offer a cost-effective and accurate alternative to the Rigamo data acquisition system, which relies on an expensive National Instruments board 6501, non-free LabView-based software, and restrictive system requirements (e.g., Windows 7/8/10) [14], we propose using an Arduino Uno board with a wired-dependent system that employs a control application developed in Python as customizable sensor-interface system. This control application displays and records all data obtained from the acquisition system for historical analysis. Arduino and Python are compatible with Microsoft, Linux, and Mac OS X operating systems. The hardware design is simple and cost-effective, while the software is straightforward and easy to understand. Consequently, this device is a valuable tool for process engineers, scientists, and anyone interested in monitoring biogas production dynamics at the lab scale. This approach encourages interdisciplinary research to address gaps, save time, and reduce costs.

2. Hardware Description

The Arduino Gasmeter Data Acquisition (AGDAC) prototype is a customizable sensor-interface system that monitors real-time gas production from the MilliGascounter (MGC). The MGC operates on a tilting bucket design, where gas bubbles displace and fill one of two small buckets (as shown in Figure 1). When one bucket tips and empties, the other pivots into place. This tilting action is detected through the interaction of a permanent magnet attached to the tilting bucket with two magnetic sensors: Magnetic Sensor 1 (MS1) and Magnetic Sensor 2 (MS2). These magnetic sensors generate a binary signal of 1s (HIGH level) and 0s (LOW level), representing the tilting events. When MS1 is triggered, an electronic circuit that displays the gas volume in milliliters (ml) is activated. Simultaneously, the signal from MS2 is sent directly to an external data acquisition (DAC) system, as described in [13].
The AGDAC sensor-interface system reads the binary signal generated by each MGC’s socket and continuously monitors tilting events. The system then accumulates and calibrates the identified pulses to determine accurate volume data. Subsequently, this calibrated data is streamed in real-time through the USB serial port and processed by Python software.
There, the data sequence over time is displayed and recorded as CVS logs for further usage. The general function of the integrated development environments (IDEs) of AGDAC is depicted in Figure 2.
Communication with the j-th MGC is obtained by connecting the ground and signal contacts of each Jack plug to a ground (GND) and a digital pin of an Arduino UNO board, respectively.
Arduino UNO reads the binary signal from the j-th MGC by setting the pinMode function as INPUT PULLUP. This enables an internal pull-up resistor (between 20k and 50k Ohm) to keep the signal HIGH by default when filling one of the tiny buckets. A level change is produced directly from HIGH to LOW and comes back to HIGH when a tiny bucket is full of gas, making an abrupt inclination of the tilting bucket. Then, the second tiny bucket begins to fill its entirety, where another level of change is produced. As a result, each transition from HIGH to LOW at the i-th occurrence defines a pulse or tilt. The number of these pulses is accumulated in the variable NTi over time.
After counting the number of pulses, the true gas volume is computed by calibrating the actual
NTi by the corresponding programmed calibration factor CF of the j-th MGC as follows:
Vj,i = CFj × NTi,
where j = {1,··· ,Number of MGC} and i = {1,··· ,Number of samples}.
After describing the internal mechanism of AGDAC, Table 1 presents the main differences between Rigamo, the DAC system provided by the MGC, and AGDAC, the system proposed in this study.
In summary, the AGDAC sensor-interface system offers several advantages over Rigamo, including low cost (around 10) compared to Rigamo’s $2,181.48, thanks to no licensing requirements. AGDAC is underpinned by an Arduino interface, which, aside from its economical nature, offers the invaluable attribute of scalability. In practical terms, this entails the capability to concurrently operate a secondary AGDAC if the need arises to expand beyond the limitations of 13 measurement channels. For example, the cost of two device units is around 20$, which is still an affordable cost. Additionally, AGDAC is flexible because it allows multiple Python codes to run simultaneously on the same computer without creating conflicts in the data acquisition of different Arduino-python-based devices. It’s worth noting that the cost of the Rigamo system varies based on the number of enabled channels, and it can only be used on one computer at a time. Moreover, AGDAC uses the most popular language worldwide, PYTHON, a free, open-source language and powerful tool for developing complex applications in science. AGDAC can work well on any operational system, such as Windows, Linux, and Mac OS since its wide portability is based on Arduino and Python. This also provides a universal data storage system, CSV, which can be read in any operational system and processing program.
Considering the advantages as mentioned earlier, it is evident that:
  • AGDAC’s affordability makes it a practical choice for biogas applications.
  • The simplicity and accessibility of AGDAC components enable system customization and scalability to suit diverse experimental designs.
  • AGDAC is user-friendly, making it accessible to researchers with limited instrument development or coding experience.
  • Its foundation on free and open-source software empowers the development of advanced scientific applications.

3. Design Files

  • AGDAC AR code 1: Arduino IDE code that sense and record tilts.
  • AGDAC PY code 2: PYTHON code that records and saves Gas Volume production data in CSV file.
Table 2. Design file summary.
Design file File type Open source Location of the file
AGDAC AR code 1 ARDUINO IDE AGDAC Reserved doi: here
AGDAC PY code 2 PYTHON AGDAC Reserved doi: here

4. Bill of Materials

Table 3. List of materials.
Designator Component Number Cost per unit currency Total cost Source of materials
AR Placa Arduino Uno Atmega
328 Smd Arduino Uno
1 $11 $11 CINESTEC electronics
UC USB-B cable** 1 CINESTEC electronics
PWC 12 V x 1 A AC-DC power con-
verter, bivolt
1 $3,50 $3,50 CINESTEC electronics
PB Black Waterproof Plastic
Project Box ABS (41 x 73 x
99 mm)
3 $22 $22 Amazon
JP PJ-392 Stereo Female Socket
Jack with Screw
3 $7.4 $22,2 Amazon
AC Aux Cord Male to Male 1m 3 $8 $24 Amazon
JC 10 cm Male to Male Wire
Jumper Cable for Arduino
Breadboard*
1 $6.35 $6.35 Amazon
TS Pocket Tube Solder Wire Tin
1.0 mm*
1 $4 $4 Amazon
LSc QTEATAK 300Pcs Black Laptop Notebook Computer Replacement Screws Kit* 1 $6.49 $6.49 Amazon
TSc Self Tapping Pan Head Screws
M3x16 mm
4 $0.70 $2.8 Andorinha commercial
ASh Genmitsu CNC Materials
Acrylic Sheet, Transparent,
1Pcs 180 x 100 x 5 mm*
1 $4 $4 Amazon
BB 20pcs 5x7cm Bakelite DIY
Prototype Board PCB*
20 $6.99 $6.99 Amazon
Total cost ¬(3 channels AG-
DAC)
1 $106.4 $106.4
Total cost (> 3 channels
AGDAC)
1 $113.33 $113.33
() Components sold in multi-packs. The number of components is in excess per AGDAC unit. (∗∗) Multi-package component. USB cable included in AR item. (¬) Cost includes the total cost of kits. (⊢) Cost includes the total cost of kits.

5. Build Instructions

The specifications below describe the building instructions of the hardware based on the Arduino interface and software on Arduino and Python programs. A graphical description of the circuitry employed is represented in Figure 3. The indicators of each material used are listed in Table 3.
  • Step 1. Arduino component
In Figure 3a shows the building configuration on an AR for three channels AGDAC. Each channel is assumed to be connected to each MGC through a stereo cable (AC). The circuitry between the different components is as follows:
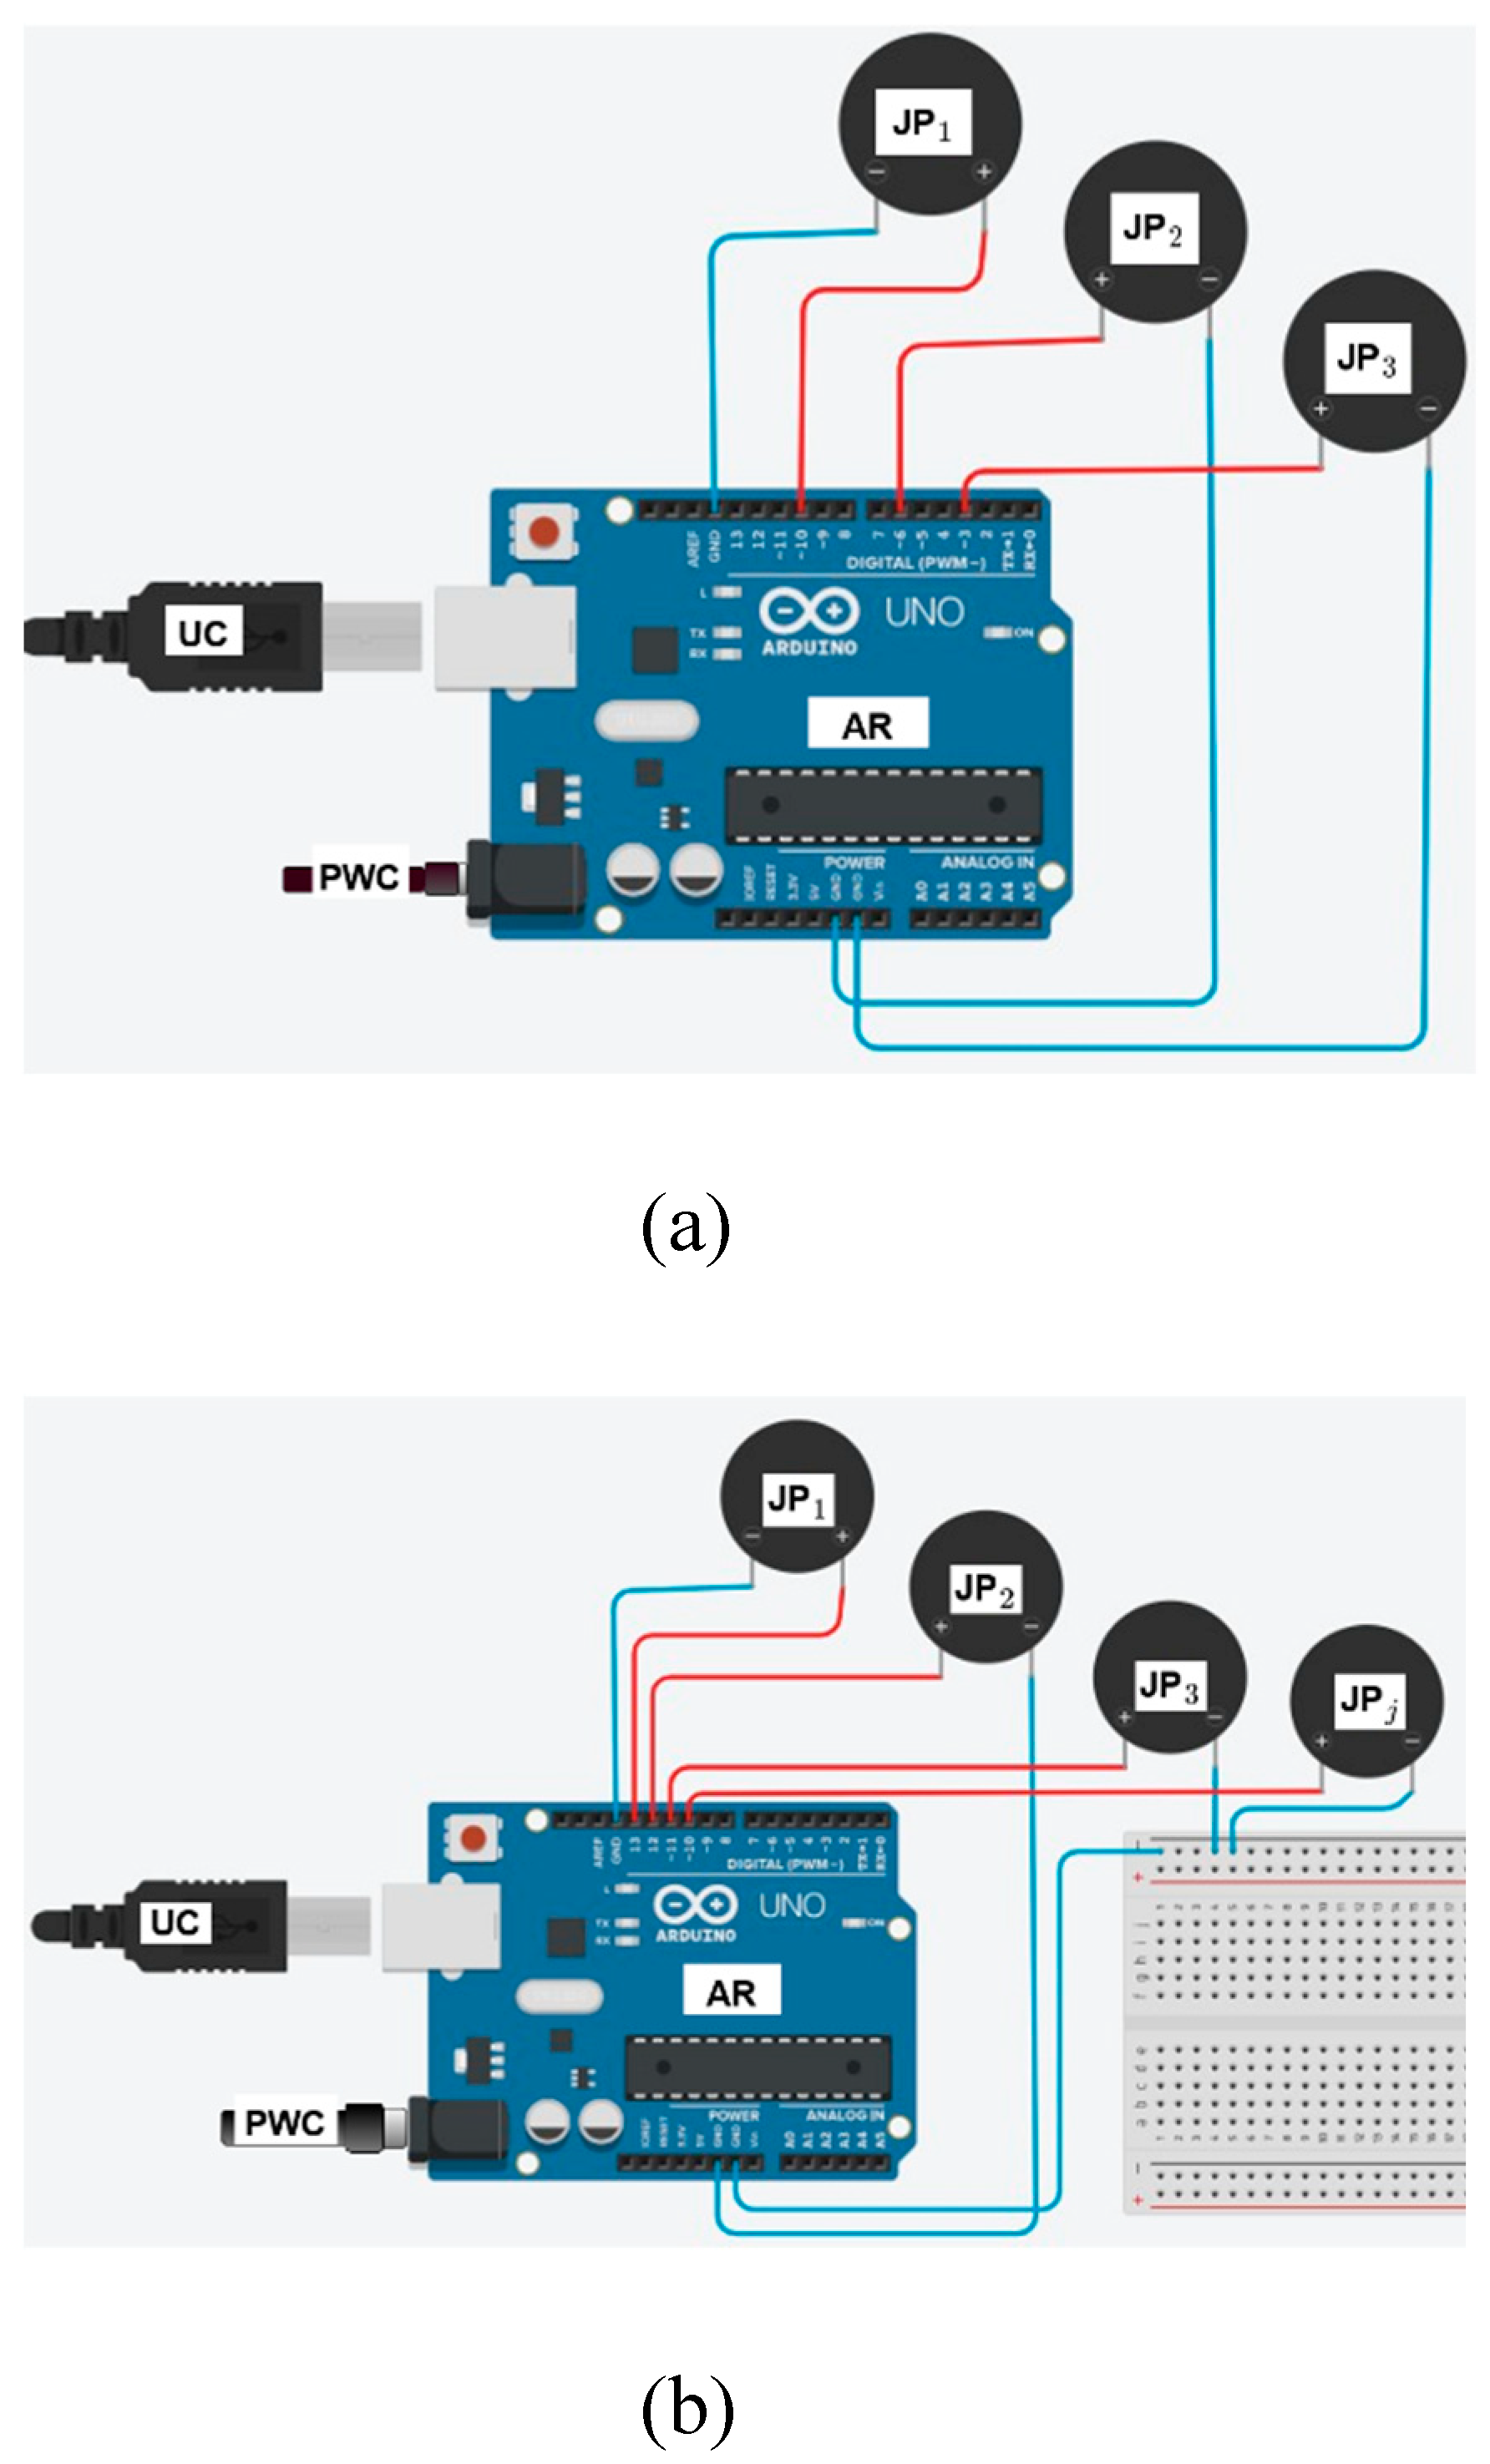
  • Identify each JP’s signal and ground pins (JP1, JP2, and JP3). It can be easily found by identifying the configuration of the plug with a continuity mode of a multimeter.
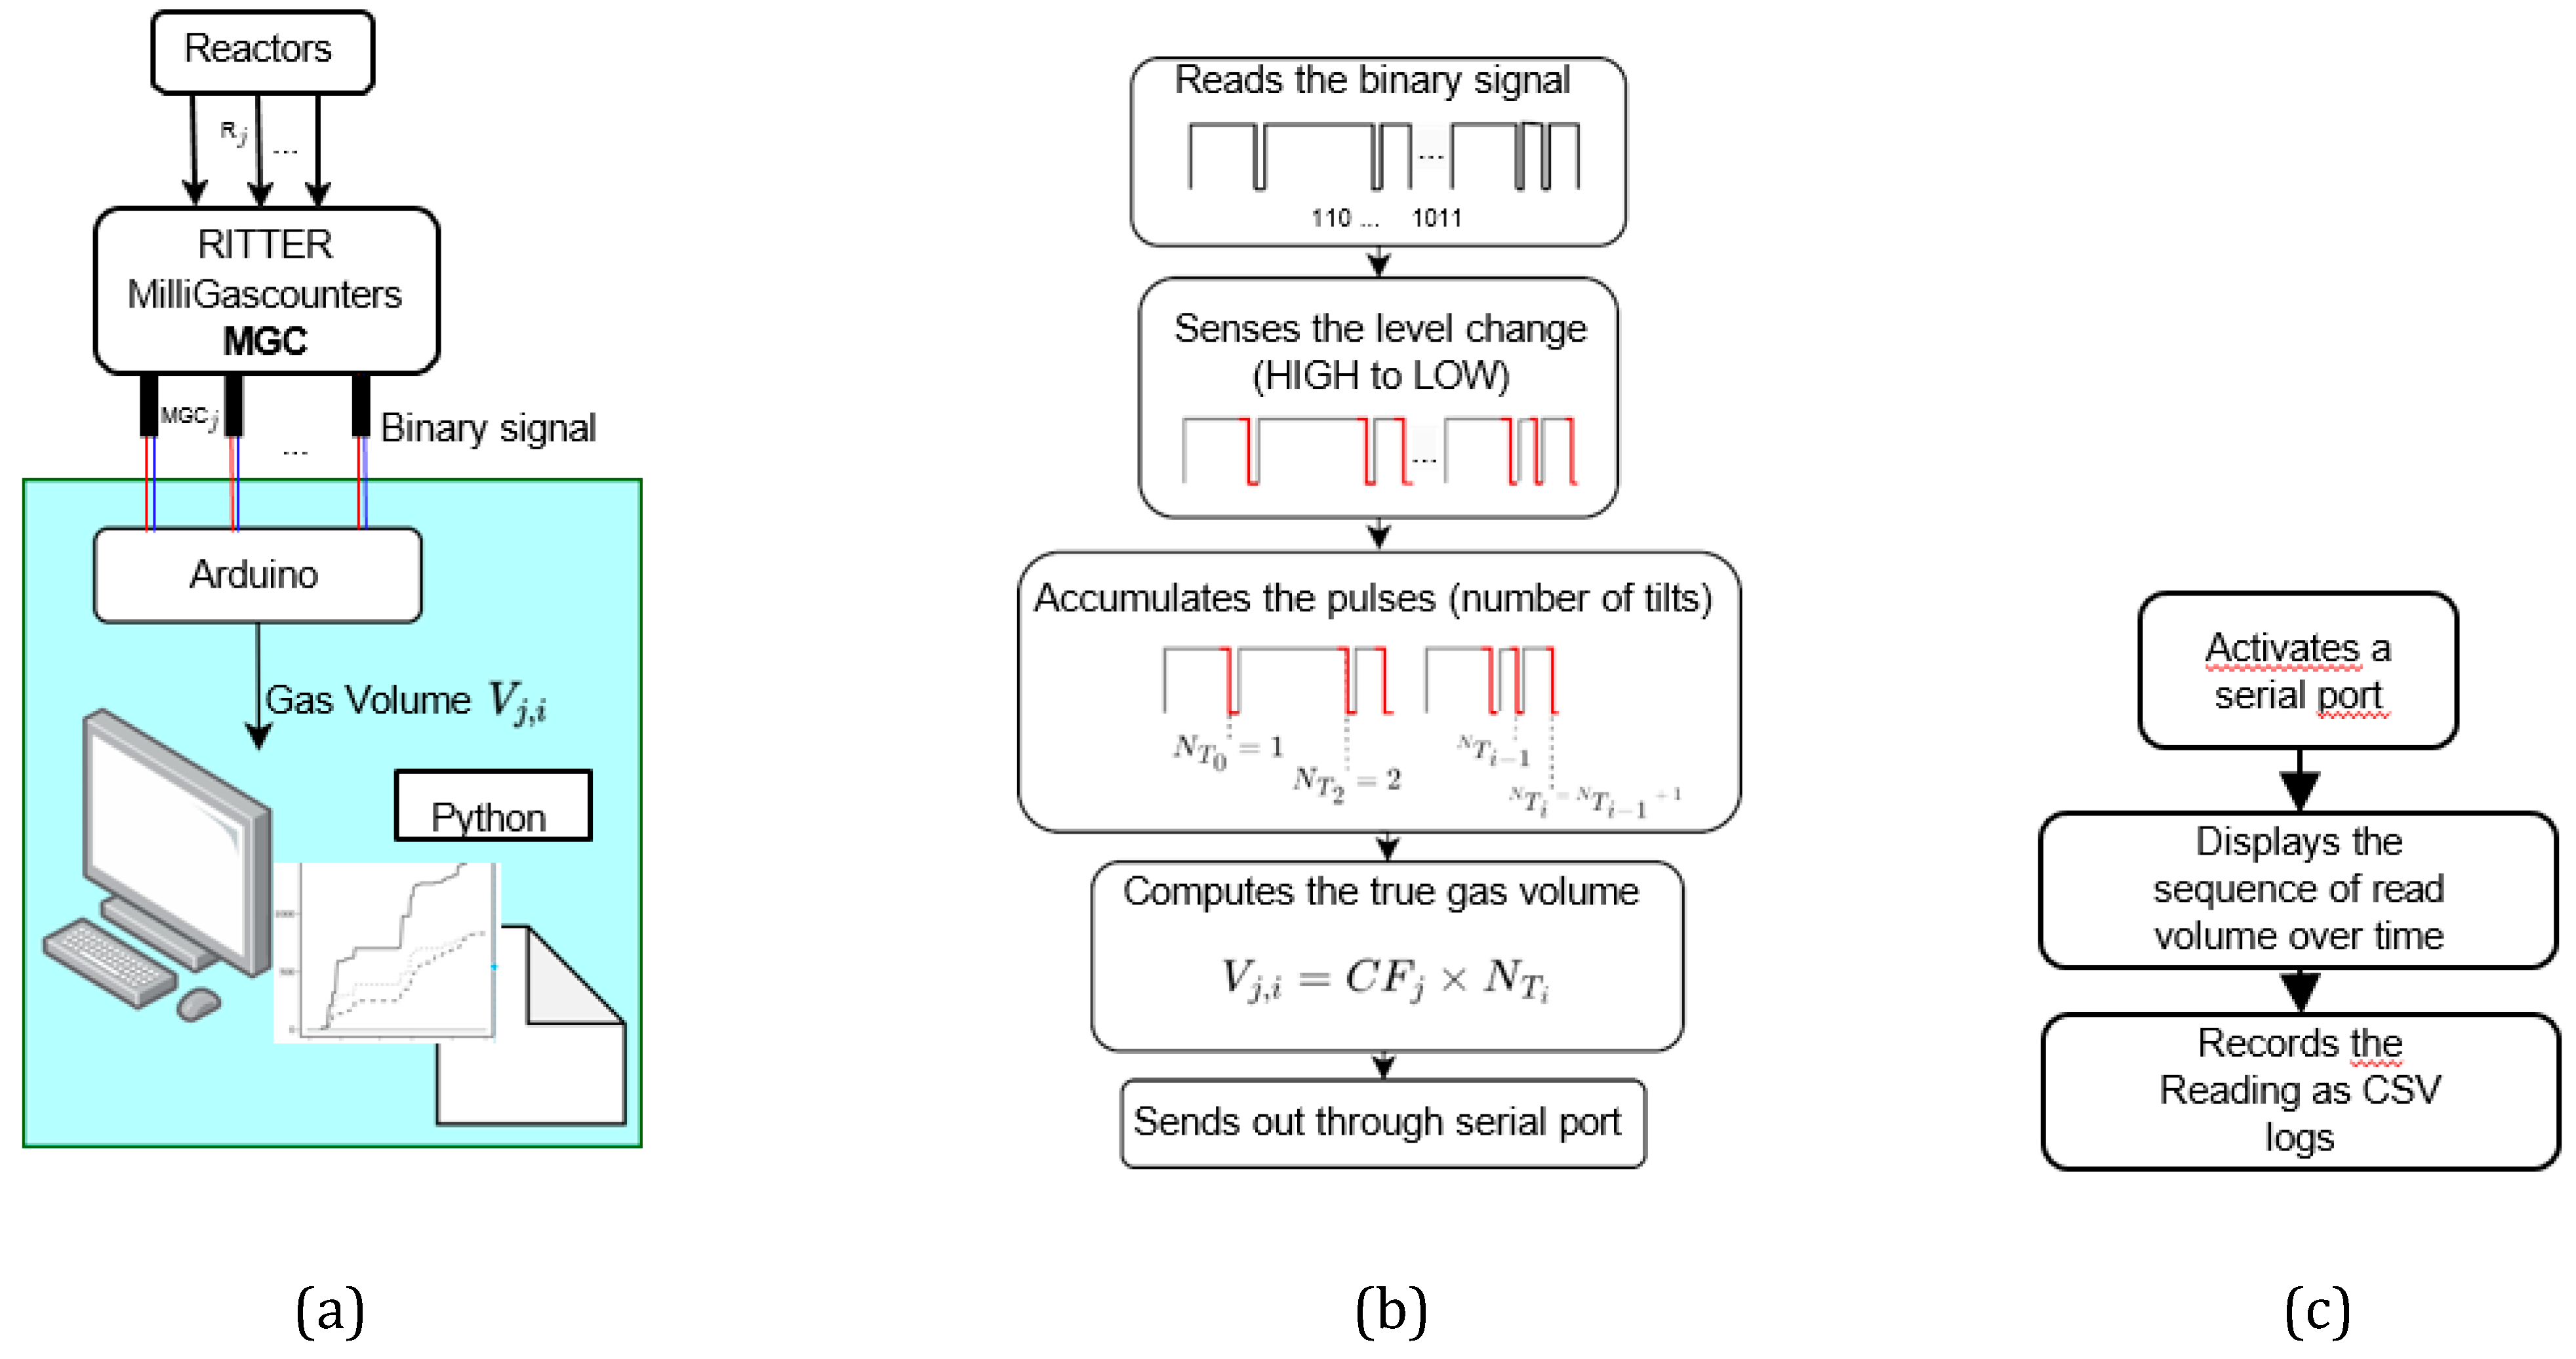
  • Select 3 digital pins on AR to read the binary signal from the 3 MGCs. Here, Pins 3, 6 and 10 were chosen.
  • Prepare wires long enough to connect each JP’s signal and ground pins to the digital and ground pins on AR, respectively. In Figure 3a, red and blue lines correspond to the signal and ground wires.
  • Connect:
    -
    The signal (red) and ground (blue) wires of JP1 to the pin 3 and one GND pin on
    AR, respectively.
    -
    The signal (red) and ground (blue) wires of JP2 to the pin 6 and another GND pin on AR, respectively.
    -
    The signal (red) and ground (blue) wires of JP3 to the pin 10 and one GND pin on
    AR, respectively.
  • Feed power to AR by using a PWC (optional).
  • Connect the AR to the computer through UC.
In case of needing more than 3 channels, the circuitry building construction is depicted in Figure 3b, and the building instructions are as follows:
  • Follow the instructions as mentioned earlier only for two JPs. Signal wires of JPs can be systematically connected.
  • Wire the last free GND pin to a mini breadboard. This extends the number of GND pins proportionally to the rest of the signal pins on AR. In Figure 3b, for example, the 3th and the others represented by the j-th JPs can be added.
Figure 3. Setup for reading (a) three MGCs, and (b) more than three MGCs.
Preprints 143157 g003
  • Step 2. Arduino IDE preparation
  • Download and install Arduino IDE 1.8.19 ( available here).
  • Open the code (refer to Design Files of Table 3).
  • Step 3. Python IDE preparation
  • Download and install PYTHON from here, or through Anaconda IDE 3, available here.
  • Install Python-Serial package. This tutorial may help.
  • Open the code (refer to Design Files of Table 3).

6. Operation Instructions

  • Step 1. Arduino IDE inputs configuration
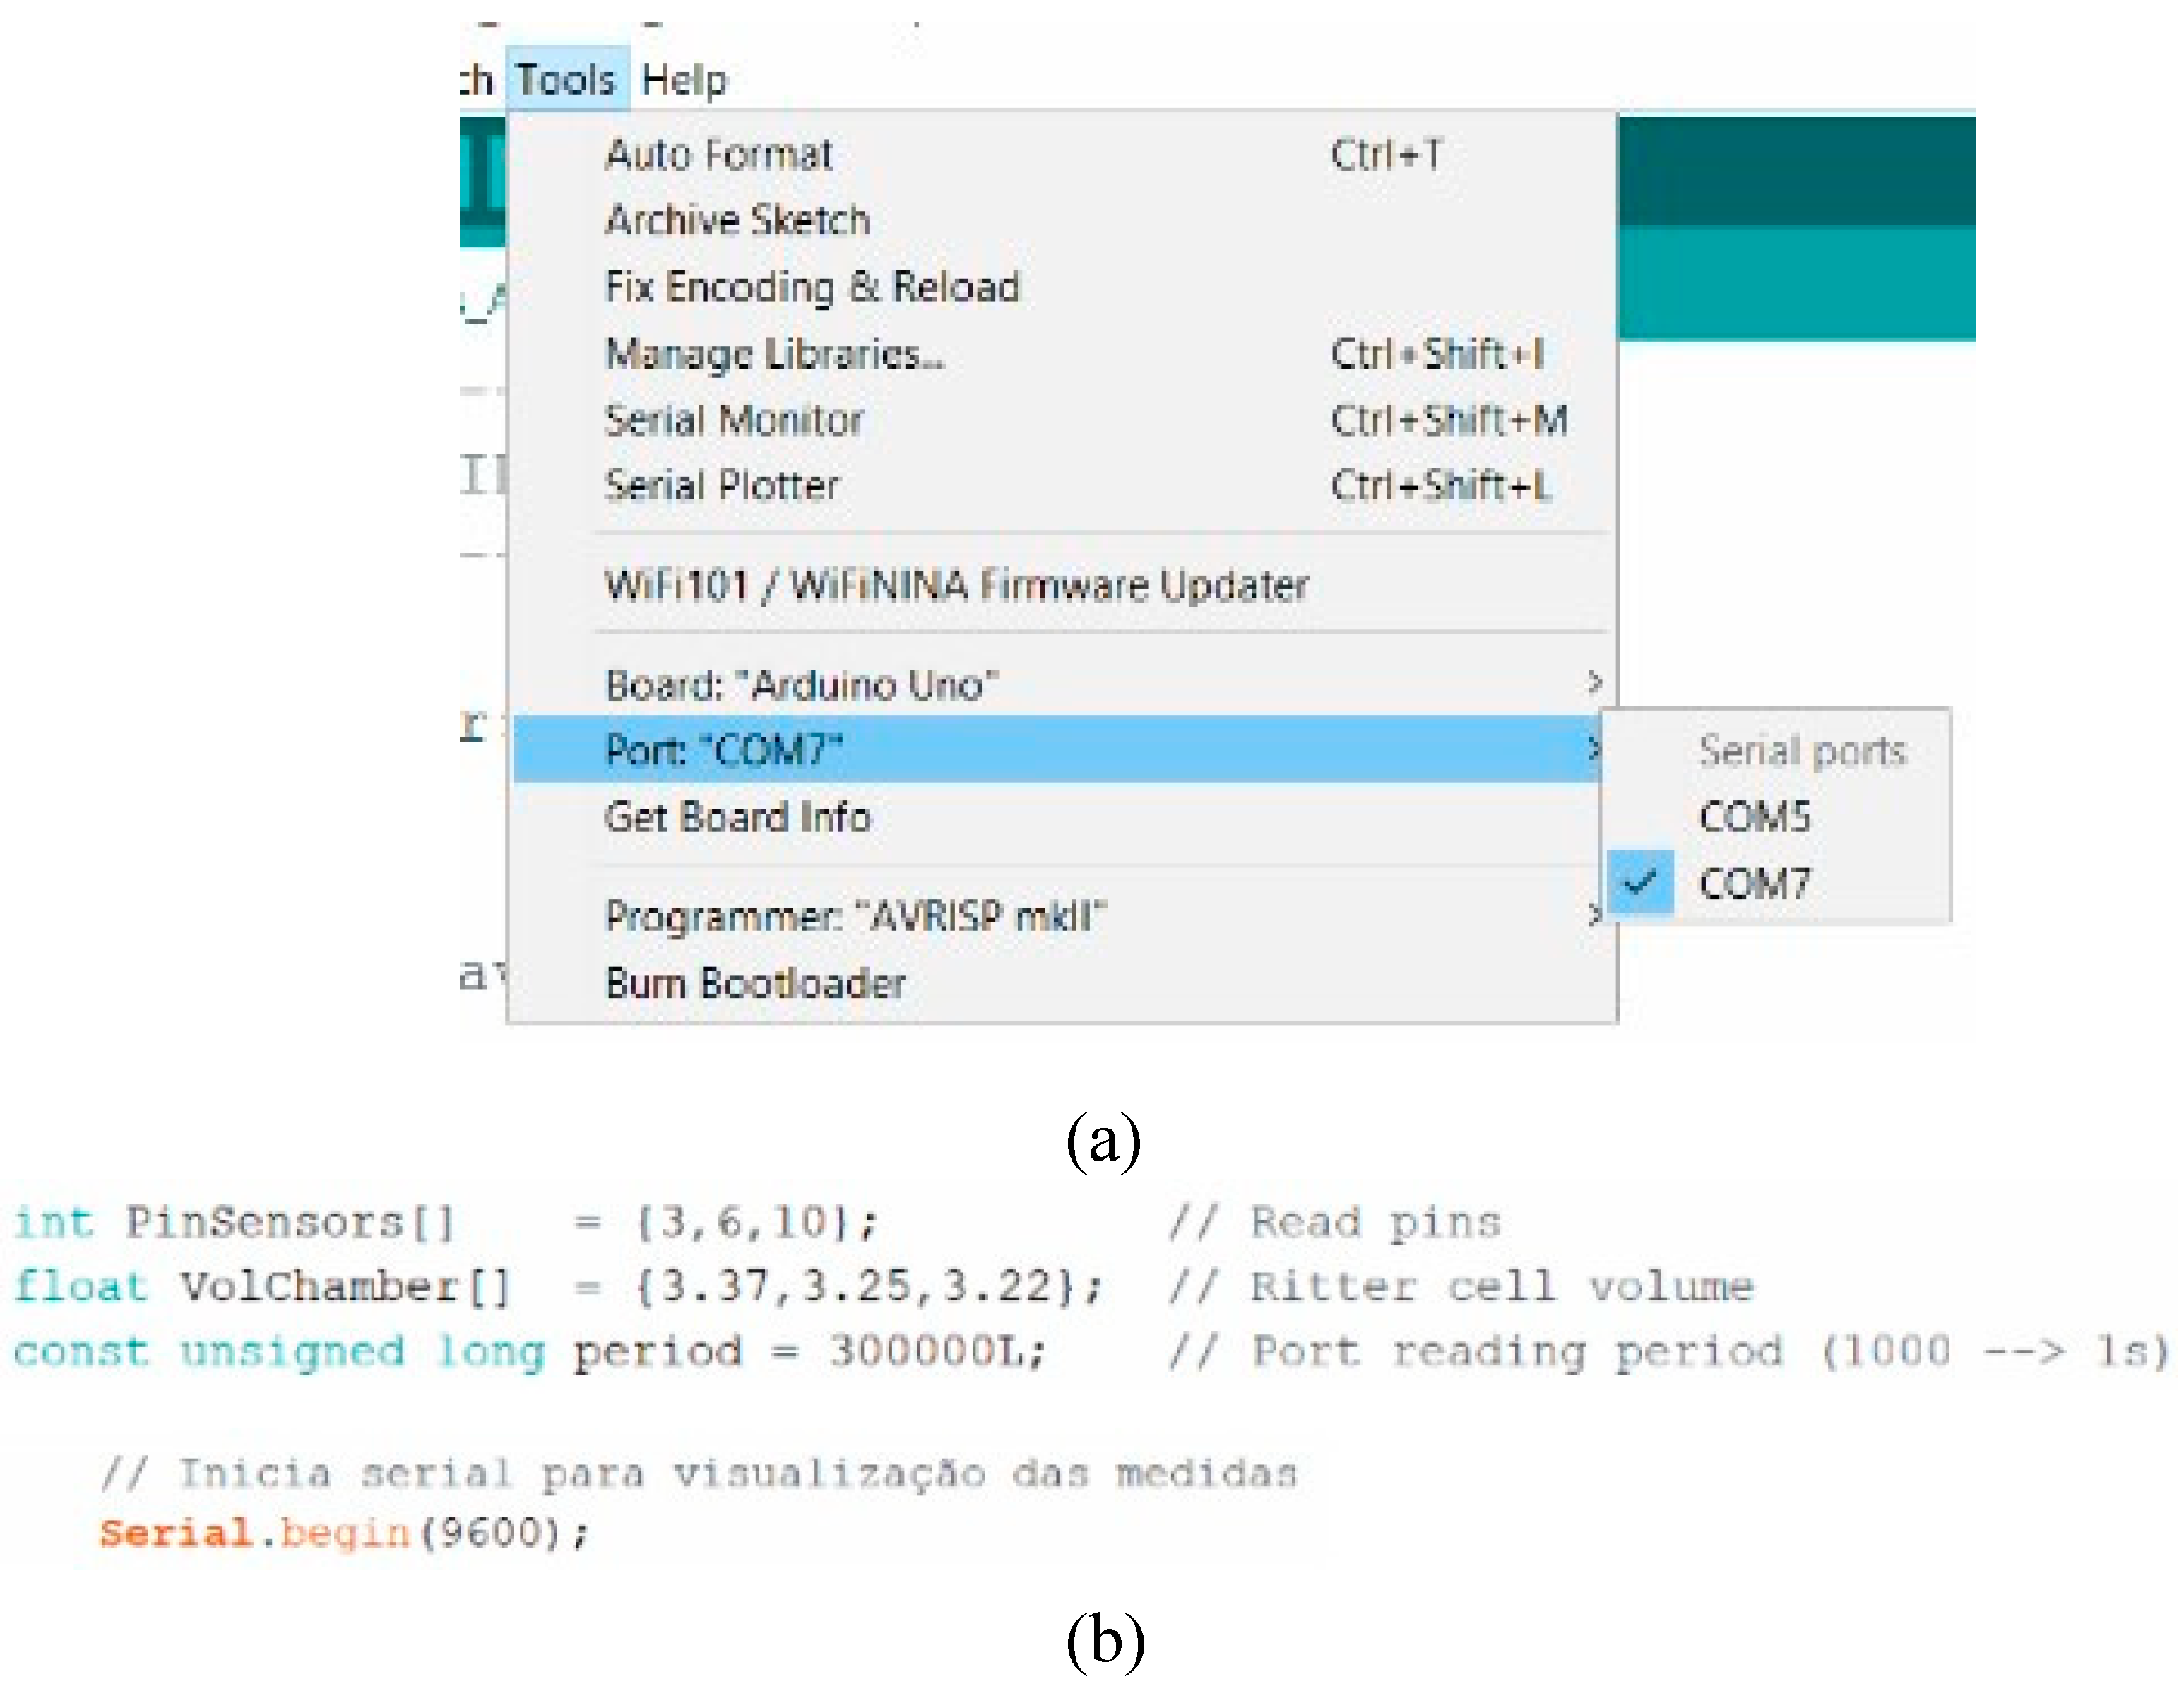
  • Within the Arduino IDE, in the Tools panel, select (see Figure 4a):
    -
    Board: “Arduino UNO”
    -
    Processor: “ATmega328P” Port: select an available COM port.
  • Set the input parameters (see Figure 4b:
    -
    PinSensors for the selected pin number (e.g. 3, 6 and 10, as Figure 3a),
    -
    VolChamber for the corresponding cell volume of each MGC to which the pins refer and
    -
    period for the period of time in which a print will be performed (e.g., 5 minutes = 300000L)
    -
    Serial.Begin, the data rate in bits per second (baud) for serial data transmission is 9600.
Note that PinSensors and VolChamber are defined as arrays. In the case of using only one channel, the braces are still necessary. In addition to periodic prints, the program is designed to display updates for each channel whenever a pulse change occurs within that period. Moreover, refer to milligascounters page to select the appropriate cell volume, VolChamber, or see the defined cell volume in the MGC cell.
Before putting it into operation, ensure all wires are correctly inserted into the AR board, the board is connected to the computer, and the correct board type and port are selected in the Arduino IDE.
3.
Upload the sketch into AR.
  • Step 2. Python IDE inputs configuration
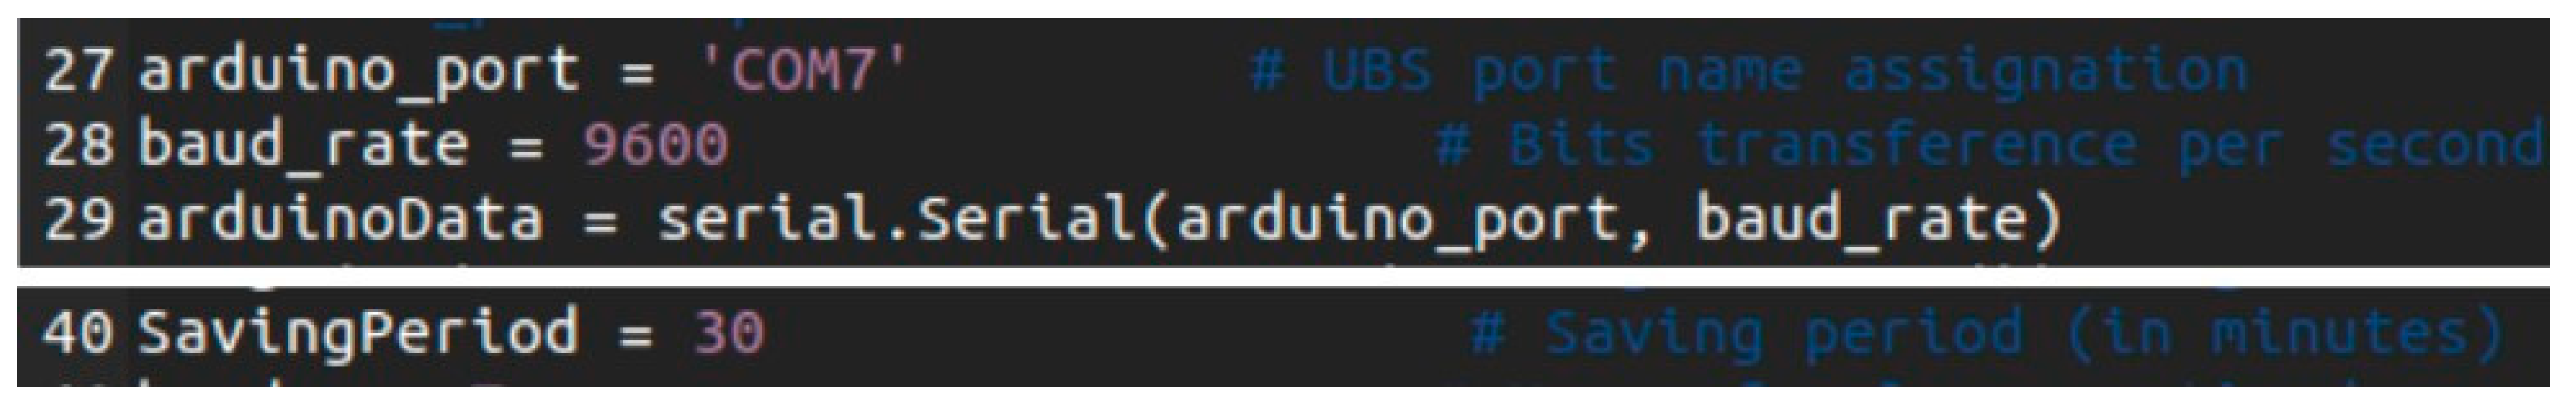
  • Set the input parameters as shown in Figure 4b. This consists of:
    -
    arduino port for the COM port identifier. Ensure that the selected COM port matches the physical port the board is plugged into.
    -
    baud rate for serial data transmission as the same it was defined in Arduino (Serial.begin of Step 1.)
    -
    SavingPeriod for the period in which a log file will be saved (e.g., 30 minute).
  • Remove any CVS file from .../AGDAC/temporal
  • Run the program
Figure 4. Arduino IDE inputs configuration, (a) board and COM port selection, and (b) input parameters.
Preprints 143157 g004
Figure 5. Python IDE inputs configuration.
Preprints 143157 g005

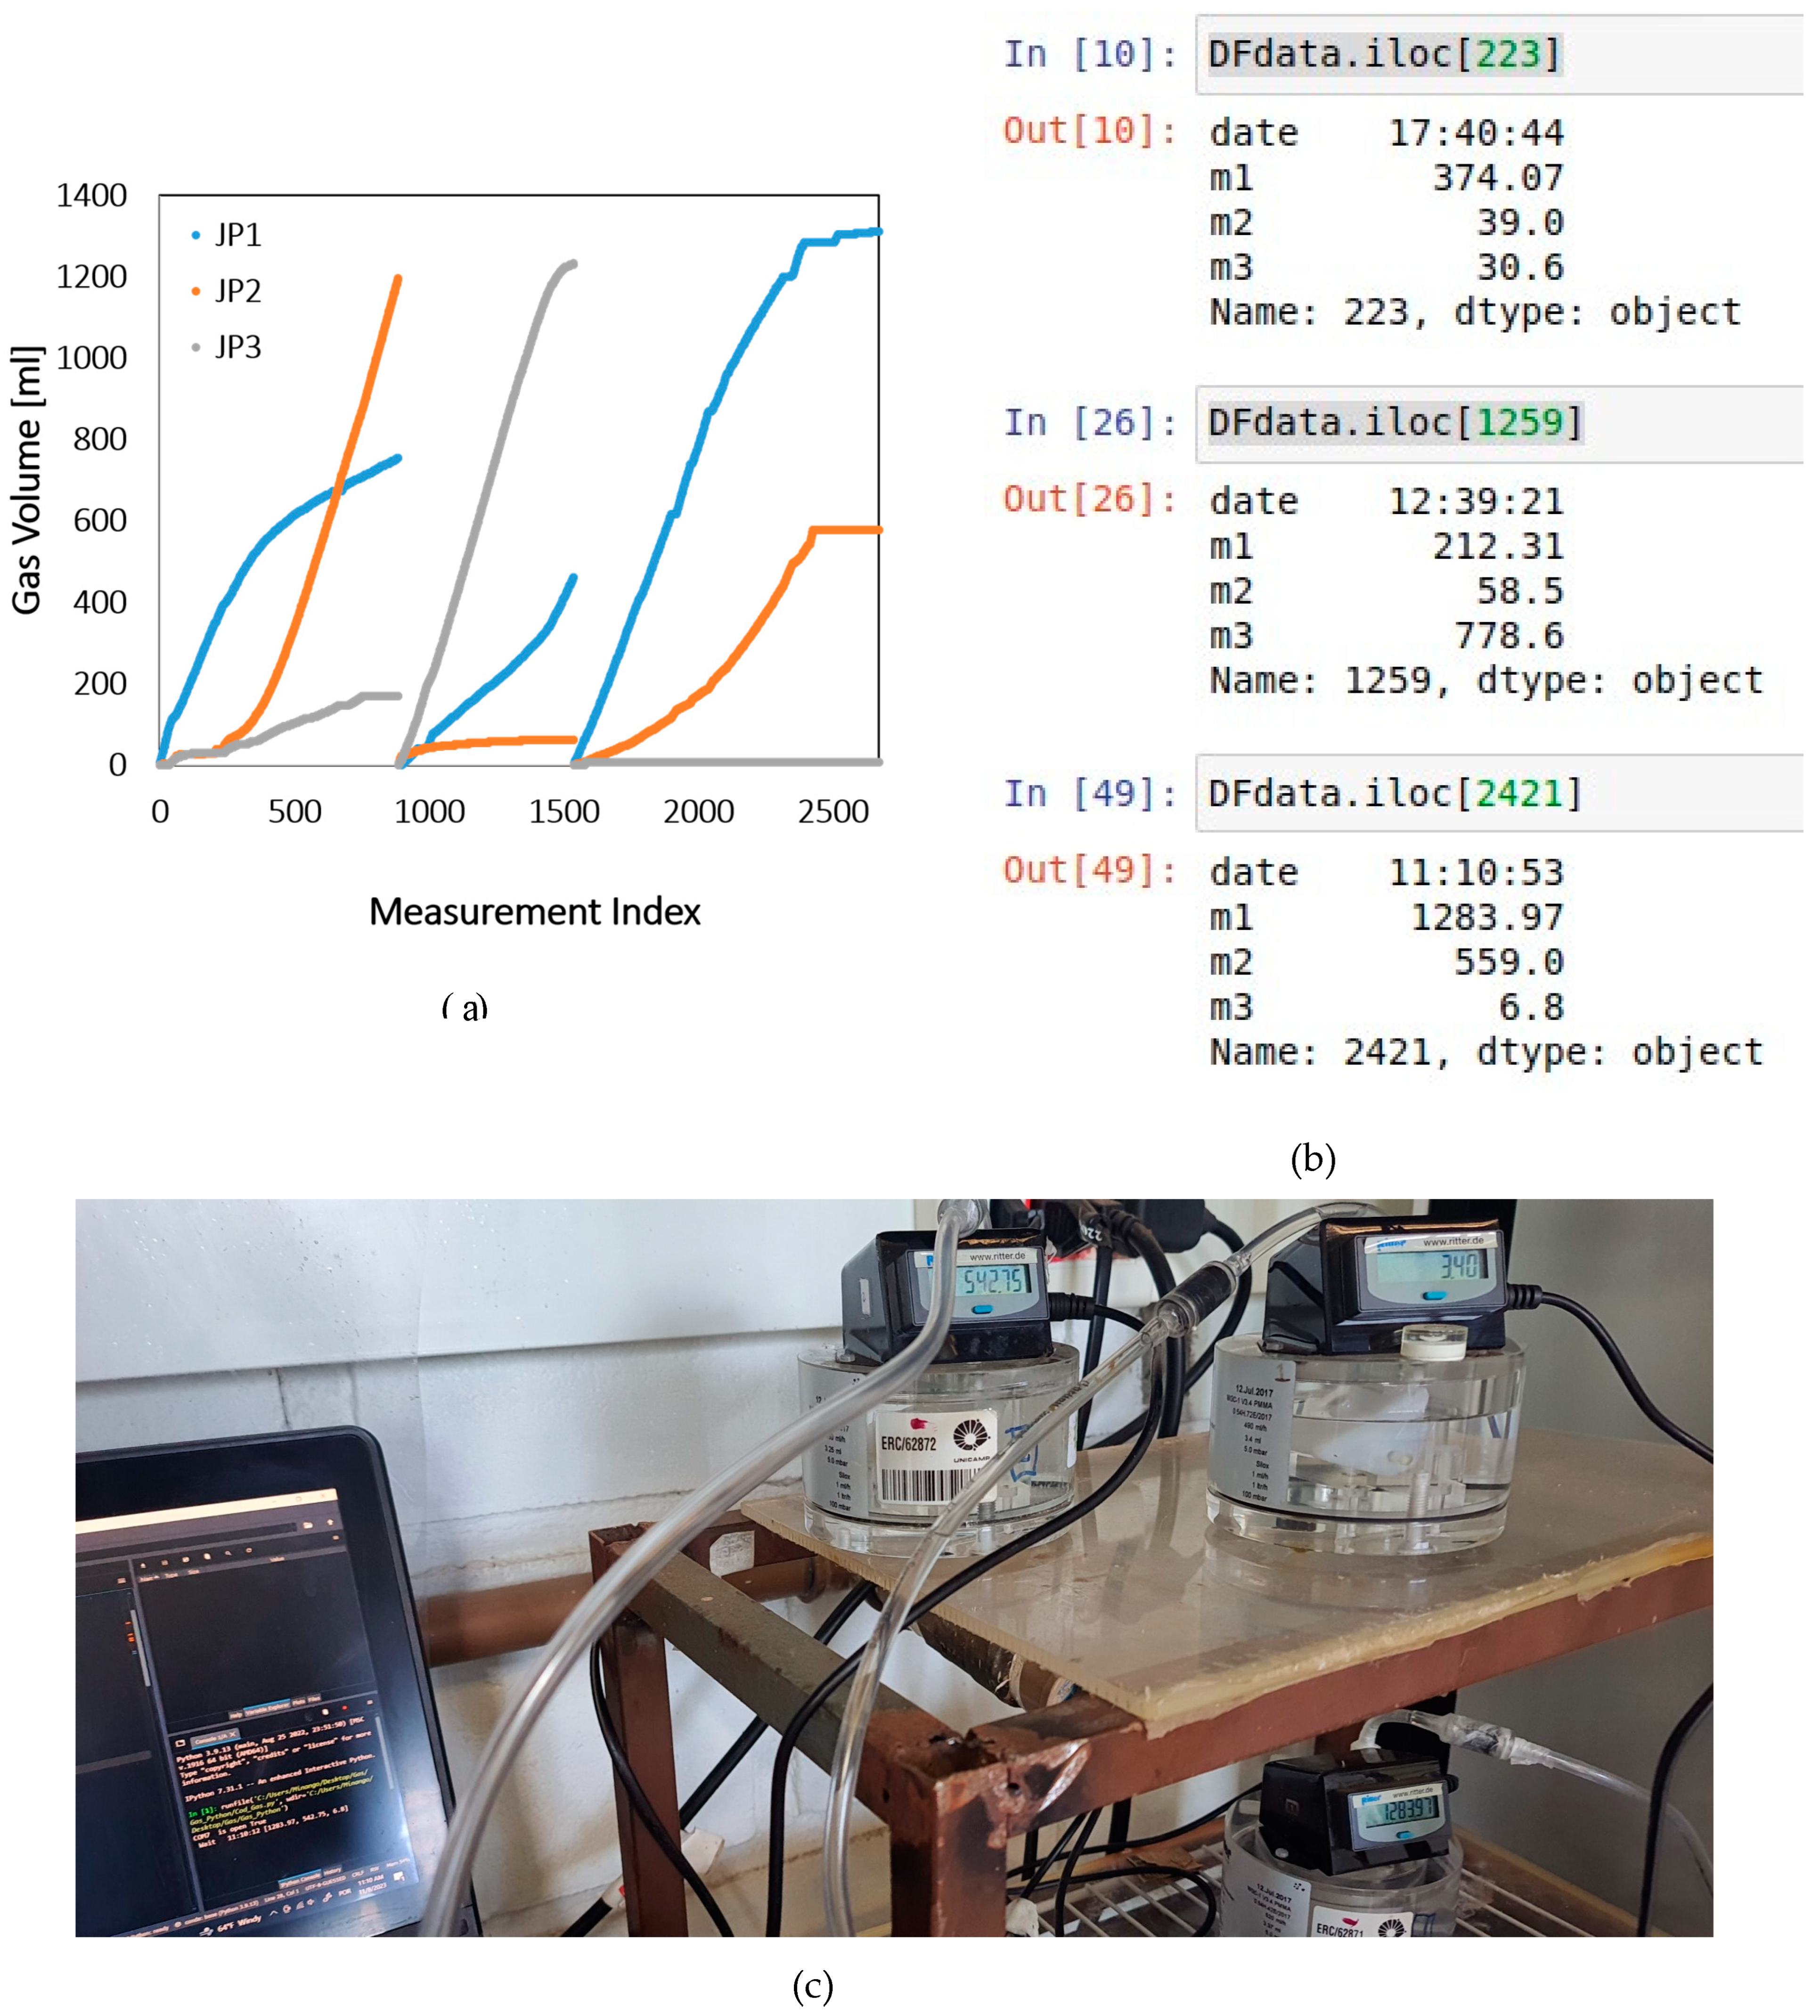
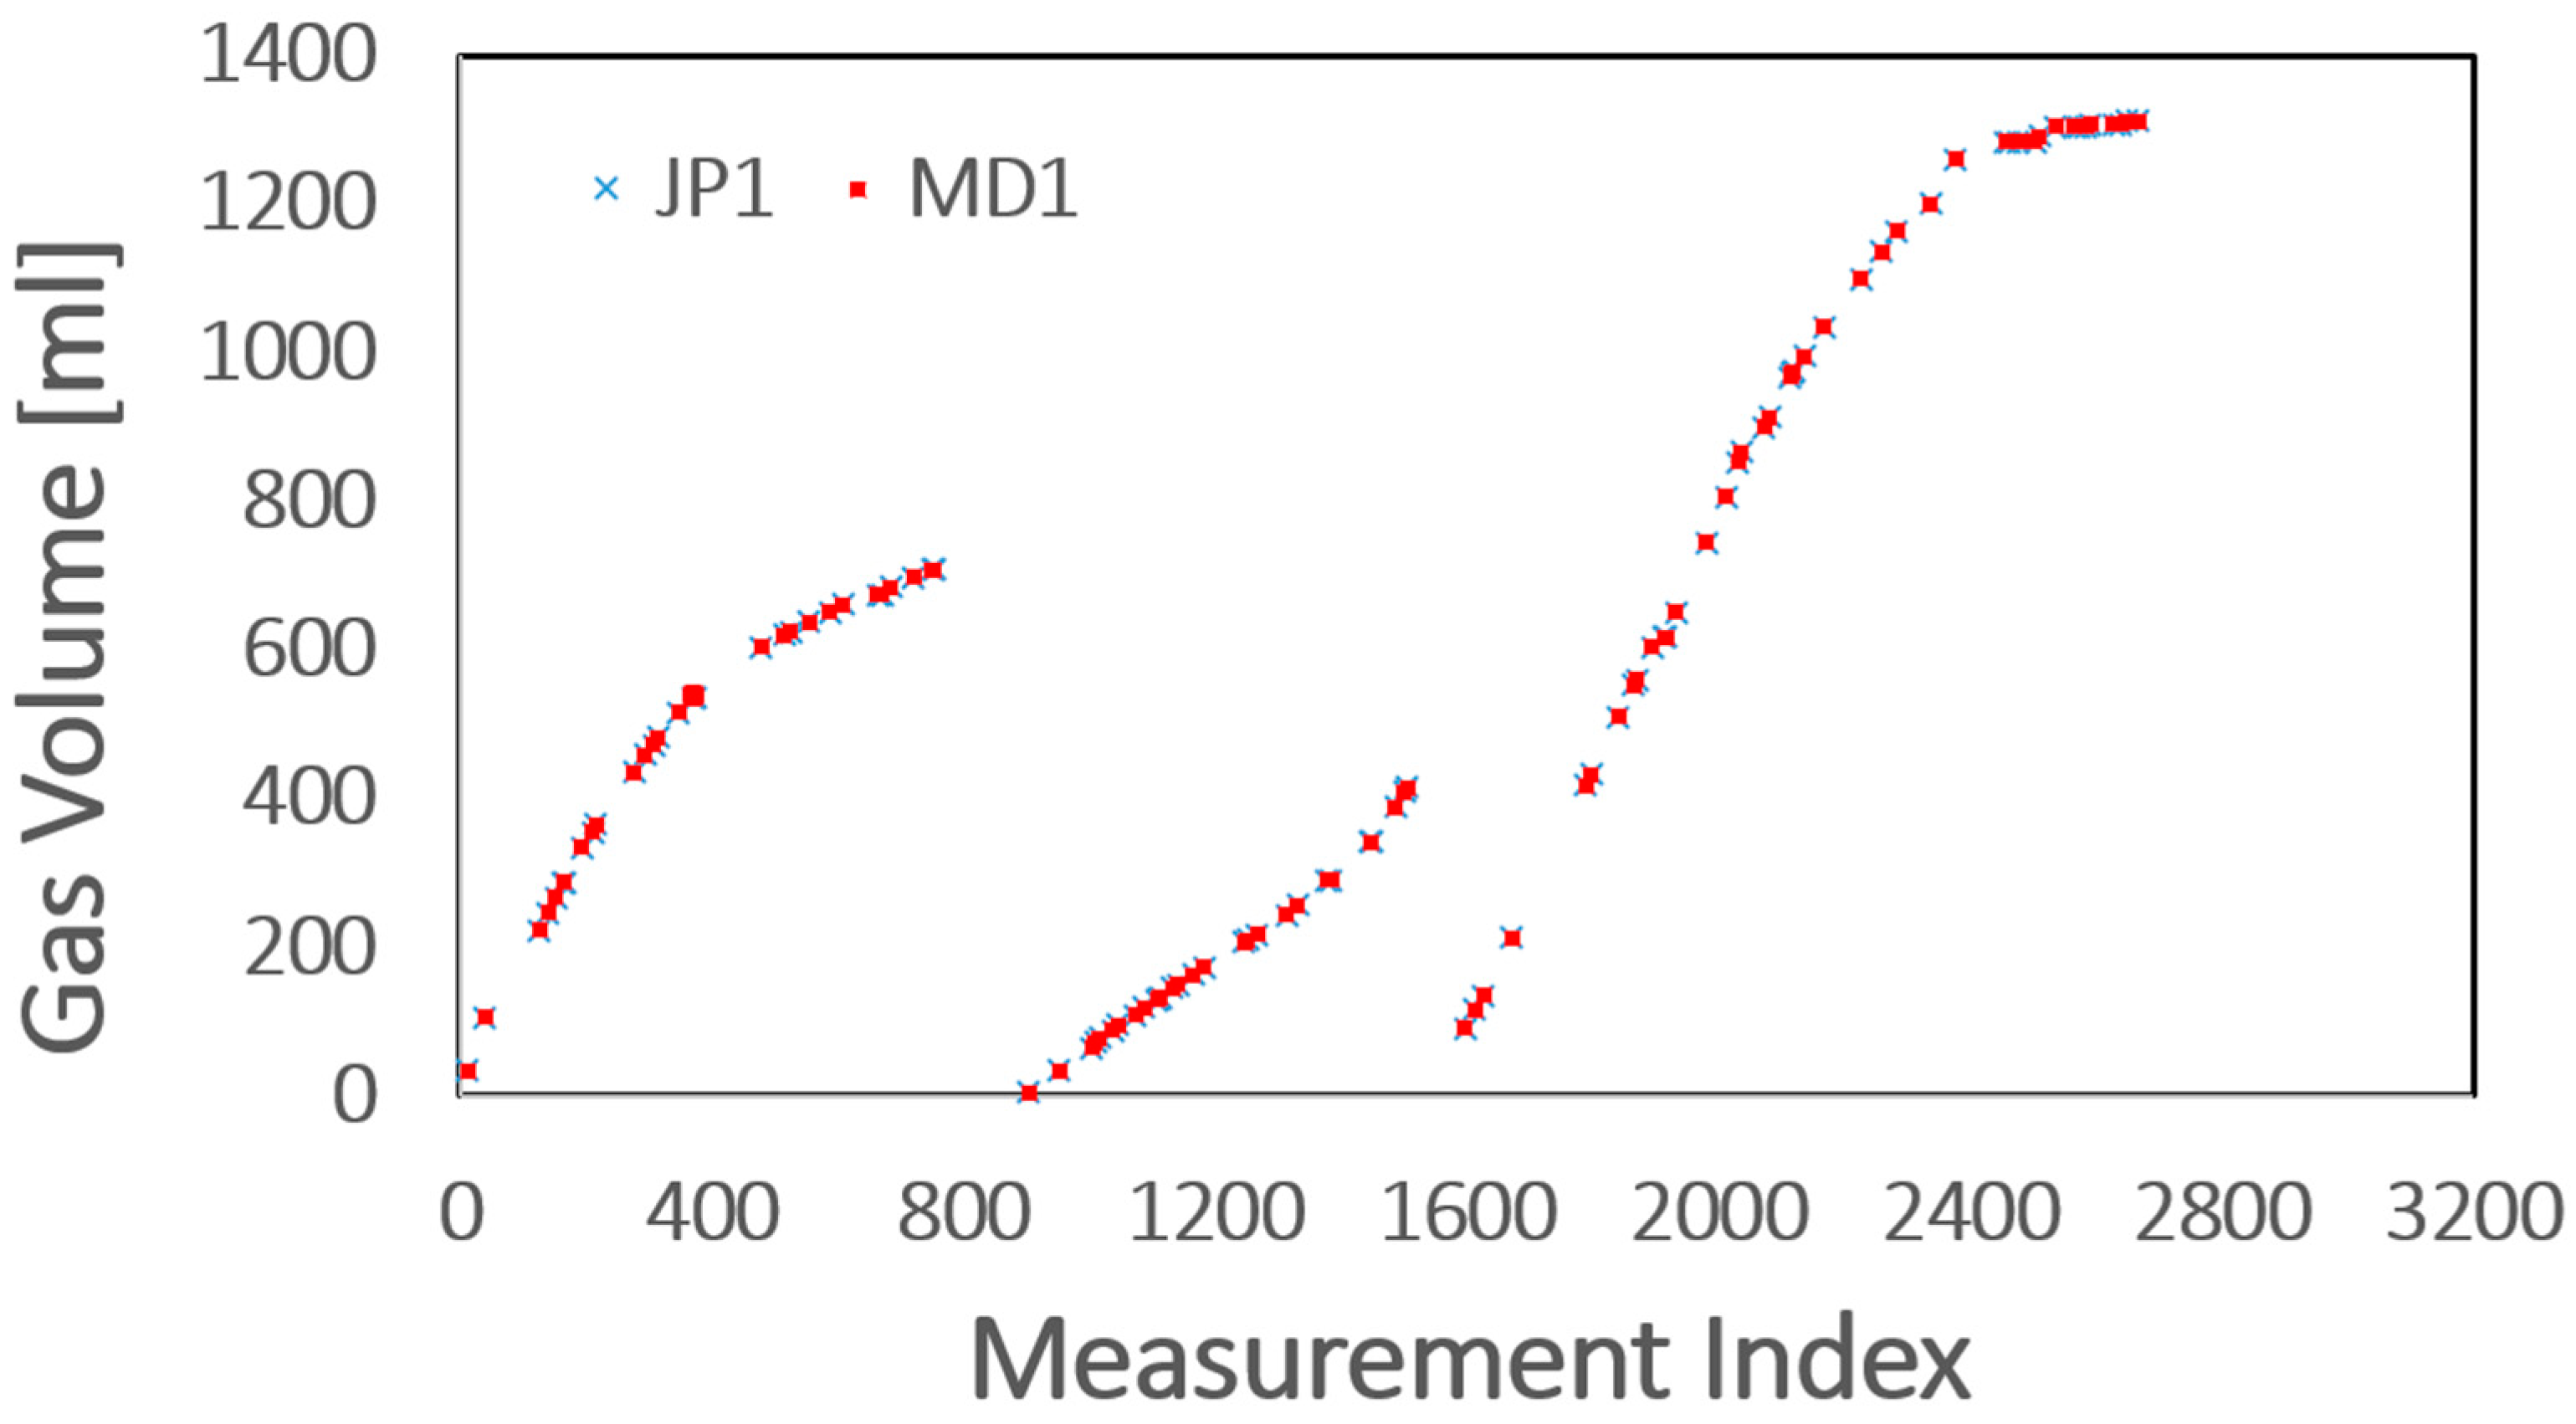
7. Validation and Characterization

The quality control of AGDAC was evaluated using three-batch anaerobic reactors. For validation, the data displayed by the MGC 6c was compared with the data collected by AGDAC 6b and shown on the screen in 6c, with measurements taken twice daily for one week.
Among the results, the data displayed by the AGDAC in line 49 (Figure 6b) showed gas volume values of 1283.97 ml, 559.0 ml, and 6.8 ml, corresponding to the MGC commercial equipment m1, m2, and m3, respectively. The results obtained were in real-time agreement with all MGC equipment except for m3, which exhibited a single pulse variation due to the reactor’s internal operational conditions. This variation was visually observed as the liquid exited the MGC and returned to the reactor, resulting in a data loss detected by the MGC equipment m3.To statistically validate the results, 100 data points were collected over time (Figure 7), and a t-test was conducted. The analysis yielded a p-value of 1 (p-value >0.05), indicating no significant difference between the results.
Consequently, AGDAC consistently achieves data acquisition and control quality comparable to expensive, sophisticated, high-performance systems while maintaining a simple, cost-effective, and user-friendly design. Additionally, AGDAC exhibits remarkable resilience when the sensor of the MGC equipment is impacted by operational conditions or battery discharge.

8. Future Work

The AGDAC sensor-interface system is pulse hardware used to detect binary responses. It offers a versatile and affordable approach to support biochemical experiments. Additionally, Extending the functionality by including additional cost-effective and custom-made hardware is possible. For example, AGDAC could be used in enzyme activity assays, where LEDs and photodiodes can detect changes in light transmission or fluorescence, indicating the presence or absence of enzyme activity. AGDAC could be integrated with biosensors to detect the presence of biomolecules or temperature and pH changes, sending a binary signal to indicate the detection. Furthermore, AGDAC can also be adapted to a sensor for colorimetric/light detection assays to detect color or light changes to determine the presence or absence of viable cells or live or dead cells.

9. Conclusion

The AGDAC sensor-interface system has proven capable of producing results comparable to those of established commercial instruments. The absence of measurement errors further underscores the prototype’s suitability for various applications where accuracy and reliability are crucial. Consequently, AGDAC delivers data acquisition and control quality on par with expensive, sophisticated, high-performance systems while maintaining a simple, cost-effective, and user-friendly design.

Declaration of Interest

The authors declare that they have no known competing financial interests or personal relationships that could have appeared to influence the work reported in this paper.

Acknowledgements

The São Paulo Research Foundation (FAPESP), Grant number 2019/03200-7. Grantee: Carla Flores-Rodríguez.

Credit Author Statement

Carla Flores-Rodriguez: Conceptualization, Data curation, Formal Analysis, Investigation, Methodology, Validation, Writing - Original Draft, Writing - Review Editing. Gustavo Mockaitis: Project administration, Funding acquisition.

References

  1. C. Moreno, A. Gonz’alez, J. L. Olazagoitia, and J. Vinolas, “The acquisition rate and soundness of a low-cost data acquisition system (lc-daq) for high frequency applications,” Sensors, vol. 20, no. 2, 2020.
  2. C. Flores-Rodriguez, C. Nagendranatha Reddy, and B. Min, “Enhanced methane production from acetate intermediate by bioelectrochemical anaerobic digestion at optimal applied voltages,” Biomass and Bioenergy, vol. 127, p. 105261, 2019. [CrossRef]
  3. EPA, “Anaerobic digester/biogas system operator guidebook,” 2020.
  4. S. A. Kerstin Maurus, Nicola Kremmeter and M. Kazda, “High-resolution monitoring of vfa dynamics reveals process failure and exponential decrease of biogas production,” Biomass Conversion and Biorefinery, 2021. [CrossRef]
  5. T. Tikhomirova, M. Taraskevich, and O. Ponomarenko, “The role of laboratory-scale bioreactors at the semi-continuous and continuous microbiological and biotechnological processes,” Applied microbiology and biotechnology, vol. 102, p. 7293—7308, September 2018. [CrossRef]
  6. M. Walker, Y. Zhang, S. Heaven, and C. Banks, “Potential errors in the quantitative evaluation of biogas production in anaerobic digestion processes,” Bioresource Technology, vol. 100, no. 24, pp. 6339–6346, 2009. [CrossRef]
  7. B. R. Dhar, Y. Gao, H. Yeo, and H.-S. Lee, “Separation of competitive microorganisms using anaerobic membrane bioreactors as pretreatment to microbial electrochemical cells,” Bioresource Technology, vol. 148, pp. 208–214, 2013. [CrossRef]
  8. R. Ganesh, M. Torrijos, P. Sousbie, A. Lugardon, J. P. Steyer, and J. P. Delgenes, “Single-phase and two-phase anaerobic digestion of fruit and vegetable waste: Comparison of start-up, reactor stability and process performance,” Waste Management, vol. 34, no. 5, pp. 875–885, 2014. [CrossRef]
  9. C. Amodeo, S. Hattou, P. Buffiere, and H. Benbelkacem, “Temperature phased anaerobic digestion (tpad) of organic fraction of municipal solid waste (ofmsw) and digested sludge (ds): Effect of different hydrolysis conditions,” Waste Management, vol. 126, pp. 21–29, 2021. [CrossRef]
  10. L. T. Fuess, L. S. M. Kiyuna, A. D. N. Ferraz, G. F. Persinoti, F. M. Squina, M. L. Garcia, and M. Zaiat, “Thermophilic two-phase anaerobic digestion using an innovative fixed-bed reactor for enhanced organic matter removal and bioenergy recovery from sugarcane vinasse,” Applied Energy, vol. 189, pp. 480–491, 2017. [CrossRef]
  11. N. Wieczorek, M. A. Kucuker, and K. Kuchta, “Fermentative hydrogen and methane production from microalgal biomass (chlorella vulgaris) in a two-stage combined process,” Applied Energy, vol. 132, pp. 108–117, 2014. [CrossRef]
  12. A. Kovalev, E. R. Mikheeva, V. Panchenko, I. V. Katraeva, D. A. Kovalev, E. A. Zhuravleva, and Y. V. Litti, “Optimization of energy production from two-stage mesophilicndash;thermophilic anaerobic digestion of cheese whey using a response surface methodology approach,” Energies, vol. 15, no. 23, 2022. [CrossRef]
  13. Ritter, “Milligascounter,” 2022.
  14. Ritter, “Rigamo,” vol. V 3.1, 2017.
  15. K. M. McLean, A. L. Pasulka, and E. E. Bockmon, “A low-cost, accessible, and high-performing arduino-based seawater ph control system for biological applications,” HardwareX, vol. 10, p. e00247, 2021. [CrossRef]
  16. P. Reguera, D. Garc’ıa, M. Dom’ınguez, M. Prada, and S. Alonso, “A low-cost open source hardware in control education. case study: Arduino-feedback ms-150,” IFAC-PapersOnLine, vol. 48, no. 29, pp. 117–122, 2015. IFAC Workshop on Internet Based Control Education IBCE15.
  17. J. Sarik and I. Kymissis, “Lab kits using the arduino prototyping platform,” in 2010 IEEE Frontiers in Education Conference (FIE), pp. T3C–1–T3C–5, 2010.
  18. A. Vidal-Pardo and S. Pindado, “Design and development of a 5-channel arduino-based data acquisition system (abdas) for experimental aerodynamics research,” Sensors (Basel, Switzerland), vol. 18, 2018. [CrossRef]
  19. L. Loui, “Working principle of arduino and using it as a tool for study and research,” International Journal of Control, Automation, Communication and Systems, vol. 1, pp. 21–29, 2016.
  20. Naveenkumar and P. Krishna, “Low cost data acquisition and control using arduino prototyping platform and labview,” International Journal of Science and Research, vol. 2, pp. 366–369, 2013.
Figure 1. MGC internal design.
Preprints 143157 g001
Figure 2. (a) General system diagram for gas volume measurement using gasometers based on a tilting bucket design. (b) Flowchart schematic depicting functions in the Arduino IDE code. (c) Flowchart schematic illustrating functions in the Arduino IDE code.
Preprints 143157 g002
Figure 6. Volume measurements. (a) Gas volume rate, (b) gas volume data in a specific time, and (c) visual validation of gas volume.
Preprints 143157 g006
Figure 7. Gas volume (ml) collected using the AGDAC interface system (in plug JP1) compared to manually collected data (MD1).
Preprints 143157 g007
Table 1. Comparison between Rigamo (own the MGC) and AGDAC.
Rigamo AGDAC
Total cost $2,181.48 (One channel) $10
Interface component National Instrument (NI6025) based Signal Interface Module (SIM) Arduino UNO R3
Cost: $1,336.66 Cost: $10
Software LabVIEW based RIGAMO Arduino and PYTHON
Cost: $844,82 (1 channel); $1,157.52 (6 channel); $1,469.19 (9 channel); Cost: Free
Number of channels Up 24 Up 13 (digital pins)
Data storage type Microsoft Excel CSV
Operational System (OS) Windows 7/8/10 Window, Linux, Mac Os
Restriction RIGAMO can only start once on a single PC. Other installed NI software may conflict with Rigamo software Multiple PYTHON interfaces can operate simultaneously
Disclaimer/Publisher’s Note: The statements, opinions and data contained in all publications are solely those of the individual author(s) and contributor(s) and not of MDPI and/or the editor(s). MDPI and/or the editor(s) disclaim responsibility for any injury to people or property resulting from any ideas, methods, instructions or products referred to in the content.
Copyright: This open access article is published under a Creative Commons CC BY 4.0 license, which permit the free download, distribution, and reuse, provided that the author and preprint are cited in any reuse.
Prerpints.org logo

Preprints.org is a free preprint server supported by MDPI in Basel, Switzerland.

Subscribe

Disclaimer

Terms of Use

Privacy Policy

Privacy Settings

© 2025 MDPI (Basel, Switzerland) unless otherwise stated