
Submitted:
31 December 2024
Posted:
31 December 2024
You are already at the latest version
Abstract
Urban gardens can be crucial for preserving the biodiversity in cities, but their construction often leads to shifts in local ant communities due to drastic habitat changes. Over time, ant communities can recover as species arrive from surrounding habitats. In this study, we explored ant community dynamics over ten years in four gardens of varying maturity on a university campus in South Spain. We examined: (1) ant community composition in the gardens and surrounding natural/seminatural areas; (2) changes in biodiversity over time; (3) indicator values of species in the campus; and (4) population dynamics of the most representative species. We found distinct ant community compositions in gardens and natural/seminatural habitats. The ant community in older gardens showed greater similarity to surrounding natural areas than in young gardens. In the youngest garden, biodiversity initially declined post-construction but later increased to levels comparable to older gardens. Exotic species were more abundant in the young garden, and the population of native species like the garden ant Lasius niger increased over the years. We found that disturbances promote the establishment of exotic species, regardless of habitat maturity. We emphasize the importance of context-dependent interpretation of species bioindicator information to assess habitat ecological status accurately.
Keywords:
Ants
; urbanization
; gardens maturity
; bioindicators
; exotic species
; watering system
; disturbance
1. Introduction
Urban ecology is an expanding field of study as ecologists seek to diminish the negative effects of urbanization on biodiversity [1]. Through urbanization, natural habitats undergo drastic changes in their landscapes and biodiversity composition, linked to habitat loss and the introduction of exotic species. In the new habitat, both biotic and abiotic interactions have been altered, resulting in the creation of novel environmental pressures [2,3,4]. threatening the survival of many local ones [5]. In this context, urban green spaces can act as major species refuges [6,7,8,9]. However, their efficiency as such will depend on various factors, including size, location, structure, or even similarity to the close natural habitats [10,11,12].
Urban green spaces can be viewed as landscapes undergoing continuous early succession, a status maintained via management practices [13,14], namely pruning or mowing. However, the creation of an urban green space causes a major shift in habitat features that will lead to changes in local ant communities. Over the long term, populations will respond differently, based on their ecological compatibility with the new habitat, and might reach a state of balance when the habitat has sufficiently aged [15].
Many studies have explored the effects of urbanization on local biodiversity using ants as model species. Because ants have short generation times and traits that reflect habitat characteristics, they are excellent bioindicators for evaluating the state of ecosystems and the impacts of environmental factors [16,17,18,19]. However, most research has focused on comparing the biodiversity of an area before and after urbanization [20] or in two different distant years after the construction of the greenery [8]. All of them show some general common results such as the arrival of exotic species with ornamental plants or material of construction, the differences in native species resilience towards habitat disturbance or the displacement of some local species. Urban biodiversity studies have also found that mature habitats are less vulnerable to the effects of disturbance [15]. However, it remains unknown how particular species respond to the disturbances linked to the management practices. As Buczkowski and Richmond [20] have underscored, there is a need for research that explores how different species respond over longer periods of time (i.e., years) and that addresses the relationship between species responses and ecology.
Another limitation in this body of research is that, to date, studies conducted on natural or urban habitats have tended to assess disturbance effects by classifying ant species into general functional groups ([16,21,22,23]; among others) or based on the functional traits of the species [24]. In a broad sense, these approaches can be well suited to urban greeneries which structure and size are large enough to allow for a large number of microhabitats [25,26]. Nevertheless, it may be less appropriate when examining residential gardens or small gardens among buildings, which typically comprise a lawn area with some ornamental plants. These spaces are also usually irrigated, which is crucial to their persistence in southern Europe where summers are mostly dry and extremely hot. Despite their artificial nature, these gardens play an important role as refuge for local species [6], and this role grows in importance when it comes to hydrophilic species [27].
In this study, we attempt to evaluate how maturation of urban gardens influences their ant community by carrying out a 10-year study in four gardens on the Rabanales Campus of the University of Cordoba (Andalusia, Spain). During the study we characterized the following: (1) similarities between the ant community composition among the four gardens as well as with the surrounding natural and seminatural areas on campus; (2) the most representative species in each garden based in their indicator status; and (3) the population dynamics of the most representative species in the gardens over time.
2. Materials and Methods
2.1. Study Areas
The Rabanales Campus of the University of Cordoba was inaugurated in 1999, following the renovation of what had previously been the Vocational University of Córdoba (Universidad laboral de Córdoba). It is located 3 km outside the city and covers a surface area of 50 ha. In this region, the climate is continental Mediterranean and is influenced by the Atlantic Ocean: winters are mild, with occasional frost, and summers are hot, with temperatures that can exceed 40º C. Precipitation mainly falls during the colder months. Summer droughts are common, which means that irrigation is essential.
In this study, we sampled the four main gardens on campus (referred to as Garden 1, Garden 2, Garden 3, and Garden 4) using pitfall traps (Figure 1). Gardens 2, 3, and 4 were originally established in 1956 when the campus first opened. However, they underwent several renovations starting in the late 1990s when the campus reopened. In contrast, Garden 1, a small garden (4 325 m2) located in front of the lecture hall, was newly constructed in 2005. Garden 2 is the largest of the gardens (17 094 m2). This garden is located behind the library and has a fountain at its centre. Garden 3 is the second largest garden (11 063 m2) and has a small building located also in the centre. Garden 4 covers 8 346 m2 and, as Garden 2, it has a fountain at the centre. The four gardens are located relatively close to one another (but still separated by buildings) and display similar landscaping, namely an expanse of lawn with very sporadic presence of herbs due to the maintenance labours. In all four gardens there are some ornamental bushes and trees, which composition vary among gardens. In Garden-1 there are Chinese fan palm (Livistona chinensis), ombu tree (Phytolacca dioica) and date palm trees (Phoenix dactilifera). In Garden-2 the plant composition includes the atlas cedar (Cedrus atlantica), the Japanese pittosporum (Pittosporum tobira), oriental arborvitae (Thuja orientalis), oleander (Nerium oleander), European privet (Ligustrum vulgare) and carob tree (Ceratonia siliqua). Garden-3 is the most differing one, since its vegetation constitutes an Aleppo pine grove. Finally, Garden-4 is the garden with larger variety of ornamental plants including the date palm (Phoenix dactilifera), European privet (Ligustrum vulgare), silver wattle (Acacia dealbata), box elder (Hacer negundo), smooth-leaved elm (Ulmus minor), crepe myrtle (Lagerstroemia indica), Red-leaf Photinia (Plotinia serrulata), rose of Sharon (Hibiscus syriacus), Southern catalpa (Catalpa bignonioides), Judas tree (Cercis siliquastrum), bull bay (Magnolia grandiflora), Ceylon cinnamon tree (Cinnamomum verum) and London plane tree (Platanus hispanica). All the gardens are regularly maintained. Three of the four are watered, providing crucial moisture during the hot and dry season in the south of the Iberian peninsula (late spring and summer) with exception of Garden 2, which is not connected to the automatic watering system and therefore experiences major droughts.
The gardens are surrounded by two natural areas (Elms 1 and Elms 2) and three seminatural areas (Eucalypts, Grassland-1, and Grassland-2). Elms 1 and Elms 2 are elm groves located along a streambank, covering areas of 1,081 m² and 782 m², respectively. The Eucalypts area is a reforested grove of Eucalyptus camaldulensis, spanning approximately 4,250 m². Grassland-1 covers 1,825 m² and features herbaceous vegetation along with Mediterranean shrubs such as Rosmarinus officinalis, Pistacia lentiscus, and Quercus coccifera. Grassland-2, approximately 3,600 m² in size, also consists of Mediterranean herbaceous vegetation but lacks the aforementioned shrubs. None of these areas receive any maintenance.
2.2. Sampling Method
We carried out pitfall trapping in the four gardens over a period of 10 years (2004–2013, both included). Sampling occurred in June or July, which are the months of maximum ant activity in Europe (Destour et al. 2024). Each year in each garden, we set 20 pitfall traps, distributed in two independent transects. Exceptionally, Garden-2 was sampled twice in 2005 and Garden-3 could not be sampled in 2006. Pitfall traps used in the study were semi-transparent plastic cups with a depth of 7.3 cm that measured 5.7 cm in diameter at their top lip and 5 cm in diameter at their base (REF. 409702, DELTALAB SL). They were filled with 50 ml of water, to which 1-2 drops of detergent were added to reduce the surface tension and thus prevent ants from escaping. The traps were placed 10 to a transect and were left open for 48 h, which was enough time to limit digging-in effects (Jiménez-Carmona et al. 2019), capture a maximum number of species, and avoid trap desiccation and deterioration of the captured material due to high temperatures. Pitfalls along a given transect were separated by 5 meters. They were placed to cover as many different microhabitats as possible (under trees, shrubs, garden lawn, etc.), and the 10-pitfall transects were separated by at least 20 meters. The contents of the traps were collected and brought to the laboratory to identify the ants under the stereomicroscope using the identification keys available in Tinaut Ranera [28].
Data of the ant communities present in the natural and seminatural areas were gathered during an ecological study carried out at the University of Cordoba to assess the biodiversity of Rabanales Campus. In the study, it was used the same sampling methodology (both, model of pitfall trap) but differed in the years of sampling. The information about the species present in these areas were gathered as follows: Species present in a total of 30 pitfall traps placed in Eucalypts in 2005; a total of 100 pitfall traps placed in Elms during the years 2001 and 2002; Elms-2 was sampled in 2001 with a total of 75 pitfall traps; and Grassland-1 and Grassland-2 were sampled in 2001, 2005 and 2013 with a total of 460 and 90 pitfall traps, respectively.
2.3. Statistical Analyses
All our statistical analyses were carried out with R [29]. We created graphical representations of the results using the ggplot function in the ggplot2 package.
2.3.1. Comparing Ant Communities Among Campus Habitats
To explore habitat-related differences in ant communities, we performed permutational multivariate analyses of variance (PERMANOVAs) using the matrix of species presence/absence per transect each sampled year (vegan package: adonis2 function; [30]). We compared ant community composition (1) among the gardens, natural areas, and seminatural areas (using data for each transect and year). We employed non-metric multidimensional scaling (NMDS) to visualize the results (vegan package: metaMDS function [Bray-Curtis] distance).
2.3.2. Species-Habitat Association
We tested whether the species were associated with a particular habitat type using the indicator value method (IVM; [31]). First, we calculated the indicator values (IVs) for the species observed on campus using relative species abundance for a given ant community (indicspecies package: multipatt function; [32]). Second, as highly artificial habitats like gardens can impact the presence of the species, we divided the campus’ habitats into two main groups—gardens (group 1) versus natural and seminatural areas (group 2) —and determined whether different ant species presence was associated with group type. Third, we were also interested on potential differences among the four gardens since they differ in the trees and bushes composition as well as in the watering maintenance during the warm season (lack of watering in Garden 2). Fourth, we tested the association between the ant species and the four different gardens by performing a correspondence analysis (CA) on the presence/absence matrix including the number of pitfall traps per transect occupied by each species in each garden (FactoMineR package: CA function; [33]). We visualized the CA results using the fviz_ca_biplot function in the factoextra package [34].
2.3.3. Species Population Dynamic over the Years
Local extinctions and colonization from the surroundings lead to changes in the biodiversity indexes over the years. Therefore, we first calculated the Shannon-Wienner Index per each garden and study year. Later, we carried out the graphical representation of the data to check for differences in the biodiversity trends among the gardens.
To explore fluctuations in the abundance of the most representative species of the gardens (according to IV results) over the years, we carried out two GLMs (lme4 package: glm.nb function [negative binomial, maximum likelihood]). In the fone of the models, the response variable was the total number of pitfalls per transect in which each species was found and the year of sampling was used as the fixed factor. The establishment of a species’ population can be associated with the increase in the number of foragers due to colony growth. Then, we performed a second GLM (negative binomial, maximum likelihood) per each species in which the response variable was the species-specific number of workers per pitfall trap and the fixed factor was the year of sampling; transect identity was used as random factor. The models were performed only for those species with a significant indicator value (IV) among gardens.
3. Results
In total, 30 ant species belonging to 18 genera were captured in the four study gardens (Table 1). On the entire campus, 41 species belonging to 19 genera have been observed (Supplementary Table S1). Overall, the two most abundant species in the gardens were Lasius grandis and Pheidole pallidula, two anthropophilic ants that are common in Mediterranean gardens [11]. Two exotic species, Cardiocondyla mauritanica and Strumigenys membranifera were particularly abundant in Garden-1 and Garden-2.
3.1. Comparing ant Communities Among Campus Habitats
There were significant differences in the ant communities found in the different habitats (PERMANOVA: F = 19.689, p-value < 0.001). Among all gardens, Garden-3 and Garden-4 were more similar to the natural and seminatural areas; followed by Garden-2. The young Garden-1 showed to be the one differing the most from the ant community found in the natural and seminatural areas of the campus (NMDS: Figure 2, stress = 0.132).
3.2. Species-Habitat Association
The IVs results clearly reflect the excellent bioindicator character of ants. More generalist and opportunistic species (species occurring in a wide range of habitats, i.e. eurytopic and polytopic) are associated with the youngest garden (Garden-1) and with the garden experiencing summer droughts. In contrast, specialist species (more specialized species occurring in habitats with specific local environmental conditions) are associated with the mature gardens provided of watering (Garden-3 and Garden-4), the natural areas, and the seminatural areas.
Many of the studied species show preferences for different type of habitat in the campus depending on their ecology. For instance, the species associated to the gardens are mostly those considered as synanthropic. They included the garden ant in the Mediterranean area L. grandis, the native P. pallidula, and the exotic species C. mauritanica and S. membranifera. The grasslands are characterized by the presence of the seed harvesting Messor species and G. hispanicum; whereas the forested areas (Elms and Elms-2) are characterized by the higher presence of A. dulcineae, Temnothorax spp., and Camponotus spp. Finally, Cataglyphis species are the most commonly found in natural open areas (Table 2, part a).
Differences in species composition are also found among the gardens. The young Garden-1 is characterized by a higher presence of anthropophilic species, like the pavement ants Tetramorium spp., or species strongly linked to disturbed habitats — the exotic Moorish sneaking ant C. mauritanica [35] and the native H. eduardi (considered a widely spread tramp species [36]) — and species linked to open grasslands but rarely found within urban lawns, like M. barbarus. The mature but summer-dry Garden-2 counts also with high presence of exotic species like S. membranifera. Other representative species in this garden are the native thermotolerant species F. cunicularia, P. pymaea, Solenopsis sp. and T. racovitzai. The oldest and watered gardens Garden-3 and Garden-4 are characterized by the presence of species linked to Mediterranean forests like A. gibbosa or C. barbaricus (both with higher presence in Garden-3) and M. aloba the most hygrophilous species found in the study only present in Garden-4 (Figure 3; Table 1, 2b).
3.3. Relationship Between Species Abundance and Habitat Maturity
Among all four gardens, the young Garden-1 shows the largest biodiversity fluctuations over the years (Figure 4). Different ant species display different population-level trends among the gardens over time. In general, Garden-1 showed Garden-3 and Garden-4 harbour more stable populations over the years (Table 3; Figure 4; Supplementary Figures S1 and S2). In contrast, Garden-1 (the younger garden) and Garden-2 (the disturbed mature garden) are home to highly fluctuating populations of species with higher IVs.
In Garden 1, populations of common garden dwellers such as L. grandis, F. cunicularia, and Solenopsis species grew significantly over the years (both in terms of pitfall traps occupied and the number of workers in the traps) (Figure 5).
No significant patterns of this type were observed in the other three, more mature gardens. Furthermore, the exotic C. mauritanica occurs at higher abundances in Garden 1 and increased in abundance in Garden-2 over time (Figure 5 and Figure 6). The population of H. edudardi decreased in Garden-1 and increased in Garden-2 (Figure 5 and Figure 6). Finally, the seed harvester M. barbarus, which was only seen in Garden-1, declined significantly in abundance through the years (Figure 5 and Figure 6).
4. Discussion
Ants are recognized as important bioindicators in ecosystems [25,37], with their presence or absence closely linked to habitat features [3,10,38,39]. Consequently, the design, location, and plant diversity of urban green spaces are crucial in determining whether these habitats can function as refuges for local species [6,10,11,26]. However, the construction of new green spaces usually involves significant habitat disturbances and the use of materials for construction and ornamentation that can inadvertently transport clusters of exotic species, which often benefit from these disturbances [40,41,42]. Our results support these findings, as the presence of exotic species was recorded only in the gardens within the campus, while the more natural surrounding areas were free of them. Moreover, among the gardens, Garden-1, the most recently constructed, had the highest number of synanthropic and exotic species, including C. mauritanica and S. membranifera.
One major challenge is to construct urban greeneries that effectively serve their intended ecological and recreational functions, even at small sizes, such as gardens. The plant composition and maintenance practices in in these areas can act as filtering factors that shape their ant communities by regulating key environmental characteristics such as soil humidity and nesting resources [43], illumination [44], or food sources [45,46,47], among others. Accordingly, only four gardens on a university campus were able to serve as refuge for at least 30 ant species (potentially more as hypogeic ant species are difficult to capture), representing nearly 10% of the Iberian Peninsula’s myrmecofauna. Although the structure of the soil surface (a large lawn) was shared among all four gardens, the ornamental plants and the presence of fountains, paved paths or differences in their maintenance provided a sufficient diversity of microhabitats to host this large diversity, supporting the already mentioned capacity of urban greeneries to host a high ant species richness [6].
Local disturbances, regardless of their nature, lead to an initial biodiversity loss that is gradually recovered through colonization from the surrounding areas [48]; therefore, experiencing changes in their biodiversity composition over the years and increasing the similarities in species composition between the donor and the receiver areas. Thus, the similarity between the ant community at a given site and in the nearby landscape can reveal the site’s ecological status [15,49,50]. In our ten years monitoring, we have observed similar trend as older gardens (Garden-2, Garden-3 and Garden-4) tended to harbour a more similar ant biodiversity to the surrounding areas than the young ones.
Not all arriving species are able to survive, as their survival depends on whether the characteristics of the destination habitat align with their specific ecological requirements. A similar fate is shared by the remnant populations of the original species, which will either persist or become extinct based on the compatibility between the habitat and the species' needs. This specificity in species requirements is widely used to interpret the bioindicator information provided by the species gathered in each habitat. Indeed, it has enabled researchers like Andersen [17] and many others to classify ant species from different regions or habitat types into bioindicator functional groups [21,22,38,51]. However, these classifications largely remain based on the ecological characteristics of natural habitats. To date, ant species continue to be equally categorized as bioindicators of either habitat disturbance or maturity without distinguishing between the nature of the habitat (natural or urban). For some species, this approach does not pose any issues; for example, the presence of exotic and tramp species is interpreted as a sign of disturbance in both natural and urban habitats [26,38,52]. Results from the Indicator Value of the species follows this interpretation and shows how some species are more likely to be found in natural areas. In our study, the gardens’ artificial nature was reflected in their ant communities, which contained exotic species such as C. mauritanica and S. membranifera. Moreover, as the gardens were watered, they provided more humid habitats than the surroundings during the dry seasons. Then, the gardens host species that can be found in meadows but are commonly found also in urban greeneries, including i.e. L. grandis, a common garden ant on the southern Iberian Peninsula, P. pallidula or F. cunicularia. In contrast, more specialist species were rare in the four gardens as moisture levels were too high and/or other ecological requirements were not met. This group includes the forest species A. gibbosa, the seed harvesters M. barbarus and M. celiae, various carpenter ants in the genus Camponotus, as well as Tetramorium and Cataglyphis species that require more open spaces. All these ants were common in the nearby natural and seminatural areas, where the mosaic of elm groves, grasslands, and Eucalyptus groves provide better conditions for these oligotopic and stenotopic species.
Changes in the myrmecofauna over the years following the construction of a garden (and other urban green spaces) can be driven by various factors, such as the introduction of exotic species [8,53,54] or the local extinction of native species unable to survive under new habitat conditions. As a result, it is feasible to observe a temporary decline in biodiversity during the initial years of a young garden, followed by a gradual recovery with the arrival of species from the surrounding areas. These changes can continue until a form of stability is reached at maturity, when most species have successfully (re)established populations [20].
This trend was observed in Garden 1, which showed a gradual decrease in biodiversity after its construction in 2005, followed by a progressive increase a few years later, reaching its maximum value in the last year of the study (2013). Delving into species trends, these fluctuations in biodiversity were based on an increase in the population of common garden species like Lasius grandis, Formica cunicularia, or Solenopsis spp., along with the extinction of the granivorous Messor barbarus (typical of more open and drier habitats) and the synanthropic species Hypoponera eduardi.
Besides being mature, slight differences in the management or the ornamentation can drive changes among close habitats with similar landscapes. For instance, despite its maturity, Garden 2 showed some similarities in the presence of exotic or tramp species. The summer droughts due to a lack of watering might weaken native populations, thereby facilitating the establishment of these opportunistic species. However, these species seem incapable of expanding in mature gardens with regular watering (Garden 3 and Garden 4), where native biodiversity is well established. Indeed, mature gardens with watering provides a humid environment that can promote the presence of hydrophilic species [27], which struggle to survive in the surrounding arid habitats. For example, the mature lawns in Garden-4 together with the watering provided in the hot summer allows the presence of species that need constant levels of moisture like M. aloba (typical of hot but humid places, [55]), unable to persist in the common drier natural habitats in the south of the Iberian Peninsula but indicator of good quality of a mature garden in our study.
In conclusion, to our knowledge, this study is the first to explore long-term species dynamics in gardens of different ages. Our findings support previous studies that highlight the importance of urban greeneries as biodiversity refuges, as the four study gardens host a valuable number of species (near 10% of Iberian myrmecofauna). Our results also underscore the importance of providing adequate management during the maturation process of gardens to enhance their conservation role and mitigate the impact of exotic species. Furthermore, our study emphasizes that ants are important bioindicator tools whose presence should be interpreted contextually. For example, Messor barbarus acts as a bioindicator of disturbance in our study gardens, although it is classified as a bioindicator of maturity in previous studies. Similarly, Lasius grandis and Myrmica aloba should be considered bioindicators of maturity in our gardens, despite traditionally being viewed as signs of disturbance. Therefore, to accurately evaluate habitats, traditional bioindicator systems must be adapted to reflect the nature and characteristics of the specific habitat.
Appendix A
The data used in this study are available through the link to figshare (https://figshare.com/s/0adba79f5acc57dfec42)
References
- Szulkin, M.; Munshi-South, J.; Chamantier, A. Urban evolutionary biology. Oxford University Press, USA, 2020.
- Rega-Brodsky, C.C.; Aronson, M.F.J.; Piana, M.R.; et al. Urban biodiversity: State of the science and future directions. Urban Ecosystems 2022, 25, 1083–109. [Google Scholar] [CrossRef]
- Trigos-Peral, G.; Maák, I.; Schmid, S.; Chodzik, P.; Czaczkes, T.J.; Witek, M.; Casacci, L.P.; Sánchez-Garcia, D.; Lörincz, A.; Kochanowski, M.; Heinze, J. Urban abiotic stressors drive changes in the foraging activity and colony growth of the black garden ant Lasius niger. Science of The Total Environment 2024, 915, 170157. [Google Scholar] [CrossRef] [PubMed]
- Johnson, M.T.J.; Munshi-South, J. Evolution of life in urban environments. Science 2017, 358(6363), eaam8327. [Google Scholar] [CrossRef] [PubMed]
- Lososová, Z.; Chytrý, M.; Tichý, L.; Danihelka, J.; Fajmon. K.; Hájek, O.; Kintrová, K.; Láníková, D.; Otýpková, Z.; Řehořek, V. Biotic homogenization of Central European urban floras depends on residence time of alien species and habitat types. Biological Conservation 2012, 145, 179–184. [Google Scholar] [CrossRef]
- Brassard, F.; Leong, C.M.; Chan, H.H.; Guénard, B. High Diversity in Urban Areas: How Comprehensive Sampling Reveals High Ant Species Richness within One of the Most Urbanized Regions of the World. Diversity 2021, 13(8), 358. [Google Scholar] [CrossRef]
- Langemeyer, J.; Gómez-Baggethun, E. Urban biodiversity and ecosystem services. In: Ossola, A., Niemelä, J. (Eds) Urban Biodiversity – From Research to Practice. Routledge, Oxon and New York, pp 36–53, 2018. 2018.
- Guénard, B.; Cardinal-De Casas, A.; Dunn, R.R. High diversity in an urban habitat: are some animal assemblages resilient to long-term anthropogenic change? Urban Ecosystems 2015, 18, 449–463. [Google Scholar] [CrossRef]
- Menke, S.B.; Guénard, B.; Sexton, J.O.; Weiser, M.D.; Dunn, R.R.; Silverman, J. Urban areas may serve as habitat and corridors for dry-adapted, heat tolerant species; an example from ants. Urban Ecosystems 2011, 14, 135–163. [Google Scholar] [CrossRef]
- Trigos-Peral, G.; Rutkowski, T.; Witek, M.; Ślipiński, P.; Babik, H.; Czechowski, W. Three categories of urban green areas and the effect of their different management on the communities of ants, spiders and harvestmen. Urban Ecosystems 2020, 23, 803–818. [Google Scholar] [CrossRef]
- Reyes-López, J.L.; Carpintero, S. Comparison of the exotic and native ant communities (Hymenoptera: Formicidae) in urban green areas at inland, coastal and insular sites in Spain. European Journal of Entomology 2014, 111(3), 421–428. [Google Scholar] [CrossRef]
- Ślipiński, P.; Zmihorski, M.; Czechowski, W. Species Diversity and nestedness of Ant Assemblages in an Urban Environment. European Journal of Entomology 2012, 109, 197–206. [Google Scholar] [CrossRef]
- Llewellyn, T.; Gaya, E.; Murrell, D.J. Are Urban Communities in successional Stasis? A Case Study on Epiphytic Lichen Communities. Diversity 2020, 12(9), 330. [Google Scholar] [CrossRef]
- Vepsäläinen, K.; Ikonen, H.; Koivula, M.J. The structure of ant assemblages in an urban area of Helsinki, southern Finland. Annales Zoologici Fennici 2008, 45(2), 109–127. [Google Scholar] [CrossRef]
- Gliessman, S.R. Agroecology: The Ecology of Sustainable Food Systems, 3rd ed.; CRC Press/Taylor & Francis: Boca Raton, FL, USA, 2015. [Google Scholar]
- King, J.R.; Andersen, A.N.; Cutter, A.D. Ants as bioindicators of habitat disturbance: validation of the functional group model for Australia's humid tropics. Biodiversity Conservation 1998, 7, 1627–1638. [Google Scholar] [CrossRef]
- Andersen, A.N.; Hoffmann, B.D.; Müller, W.J.; Griffiths, A.D. Using ants as bioindicators in land management> simplifying assessment of ant community responses. Journal of Applied Ecology 2002, 39, 8–17. [Google Scholar] [CrossRef]
- Andersen, A.N.; Majer, J.D. Ants show the way Down Under: Invertebrates as bioindicators in land management. Frontiers in Ecology and the Environment 2004, 2, 291–298. [Google Scholar] [CrossRef]
- Ivanov, K.; Keiper, J. Ant (Hymenoptera: Formicidae) diversity and community composition along sharp urban forest edges. Biodiversity Conservation 2010, 19, 3917–3933. [Google Scholar] [CrossRef]
- Buczkowski, G.; Richmond, D.S. The effect of urbanization on ant abundance and diversity: A temporal examination of factors affecting biodiversity. PLoS ONE 2012, 7(8), e41729. [Google Scholar] [CrossRef] [PubMed]
- Czechowski, W.; Radchenko, A.; Czechowska, W.; Vepsäläinen, K. The ants of Poland with reference to the myrmecofauna of Europe. Fauna Polonia 4. Natura Optima Dux Foundation, Warsaw, 2012.
- Roig, X.; Espadaler, X. Propuesta de grupos funcionales de hormigas para la Península Ibérica y Baleares, y su uso como bioindicadores Proposal of functional groups of ants for the Iberian Peninsula and Balearic Islands, and their use as bioindicators. Iberomyrmex 2010, 2, 28–29. [Google Scholar]
- Andersen, A.N. A classification of Australian ant communities, based on functional groups which parallel plant life-forms in relation to stress and disturbance. Journal of Biogeography 1995, 22, 15–29. [Google Scholar] [CrossRef]
- Arnán, X.; Cerdá, X.; Retana, J. Partitioning the impact of environment and spatial structure on alpha and beta components of taxonomic, functional, and phylogenetic diversity in European ants. PeerJ 2015, 3, e1241. [Google Scholar] [CrossRef]
- Cabrero-Sañudo, F.J.; Cañizares García, R.; Caro-Miralles, E.; Gil-Tapetado, D.; Grzechnik, S.; López-Collar, D. Seguimiento de artrópodos bioindicadores en áreas urbanas: objetivos, experiencias y perspectivas. Ecosistemas 2022, 31(1), 2340. [Google Scholar] [CrossRef]
- arpintero, S.; Reyes-López, J.L. Effect of park age, size, shape and insolation on ant assemblages in two cities of. Southern Spain. Entomological Science 2014, 17, 41–51. [Google Scholar] [CrossRef]
- Miguelena, G.J.; Baker, P.B. Effects of urbanization on the diversity, abundance, and composition of ant assemblages in an arid city. Environmental Entomology 2019, 48(4), 836–846. [Google Scholar] [CrossRef] [PubMed]
- Tinaut Ranera, J.A. Estudio de los formícidos de Sierra Nevada. Ph.D. Thesis, . Universidad de Granada, Granada, 1981. [Google Scholar]
- R Core Team R: A language and environment for statistical computing. R Foundation for Statistical Computing, Vienna, Austria, 2010. https://www.R-project.org/.
- Oksanen, J.; Simpson, G.L.; Guillaume Blanchet, F.; Kindt, R.; Legendre, P.; et al. vegan: Community Ecology package. R package version 2.0-10., 2024. Available at: http://CRAN.R-project.org/ package=vegan.
- Dufrêne, M.; Legendre, P. Species assemblages and indicator species: The need for a flexible asymmetrical approach. Ecological Monographs 1997, 67(3), 345–366. [Google Scholar] [CrossRef]
- De Cáceres, M.; Legendre, P. Associations between species and groups of sites: indices and statistical inference. Ecology 2009, 90, 3566–3574. [Google Scholar] [CrossRef] [PubMed]
- Lê, S.; Josse, J.; Husson, F. FactoMineR: An R Package for Multivariate Analysis. Journal of Statistical Software 2008, 25(1), 1–18. [Google Scholar] [CrossRef]
- Kassambara, A.; Mundt, F. factoextra: Extract and Visualize the Results of Multivariate Data Analyses. R package version 1.0.5., 2020. Available at: https://CRAN.R-roject.org/package=factoextra.
- Wetterer, J.K. Worldwide Spread of the Moorish Sneaking Ant, Cardiocondyla mauritanica (Hymenoptera: Formicidae). Sociobiology 2012, 59(3), 985–997. [Google Scholar]
- Taheri, A.; Wetterer, J.K.; Reyes-López, J. Tramp ants of Tangier, Morocco. Transactions of the American Entomological Society 2017, 143(2), 299–304. [Google Scholar] [CrossRef]
- Hölldobler, B.; Wilson, E.O. The Ants. Cambridge: Harvard University Press, 1990.
- Jiménez-Carmona, F.; Heredia-Arévalo, A.M.; Reyes-López, J.L. Ants (hymenoptera: formicidae) as an indicator group of human environmental impact in the riparian forests of the Guadalquivir river (Andalusia, Spain). Ecological Indicators 2020, 118, 106762. [Google Scholar] [CrossRef]
- Lőrincz, Á.; Habenczyus, A.A.; Kelemen, A.; Ratkai, B.; Tölgyesi, C.; Lőrinczi, G.; Frei, K.; Bátori, Z.; Maák, I.E. Wood-pastures promote environmental and ecological heterogeneity on a small spatial scale. Science of The Total Environment 2024, 906, 167510. [Google Scholar] [CrossRef]
- McKinney, M.L. Urbanization as a Major Cause of Biotic Homogenization. Biological Conservation 2006, 127, 247–260. [Google Scholar] [CrossRef]
- McKinney, M.L. Effects of urbanization on species richness: A review of plants and animals. Urban Ecosystems 2008, 11, 161–176. [Google Scholar] [CrossRef]
- Pearson, D.E.; Ortega, Y.K.; Eren, Ö.; Villareal, D.; Lekberg, Y.; Hierro, J. Exotic success following disturbance explained by weak native resilience and ruderal exotic bias. Journal of Ecology 2023, 111, 2412–2423. [Google Scholar] [CrossRef]
- Cotton, J. Diversity, abundance, and species composition of ants in urban green spaces. Urban Ecosystems 2010, 13, 25–441. [Google Scholar]
- Stukalyuk, S.; Maák, I.E. The influence of illumination regimes on the structure of ant (Hymenoptera, Formicidae) community composition in urban habitats. Insectes Sociaux 2023, 70, 423–437. [Google Scholar] [CrossRef]
- Penick, C.A.; Savage, A.M.; Dunn, R.R. Stable isotopes reveal links between human food inputs and urban ant diets. Proceedings of the Royal Society B-Biological Sciences 2015, 282, art 20142608. [Google Scholar] [CrossRef]
- Trigos-Peral, G.; Witek, M.; Csata, E.; Chudzik, P.; Heinze, J. Urban diet as potential cause of low body fat content in female ant sexuals. Myrmecological News 2024b, 34, 181–190. [Google Scholar]
- Gaber, H.; Ruland, F.; Jeschke, J.; Bernard-Verdier, M. Behavioural changes in the city: The common black garden ant defends aphids more aggressively in urban environments. Ecology and Evolution 2024, 4, e11639. [Google Scholar] [CrossRef] [PubMed]
- Vidal-Cordero, J.M.; Angulo, E.; Molina, F.P.; Boulay, R.; Cerdá, X. Long-term recovery of Mediterranean ant and bee communities after fire in southern Spain. Science of the Total Environment 2023, 887, 164132. [Google Scholar] [CrossRef] [PubMed]
- Zina, V.; Ordeix, M.; Franco, J.C.; Ferreira, M.T.; Fernandes, M.R. Ants as Bioindicators of Riparian Ecological Health in Catalonian Rivers. Forests 2021, 12, 625. [Google Scholar] [CrossRef]
- Gollan, J.R.; Lobry de Bruyn, L.; Reid, N.; Smith, D.; Wilkie, L. Can ants be used as ecological indicators of restoration progress in dynamic environments? A case study in a revegetated riparian zone. Ecological Indicators 2011, 11(6), 1517–1525. [Google Scholar] [CrossRef]
- Hill, J.G.; Summerville, K.S.; Brown, R.L. Habitat associations of ant species (Hymenoptera: Formicidae) in a heterogeneous Mississippi landscape. Environmental Entomology 2008, 37(2), 453–463. [Google Scholar] [CrossRef] [PubMed]
- Wetterer, J.K.; Espadaler, X.; Wetterer, A.L.; Cabral, S.G.M. Native and exotic ants of the Azores (Hymenoptera: Formicidae). Sociobiology 2004, 44, 265–297. [Google Scholar]
- Yamaguchi, T. Influence of urbanization on ant distribution in parks of Tokyo and Chiba City, Japan I. Analysis of ant species richness. Ecological Research 2004, 19, 209–216. [Google Scholar] [CrossRef]
- Clarke, K.M.; Fisher, B.L.; LeBuhn, G. The influence of urban park characteristics on ant (Hymenoptera, Formicidae) communities. Urban Ecosystems 2008, 11, 317–334. [Google Scholar] [CrossRef]
- Radchenko, A.G. , Elmes, G.W. Myrmica ants (Hymenoptera: Formicidae) of the Old World. Fauna Mundi 3, 2010.
Figure 1.
Map of the studied gardens and the natural and seminatural areas in the Rabanales Campus, University of Córdoba, Spain.
Figure 1.
Map of the studied gardens and the natural and seminatural areas in the Rabanales Campus, University of Córdoba, Spain.
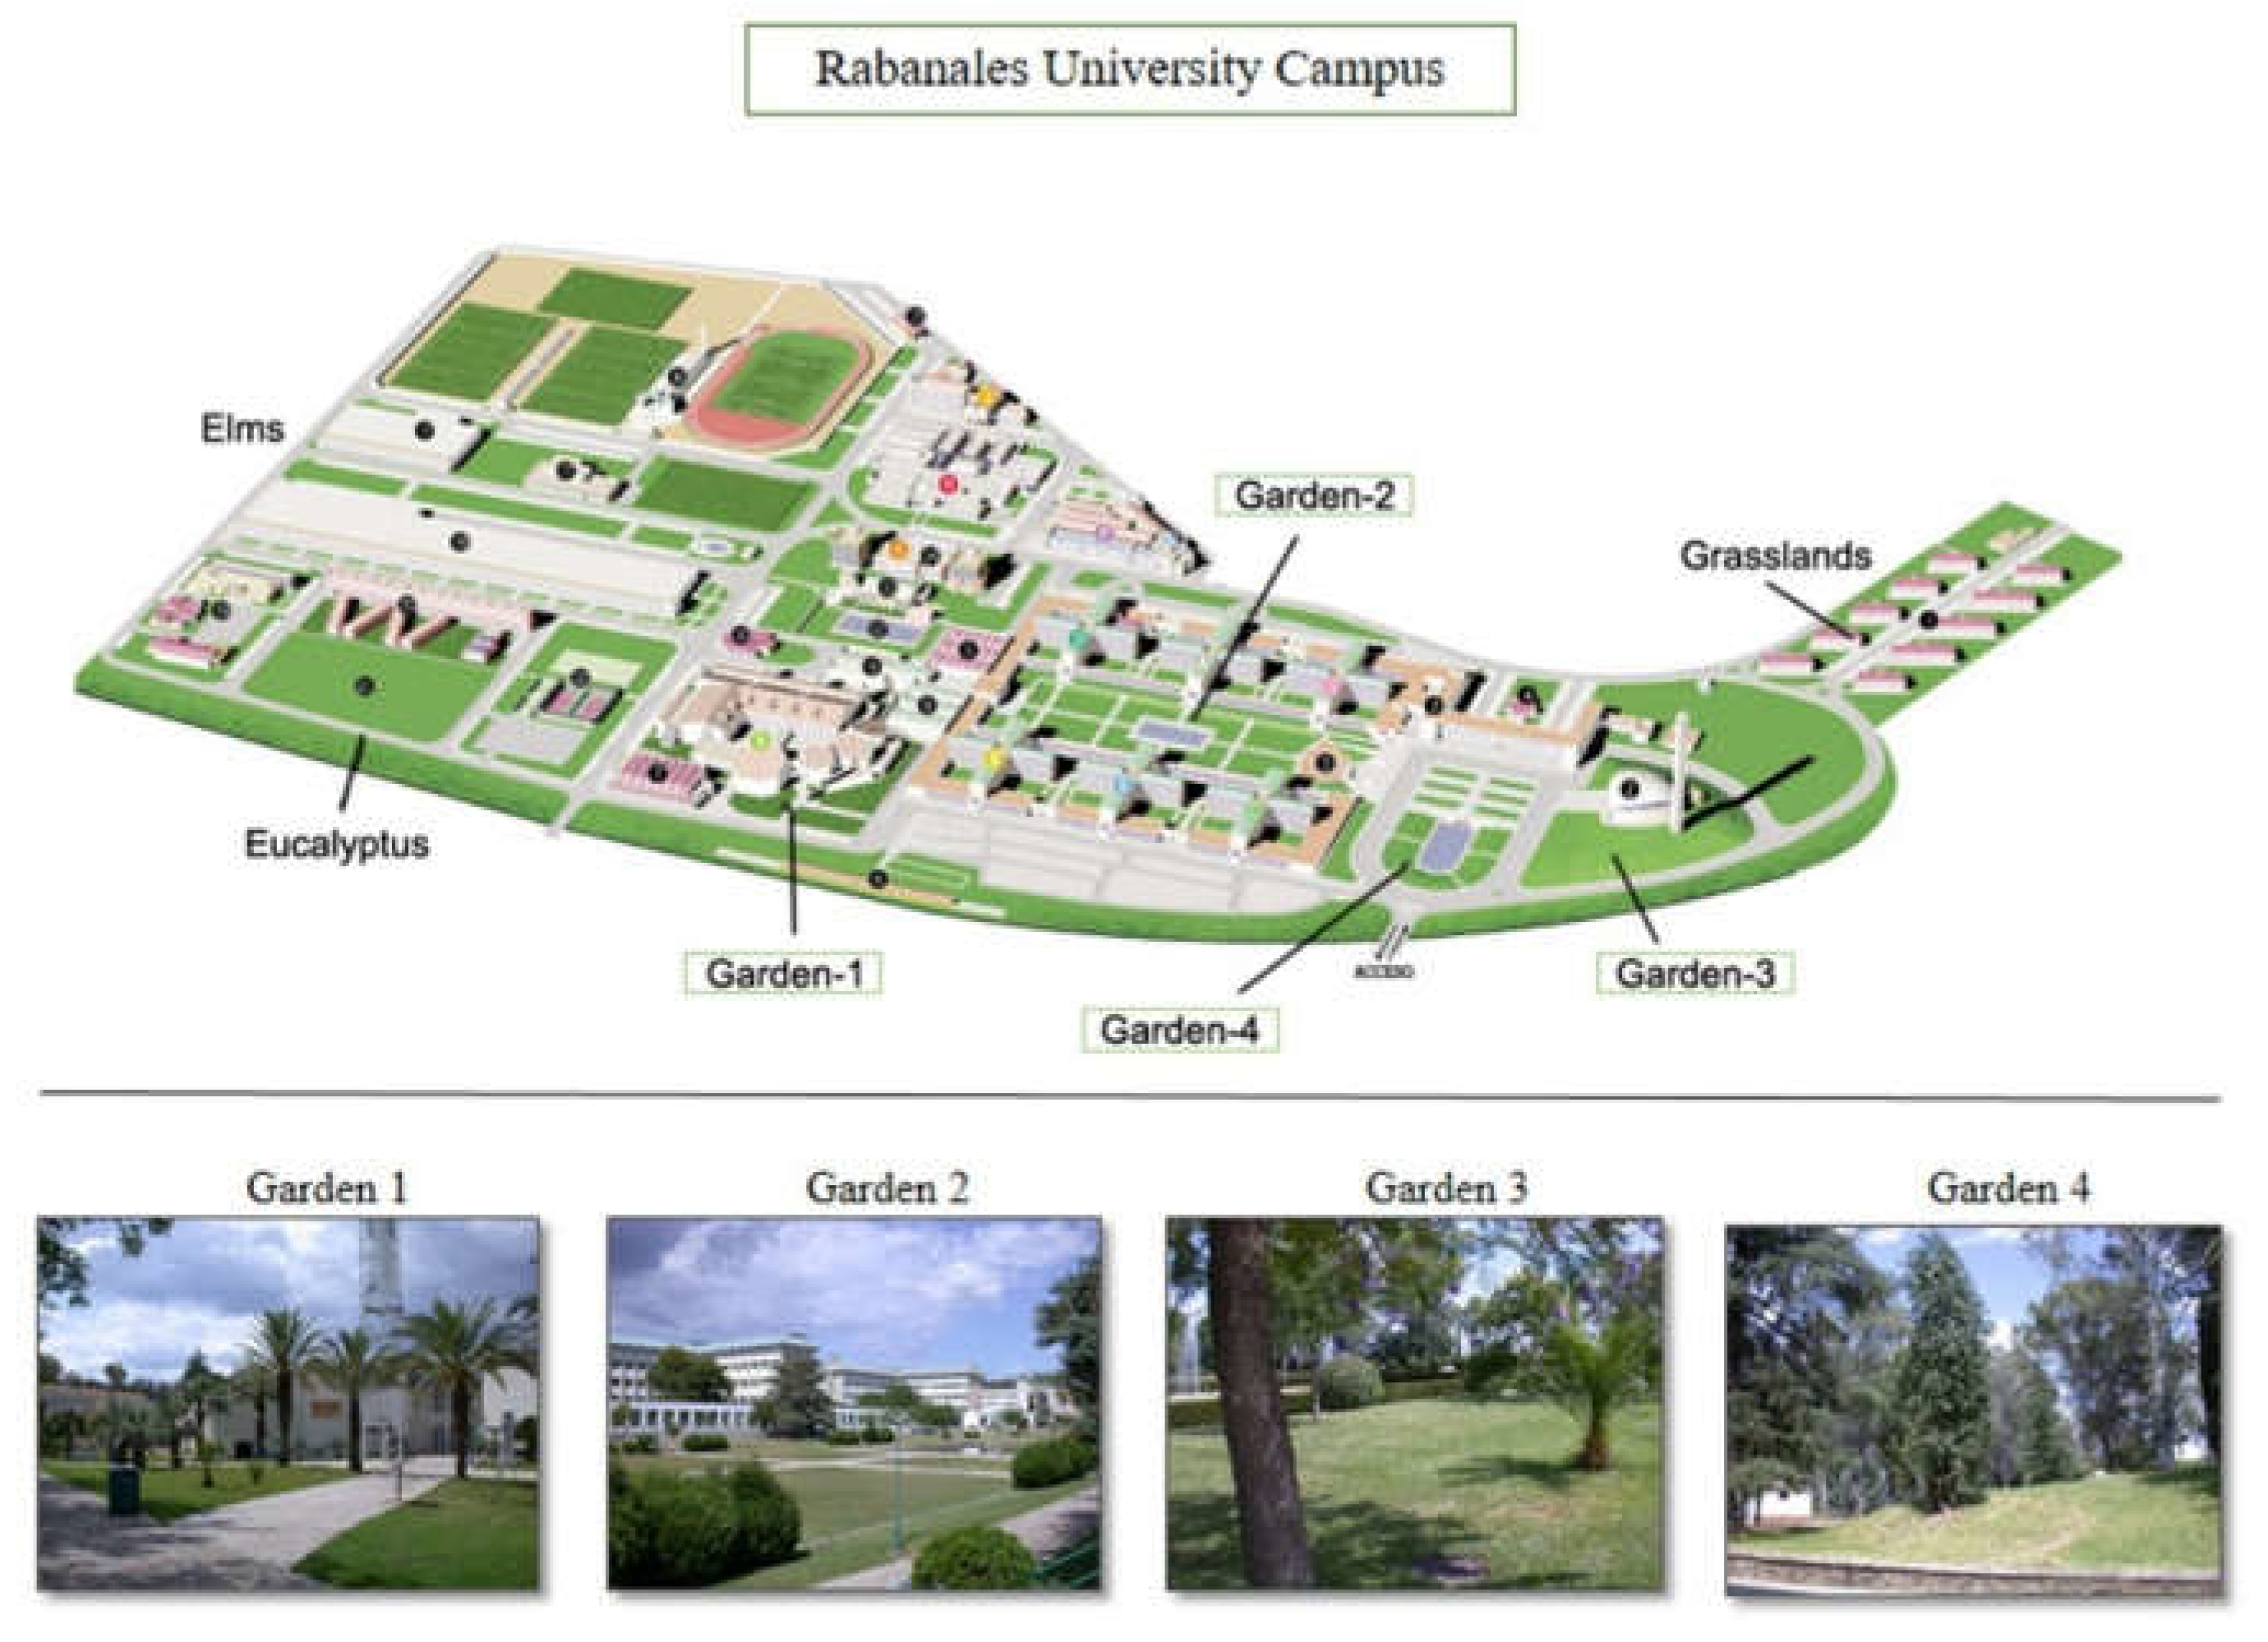
Figure 2.
Differences in ant communities among the study gardens and the natural and seminatural areas of the campus.
Figure 2.
Differences in ant communities among the study gardens and the natural and seminatural areas of the campus.
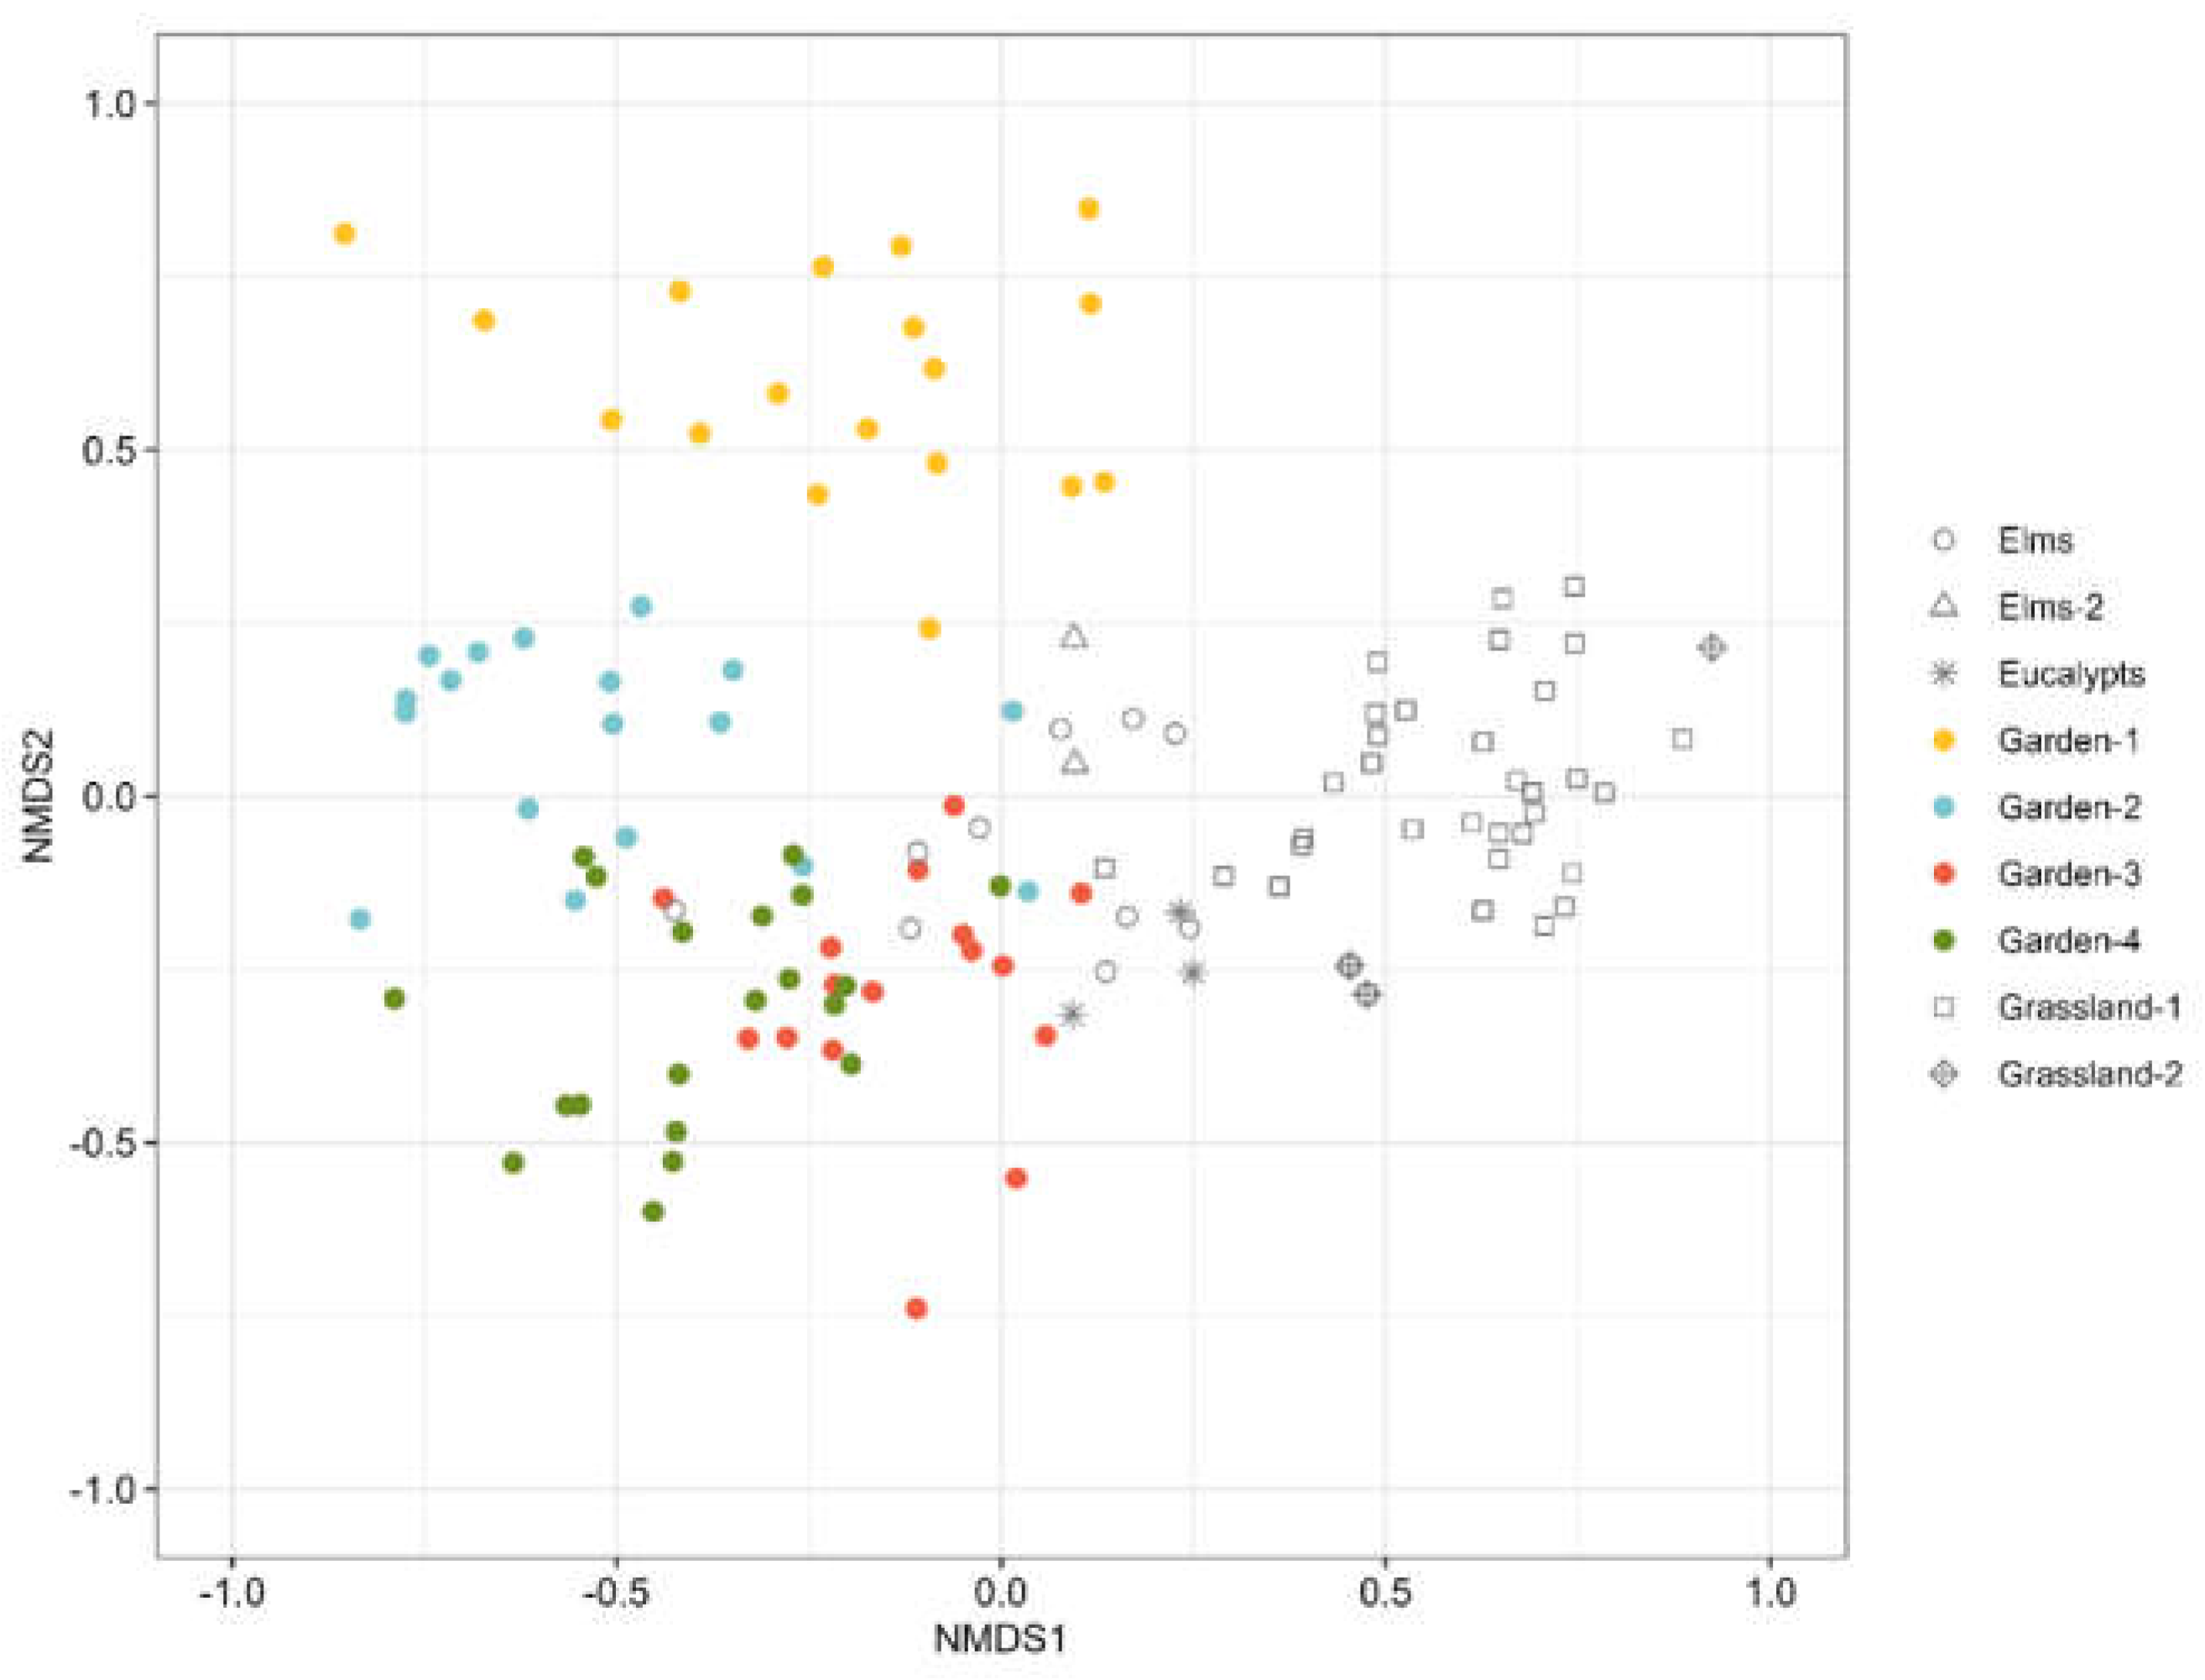
Figure 3.
Graphical representation (Correspondence Analyses) of the relationship between the species found in the gardens and their association with each garden.
Figure 3.
Graphical representation (Correspondence Analyses) of the relationship between the species found in the gardens and their association with each garden.
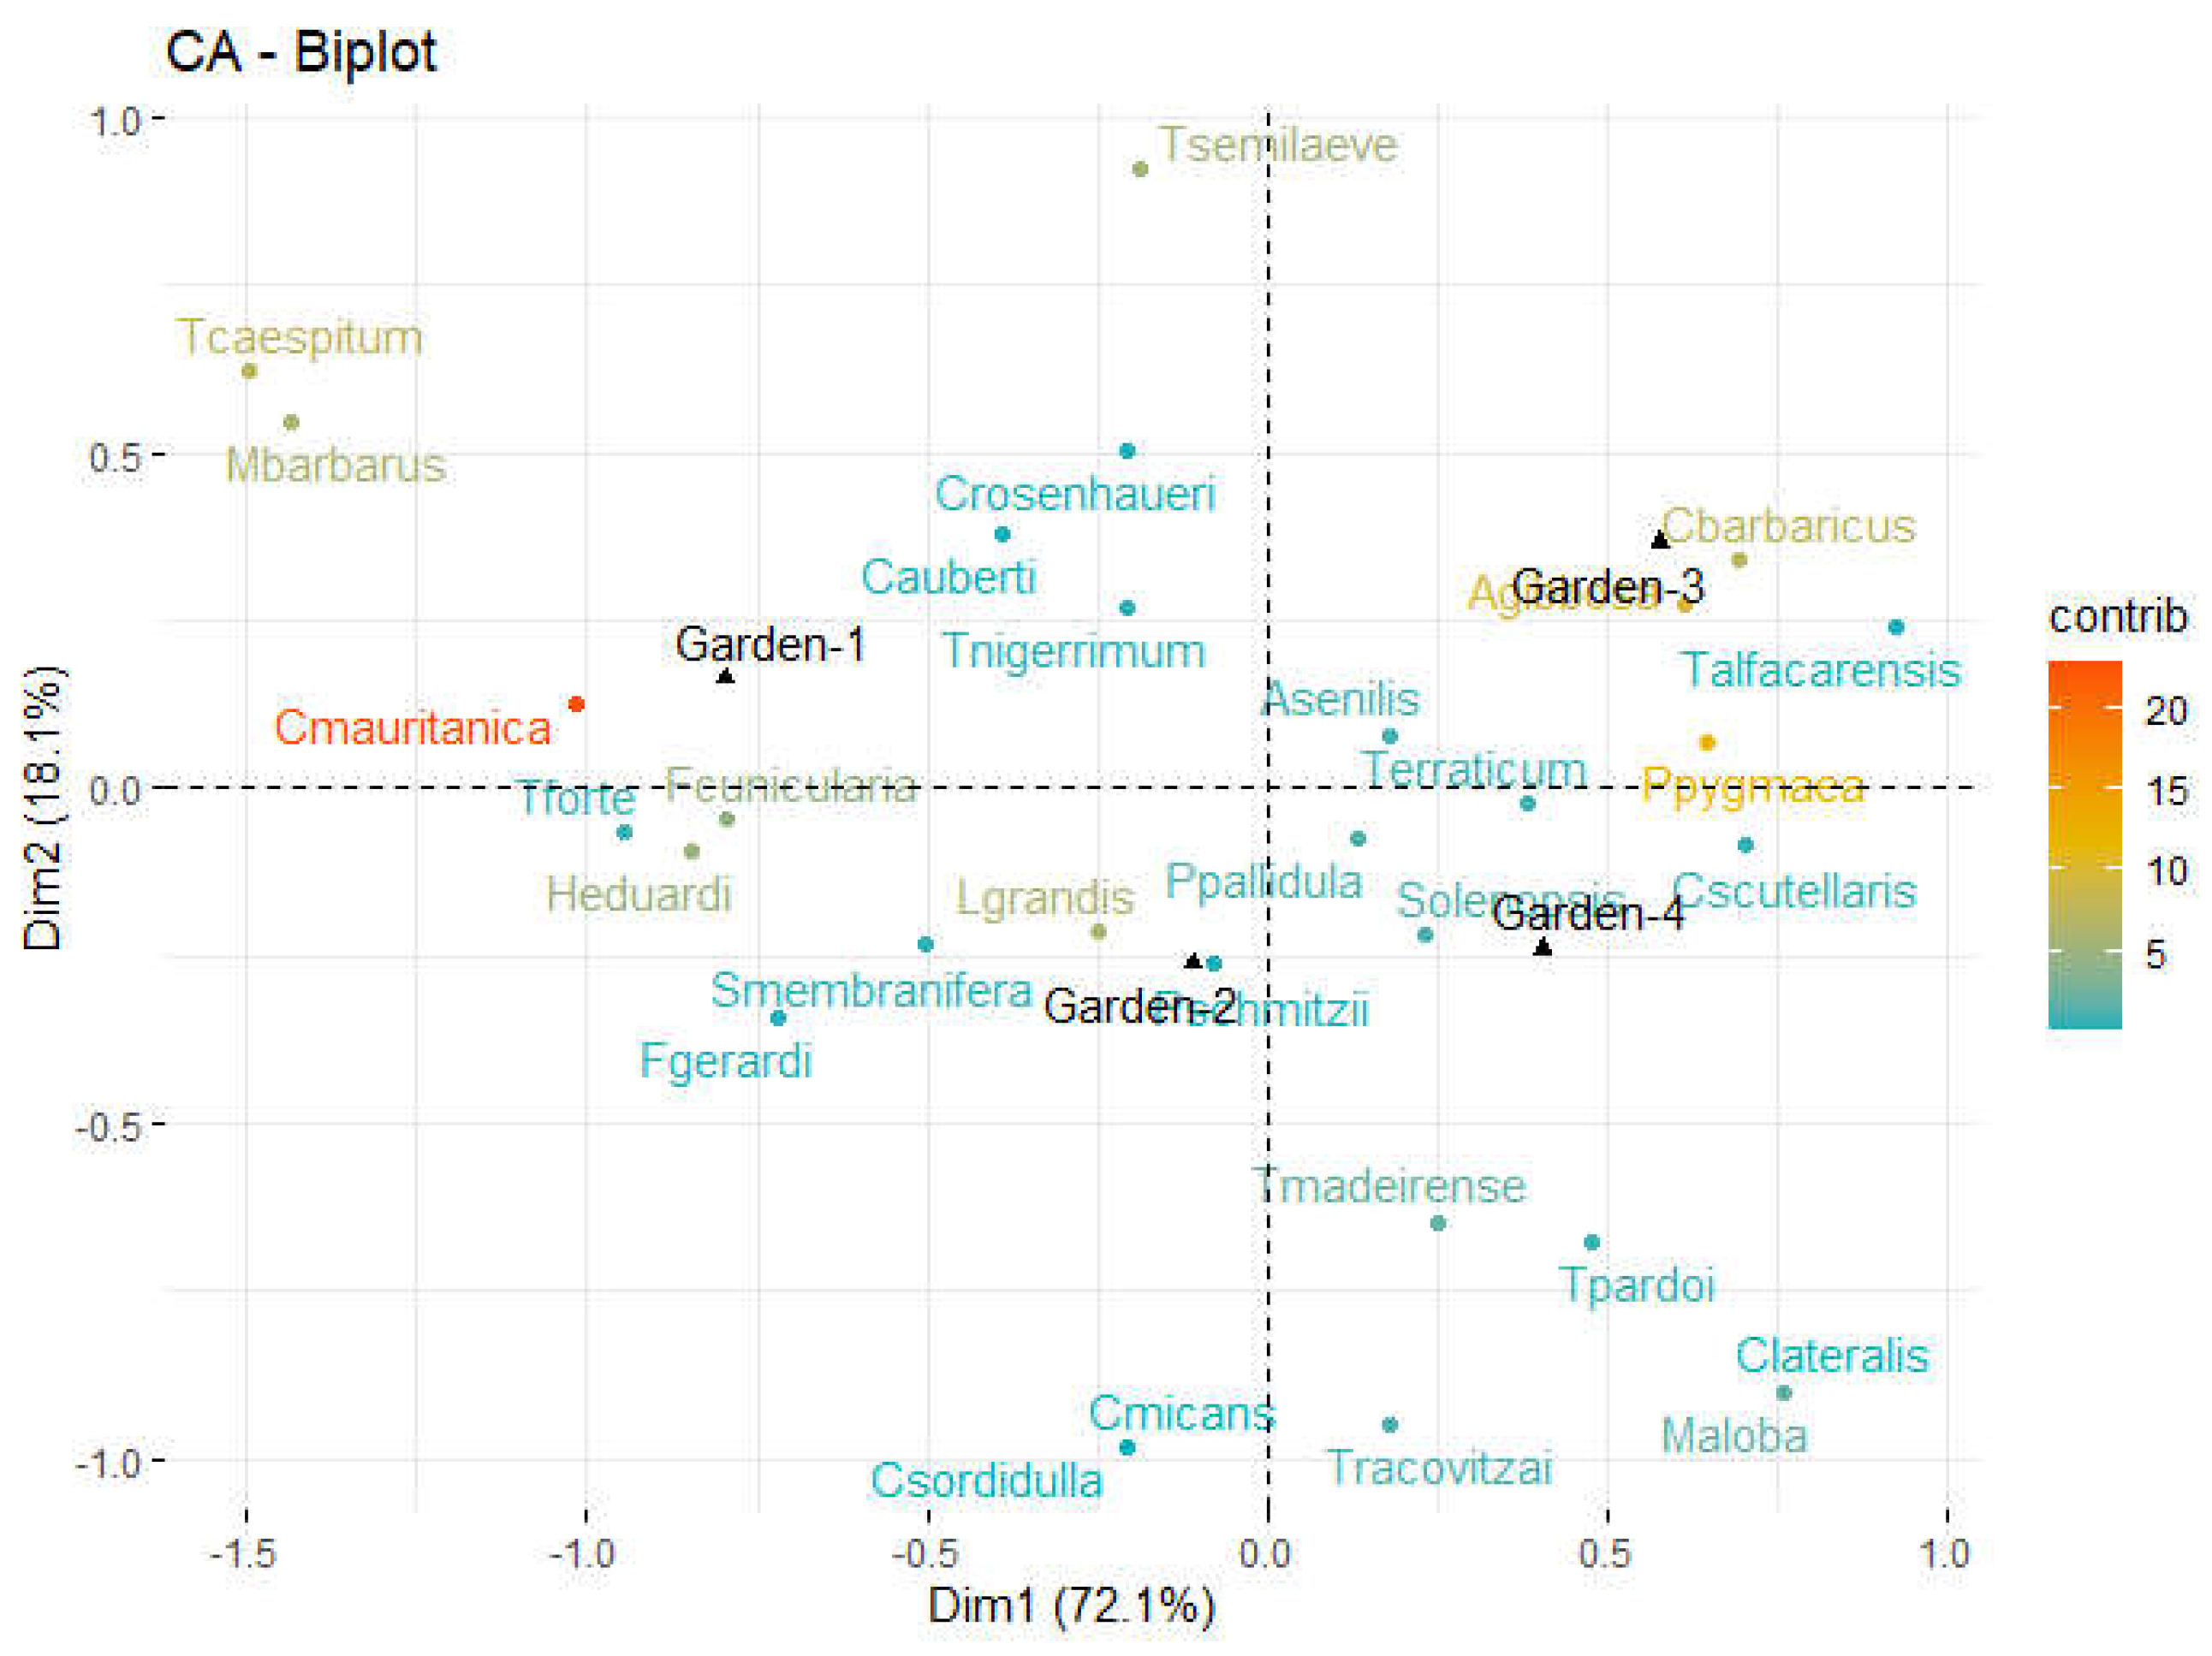
Figure 4.
Fluctuation in Shannon-Wienner Index in the study gardens over the years.
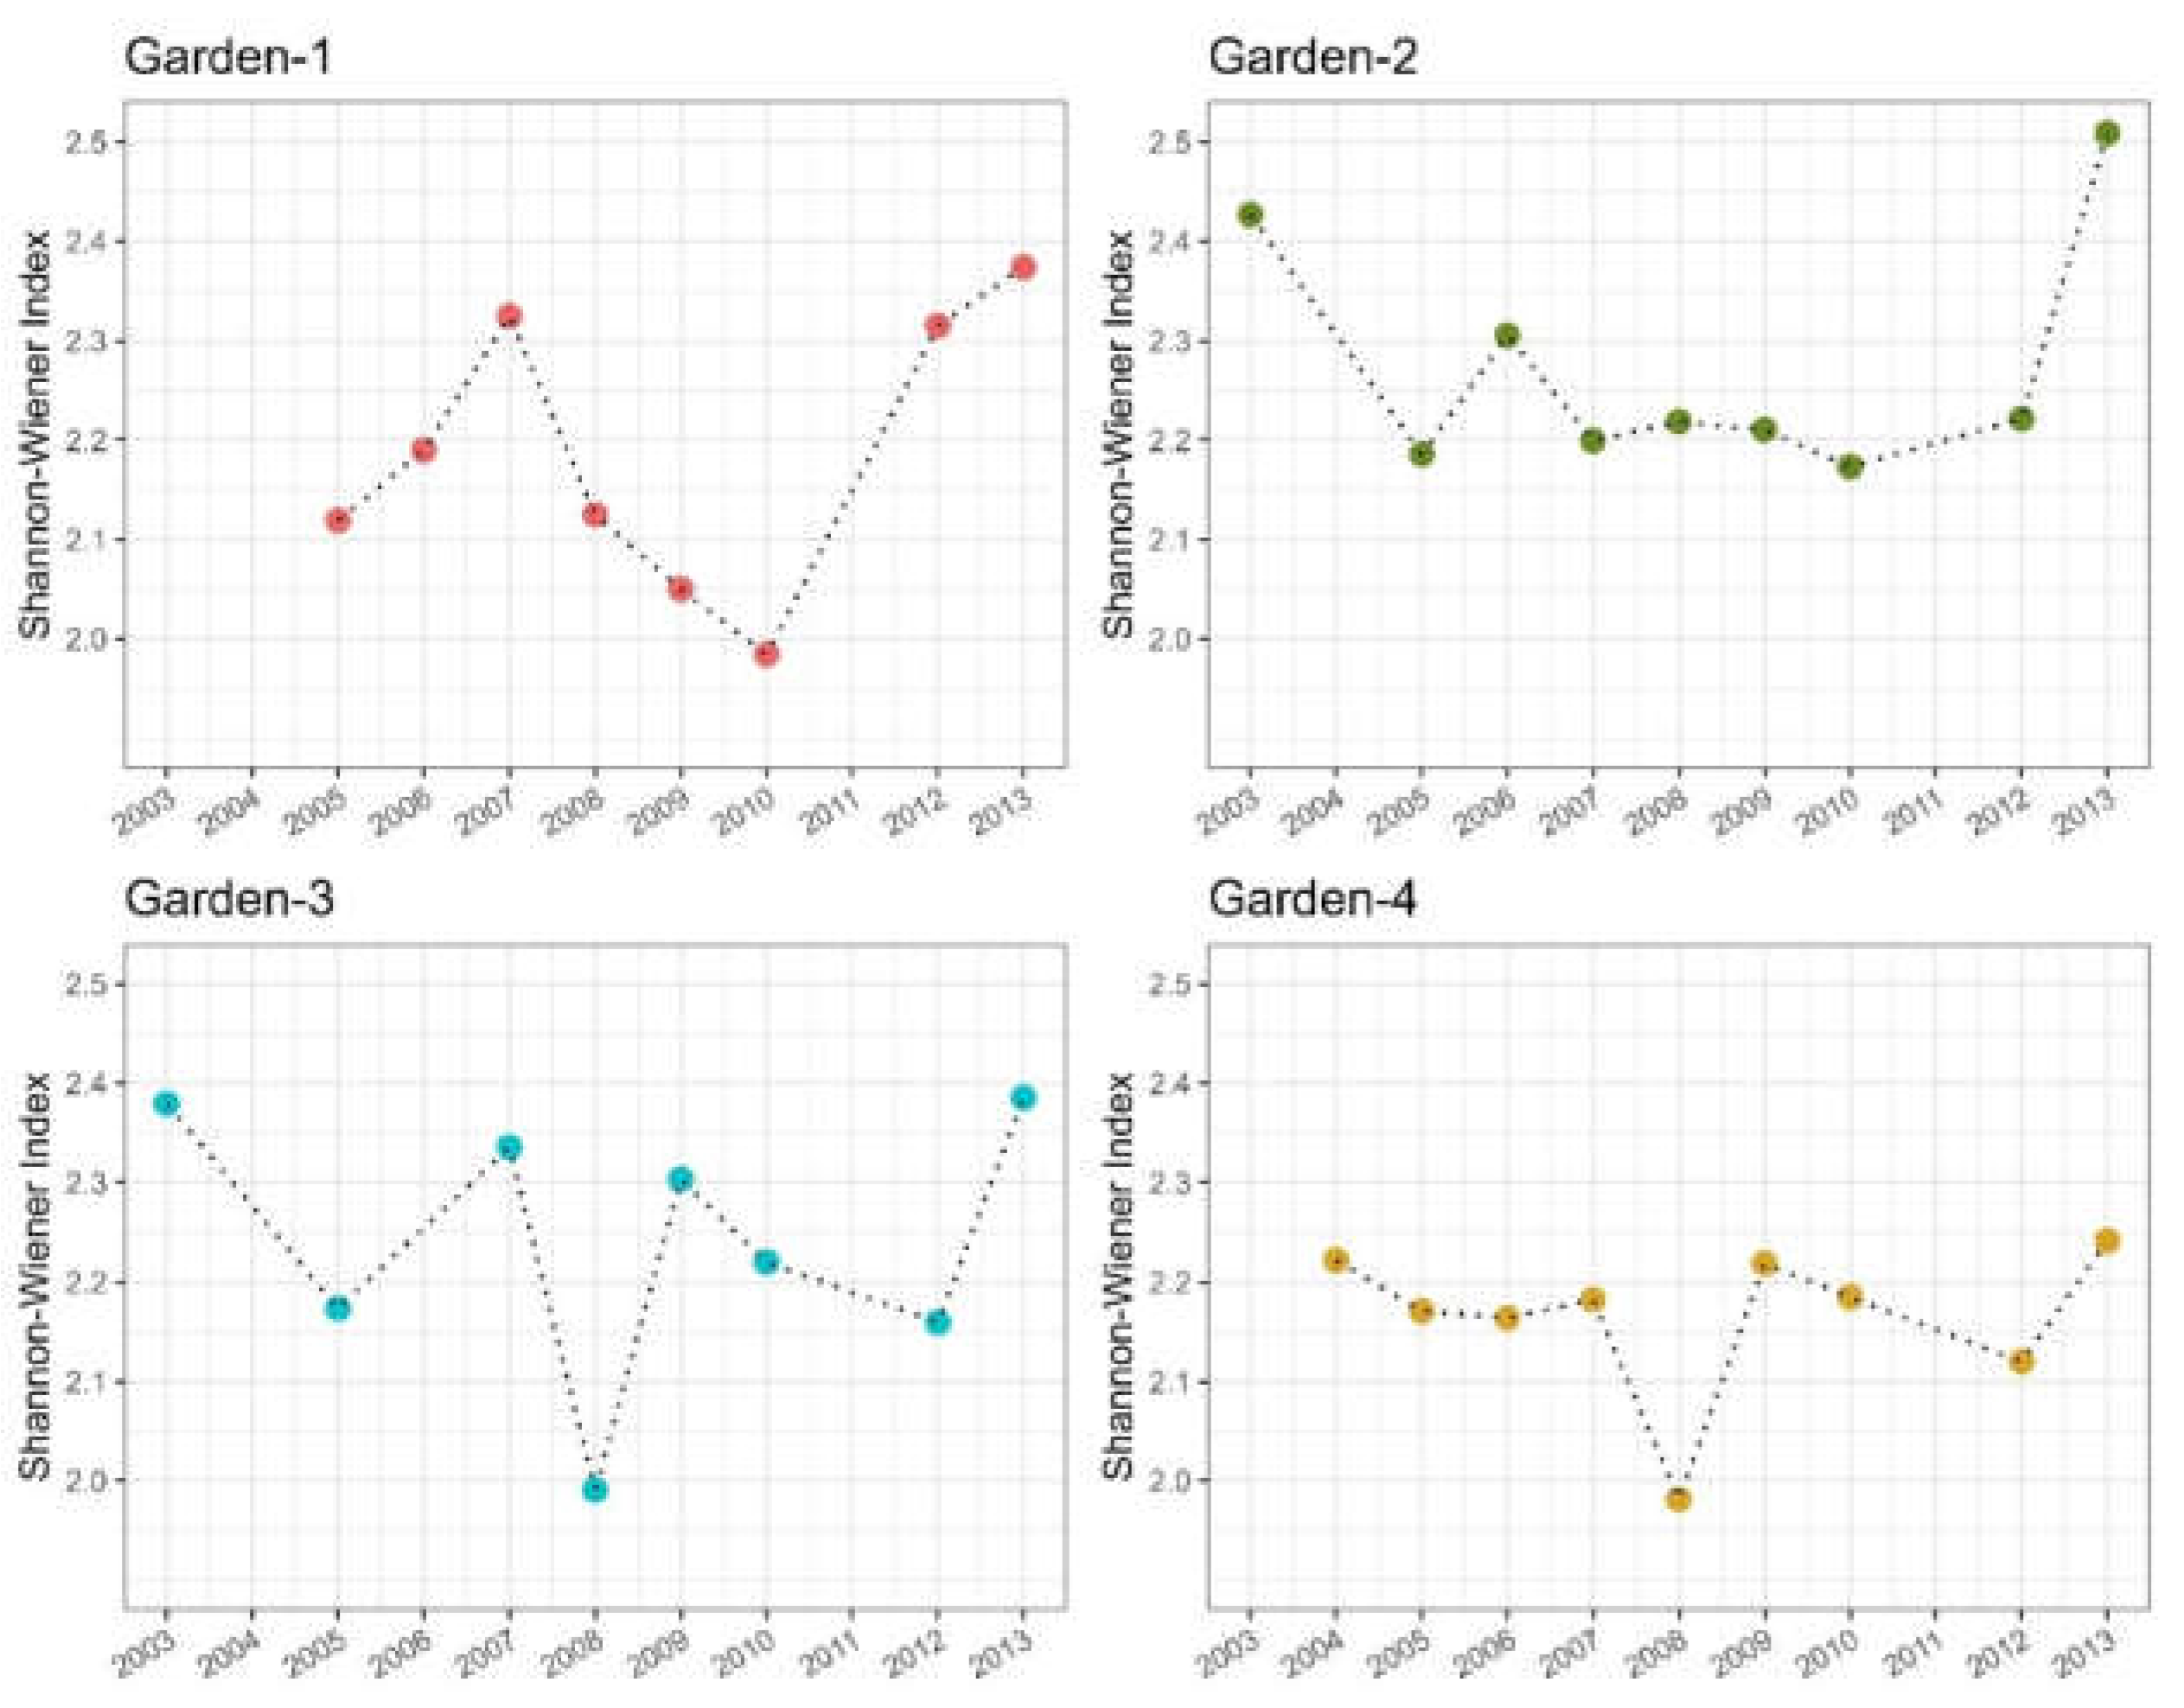
Figure 5.
Population dynamics over time for the most abundant and representative ant species found in Garden-1 (the youngest garden).
Figure 5.
Population dynamics over time for the most abundant and representative ant species found in Garden-1 (the youngest garden).
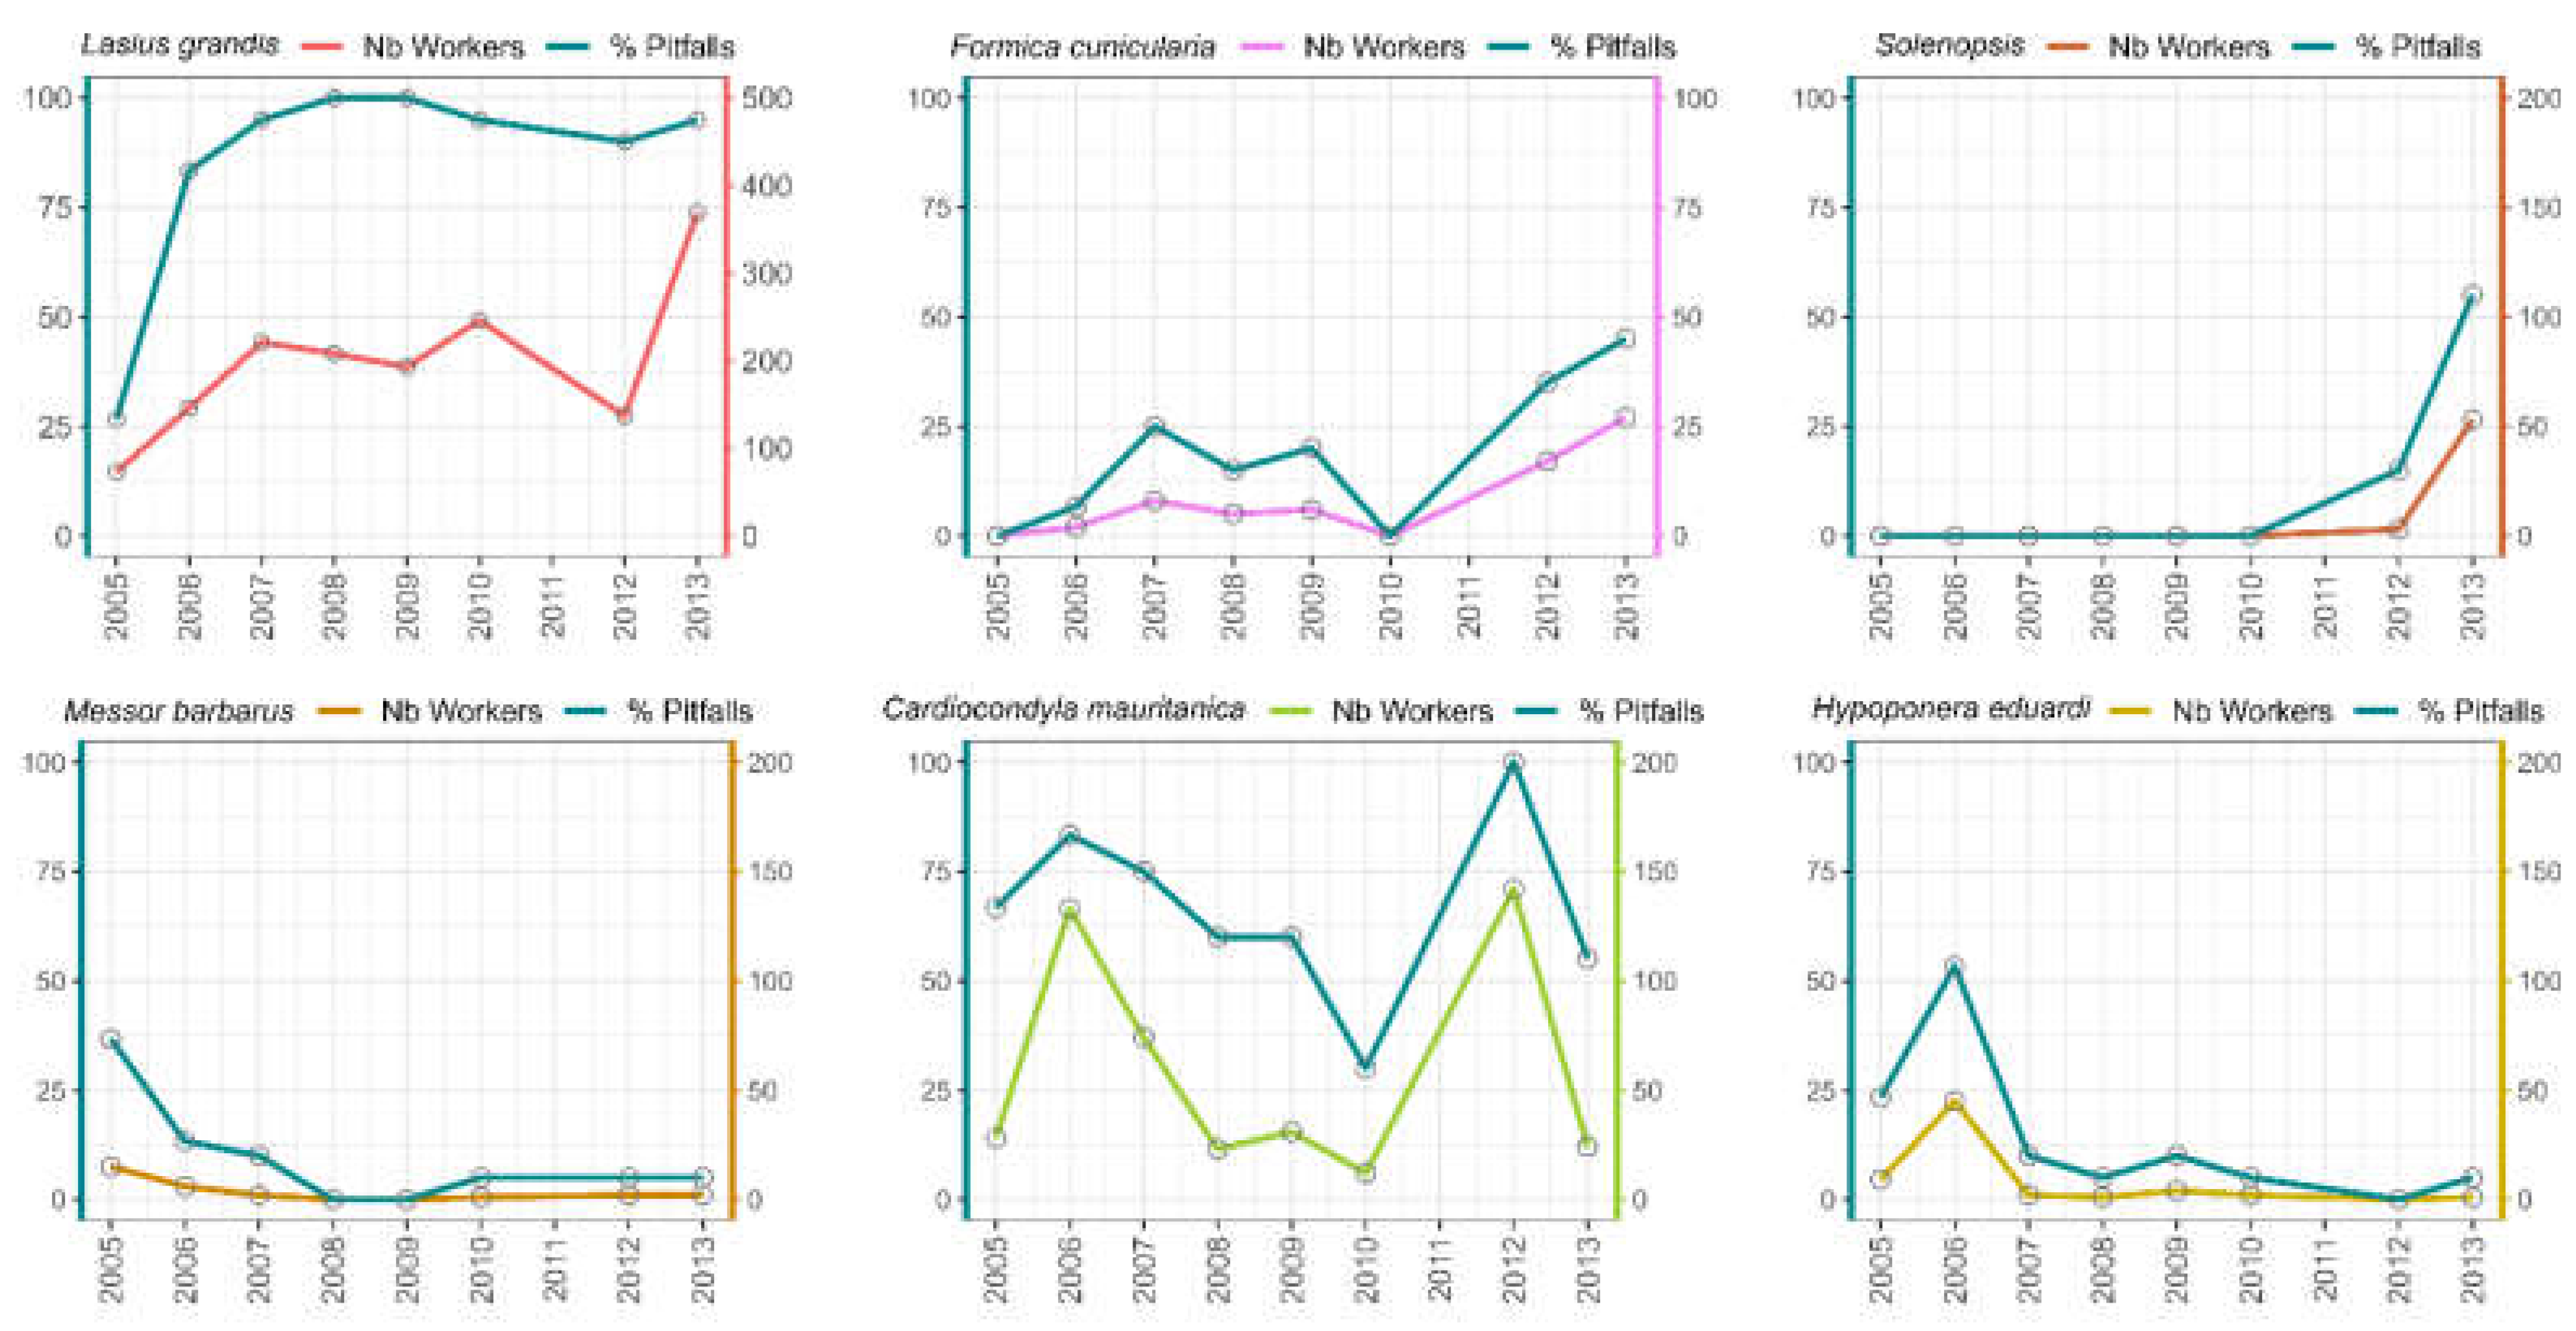
Figure 6.
Population dynamics over time for the most abundant and representative ant species found in Garden-2 (the mature unwatered garden).
Figure 6.
Population dynamics over time for the most abundant and representative ant species found in Garden-2 (the mature unwatered garden).
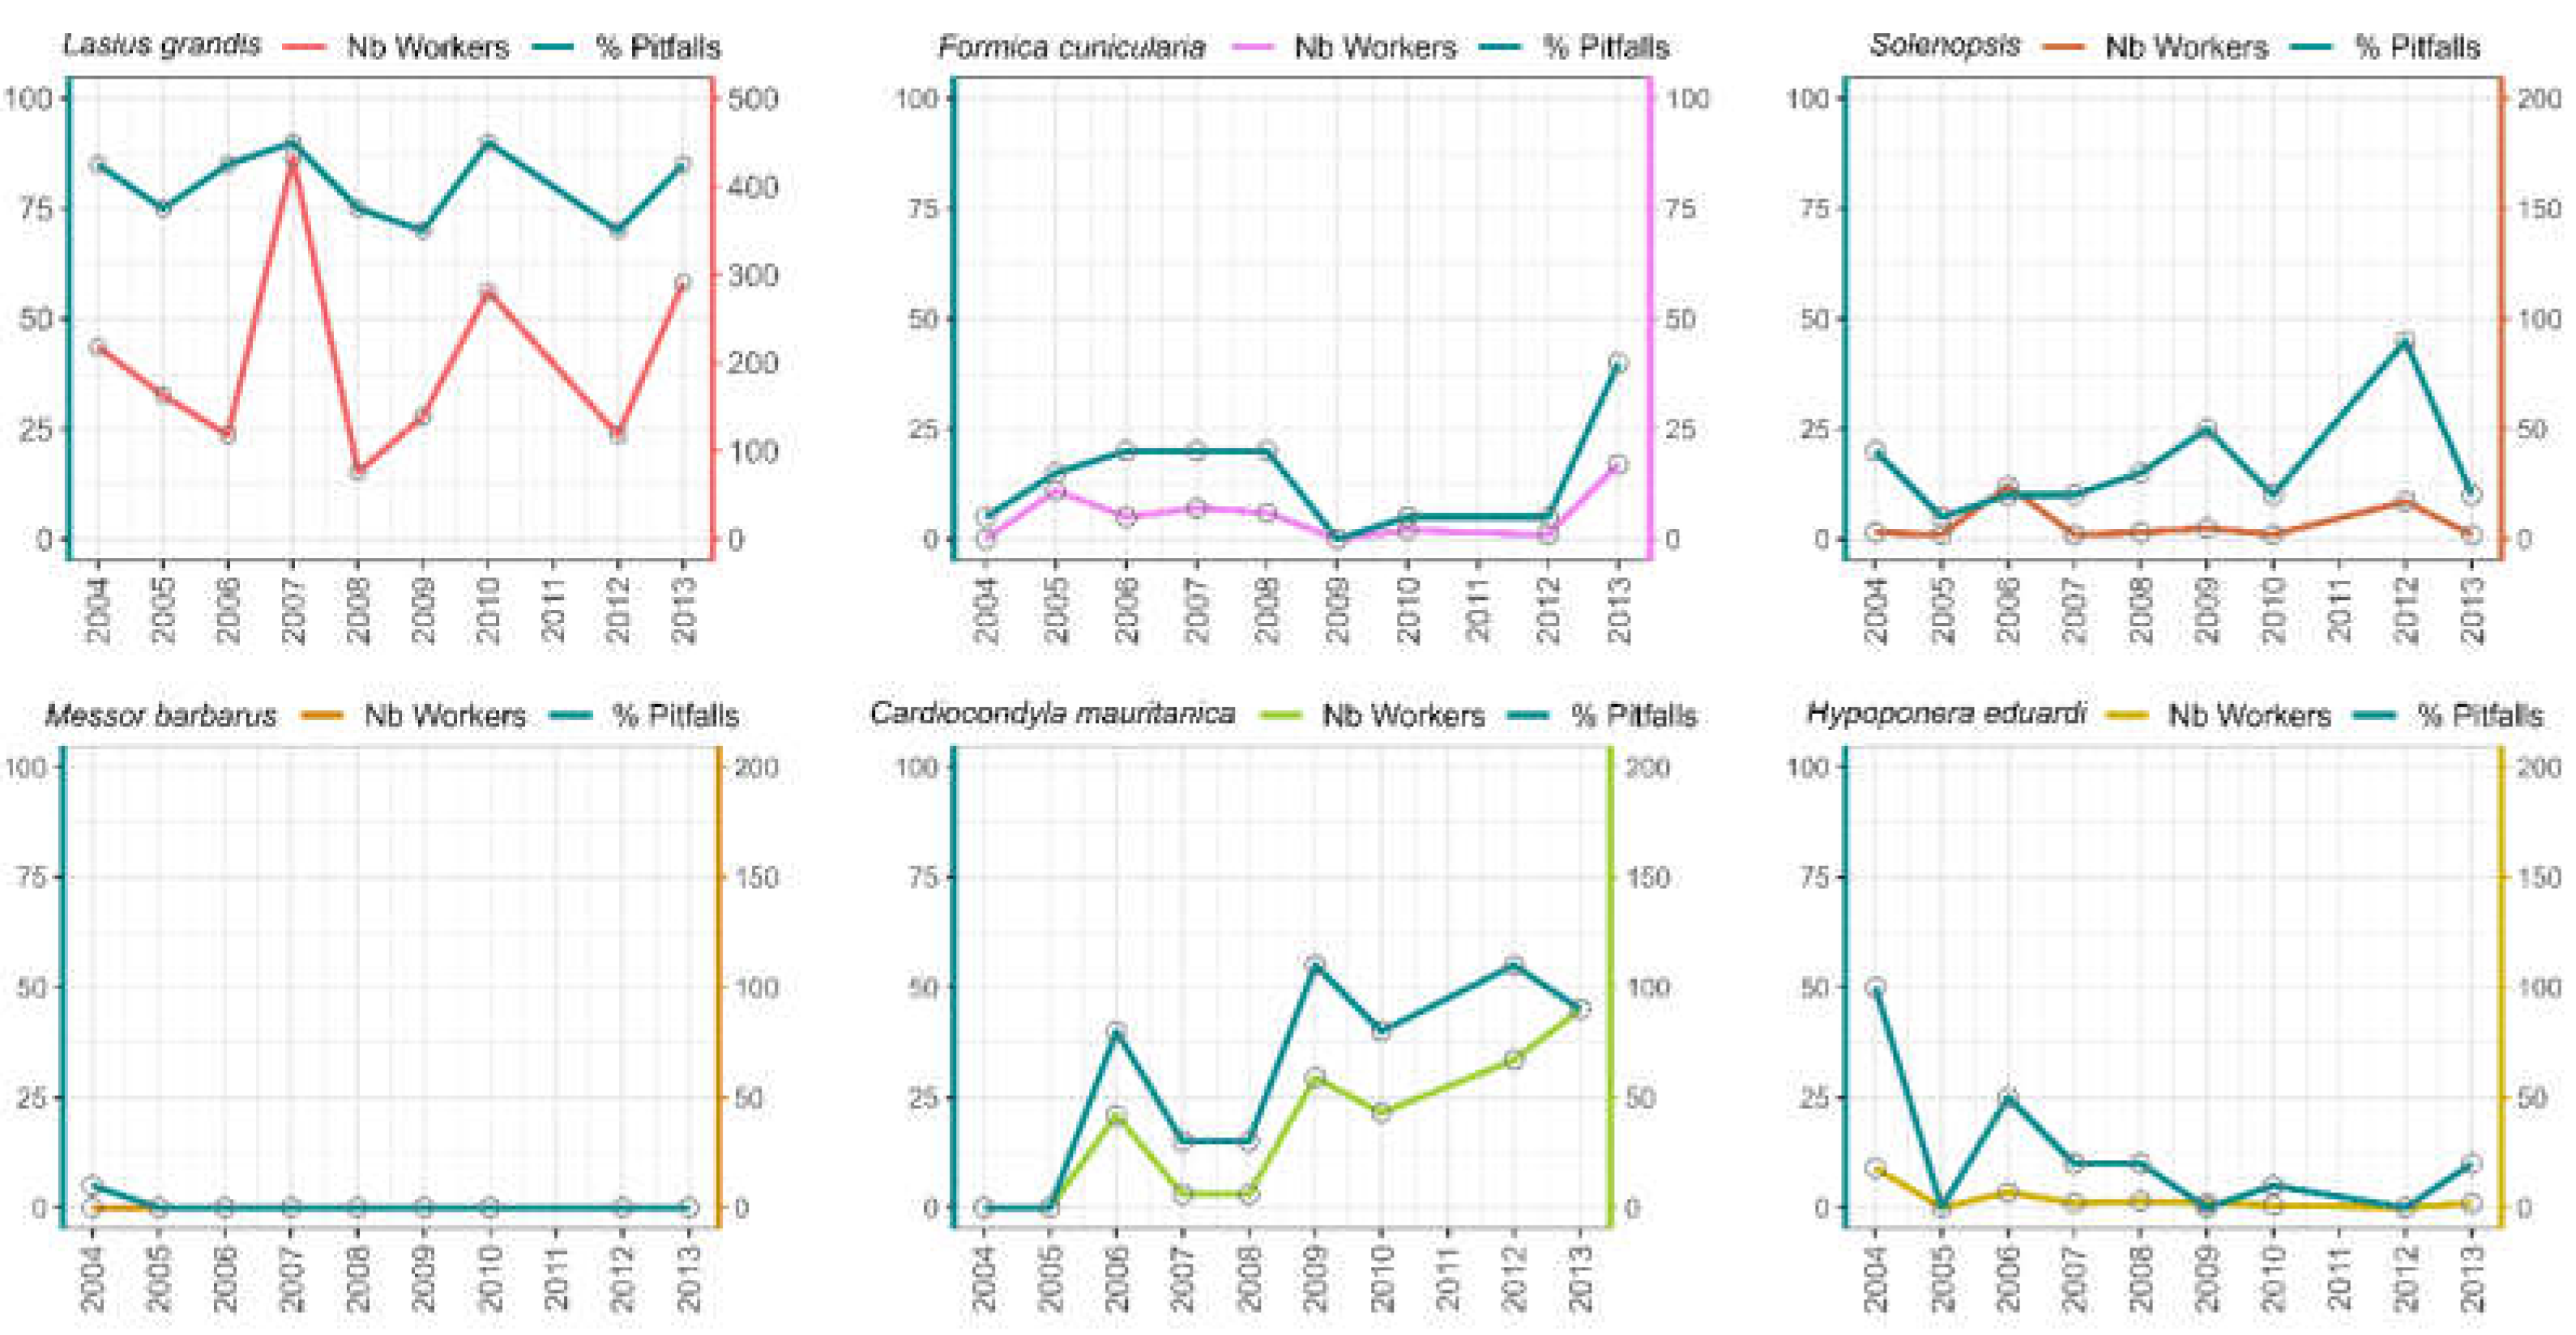

Table 1.
Ant species found for each study garden during the study.
| Species | Garden-1 | Garden-2 | Garden-3 | Garden-4 | Total |
|---|---|---|---|---|---|
| Aphaenogaster gibbosa (Latreille, 1798) | 14 | 11 | 80 | 56 | 161 |
| Aphaenogaster senilis Mayr, 1853 | 31 | 48 | 54 | 44 | 177 |
| Camponotus barbaricus Emery, 1905 | 0 | 21 | 55 | 16 | 92 |
| Camponotus lateralis (Olivier, 1792) | 0 | 0 | 0 | 1 | 1 |
| Camponotus micans (Nylander, 1856) | 0 | 1 | 0 | 0 | 1 |
| Cardiocondyla mauritanica Forel, 1890 | 107 | 53 | 3 | 5 | 168 |
| Cataglyphis rosenhaueri Santschi, 1925 | 2 | 2 | 2 | 0 | 6 |
| Crematogaster auberti Emery, 1869 | 2 | 2 | 2 | 0 | 6 |
| Crematogaster scutellaris (Olivier, 1792) | 0 | 2 | 4 | 5 | 11 |
| Crematogaster sordidula (Nylander, 1849) | 0 | 1 | 0 | 0 | 1 |
| Formica cunicularia Latreille, 1798 | 30 | 25 | 3 | 0 | 58 |
| Formica gerardi Bondroit 1917 | 2 | 3 | 0 | 0 | 5 |
| Hypoponera eduardi (Forel, 1894) | 26 | 20 | 1 | 1 | 48 |
| Lasius grandis Forel, 1909 | 141 | 137 | 38 | 107 | 423 |
| Messor barbarus Linnaeus, 1767 | 18 | 0 | 0 | 0 | 18 |
| Myrmica aloba Forel, 1909 | 0 | 0 | 0 | 10 | 10 |
| Pheidole pallidula (Nylander, 1849) | 79 | 100 | 100 | 127 | 406 |
| Plagiolepis pygmaea (Latreille, 1798) | 1 | 56 | 98 | 64 | 219 |
| Plagiolepis schmitzii Forel, 1895 | 8 | 15 | 6 | 6 | 35 |
| Solenopsis sp cfr | 14 | 29 | 21 | 33 | 97 |
| Strumigenys membranifera (Emery, 1869) | 5 | 7 | 1 | 0 | 13 |
| Tapinoma erraticum (Latreille, 1798) | 4 | 13 | 14 | 14 | 45 |
| Tapinoma madeirense Forel, 1895 | 1 | 18 | 4 | 12 | 35 |
| Tapinoma nigerrimum group (Nylander, 1856) | 13 | 8 | 8 | 4 | 33 |
| Temnothorax alfacarensis Tinaut & Reyes-López, 2020 | 0 | 0 | 1 | 1 | 2 |
| Temnothorax pardoi Tinaut, 1987 | 0 | 3 | 1 | 4 | 8 |
| Temnothorax racovitzai Bondroit, 1918 | 0 | 6 | 0 | 4 | 10 |
| Tetramorium caespitum (Linnaeus, 1758) | 23 | 0 | 0 | 0 | 23 |
| Tetramorium forte Forel, 1904 | 4 | 1 | 0 | 0 | 5 |
| Tetramorium semilaeve André, 1883 | 23 | 1 | 22 | 1 | 47 |
* Data belong to the total number of pitfall traps in which each species was found.
Table 2.
Analysis of the species indicator values showing which ants were significantly associated with (a) the gardens versus the natural and seminatural areas and (b) gardens experiencing different levels of disturbance.
Table 2.
Analysis of the species indicator values showing which ants were significantly associated with (a) the gardens versus the natural and seminatural areas and (b) gardens experiencing different levels of disturbance.
| Species | Greenery Category | Indicator Value (%) | P | |
| Lasius grandis | Garden | 85,1 | 0,001 | |
| Pheidole pallidula | Garden | 79,2 | 0,001 | |
| Cardiocondyla mauritanica | Garden | 70,7 | 0,001 | |
| Plagiolepis pygmaea | Garden | 69,3 | 0,002 | |
| Solenopsis spp. | Garden | 63,9 | 0,021 | |
| Formica cunicularia | Garden | 56,5 | 0,001 | |
| Hypoponera eduardi | Garden | 54,9 | 0,001 | |
| Tapinoma erraticum | Garden | 52,8 | 0,013 | |
| Strumigenys membranifera | Garden | 40,8 | 0,005 | |
| Temnothorax pardoi | Garden | 35,4 | 0,015 | |
| Messor barbarus | Natural/Seminatural | 87,9 | 0,001 | |
| Plagiolepis shcmitzii | Natural/Seminatural | 79,1 | 0,001 | |
| Tetramorium semilaeve | Natural/Seminatural | 77,2 | 0,001 | |
| Aphaenogaster gibbosa | Natural/Seminatural | 76,4 | 0,001 | |
| Aphaenogaster senilis | Natural/Seminatural | 76,2 | 0,001 | |
| Tapinoma nigerrimum | Natural/Seminatural | 70,4 | 0,001 | |
| Crematogaster auberti | Natural/Seminatural | 64,2 | 0,001 | |
| Temnothorax tyndalei | Natural/Seminatural | 57,2 | 0,001 | |
| Temnothorax alfacarensis | Natural/Seminatural | 54,9 | 0,001 | |
| Camponotus micans | Natural/Seminatural | 54,3 | 0,001 | |
| Cataglyphis velox | Natural/Seminatural | 51,9 | 0,001 | |
| Cataglyphis rosenhaueri | Natural/Seminatural | 45,3 | 0,009 | |
| Camponotus pilicornis | Natural/Seminatural | 43,9 | 0,001 | |
| Tetramorium forte | Natural/Seminatural | 41,2 | 0,025 | |
| Goniomma hispanicum | Natural/Seminatural | 36,7 | 0,003 | |
| Messor celiae | Natural/Seminatural | 31 | 0,011 | |
| (a) Gardens vs natural/seminatural areas | ||||
| Species | Maturity status | Indicator Value (%) | P | |
| Cardiocondyla mauritanica | 0 | 73,9 | 0,001 | |
| Messor barbarus | 0 | 71,1 | 0,001 | |
| Hypoponera eduardi | 0 | 60,3 | 0,001 | |
| Tetramorium semilaeve | 0 | 57,2 | 0,007 | |
| Tetramorium caespitum | 0 | 52,7 | 0,002 | |
| Plagiolepis pygmaea | 1 | 68,8 | 0,001 | |
| Solenopsis spp | 1 | 61.5 | 0,027 | |
| Formica cunicularia | 1 | 59,6 | 0,002 | |
| Strumigenys membranifera | 1 | 50,9 | 0,024 | |
| Temnothorax racovitzai | 1 | 44,5 | 0,025 | |
| Aphaennogaster gibbosa | 2 | 74,7 | 0,001 | |
| Camponotus barbarus | 2 | 62,5 | 0,006 | |
| Myrmica aloba | 2 | 37,3 | 0,045 | |
| (b)Young garden (maturity status = 0) vs mature gardens (unwatered, maturity status = 1; watered, maturity status = 2). | ||||
Table 3.
Population dynamics of the gardens’ most representative species (GLMM analyses).
| Garden-1 | Garden-2 | Garden-3 | Garden-4 | ||||||
|---|---|---|---|---|---|---|---|---|---|
| Species | z | p | z | p | z | p | z | p | |
| Number of workers | L. grandis | 2,57 | 0,01 | 0,20 | 0,838 | 1,07 | 0,284 | -1,03 | 0,305 |
| F. cunicularia | 2,82 | 0,005 | 0,48 | 0,634 | 0 | 1 | - | - | |
| Solenopsis spp | 2,57 | 0,024 | 0,13 | 0,896 | -0,53 | 0,598 | 0,43 | 0,664 | |
| C. mauritanica | -0,8 | 0,936 | 2,59 | 0,009 | 1,18 | 0,237 | -3,23 | 0,001 | |
| H. eduardi | -3,14 | 0,002 | -2,39 | 0,017 | 0 | 1 | 0 | 1 | |
| M. barbarus | -1,84 | 0,06 | - | - | - | - | - | - | |
| Number of pitfalls | L. grandis | 2,27 | 0,024 | -0,05 | 0,957 | -0,74 | 0,459 | -1,42 | 0,157 |
| F. cunicularia | 2,72 | 0,05 | 0,83 | 0,404 | 0,002 | 0,998 | - | - | |
| Solenopsis spp | 2,86 | 0,004 | 1,19 | 0,232 | -1,83 | 0,06 | 1,58 | 0,113 | |
| C. mauritanica | -0,44 | 0,659 | 2,90 | 0,004 | 0,88 | 0,381 | 0,82 | 0,413 | |
| H. eduardi | -3,11 | 0,002 | -2,05 | 0,041 | 0,001 | 0,999 | -0,001 | 0,999 | |
| M. barbarus | -2,69 | 0,007 | - | - | -- | - | - | ||
Disclaimer/Publisher’s Note: The statements, opinions and data contained in all publications are solely those of the individual author(s) and contributor(s) and not of MDPI and/or the editor(s). MDPI and/or the editor(s) disclaim responsibility for any injury to people or property resulting from any ideas, methods, instructions or products referred to in the content. |
© 2024 by the authors. Licensee MDPI, Basel, Switzerland. This article is an open access article distributed under the terms and conditions of the Creative Commons Attribution (CC BY) license (http://creativecommons.org/licenses/by/4.0/).
Copyright: This open access article is published under a Creative Commons CC BY 4.0 license, which permit the free download, distribution, and reuse, provided that the author and preprint are cited in any reuse.


