Submitted:
31 December 2024
Posted:
01 January 2025
You are already at the latest version
Abstract
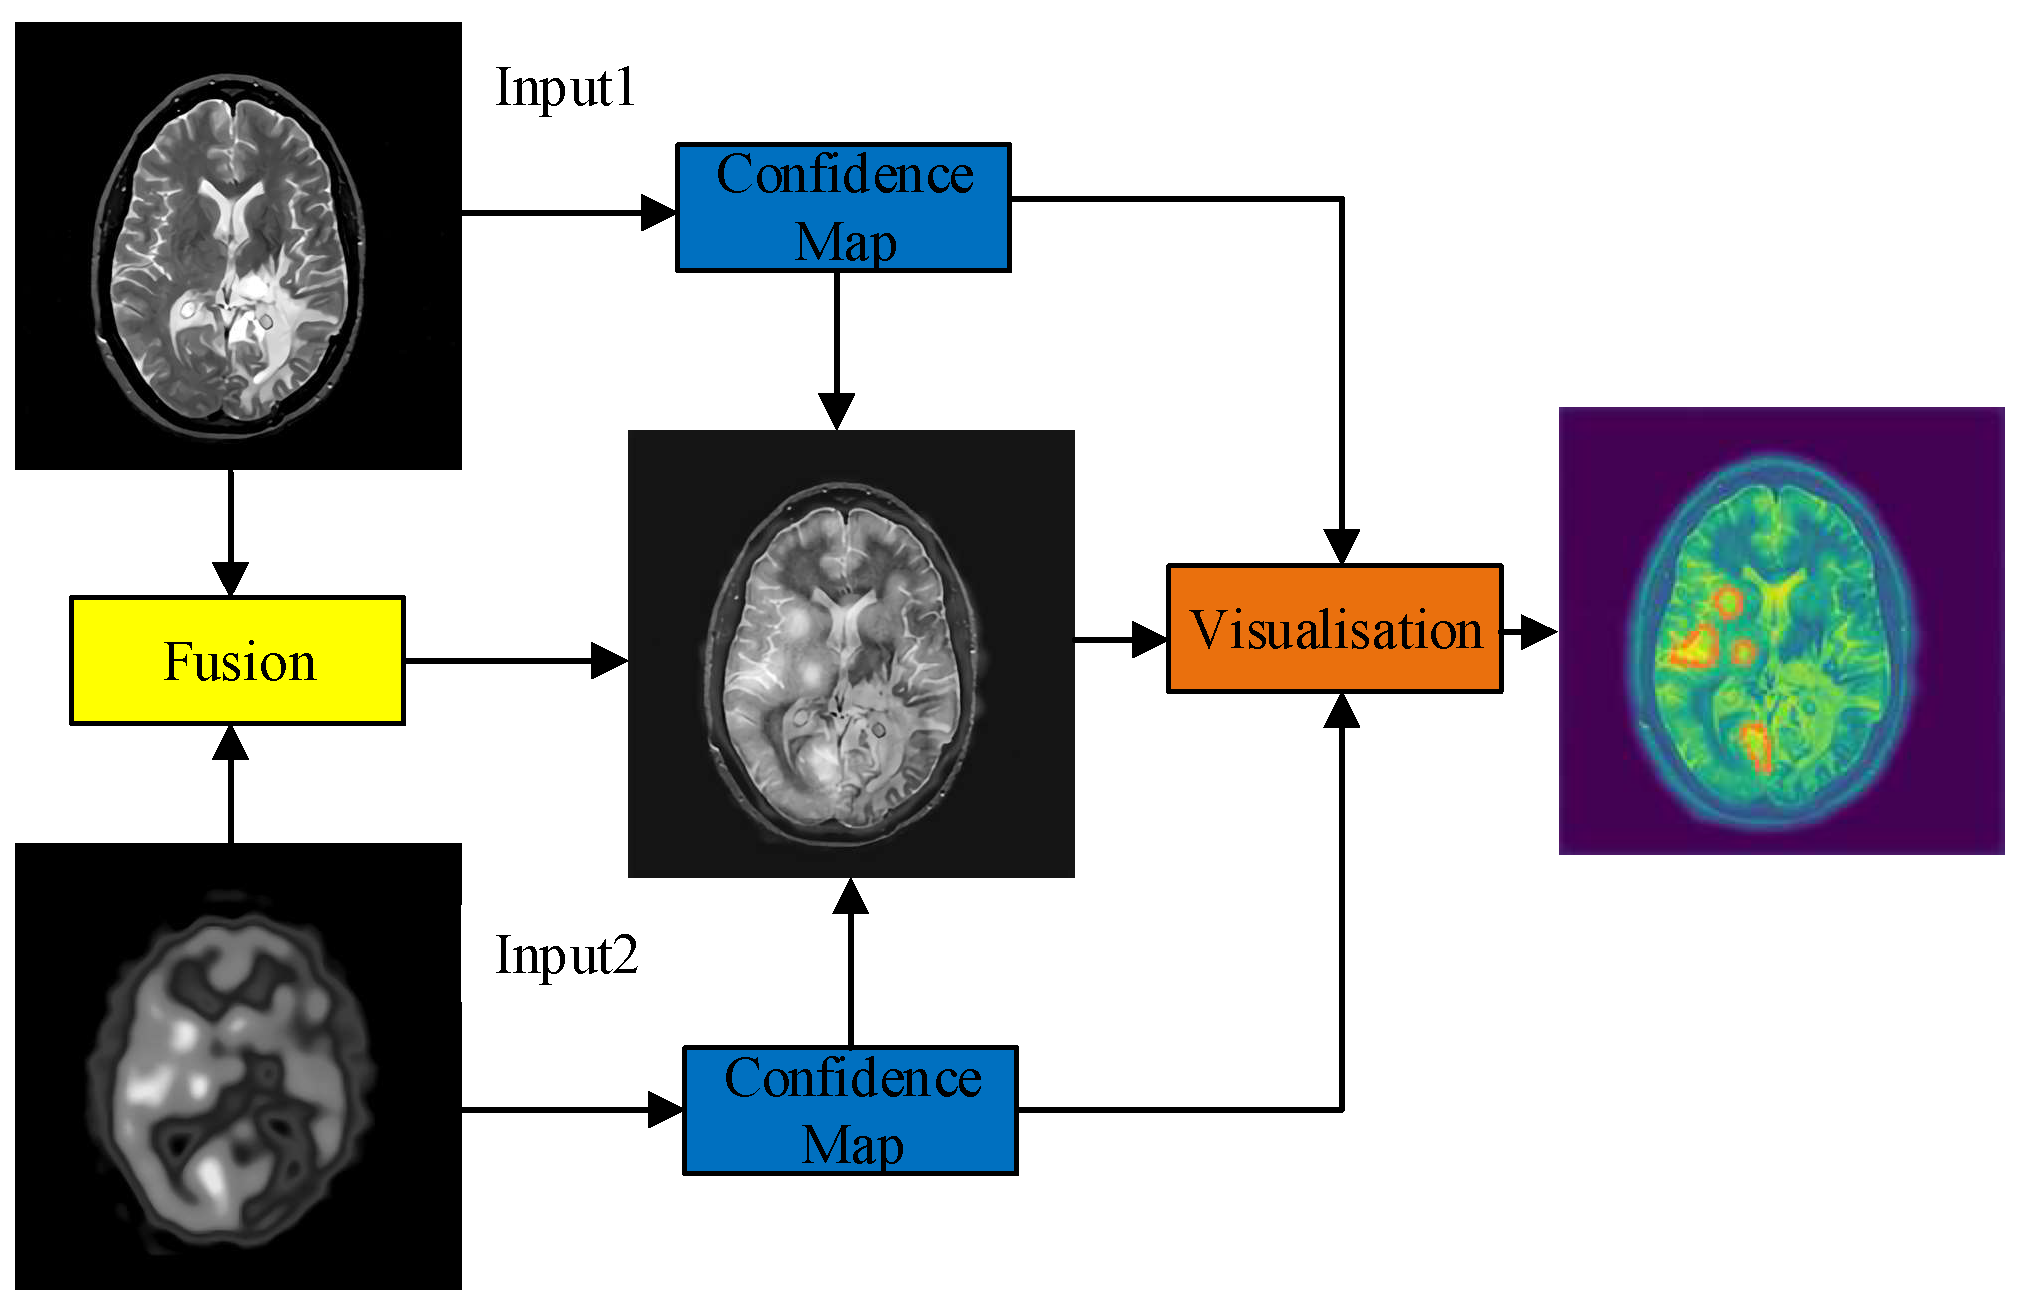
Data from magnetic resonance imaging (MRI) and positron emission tomography (PET) scans can effectively assist physicians in diagnosing and treating brain tumors. However, images from different modalities have their advantages and limitations. Multimodal medical image fusion is the process of extracting and merging the information of every single modality medical image and retaining the characteristic information of each modality to the maximum extent. Therefore, this paper proposes a medical image fusion method based on multi-scale contextual reasoning to address the problems of the scattered size distribution of pathological regions, inconspicuous detail features, and extensive visual differences between similar tissue images. Firstly, the original image is decomposed by the method to get the global part and the local part. Secondly, the multi-scale feature extraction network (MSFE-Net) mines the different regions between multi-level features and improves the network’s ability to extract pathological features at different scales. Meanwhile, the attention module is introduced to perform channel-weighted summation of the network feature maps to improve the feature expression ability of key channels so that the network can accurately capture the pathological feature regions. Thirdly, in the loss function design, multiple losses are used further to optimize the distribution of the sample feature space. This paper conducted experiments using clinical images from computed tomography/magnetic resonance/ of the brain. The experimental results show that the medical image fusion method based on multi-scale contextual inference works better than other advanced fusion methods.
Keywords:
1. Introduction
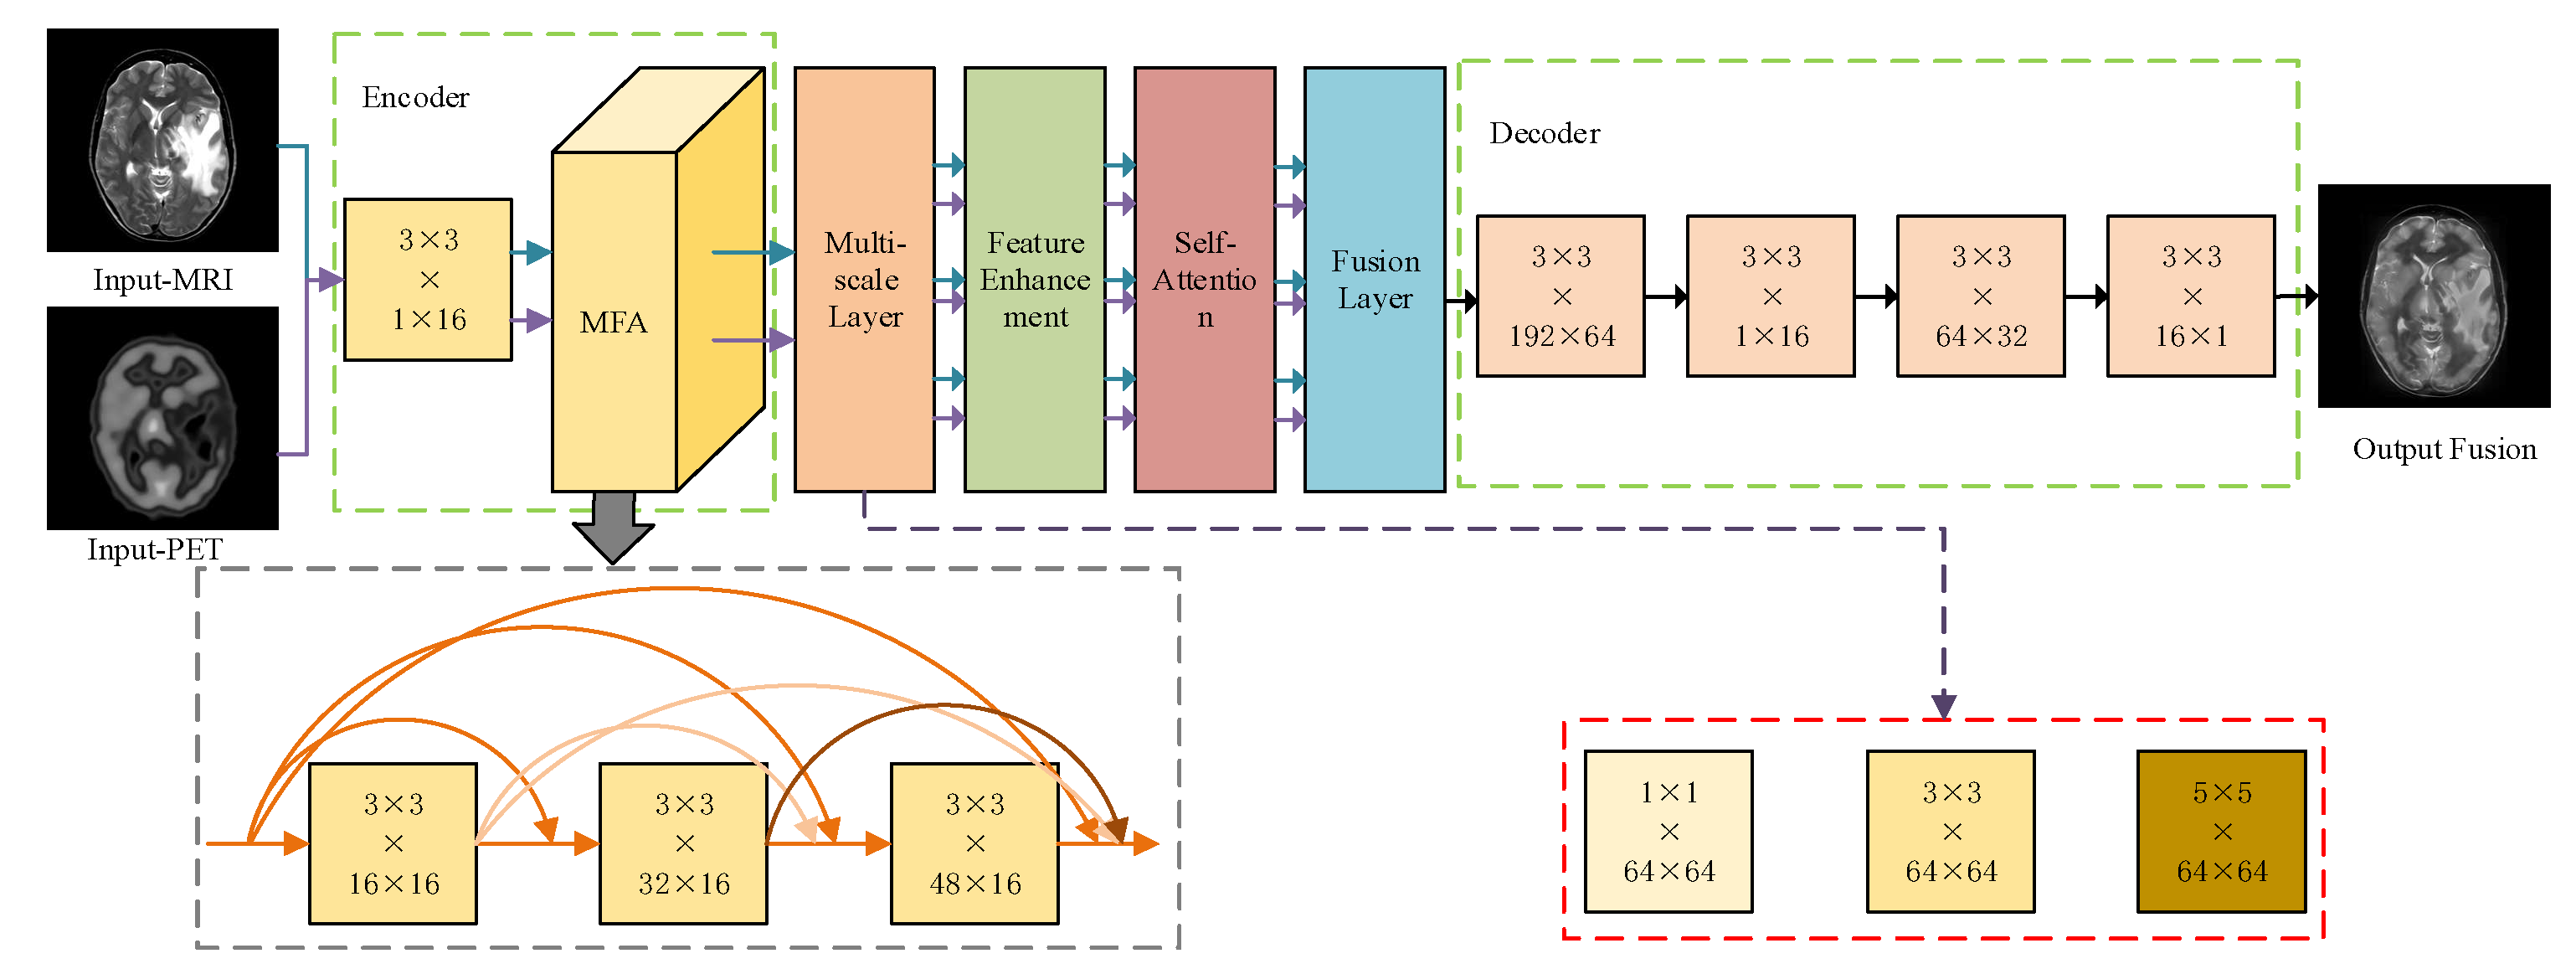
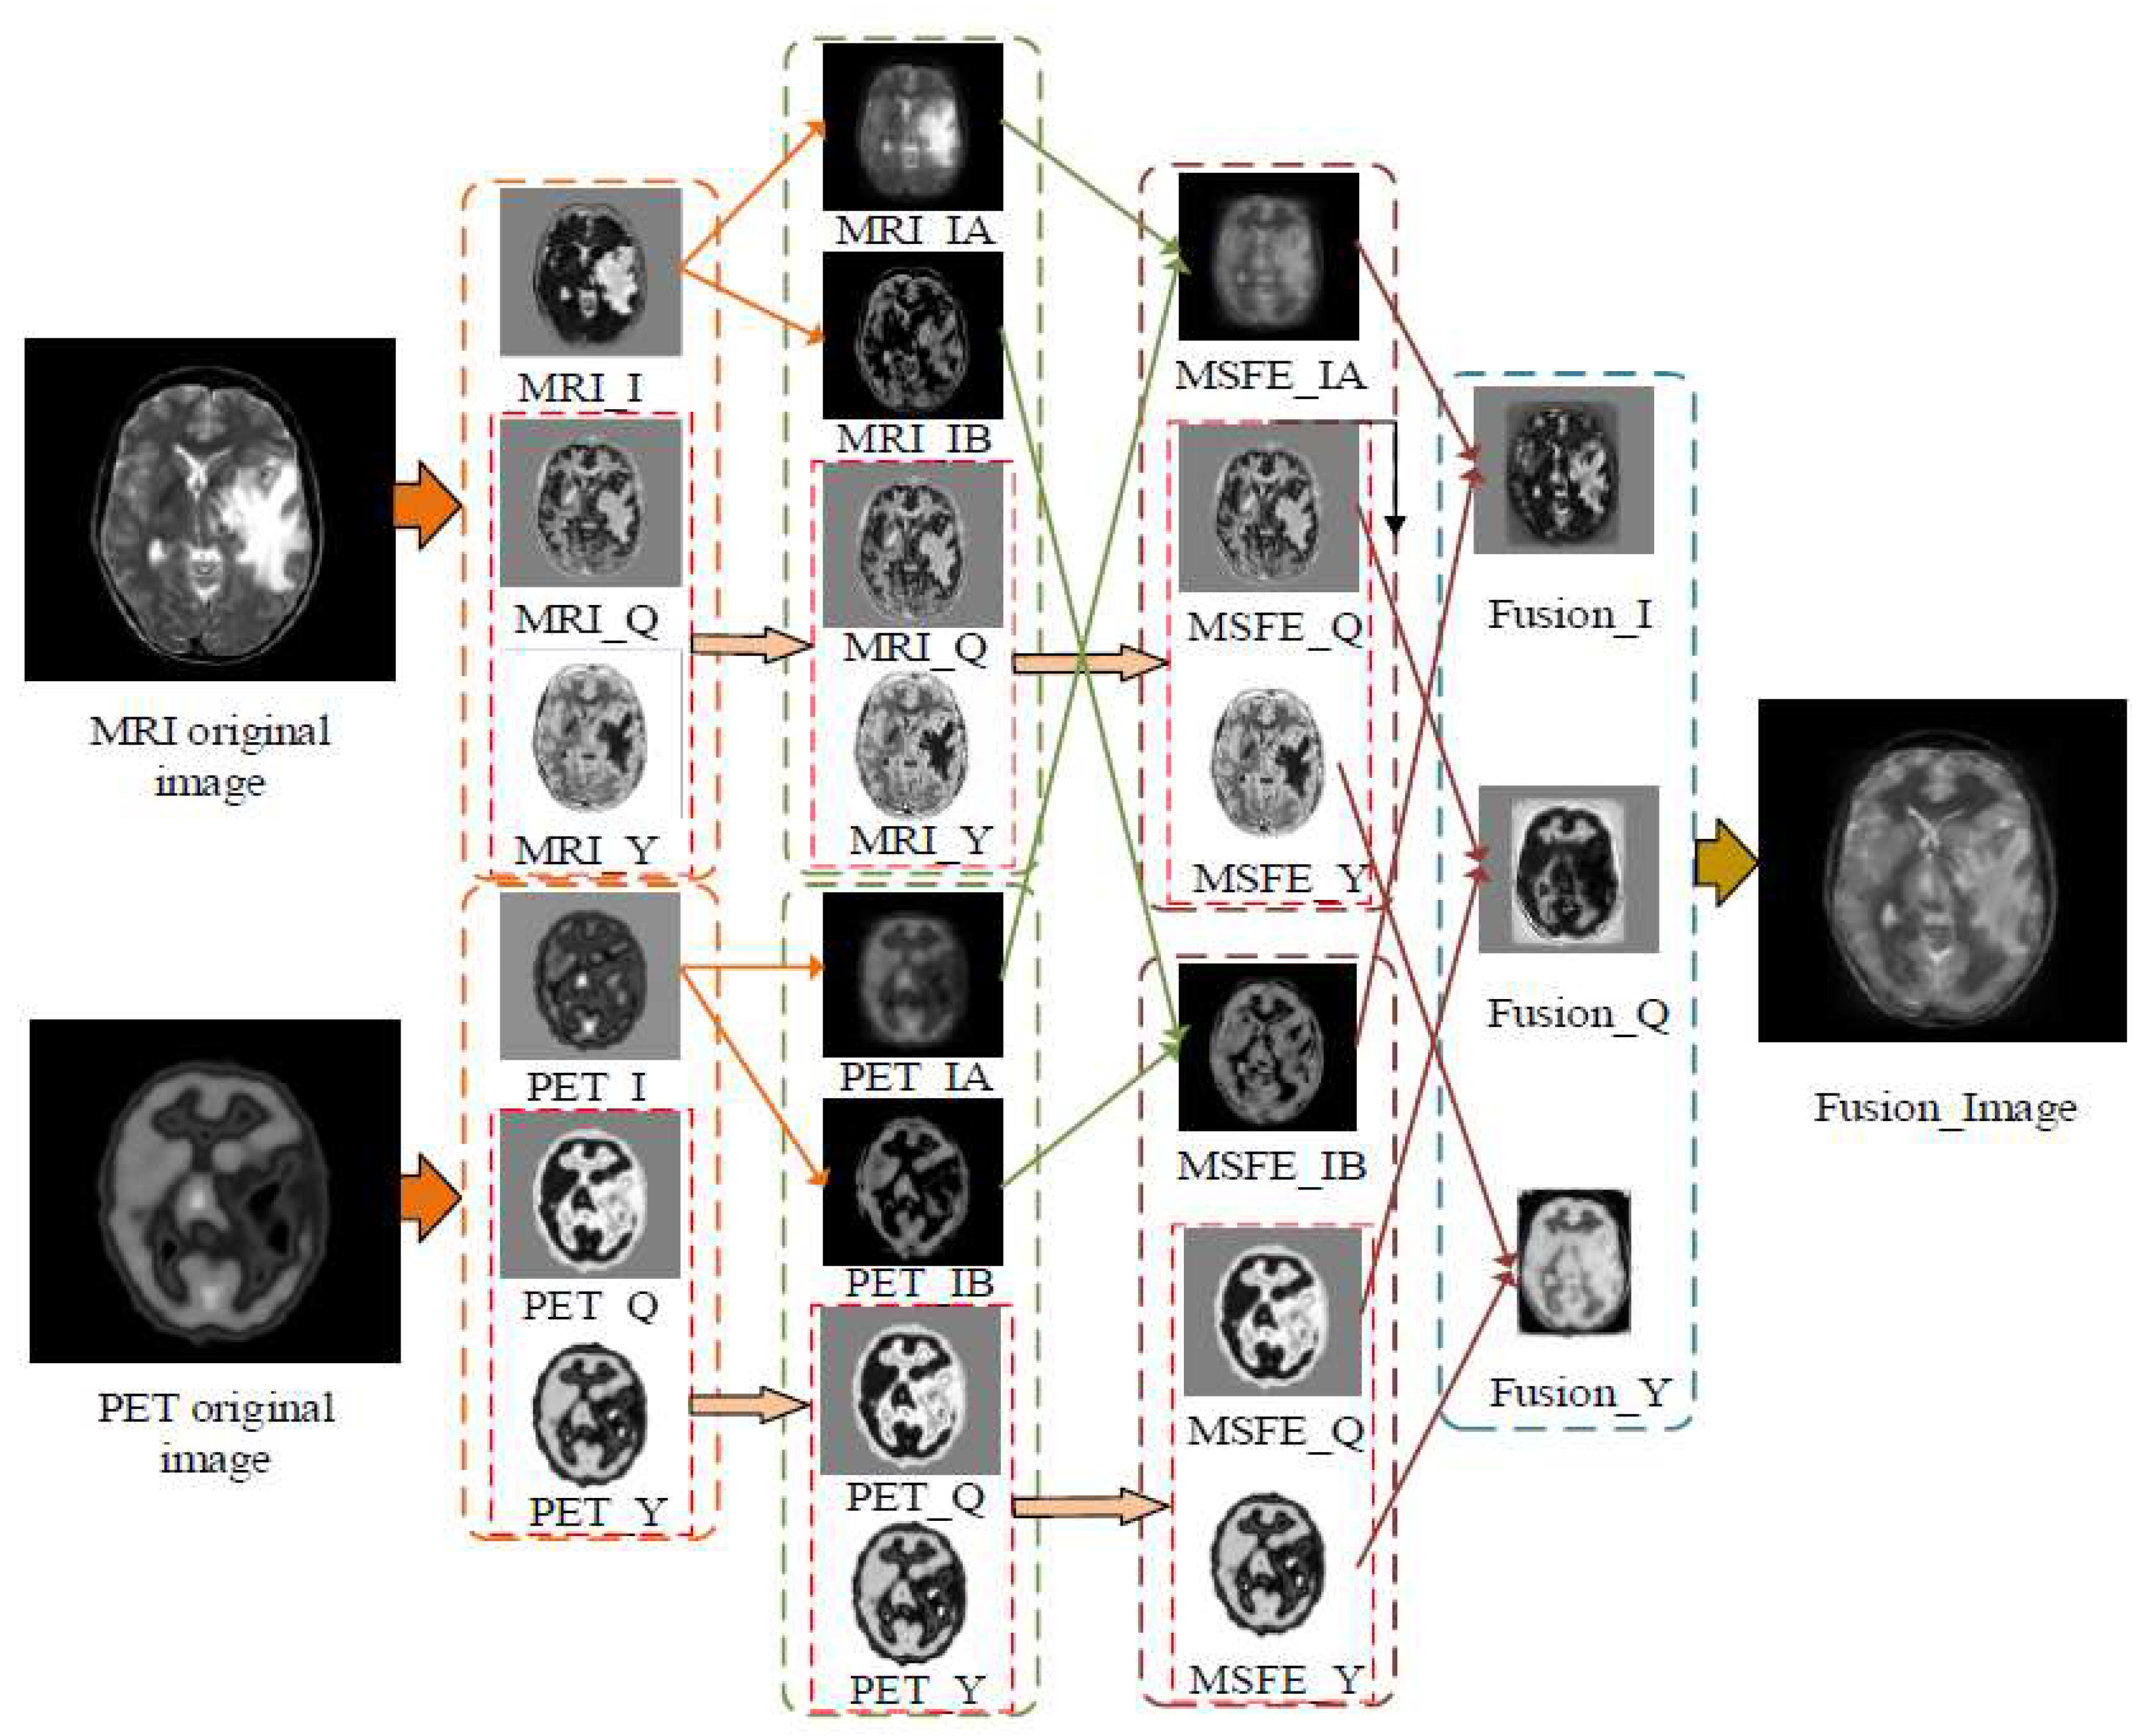
- A medical image fusion network model based on multiscale contextual inference is proposed to preserve the structural information of the images. The model uses large-sized extraction frames to extract global structural information for filtered images and small-sized extraction frames to extract local structural information for detail layer images.
- For feature maps of different scales, this paper proposes a self-attentive module to further filter different channel features in the feature maps to improve the feature representation of critical channels and further guide the network to focus its attention on the regions containing essential information.
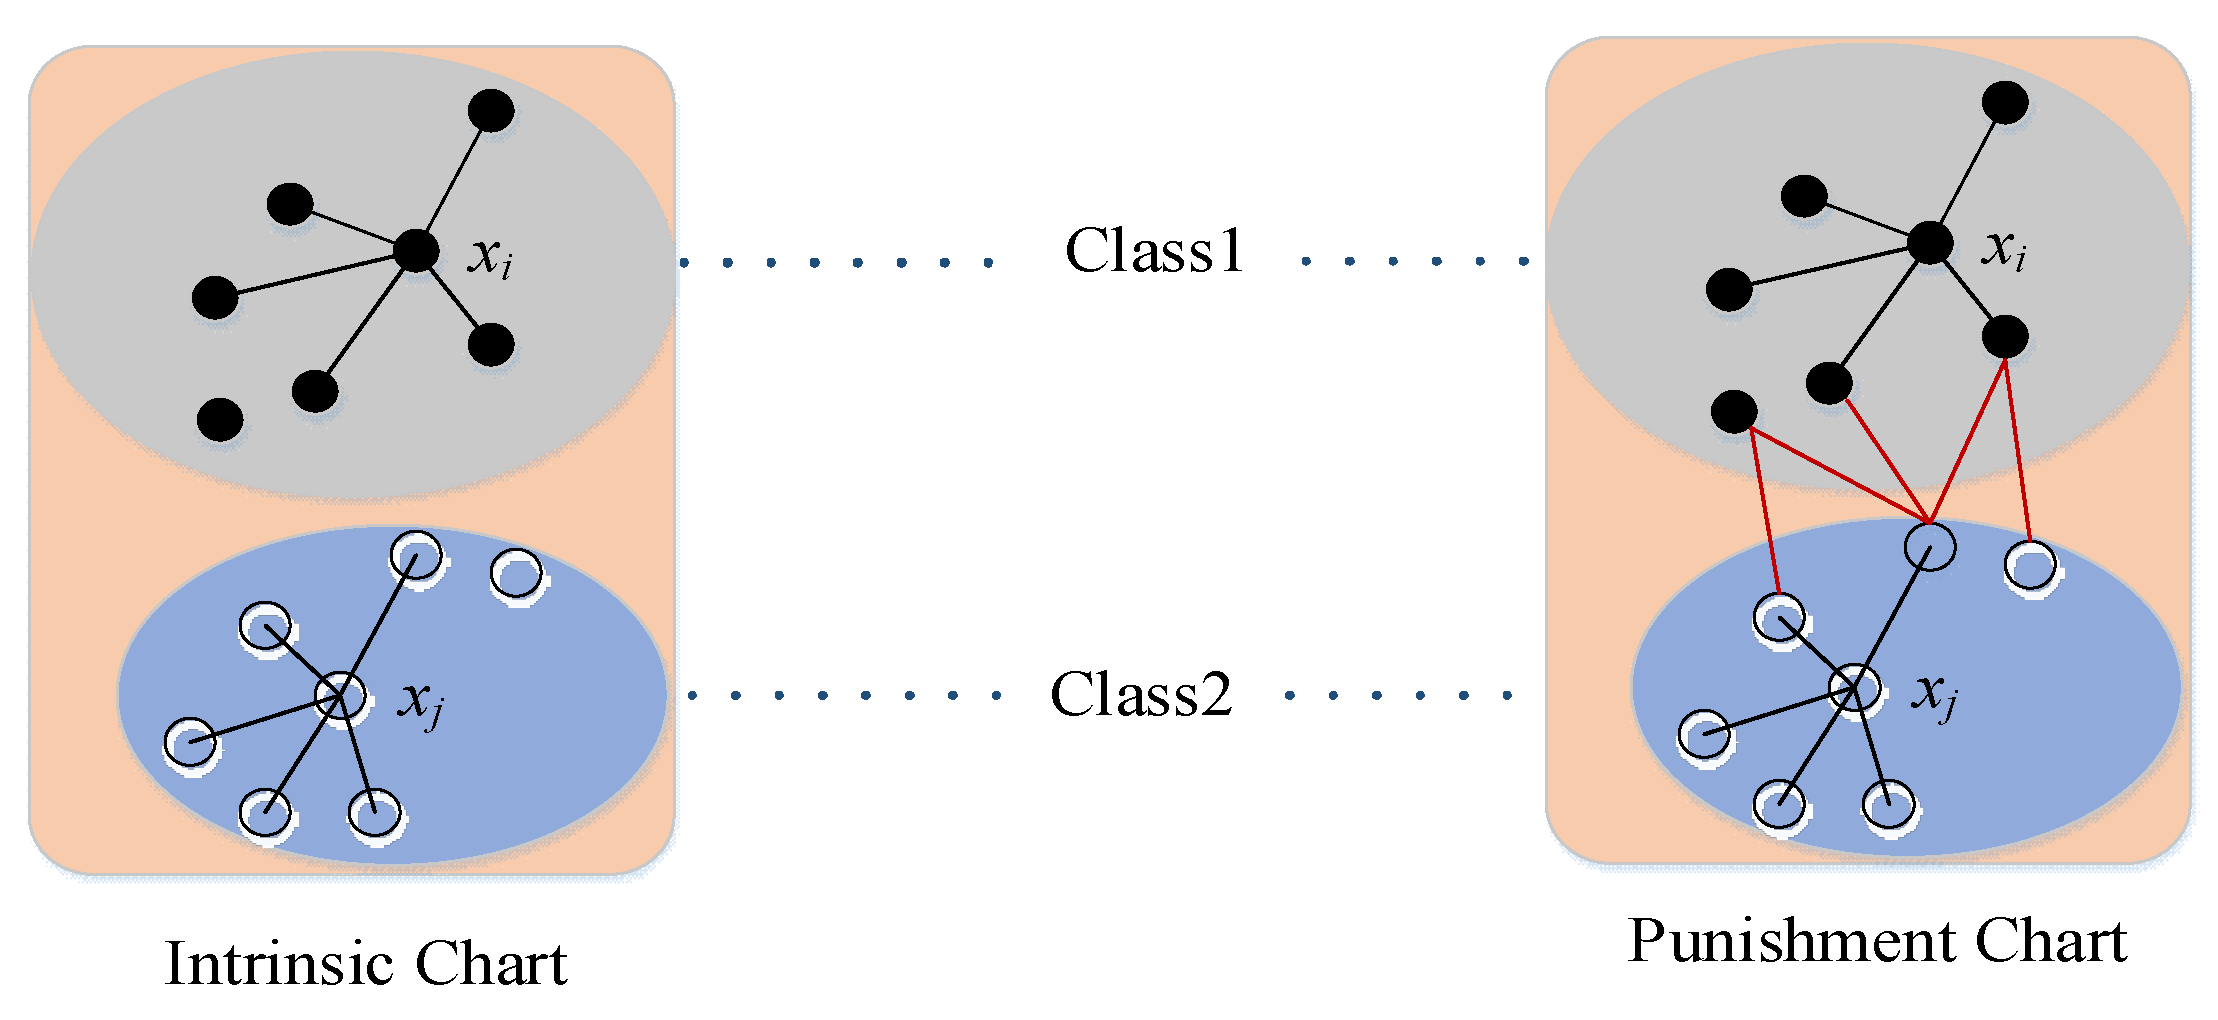
- Because most medical images have high background similarity, the data of the same class will present significant visual differences due to different acquisition objects, which leads to the mixing of sample features between other classes. Based on the fact that the distance in the feature space is enlarged due to the large visual differences between data of the same class, a new loss function is designed by combining the advantages of cross-entropy loss and central loss to deal with this problem.
2. Related Work
2.1. Space Domain-Based Medical Image Fusion Method
2.2. Medical Image Fusion Method Based on Change Domain
2.3. Deep Learning Based Medical Image Fusion Method
3. Methodology
3.1. Feature Encoder
3.2. Multi-Scale Feature Extraction Network
3.3. Feature Enhancement
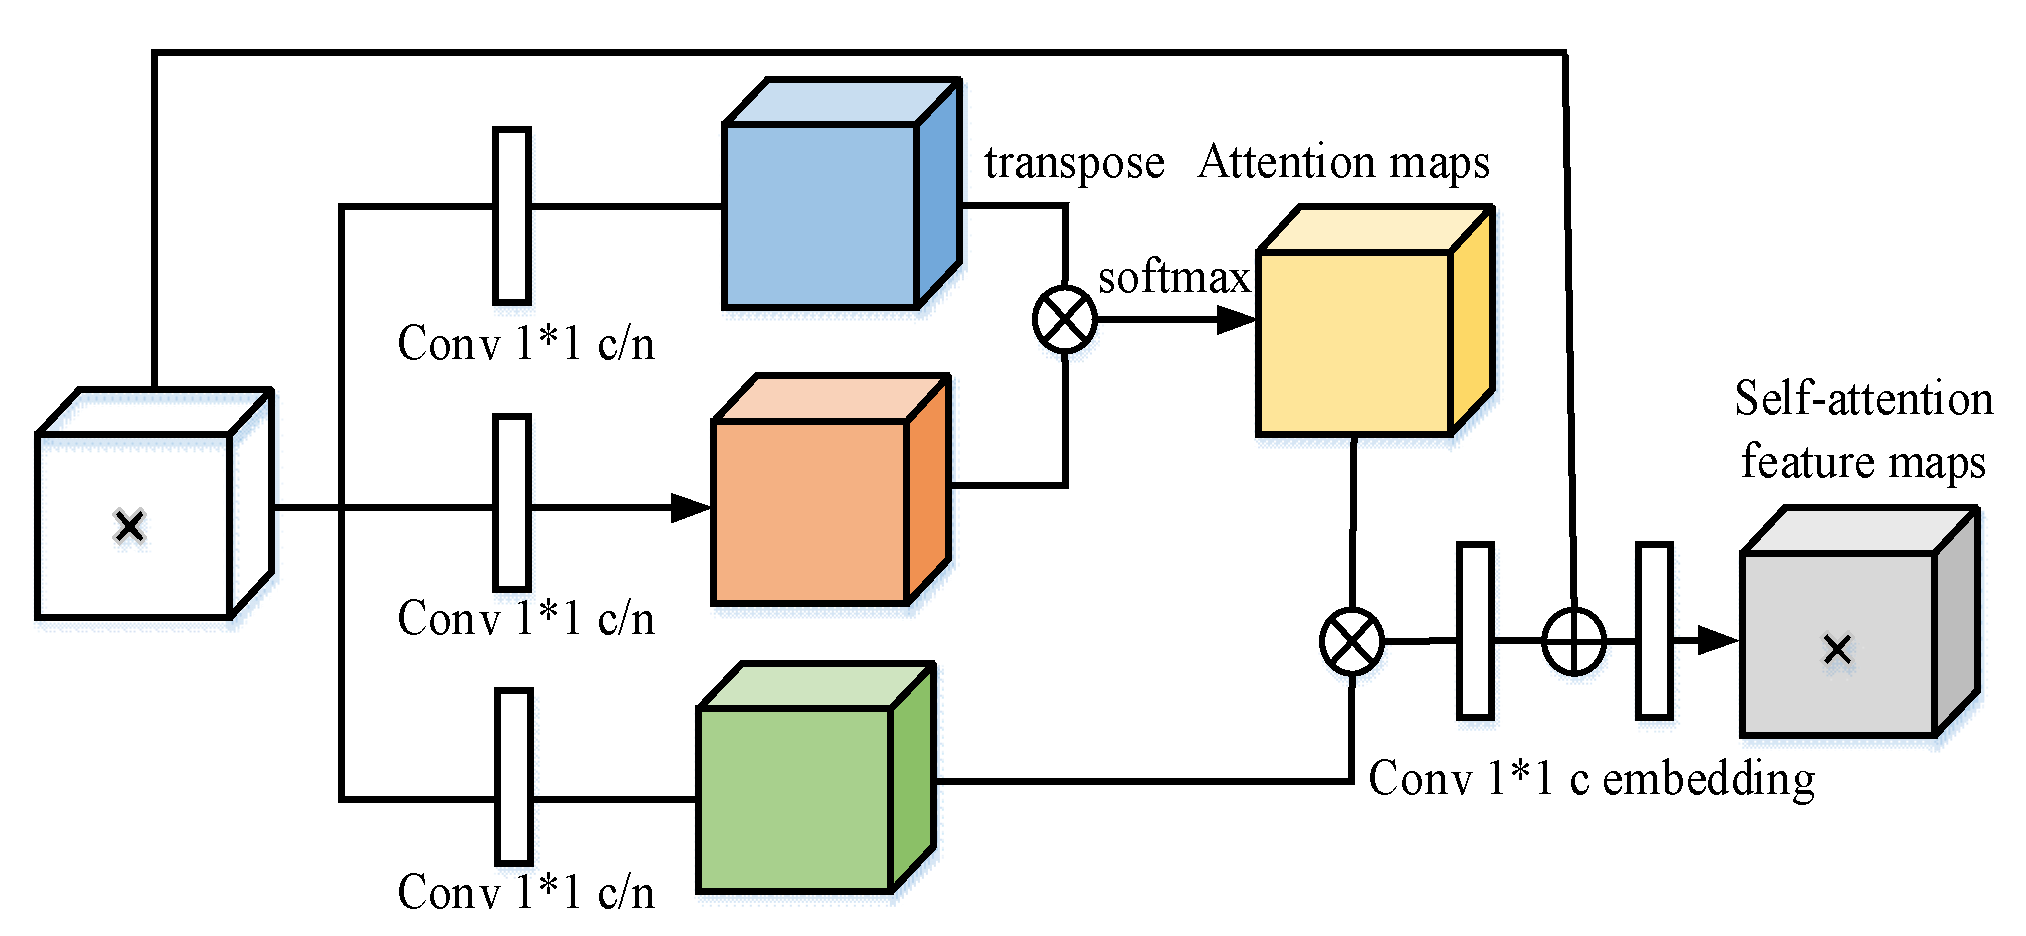
3.4. Self-Attention Module
3.5. Decoders
4. Experiments
4.1. Experiment Settings
4.2. Evaluation Criteria
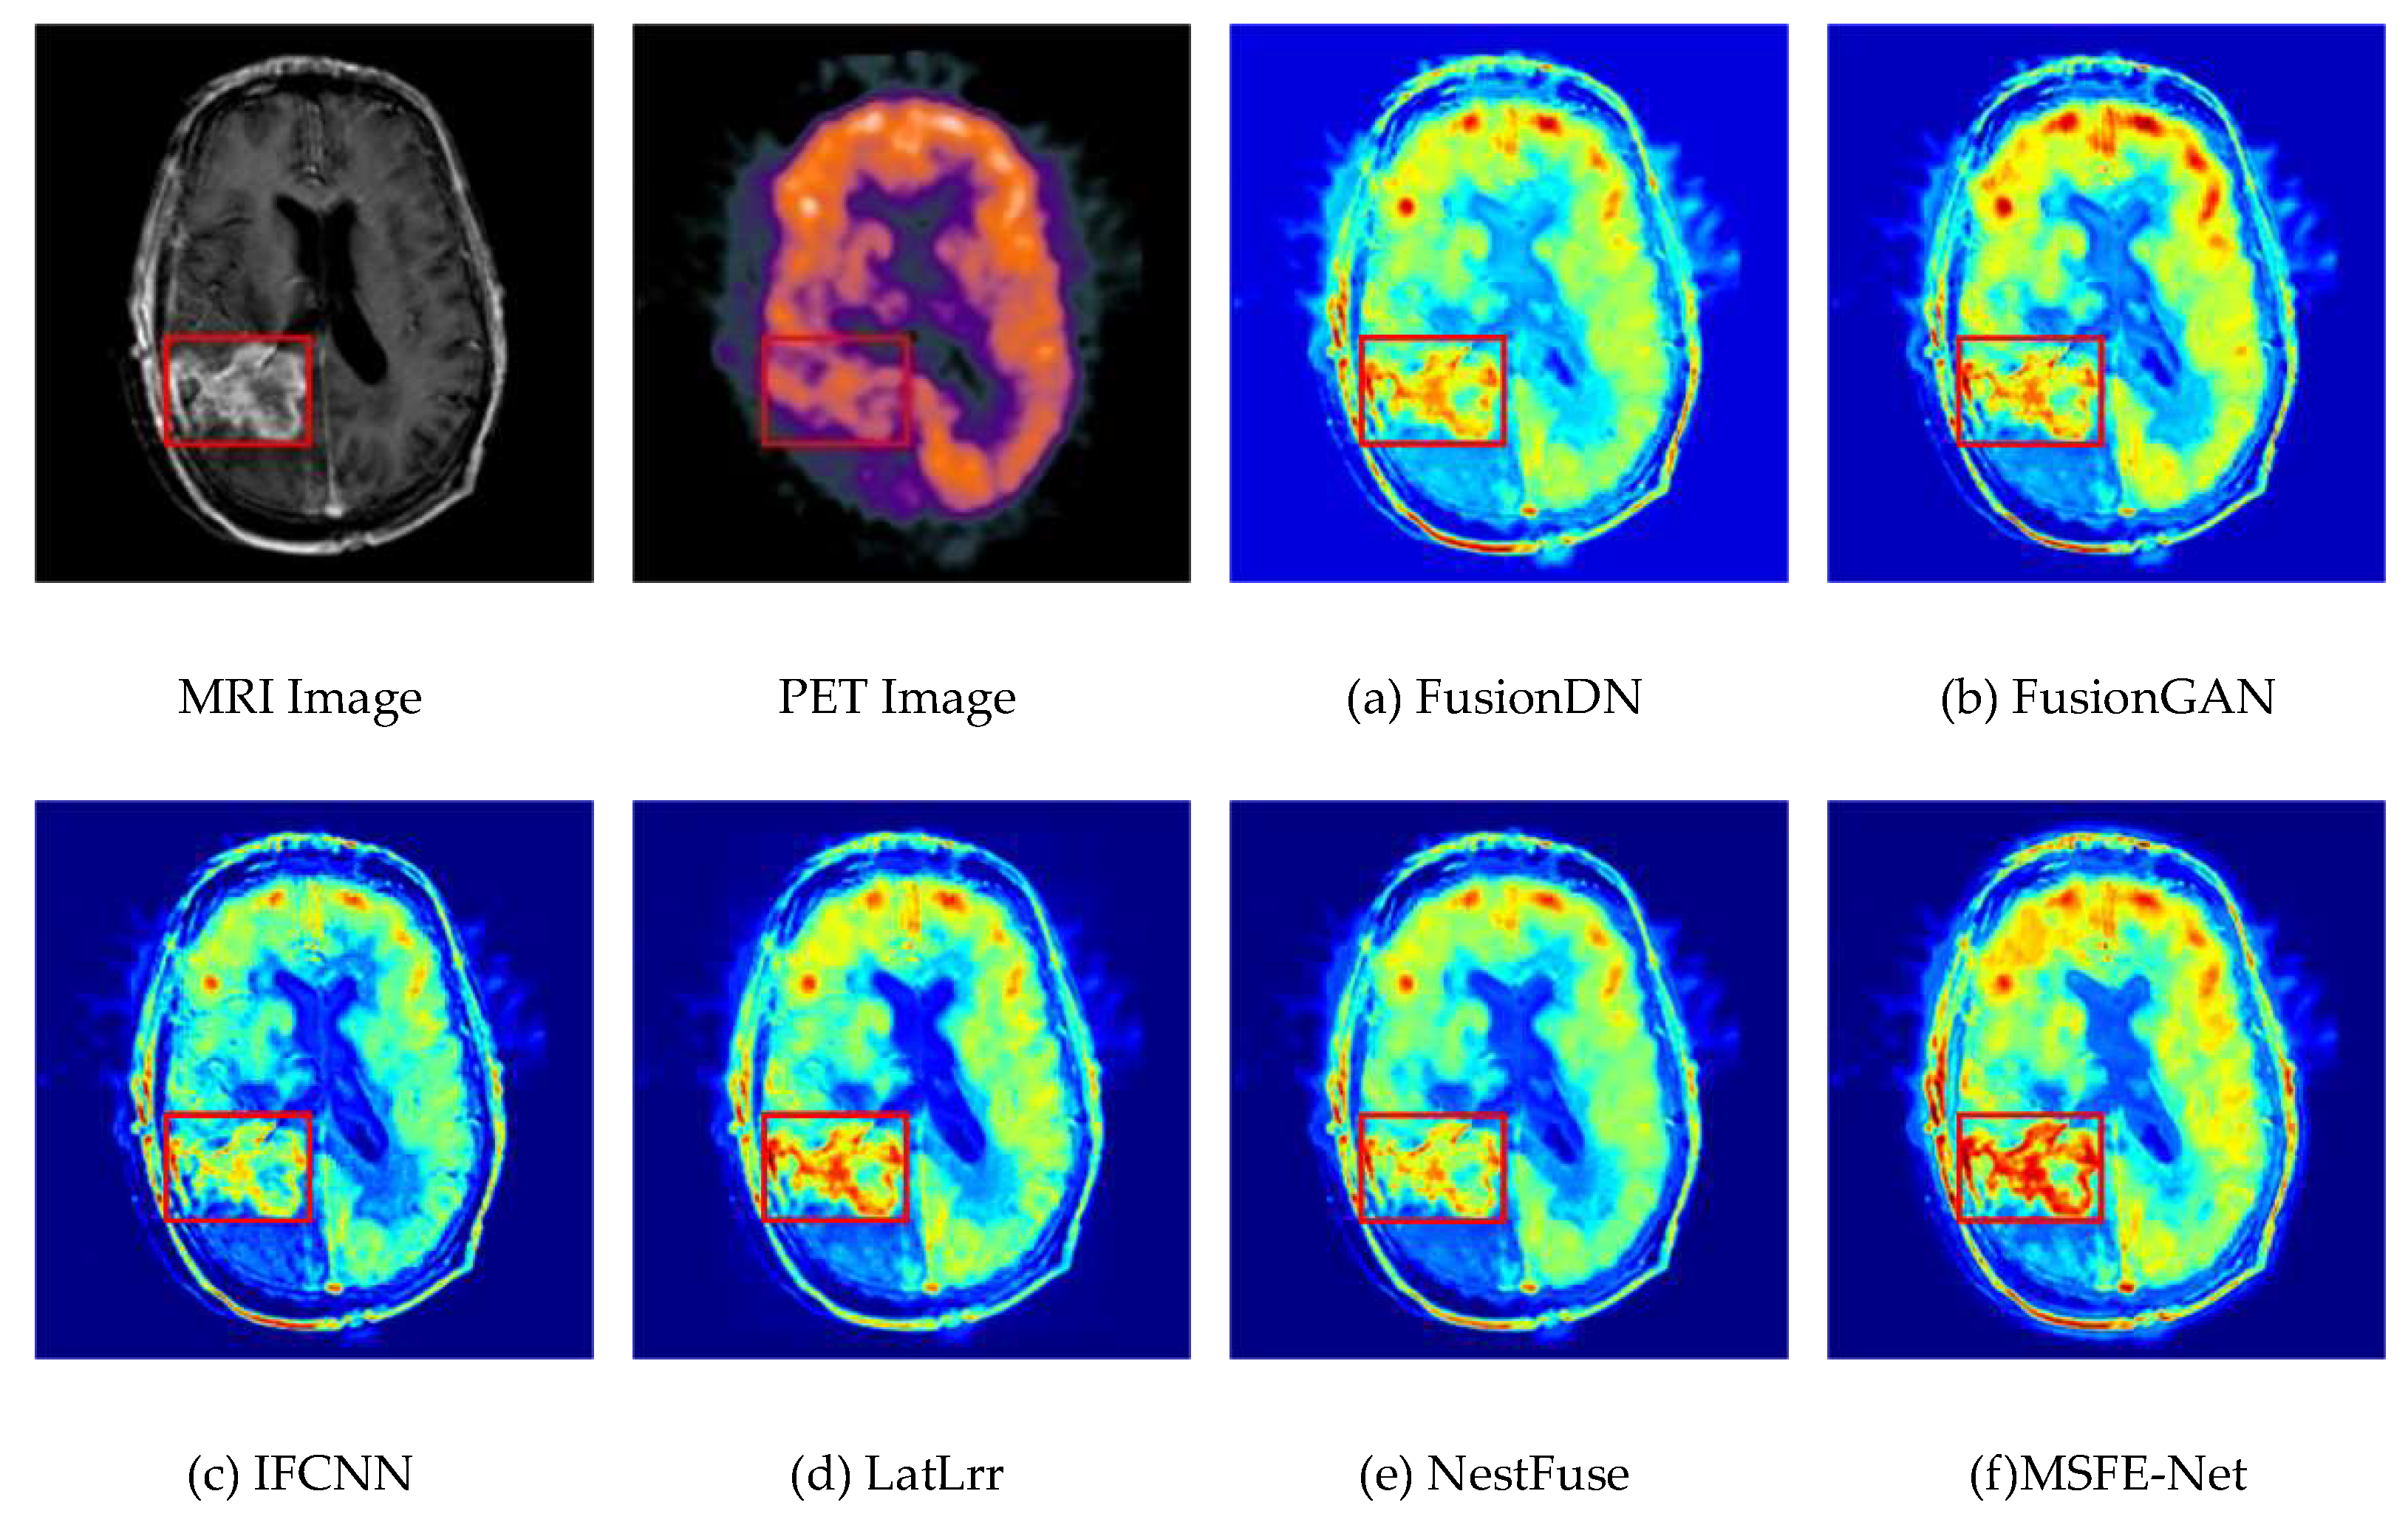
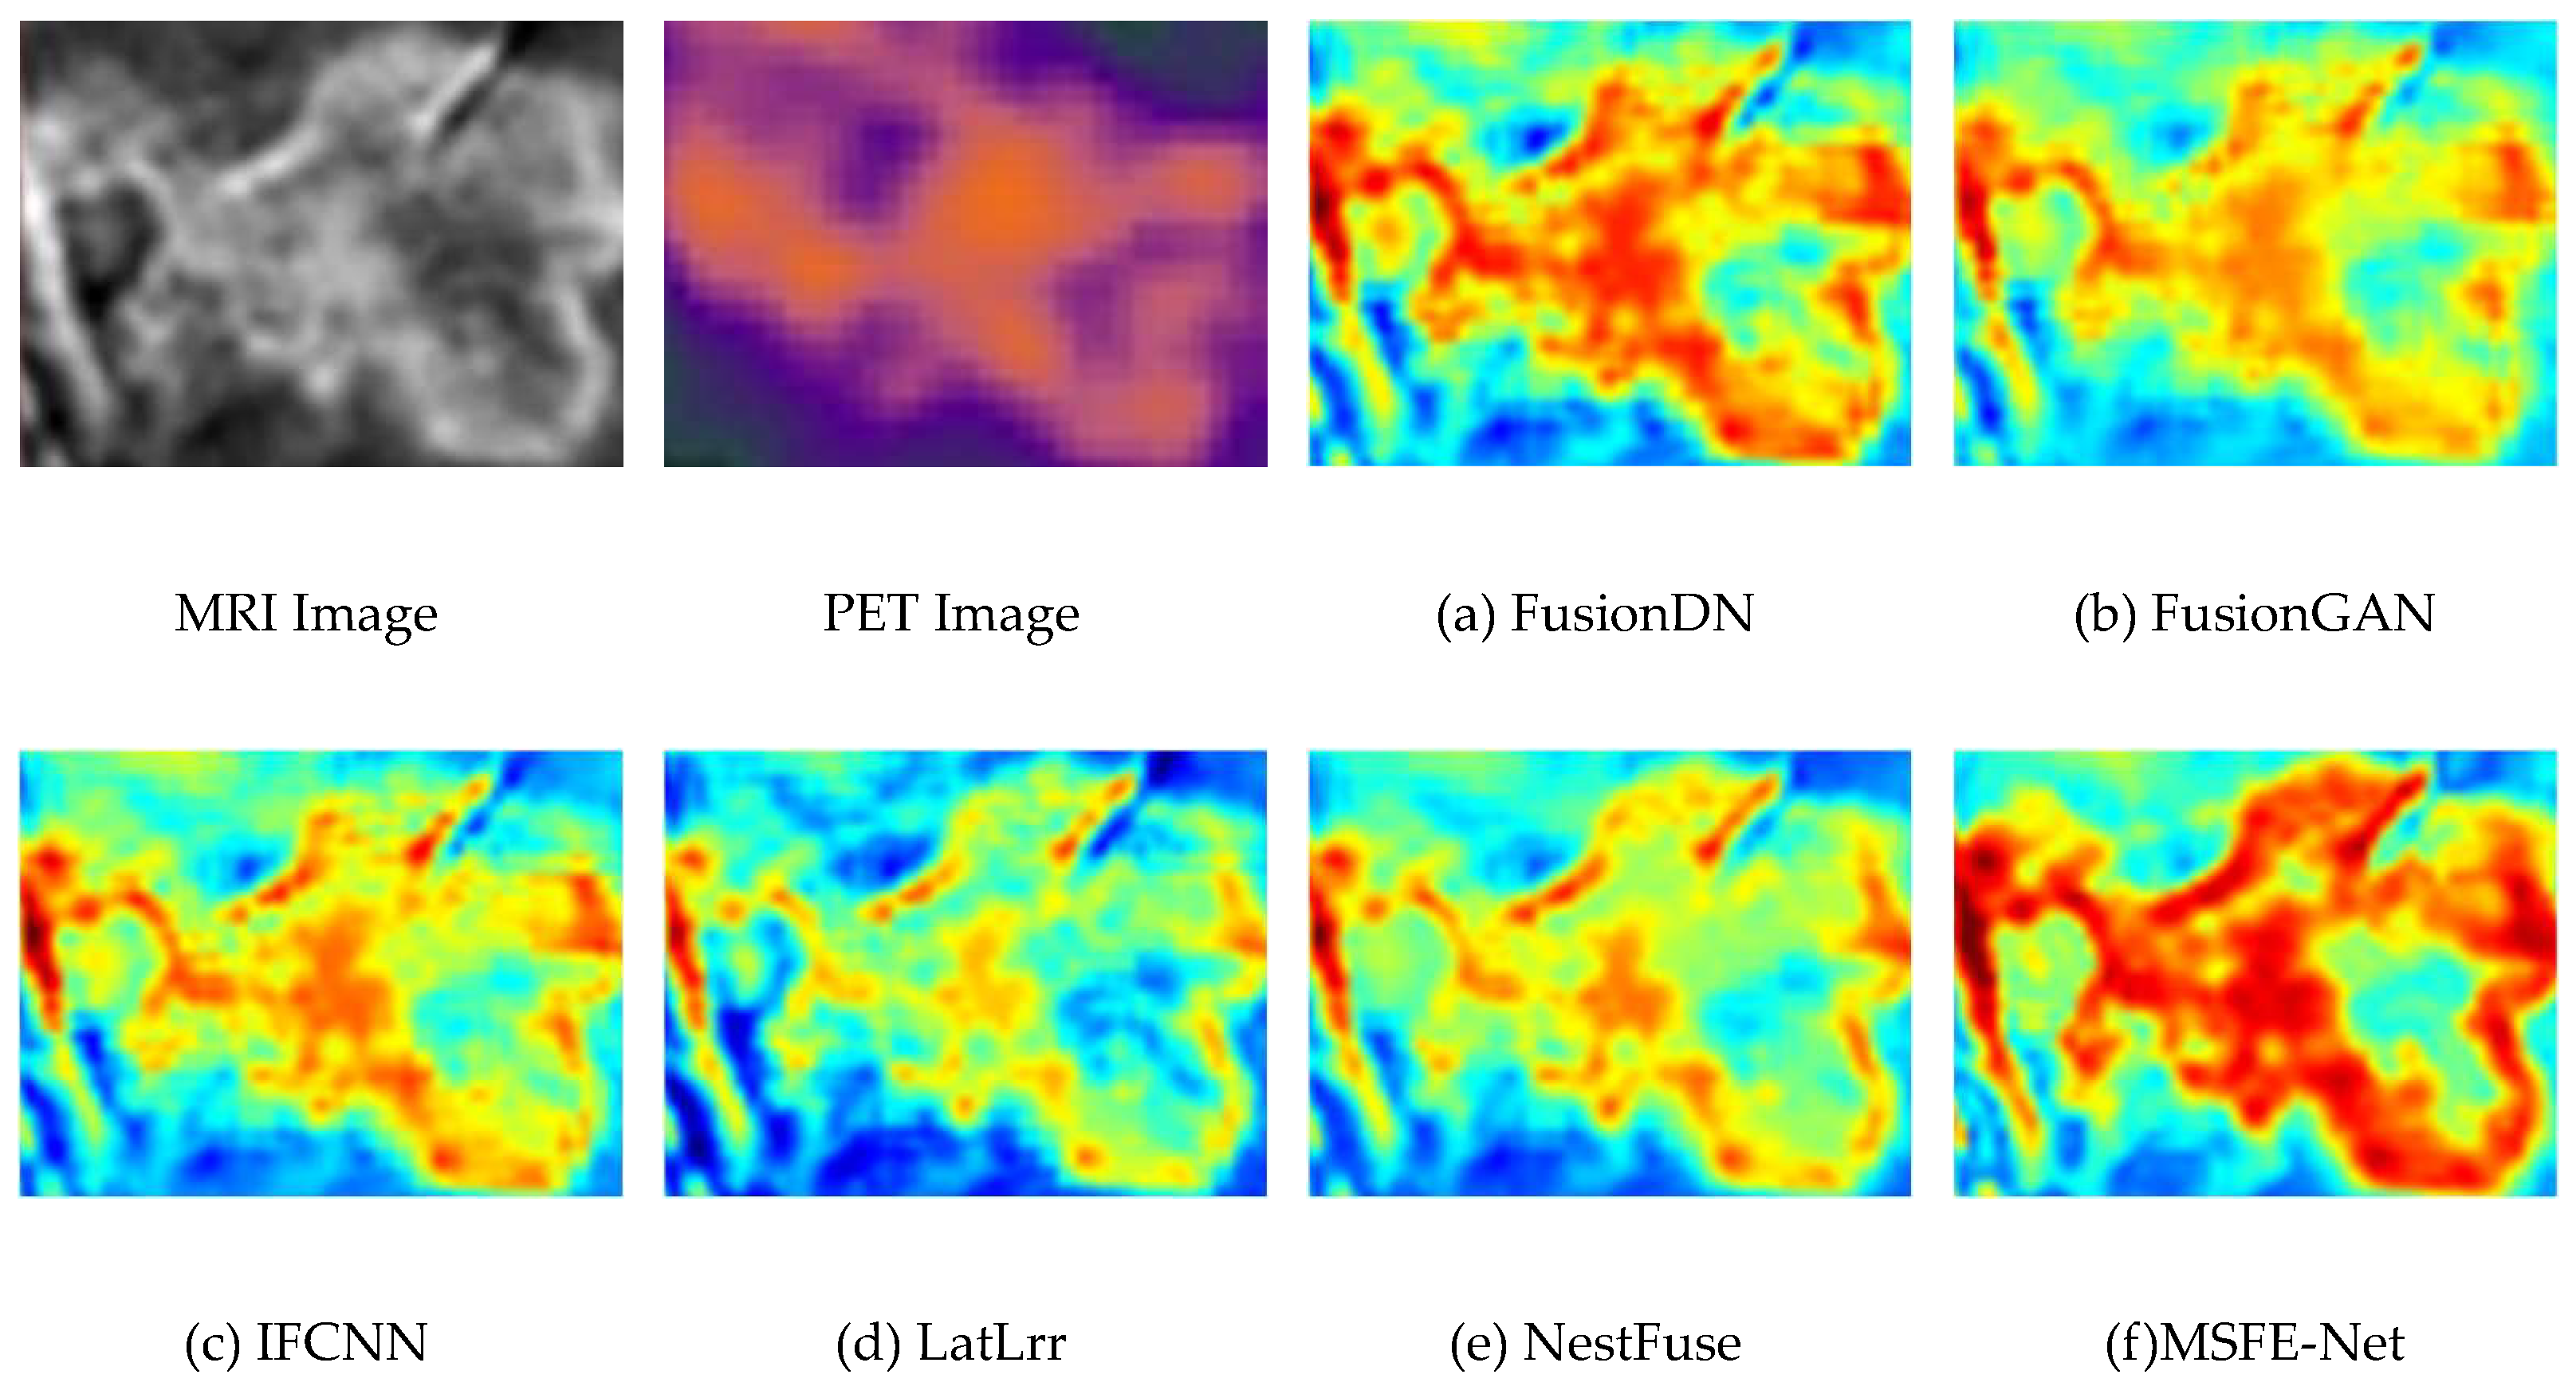
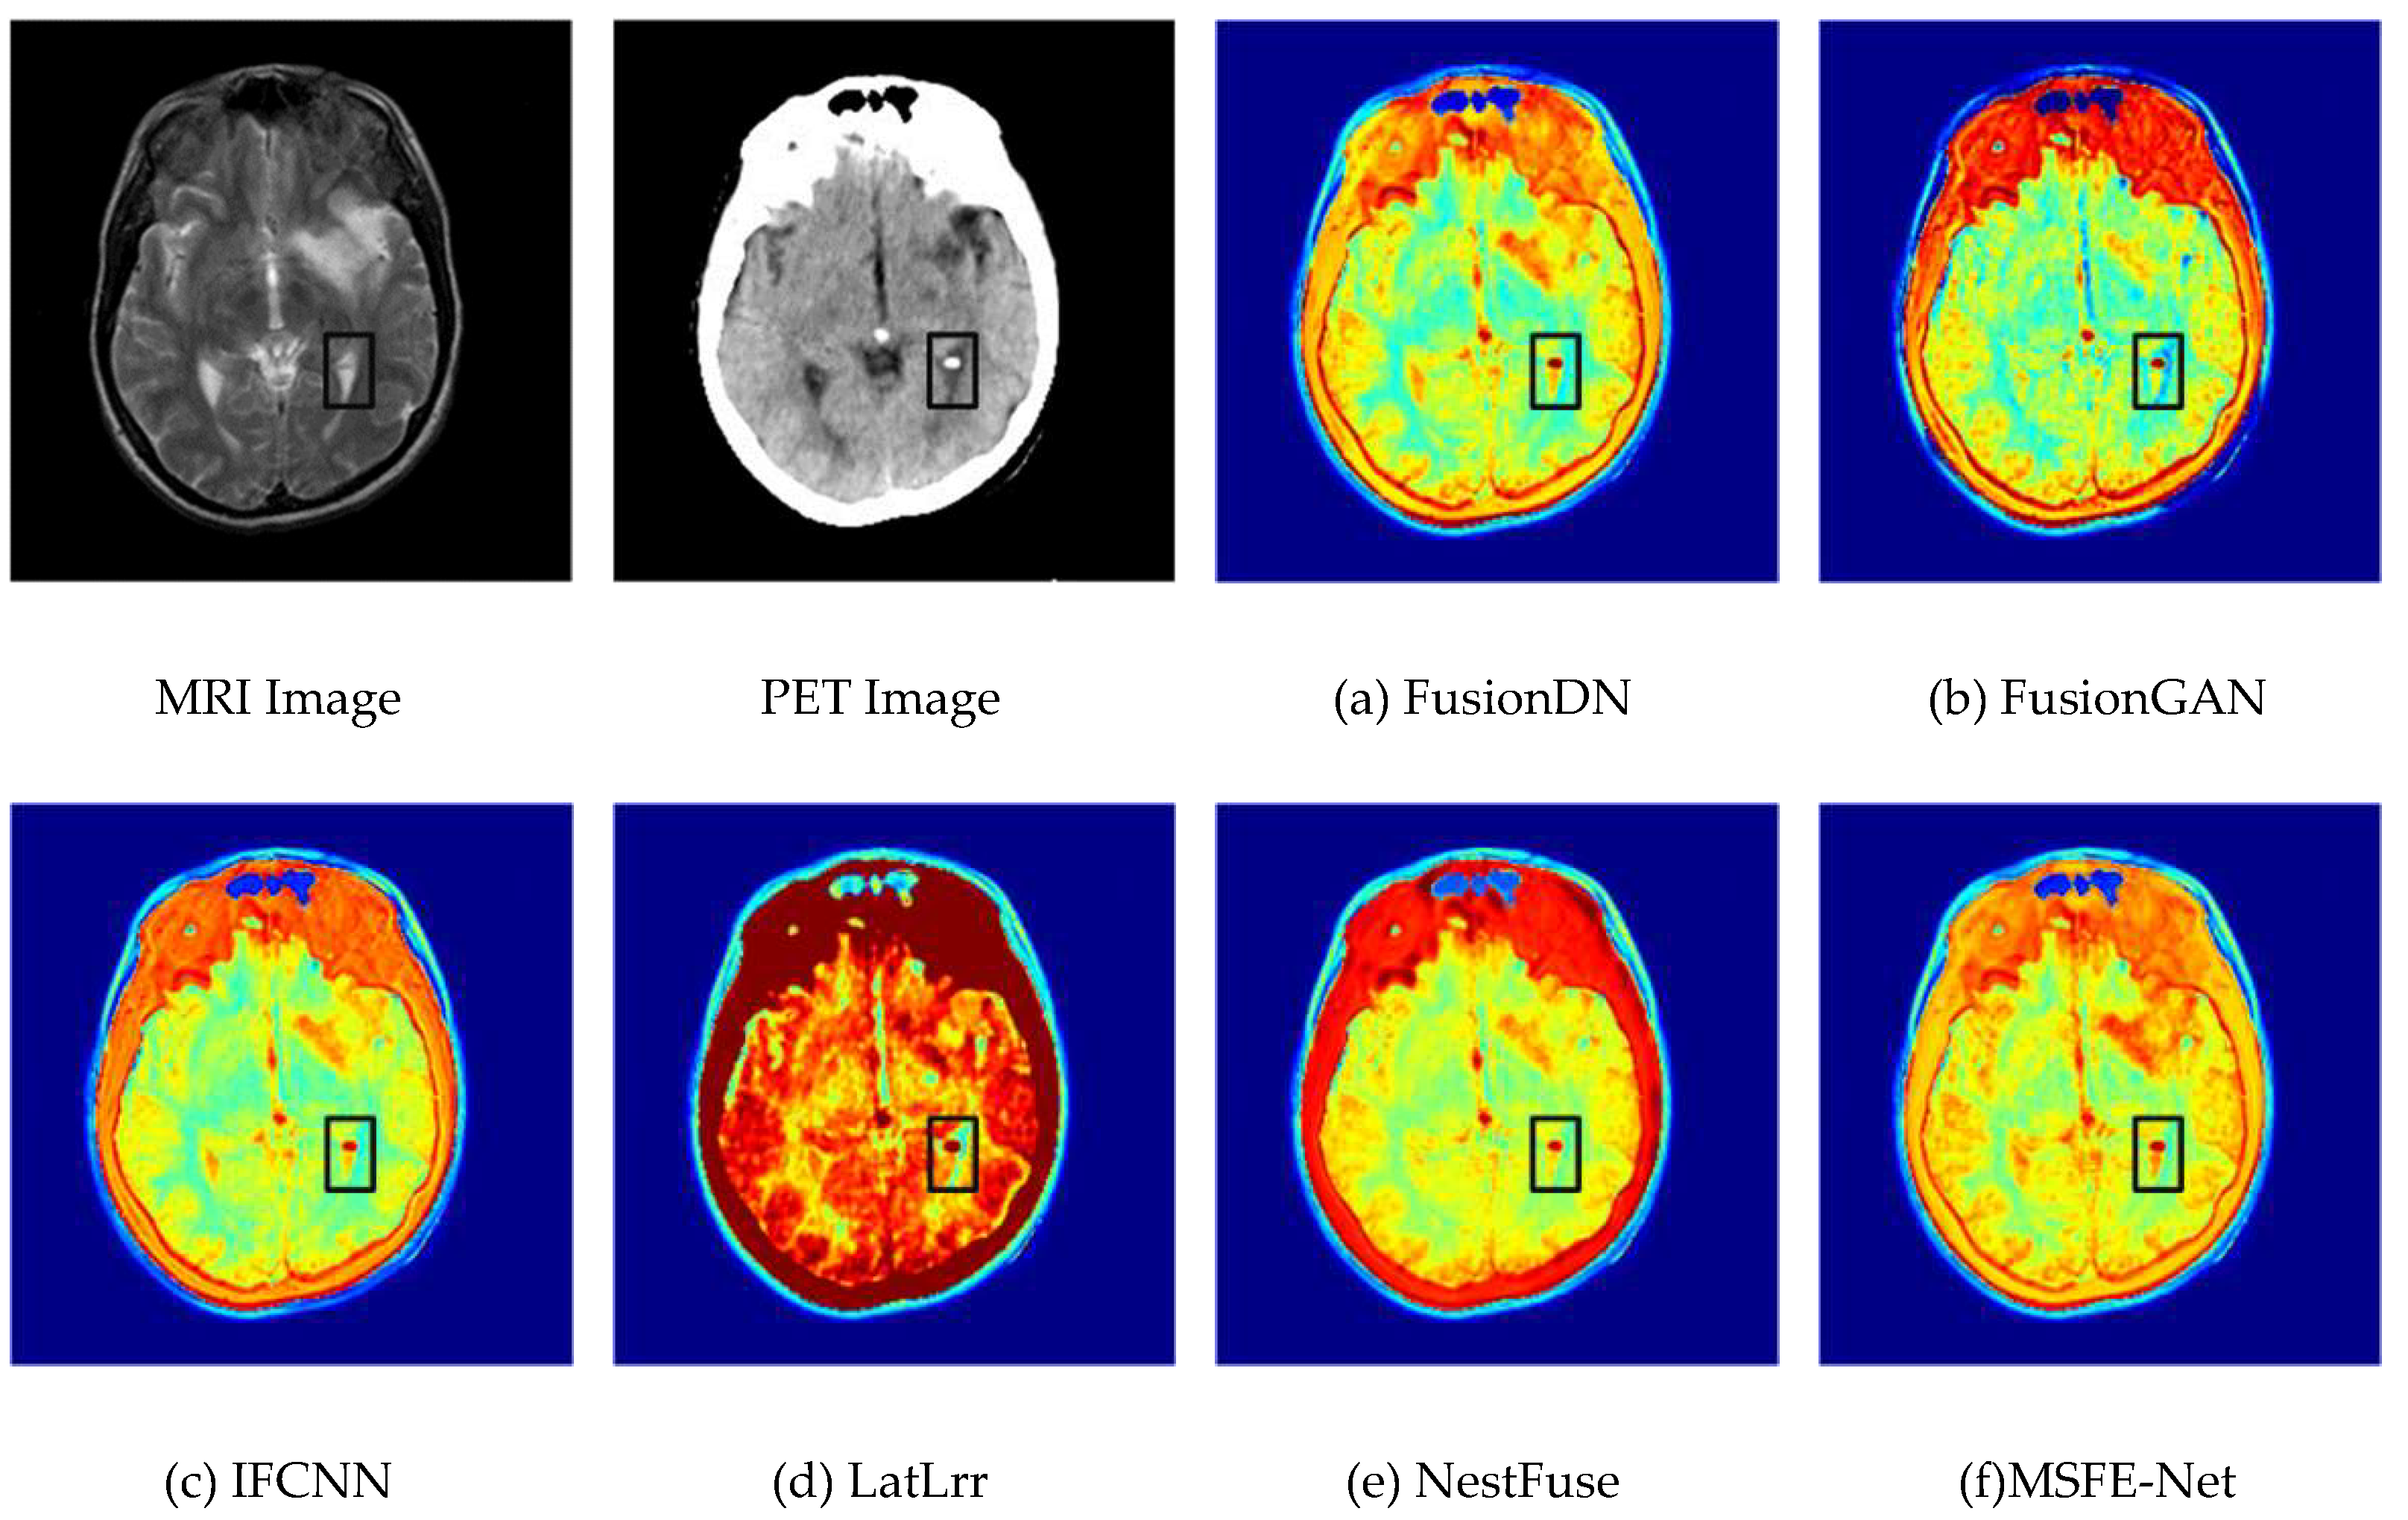
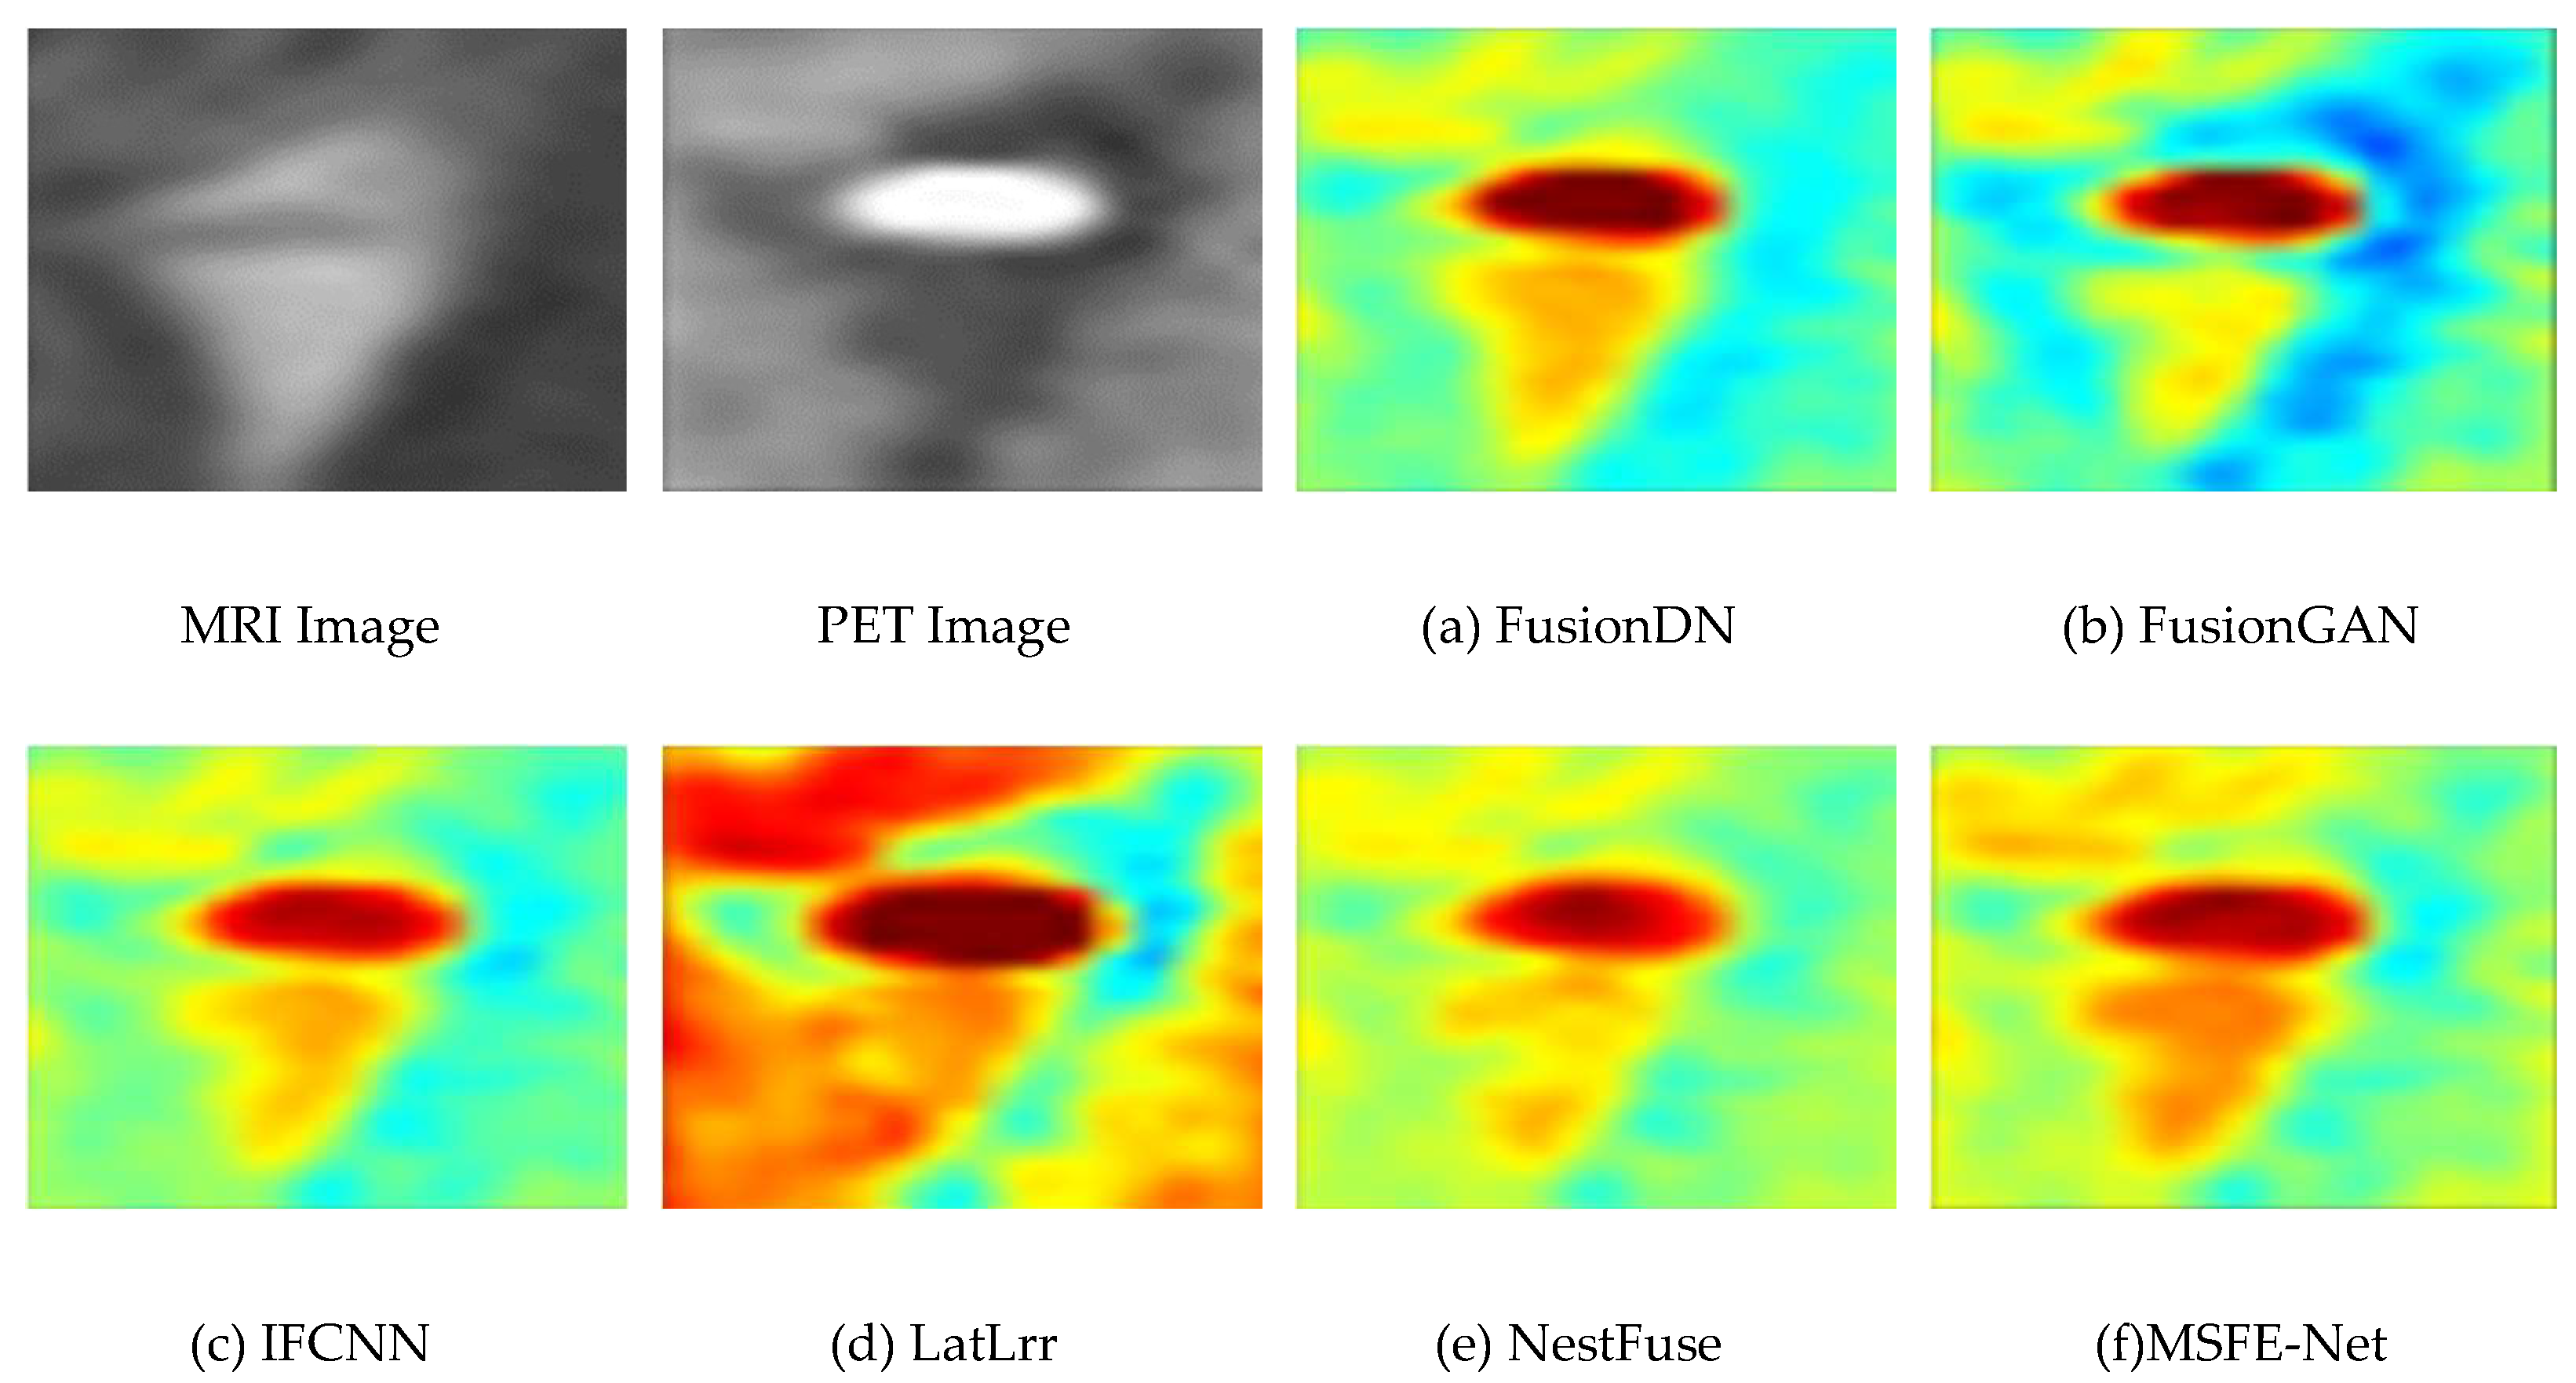
4.3. Experimental Results Between the Proposed Method and Existing Methods
4.4. Comparison of the Proposed Method with Advanced Method Statistics
5. Conclusions
Funding
Conflicts of Interest
References
- Goyal, M. K. Arya, R. Agrawal, et al., “Automated segmentation of gray and white matter regions in brain MRI images for computer aided diagnosis of neurodegenerative diseases,” 2017 International Conference on Multimedia, Signal Processing and Communication Technologies (IMPACT), Aligarh, (2017) 204-208.
- Verclytte, S.; Lopes, R.; Lenfant, P.; Rollin, A.; Semah, F.; Leclerc, X.; Pasquier, F.; Delmaire, C. Cerebral Hypoperfusion and Hypometabolism Detected by Arterial Spin Labeling MRI and FDG-PET in Early-Onset Alzheimer's Disease. J. Neuroimaging 2015, 26, 207–212. [Google Scholar] [CrossRef]
- M. P. Nguyen, H. Kim, S. Y. Chun, et al., “Joint spectral image reconstruction for Y-90 SPECT with multi-window acquisition,” 2015 IEEE Nuclear Science Symposium and Medical Imaging Conference (NSS/MIC), San Diego, CA, (2015) 1-4.
- Li, H.; Wang, Y.; Yang, Z.; Wang, R.; Li, X.; Tao, D. Discriminative Dictionary Learning-Based Multiple Component Decomposition for Detail-Preserving Noisy Image Fusion. IEEE Trans. Instrum. Meas. 2019, 69, 1082–1102. [Google Scholar] [CrossRef]
- Du, J.; Fang, M.; Yu, Y.; Lu, G. An adaptive two-scale biomedical image fusion method with statistical comparisons. Comput. Methods Programs Biomed. 2020, 196, 105603. [Google Scholar] [CrossRef]
- Li, H.; Wu, X.-J. DenseFuse: A Fusion Approach to Infrared and Visible Images. IEEE Trans. Image Process. 2018, 28, 2614–2623. [Google Scholar] [CrossRef]
- Y. Li, J.Chen, P. Xue, et al., “Computer-aided Cervical Cancer Diagnosis using Time-lapsed Colposcopic Images,” IEEE Transactions on Medical Imaging, vol. 39, no. 11, pp. 3403–3415, 2020.
- Ganasala, P.; Kumar, V. Feature-Motivated Simplified Adaptive PCNN-Based Medical Image Fusion Algorithm in NSST Domain. J. Digit. Imaging 2015, 29, 73–85. [Google Scholar] [CrossRef]
- Huang, C.; Tian, G.; Lan, Y.; Peng, Y.; Ng, E.Y.K.; Hao, Y.; Cheng, Y.; Che, W. A New Pulse Coupled Neural Network (PCNN) for Brain Medical Image Fusion Empowered by Shuffled Frog Leaping Algorithm. Front. Neurosci. 2019, 13, 210. [Google Scholar] [CrossRef] [PubMed]
- Daneshvar, S.; Ghassemian, H. MRI and PET image fusion by combining IHS and retina-inspired models. Inf. Fusion 2009, 11, 114–123. [Google Scholar] [CrossRef]
- Chen, C.-I. Fusion of PET and MR Brain Images Based on IHS and Log-Gabor Transforms. IEEE Sensors J. 2017, 17, 6995–7010. [Google Scholar] [CrossRef]
- R. Gillespie, A. B. Kahle, and R. E.Walker, Color enhancement of highly correlated images. II. Channel ratio and “chromaticity” transformation techniques. Remote Sensing of Environment 1987, 22(3), 343–365. [CrossRef]
- Nandi, D.; Ashour, A.S.; Samanta, S.; Chakraborty, S.; Salem, M.A.; Dey, N. Principal component analysis in medical image processing: a study. Int. J. Image Min. 2015, 1, 65. [Google Scholar] [CrossRef]
- Krishn, V. Bhateja, Himanshi, et al., Medical image fusion using combination of PCA and wavelet analysis. Proceedings of the 2014 International Conference on Advances in Computing, Communications and In-formatics (ICACCI), IEEE, 2020: 986-991.
- Himanshi, V. Bhateja, A. Krishn, et al., An improved medical image fusion approach using PCA and complex wavelets. Proceedings of the 2014 International Conference on Medical Imaging, m-Health and Emerging Communication Systems (MedCom), IEEE, 2019: 442-447.
- S. P. Yadav, S.Yadav, Image fusion using hybrid methods in multimodality medical images. Medical & Biological Engineering & Computing, 2020, 58(4): 669-687.
- He, C.; Liu, Q.; Li, H.; Wang, H. Multimodal medical image fusion based on IHS and PCA. Procedia Eng. 2010, 7, 280–285. [Google Scholar] [CrossRef]
- V. D. Calhoun, T. Adali, Feature-based fusion of medical imaging data. IEEE Transactions on Information Technology in Biomedicine, 2008, 13(5): 711-720.
- Z. Cui, G. Zhang, and J.Wu, Medical image fusion based on wavelet transform and independent component analysis. Proceedings of the 2009 International Joint Conference on Artificial Intelligence (IJCAI). IEEE, 2009: 480-483.
- C. Tomasi, R. Manduchi, Bilateral filtering for gray and color images Proceedings of the sixth International Conference on Computer Vision (IEEE Cat. No.98CH36271), IEEE, 1998:839-846.
- Kumar, B.K.S. Image fusion based on pixel significance using cross bilateral filter. Signal, Image Video Process. 2013, 9, 1193–1204. [Google Scholar] [CrossRef]
- Hu, J.; Li, S. The multiscale directional bilateral filter and its application to multisensor image fusion. Inf. Fusion 2012, 13, 196–206. [Google Scholar] [CrossRef]
- S. Li, X. Kang, and J. Hu, Image fusion with guided filtering. IEEE Transactions on Image Processing 2013, 22(7), 2864–2875. [CrossRef] [PubMed]
- Li, W.; Jia, L.; Du, J. Multi-Modal Sensor Medical Image Fusion Based on Multiple Salient Features With Guided Image Filter. IEEE Access 2019, 7, 173019–173033. [Google Scholar] [CrossRef]
- Jian, L.; Yang, X.; Zhou, Z.; Zhou, K.; Liu, K. Multi-scale image fusion through rolling guidance filter. Futur. Gener. Comput. Syst. 2018, 83, 310–325. [Google Scholar] [CrossRef]
- Zhao, W.; Lu, H. Medical Image Fusion and Denoising with Alternating Sequential Filter and Adaptive Fractional Order Total Variation. IEEE Trans. Instrum. Meas. 2017, 66, 2283–2294. [Google Scholar] [CrossRef]
- B. Biswas, A. Chakrabarti, and K. N. Dey, Spine medical image fusion using wiener filter in shearlet domain. Proceedings of the 2nd International Conference on Recent Trends in Information Systems (ReTIS). IEEE, 2015: 387-392.
- Liu, X.; Mei, W.; Du, H. Multimodality medical image fusion algorithm based on gradient minimization smoothing filter and pulse coupled neural network. Biomed. Signal Process. Control. 2016, 30, 140–148. [Google Scholar] [CrossRef]
- Jiang, W.; Yang, X.; Wu, W.; Liu, K.; Ahmad, A.; Sangaiah, A.K.; Jeon, G. Medical images fusion by using weighted least squares filter and sparse representation. Comput. Electr. Eng. 2018, 67, 252–266. [Google Scholar] [CrossRef]
- Yin, H. Tensor Sparse Representation for 3-D Medical Image Fusion Using Weighted Average Rule. IEEE Trans. Biomed. Eng. 2018, 65, 2622–2633. [Google Scholar] [CrossRef]
- Zong, J.-J.; Qiu, T.-S. Medical image fusion based on sparse representation of classified image patches. Biomed. Signal Process. Control. 2017, 34, 195–205. [Google Scholar] [CrossRef]
- X. Wen, Image fusion based on improved IHS transform with weighted average. Proceedings of the 2011 International Conference on Computational and Information Sciences, IEEE, 2011: 111-113.
- G. Pajares, J. M. G. Pajares, J. M. De La Cruz, A wavelet-based image fusion tutorial. Pattern recognition 2004, 37(9), 1855–1872. [Google Scholar] [CrossRef]
- Wang, H. Sun, and Y. Guan, The application of wavelet transform to multi-modality medical image fusion. Proceedings of the 2006 IEEE International Conference on Networking, Sensing and Control. IEEE, 2006: 270-274.
- S. Cheng, J. He, and Z. Lv, Medical image of PET/CT weighted fusion based on wavelet transform. Proceedings of the 2nd International Conference on Bioinformatics and Biomedical Engineering. IEEE, 2008: 2523-2525.
- Yang, Y.; Park, D.S.; Huang, S.; Rao, N. Medical Image Fusion via an Effective Wavelet-Based Approach. EURASIP J. Adv. Signal Process. 2010, 2010, 579341. [Google Scholar] [CrossRef]
- Vijayarajan, R.; Muttan, S. Discrete wavelet transform based principal component averaging fusion for medical images. AEU - Int. J. Electron. Commun. 2015, 69, 896–902. [Google Scholar] [CrossRef]
- V. Bhavana, H. Krishnappa, Multi-modality medical image fusion using discrete wavelet transform. Procedia Computer Science 2015, 70, 625–631. [CrossRef]
- Zhang, Y.; Liu, Y.; Sun, P.; Yan, H.; Zhao, X.; Zhang, L. IFCNN: A general image fusion framework based on convolutional neural network. Inf. Fusion 2019, 54, 99–118. [Google Scholar] [CrossRef]
- Tajbakhsh, N.; Shin, J.Y.; Gurudu, S.R.; Hurst, R.T.; Kendall, C.B.; Gotway, M.B.; Liang, J. Convolutional Neural Networks for Medical Image Analysis: Full Training or Fine Tuning? IEEE Trans. Med. Imaging 2016, 35, 1299–1312. [Google Scholar] [CrossRef] [PubMed]
- Singh, S.; Anand, R.S. Multimodal Medical Image Fusion Using Hybrid Layer Decomposition With CNN-Based Feature Mapping and Structural Clustering. IEEE Trans. Instrum. Meas. 2019, 69, 3855–3865. [Google Scholar] [CrossRef]
- Wang, Z.; Li, X.; Duan, H.; Su, Y.; Zhang, X.; Guan, X. Medical image fusion based on convolutional neural networks and non-subsampled contourlet transform. Expert Syst. Appl. 2021, 171. [Google Scholar] [CrossRef]
- Wang, L.; Chang, C.; Liu, Z.; Huang, J.; Liu, C.; Liu, C. A Medical Image Fusion Method Based on SIFT and Deep Convolutional Neural Network in the SIST Domain. J. Heal. Eng. 2021, 2021, 1–8. [Google Scholar] [CrossRef] [PubMed]
- Fu, J.; Li, W.; Du, J.; Huang, Y. A multiscale residual pyramid attention network for medical image fusion. Biomed. Signal Process. Control. 2021, 66. [Google Scholar] [CrossRef]
- L. Wang, C. Chang, B. Hao, et al., Multi-modal medical image fusion based on GAN and the shift-invariant shearlet transform. Proceedings of the 2020 IEEE International Conference on Bioinformatics and Biomedicine (BIBM), IEEE, 2020: 2538-2543.
- H. M. El-Hoseny, E. S. M. El Rabaie, W. Abd Elrahman, et al., Medical image fusion techniques based on combined discrete transform domains. Proceedings of the 2017 34th National Radio Science Conference (NRSC), IEEE, 2017: 471-480.
- Wang, Z.; Cui, Z.; Zhu, Y. Multi-modal medical image fusion by Laplacian pyramid and adaptive sparse representation. Comput. Biol. Med. 2020, 123, 103823. [Google Scholar] [CrossRef] [PubMed]
- Zhang, X.; Yan, H. Medical image fusion and noise suppression with fractional-order total variation and multi-scale decomposition. IET Image Process. 2021, 15, 1688–1701. [Google Scholar] [CrossRef]
- Li, X.; Zhou, F.; Tan, H.; Zhang, W.; Zhao, C. Multimodal medical image fusion based on joint bilateral filter and local gradient energy. Inf. Sci. 2021, 569, 302–325. [Google Scholar] [CrossRef]
- Tan, W.; Thitøn, W.; Xiang, P.; Zhou, H. Multi-modal brain image fusion based on multi-level edge-preserving filtering. Biomed. Signal Process. Control. 2020, 64, 102280. [Google Scholar] [CrossRef]

| Coefficients | EN | SD | MI | rSFe | SM | VIF |
| m | 1 | 0.1 | 1 | 1000 | 1000 | 1000 |
| n | 0 | 0 | -6 | 995 | -2 | 1 |
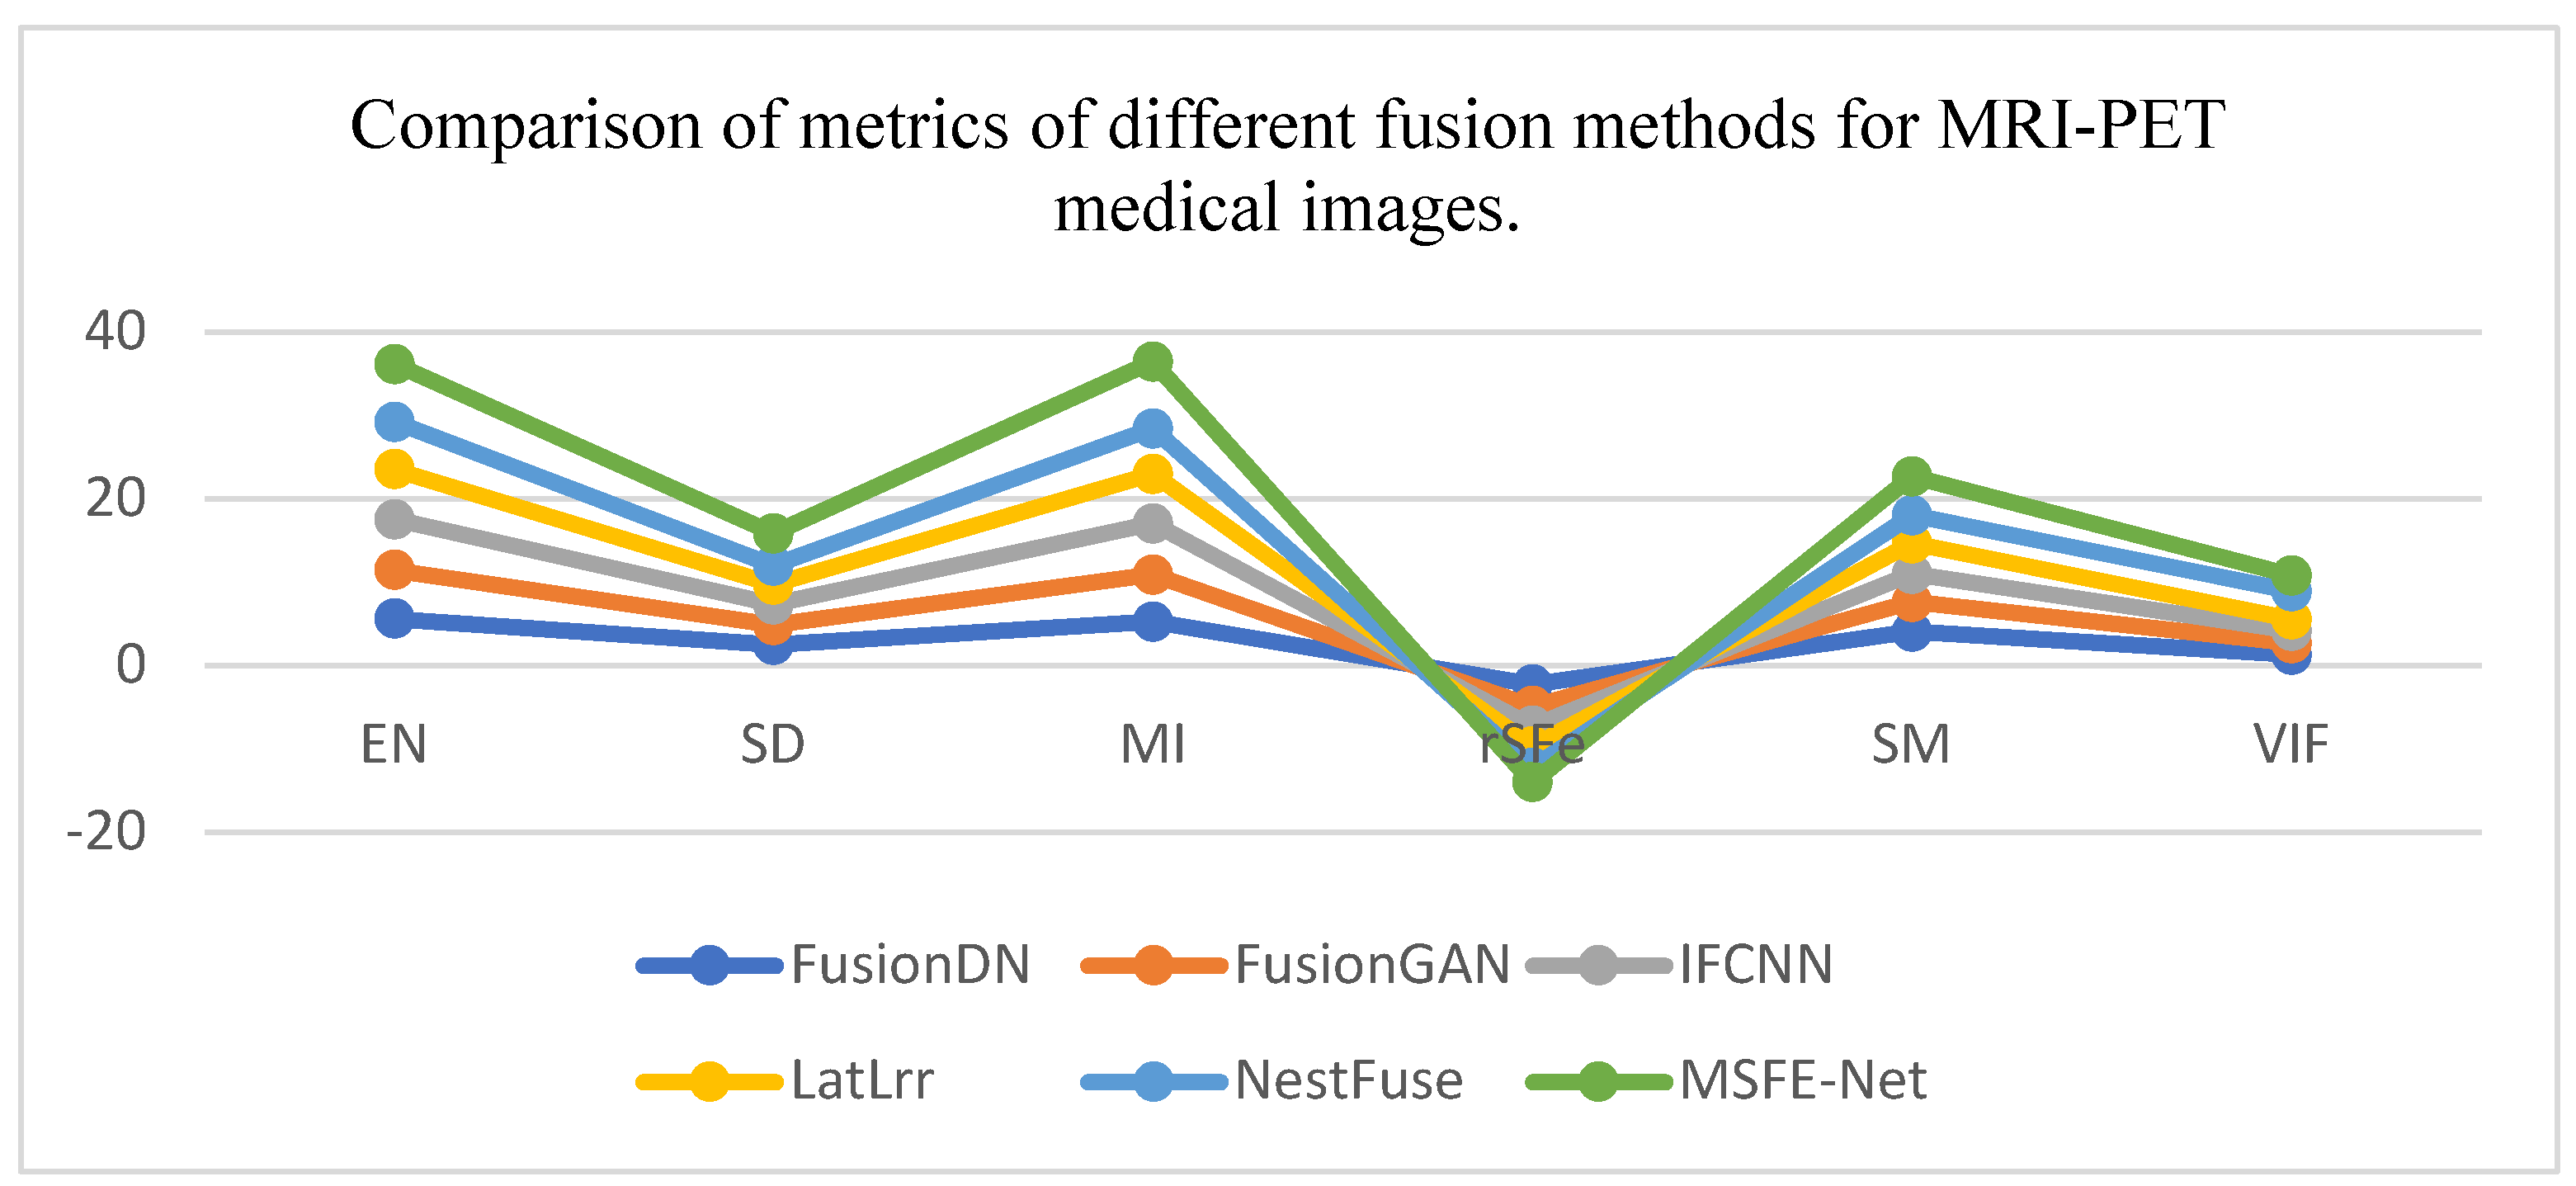
| Indicators | EN | SD | MI | rSFe | SM | VIF | |
| Methods | |||||||
| FusionDN | 5.609 | 2.496 | 5.217 | -2.3 | 4.0 | 1.3 | |
| FusionGAN | 5.847 | 2.297 | 5.694 | -2.6 | 3.6 | 1.3 | |
| IFCNN | 6.063 | 2.487 | 6.127 | -2.4 | 3.4 | 1.5 | |
| LatLrr | 5.976 | 2.446 | 5.951 | -2.4 | 3.6 | 1.4 | |
| NestFuse | 5.716 | 2.245 | 5.431 | -2.6 | 3.4 | 3.4 | |
| MSFE-Net | 6.934 | 5.871 | 8.019 | -1.7 | 4.7 | 3.9 | |
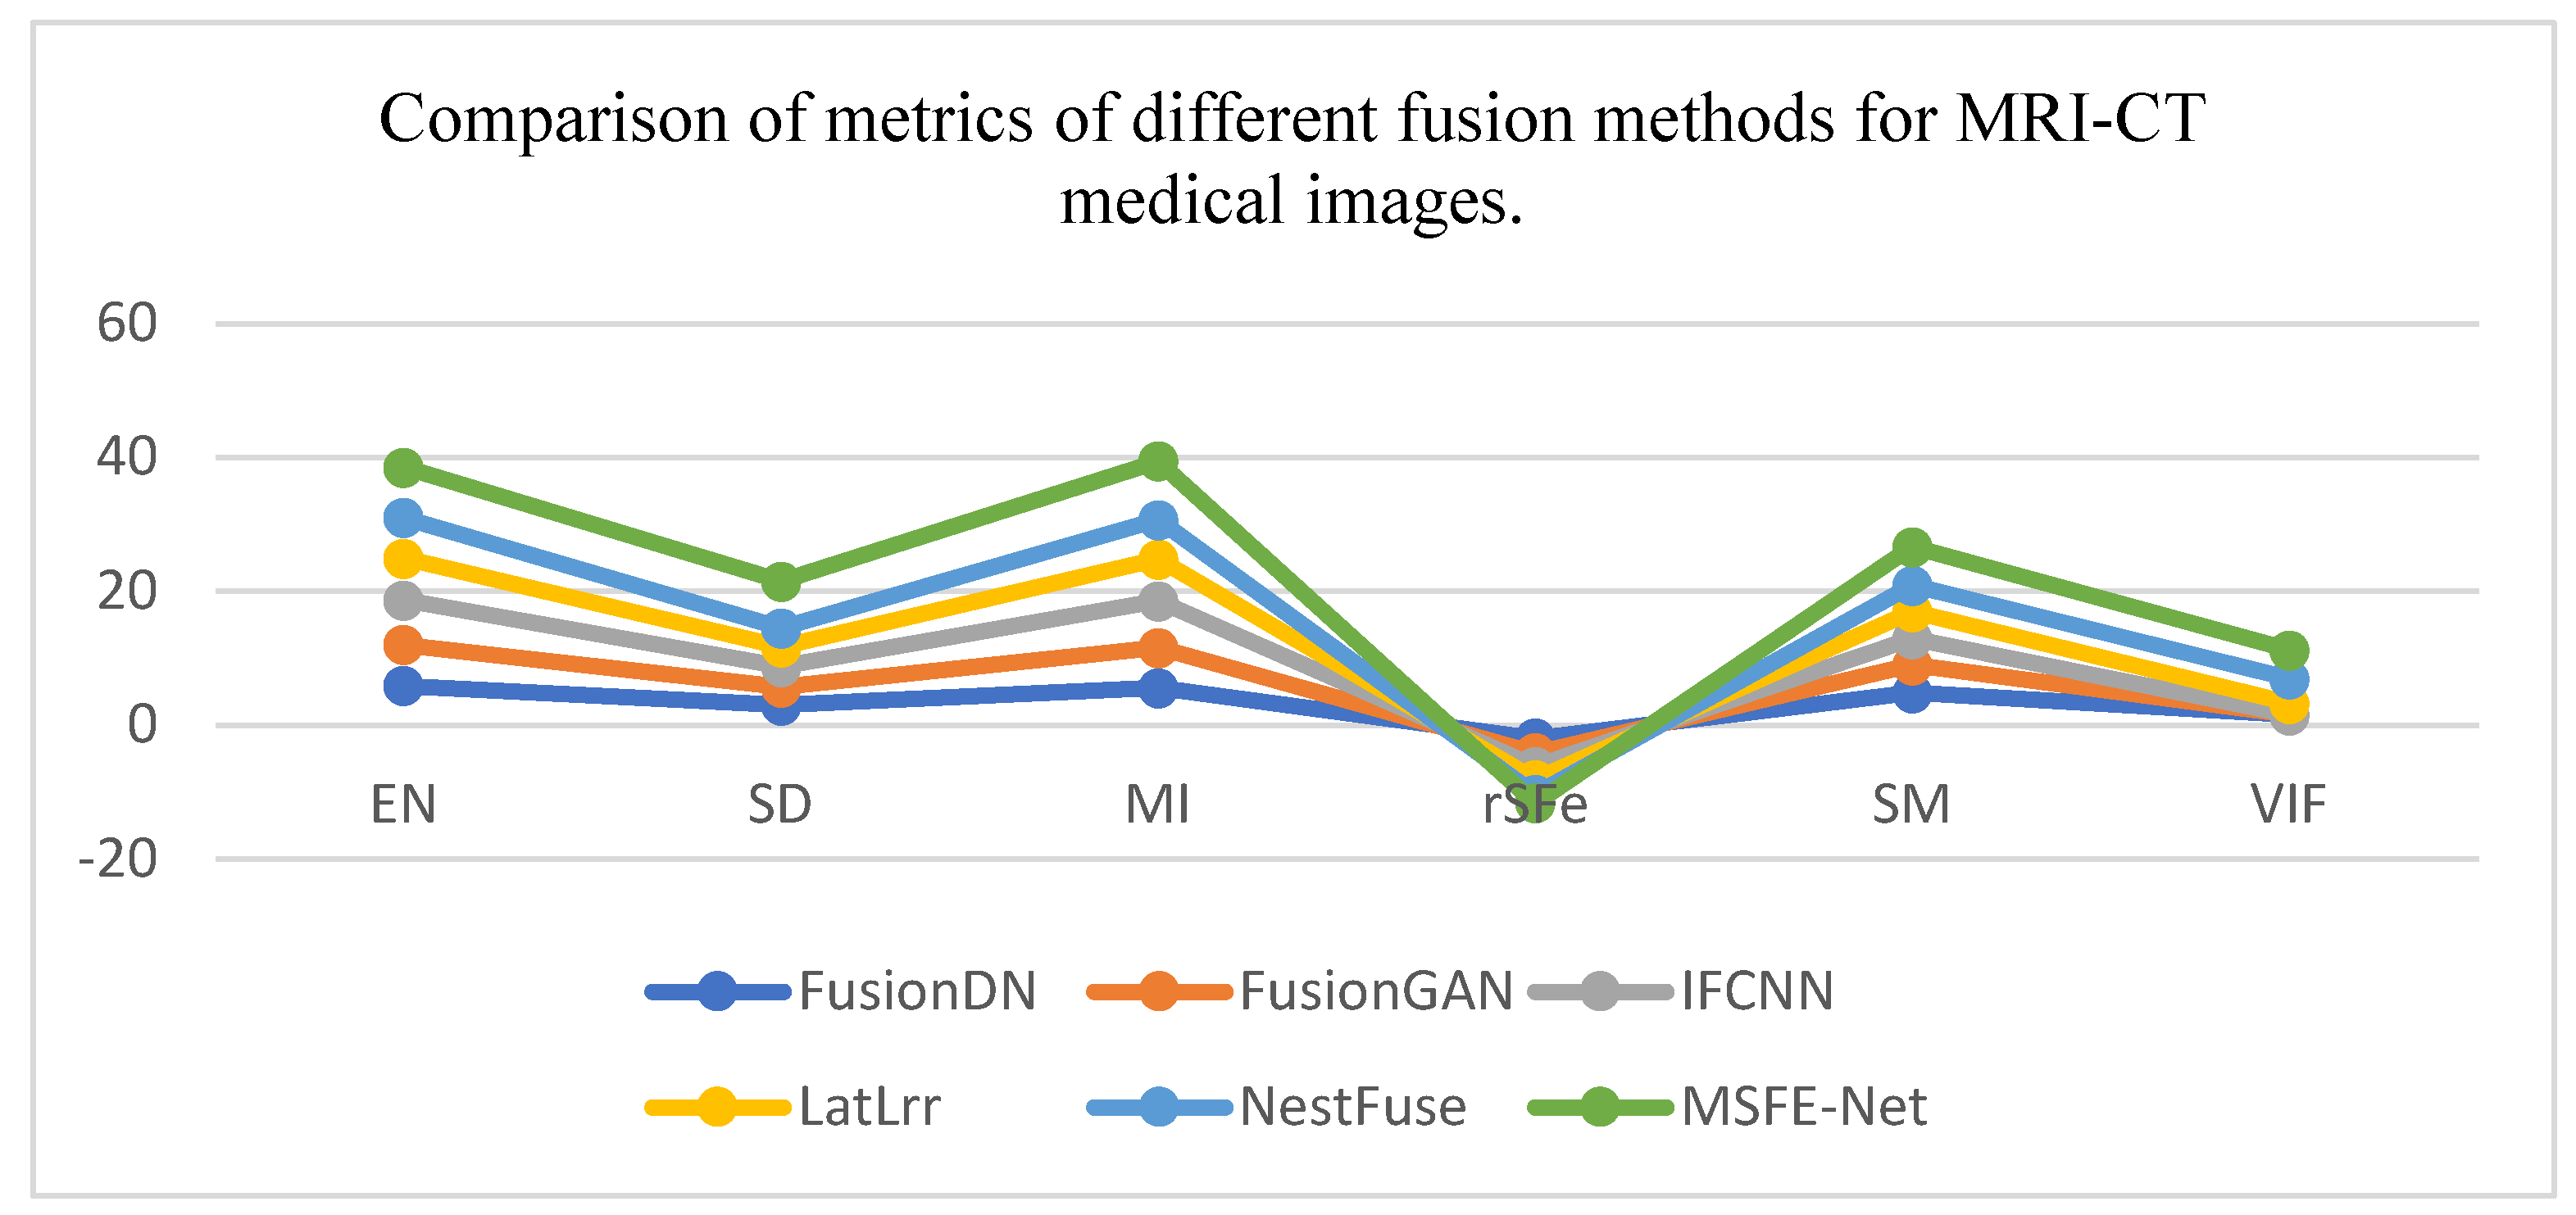
| Indicators | EN | SD | MI | rSFe | SM | VIF | |
| Methods | |||||||
| FusionDN | 5.952 | 2.998 | 5.609 | -1.9 | 4.9 | 1.6 | |
| FusionGAN | 6.128 | 2.789 | 6.018 | -2.2 | 4.1 | 1. 6 | |
| IFCNN | 6.631 | 2.942 | 6.992 | -2.0 | 3.9 | 1. 8 | |
| LatLrr | 6.278 | 2.983 | 6.158 | -2.0 | 4.1 | 1.7 | |
| NestFuse | 6.056 | 2.774 | 5.893 | -2.2 | 3.9 | 3.7 | |
| MSFE-Net | 7.543 | 6.995 | 8.855 | -1.3 | 5.8 | 4.2 | |
Disclaimer/Publisher’s Note: The statements, opinions and data contained in all publications are solely those of the individual author(s) and contributor(s) and not of MDPI and/or the editor(s). MDPI and/or the editor(s) disclaim responsibility for any injury to people or property resulting from any ideas, methods, instructions or products referred to in the content. |
© 2025 by the authors. Licensee MDPI, Basel, Switzerland. This article is an open access article distributed under the terms and conditions of the Creative Commons Attribution (CC BY) license (https://creativecommons.org/licenses/by/4.0/).


