0. Introduction
In China, the extensive development of the underground space has led to a surge in foundation pit engineering. Particularly over the last two decades, foundation pit engineering has achieved a leapfrog development, characterized by increasingly larger plane size, deeper excavation depth, and more complex surrounding environment. In soft soil regions, the design and construction of ultra-large deep foundation pit faces great challenges [
1]. The interaction between soil and retaining structure, the small strain behaviour of soft soil, and the influence of temperature on the construction of ultra-large foundation pit should be investigated.
Burland [
2] found that soil exhibited obvious nonlinear stress-strain relationship. The soil stiffness is very high in the small strain range and decreases significantly with the increasing strain. However, when the soil approaches damage, the soil stiffness becomes small. Benz [
3] proposed the Hardening Soil model with small-strain stiffness (HSS model), which could not only describe the hardening characteristics of soft clay, distinguish the loading and unloading behaviour and reflect the dependence of soil stiffness on the stress history and stress path, but also consider the shear modulus degradation in the small strain range. Ruan et al. [
4] conducted a series of mechanical experiments on the lacustrine sedimentary soft soil collected from Kunming, and determined the parameters of HSS model. Their work provided necessary conditions for the numerical simulation of the foundation pit excavation considering the small strain behaviour of soil. Zong et al. [
5] used HSS model to study the construction process of the deep foundation pit in Shanghai International Finance Centre. Different kinds of construction methods, including forward building method, reverse building method and their combination, were simulated. Based on the field measurements, they investigated the deformation of the retaining structure and surrounding soil, axial force of the support system, and lateral earth pressure behind the wall under various construction stages. In addition to the HSS model, Liu et al. [
6] developed a new function for the shear modulus to reflect the small strain behaviour of sand based on the SANISAND model and NorSand model. The new models were incorporated into the finite element software, PLAXIS 2D, to analyze the safety of geotechnical structures.
On the other hand, Yao and Zhou [
7] found that heating and cooling could bring additional volume change or even failure to geomaterials. This phenomenon is called temperature effect, and should be considered into the geotechnical engineering design. Based on the elastic resistance method, Zheng et al. [
8] simplified the deformation of the retaining structure into a linear distribution, and considered the deformation compatibility among the support system, retaining pile and soil. They ultimately proposed a simplified analytical model to calculate the temperature stress in the horizontal single support. Hu et al. [
9] conducted back analysis based on the measured results of a deep ring-shaped foundation pit engineering in Tokyo, and proposed an analytical method to determine the influence of the temperature field on the force and deformation of the retaining structure. Then, their research achievement was applied to calculating the force and deformation of the retaining structure in the deep foundation pit of Shanghai World Exposition. Lu et al. [
10] combined the measured results from practical engineering with the simulation results based on the Modified Cam-clay constitutive model, to investigate the temperature effect of the support during the foundation pit excavation process. They analyzed the influence of the temperature variation on the internal force of the support, and pointed out that the temperature stress should be considered according to the most disadvantageous combinations of various construction stages.
This paper presents a case study about the ultra-large foundation pit of Kunming International Comprehensive Transportation Hub. The internal support system has seven rings, which are the most in the world at present. A finite element model considering the interaction between soil and retaining structure is established. HSS model, which accounts for the small strain behaviour of soil, is employed to analyze the deformation of the retaining structure and the influence of the ultra-large foundation pit excavation on the surrounding environment. The 3D elastic foundation plate method (m-method) is used to evaluate the temperature’s effect on the horizontal deformation of the foundation pit and the axial force of the internal support system. The calculated results are compared with the field measurement, revealing the applicability of the proposed analytical method. This work can provide valuable reference for the design and construction of ultra-large underground space.
1. Engineering Overview
1.1. Project Introduction
Kunming International Comprehensive Transportation Hub is located in Guandu District, Kunming, China [
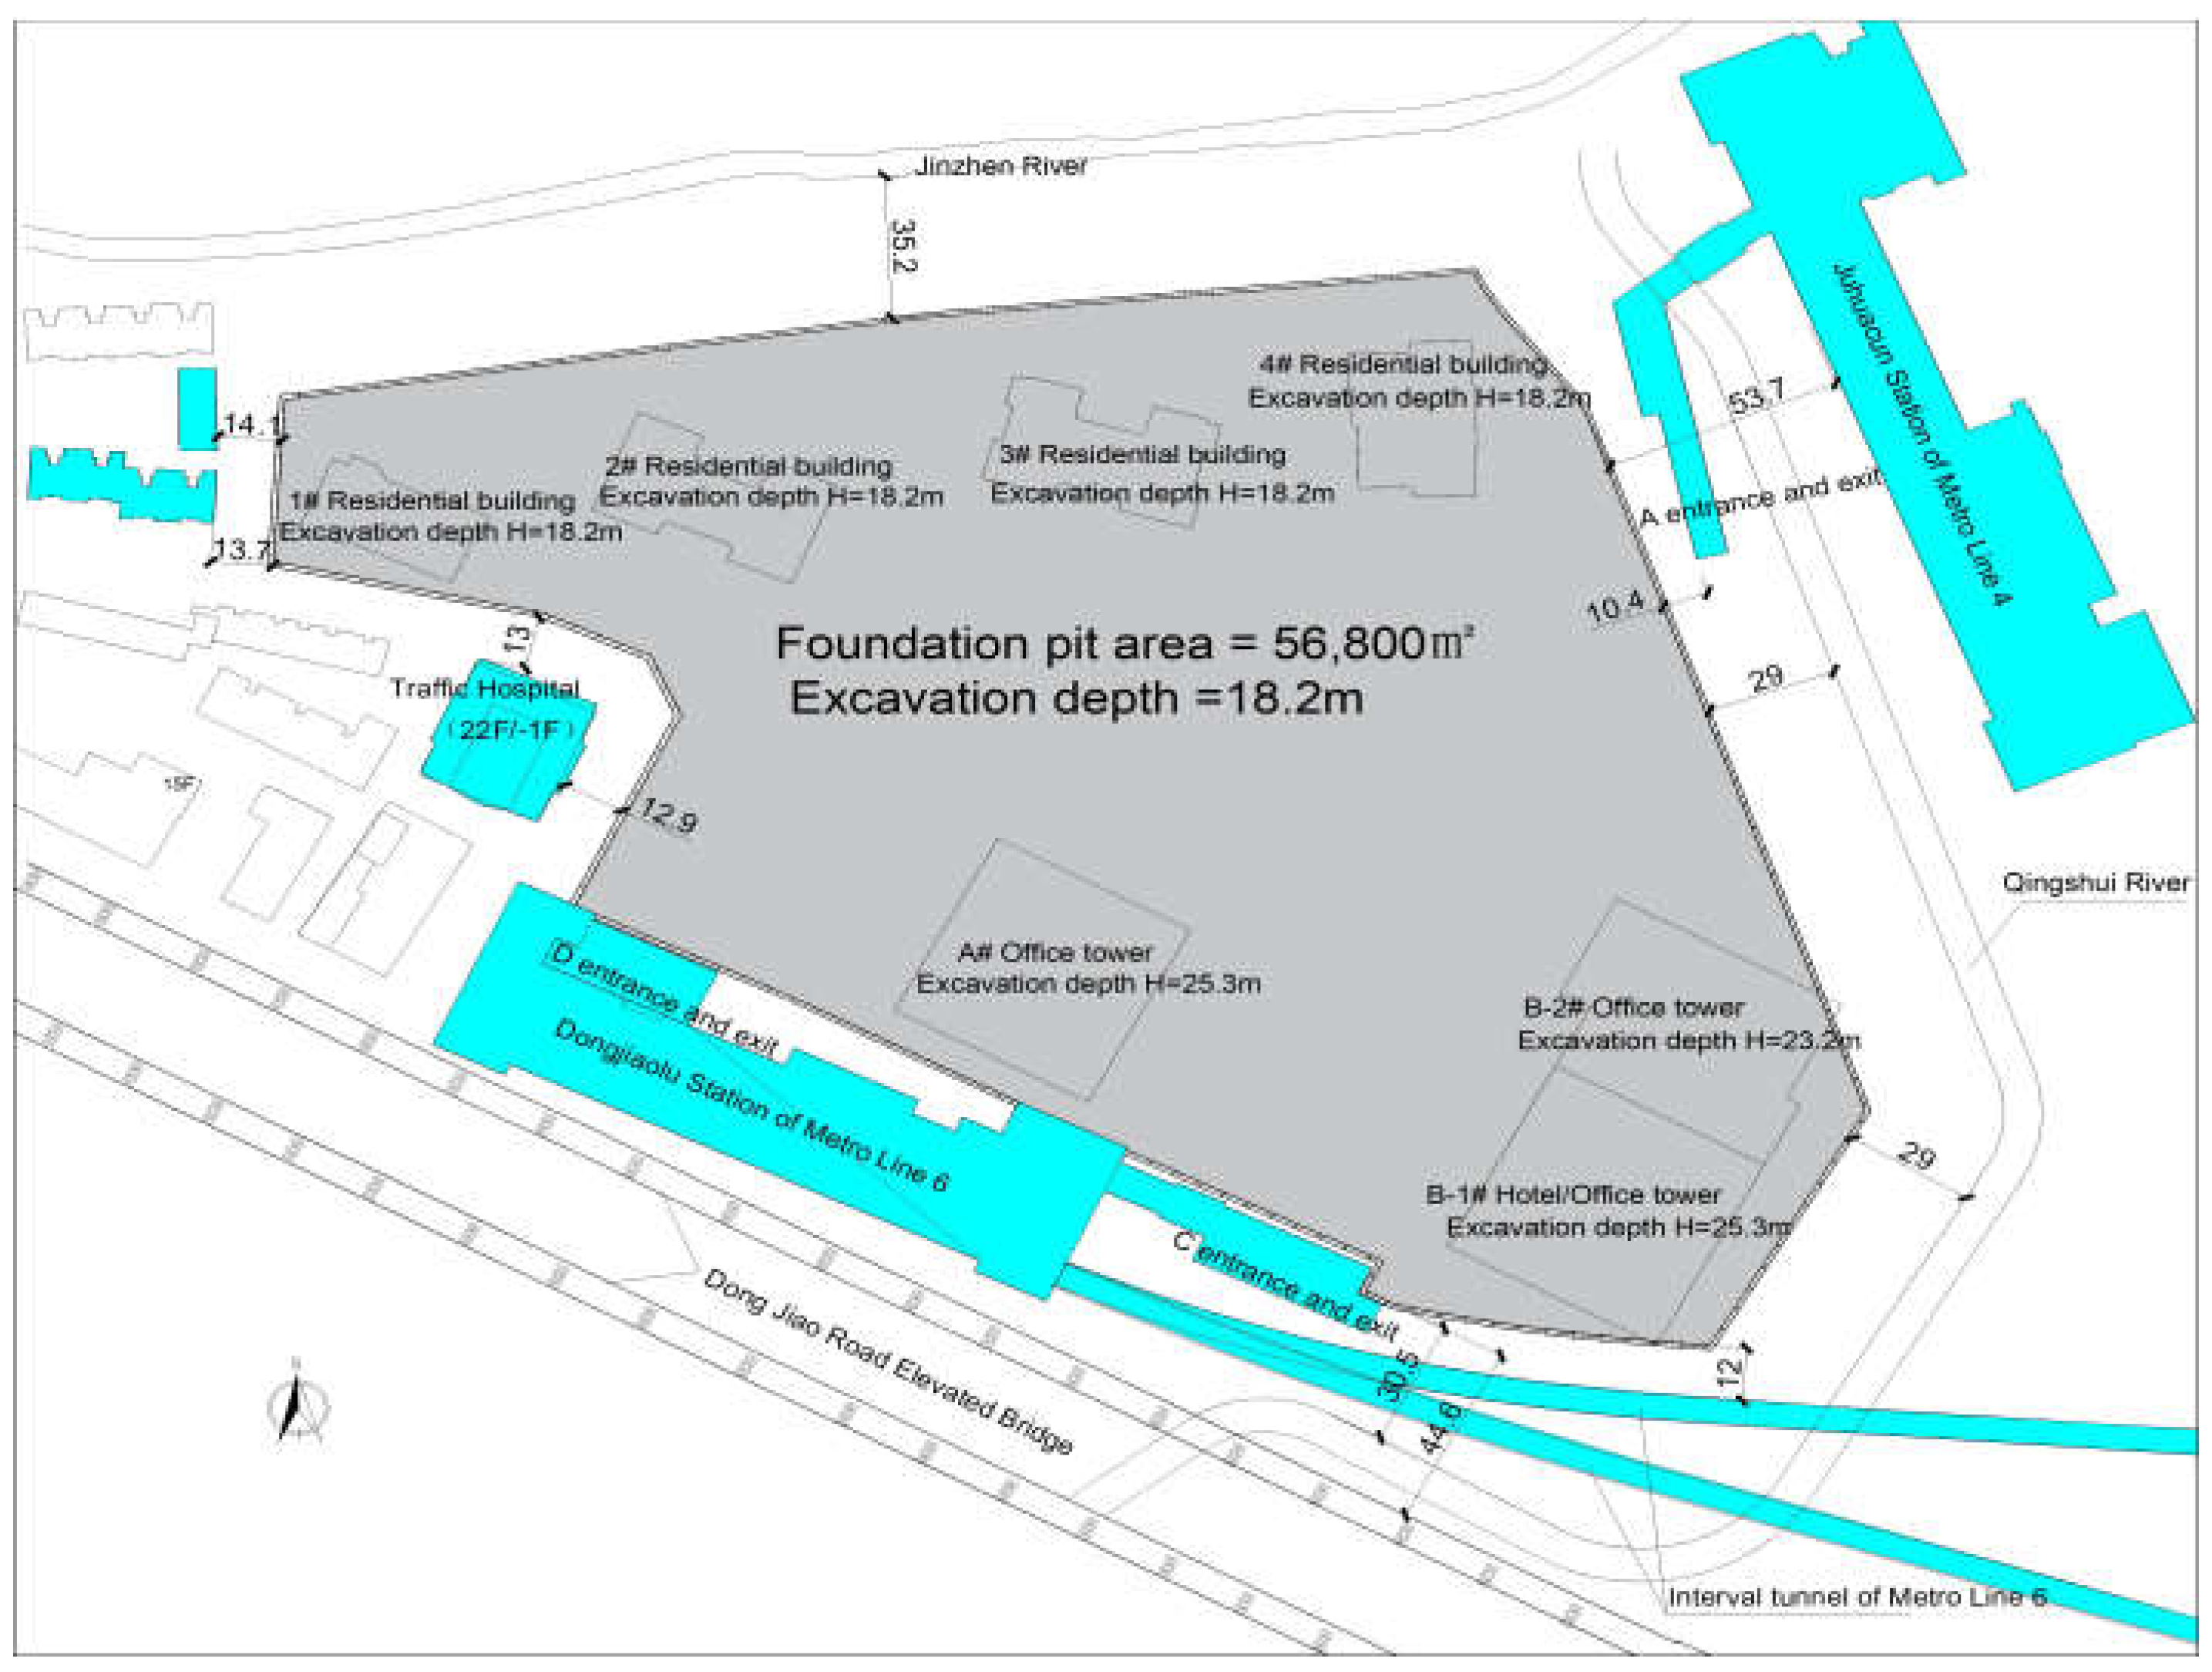
11]. It consists of three commercial towers (30~48 floors), four residential buildings (27~31 floors) and one commercial podium (8 floors) on the ground. And below the ground, all the buildings have three floors of basements. The area of the foundation pit is 56,800m
2, the perimeter is 1,084m and the excavation depth varies from 18m to 25m.
The project is located at the northwest of the intersection between Dongjiao Road and Second Ring East Road. This site is surrounded by complex environmental conditions, including old buildings with shallow foundation, existing and under-construction metro stations and tunnels, as well as municipal roads. The site plan is shown in
Figure 1. At the south side, the site is adjacent to a station of Metro Line 6, i.e., Dongjiaolu Station, sharing the same retaining structure. Besides, the minimum distances to the shield tunnel of Metro Line 6 and Dongjiao Road are approximately 12m and 43.5 m, respectively. At the west side, the site borders several old residential buildings (5~7 floors) with shallow foundation and a 24-story hospital with pile foundation, and the minimum distances are 12.5m and 12.9m, respectively. At the east side, the site is near the open channel of Qingshui River and the under-construction Juhuacun Station of Metro Line 4, with the minimum distances being 29.1m and 53.7m, respectively. The north boundary is adjacent to the open channel of Jinzhen River, with a minimum distance of 33.8m. During the excavation process of the foundation pit, the environment must be protected strictly.
1.2. Engineering Geological Conditions
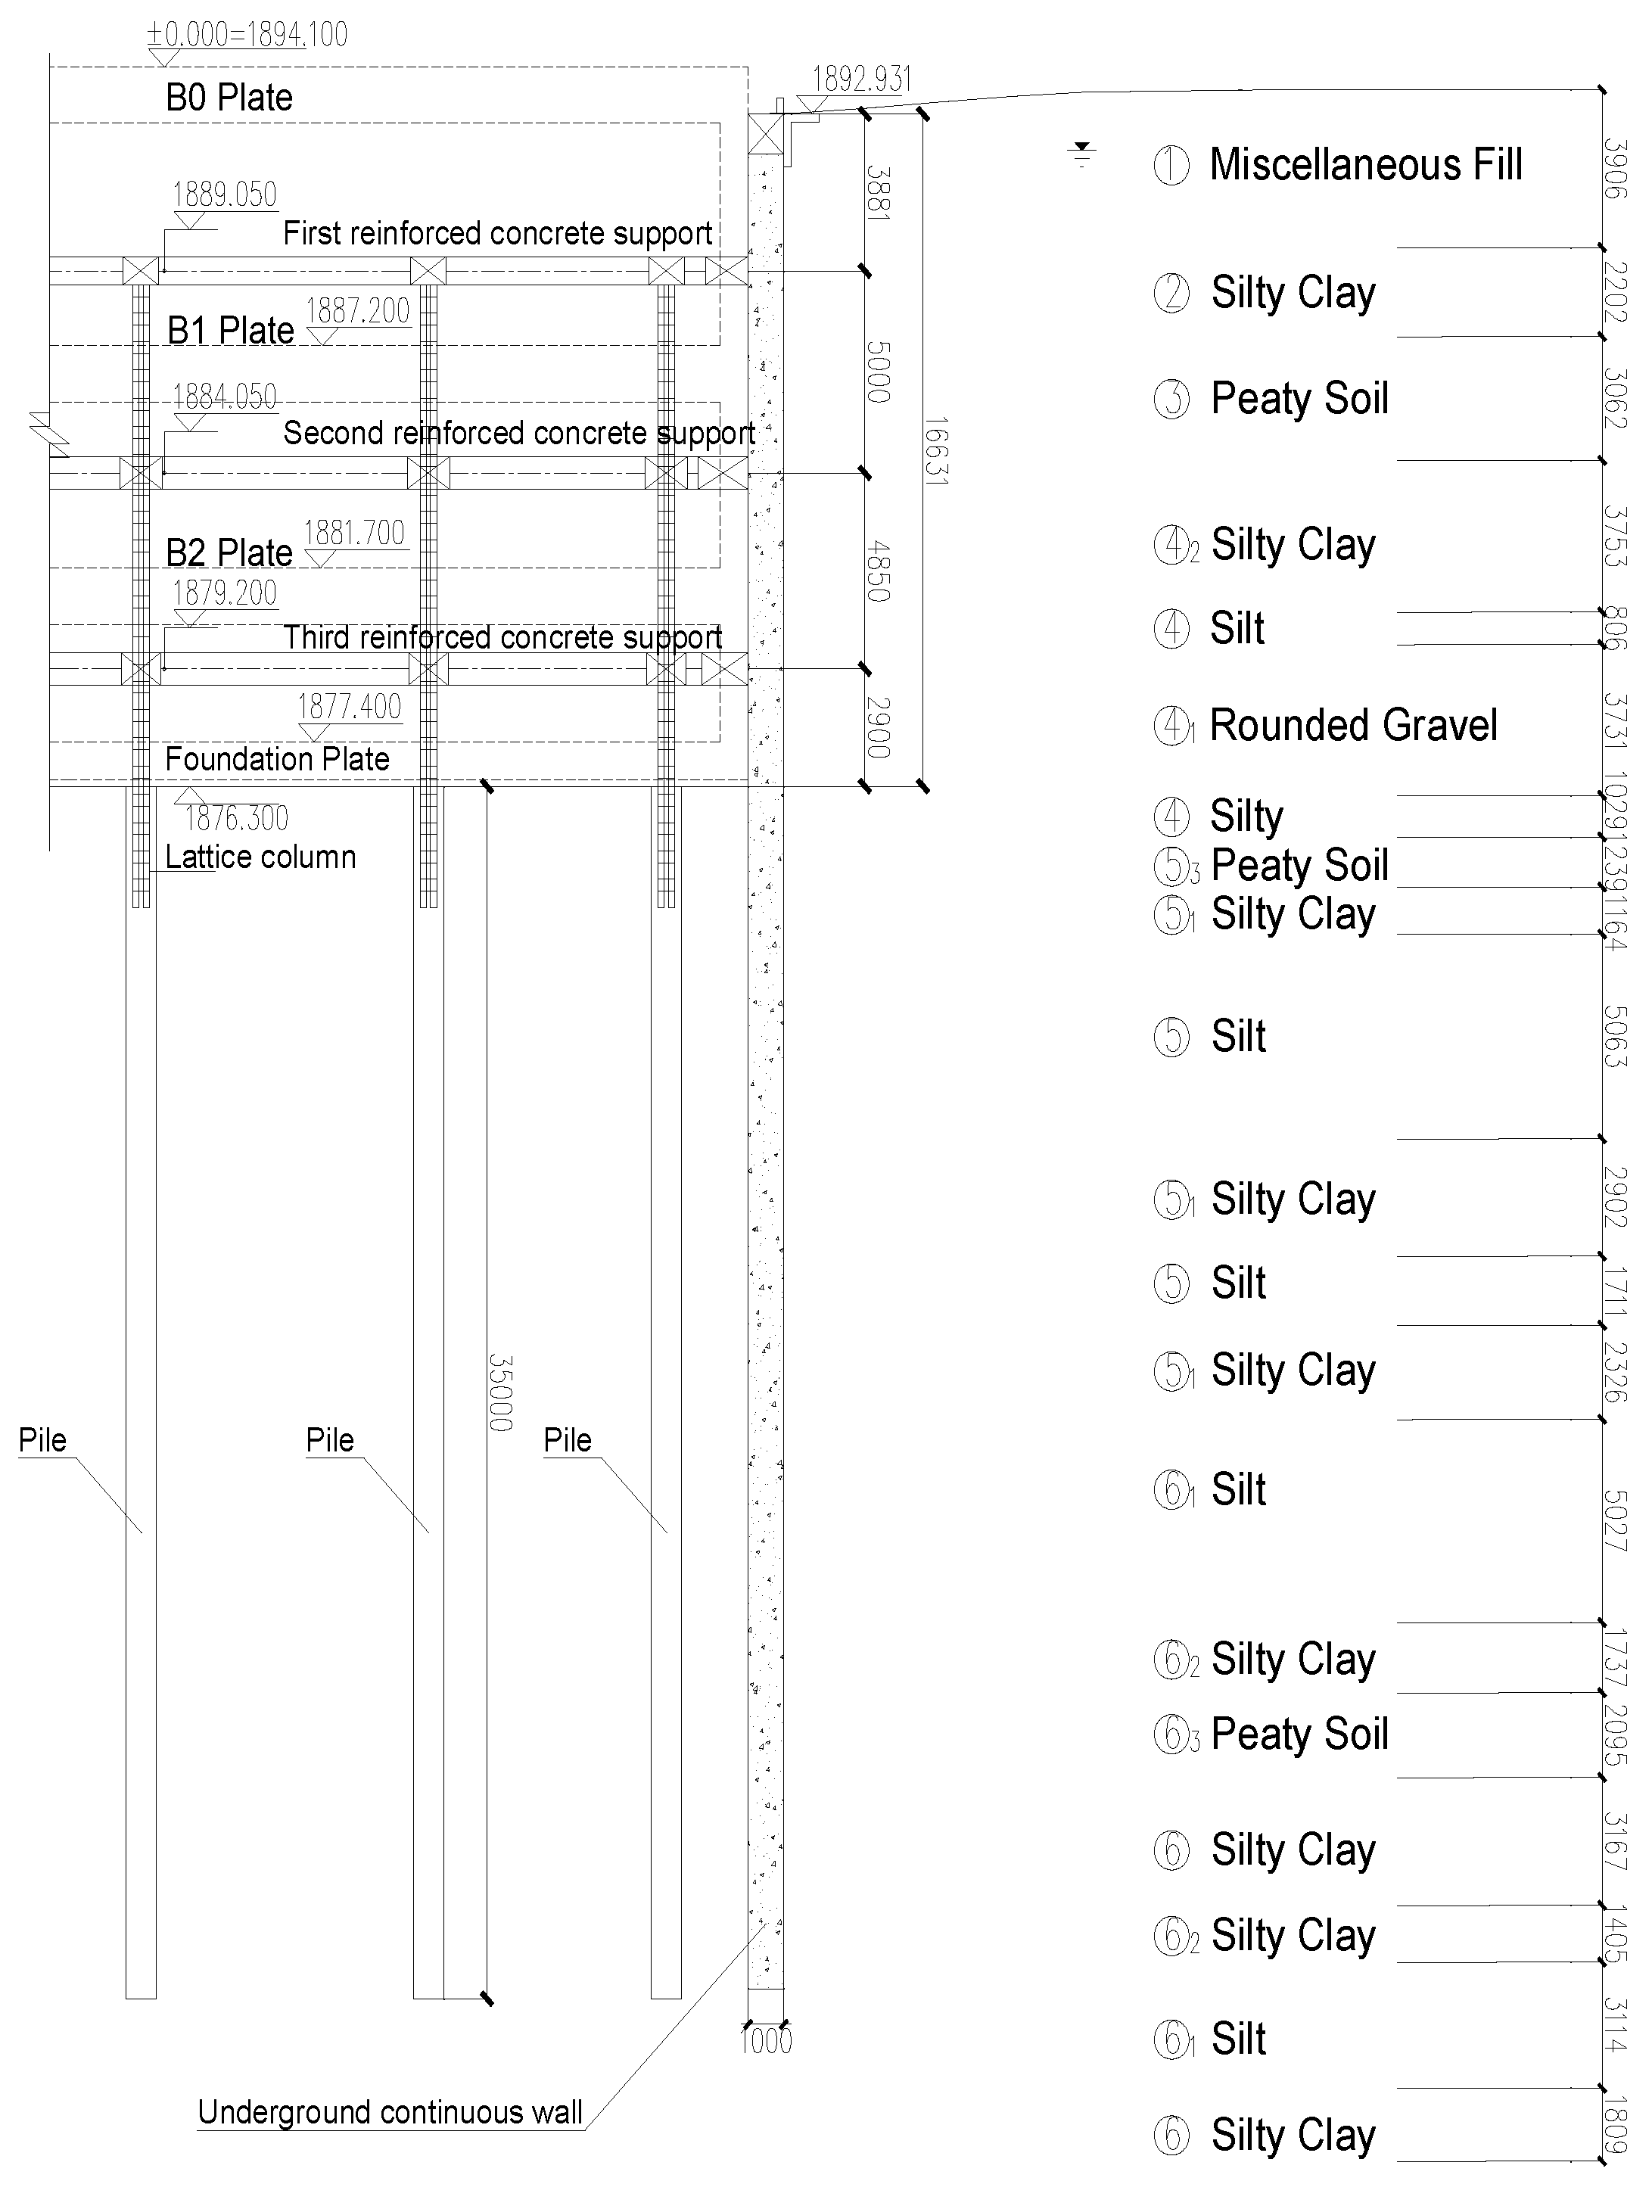
The engineering site is located in the transitional zone between the alluvial lacustrine plain and alluvial lacustrine terrace of northeastern Kunming fault basin. The geomorphology is classified as lacustrine sedimentary basin. The stratigraphy exhibits local undulations due to tectonic activity and river erosion in the geological history. The superficial layer, approximately 1~6m in depth, consists of artificial fill. Beneath it, there is Quaternary Holocene alluvial deposit, and its depth can be up to 20~35m. This layer primarily consists of silty clay (Layer ②) and slightly dense to medium dense silt (Layers ④ and ⑤). Peaty soil (Layer ③) is distributed at the east side of the site. Below the Holocene deposit, there is Quaternary Upper Pleistocene alluvial layer which mainly consists of hard silty clay (Layers ⑥ and ⑦), mixed up with silt, gravelly sand and peaty soil. The soil parameters of each layer are provided in
Table 1.
The groundwater at the site includes two types: perched water and porous phreatic water. The perched water primarily exists in Layer ① (miscellaneous fill) but the water content is low. The porous phreatic water mainly exists in Layer ④1 and Layer ⑤2 (rounded gravel) as well as Layer ⑥4 (gravelly sand). It can bear a tiny part of pressure and the water head is 4~5m below the ground surface. According to the stability checking calculation against the water gushing, the water head of Layer ⑤2 below the excavation surface should reduce 14.6m while dewatering is not required for Layer ⑥4.
1.3. Support Scheme of the Foundation Pit
The foundation pit is constructed by the forward building method. In general area, the foundation pit is supported by 1.0-meter-thick underground continuous wall. At the west side, adjacent to the hospital and residential buildings, the thickness of the underground continuous wall is 1.2m. The bottom of these walls is 42.45~54.45m below the ground surface to ensure stability. These walls also serve to cut off the superficial perched water and the confined water in Layers ④
1~⑤
2, minimizing the influence of dewatering inside the pit on the surrounding environment. All underground continuous walls used in this project are temporary.
Figure 2 illustrates the profile view of the retaining structure in the foundation pit of Tower A.
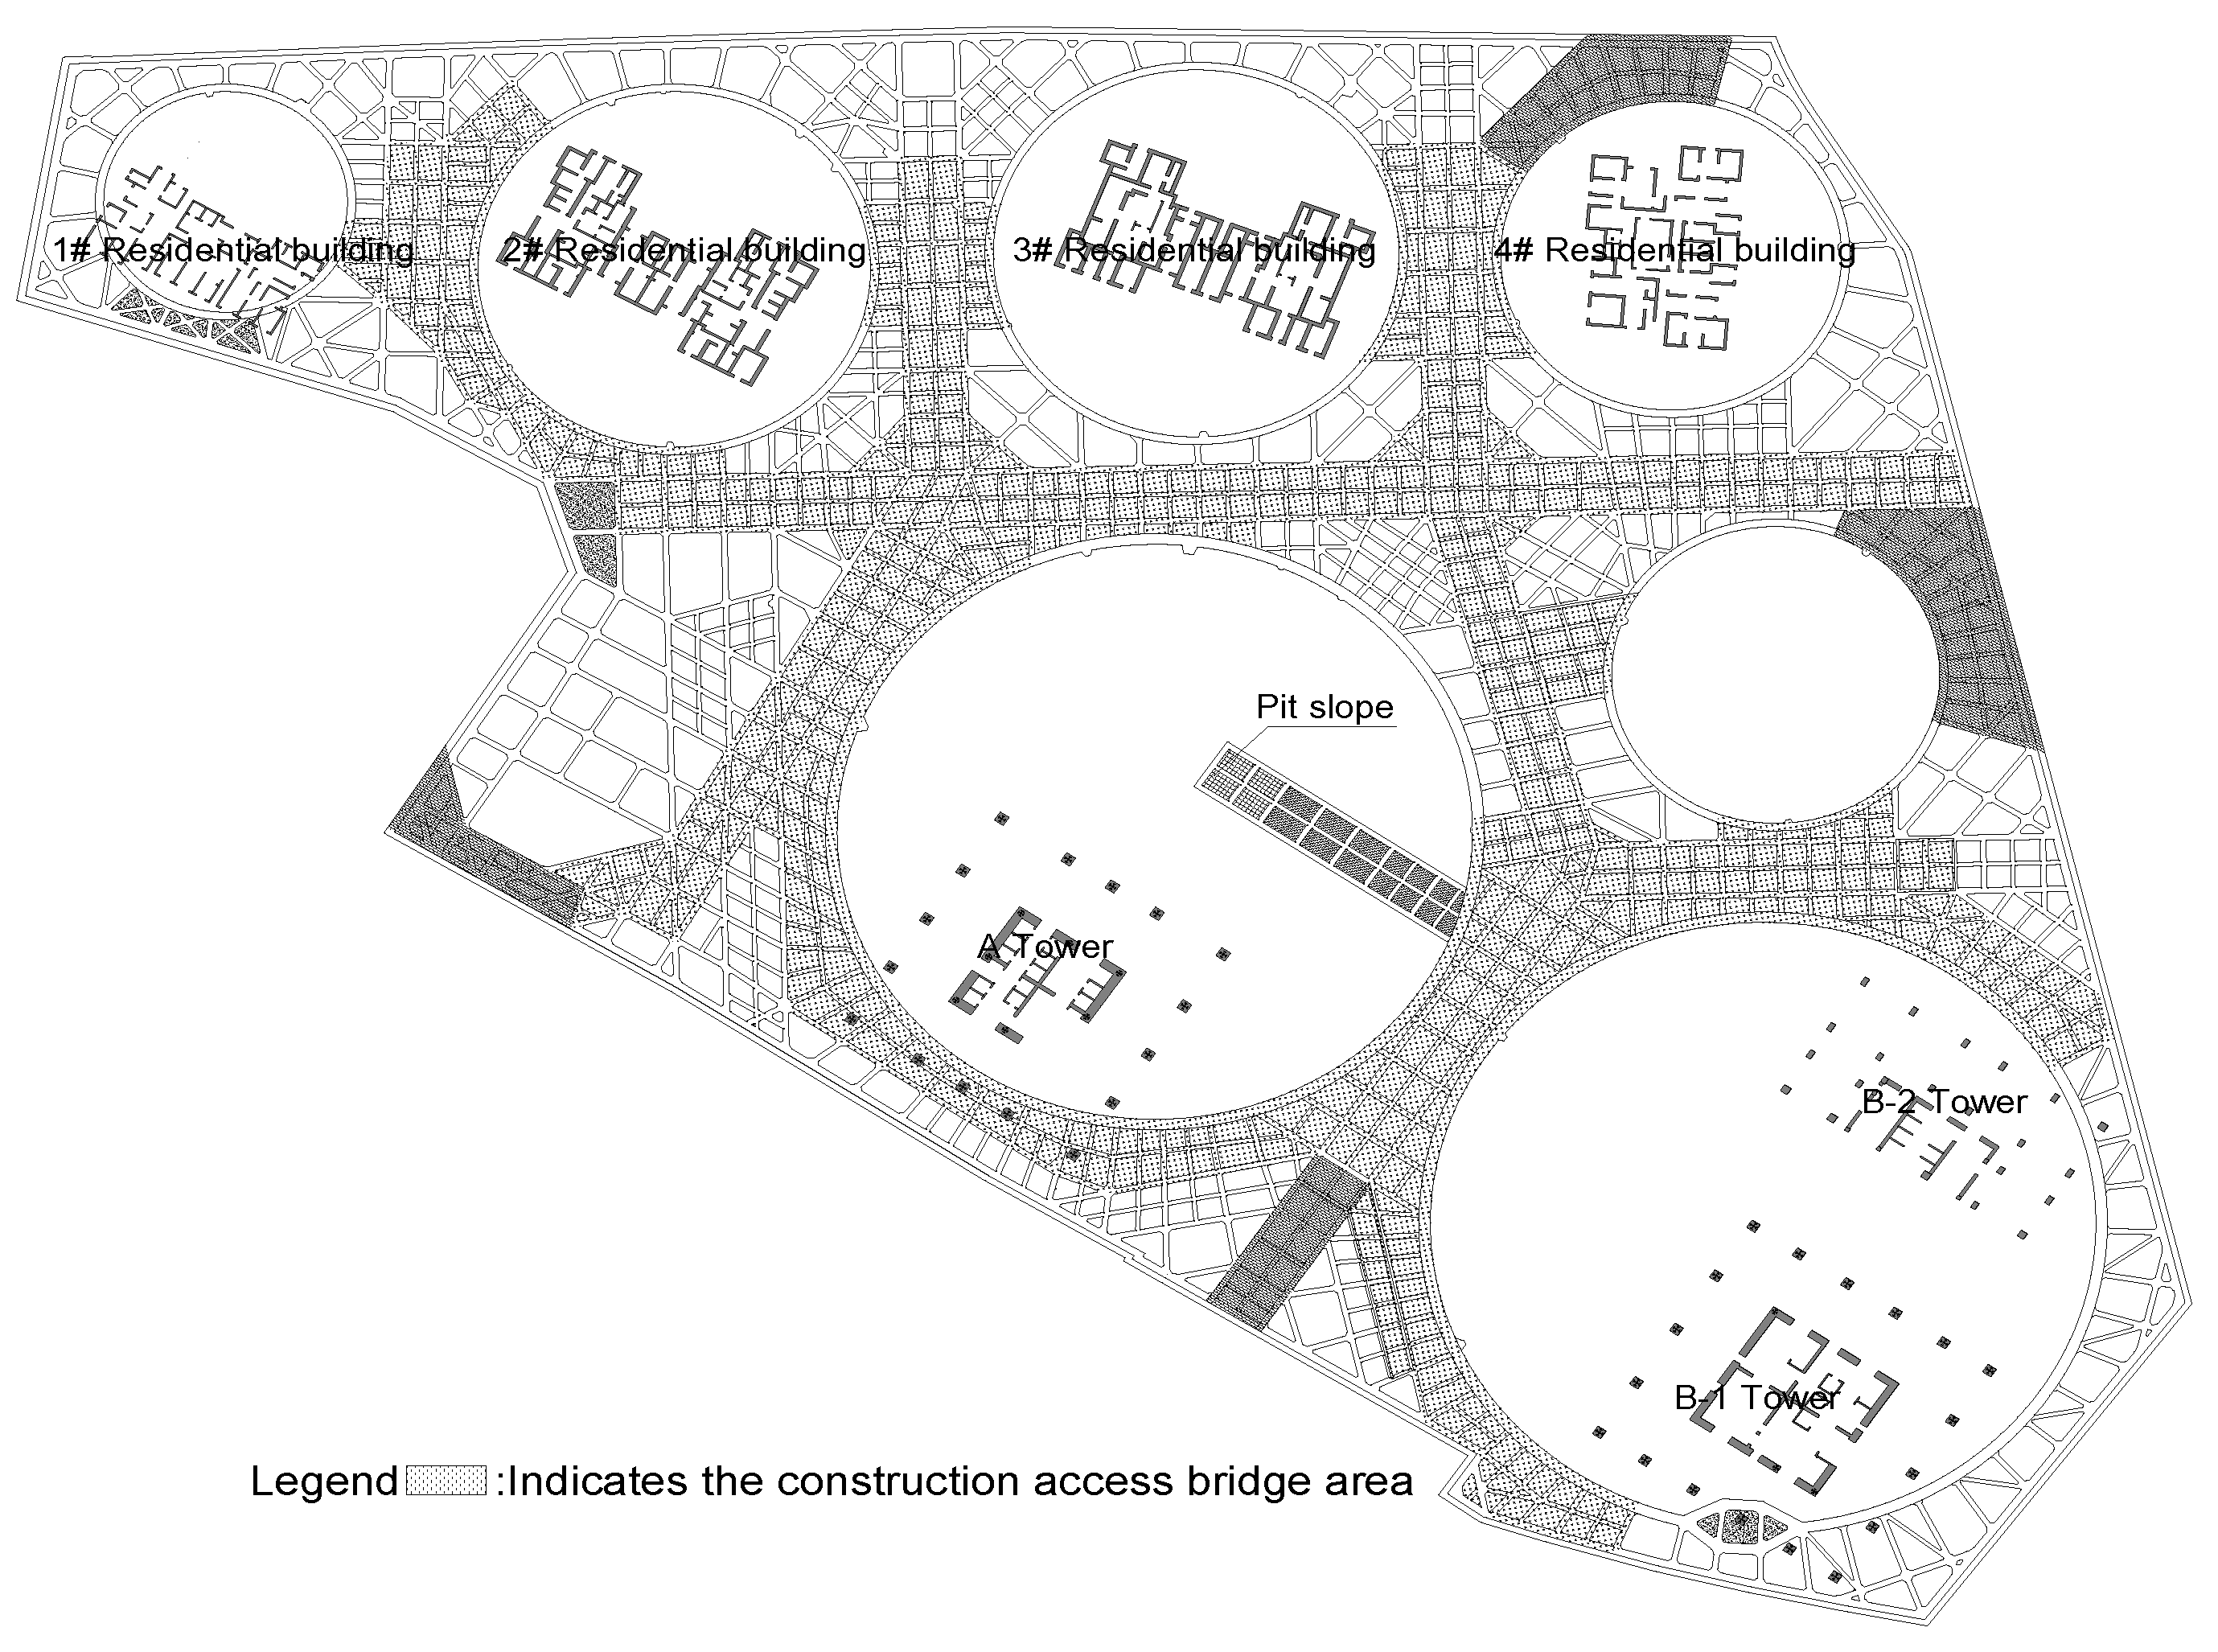
In the foundation pit, there are three layers of reinforced concrete support system along the vertical direction. The concrete grade of all supports is C40. Each support system has seven rings that are connected with each other in the horizontal direction, as shown in
Figure 3. The uppermost support system is also used as the construction access bridge (see the shadowed area in
Figure 3). The force of the internal support system is coupled integrally, and the number of rings is the most in the world. Diameters of these rings are 105m, 100m, 64m, 62m, 54m, 52m, and 39m, respectively. The internal support system can create favorable conditions for the early construction of the aboveground structures of six towers.
This project utilizes temporary steel columns and drilled grouting piles as vertical support members for the horizontal support system. In both the general area and construction access bridge area, the temporary steel columns are made of steel lattice columns whose cross-sections are 460mm × 460mm. Diameters of the piles under the columns are all 800mm, while their lengths are 18m or 35m.
2. Design of the Retaining Structure
2.1. Finite Element Model Considering the Soil-Structure Interaction
PLAXIS is widely used in geotechnical engineering due to its user-friendly interface and convenient operation. PLAXIS incorporates some well-known soil constitutive models, such as the linear elastic model and Mohr-Coulomb model. In addition, two advanced constitutive models, i.e., Hardening Soil model (HS model) and Hardening Soil model with small strain stiffness (HSS model), are available. The last model can consider the stiffness variation of soil during unloading, providing simulation results that agree well with the actual conditions, so that it is particularly suitable for the foundation pit engineering [
7].
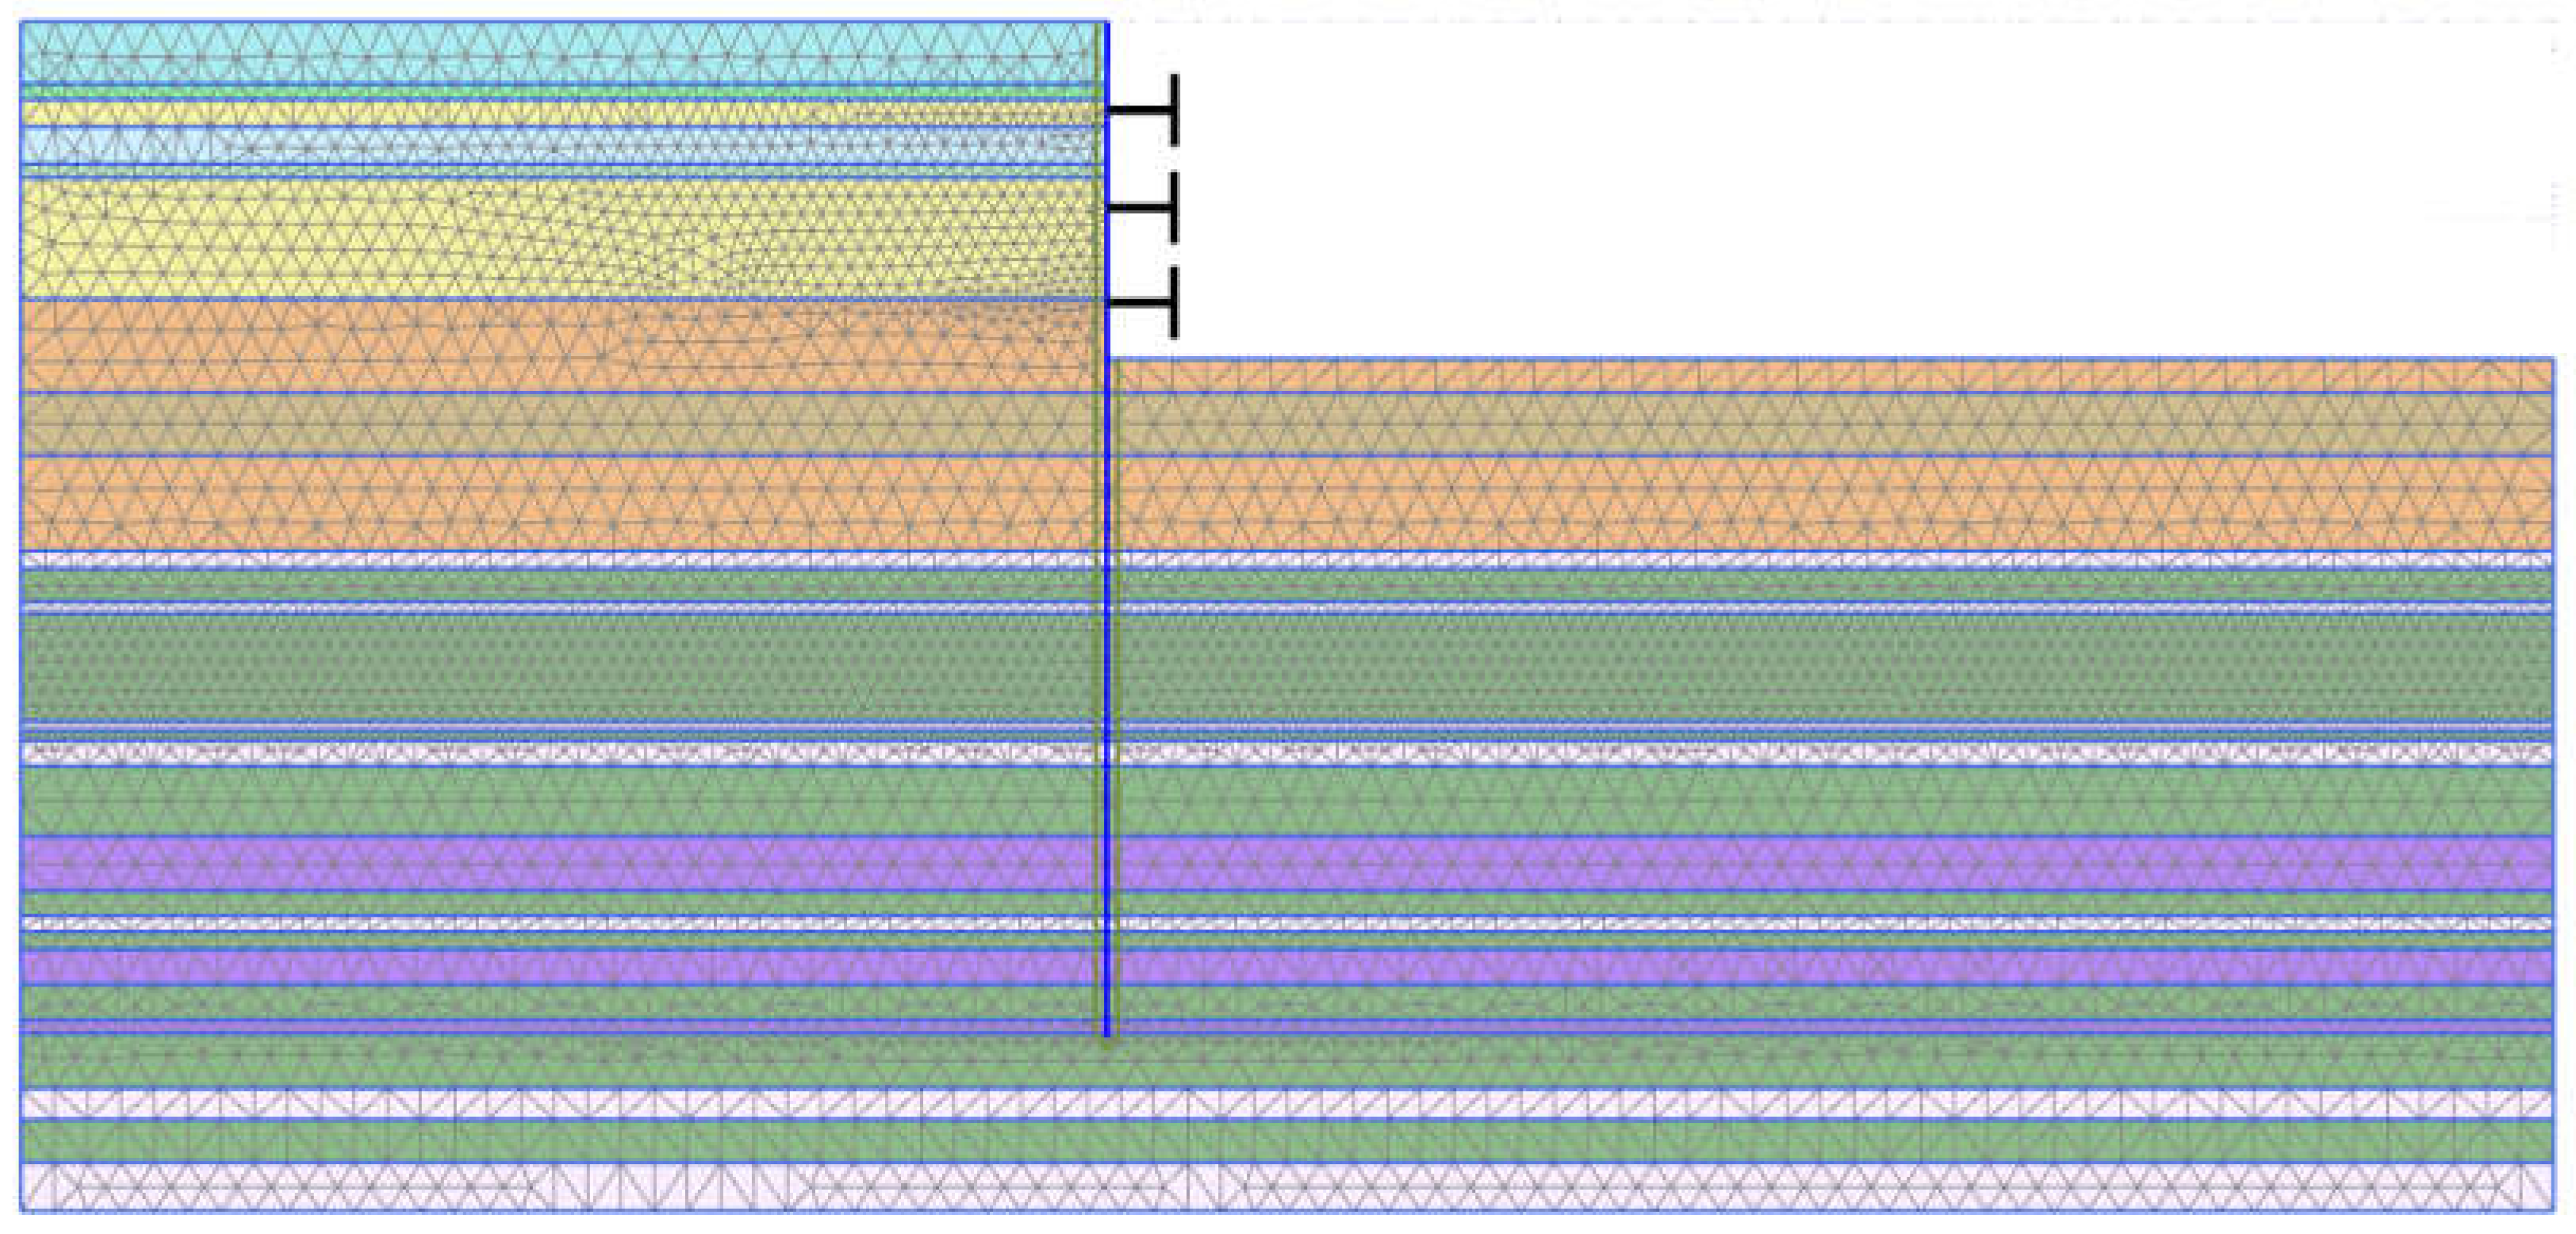
Due to the large scale of this project, a typical cross-section from the northern part of the foundation pit is selected to design the retaining structure. A finite element model, including the soil, underground continuous wall and temporary support system, is established in PLAXIS 2D, as shown in
Figure 4. The soil, wall and supports are simulated by 15-node triangular elements, 3-node beam elements and 2-node anchor elements, respectively. The interaction between soil and underground continuous wall is modeled using Goodman contact elements. Strength reduction is applied to these contact elements, with the reduction coefficients for clay (including peaty soil) and sand being 0.65 and 0.7, respectively.
To minimize the boundary effect, the horizontal distance from the foundation pit to the model boundary is set to be three times the excavation depth, and the vertical size of the model is also approximately three times the excavation depth [
12]. On the left and right sides of the model, horizontal deformation is constrained; while on the bottom, both horizontal and vertical deformation are constrained. The seepage boundary conditions are set as follows: the underground water has a constant water head of -1.3m, while the bottom, left and right sides are impermeable. There are construction vehicles and building materials outside the foundation pit, so that a vertical load of 20kPa is subjected on the ground surface to simulate the actual loading conditions of the foundation pit.
2.2. Calculation Parameters and Construction Stages
2.2.1. Information of Structural Members
According to the retaining structure design, the elastic modulus of the underground continuous wall is set to 3.25×10
7kPa. Three layers of reinforced concrete support system are adopted as temporary horizontal support. Information of different structural members in the support system is provided in
Table 2. The support stiffness can be calculated by the product of the elastic modulus
E and cross-sectional area
A. The interval between adjacent supports is set to be 9m, and Poisson's ratio is 0.2 for all structural members. Because concrete may experience shrinkage and creep during the pouring and maintaining processes, and the uneven loading could cause additional bending moment and torsion, the support stiffness will gradually reduce. To consider this effect, the support stiffness is usually discounted in the finite element analysis. According to the suggestion of Ou [
12], the elastic modulus of concrete support should reduce by 20%. Given the large scale of this foundation pit and the significant effects of the concrete shrinkage and creep, the reduction coefficient of the elastic stiffness of the support is taken to be 40%.
2.2.2. Calculation Parameters for Soils
In this numerical simulation, HSS model is adopted for different kinds of soils. The specific parameter values are provided in
Table 3. Besides, Poisson's ratio during unloading or reloading,
νur, is equal to 0.2 and the reference pressure
pref=100 kPa. During the analysis, clay layers are assumed to be undrained, while sand layers are in drained condition. This approach allows for a more reasonable representation of different soil behaviors under various loading and drainage conditions.
2.2.3. Construction Stages
In PLAXIS, elements can be added and removed in different analytical steps. This function is adopted to simulate the whole construction process of the foundation pit, including the construction of the underground continuous wall, soil excavation layer by layer, and production of the support system. In addition, to simulate the dewatering, the underground water level inside the foundation pit falls to the excavation surface after each soil layer is excavated, followed by a seepage analysis. The specific construction stages are shown in
Table 4.
2.3. Calculation Results and Analysis
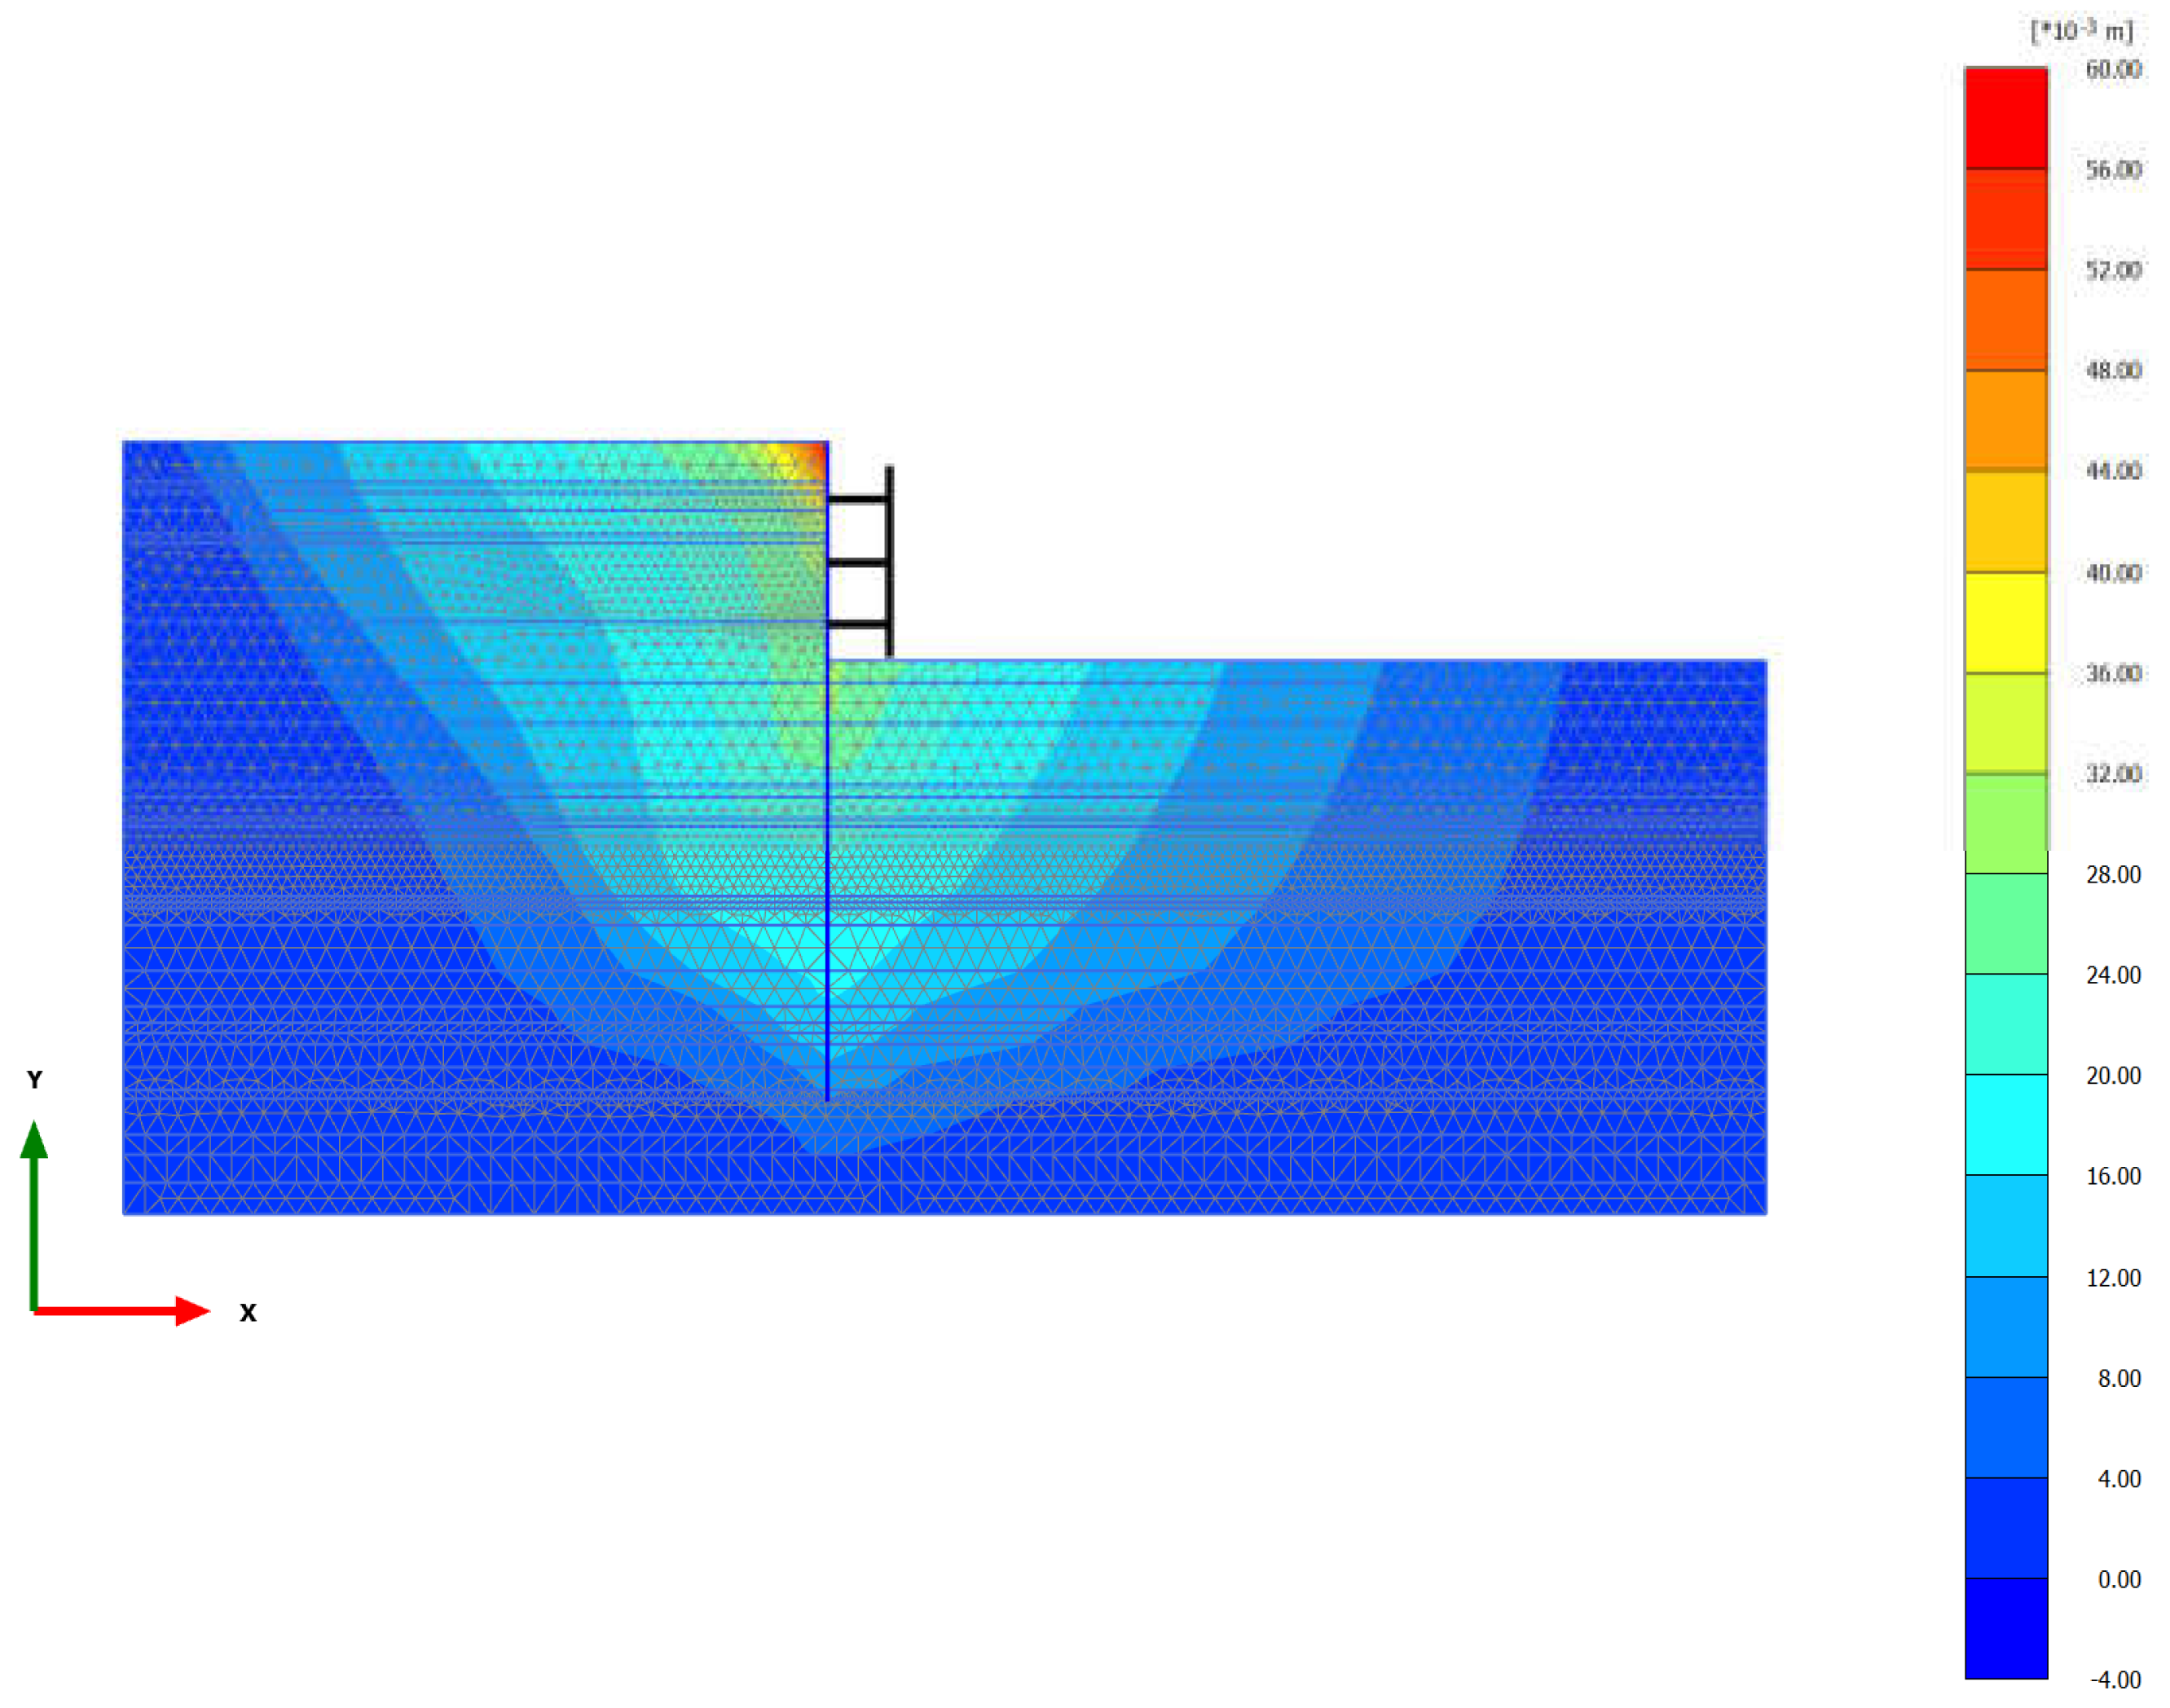
Based on the finite element simulation, the horizontal ground deformation when the foundation pit is completely excavated is shown in
Figure 5. At Stage 2, the excavation depth of the first soil layer is 4.6m. Because the underground continuous wall does not have lateral support yet, its deformation characteristics look like those of cantilever beam, with the deformation value being relatively large at the top and small at the bottom. The maximum horizontal deformation at this stage is 19. 2mm. As the foundation pit is excavated layer by layer, the maximum horizontal deformation of the wall gradually increases. Due to the large distance between the first support and the top of the foundation pit, the cantilever part of the underground continuous wall is relatively long. This, coupled with the large area of the foundation pit, makes the support stiffness lower than the horizontal constraint provided by the internal support in smaller foundation pit for the underground continuous wall. As a result, the maximum horizontal deformation of the underground continuous wall will reach 58.7mm at the end of Stage 5.
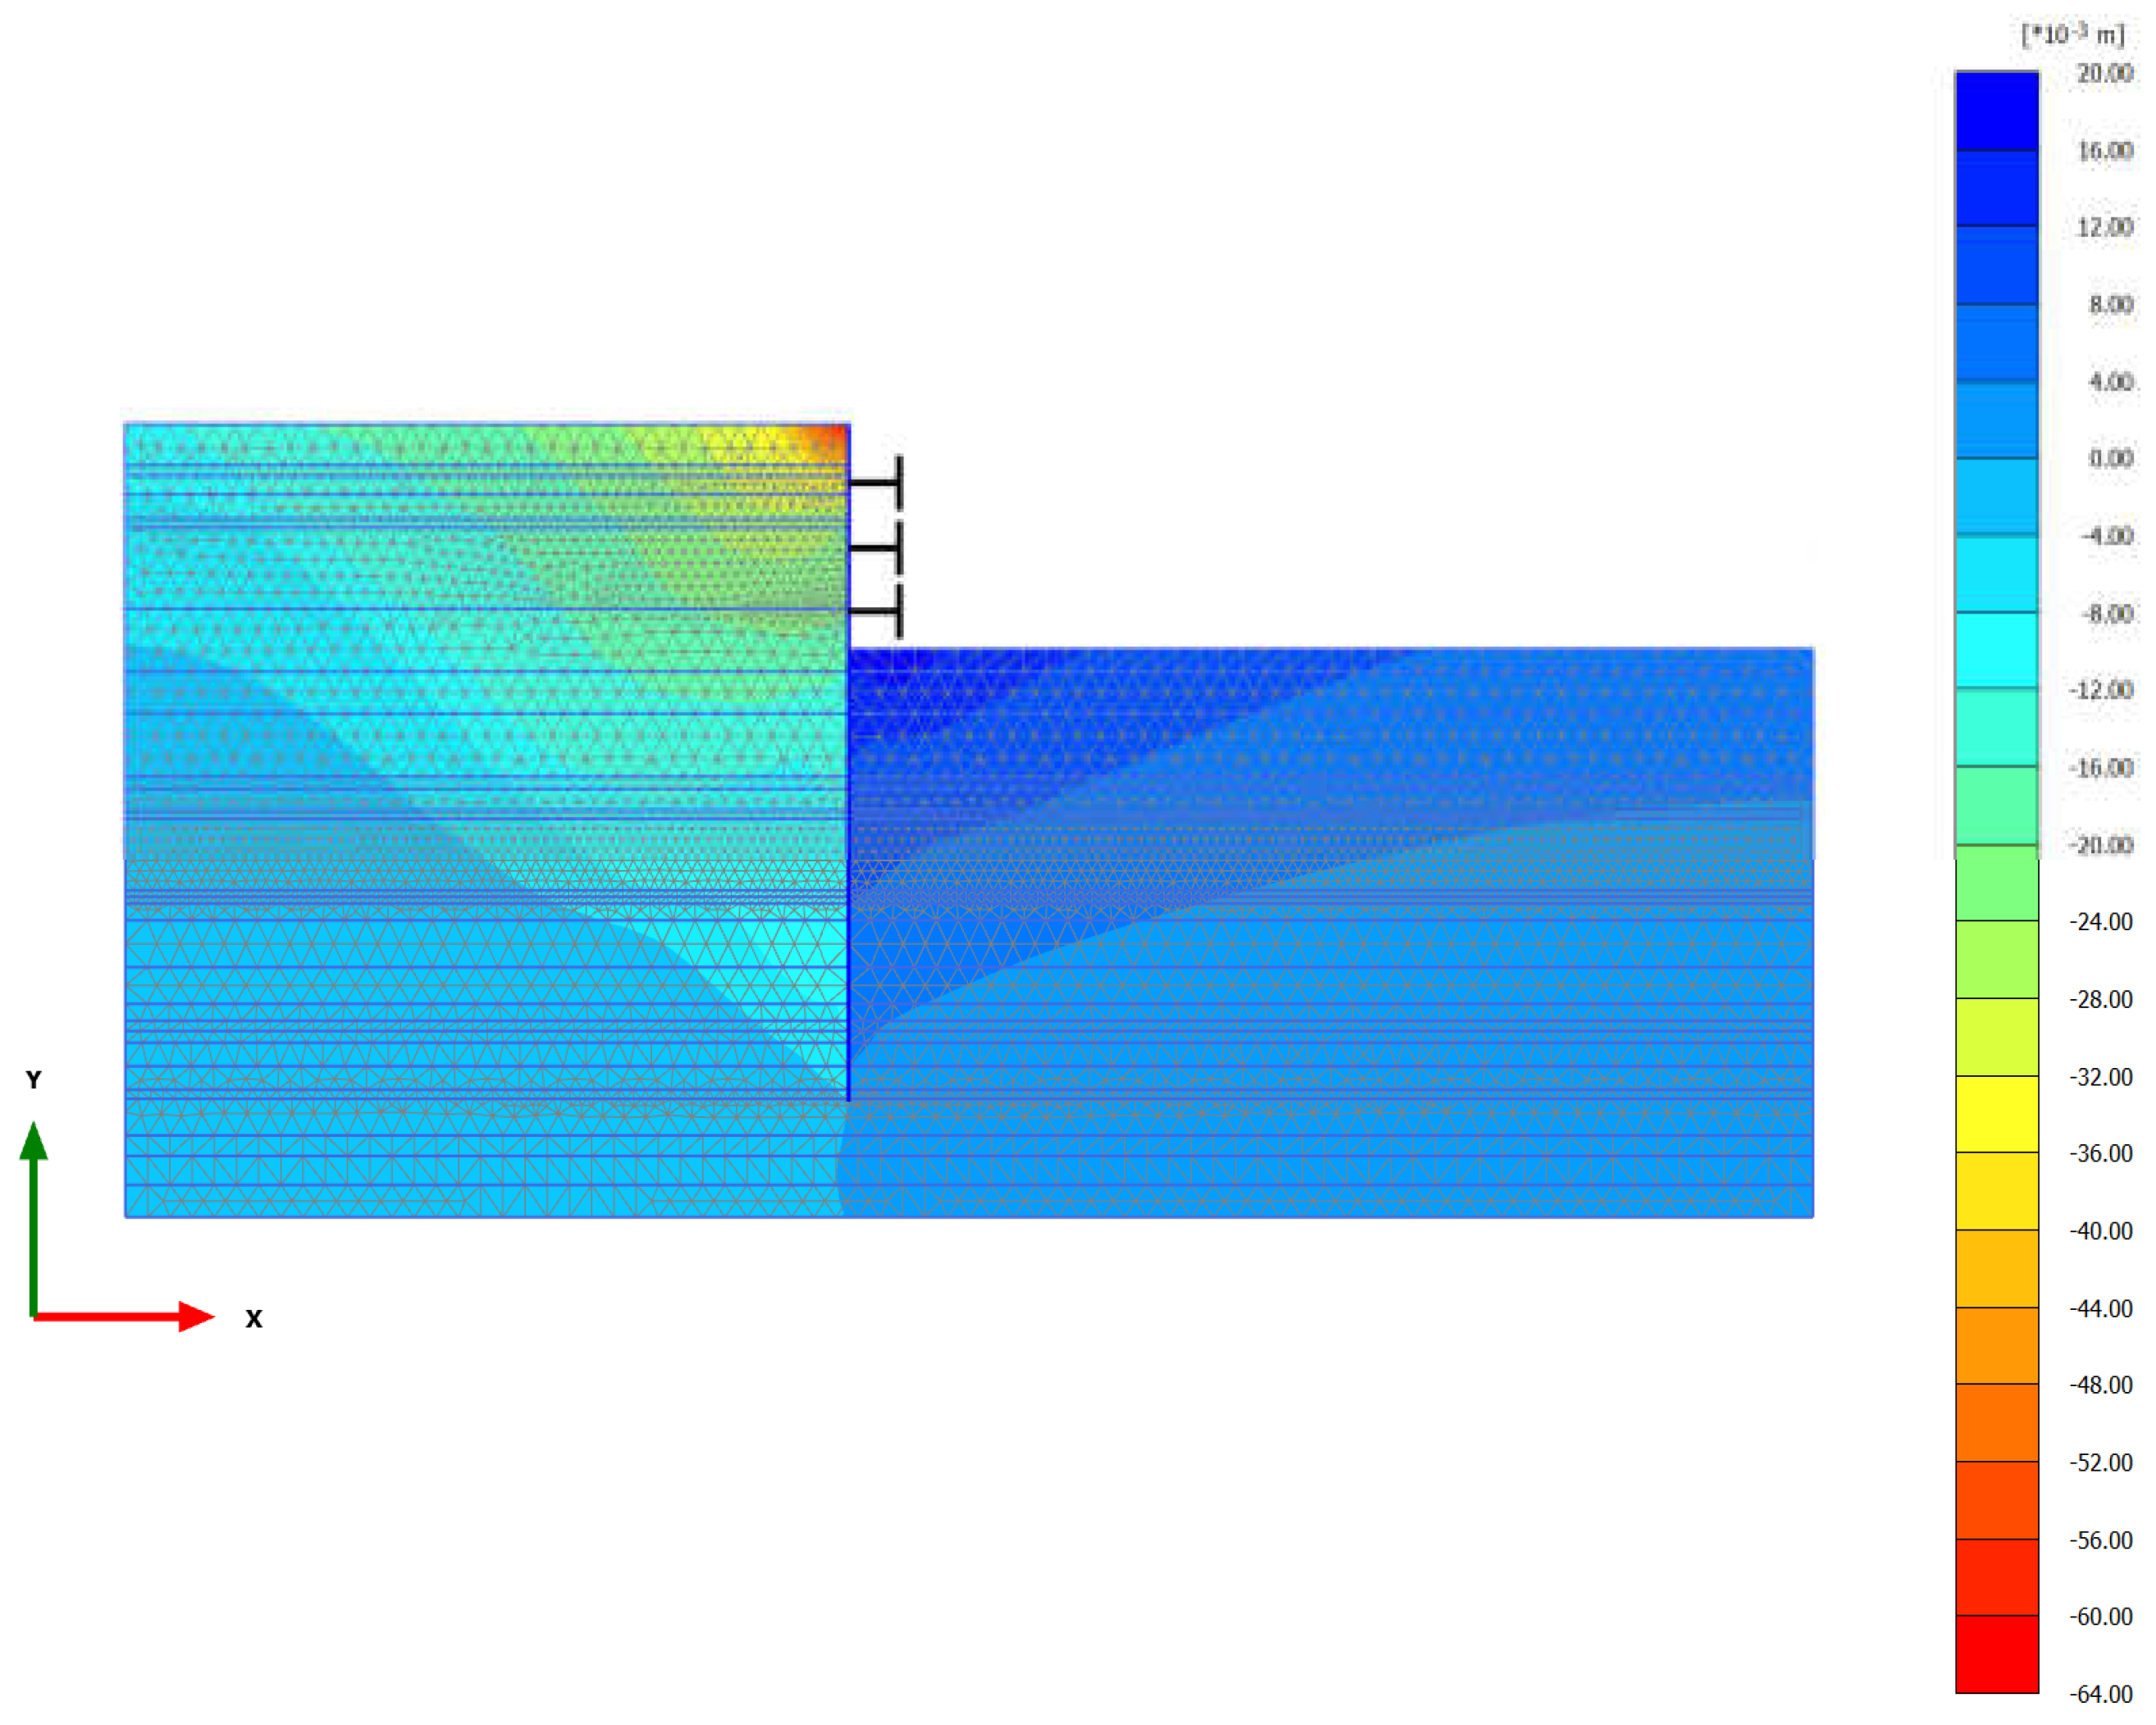
Figure 6 presents the calculated vertical ground deformation at the end of Stage 5. As the excavation depth increases, the ground surface settlement contour outside the foundation pit exhibits a triangular distribution. This is consistent with the above-mentioned conclusion that the underground continuous wall deforms like cantilever beam. As the construction progresses, the surface settlement outside the foundation pit gradually increases. At the end of Stage 5, the maximum surface settlement is 58.4mm, which is close to the maximum horizontal deformation of the underground continuous wall.
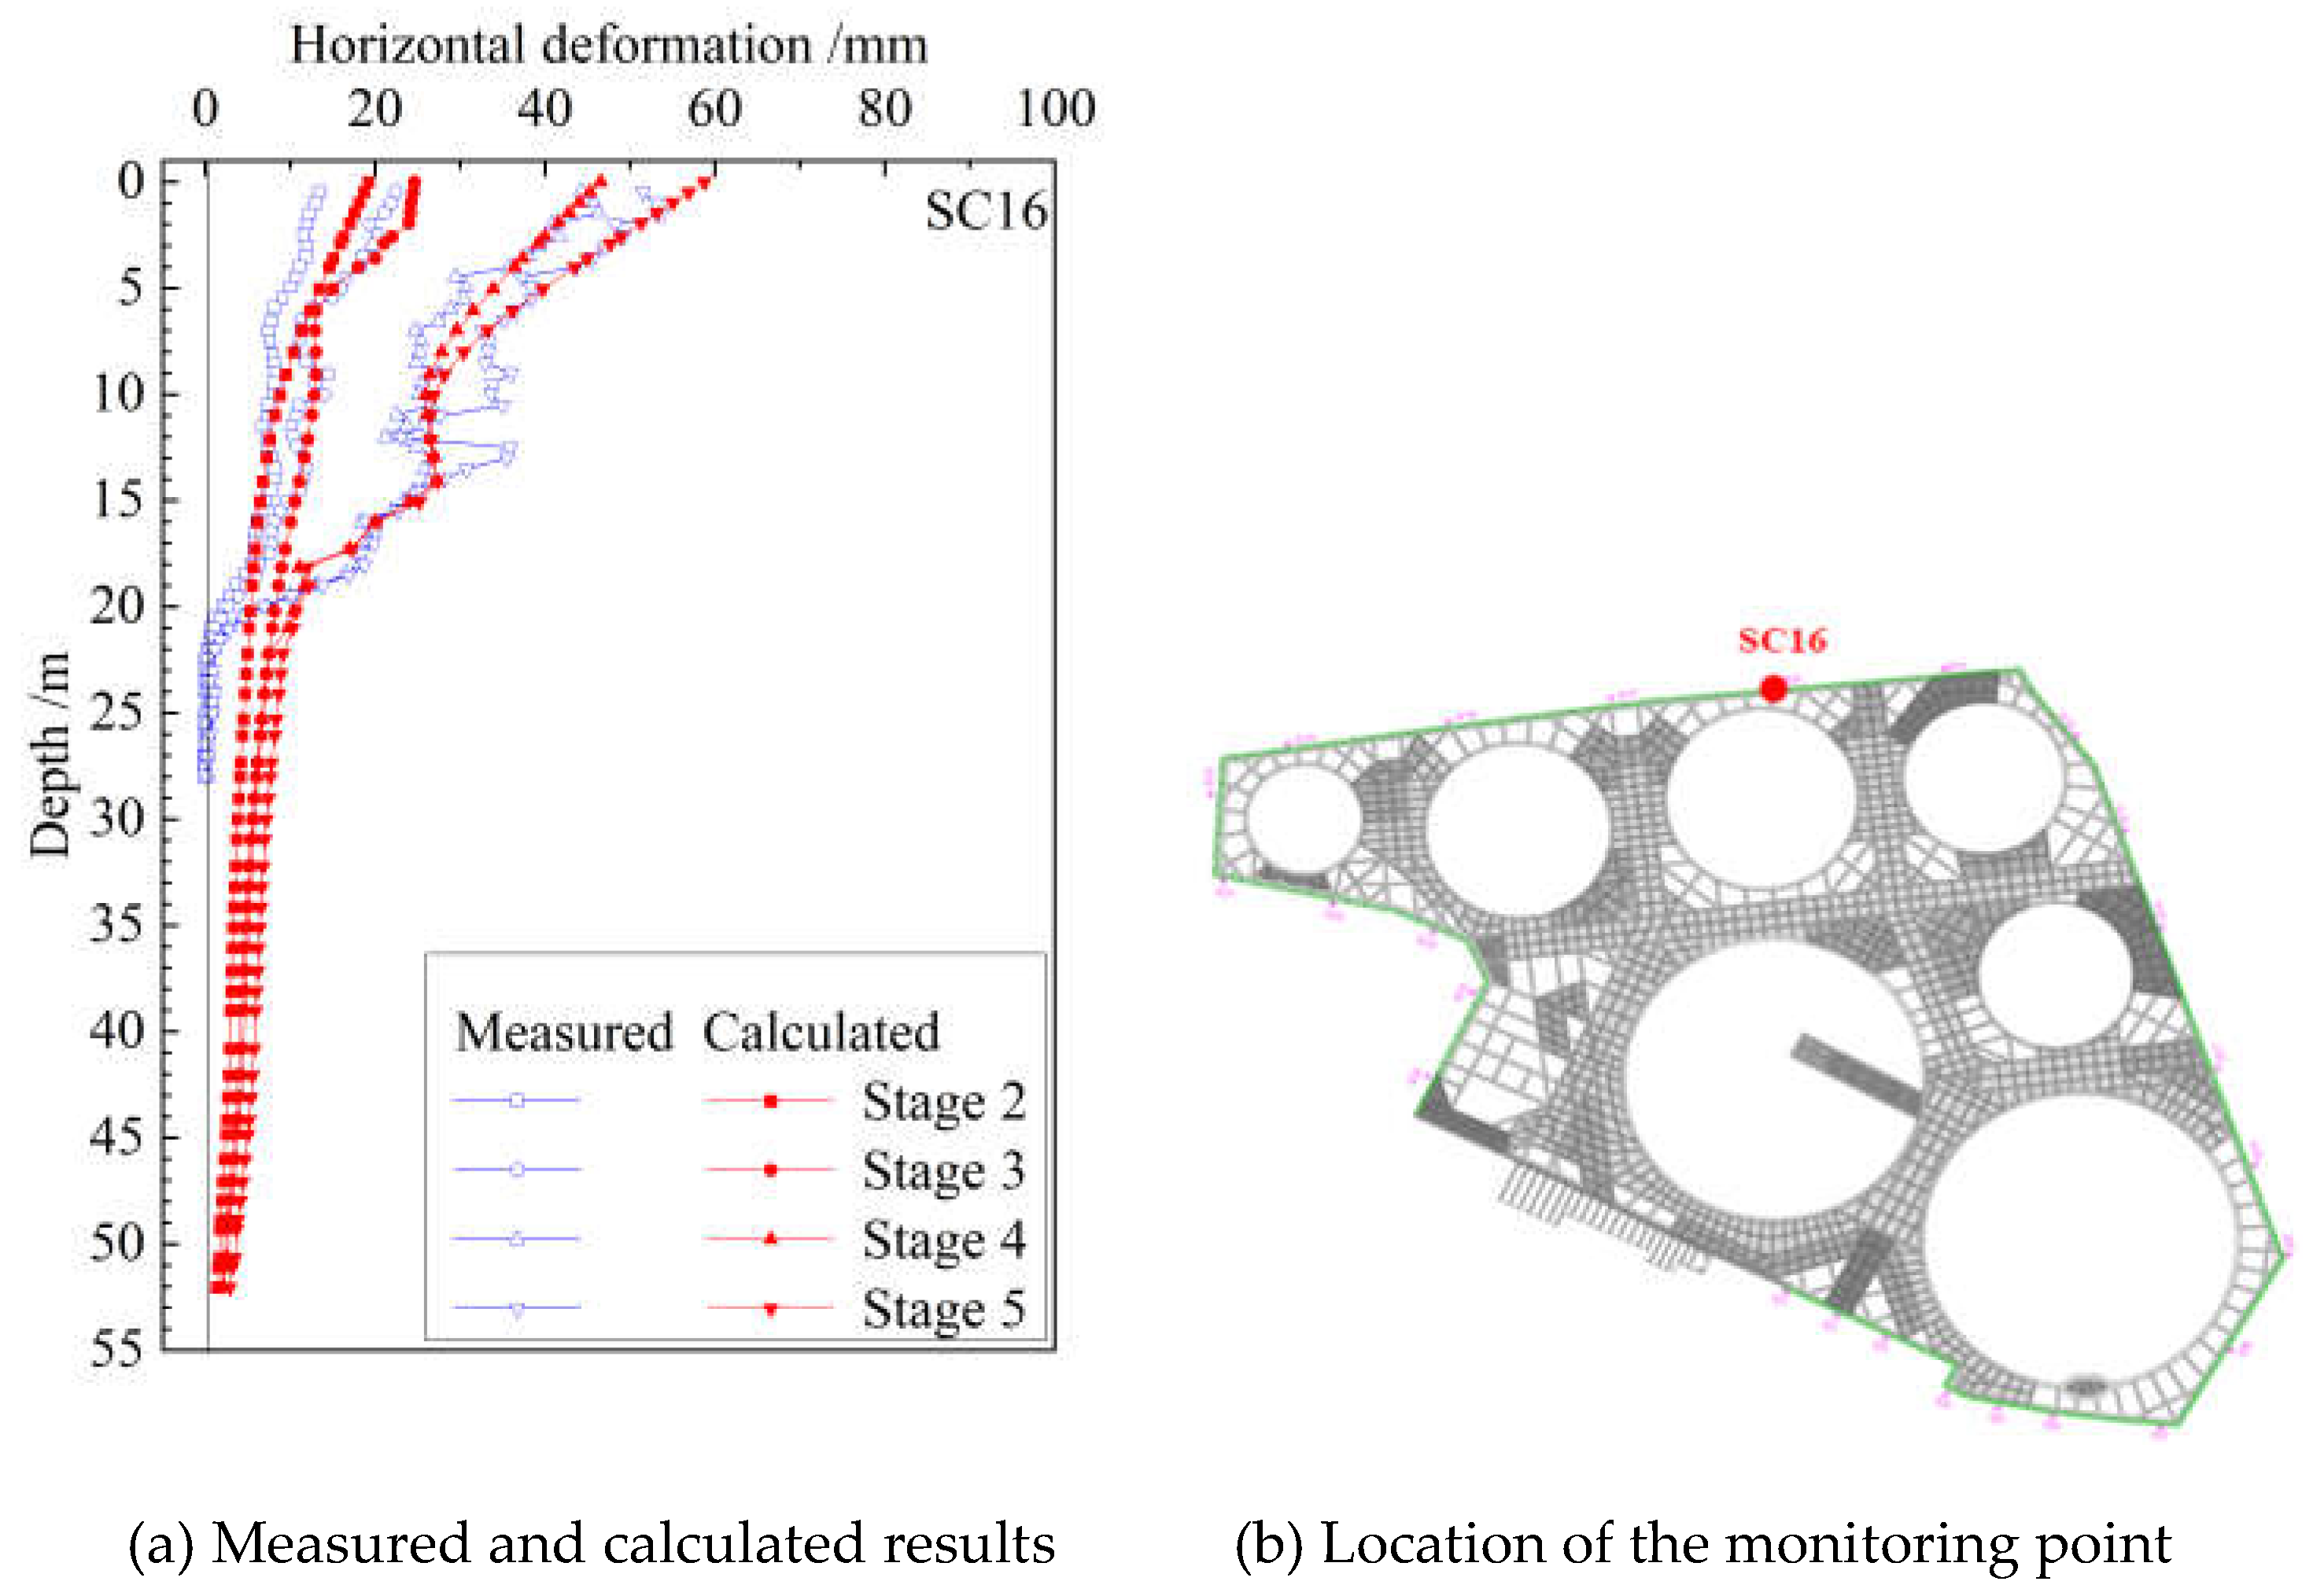
To further validate the effectiveness of the finite element simulation, comparison is made between the measured and calculated horizontal deformation of the underground continuous wall for each construction stage, as shown in
Figure 7. It demonstrates that the deformation obtained from the finite element simulation is basically consistent with the measured one. At each measurement point, the deformation increases progressively with the excavation depth increasing, and the overall distribution of the deformation is cantilever-shaped. From Stage 2 to Stage 5, the calculated maximum horizontal deformation is 19.2mm, 24.7mm, 46.5mm, and 58.7mm, respectively. These values are in close agreement with the measured results, i.e., 13.5mm, 22.4mm, 44.2mm, and 51.5mm for the same stages. This comparison shows that both the mode and specific values of the calculated horizontal deformation of the underground continuous wall align well with the measured results. Above all, the finite element simulation, which uses the HSS constitutive model to consider the small strain behaviour of soil and is based on parameters calibrated for typical soils in Kunming, can reasonably predict the deformation characteristics of the foundation pit engineering.
3. Influence of Temperature on the Ultra-Large Internal Support.
3.1. Background
The excavation area of this project is relatively large, with dimensions ranging from 250m to 300m. The first concrete support is produced in summer, while excavation is completed in winter. Therefore, the influence of seasonal temperature variation on the deformation of the support system must be considered. According to statistics on the monthly temperatures in Kunming, the average temperature in June is approximately 21°C, while in December, the average temperature is about 9°C. This results in an overall temperature decrease of about 12°C during the excavation period. Consequently, the following assumptions are made in the 3D numerical simulation, as shown in
Table 5.
To simulate the temperature variation in the internal support system, thermal expansion coefficient of the concrete structure should be determined first. According to some references, the thermal expansion coefficient of concrete ranges from 8×10⁻⁶/°C to 12×10⁻⁶/°C. Therefore, a value of 10×10⁻⁶/°C is adopted for this simulation. At different construction stages, the corresponding temperature field shown in
Table 5 is input for each concrete member.
3.2. Calculation Principles and Models
During the 3D finite element simulation that considers the soil-structure interaction, the modeling process is complex, the computation is intensive, and the required time is very long. Reasonable soil constitutive model and the corresponding parameters should also be determined [
13]. Thus, it is difficult to directly apply 3D finite element simulation to the engineering design. In contrast, 3D
m-method inherits the analytical idea of the planar elastic resistance method in the specification, with straightforward and clear calculation principle. It can also overcome the limitations of the traditional elastic resistance method and consider the spatial effect. Besides, the calibration of its parameters can refer to the elastic resistance method, which accumulates many engineering experiences in selecting parameters. Hence, the 3D
m-method is more acceptable for engineering designers.
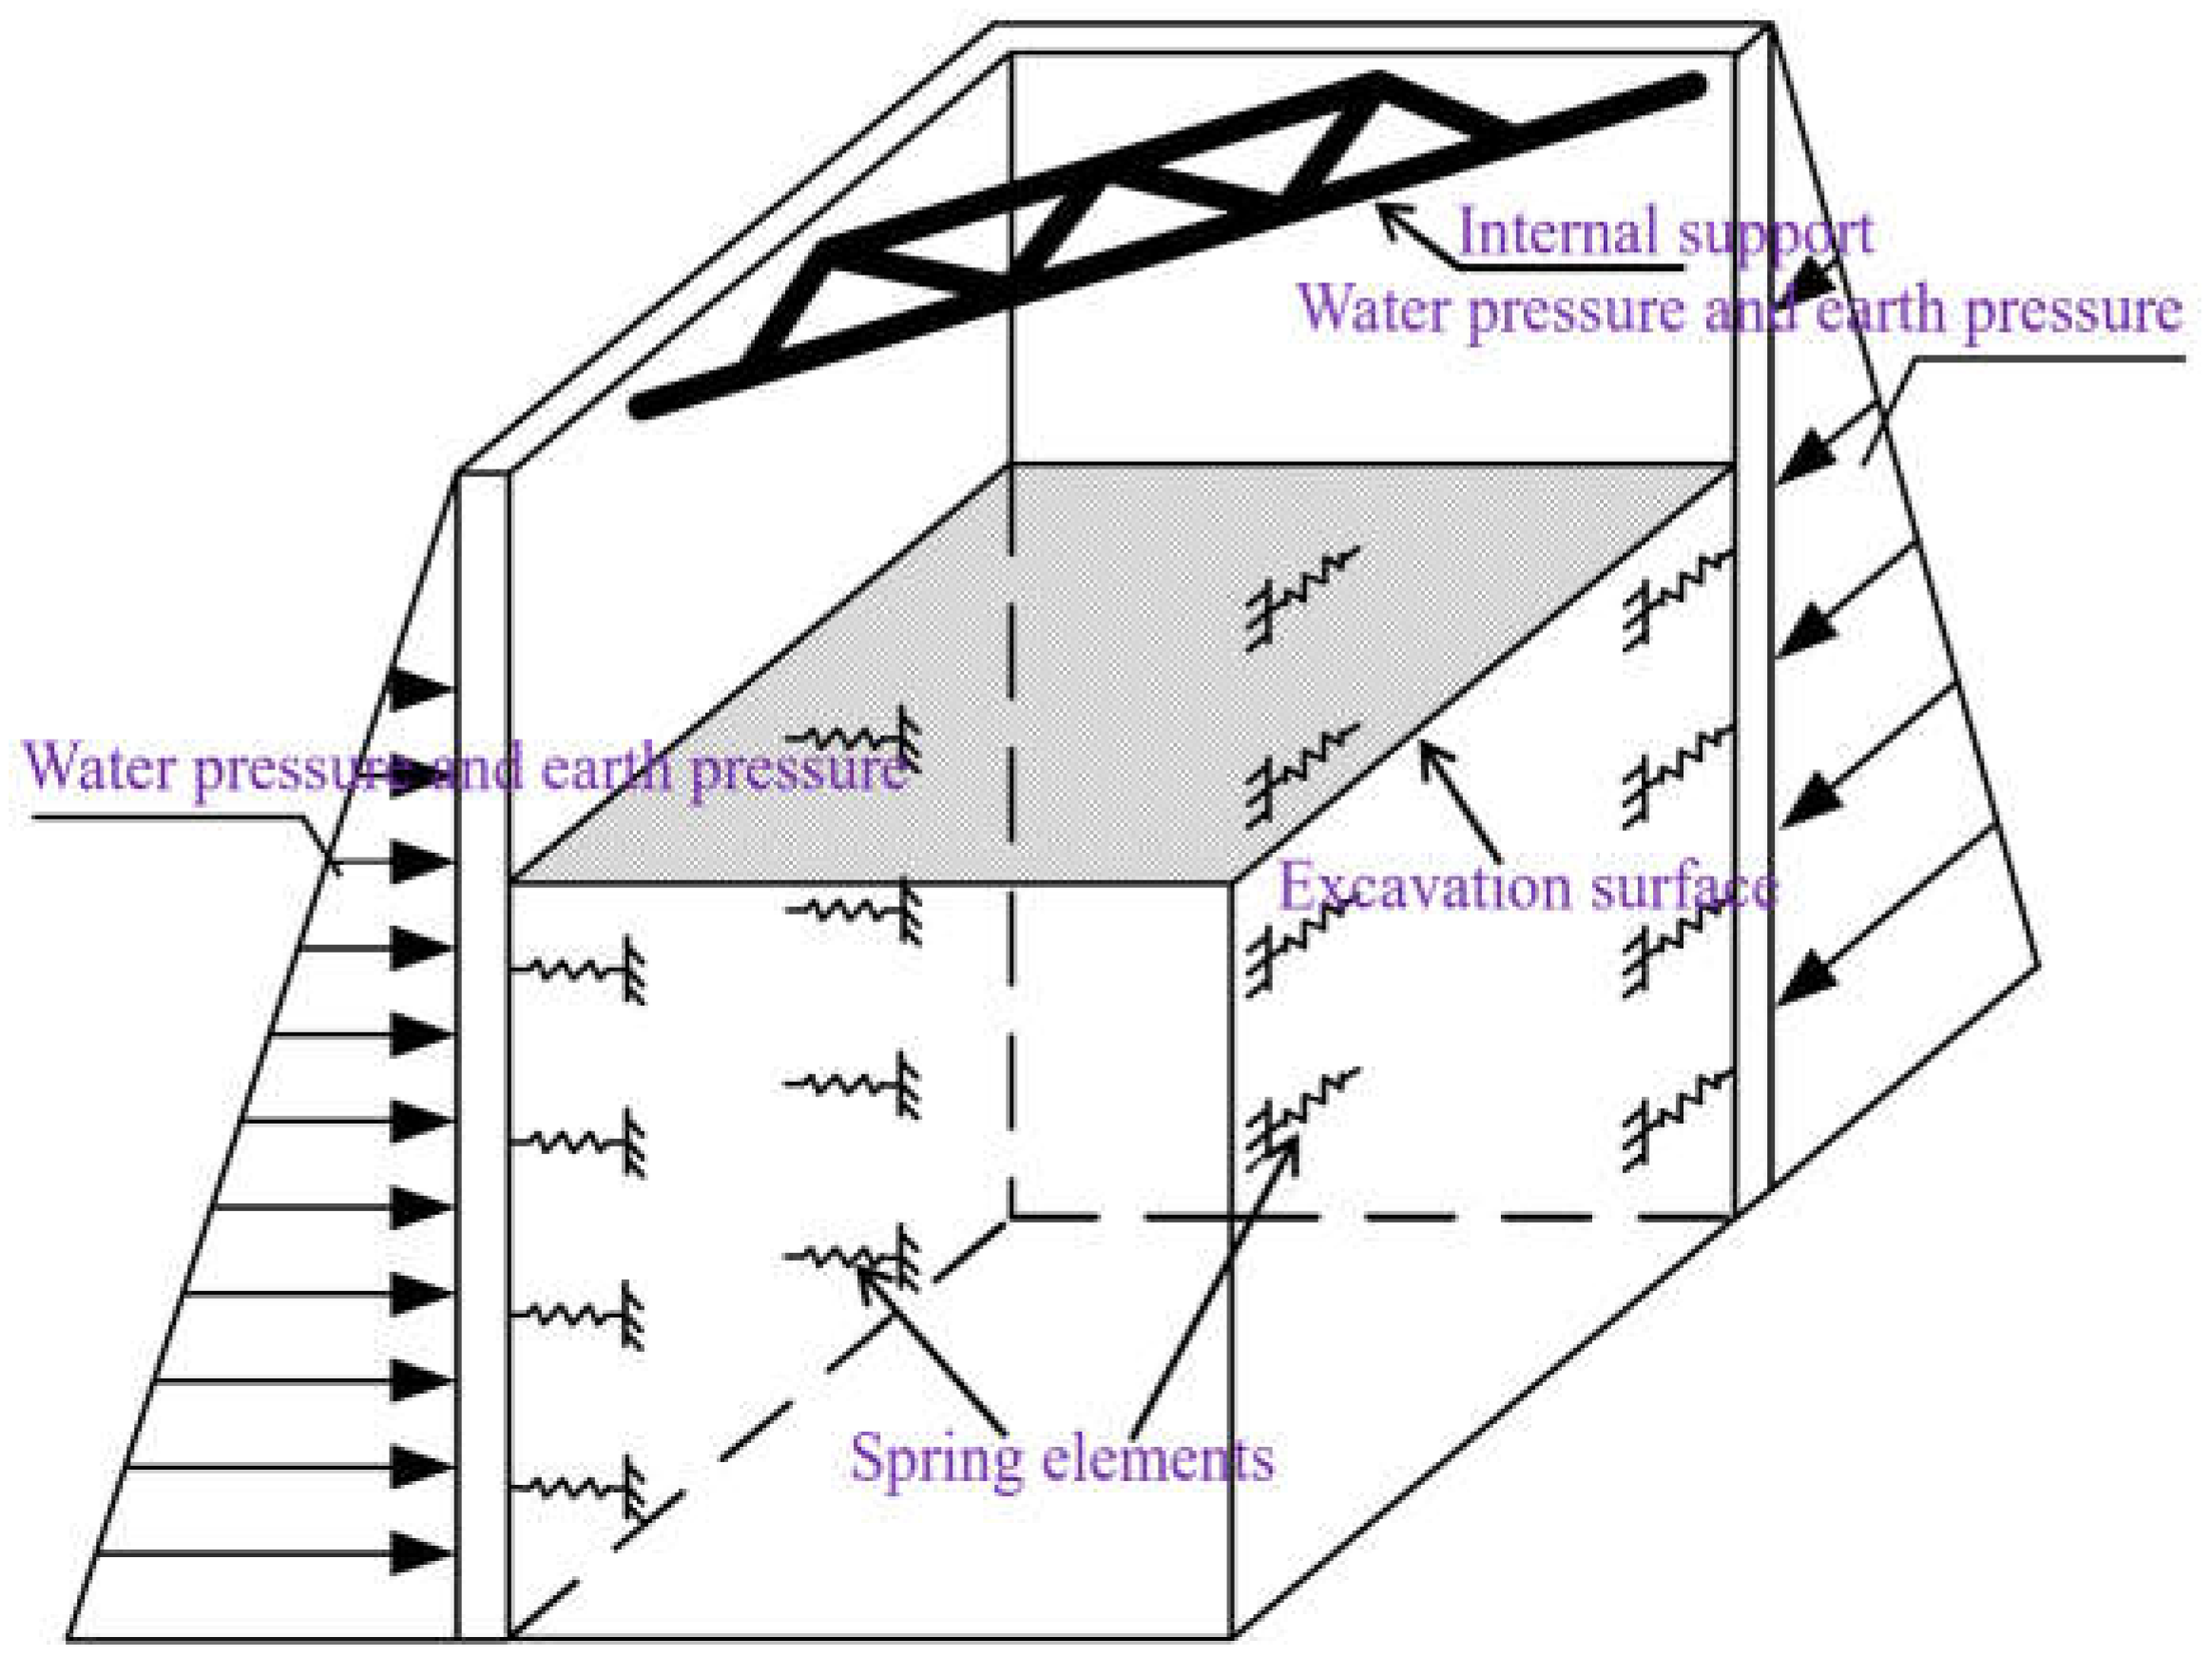
Figure 8 illustrates the principle of the 3D
m-method when the retaining structure of the foundation pit is analyzed. Rectangular foundation pit is taken as an example, while only 1/4 of the model is displayed. The 3D finite element model is established according to the actual design scheme, including the retaining structure, horizontal support system, vertical support system, and soil springs. 3D plate elements are adopted to simulate the underground continuous wall. The horizontal support system, including beams and plates, is simulated by beam elements and 3D plate elements. The interaction between beams and plates are taken into consideration. The vertical support system, which generally includes columns and piles, can also be simulated by beam elements. Based on the construction stages and engineering geological conditions, the water pressure and earth pressure, which are applied by the surrounding soil to the retaining structure, are determined to calculate the internal force and deformation of the retaining structure.
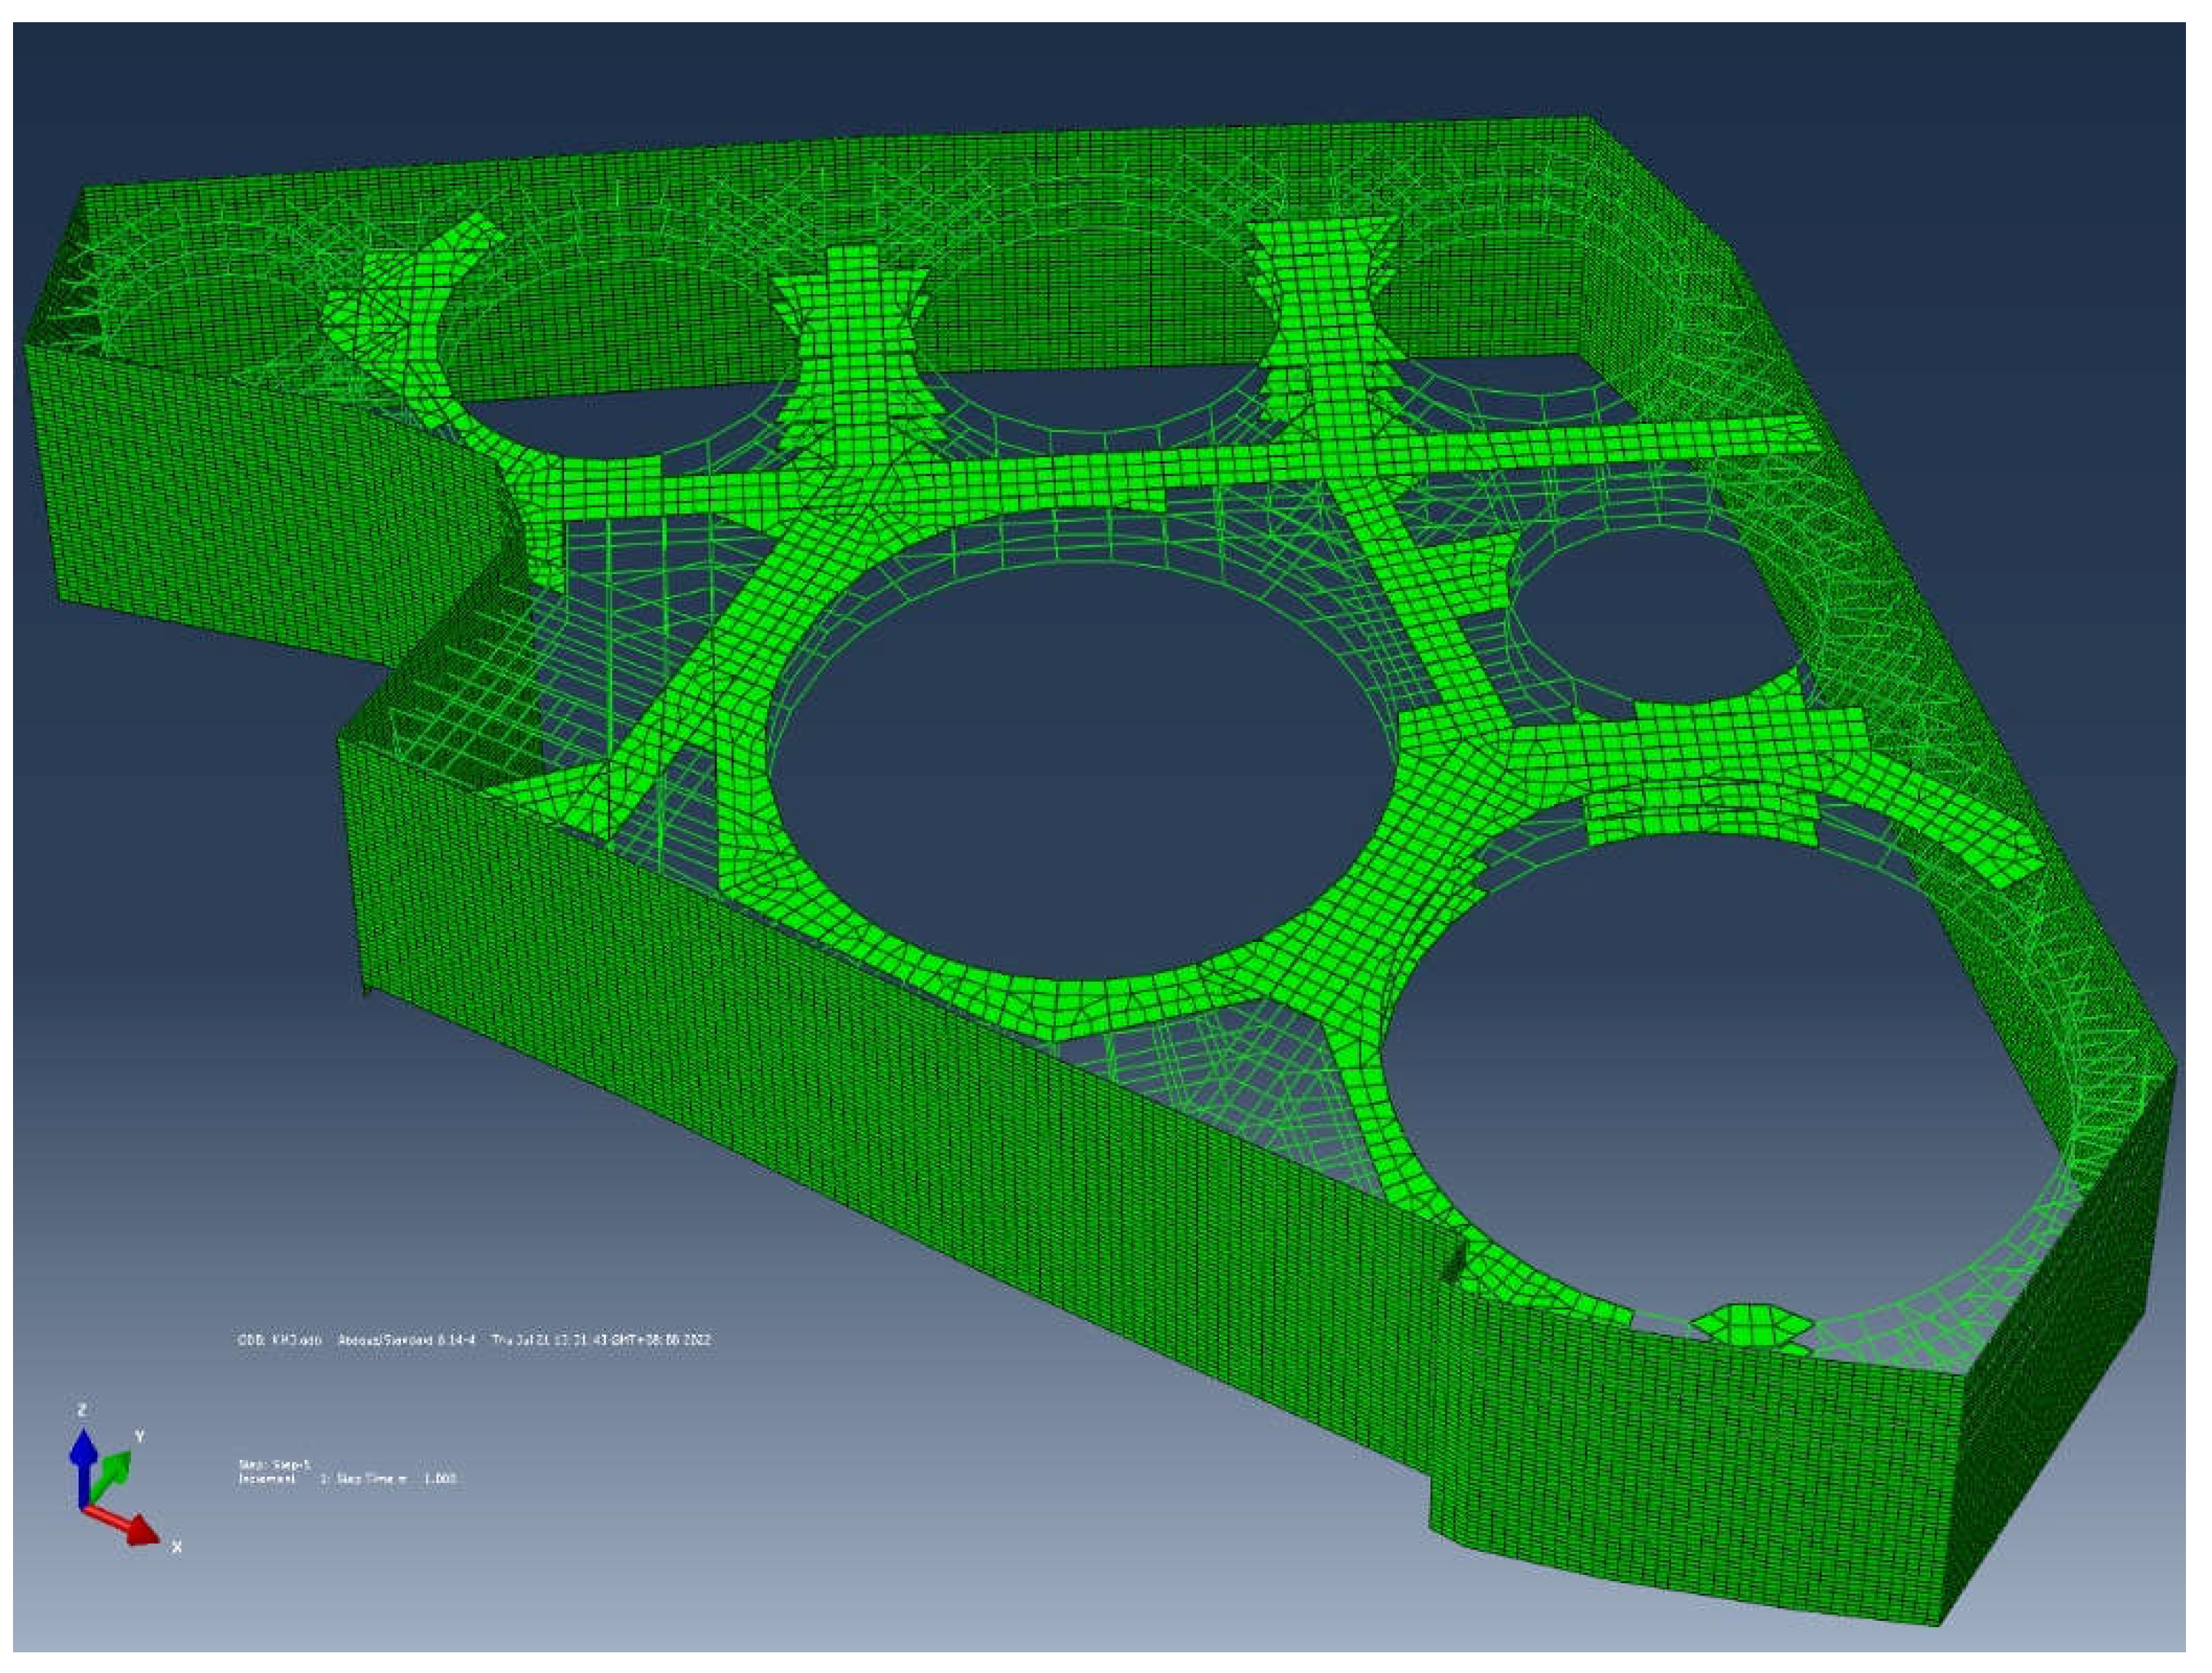
According to the foundation pit of Kunming International Comprehensive Transportation Hub, a 3D finite element model is established using ABAQUS. This model considers the interaction between the retaining structure and internal support system. The underground continuous wall is simulated by four-node plate elements (S4), and the reinforced concrete supports adopt the beam elements (B31). The horizontal resistance of soil inside the foundation pit is simulated by soil spring elements. One end of the spring element is fixed, while the other end is coupled to the node of the underground continuous wall elements. The water pressure and earth pressure outside the foundation pit are calculated separately. A surface overload of 20kPa is applied outside the foundation pit. The 3D integrated model of the retaining structure is shown in
Figure 9. Information of the main support members has been provided in
Table 2, while parameters of different soil layers are given in
Table 1.
In ABAQUS, six analytical steps are established to simulate the excavation process, as shown in
Table 6. During the excavation, the stiffness variation of the soil spring in different analytical steps is controlled by user subroutine UFIELD, while the variation of the water pressure and earth pressure is achieved via user subroutine DLOAD. In the general area of the foundation pit, the excavation depth is 18m. The excavation process is simulated by modifying the load and spring stiffness at different positions on the retaining structure. This modification is conducted by developing user subroutine in ABAQUS.
3.3. Calculation Results and Analysis
3.3.1. Overall Calculation Results
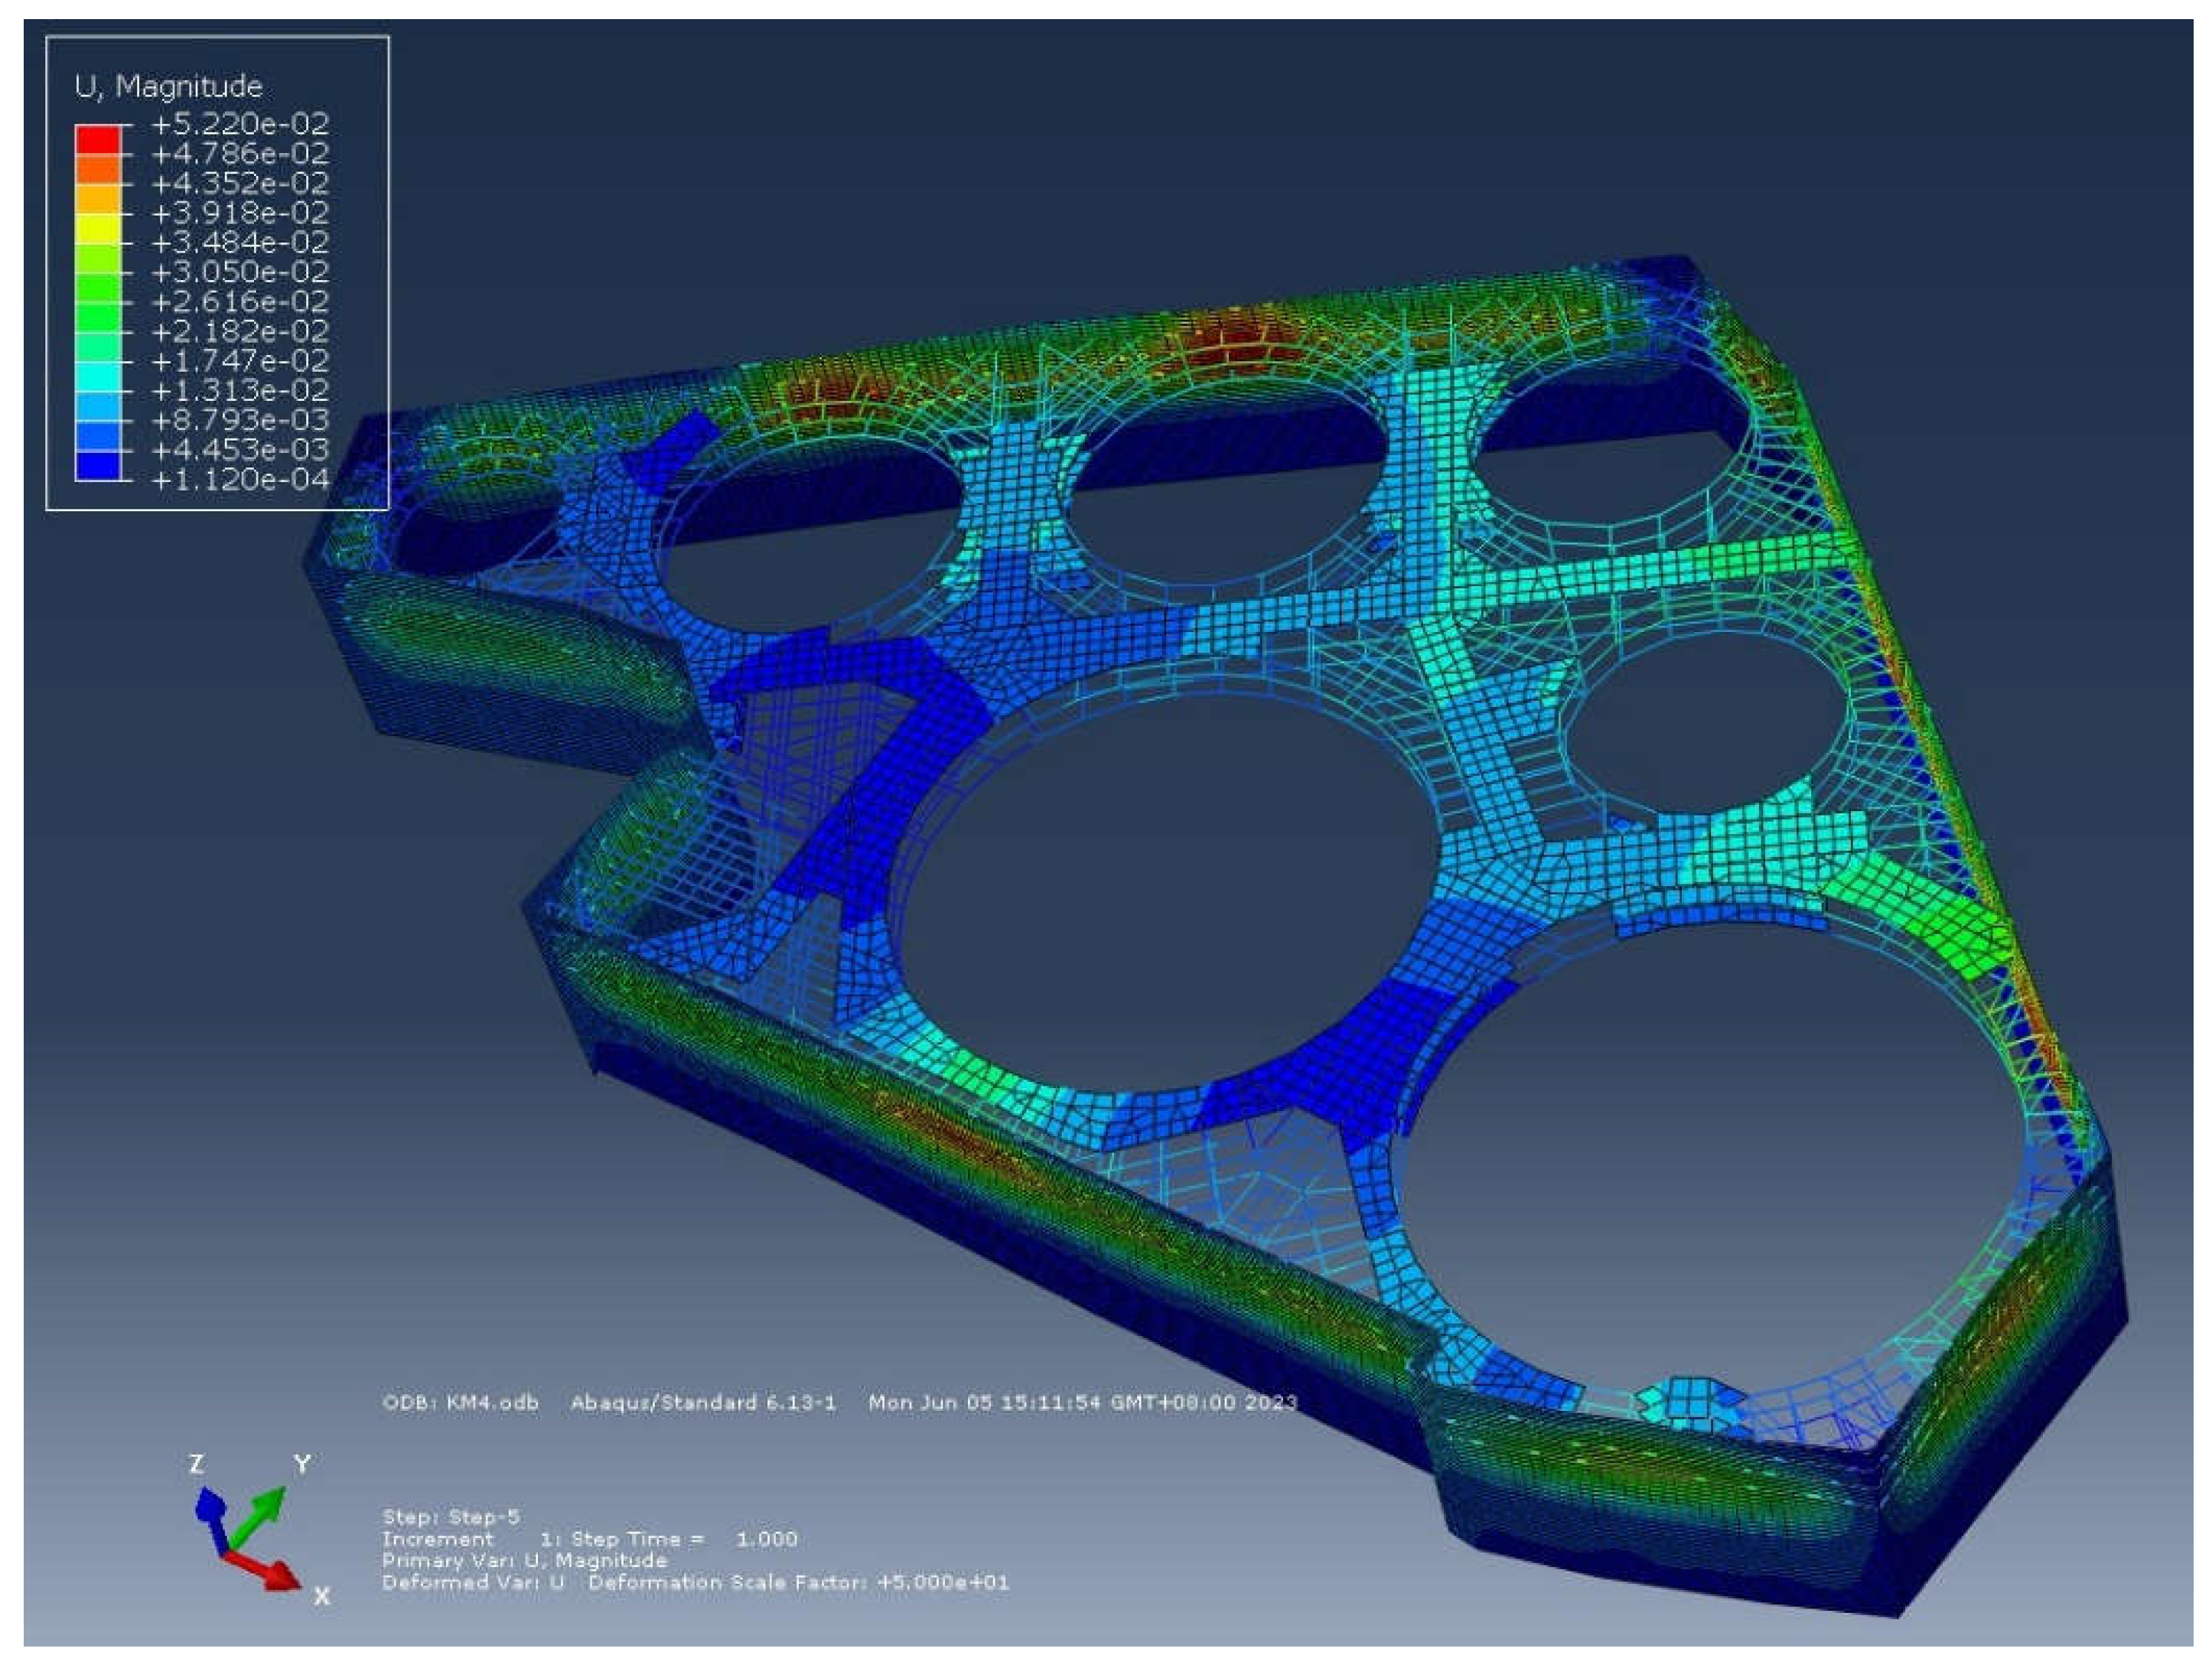
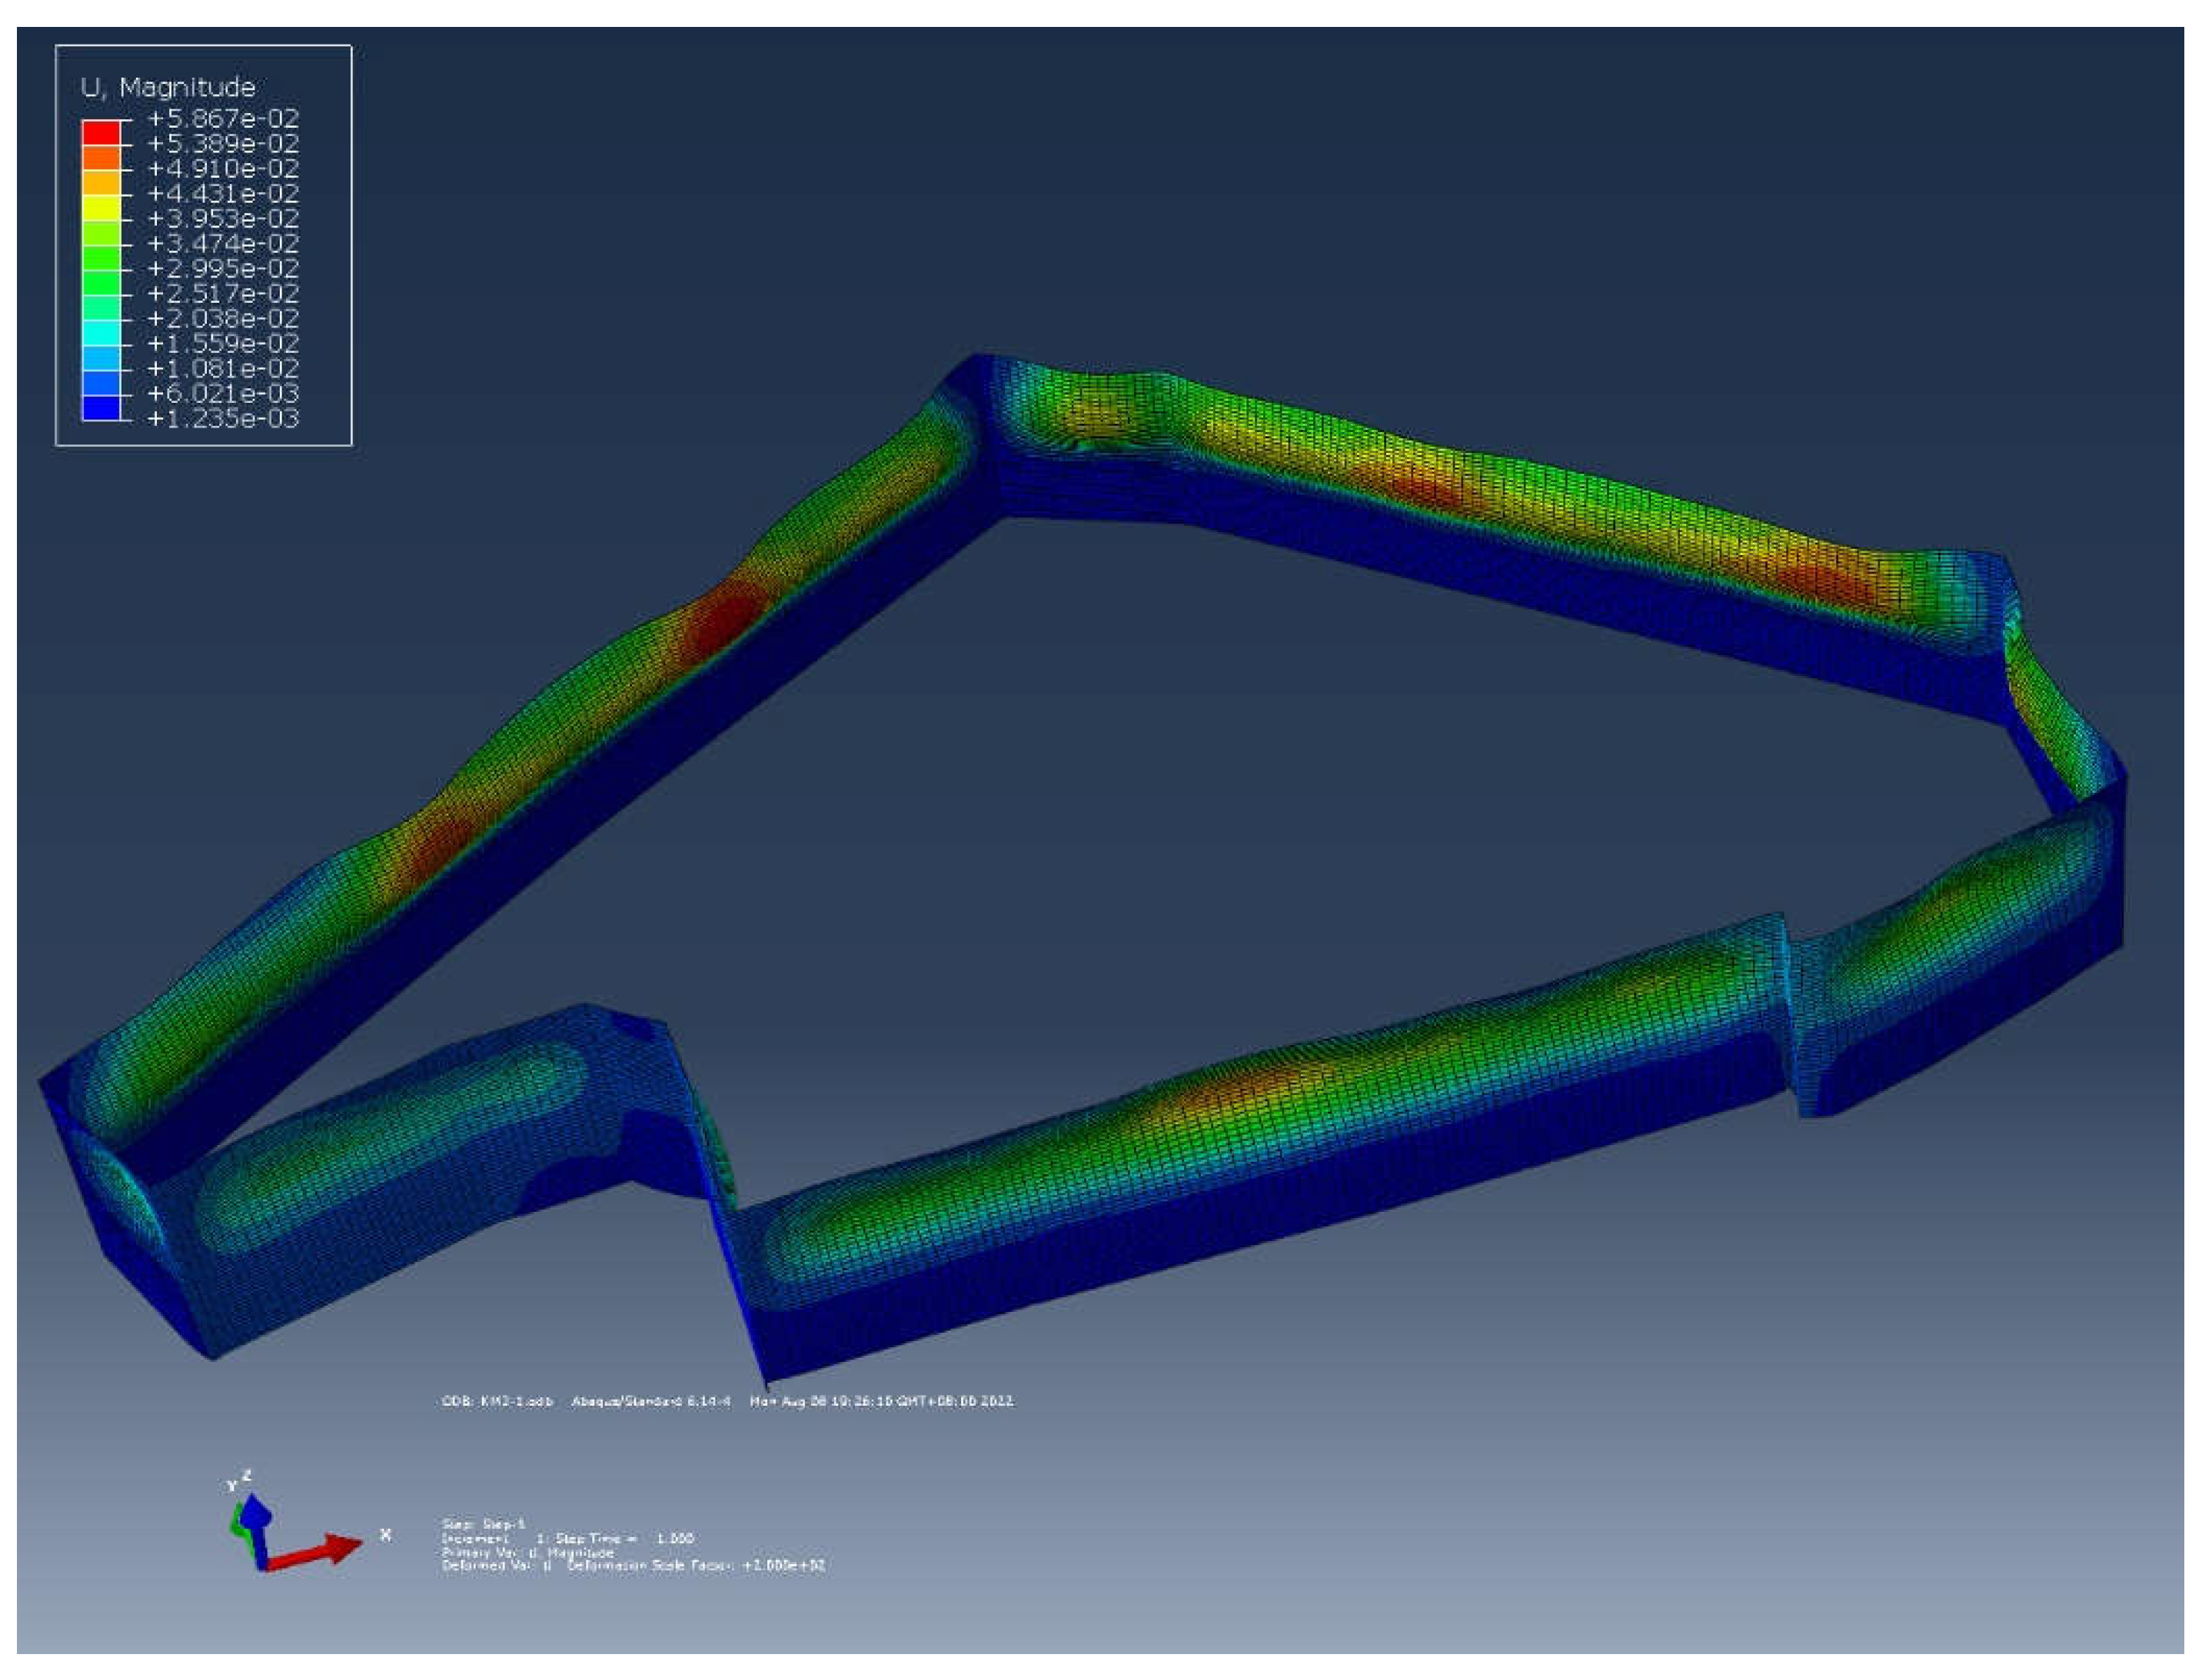
The overall deformation of the internal support system is shown in
Figure 10. Deformation of the retaining structure, considering the influence of temperature, is shown in
Figure 11. It can be observed that the deformation of the retaining structure exhibits a clear spatial effect. The deformation near the corner is minimal, while the deformation in the central region is relatively obvious. Meanwhile, for the region where there exists counter support, the deformation is small. If the ring support is close to the foundation pit edge, the retaining structure has large deformation.
If the temperature effect is ignored, the maximum deformation of the retaining structure is 52.2mm; whereas this value increases to 58.6mm if the temperature effect is taken into consideration. At the top of the retaining structure, the deformation increase is more obvious after the temperature effect is considered, and even the deformation mode exhibits noticeable difference. The temperature effect is the most pronounced on the first support. This support is constructed in summer, and when the foundation pit is excavated completely, it turns into winter. The average temperature drops from 21°C to 9°C. In the case of constant force, the temperature variation brings a certain amount of shrinkage to the support, which further increases the deformation at the top of the retaining structure.
3.3.2. Horizontal Deformation of the Retaining Structure
Figure 12 compares the horizontal deformation of the underground continuous wall with and without considering the temperature effect. From the measured results, it can be observed that the horizontal deformation reaches the maximum at the top of the wall, and the overall distribution of the deformation is cantilever-shaped. This is because there is a 4~5m thick weak soil layer in the shallow ground, and the first support is approximately 4m below the ground surface. For all the monitoring points, the deformation values increase gradually with the excavation depth increasing (from Step 1 to Step 3). Note that the excavation depth of each step is always 5~6m. However, due to the presence of the weak soil layer and the location of the first support, the deformation increment at Step 1 is the largest for all the monitoring points. Additionally, there is peaty soil (Layer ④
3) at the true north, northeast and southeast sides of the foundation pit, so that the deformation increment corresponding to these regions is also relatively large at Step 3. The foundation pit has larger span at the north side and east side (approximately 260m and 230m, respectively), while the wall is relatively thin (1m) and its embedded depth is shallow. Consequently, the spatial effect and support stiffness have significant influence on the horizontal deformation of the soil outside the foundation pit. The maximum horizontal deformation at the north and east sides can reach up to 47mm and 46mm, respectively. These maximum values usually appear at the middle part of the large side span of the foundation pit and near the weak points of the ring support. The ratios of the maximum horizontal deformation to the excavation depth (
δhmax/
H) at the north and east sides are 0.31% and 0.29%, respectively, indicating that the deformation of the underground continuous wall is controlled effectively.
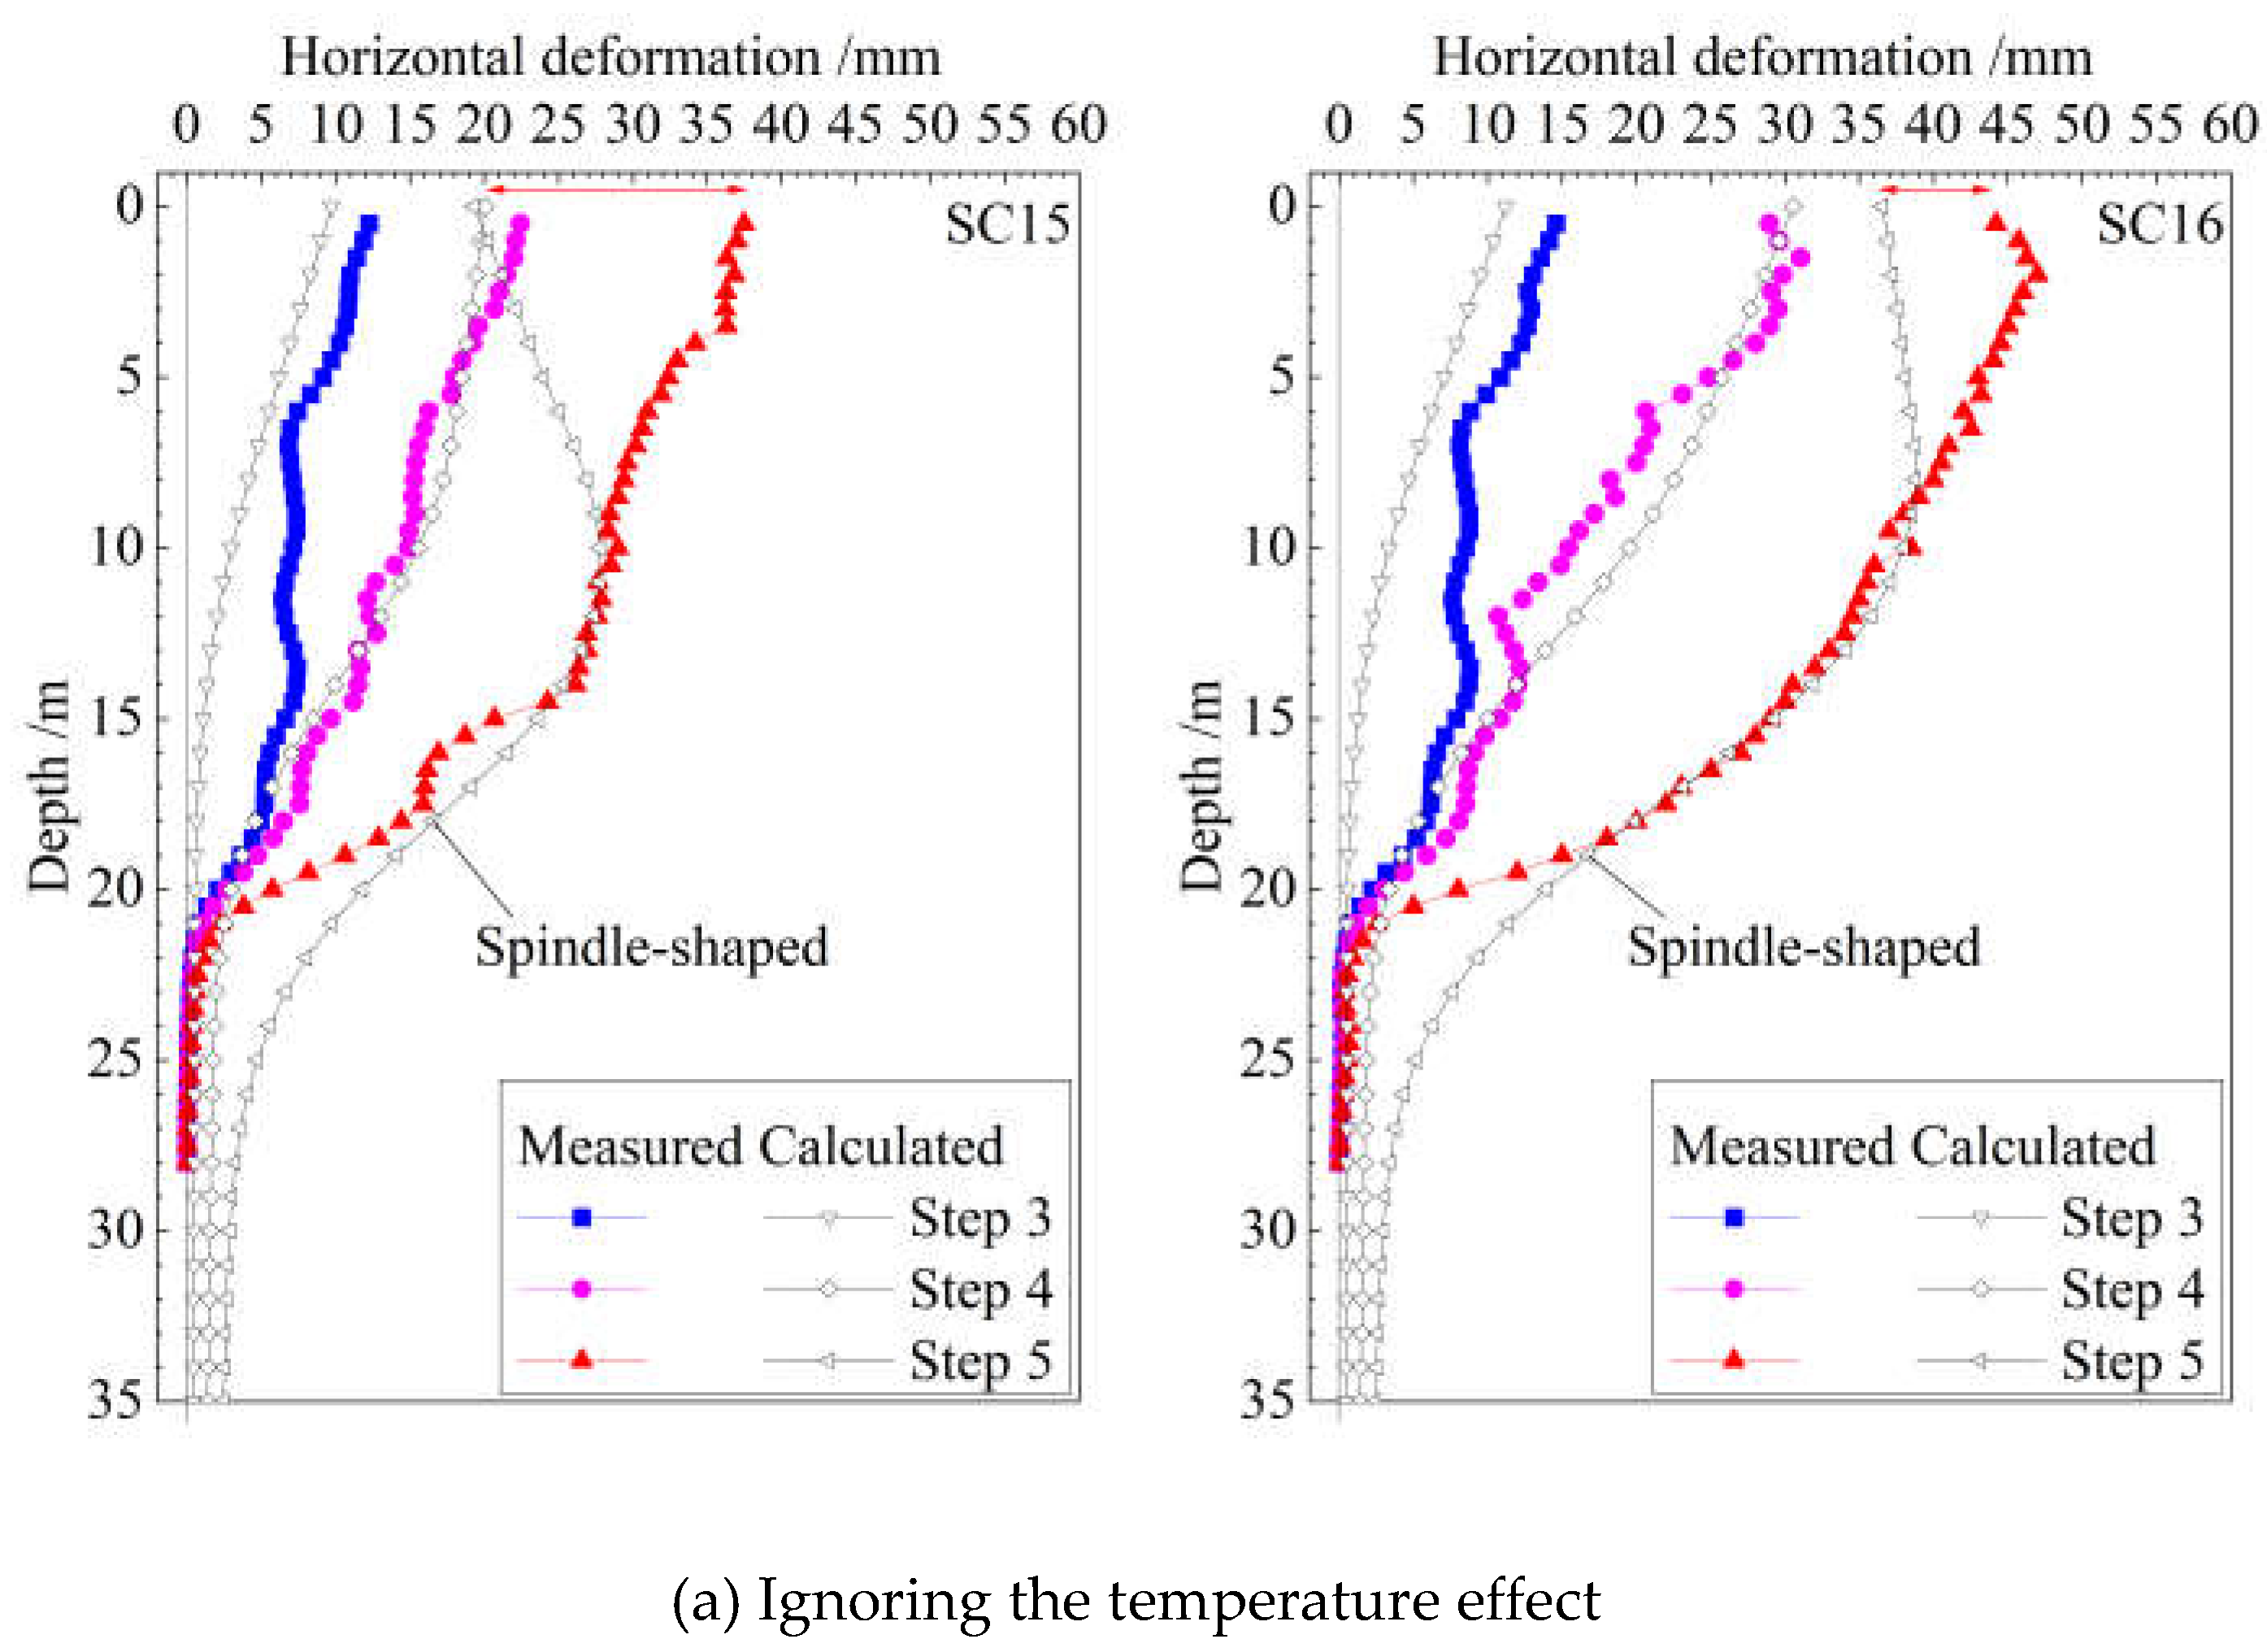
When the temperature effect is ignored, comparison between the measured and calculated deformation curves is shown in
Figure 12(a). From the overall characteristics of the measured results, it can be found that the deformation reaches the maximum at the top of the retaining structure, and decreases gradually with depth. However, according to the calculated results, the deformation at the wall bottom is the smallest, while the largest deformation is located at the excavation surface, showing a spindle-shaped deformation curve. There is a certain degree of deviation between the measured and calculated results.
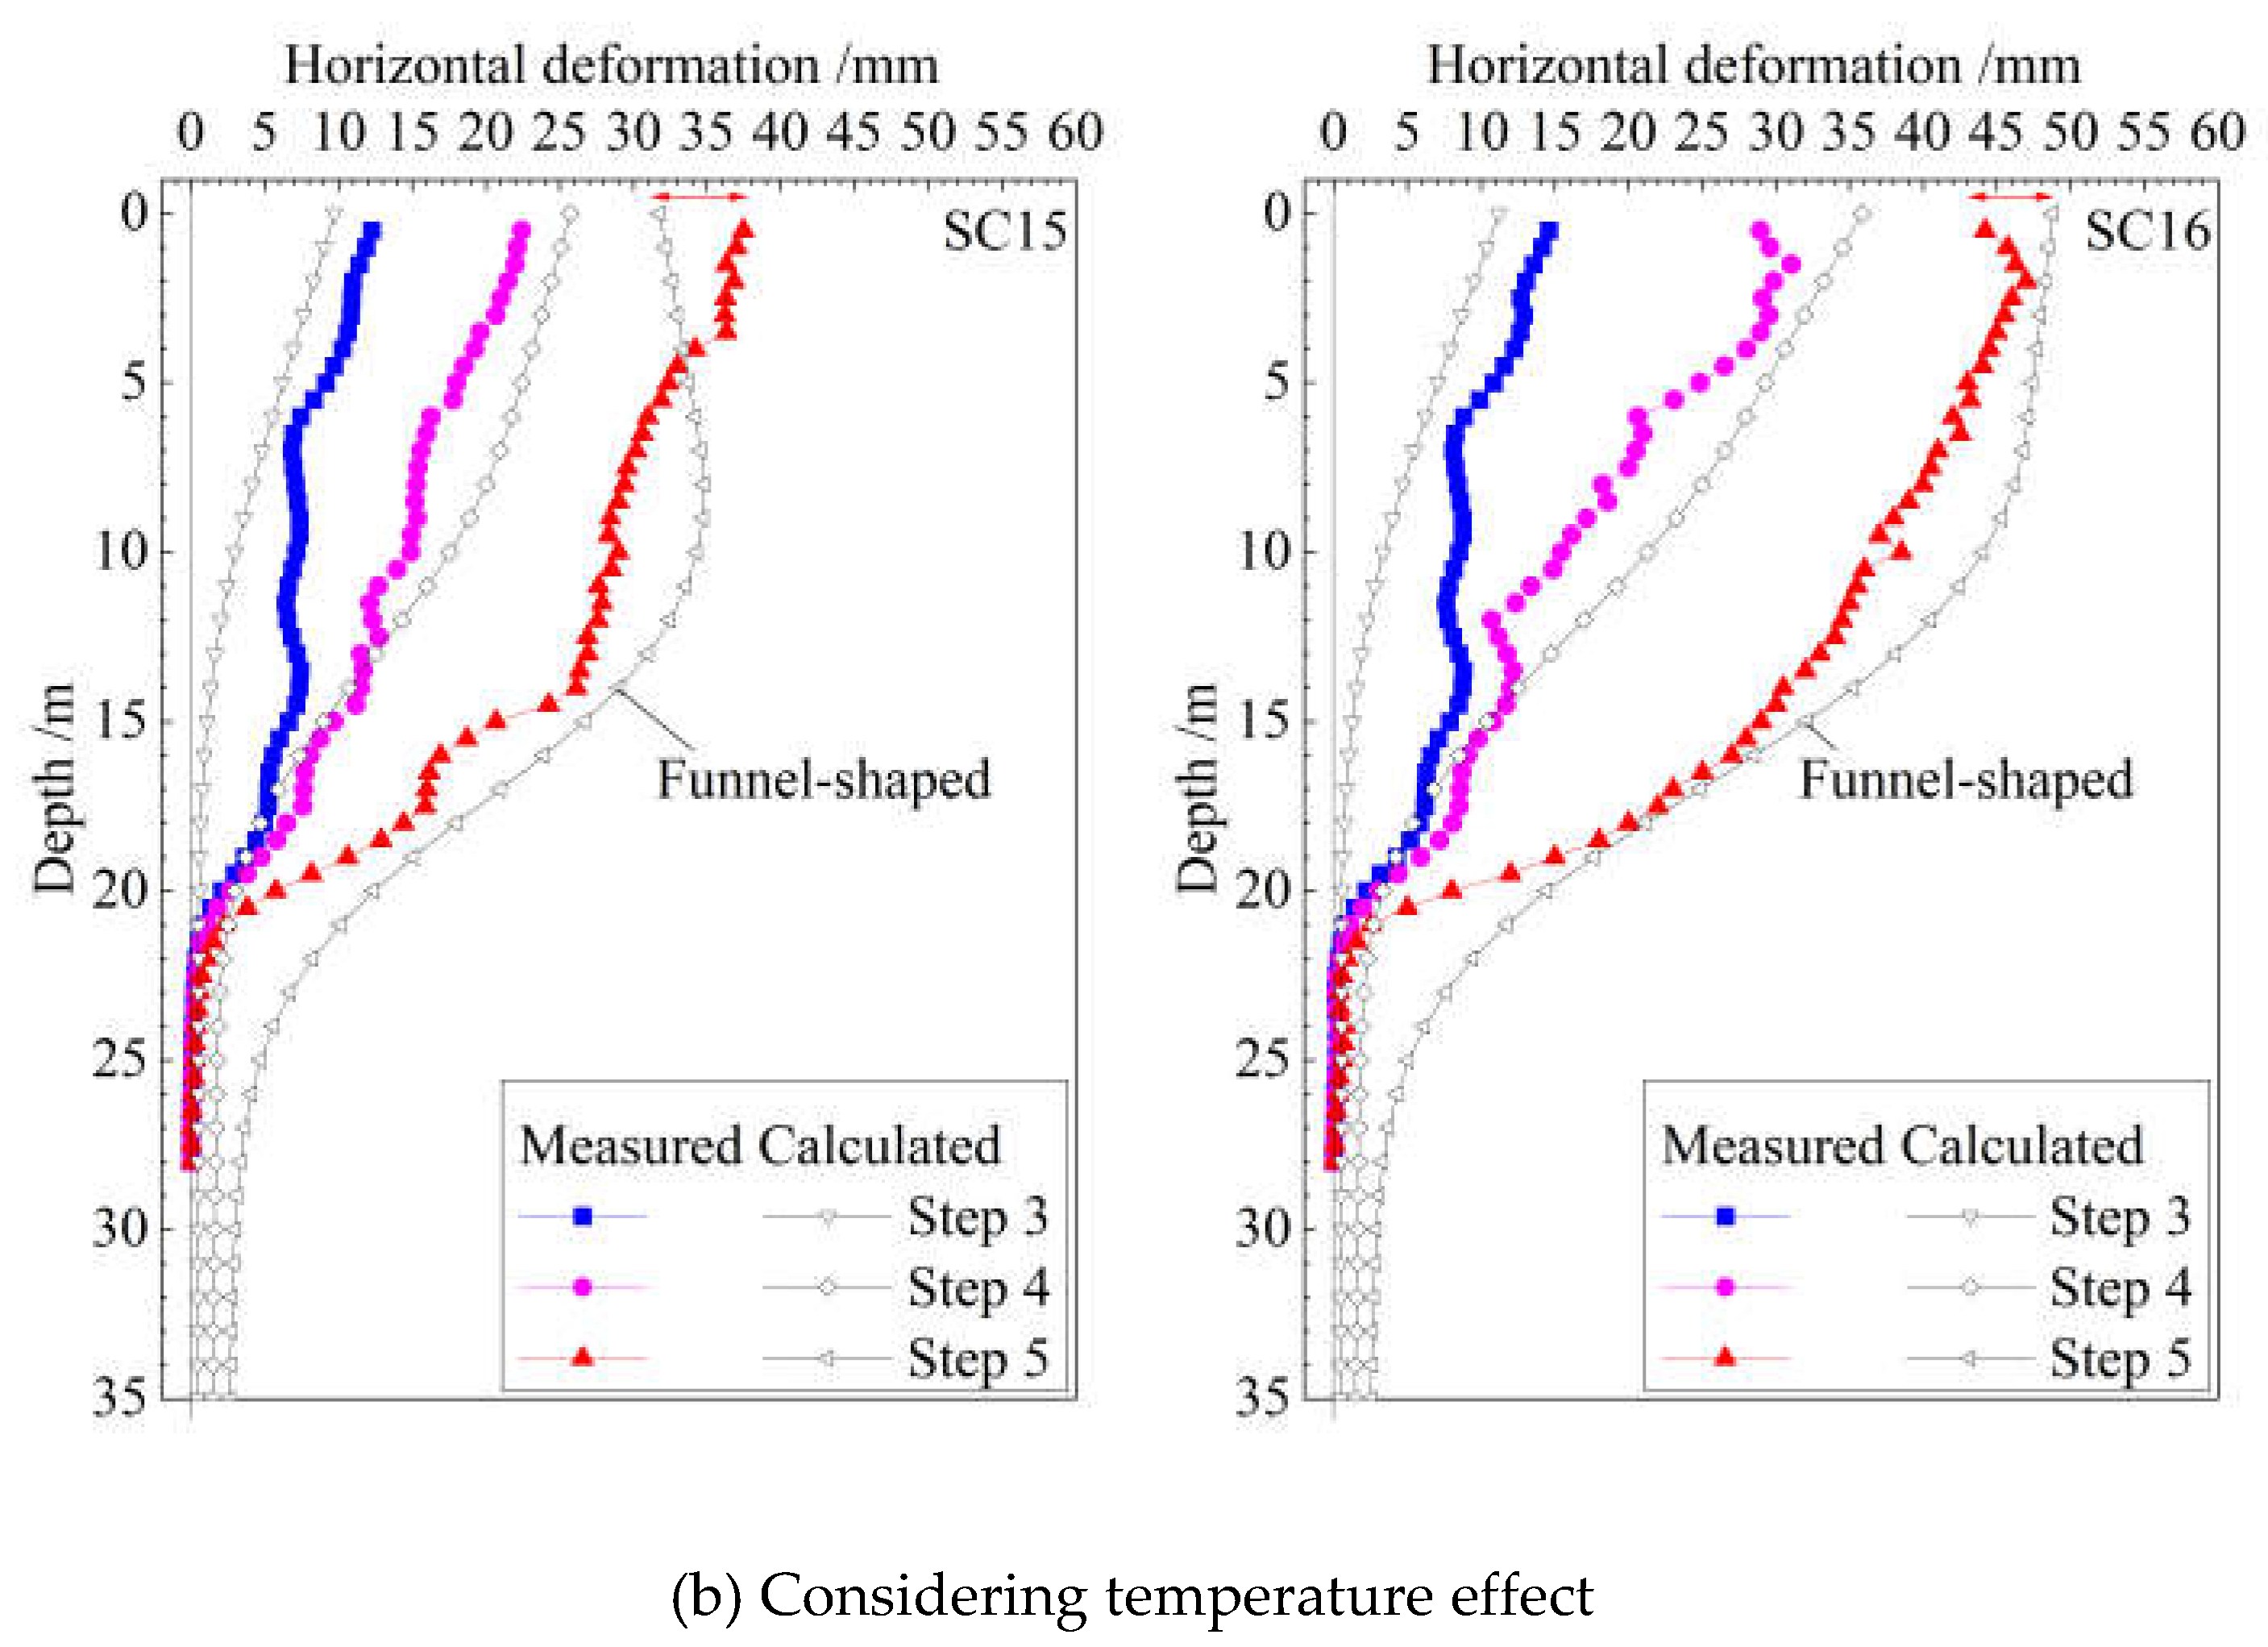
Figure 12(b) shows the comparison considering the temperature effect. From the initial construction to the completion of the foundation pit excavation, the temperature of the first concrete support decreases by 12°C, while the temperature decrease in the second and third supports is 8°C and 4°C, respectively. As a result, different degrees of shrinkage occur to the supports, and the deformation at the top of the retaining structure is significantly larger than the calculated result without considering the temperature effect.
The above analysis shows that after taking the temperature effect into account, the calculated deformation of the retaining structure agrees well with the measured results. Similar conclusion can be drawn for the deformation of the foundation pit. Therefore, when the foundation pit scale is very large and the construction period is long, the influence of the seasonal temperature variation should be considered into the analysis of the force and deformation of the retaining structure.
3.3.3. Axial Force of the Internal Supports
Table 7 summarizes the calculated maximum axial force of each support. This table shows that the variation in the axial force before and after considering the temperature effect is uncertain. For the first and second supports, the axial forces decrease when the temperature effect is considered; while the axial force in the third support slightly increases. During the excavation process, the shrinkage of the first and second supports induced by the temperature variation is more pronounced. The external water pressure and earth pressure will be transferred through the retaining structure to the third support and the passive earth pressure zone. Consequently, the axial force of the third support increases, and the soil in the passive earth pressure zone is compressed further, which finally leads to greater deformation of the retaining structure.
4. Conclusions
(1) Based on the ultra-large deep foundation pit of Kunming International Comprehensive Transportation Hub, a finite element model considering the interaction between soil and retaining structure is established. The model can reasonably simulate the deformation of the foundation pit, with the relative error between the measured and calculated results being smaller than 6%. The calculation can provide valuable reference for designing the retaining structure.
(2) Analysis shows that, because the first support is approximately 4m below the ground surface, the retaining structure deforms like a cantilever beam, while the ground surface settlement contour outside the foundation pit exhibits a triangular distribution.
(3) Influence of the seasonal temperature variation on the deformation of the underground continuous wall is analyzed by 3D finite element simulation. It is found that after the temperature effect is considered, the deformation curve of the underground continuous wall turns from spindle-shaped into funnel-shaped; and the deformation at the top significantly increases, which agrees better with the measured results.
(4) Considering the temperature effect will reduce the axial forces in the first and second supports, but slightly increase the axial force in the third support.
(5) For ultra-large foundation pit engineering, the temperature effect should be considered into the analysis of the internal force and deformation of the retaining structure.
Author Contributions
Conceptualization, H.H. and Y.T.; methodology, H.H. and Z.X.; software, H.H. and Z.X.; validation, H.H., Y.T. and N.Z.; writing—original draft preparation, Y.T. and N.Z.; writing—review and editing, H.H. and Z.X.; visualization, H.H. and N.Z.; supervision, X.D. and H.G.; funding acquisition, H.H. and Y.T. All authors have read and agreed to the published version of the manuscript.
Funding
This research was funded by Science and Technology Plan of Ministry of Housing and Urban-Rural Development of China, grant number 2022-S-031; and National Natural Science Foundation of China, grant number 51908010.
Data Availability Statement
The data, models, and code that support the findings of this study are available from the corresponding author upon reasonable request.
Conflicts of Interest
The authors declare that the research was conducted in the absence of any commercial or financial relationships that could be construed as a potential conflict of interest.
References
- Li, M.G.; Xiao, X.; Wang, J.H.; Chen, J.J. Numerical study on responses of an existing metro line to staged deep excavations. Tunn. Undergr. Space Technol. 2019, 85, 268–281. [Google Scholar] [CrossRef]
- Burland, J.B. “Small is beautiful” - the stiffness of soils at small strains. Can. Geotech. J. 1989, 26(4), 499–516. [Google Scholar] [CrossRef]
- Benz, T. Small-strain stiffness of soils and its numerical consequences. Ph.D. Thesis, Institute of Geotechnical Engineering, University of Stuttgart, Stuttgart, Germany, 2007. [Google Scholar]
- Chen, Z.H.; Ruan, Y.F.; Wang, P.; Zhu, Q.; Yan, M. Parameter value of HSS model for lacustrine sedimentary soft soil. China Earthquake Eng. J. 2023, 45(1), 74–85. [Google Scholar]
- Zong, L.D.; Xu, Z.H.; Weng, Q.P.; Wang, W.D. Application of small strain constitutive model in the analysis of a ultra large and deep excavation. Chin. J. Undergr. Space Eng. 2019, 15(S1), 231–242. [Google Scholar]
- Zheng, G.; Gu, X.L. Simple method for calculating temperature stress in horizontal strut of foundation pit considering strut-pile-soil interaction. China Civ. Eng. J. 2004, 35(3), 87–89. [Google Scholar]
- Liu, H.Y.; Nagula, S.; Jostad, H.P.; Piciullo, L.; Nadim, F. Considerations for using critical state soil mechanics based constitutive models for capturing static liquefaction failure of tailings dams. Comput. Geotech. 2024, 167, 106089. [Google Scholar] [CrossRef]
- Yao, Y.P.; Zhou, A.N. Non-isothermal unified hardening model: a thermo-elasto-plastic model for clays. Géotechnique 2013 63(15), 1328-1345. [CrossRef]
- Hu, Q.; Ling, D.S.; Cheng, Z.H.; Chen, Z. Effects of temperature stress on diaphragm wall of circular deep foundation pit. Chin. J. Geotech. Eng. 2013, 35(11), 2139–2143. [Google Scholar]
- Lu, P.Y.; Han, L.J.; Yu, Y. Finite element analysis of temperature stress in strut of foundation pit. Rock Soil Mech. 2008, 29(5), 1290–1294. [Google Scholar]
- Hu, H.X.; Li, C.L.; Xu, Z.H., Gui, Y.; Zong, L.D.; Shi, J.B. Calculation example of full cycle carbon emission of super deep foundation pit and carbon reduction measures. Low-Carbon Mater. Green Constr. 2023, 1, 11. [CrossRef]
- Ou, Z.Y. Deep Excavation Engineering Analysis, Design Theory, and Practice. Taipei: Science and Technology Books Co., Ltd., 2004.
- Li, J.; Xu, Z.; Wang, W.D. Three-dimensional finite element analysis of effects of foundation underpinning on deformation control of existing buildings adjacent to a deep excavation. China J. Geotech. Eng. 2017, 39(S2), 157–161. [Google Scholar]
Figure 1.
Site Plan of the foundation pit and surrounding environment of Kunming International Comprehensive Transportation Hub.
Figure 1.
Site Plan of the foundation pit and surrounding environment of Kunming International Comprehensive Transportation Hub.
Figure 2.
Vertical profile of the internal support system and the corresponding soil layers.
Figure 2.
Vertical profile of the internal support system and the corresponding soil layers.
Figure 3.
Layout plan of the internal support system.
Figure 3.
Layout plan of the internal support system.
Figure 4.
Finite element model for typical cross-section.
Figure 4.
Finite element model for typical cross-section.
Figure 5.
Horizontal ground deformation when the foundation pit is excavated completely.
Figure 5.
Horizontal ground deformation when the foundation pit is excavated completely.
Figure 6.
Vertical ground deformation when the foundation pit is excavated completely.
Figure 6.
Vertical ground deformation when the foundation pit is excavated completely.
Figure 7.
Comparison between the measured and calculated horizontal deformation of the underground continuous wall.
Figure 7.
Comparison between the measured and calculated horizontal deformation of the underground continuous wall.
Figure 8.
Three-dimensional analysis model considering the interaction between the retaining structure and internal support system.
Figure 8.
Three-dimensional analysis model considering the interaction between the retaining structure and internal support system.
Figure 9.
Three-dimensional finite element model of the retaining structure.
Figure 9.
Three-dimensional finite element model of the retaining structure.
Figure 10.
Overall deformation of the internal support system.
Figure 10.
Overall deformation of the internal support system.
Figure 11.
Spatial deformation of the retaining structure.
Figure 11.
Spatial deformation of the retaining structure.
Figure 12.
Influence of temperature on the horizontal deformation of the retaining structure.
Figure 12.
Influence of temperature on the horizontal deformation of the retaining structure.
Table 1.
Physical and mechanical parameters of soil layers.
Table 1.
Physical and mechanical parameters of soil layers.
| Layer No. |
Name |
γ
/(kN/m3)
|
w
/%
|
c
/kPa
|
φ
/(°)
|
Kv
/(cm/s)
|
N |
| ① |
Miscellaneous fill |
17.6 |
/ |
15 |
12 |
/ |
3.8 |
| ② |
Silty clay |
19.4 |
28.5 |
32 |
14 |
4.91×10⁻⁵
|
5.9 |
| ③ |
Peaty soil |
12.6 |
177.8 |
24 |
10 |
/ |
2.2 |
| ④ |
Silt |
20.2 |
21.3 |
16 |
17 |
/ |
9.6 |
| ④1
|
Rounded gravel |
21.0 |
/ |
7 |
28 |
4.41×10⁻⁴
|
7.4 |
| ④2
|
Silty clay |
19.0 |
30.6 |
30 |
13 |
5.95×10⁻⁵
|
6.3 |
| ④3
|
Peaty soil |
15.7 |
61.6 |
22 |
10 |
/ |
4.2 |
| ⑤ |
Silt |
20.1 |
21.7 |
17 |
20 |
3.94×10⁻⁴
|
13.5 |
| ⑤1
|
Silty clay |
19.2 |
28.9 |
30 |
15 |
1.18×10⁻⁴
|
7.7 |
| ⑤2
|
Rounded gravel |
21.0 |
/ |
8 |
31 |
1.26×10⁻⁴
|
/ |
| ⑤3
|
Peaty soil |
15.0 |
66.1 |
24 |
10 |
2.44×10⁻⁶
|
6.0 |
| ⑤4
|
Silty clay |
19.4 |
27.8 |
35 |
13 |
4.31×10⁻⁶
|
12.1 |
| ⑥ |
Silty clay |
19.3 |
28.4 |
35 |
14 |
2.62×10⁻⁵
|
12.1 |
| ⑥1
|
Silt |
20.1 |
22.4 |
18 |
22 |
2.22×10⁻⁴
|
19.7 |
| ⑥2
|
Silty clay |
19.0 |
30.1 |
32 |
14 |
2.61×10⁻⁴
|
11.2 |
| ⑥3
|
Peaty soil |
13.8 |
91.8 |
30 |
12 |
/ |
9.1 |
| ⑥4
|
Gravelly sand |
21.0 |
/ |
10 |
28 |
/ |
30.4 |
| ⑦ |
Silty clay |
19.3 |
27.8 |
38 |
15 |
/ |
/ |
| ⑦1
|
Silt |
20 |
21.8 |
/ |
/ |
/ |
25.6 |
| ⑦2
|
Silty clay |
18.9 |
30.2 |
35 |
15 |
/ |
14.6 |
| ⑦3
|
Peaty soil |
15.2 |
66.1 |
32 |
12 |
/ |
12.9 |
Table 2.
Information of different structural members in the support system.
Table 2.
Information of different structural members in the support system.
|
Membername
|
Property |
Unit |
First layer |
Second layer |
Third layer |
| / |
Elevation |
m |
+1889.05 |
+1884.05 |
+1879.20 |
| Surrounding purlin |
Width × Height |
m×m |
1.2×0.7 / 1.4×0.8 |
1.4×0.8 |
1.3×0.8 |
| Small ring |
Width × Height |
m×m |
1.3×0.8 |
1.5×0.9 |
1.5×0.8 |
| Big ring |
Width × Height |
m×m |
1.8×0.8 |
2.2×1.1 |
2.0×0.9 |
| Radial rod |
Width × Height |
m×m |
0.9×0.7 |
1.0×0.8 |
1.0×0.8 |
Counter support /
Corner support |
Width × Height |
m×m |
1.0×0.7 |
1.2×0.8 |
1.1×0.8 |
| Connecting rod |
Width × Height |
m×m |
0.7×0.7 |
0.7×0.8 |
0.7×0.8 |
Table 3.
Parameters of the HSS model for different soils.
Table 3.
Parameters of the HSS model for different soils.
| |
② Siltyclay
|
④ Silt |
④1Rounded gravel
|
④2Siltyclay
|
⑤ Silt |
⑤1Siltyclay
|
⑥ Siltyclay
|
⑥1Silt
|
⑥3Peatysoil
|
|
γ/(kN/m3) |
19.4 |
20.2 |
21.0 |
19.0 |
20.1 |
19.2 |
19.3 |
20.1 |
13.8 |
|
/(MPa) |
3.6 |
5.8 |
10.0 |
3.8 |
6.2 |
4.6 |
5.6 |
5.9 |
5.6 |
|
/(MPa) |
4.7 |
8.2 |
10.0 |
4.9 |
8.7 |
6.0 |
7.3 |
8.3 |
7.8 |
|
/(MPa) |
28.7 |
40.8 |
40.0 |
30.3 |
43.4 |
36.7 |
44.8 |
41.6 |
39.1 |
|
/(MPa) |
114.9 |
204.1 |
200.0 |
121.2 |
216.8 |
146.9 |
179.2 |
207.8 |
40.0 |
|
c'/(kPa) |
0 |
0 |
0 |
0 |
0 |
0 |
0 |
0 |
0 |
|
φ'/(°) |
28 |
30 |
35 |
28 |
30 |
28 |
28 |
30 |
24 |
|
ψ/(°) |
0 |
0 |
5 |
0 |
0 |
0 |
0 |
0 |
0 |
|
γ0.7/(×10-4) |
3.7 |
2.5 |
2.0 |
2.9 |
2.4 |
2.8 |
2.9 |
2.4 |
3.8 |
| m |
0.8 |
0.5 |
0.5 |
0.8 |
0.5 |
0.8 |
0.8 |
0.5 |
0.8 |
|
K0
|
0.53 |
0.50 |
0.43 |
0.53 |
0.50 |
0.53 |
0.53 |
0.50 |
0.59 |
|
Rf
|
0.9 |
0.9 |
0.9 |
0.7 |
0.9 |
0.7 |
0.7 |
0.9 |
0.9 |
Table 4.
Construction stages in the numerical simulation.
Table 4.
Construction stages in the numerical simulation.
| Stage No. |
Construction content |
| Stage 0 |
Calculate the initial geostress field |
| Stage 1 |
Construct the retaining structure |
| Stage 2 |
Excavate the soil to the bottom of the first support |
| Stage 3 |
Produce the first support and excavate the soil to the bottom of the second support |
| Stage 4 |
Produce the second support and excavate the soil to the bottom of the third support |
| Stage 5 |
Produce the third support and excavate the soil to the bottom of the foundation pit |
Table 5.
Temperature of the internal supports at different construction stages.
Table 5.
Temperature of the internal supports at different construction stages.
| Stage No. |
Temperature of
the first support
/℃
|
Temperature of
the second support
/℃
|
Temperature of
the third support
/℃
|
| Stage 1 |
/ |
/ |
/ |
| Stage 2 |
21 |
/ |
/ |
| Stage 3 |
17 |
/ |
/ |
| Stage 4 |
13 |
13 |
/ |
| Stage 5 |
9 |
9 |
9 |
Table 6.
Analytical steps of the finite element simulation in ABAQUS.
Table 6.
Analytical steps of the finite element simulation in ABAQUS.
| Step No. |
Construction content |
| Step 1 |
Remove the soil above the crown beam |
| Step 2 |
Activate the crown beam and remove the soil above the first support |
| Step 3 |
Activate the first support and construction access bridge, and remove the soil above the second support |
| Step 4 |
Activate the second support, and remove the soil above the third support |
| Step 5 |
Activate the third support, and remove the soil above the foundation pit bottom |
| Step 6 |
Activate the foundation slab |
Table 7.
Calculated maximum axial force of the internal supports.
Table 7.
Calculated maximum axial force of the internal supports.
| Conditions |
Maximum axial force
in the first support/kN
|
Maximum axial force
in the second support/kN
|
Maximum axial force
in the third support/kN
|
| Ignoring thetemperature effect |
12620 |
17340 |
9691 |
| Considering thetemperature effect |
11850 |
16250 |
10100 |
| Relative error |
6.1% |
6.3% |
4.2% |
|
Disclaimer/Publisher’s Note: The statements, opinions and data contained in all publications are solely those of the individual author(s) and contributor(s) and not of MDPI and/or the editor(s). MDPI and/or the editor(s) disclaim responsibility for any injury to people or property resulting from any ideas, methods, instructions or products referred to in the content. |
© 2025 by the authors. Licensee MDPI, Basel, Switzerland. This article is an open access article distributed under the terms and conditions of the Creative Commons Attribution (CC BY) license (http://creativecommons.org/licenses/by/4.0/).