
Submitted:
30 December 2024
Posted:
31 December 2024
You are already at the latest version
Abstract
Metabolic dysfunction-associated steatotic liver disease (MASLD) is a prevalent liver condition with potential progression to cirrhosis and impaired regeneration post-resection. A key mechanism underlying lipotoxicity is endoplasmic reticulum (ER) stress, particularly the activation of the unfolded protein response (UPR). This study investigates the interplay between lipid accumulation, endoplasmic reticulum (ER) stress, and cellular outcomes, focusing on the balance between autophagy and apoptosis. We cultured primary human hepatocytes (PHH) in a free fatty acid (FFA)-enriched medium for 120 hours, assessing lipid accumulation, metabolism, and the expression of selected UPR markers. Additionally, we investigated the effects of lipid load on cell activity and growth in proliferating HepG2 cells. We observed that FFA uptake consistently induced ER stress, shifting cellular responses toward apoptosis under high lipid loads. Donor-specific differences were evident, particularly in lipid storage, excretion, and sensitivity to lipotoxicity. Some donors exhibited limited triglyceride (TAG) storage and excretion, leading to an excess of FFA whose metabolic fate remains unclear. Proliferation was more sensitive to lipid accumulation than overall cell activity, with even low FFA concentrations impairing growth, highlighting the vulnerability of regenerative processes to steatosis. The study elucidates how ER stress pathways, such as PERK-CHOP and IRE1α-JNK, are differentially activated in response to lipid overload, tipping the balance toward apoptosis in severe cases. Limited activation of repair mechanisms, such as autophagy, further emphasizes the critical role of ER stress in determining hepatocyte fate. The donor-dependent variability highlights the need for personalized strategies to mitigate lipotoxic effects and enhance liver regeneration in steatosis-related conditions.
Keywords:
unfolded protein response
; ER stress
; hepatic lipid metabolism
; MASLD
; liver regeneration
; primary human hepatocytes
1. Introduction
With the increasing prevalence of diabetes, obesity and the metabolic syndrome, the associated, metabolic dysfunction-associated steatotic liver disease (MASLD), formerly known as non-alcoholic fatty liver disease (NAFLD), is becoming increasingly important in healthcare. Affecting 10-25% of the global population, it is one of the most common liver diseases and can progress to steatohepatitis, liver fibrosis and cirrhosis [1]. Even mild steatosis (up to 30%) significantly increases complications after liver resection, while advanced steatosis is associated with higher postoperative mortality [2]. Although the liver has a strong regenerative capacity, obesity and high saturated fat diets reduce this ability after liver resection, as shown in animal models [3,4]. Current research focuses on the cellular mechanisms that are affected by lipid accumulation. Our recent work highlights endoplasmic reticulum (ER) stress as a key consequence of lipid accumulation in hepatocytes reducing their regenerative capacity [5].
It is known that there is a significant difference in the metabolism of saturated and unsaturated fatty acids. Unsaturated fatty acids, like oleate are used for beta oxidation or triglyceride (TAG) production and stored in lipid droplets (LD) or excreted as very low density lipoproteins (VLDL) [6]. Saturated fatty acids such as palmitate are incorporated into diacylglycerides (DAG) and, in dependance of the fatty acid (FA) environment, further metabolized to TAG. In presence of unsaturated FA, palmitate is more likely directed to TAG synthesis [7]. This effect is partly due to the enzyme desaturase, which converts saturated to monounsaturated FA and is more active in an unsaturated FA-containing environment [8]. However, saturated FA are associated with greater DAG accumulation in the ER [7] as well as increased phospholipid synthesis leading to ER-membrane dilation and stiffening and subsequent ER stress [9].
ER stress can be activated during physiological processes, such as postprandial glucose metabolism regulation. Prolonged ER stress due to MASLD is linked to inflammation and cell death and may progress to metabolic dysfunction-associated steatohepatitis (MASH). ER stress activates the unfolded protein response (UPR), a complex signaling cascade involving multiple pathways and feedback loops that affect transcription, autophagy, protein processing and apoptosis [10]. It is initiated by three transmembrane proteins at the ER, bound to BiP (Binding immunoglobulin protein): inositol requiring enzyme 1α (IRE 1α), protein kinase RNA-activated like ER kinase (PERK) and activating transcription factor 6α (ATF 6α). Upon activation, ATF 6α is cleaved inside the Golgi apparatus, afterwards its N-terminal fragment enters the nucleus to activate peroxisome proliferator–activated receptor α (PPARα), a transcription factor regulating FA oxidation [11]. Activation of IRE 1α leads to phosphorylation of Janus kinase (JNK), which can trigger apoptosis through activation of further signal proteins[12]. Additionally, IRE 1α and JNK are linked to autophagy involving microtubule-associated protein 1 light chain 3β (MAP-LC3β) [13]. PERK activation inhibits mRNA translation and, through several intermediates, activates CHOP (transcriptional factor C/EBP homologous protein), a transcription factor that induces apoptosis [12]. The pathway to apoptosis involves cleavage of PARP (Poly (ADP-ribose) polymerase) [14]. The balance between autophagy and apoptosis is tightly regulated and decides between life and death of the cell [15].
This study aimed to investigate the relationship between hepatocellular lipid processing and UPR activation and its downstream mechanisms in humans. We utilized a well-established human steatosis model based on primary human hepatocytes (PHH). PHH were cultured with a mixture of free fatty acids (FFA) for up to 120 h, during which we measured fatty acid uptake, lipid accumulation and excretion and the expression of key UPR proteins and their downstream targets. Additionally, we examined the effects of lipid uptake on cell growth and activity using a proliferating HepG2 model. Our findings provide insights into the transition from intracellular lipid homeostasis to a pathological lipotoxicity in steatosis. We also demonstrate that even low concentrations of FFA can impair cell proliferation and the regenerative capacity of the human liver.
2. Materials and Methods
Liver tissue samples, Isolation and Cultivation of Primary Human Hepatocytes
Cells from four patients were included in this study. All of them were treated in the Department of Hepatobiliary Surgery and Visceral Transplantation at University Hospital Leipzig, Germany because of benign or malign liver tumors (Table 1). The study protocol was developed according to the Declaration of Helsinki and approved by the Ethical Committee at the Medical Faculty, Leipzig University (006/17-ek, date 2017/03/21 ratified 2019/02/12). All patients gave their signed consent to participate in the study prior surgery.
Primary human hepatocytes (PHH) were isolated from tumor-free tissue samples we obtained from resected livers. A two-step collagenase perfusion technique was used according to the protocol described earlier [16,17,18]. After washing with phosphate buffered saline (PBS, Thermo Fisher Scientific, Waltham, US), cells were resuspended in PHH culture medium (William’s Medium E (WME), Penicillin/Streptomycin (100 U/100 µM), 15 mM HEPES (4-(2-hydroxyethyl)-1-piperazineethanesulfonic acid), 1 mM Sodium Pyruvat, 1% NEAA (Non-Essential Amino Acids Solution) (alle purchased from Thermo Fisher Scientific, Waltham, US), 10% FBS (fetal bovine serum, Biochrom GmbH, Berlin, Germany), 40 U/ml Human Insulin (Elli Lilly and Company, Indianapolis, US), 1 µg/ml Dexamethason (Jenapharm GmbH + Co. KG, Jena, Germany). Cell count and viability were determined by trypan blue (Sigma Aldrich, St-Louis, US) exclusion and examined with a Neubauer chamber. Cell culture plastics (Greiner Bio-One GmbH, Frickenhausen, Germany) and µ-Slides (Ibidi GmbH, Gräfelfing, Germany) were covered with rat tail collagen that was prepared in our laboratory based on the protocol of Rajan et al. [19] Afterwards cells were seeded and attached overnight.
Induction of Steatosis
Based on the model of Gomez-Lechón et al. [20] steatosis was induced by a culture medium containing 0.6 mM mixture of palmitic and oleic acids (WME, 5% FBS, 15 mM HEPES, 1 mM Sodium pyruvate, 1% MEM NEAA, 100 U/100 µM Penicillin/Streptomycin, 0,2 mM Sodium-Palmitat, 0,4 mM Oleic Acid (both purchased from Sigma Aldrich (St-Louis, US)), 0,3% Methanol (Th. Geyer GmbH & Co. KG, Renningen, Germany). After adherence, cells were washed and medium replaced by FFA-containing medium or control medium (WME, 5% FBS, 15 mM HEPES, 1 mM Sodium pyruvate, 1% MEM NEAA, 100 U/100 µM Penicillin/Streptomycin, 0,3% Methanol). Cells were cultivated over a period of 120 h. Culture medium was changed every 24 h and each day samples were collected for further examination.
Oil Red O and SRB Staining
For Oil Red O and SRB staining, cells were washed with PBS and fixed with 4% formaldehyde (Carl Roth, Karlsruhe, Germany) solution for 10 min.
For assay procedure Oil Red O (Sigma Aldrich, St. Louis, US) is dissolved in isopropanol (Carl Roth, Karlsruhe, Germany) to a concentration of 0.35%, mixed with water in a ratio of 2:3 and added to fixed cells. After 20 minutes of incubation time cells were washed with dH2O and examined with an inverse microscope (Eclipse TS100, Nikon, Tokio, Japan) for visual detection of steatosis. Afterwards, cells were dried and dye was dissolved in isopropanol. Oil Red O concentration was detected by measuring absorbance at 492 nm in a microplate reader (Synergy H1, BioTek, Winooski, USA). Remaining supernatant was removed from cells and cells were washed again with dH2O.
Sulforhodamine b sodium salt (SRB, Sigma Aldrich, St-Louis, US) solution was prepared by dissolving SRB in 1% acetic acid up to a concentration of 0.4% and added to cells. After an incubation time of 30 minutes in the dark cells were washed four times with 1% acetic acid solution. Attached SRB was resuspended in TRIS-solution containing 10 mM TRIS (tris(hydroxymethyl)aminomethane, Carl Roth, Karlsruhe, German) in dH2O. Detection was performed via microplate reader measuring absorbance at 565 nm separated from background staining at 690 nm.
Confluence measuring
For measuring of confluence at 0 h, microscopic pictures were taken with an inverse microcope. Three pictures per donor were examined by marking cell-covered departments manually and detecting area size by analysis with Image J.
Fluorescent staining and microscope
Cells were washed with PBS and fixed with 4% formaldehyde solution for 10 min. BODIPY™ 493/503 (Thermo Fisher Scientific, Waltham, US) was diluted in PBS to a concentration of 25 µg/ml and incubated over 45 min at room temperature in the dark. Hoechst 33342 (Thermo Fisher Scientific, Waltham, US) was used in a concentration of 10 µg/ml in PBS with 10 min incubation time at room temperature. Phalloidin iFluor 555 (abcam, Cambridge, UK) was diluted in 1% BSA/PBS up to a concentration of 1µl/ml and incubated at 4 °C overnight. Fluorescent detection was done with a laser scanning microscope (LSM 700; Carl Zeiss, Oberkochen, Germany).
LDH Assay
Supernatants were collected at respective time points, centrifuged to remove cell debris and stored at -80 °C. LDH activity was examined with LDH-L Assay Kit following the manufacturer’s instructions. Photometric measuring was done in a microplate reader at 340 nm over 15 minutes. In Donor 4 we measured negative LDH values in FFA-treated group. For the normalization of protein expression on LDH, we adjusted these negative values to a base line of 8.37 U/l, as they can’t be explained biologically.
FFA Assay
Free Fatty Acid Assay Kit (Sigma Aldrich, St-Louis, US) was used to detect content of remaining FFA in supernatants. Based on the initially added free fatty acid content we calculated the uptake within 24 hours and summed them up over the whole incubation time. This assay works by activating free fatty acids via Acetyl Coenzyme A Synthetase and measuring fluorescent signal after further steps of enzyme-coupled activation that are induced by adding a reaction mix. The procedure was performed following the manufacturer’s instructions, with the exception of steatosis medium (without fatty acids and methanol) being used instead of assay buffer for dilution of standards and samples. Fluorescence was measured at 570 nm using a microplate reader.
TAG Assay
For quantitative detection of TAG content and TAG excretion, samples of cell lysate and supernatants were analyzed with Triglyceride Quantification Assay Kit (abcam, Cambridge, UK). After supernatants were retained, 4% NP40 (rergitol NP 40 Cell Lysis Buffer, Sigma Aldrich (St-Louis, US)) was added and cells were scraped off. For lysis, cells were heated up to 100°C two times for 2 min. Samples were stored at -80°C until measurement. The kit was used according to the manufacturer’s instructions. TAG Assay works by dividing TAG to fatty acids and glycerol with Lipase, oxidizing glycerol and inducing a reaction of oxidized glycerol with a dye. Fluorescence was measured at Ex/Em 535/587 nm in a microplate reader.
HepG2 cell cultivation
HepG2 cells were cultured on uncoated culture plastics with HepG2 culture medium (DMEM (Dulbecco's Modified Eagle Medium from Thermo Fisher Scientific (Waltham, US), 10% FBS, 100 U/100 μM Pencillin/Streptomycin). Medium was changed three times a week and after reaching a density of 70-80% cells were divided. For cell count and re-seeding, cells were detached with trypsin-EDTA (0,25%/ 0.02%; Biochrom GmbH, Berlin, Germany), resuspended in culture medium, washed with PBS and counted in a Neubauer chamber after trypan blue staining.
Induction of UPR in HepG2 cells using Thapsigargin and Tunicamycin
Positive controls for Western blot analysis were produced by inducing UPR in HepG2 cells with thapsigargin and tunicamycin (both purchased from Sigma Aldrich, St-Louis, US). HepG2 cells were incubated in culture medium containing different concentrations of tunicamycin or thapsigargin over different periods of time based on the procedures described elsewhere [21,22].
Induction of Steatosis in HepG2 cells
HepG2 cells were seeded on cell culture plates and allowed to adhere overnight. Fatty acid mix containing palmitic and oleic acids in a ratio of 1:2 was prepared. HepG2 stock medium (DMEM, 5% FBS, 100 U/100 μM Pencillin/Streptomycin) was mixed with different concentrations of fatty acid mix (0 mM, 0.3 mM, 0.6 mM, 0.9 mM, 1.2 mM and 1.5 mM). After adherence, the medium was changed. Cells were cultured for 48 h, medium was changed every 24 h.
Western Blot Analysis
For Western Blot analysis one part of cells were treated with radioimmunoprecipitation assay (RIPA) lysing buffer containing 50 mM Tris-hydrochloride (Carl Roth, Karlsruhe, Germany), 150 mM sodium chloride (NaCl), 1 mM ethylenediaminetetraacetic acid (EDTA), 0.5% sodium deoxycholate, 0.5 mM sodium orthovanadate, 0.4% aprotinin, 0.4% AEBSF (4-(2-aminoethyl)-benzolsulfonylfluorid hydrochlorid) (all from Sigma Aldrich (St-Louis, US)), 0.05% NP40, 2.5 mM sodium fluoride (Honeywell, Seelze, Germany). Another part was lysed by Subcellular Fractionation Kit (Thermo Fisher Scientific, Waltham, US) following manufacturer’s instructions to analyze PPARα expression in the nucleus. Samples were stored at -80°C.
To determine the protein concentration of the samples, BCA assay was performed. A serial dilution of bovine serum albumin (BSA) solution was used as standard. The reaction mix consisting of Bicinchoninic Acid solution (BCA) reagent A and 4% Copper(II) sulfate (CuSO4) (all purchased from from Sigma Aldrich, St-Louis, US) was added to standard and samples according to the manufacturer’s instructions. Absorbance was measured at 550 nm using a microplate reader.
Protein lysates were adjusted to a volume of 15-20 µl containing a definite protein amount between 17-25µg (see Supplement Table S1) with RIPA buffer and 4x Laemmli sample buffer (from Bio-Rad Laboratories, Hercules, US) and heated at 95° C for 5 min. After cooling down, samples were used immediately or stored at -80°C for later use. Resolving gels for separating with sodium dodecyl sulfate–polyacrylamide gel electrophoresis (SDS PAGE) were prepared with a mixture of Rotiphorese Gel A and B (Carl Roth, Karlsruhe, Germany) and 0.5 M TRIS Solution, 0.1% Sodiumdodecylsulfat (SDS, Carl Roth (Karlsruhe, Germany) and 0.1% APS. Stacking gels of 5% were prepared with Rotiphorese Gel A and B and 0.5 M Tris-hydrochloride. Proteins and a protein ladder (PageRuler Prestained Protein Ladder (Thermo Fisher Scientific, Waltham, US) or Chameleon Duo Pre-stained Protein Ladder (LI-COR Biosciences, Lincoln, USA)) were separated with SDS-PAGE in an electrophoresis chamber (Bio–Rad Laboratories, Hercules, USA) using running buffer (2.5 mM TRIS, 19.2 mM glycine (Carl Roth, Karlsruhe, Germany), 0.1% SDS) for 30 min at 80 V to run through stacking gel and 120 V for 120 min to run through resolving gel. Afterwards, gels and Odyssey Nitrocellulose Membrane (LI-COR Biosciences, Lincoln, USA) were activated in blotting buffer (4.8 mM TRIS, 3.9 mM glycine, 20% methanol) for 5 min. Blotting was performed using a tank blot system (Bio–Rad Laboratories, Hercules, USA) at 4° C and 35 V for 17 h. For total protein detection, membranes were stained with Revert™ 700 Total Protein Stain (LI-COR Biosciences, Lincoln, USA) for 5 min and washed two times with Revert Wash Solution (6.7% acetic acid, 30% methanol). Total protein was detected at 700 nm via Odyssey 9120 Imaging System (LI-COR Biosciences, Lincoln, USA). The staining was removed by incubation in Revert Reversal Solution (0.1 M NaOH (Sodium hydroxide, Carl Roth, Karlsruhe, Germany), 30% methanol) for 5 min and membranes were activated for 1 h in Intercept® (TBS) Blocking Buffer (LI-COR Biosciences, Lincoln, USA).
Primary Antibodies (Supplement Table S1) were diluted in Intercept TM (TBS) blocking buffer and 0.1% TWEEN® 20 (Sigma Aldrich, St-Louis, US) in a fitting dilution and incubated at 4° C overnight. Secondary antibody was diluted 1:10.000 in Intercept TM(TBS) blocking buffer and 0.1% TWEEN 20. Membranes were stained with secondary antibody (IRDye800CW Goat anti-rabbit, IRDye680RD Goat anti-mouse, both purchased from LI-COR Biosciences (Lincoln, USA)) for 1 h at room temperature in the dark. Target protein detection was performed at 700 nm (anti-mouse) or 800 nm (anti-rabbit) with Odyssey 9120 Imaging System. Some membranes showed a high background staining disturbing the detection of target proteins. In such cases, membranes were treated with stripping buffer (LI-COR Biosciences, Lincoln, USA) according to the manufacturer’s instructions and incubation of antibodies was repeated. To ensure comparability, all measured signals were normalized to positive controls. For analysis, Image Studio™ Software (LI-COR Biosciences, Lincoln, USA) was used.
Alamar Blue Assay
Alamar Blue Assay (Bio-Rad Laboratories, Hercules, US) solution was added to HepG2 starving medium (DMEM, 100 U/100 μM pencillin/streptomycin) in a dilution of 1:10. Culture medium was removed from cells and Alamar Blue-mixture was added. After an incubation time of 4 h at 37° C fluorescence was detected using a microplate reader at Ex/Em 560/590 nm.
Sybr Green Assay
For SYBR Green Nucleic acid gel stain (Thermo Fisher Scientific, Waltham, US) Assay cell culture plates were washed and frozen at -20° C overnight. Sybr Green working solution (PBS, 0.1% Triton X 100 (Sigma Aldrich, St-Louis, US), 0.04% Sybr Green) was added to the cells and incubated for 1 h at room temperature in the dark. Fluorescence intensity was detected using a microplate reader at Ex/Em 485/535 nm.
Statistical Analysis
Data are expressed as means +SD. Data from PHH are single values or different counts of technical replicates as indicated in the figures. ROUT test at Q=1% was used to identify outliers for data sets containing eight to twelve technical replicates (Oil Red O and SRB detection). Steatosis in proliferating cells was investigated in three biological replicates of HepG2 cells including 10 technical replicates each. Statistical analysis and chart design was performed with GraphPad Prism 7 software (San Diego, USA). To compare multiple groups one-way or two-way ANOVA tests followed by Tukey’s tests were performed. Statistical significance was considered at p<0.05.
3. Results
3.1. Characterization of steatotic PHH reveals donor-dependent variation
PHH were isolated from four human liver tissue samples (Table 1) and lipid content was assessed initially and post-FFA treatment at 24-hour intervals using microscopy and the Oil Red O staining for visualization of neutral lipids (Figure 1). Initial cultures showed homogenous PHH distribution with ~60% confluence (Supplement Figure S1), but lipid presence varied widely across cells, indicating baseline heterogeneity in steatosis.
Treatment with 0.6 mM FFA every 24 h for five days induced further steatosis. Figure 1A shows the time-dependent neutral lipid accumulation observed in PHH cultures from all four donors. As PHH were cultured, confluence increased, and cells formed additional cell-cell contacts. In the control cultures, cell surface-protein levels, that were detected with SRB-staining, remained stable, indicating that the cultures were well-maintained over time (Supplement Figure S2). In contrast, FFA treatment led to a time-dependent decrease in protein levels, alongside an increase in lipid droplet number and size. Over time, individual lipid droplets merged, changing from a heterogenous distribution of lipid droplets to a more homogenous area of lipid content. Donor-specific differences were noted: lipid merging began at 48 hours in donor 3, 72 hours in donor 1 and 2, and 96 hours in donor 4. After 120 hours of FFA treatment, donor 3 exhibited cell loss and elevated lipotoxicity, confirmed by LDH measurements (Supplement Figure S3).
Quantification of the lipid accumulation demonstrated variability in the dynamics and capacities for lipid storage across donors (Figure 1B). Donor 1 had the lowest initial lipid-to-protein ratio, while donor 3’s ratio was 5.3 times higher. All FFA-treated cultures showed significantly increased lipid content with varying dynamics of accumulation. In the first 24 hours, lipid content increased by 2.3- to 3.8-fold. Further FFA treatment caused continued lipid accumulation in donors 2, 3, and 4 while donor 1 showed a slower increase. By 120 hours, lipid content has risen 5.15- to 6.34-fold in all donors.
3.2. Steatosis leads to adaptations in hepatic lipid metabolism
In a next step we investigated changes in FFA uptake, lipid metabolism and excretion under steatotic conditions (Figure 2). Therefore, we measured FFA and TAG concentrations in our cultures using biochemical assays.
Measurements of FFA uptake revealed that the uptake of FFA into the hepatocytes was very similar in all donors. This allows the data to be averaged (Figure 2A). We observed a significant increase in FFA uptake over the entire treatment period, with the largest increase occurring during the first 24 hours (95.9% uptake), followed by a gradual flattening over time, culminating in 79.8% uptake over 120 hours across all donors (Figure 2B). These results indicate that hepatocytes incorporate a major part of the offered FFA, even under severe steatotic conditions.
Excreted TAG is a surrogate for VLDL secretion and was measured as cumulated amount of TAG in the supernatants of FFA-treated and control cultures. Results were plotted as differences of FFA treated and control cultures (Figure 2C). Our results revealed that FFA-treated hepatocytes from donor 1 had the highest excretion rate of TAG showing a significant increase every 24 h. Donors 2 and 4 showed a similar pattern, although with quantitatively lower TAG excretion. Notably, donor 2 seemed to limit TAG excretion after 96 h. The excretion kinetics of PHH from donor 3 varied completely in comparison to the other donors. Here, we observed a lower TAG excretion of FFA-treated compared to control group resulting in negative values except for the 120 h time point that showed a slightly increased excretion.
In a further step we wanted to investigate the metabolization from FFA to TAG. This includes storage TAG like LD as well as secreted TAG like VLDL (Supplement Table S2 and Supplement Figure S4). Our calculations revealed that TAG storage and excretion varied in the different donors with an increasing variation at later time points of the cultivation time. The comparison of FFA uptake and TAG formation showed a significant difference beyond 48 h (Figure 2D) resulting in an increasing gap between FFA uptake and TAG formation (Figure 2E). These observations indicate that with increasing intracellular lipid accumulation a smaller amount of FFA is transformed into TAG and have to be utilized elsewhere.
Taken together, under steatotic conditions, hepatocytes exhibit efficient FFA uptake, particularly within the first 24 hours, indicating an active response to lipid availability. TAG storage and excretion show donor-dependent variability: while most donors demonstrate significant TAG secretion, Donor 3 exhibits impaired excretion under FFA treatment. Over time, lipid accumulation results in a growing gap between FFA uptake and TAG formation, suggesting that hepatocytes increasingly divert FFA to alternative metabolic pathways as TAG synthesis becomes saturated.
3.4. Investigation of lipid droplet dynamics
Lipid accumulation was investigated on a cellular level using fluorescent staining of lipid droplets with the fluorescent dye Bodipy. In addition, we stained cell nuclei with Hoechst and cell boarders/actin filaments with phalloidin. For donor 4, fluorescent microscopy images were only available for the time points 0, 24, and 48 hours. The high resolution of the fluorescence microscopy allowed the investigation of the dynamics of LD formation (Figure 3).
Phalloidin and Hoechst staining allowed the time- and FFA treatment dependent investigation of the cell morphology. In general, the boarders between neighboring cells were well distinguishable by phalloidin-stained cell membranes. Over time, the cells flattened and formed cell-cell contacts, which can be observed as larger areas between the cells. In addition, in donor 3, we also observed increased actin staining within the hepatocytes. The latter correlates with cellular membrane damage shown by LDH measurements (Supplement Figure S3). Further we observed clearly visible nuclei which are often diploid or polyploid which can be seen by the intensity of the blue fluorescence.
Regarding the lipid droplet dynamics, we observed differences in the initial lipid load, such as a higher count of lipid droplets in donor 3 at 0 h. In the control group, we observed a loss of the initially present lipid droplets over time. In the FFA-treated cells, the number and size of lipid droplets generally increased over the cultivation period, but notable heterogeneity existed among individual hepatocytes. In donor 1, cells tend to form either large droplets or a high number of very small droplets. Donors 2 and 3 exhibited a more balanced distribution, with cells forming both small and large droplets. In contrast, cells from donor 4 predominantly formed larger droplets. Notably, cells with both small and large droplets often displayed a spatial organization with smaller droplets near the cell membrane and larger ones closer to the ER. However, observing the variation of LD size over time we saw a tendency of cells to first form small-size droplets that seem to merge in a second step. Afterwards the remaining space in the cytosol was filled with new small-sized LD, as we can see e.g. in donor 2 from 72 h to 120 h.
3.5. Expression of UPR markers
The expression of different ER stress proteins was determined by Western blotting. As described above, UPR starts with the activation of ATF 6α, IRE 1α and PERK and leads to autophagy (phosphorylation of JNK, MAP LC3β), fatty acid oxidation (PPARα), inhibition of translation (PERK) or apoptosis (phosphorylation of JNK, CHOP, PARP).
In general, the investigation of ER-stress markers in FFA-treated and control PHH showed highly variable expression and activation levels (Figure 4A–I, Supplement Figure S5–S12). In addition, we could observe an initial activation of some of our ER-stress markers at the 0 h time point, e.g. cleavage of ATF 6α, cleavage of PARP and expression of CHOP (Figure 4A,F,I). The association of these markers with ER stress and apoptosis indicates initial cell stress which is in line with the observed LDH release (Supplement Figure S3) resulting from post-isolation stress. Similar courses in the activation of PPARα in FFA-treated and control cultures over the whole cultivation time of 120 h indicate a metabolic adaption due to cell culture conditions.
The treatment of PHH cultures with FFA led to an increase in the expression of the ER-stress proteins ATF 6α. IRE 1α and PERK, as well as related apoptotic downstream targets e.g. CHOP, PARP, JNK. However, the activation of these targets varies widely in amplitude and time point in our investigated donors. In contrast we did not observe a clear FFA-treatment dependent increase in the expression of MAP LC3β and PPARα in all donors indicating that regenerative pathways play a lesser role in our in vitro steatosis model.
Donor 3, which was already slightly steatotic at baseline, exhibited a distinct activation pattern. In this donor, UPR activation decreased after 96 h in the FFA-treated group for all markers, although some downstream processes remained active as seen by the presence of cleavage products. But also, the control group lost its UPR after 120 hours (Figure 4J). This suggests that prolonged cultivation conditions may contribute to the observed effect. However, the earlier onset of UPR loss in FFA treated PHH of donor 3 indicates that an increasing lipid load accelerates this process.
3.6. Activation of UPR and apoptosis regulates cell death under severe steatotic conditions
Similar activation patterns of ER-stress marker in FFA treated PHH from different donors which varies in their onset and expression suggests a dependency on lipid accumulation. In contrast, we observed similar activation patterns of apoptotic markers related to post-isolation stress. Therefore, we standardized our ER stress markers to the degree of lipid accumulation and adjusted them to account for post-isolation stress. The courses were interpolated using Bezier curve fitting (Figure 5).
ATF 6α-pathway activation
After dissociation from BiP, ATF 6α is cleaved inside the Golgi apparatus, producing a cleavage product that enters the nucleus to activate PPARα. In our experiments, ATF 6α activation was lipid load-dependent but decreased at high TAG content. PPARα is a transcription factor which increases beta oxidation and consequently lowers hepatic lipid load. When comparing ATF 6α and PPARα activation relative to lipid accumulation, we observed that their activation patterns were aligned. However, the extent of ATF 6α activation inversely related with the level of PPARα activation, with the strongest PPARα activation in donor 2. It is known that PPARα is activated by FFA which explains its increasing activation with increasing cellular lipid content independent from ATF 6α. The furtherly observed increase in PPARα expression in the control PHH shows that the basal culture conditions also induce PPARα activation.
IRE 1α-pathway activation
IRE 1α is activated during UPR by dissociation from BiP and subsequently activates JNK via several intermediate steps. We observed a lipid load-dependent course of IRE 1α activation in donor 2, 3 and 4. In donors 2 and 3, activation remained relatively flat, also with increasing cellular lipid accumulation. In contrast, donor 4 showed a steep increase in IRE 1α activation at low lipid levels. Similar to ATF 6α, IRE 1α activation decreased at higher lipid levels, except in donor 2. These results suggests that IRE 1α activation is donor-dependent in response to increasing lipid load. Downstream of IRE 1α, JNK is phosphorylated and P-JNK can influence apoptosis and downstream autophagy through initiating expression. JNK exists in two isoforms, 46 kDa and 54 kDa due to differences in splicing. All donors showed JNK activation with a donor-specific maximum at a varying lipid load. The activation patterns of IRE 1α and JNK 54 kDa were in general similar, except for donor 1, displaying JNK 54 kDa activation despite limited IRE 1α activation. In contrast, JNK 46kDa tended to be activated at higher lipid loads than the 54 kDa splicing variant, suggesting a sequential activation in this pathway. Notably, donor 3 exhibited a stronger activation of JNK 54 kDa isoform compared to the 46 kDa isoform. MAP LC3β followed the activation pattern of JNK 54 kDa more closely than that of JNK 46 kDa with the exception of donor 3.
PERK-pathway activation
PERK is activated by dissociation from BiP. It leads to a downregulation of mRNA translation which reduces protein load in the already stressed ER. In our analysis, the activation pattern of PERK follows a similar course to that of IRE 1α across all donors. However, the expression level is rather low in donors 1, 2, and 3, also with increasing cellular lipid amount. In contrast donor 4 shows a steep increase in its expression already at a low lipid load which is comparable to the activation patterns of most other investigated UPR proteins. In comparison to ATF 6α and IRE 1α, which show activation already at lower lipid loads, PERK activation takes place when lipid accumulation is more advanced. Prolonged activation of PERK leads to downstream activation of CHOP, a key protein involved in the initiation of apoptosis. CHOP showed a clear increase in expression in hepatocytes from donors 1 and 2 as lipid content rose.
PARP-activation
PARP is part of the common downstream pathway of JNK and CHOP to induce apoptosis. Upon activation PARP is cleaved into several products, with the 89 kDa cleavage product being the best-documented. However, other cleavage products of approximately 40 kDa and 24 kDa have also been described. The 89 kDa PARP fragment was weakly expressed in all of our donors but showed an activation pattern similar to that of JNK. The highest PARP activation was observed in donor 3, which correlates with the observed lipotoxicity. In donor 1, PARP exhibits a decreasing trend at higher lipid levels, a pattern also seen in CHOP. In donor 2, PARP activation stabilizes at a plateau with increasing lipid load. This is similar to the JNK activation pattern, while CHOP increases with rising lipid levels. These results suggest that lipid accumulation up to a moderate level, leads to strong activation of CHOP but does not necessarily result in a corresponding high activation of PARP 89 kDa.
3.6. Increasing lipid accumulation inhibts cell proliferation
Our previous results demonstrate that lipid accumulation induces ER-stress, accompanied by the activation of ATF 6α, IRE 1α and PERK pathways. The activation of PERK at higher lipid loads suggests an inhibition of global protein synthesis, as confirmed by SRB assay for donor 2 and 3 (Supplement Figure S2). Based on this, we hypothesize that lipid accumulation impacts on regenerative capacities, specifically cell proliferation.
To investigate hepatic cell proliferation, we used HepG2 cells as model for proliferating hepatocytes, as mature primary hepatocytes do not exhibit noteworthy proliferation in vitro. Cell proliferation in HepG2 cells was assessed using the Alamar Blue assay (Figure 6A), which measures cell activity, and Sybr Green assay (Figure 6B), which detects changes in DNA content by binding to dsDNA as a surrogate for cell count.
Hep G2 cells were treated with varying concentrations of FFA (0 to 1.5 mM) to induce steatosis. In the control group (0 mM FFA), a significant increase in cell activity and dsDNA content was observed after 48 hours of culture, indicating an increased cell count. Low FFA concentrations (0.3 and 0.6 mM) were associated with increased cell activity; however, dsDNA content showed no significant change at 0.3 mM. Treatment with FFA concentrations of 0.6 mM or higher resulted in a decrease of dsDNA content after 48 hours with cell activity significantly reduced at 1.2 and 1.5 mM after both 24 and 48 hours.
After 48 hours significant difference in cell activity and dsDNA content were observed between the control group (0 mM) and all FFA-treated groups. These findings indicate that even low concentrations of FFA reduce cell proliferation, while higher concentrations exert cytotoxic effects on proliferative hepatocytes.
4. Discussion
The regenerative capacity of the liver following resection is impaired by obesity and high-saturated-fat diets, as demonstrated in animal models [3,4]. Similarly, clinical observations indicate that overweight and obese patients exhibit increased postoperative rates of acute liver failure, complications and mortality [2,23,24,25]. As demonstrated in our previous study, ER stress is one of the most relevant consequences of hepatic lipid accumulation and is more prominently activated than oxidative stress [5]. The aim of the present study was to further investigate the effects of prolonged lipid accumulation on lipid metabolism, as well as the downstream impact of ER-stress on regeneration and cell death [7,9].
4.1. Initial lipid load influences the dynamics of further lipid accumulation
In this study, we investigated PHH isolated from resected liver tissues from four patients. FFA-treated PHH cultures from all donors exhibited significant lipid accumulation compared to both control group and their initial lipid load. Consistently, the highest lipid accumulation occurred during the first 24 hours, aligning with findings from our previous study [5]. Notably, donor 1, who had the lowest initial lipid load, showed the greatest relative increase in lipid accumulation during this period. However, in terms of absolute values, lipid accumulation was dependent on the initial load, with a higher starting lipid content still resulting in greater lipid accumulation during steatosis induction.
4.2. FFA uptake was independent from existing lipid load and cultivated PHH used a small part of FFA to form TAG
MASLD is caused by lipid accumulation inside hepatocytes which is influenced by lipid offer, intake, metabolization, storage and VLDL excretion. Cells incorporated a substantial portion of the available FFA, with similar uptake observed across all donors. The uptake was the highest during the first 24 h of cultivation but decreased over time. In vivo, FFA uptake is partially mediated by specialized transmembrane transporters such as CD36 and specific isoforms of free acid transport proteins (FATPs). Recent studies have shown increased expression of these transporters in MASLD or in hepatic cell lines incubated with oleic or palmitic acid [27,28]. While the variation in initial lipid load among our donors suggests potential differences in transporter-dependent FFA uptake, the uniform uptake observed in our study indicates that FFA uptake in vitro may occur independently of these transporters. Although FFA uptake was similar across donors, the patterns of lipid accumulation and TAG excretion varied. Donors 3 and 4 exhibited lower TAG storage rates, while donors 1 and 2 converted a larger portion of FFA into intracellular TAG. The metabolization of FFA to TAG is dependent on intracellular activation of FFA to acyl-Co A and three esterifications on glyceraldehyde 3-phosphate (G3P). The first esterification is speed-determining for TAG synthesis and dependent from G3P acyltransferase enzymes. But still there are several pathways that channel off metabolites to construction of other proteins e.g. phosphatidylethanolamine, lecithin or cardiolipins [29]. Our results suggest that donor 3 and 4 are either less able to activate FFA or channel off more lipid metabolites to formation of other lipids. Regarding TAG excretion, donors 1, 2 and 4 showed higher excretion levels in the FFA-treated group compared to controls, whereas donor 3 exhibited the opposite, with higher TAG excretion in control group. These findings confirm previous results from Fon Tacer and Rozman, who reported increased VLDL secretion under MASLD conditions but inhibition of VLDL secretion under MASH conditions [30]. Recent studies suggest that these differences depend on ER function, as VLDL formation in hepatocytes relies on the transfer of triglycerides to ApoB100 in the ER lumen [27]. In rodent studies, moderate ER stress led to increased ApoB100 secretion, whereas excessive ER stress decreased it [31].
Furthermore, only a portion of FFA was utilized for TAG formation with the gap between FFA uptake and TAG synthesis increasing over time. In a previous study, we demonstrated higher expression of lipid metabolism proteins, such as ACSL1 and CPT1L, in steatotic hepatocytes, indicating enhanced FFA metabolism under steatotic conditions [32]. However, we also observed that basal metabolic rates in hepatocytes remained relatively constant but decreased under prolonged steatotic conditions [5]. We hypothesize that FAA could be partly transformed into phospholipids. Clinical data from adipose patients show an increased risk of bile stone formation due to an imbalance in bile composition [33,34,35]. Phospholipids were an essential part of bile and the excretion of excess FFA as phospholipids via bile could be a pathological effect of disturbed lipid homeostasis.
4.3. Lipid accumulation activates UPR and especially expression of apoptosis-associated markers
Increasing lipid accumulation is associated with the induction of ER stress, which initiates the UPR. Throughout all donors we observed an initial activation of several UPR markers simultaneously to high initial LDH activity in the supernatant. A high LDH activity after cell isolation was also observed in other studies as a result of post-isolation stress [5,36]. As a consequence, we normalized our UPR expression data to LDH.
Over time, we observed an activation of various UPR markers. Our results suggest a predominance of apoptosis-inducing pathways over repair mechanism within the UPR. Visualizing this as a scale, the two opposing sides represent repair and apoptosis. On the repair side of the scale, the ATF 6α/PPARα pathway emerged as key player. Both ATF 6α and PPARα showed a lipid load dependent course. However, we also observed a time dependent-increase in PPARα expression in the control cells, suggesting that PPARα activation can occur naturally, even in the absence of additional FFA treatment. This likely reflects a basal, low-level activation of PPARα under normal metabolic conditions, possibly related to inherent lipid content. On the opposing side of the scale, which tilts toward apoptosis and cell death, lies the PERK/CHOP/PARP pathway. PERK and CHOP expressions were clearly associated with higher lipid loads, indicating that the apoptotic cascade is activated upstream. However, PARP activation, a clear marker of apoptosis execution, did not follow this pattern consistently in across all donors. PARP was markedly activated only in donor 3, where its expression coincided with signs of lipotoxicity and cell death, as evidenced by LDH release and microscopy analyses. In contrast, in donors 1, 2, and 4, PARP activation remained limited, suggesting that these cells were at the brink of apoptosis or experiencing only slight activation of apoptotic pathways. JNK, a downstream marker of IRE 1α activation, serves as a pivot weight on this scale, determining the balance between autophagy and apoptosis [13]. Although we did not observe strong activation of the autophagy marker MAP LC3β, which could tip the scale towards repair, we saw a parallel activation of the apoptosis-associated PARP in donor 3, further shifting the balance decisively toward cell death. While autophagy is known to suppress apoptosis under certain conditions [37], repair mechanisms appeared inactive in our model. The observed activation of JNK and CHOP highlights the progressive tipping of the scale towards lipoapoptosis, a process typically associated with prolonged ER stress [38,39,40].
Given the use of primary human hepatocytes, donor-specific characteristics must be considered. Donor 1 was the youngest, and donor 4 the oldest, with both suffering from benign liver diseases. Donors 2 and 3, by contrast, were operated on for malignant liver tumors. All donors except donor 2 were normal-weight and female. Notably, donor 3, despite having the lowest BMI, exhibited the highest initial lipid load, suggesting individual susceptibility to lipid accumulation. Donors 3 and 4 showed distinct characteristics. Donor 4 displayed elevated UPR marker expression even at low lipid loads, which may align with findings in mice showing age-related increases in ER stress [40]. For donor 3, UPR marker expression declined in FFA-treated cells after 96 hours, a trend that became apparent in control cells at 120 hours. As we normalized target protein expression to total intracellular protein, this decrease was not attributable to overall protein degradation but was specific to ER stress proteins. Concurrently, microscopy revealed a reduction in cell count and cell surface proteins over time, with these effects occurring earlier in FFA-treated cells compared to controls. Importantly, the decline in UPR markers preceded an increase in LDH release, suggesting that donor 3 reached a stage of lipotoxicity characterized by membrane damage. This membrane disruption could explain the observed LDH release and may also facilitate the release of TAG, which, under such conditions, might not be packaged and excreted as VLDL.
Together, these findings suggest that donor 3 represents a critical case where severe lipid accumulation leads to UPR downregulation, loss of cellular integrity, and the transition from stress to apoptosis. This reinforces the earlier conclusion that apoptosis execution occurs primarily under conditions of extreme lipid load, where the balance decisively tilts toward cell death.
4.4. Cell growth and cell activity are disturbed by FFA-treatment
UPR shows high interindividual variability, influenced by factors such as initial lipid load, dynamics of lipid intake, metabolization and excretion. If ER stress fails to restore cellular homeostasis, MASLD can progress to MASH and other complications [39]. Moreover, MASLD is associated with impaired liver regeneration following liver resection [4].
Our results demonstrated that lipid accumulation strongly activates ER stress. Prolonged ER stress, driven by sustained PERK activation, leads to a global inhibition of protein translation impairing both cellular repair and tissue regeneration. This challenge is particularly critical in the context of severe lipid accumulation, which triggers cell death and underscores the need for effective recovery mechanisms to preserve liver integrity under lipotoxic conditions.
To further investigate the effects of lipid accumulation on hepatic cell proliferation, we used HepG2 cells as a model. The Alamar Blue and Sybr Green assays revealed that low FFA concentrations (0.3 and 0.6 mM) initially increased cell activity, likely reflecting metabolic adaptation to moderate lipid exposure. However, DNA content at 0.3 mM remained unchanged, indicating that this increase in activity did not correspond to effective proliferation. At 0.6 mM or higher, both DNA content and cell activity declined, with significant reductions observed at 1.2 and 1.5 mM, suggesting a dose-dependent relationship where low FFA concentrations disrupt proliferation and higher concentrations exert cytotoxic effects.
Extrapolated to the organ level, these findings suggest that lipid-induced disruption of cell proliferation and activity could compromise liver regeneration and, in severe cases, lead to organ failure. This is consistent with clinical observations of increased postoperative complications and mortality in patients with progressive steatosis undergoing liver resection [2]. Notably, cell proliferation appears more sensitive to steatosis than cell activity. At low FFA concentrations (0.3–0.6 mM), cell activity increased over time, likely reflecting metabolic adaptation but DNA content either remained stable (0.3 mM) or declined (0.6 mM). This indicates that cells under mild lipid stress may prioritize metabolic functions over division. At higher FFA concentrations (≥1.2 mM), both cell activity and proliferation were significantly reduced, consistent with previous reports of diminished metabolic activity under FFA treatment [41].
Interestingly, the observed increase in cell activity in low FFA-treated groups between 24 and 48 hours may represent a transient adaptive response before metabolic stress overwhelms repair mechanisms. Together, these findings underscore the detrimental impact of lipid accumulation on cellular proliferation and liver regeneration, highlighting the critical need to address lipid-induced stress in the treatment of steatosis-related liver diseases.
4.5. Limitations
Our study is limited by the use of primary human hepatocytes (PHH) and the small number of donors included in the experiments. The use of PHH inherently introduces variability due to differences in donor age, sex, underlying diseases, lifestyle, and medication. In particular, our results highlight the influence of initial lipid content on cellular responses, which required us to account for donor-specific lipid load in our analysis. Despite these challenges, the consistency of our findings across different experimental read-outs supports the validity of our conclusions.
The limited availability of primary hepatic cells also constrained the number of parallel experiments, making it difficult to perform extensive subgroup analyses. Additionally, inter-donor variability could not be entirely controlled, emphasizing the need for further studies using larger donor pools to validate these findings.
In addition to PHH, we used HepG2 cells as a model to investigate lipid-induced stress and proliferation. While HepG2 cells are suitable for studying steatosis due to their ability to increase lipid load in response to fatty acid treatment, they differ from non-cancerous hepatocytes in key aspects. HepG2 cells respond differently to glucose and fructose treatment compared to primary hepatocytes [26], and their capacity for very-low-density lipoprotein (VLDL) secretion is notably poor [41]. These differences may limit the translatability of some findings to physiological or in vivo conditions. Nonetheless, HepG2 cells provide a valuable tool for investigating lipid-induced cellular stress and remain a widely used model for such studies.
5. Conclusions
This study underscores the detrimental impact of lipid accumulation on hepatocyte function, highlighting its role in activating ER stress pathways, inhibiting regeneration, and inducing apoptosis. Prolonged ER stress, driven by sustained PERK activation, disrupts cellular repair and tissue regeneration, particularly under severe lipid load. These findings align with clinical observations of impaired liver regeneration and increased postoperative complications in obese patients undergoing liver resection.
Additionally, the gap between FFA uptake and TAG synthesis suggests diversion of FFA into alternative pathways, such as phospholipid synthesis. This may contribute to imbalances in bile composition, offering a potential explanation for the increased risk of gallstone formation in patients with disturbed lipid metabolism.
Future studies should further investigate the mechanisms underlying these processes and validate these findings in larger donor pools. Improving our understanding of lipid-induced hepatocyte dysfunction will be crucial for developing targeted therapies to enhance liver regeneration and mitigate complications in steatosis-related liver diseases.
Supplementary Materials
The following supporting information can be downloaded at: www.mdpi.com/xxx/s1, Table S1. Technical data for Western Blots, Table S2. FFA-metabolization to TAG, Figure S1: Initial Confluence, Figure S2: Quantification of cell surface protein with SRB, Figure S3: LDH activity, Figure S4: Intracellular TAG, Figure S5: PARP expression, Figure S6: CHOP expression, Figure S7: PERK expression, Figure S8: JNK and P-JNK expression, Figure S9: MAP LC3β expression, Figure S10: IRE 1α expression, Figure S11: PPARα expression, Figure S12: ATF 6α expression
Author Contributions
Conceptualization, G.D.; methodology, G.D. and D.S.; software, R.H.; validation, R.H., L.S. and D.S.; formal analysis, A.S. and R.H.; investigation, A.S.; resources, G.D. and D.S.; writing—original draft preparation, A.S., L.S. and G.D.; writing—editing, A.S., L.S., G.S., G.D. and D.S.; visualization, A.S. and R.H.; supervision, G.D.; project administration, G.D.; funding acquisition, G.D. and D.S. All authors have read and agreed to the published version of the manuscript.
Funding
The study was supported by the Federal Ministry of Education and Research (BMBF, Germany) within the research net-work Liver Systems Medicine (LiSyM) Cancer SMART-NAFLD [grant numbers: 031L0256C and 031L0313C] and partly funded with tax money approved by the delegates of the Saxonian state parliament. Lena Seidemann received funding as participant in the clinician scientist programs of Leipzig University Medicine. Anna Stilkerich received funding as participant in the doctoral program of Leipzig University Medicine.
Institutional Review Board Statement
The study was conducted in accordance with the Declaration of Helsinki and the protocol was approved by the Ethics Committee of University Hospital Leipzig (006/17-ek, date 2017/03/21 ratified 2019/02/12).
Informed Consent Statement
Informed consent was obtained from all subjects involved in the study.
Additional information: During the preparation of this work, the authors used ChatGPT in order to improve readability. After using this tool or service, the authors reviewed and edited the content as needed and take full responsibility for the content of the publication.
Data Availability Statement
The datasets generated during and/or analyzed during the current study are available from the corresponding author on reasonable request.
Acknowledgments
We cordially thank the team from the Clinic and Polyclinic for Visceral, Transplantation, Thoracic and Vascular Surgery for the fruitful collaboration. We thank Lubina Sauer and Christiane Körner for parts of the method establishment and the preliminary work within the project.
Conflicts of Interest
The authors declare no conflict of interest.
References
- Angulo, P. Nonalcoholic fatty liver disease. N. Engl. J. Med. 2002, 346, 1221–1231. [Google Scholar] [CrossRef] [PubMed]
- Meijer, V.E. de; Kalish, B.T.; Puder, M.; Ijzermans, J.N.M. Systematic review and meta-analysis of steatosis as a risk factor in major hepatic resection. Br. J. Surg. 2010, 97, 1331–1339. [Google Scholar] [CrossRef] [PubMed]
- Selzner, M.; Clavien, P.A. Failure of regeneration of the steatotic rat liver: disruption at two different levels in the regeneration pathway. Hepatology (Baltimore, Md.) 2000, 31, 35–42. [Google Scholar] [CrossRef] [PubMed]
- Wang, D.; Wei, Y.; Pagliassotti, M.J. Saturated fatty acids promote endoplasmic reticulum stress and liver injury in rats with hepatic steatosis. Endocrinology 2006, 147, 943–951. [Google Scholar] [CrossRef]
- Rennert, C.; Heil, T.; Schicht, G.; Stilkerich, A.; Seidemann, L.; Kegel-Hübner, V.; Seehofer, D.; Damm, G. Prolonged Lipid Accumulation in Cultured Primary Human Hepatocytes Rather Leads to ER Stress than Oxidative Stress. Int. J. Mol. Sci. 2020, 21. [Google Scholar] [CrossRef]
- Akoumi, A.; Haffar, T.; Mousterji, M.; Kiss, R.S.; Bousette, N. Palmitate mediated diacylglycerol accumulation causes endoplasmic reticulum stress, Plin2 degradation, and cell death in H9C2 cardiomyoblasts. Exp. Cell Res. 2017, 354, 85–94. [Google Scholar] [CrossRef]
- Coll, T.; Eyre, E.; Rodríguez-Calvo, R.; Palomer, X.; Sánchez, R.M.; Merlos, M.; Laguna, J.C.; Vázquez-Carrera, M. Oleate reverses palmitate-induced insulin resistance and inflammation in skeletal muscle cells. J. Biol. Chem. 2008, 283, 11107–11116. [Google Scholar] [CrossRef]
- Listenberger, L.L.; Han, X.; Lewis, S.E.; Cases, S.; Farese, R.V.; Ory, D.S.; Schaffer, J.E. Triglyceride accumulation protects against fatty acid-induced lipotoxicity. Proc. Natl. Acad. Sci. U. S. A. 2003, 100, 3077–3082. [Google Scholar] [CrossRef]
- Leamy, A.K.; Egnatchik, R.A.; Shiota, M.; Ivanova, P.T.; Myers, D.S.; Brown, H.A.; Young, J.D. Enhanced synthesis of saturated phospholipids is associated with ER stress and lipotoxicity in palmitate treated hepatic cells. J. Lipid Res. 2014, 55, 1478–1488. [Google Scholar] [CrossRef]
- Lebeaupin, C.; Vallée, D.; Hazari, Y.; Hetz, C.; Chevet, E.; Bailly-Maitre, B. Endoplasmic reticulum stress signalling and the pathogenesis of non-alcoholic fatty liver disease. J. Hepatol. 2018, 69, 927–947. [Google Scholar] [CrossRef]
- Chen, X.; Zhang, F.; Gong, Q.; Cui, A.; Zhuo, S.; Hu, Z.; Han, Y.; Gao, J.; Sun, Y.; Liu, Z.; et al. Hepatic ATF6 Increases Fatty Acid Oxidation to Attenuate Hepatic Steatosis in Mice Through Peroxisome Proliferator-Activated Receptor α. Diabetes 2016, 65, 1904–1915. [Google Scholar] [CrossRef] [PubMed]
- Sano, R.; Reed, J.C. ER stress-induced cell death mechanisms. Biochim. Biophys. Acta 2013, 1833, 3460–3470. [Google Scholar] [CrossRef] [PubMed]
- Høyer-Hansen, M.; Jäättelä, M. Connecting endoplasmic reticulum stress to autophagy by unfolded protein response and calcium. Cell Death Differ. 2007, 14, 1576–1582. [Google Scholar] [CrossRef]
- Mungrue, I.N.; Pagnon, J.; Kohannim, O.; Gargalovic, P.S.; Lusis, A.J. CHAC1/MGC4504 is a novel proapoptotic component of the unfolded protein response, downstream of the ATF4-ATF3-CHOP cascade. J. Immunol. 2009, 182, 466–476. [Google Scholar] [CrossRef] [PubMed]
- Márton, M.; Kurucz, A.; Lizák, B.; Margittai, É.; Bánhegyi, G.; Kapuy, O. A Systems Biological View of Life-and-Death Decision with Respect to Endoplasmic Reticulum Stress-The Role of PERK Pathway. Int. J. Mol. Sci. 2017, 18. [Google Scholar] [CrossRef]
- Pfeiffer, E.; Kegel, V.; Zeilinger, K.; Hengstler, J.G.; Nüssler, A.K.; Seehofer, D.; Damm, G. Featured Article: Isolation, characterization, and cultivation of human hepatocytes and non-parenchymal liver cells. Exp. Biol. Med. (Maywood) 2015, 240, 645–656. [Google Scholar] [CrossRef] [PubMed]
- Kegel, V.; Deharde, D.; Pfeiffer, E.; Zeilinger, K.; Seehofer, D.; Damm, G. Protocol for Isolation of Primary Human Hepatocytes and Corresponding Major Populations of Non-parenchymal Liver Cells. J. Vis. Exp. 2016, e53069. [Google Scholar] [CrossRef]
- Damm, G.; Schicht, G.; Zimmermann, A.; Rennert, C.; Fischer, N.; Kießig, M.; Wagner, T.; Kegel, V.; Seehofer, D. Effect of glucose and insulin supplementation on the isolation of primary human hepatocytes. EXCLI J. 2019, 18, 1071–1091. [Google Scholar] [CrossRef]
- Rajan, N.; Habermehl, J.; Coté, M.-F.; Doillon, C.J.; Mantovani, D. Preparation of ready-to-use, storable and reconstituted type I collagen from rat tail tendon for tissue engineering applications. Nat. Protoc. 2006, 1, 2753–2758. [Google Scholar] [CrossRef]
- Gómez-Lechón, M.J.; Donato, M.T.; Martínez-Romero, A.; Jiménez, N.; Castell, J.V.; O'Connor, J.-E. A human hepatocellular in vitro model to investigate steatosis. Chem. Biol. Interact. 2007, 165, 106–116. [Google Scholar] [CrossRef]
- Abdullahi, A.; Stanojcic, M.; Parousis, A.; Patsouris, D.; Jeschke, M.G. Modeling Acute ER Stress in Vivo and in Vitro. Shock 2017, 47, 506–513. [Google Scholar] [CrossRef]
- Achard, C.S.; Laybutt, D.R. Lipid-induced endoplasmic reticulum stress in liver cells results in two distinct outcomes: adaptation with enhanced insulin signaling or insulin resistance. Endocrinology 2012, 153, 2164–2177. [Google Scholar] [CrossRef]
- Gomez, D.; Malik, H.Z.; Bonney, G.K.; Wong, V.; Toogood, G.J.; Lodge, J.P.A.; Prasad, K.R. Steatosis predicts postoperative morbidity following hepatic resection for colorectal metastasis. Br. J. Surg. 2007, 94, 1395–1402. [Google Scholar] [CrossRef]
- Paro, A.; Tsilimigras, D.I.; Dalmacy, D.; Mirdad, R.S.; Hyer, J.M.; Pawlik, T.M. Impact of Metabolic Syndrome on Postoperative Outcomes Among Medicare Beneficiaries Undergoing Hepatectomy. J. Gastrointest. Surg. 2021, 25, 2545–2552. [Google Scholar] [CrossRef] [PubMed]
- Berardi, G.; Kingham, T.P.; Zhang, W.; Syn, N.L.; Koh, Y.-X.; Jaber, B.; Aghayan, D.L.; Siow, T.F.; Lim, C.; Scatton, O.; et al. Impact of body mass index on perioperative outcomes of laparoscopic major hepatectomies. Surgery 2023, 174, 259–267. [Google Scholar] [CrossRef] [PubMed]
- Huggett, Z.J.; Smith, A.; Vivo, N. de; Gomez, D.; Jethwa, P.; Brameld, J.M.; Bennett, A.; Salter, A.M. A Comparison of Primary Human Hepatocytes and Hepatoma Cell Lines to Model the Effects of Fatty Acids, Fructose and Glucose on Liver Cell Lipid Accumulation. Nutrients 2022, 15. [Google Scholar] [CrossRef] [PubMed]
- Kawano, Y.; Cohen, D.E. Mechanisms of hepatic triglyceride accumulation in non-alcoholic fatty liver disease. J. Gastroenterol. 2013, 48, 434–441. [Google Scholar] [CrossRef]
- Zhang, M.; Bai, X.; Du, Q.; Xu, J.; Wang, D.; Chen, L.; Dong, K.; Chen, Z.; Yang, J. The Different Mechanisms of Lipid Accumulation in Hepatocytes Induced by Oleic Acid/Palmitic Acid and High-Fat Diet. Molecules 2023, 28. [Google Scholar] [CrossRef]
- Alves-Bezerra, M.; Cohen, D.E. Triglyceride Metabolism in the Liver. Compr. Physiol. 2017, 8, 1–8. [Google Scholar] [CrossRef]
- Fon Tacer, K.; Rozman, D. Nonalcoholic Fatty liver disease: focus on lipoprotein and lipid deregulation. J. Lipids 2011, 2011, 783976. [Google Scholar] [CrossRef]
- Ota, T.; Gayet, C.; Ginsberg, H.N. Inhibition of apolipoprotein B100 secretion by lipid-induced hepatic endoplasmic reticulum stress in rodents. J. Clin. Invest. 2008, 118, 316–332. [Google Scholar] [CrossRef] [PubMed]
- Seidemann, L.; Krüger, A.; Kegel-Hübner, V.; Seehofer, D.; Damm, G. Influence of Genistein on Hepatic Lipid Metabolism in an In Vitro Model of Hepatic Steatosis. Molecules 2021, 26. [Google Scholar] [CrossRef]
- Wu, W.; Pei, Y.; Wang, J.; Liang, Q.; Chen, W. Association between visceral lipid accumulation indicators and gallstones: a cross-sectional study based on NHANES 2017-2020. Lipids Health Dis. 2024, 23, 345. [Google Scholar] [CrossRef] [PubMed]
- Zhang, G.; Ding, Z.; Yang, J.; Wang, T.; Tong, L.; Cheng, J.; Zhang, C. Higher visceral adiposity index was associated with an elevated prevalence of gallstones and an earlier age at first gallstone surgery in US adults: the results are based on a cross-sectional study. Front. Endocrinol. (Lausanne) 2023, 14, 1189553. [Google Scholar] [CrossRef]
- Wang, H.H.; Portincasa, P.; Liu, M.; Wang, D.Q.-H. Effects of Biliary Phospholipids on Cholesterol Crystallization and Growth in Gallstone Formation. Adv. Ther. 2023, 40, 743–768. [Google Scholar] [CrossRef]
- Jeschke, M.G.; Klein, D.; Thasler, W.E.; Bolder, U.; Schlitt, H.-J.; Jauch, K.-W.; Weiss, T.S. Insulin decreases inflammatory signal transcription factor expression in primary human liver cells after LPS challenge. Mol. Med. 2008, 14, 11–19. [Google Scholar] [CrossRef] [PubMed]
- Cai, N.; Zhao, X.; Jing, Y.; Sun, K.; Jiao, S.; Chen, X.; Yang, H.; Zhou, Y.; Wei, L. Autophagy protects against palmitate-induced apoptosis in hepatocytes. Cell Biosci. 2014, 4, 28. [Google Scholar] [CrossRef] [PubMed]
- Malhi, H.; Bronk, S.F.; Werneburg, N.W.; Gores, G.J. Free fatty acids induce JNK-dependent hepatocyte lipoapoptosis. J. Biol. Chem. 2006, 281, 12093–12101. [Google Scholar] [CrossRef]
- Malhi, H.; Kaufman, R.J. Endoplasmic reticulum stress in liver disease. J. Hepatol. 2011, 54, 795–809. [Google Scholar] [CrossRef]
- Pfaffenbach, K.T.; Gentile, C.L.; Nivala, A.M.; Wang, D.; Wei, Y.; Pagliassotti, M.J. Linking endoplasmic reticulum stress to cell death in hepatocytes: roles of C/EBP homologous protein and chemical chaperones in palmitate-mediated cell death. Am. J. Physiol. Endocrinol. Metab. 2010, 298, E1027-35. [Google Scholar] [CrossRef]
- Kostrzewski, T.; Cornforth, T.; Snow, S.A.; Ouro-Gnao, L.; Rowe, C.; Large, E.M.; Hughes, D.J. Three-dimensional perfused human in vitro model of non-alcoholic fatty liver disease. World J. Gastroenterol. 2017, 23, 204–215. [Google Scholar] [CrossRef] [PubMed]
Figure 1.
Qualitative and semi-quantitative analysis of steatosis A. Microscopic analysis of Oil Red O-stained cultures: PHH were cultivated with FFA-containing or control medium. For qualitative analysis lipids were stained with Oil Red O and SRB. Images were taken with an inverse microscope; 20x magnification. PHH from all donors showed a visible increase in lipid load. B. Semiquantitative analysis of lipids per protein: Oil Red O (ORO) extinction per SRB staining extinction: PHH were cultivated with 0.6 mM FFA or control medium. For semiquantitative analysis of lipids per protein, ORO and SRB stainings were performed and extinction was measured to determine relative concentrations. Data are shown as means +SD, n=8 (donor 1) or n=12 (donor 2, 3 and 4). Two-way ANOVA and post hoc Tukey’s test; FFA-treated and control group were compared at the same time points (####: p<0.0001, ###: p<0.001, ##: p<0.01, #: p=0.0186) and the increase in FFA-treated group compared to the start (****: p<0.0001, ***: p<0.001, **: p=0.0046). Further the increase during 24 h of FFA-incubation was analyzed (^^^^: p<0.0001, ^^^: p<0.001, ^^: p<0.01).
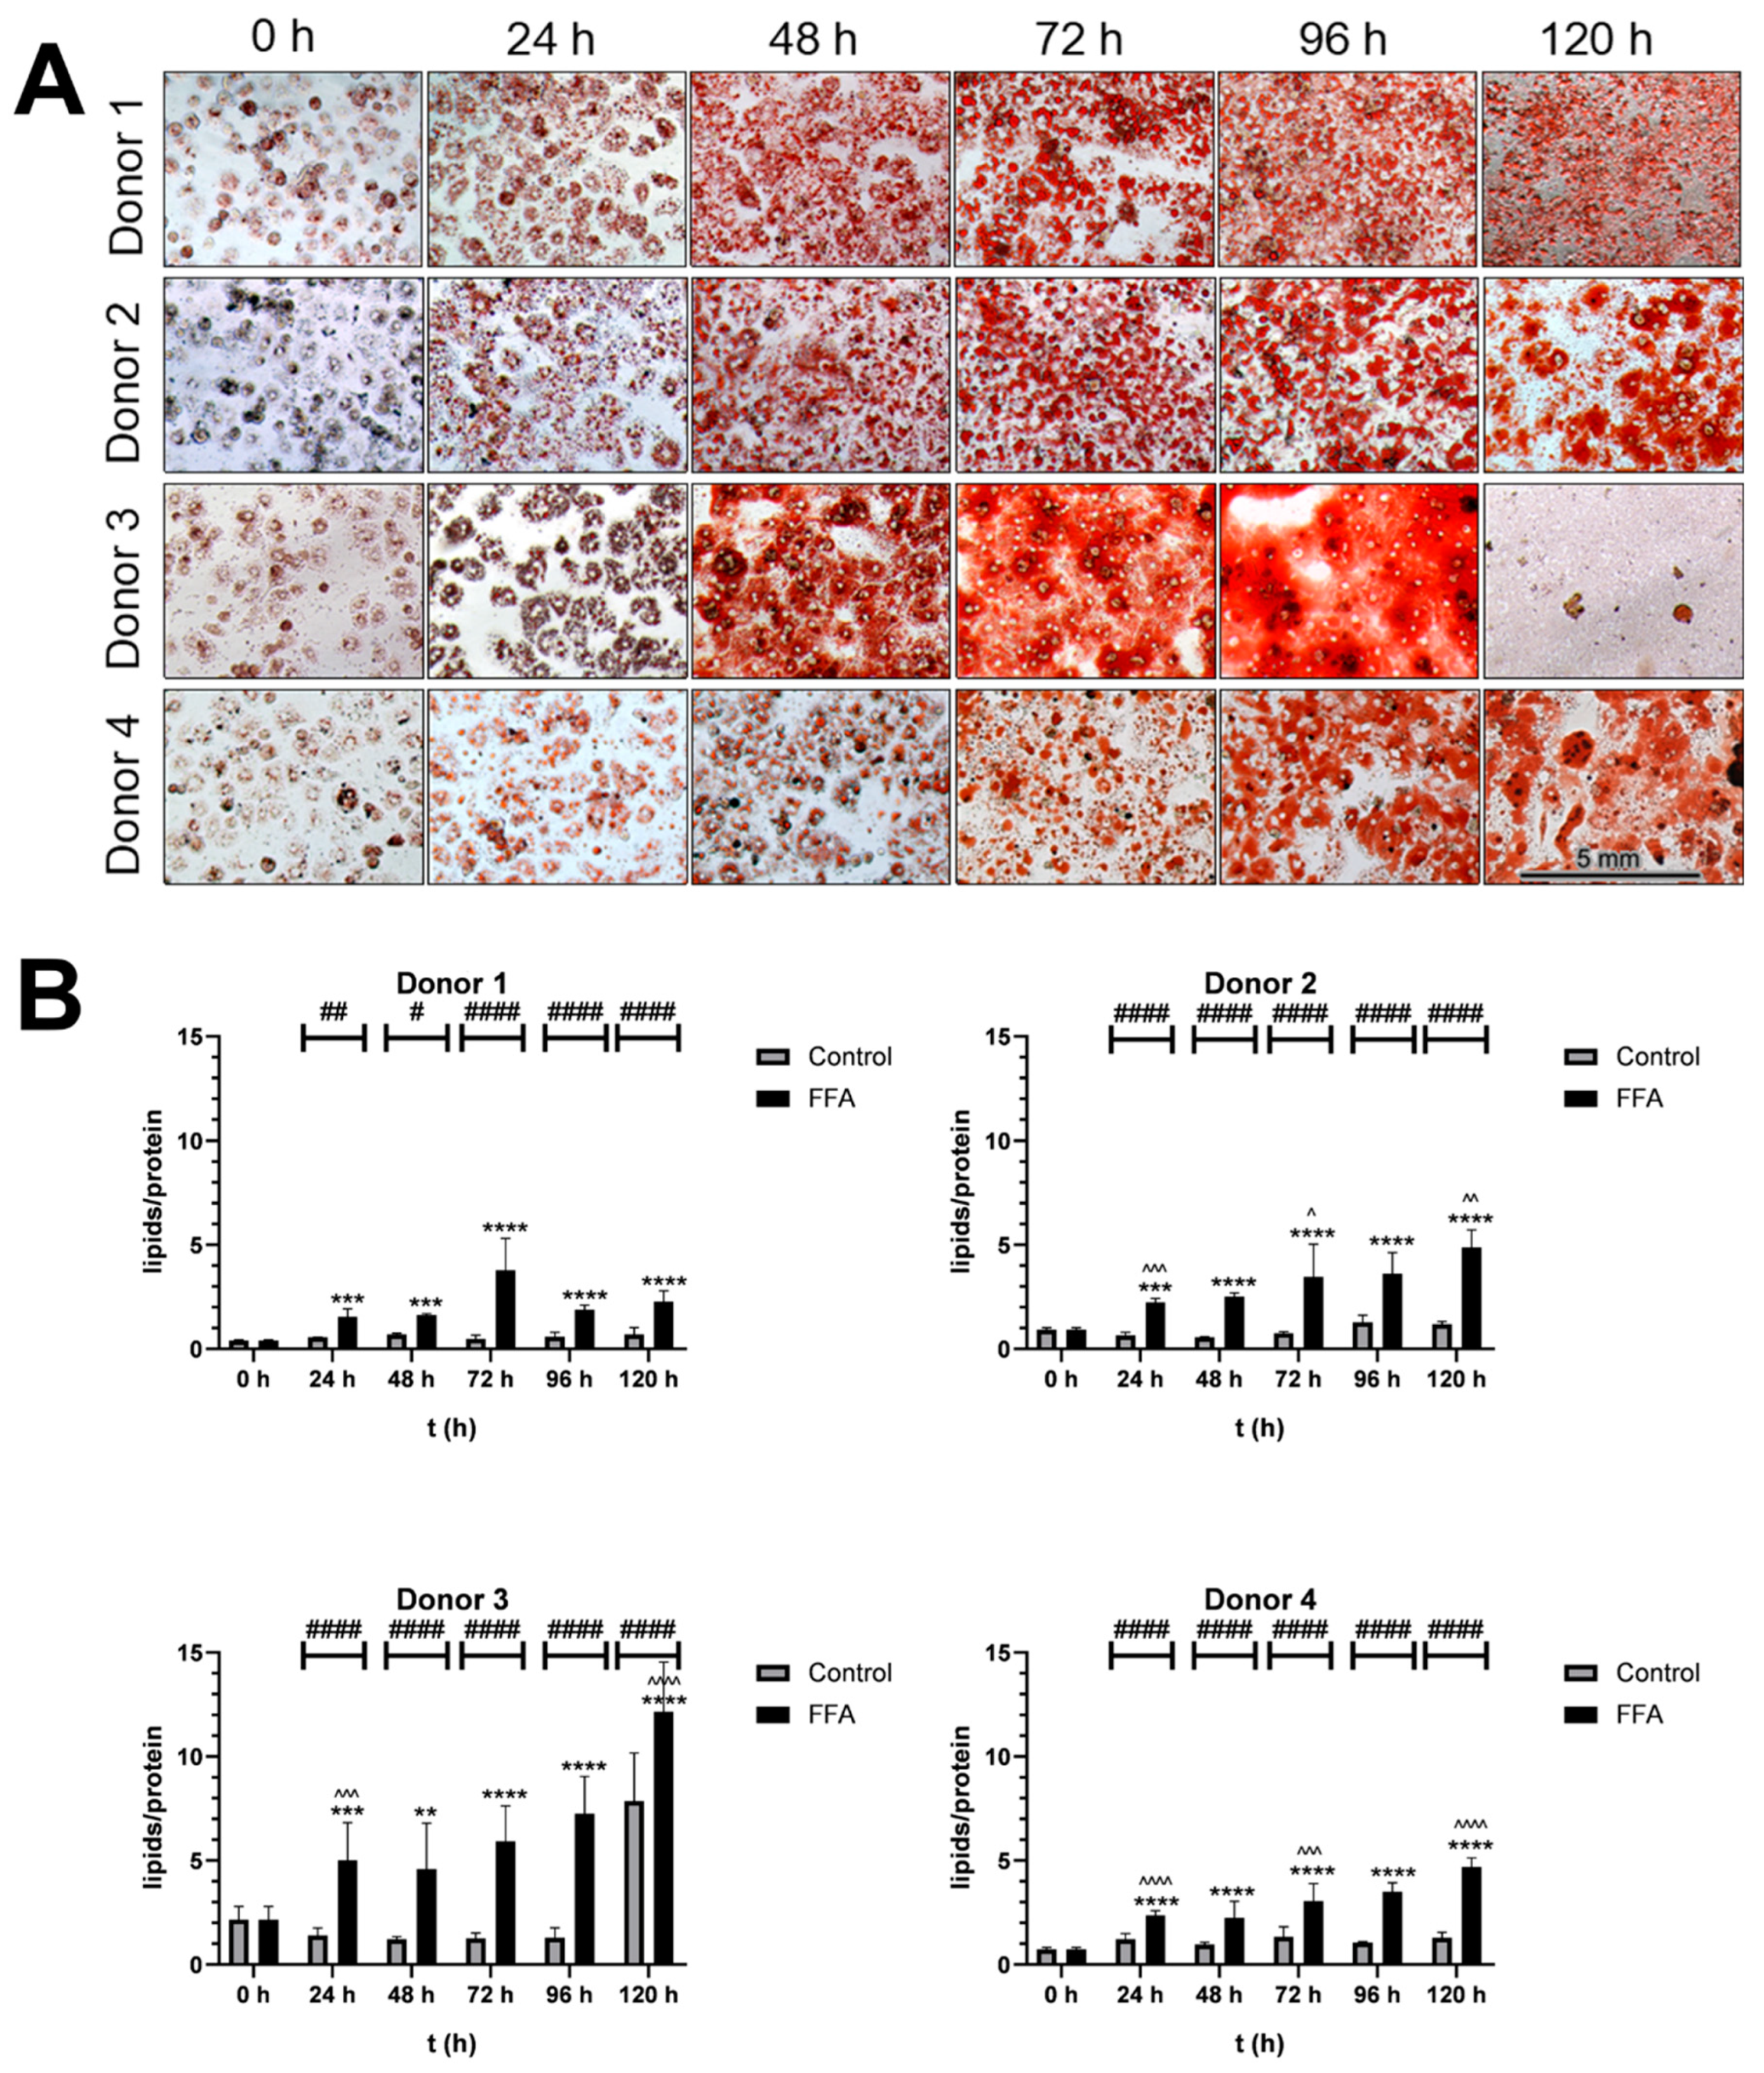
Figure 2.
Quantitative Analysis of FFA uptake, TAG excretion, and FFA metabolization. A. FFA uptake: FFA uptake was calculated as the difference between initial and measured FFA concentrations in 2 ml of medium per well, summed over the entire incubation period. Data are presented as mean + SD (n=4 biological replicates). Statistical analysis was performed using one-way ANOVA with Tukey’s post hoc test, and a one-sample t-test was used to compare the 24-hour value to a hypothetical baseline (0 mM). ****p < 0.0001. B. Comparison of FFA intake and FFA availability. C. TAG excretion: TAG excretion was calculated as the difference in TAG concentrations between FFA-treated and control supernatants in 2 ml of medium per well, summed over the entire incubation period. Data are presented as mean + SD (n=2 technical replicates). Statistical significance of TAG excretion at 24-hour intervals (****p < 0.0001, ***p < 0.001, *p < 0.05) or 120-hour interval (#### p< 0.0001) was determined using one-way ANOVA with Tukey’s post hoc test. D. FFA uptake and TAG formation: FFA uptake compared with FFA used for TAG formation (LD and VLDL). Data are shown as mean ± SD (n=4 biological replicates), with statistical analysis performed using two-way ANOVA and Tukey’s post hoc test (****p < 0.0001, ***p < 0.001). E. The Gap of FFA uptake to TAG formation (LD and VLDL): The gap between FFA uptake and TAG formation (LD and VLDL) was calculated over time (see Table S2 in the Supplement). Data are shown as mean ± SD (n=4 biological replicates). Statistical significance between time points was determined using one-way ANOVA with Tukey’s post hoc test (**p < 0.01, *p < 0.05).
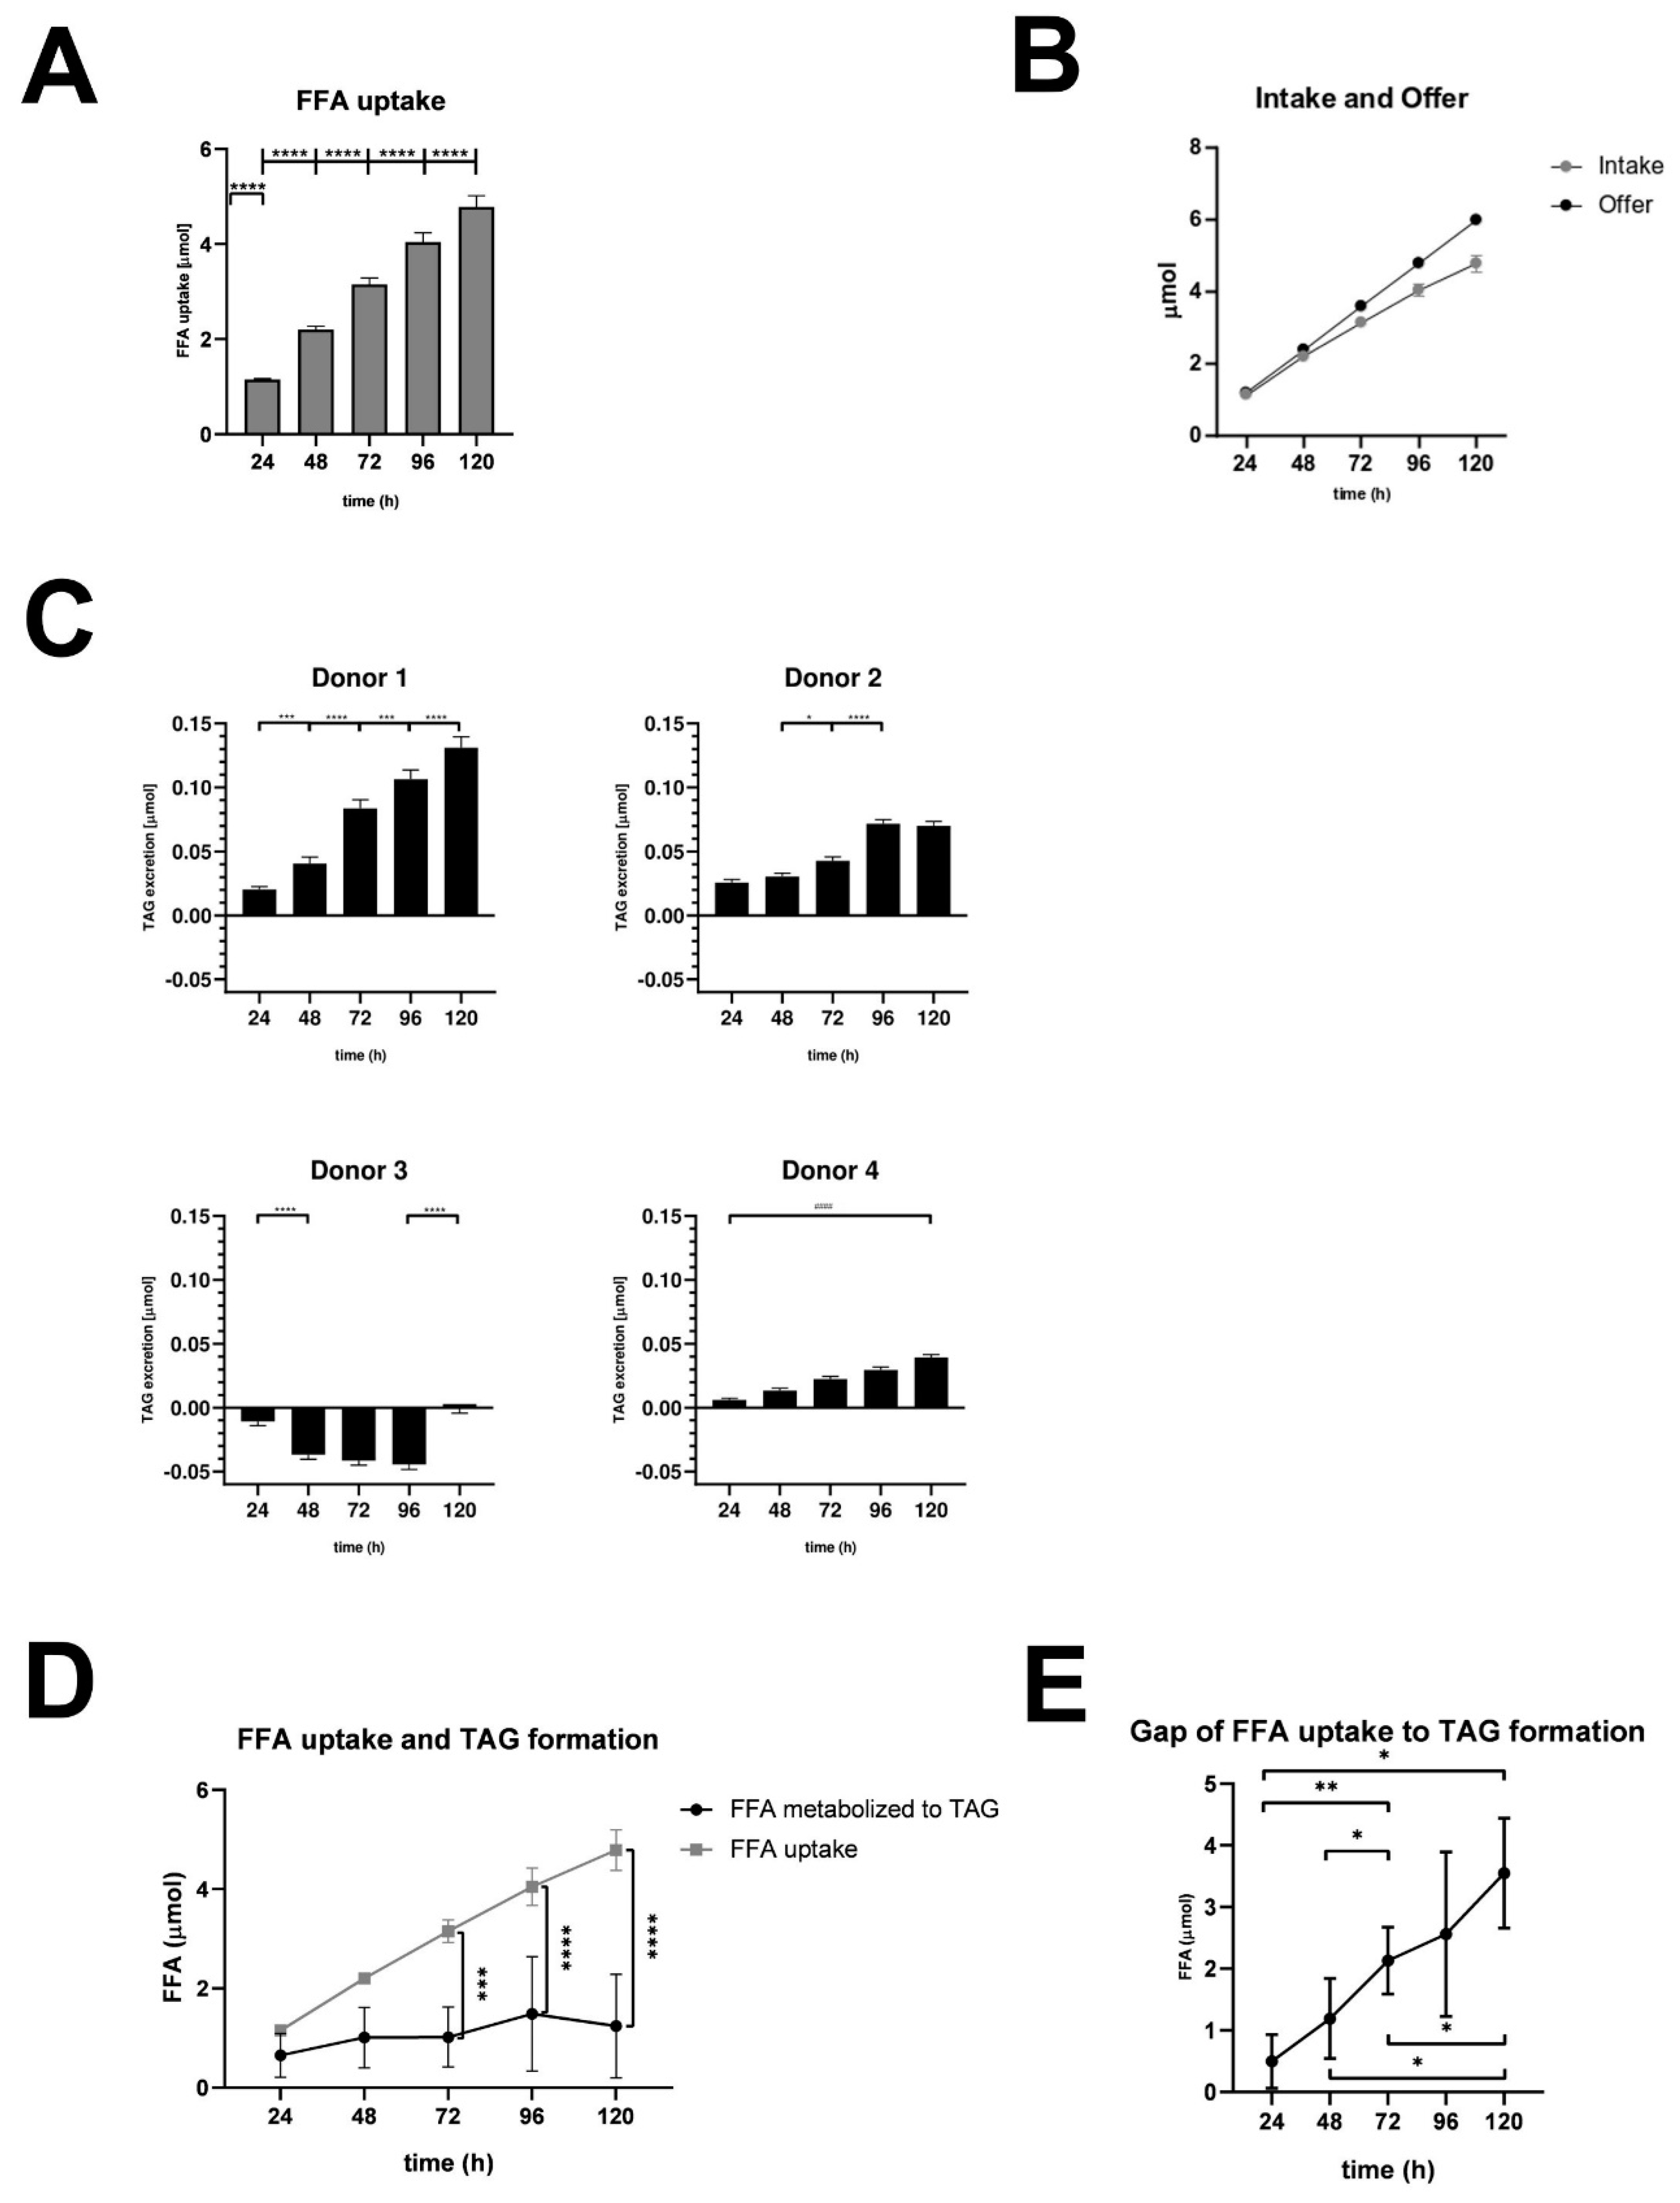
Figure 3.
Dynamics of lipid droplet formation. After cultivation and fixation of cells, LD were stained with Bodipy (green), cell membrane with Phalloidin iFluor (red) and nuclei with Hoechst (blue). Using a laser scanning microscope, n=5 areas per condition were recorded as z-stacks. One representative picture per condition was selected for this figure-.
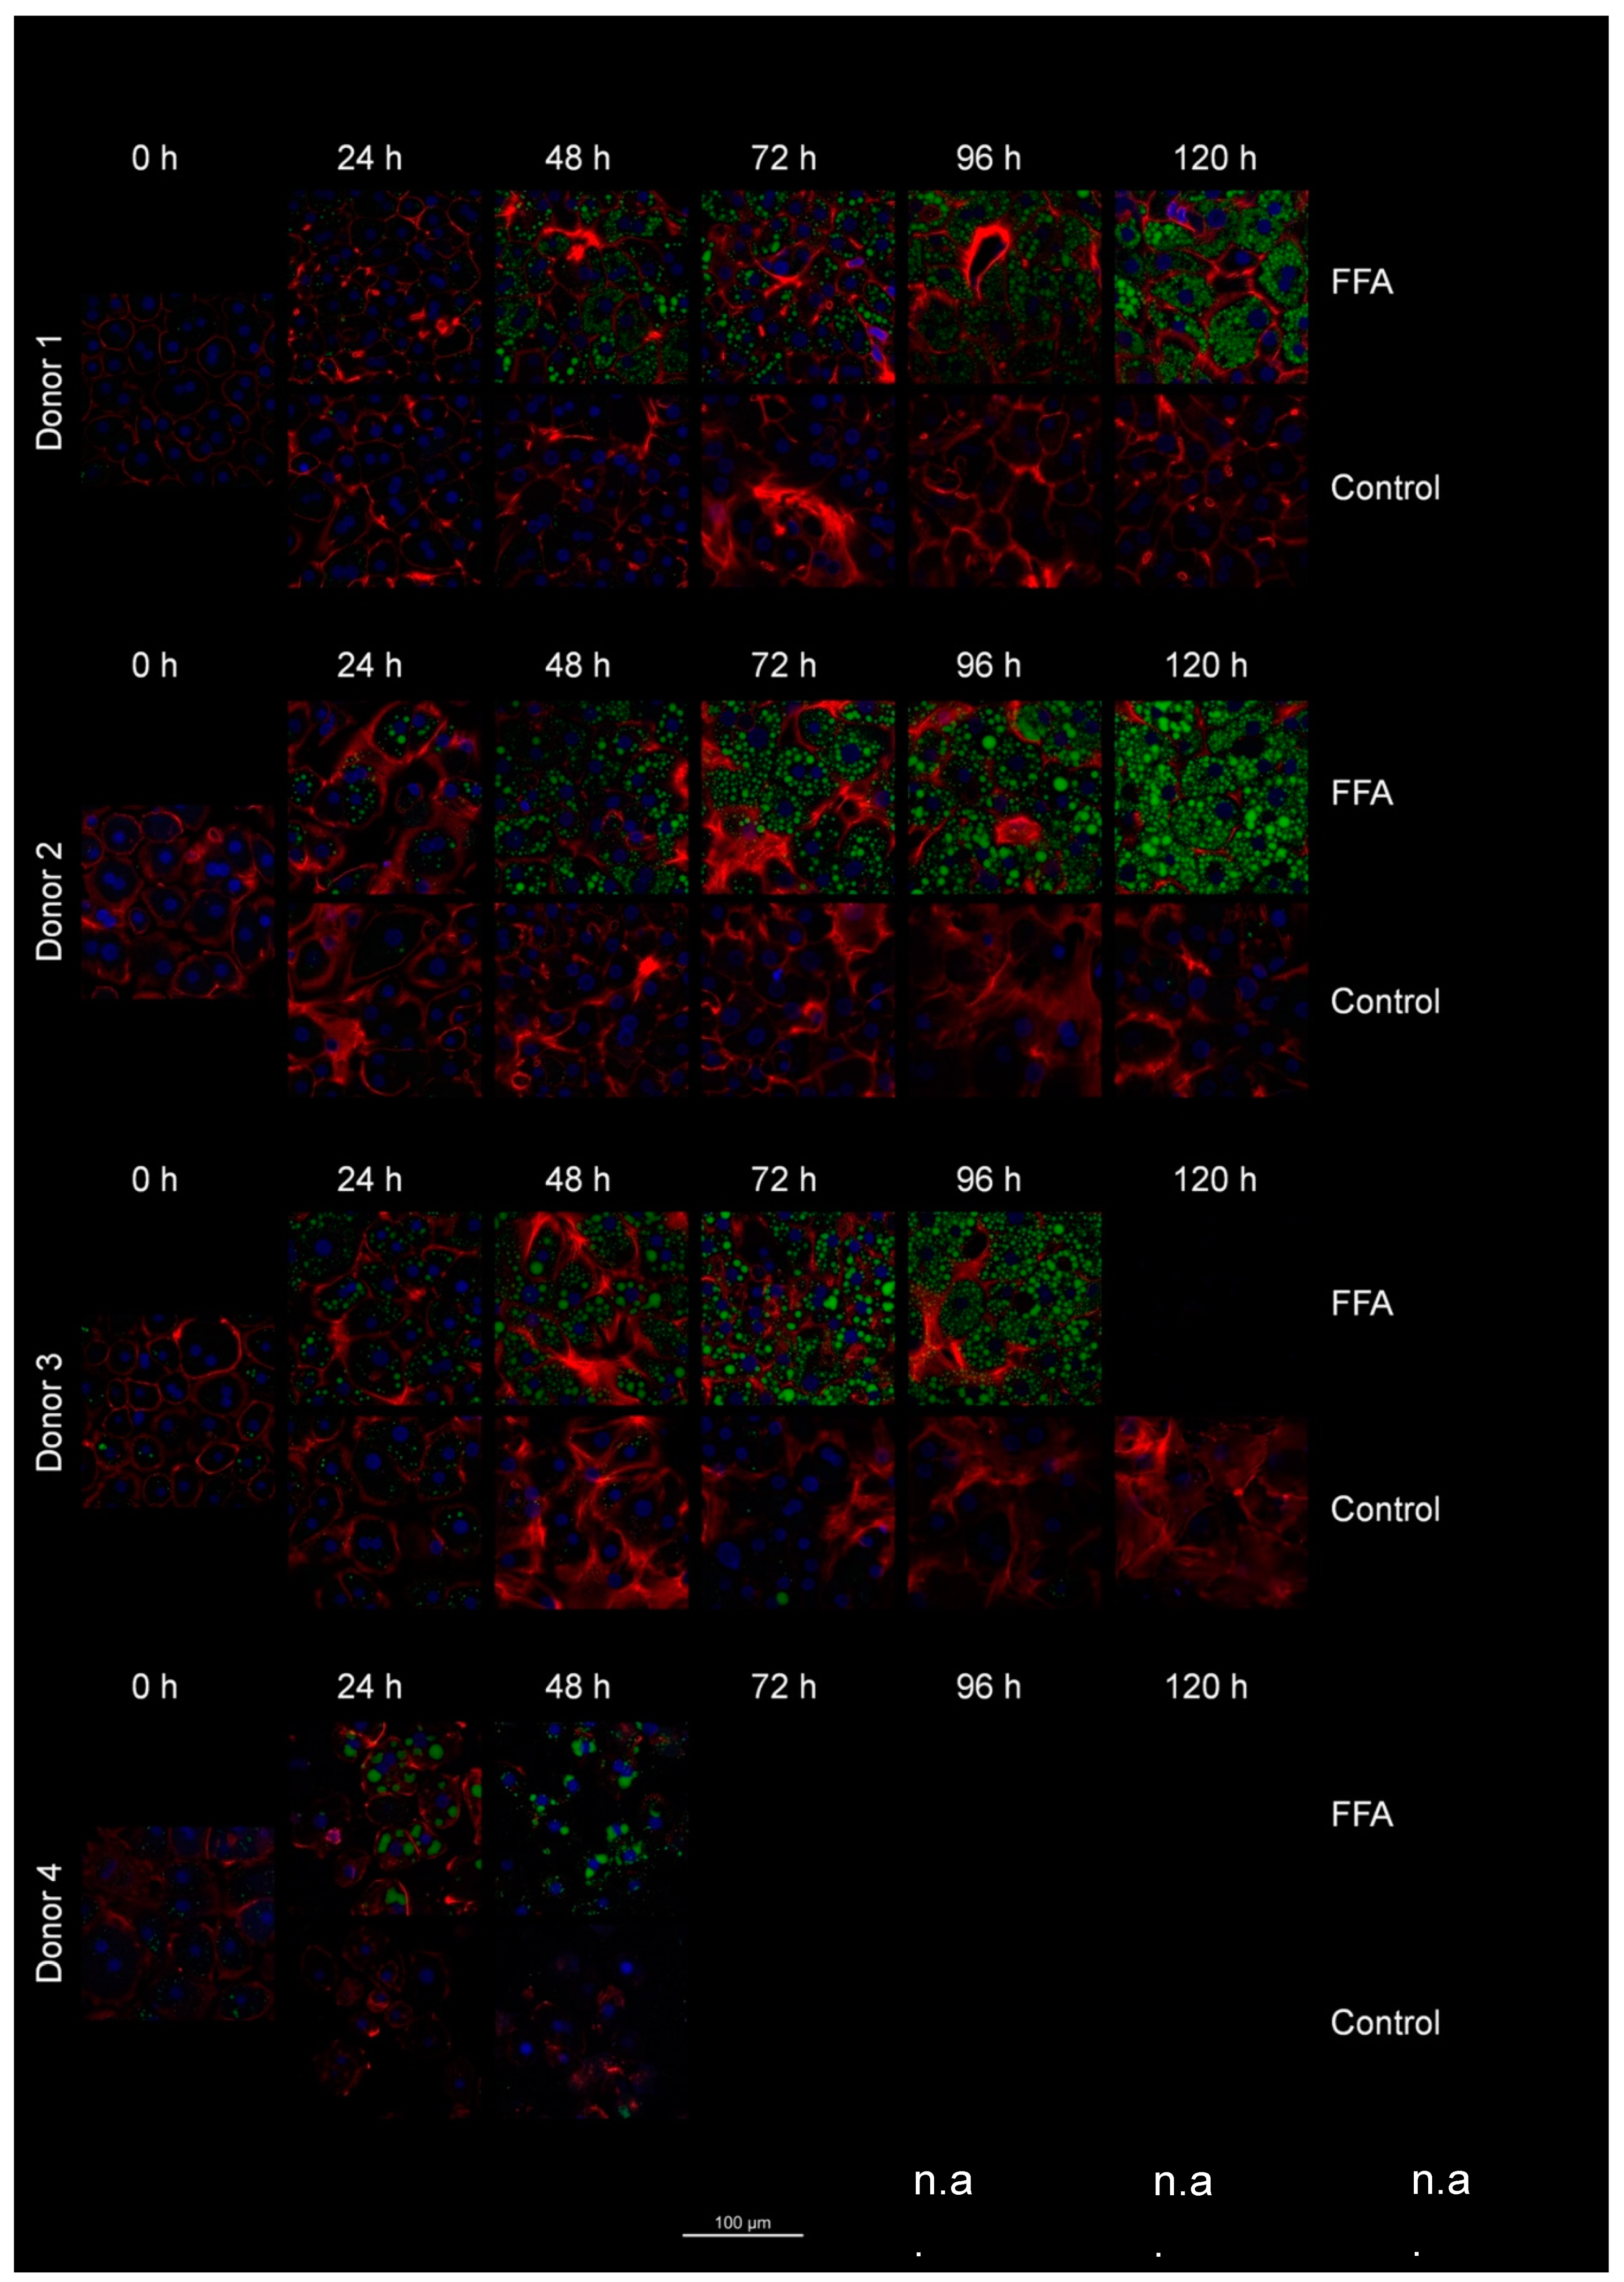
Figure 4.
Western Blot analysis. Expression of selected UPR markers over 120 A. Expression of cleaved per uncleaved ATF 6α in donor 1, B. Expression of IRE 1α in donor 4, C. Expression of PERK in donor 2, D. Expression of PPARα in donor 3, E. Expression of phosphorylated per unphosphorylated JNK, isoform sized 46 kDa in donor 4, F. Expression of CHOP in donor 1, G. Expression of MAP LC3β in donor 3, H. Expression of phosphorylated per unphosphorylated JNK, isoform sized 54 kDa in donor 4, Expression of cleaved per uncleaved PARP in donor 1. J. Target protein expression of donor 3. After 96 h expression decreased in FFA-treated cells and after 120 h also in control cells.
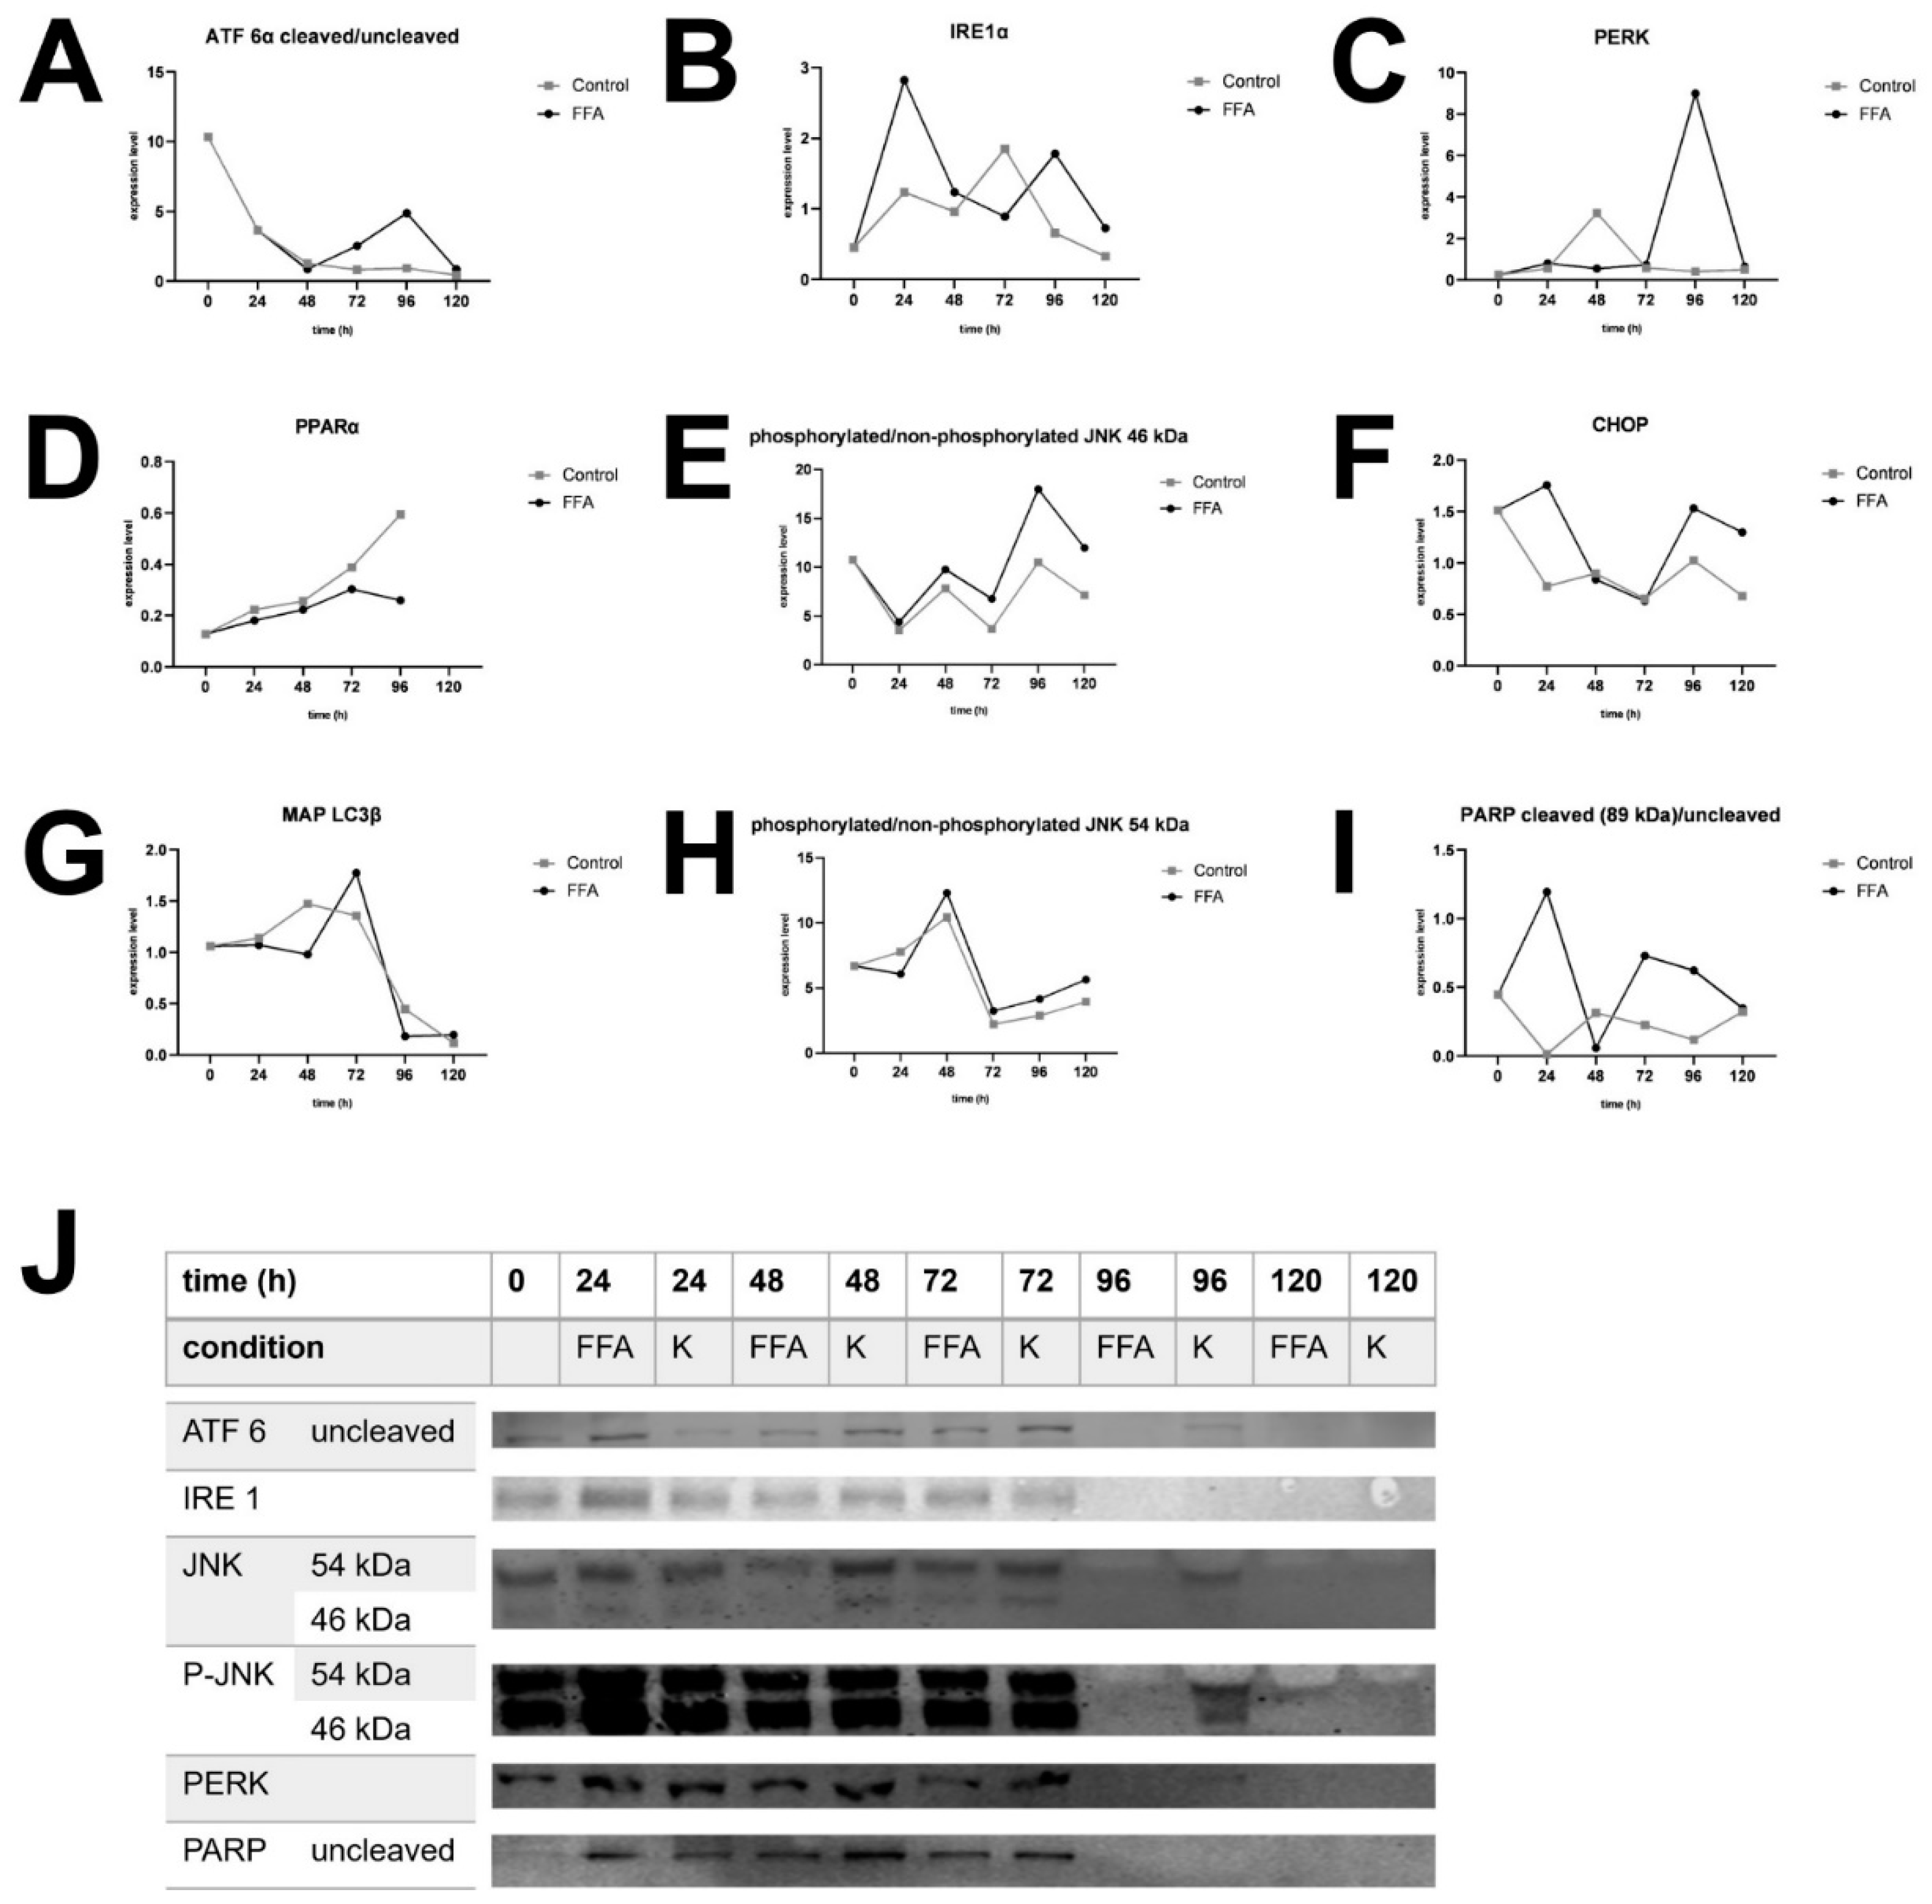
Figure 5.
Expression of UPR markers normalized to LDH in relation to TAG/SRB. Expression of selected UPR markers were analyzed with Western Blotting in FFA-treated PHH and normalized to total protein staining and positive control. In order to divide UPR signal from other cell stress (e.g. isolation-associated stress) values were divided by LDH expression. Expression values of FFA-treated cells (y axis) are shown in dependence on TAG-content (x axis). For trend fitting we used spline interpolation with Bezier curve.
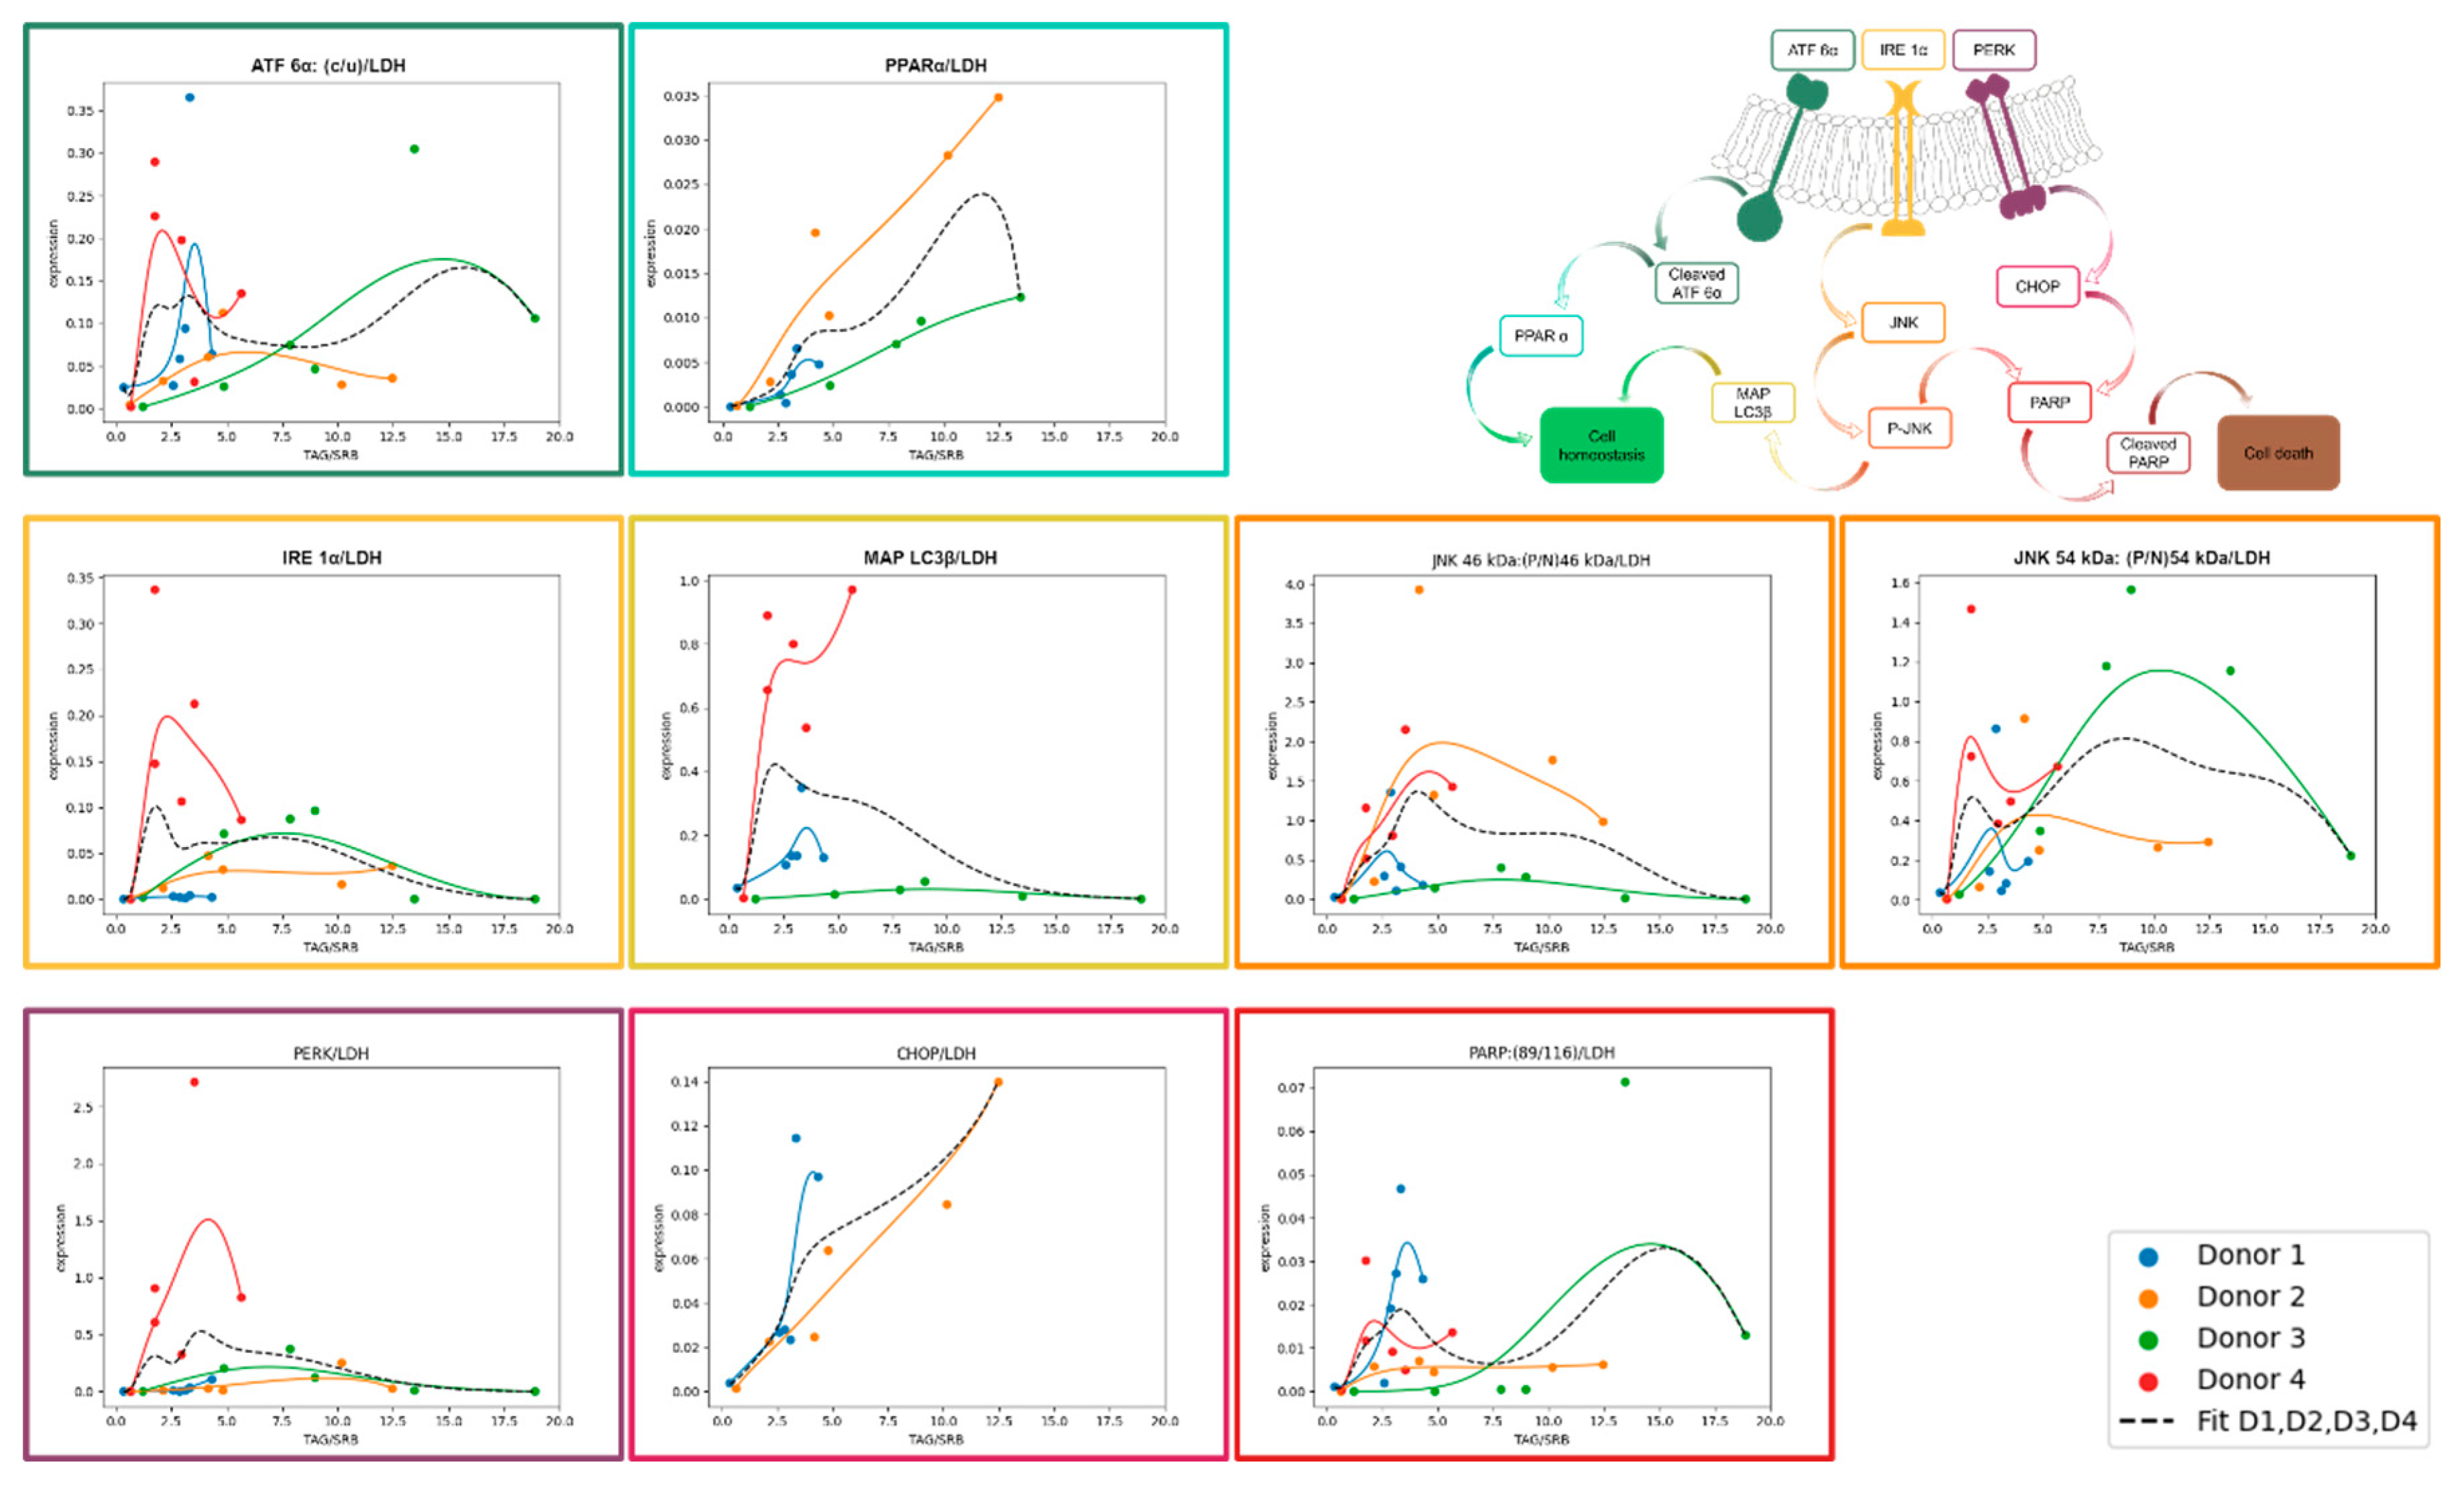
Figure 6.
Influence of FFA treatment on cell activity and dsDNA content in proliferating hepatocytes. Hep G2 cells were cultured with varying concentrations of FFA over 48 hours, medium was changed daily. Alamar Blue Assay was used to investigate cell activity, Sybr Green Assay for dsDNA content. Data are shown as means ±SD, n=3 biological replicates (including 10 technical replicates per each). Two-way ANOVA and post hoc Tukey’s test was used for statistical analysis. Vertical markers depict significant changes over time: 0 vs 24h (####: p<0.0001, ###: p<0.001, #: p<0.05) or 0 vs 48h (****: p<0.0001, ***: p<0.001, **: p<0.01, *: p<0.05). Horizontal markers depict significant changes after treatment with varying FFA concentrations in comparison to control (0 mM) after 48 hours (****: p<0.0001, ***: p<0.001, **: p<0.01, *: p<0.05).
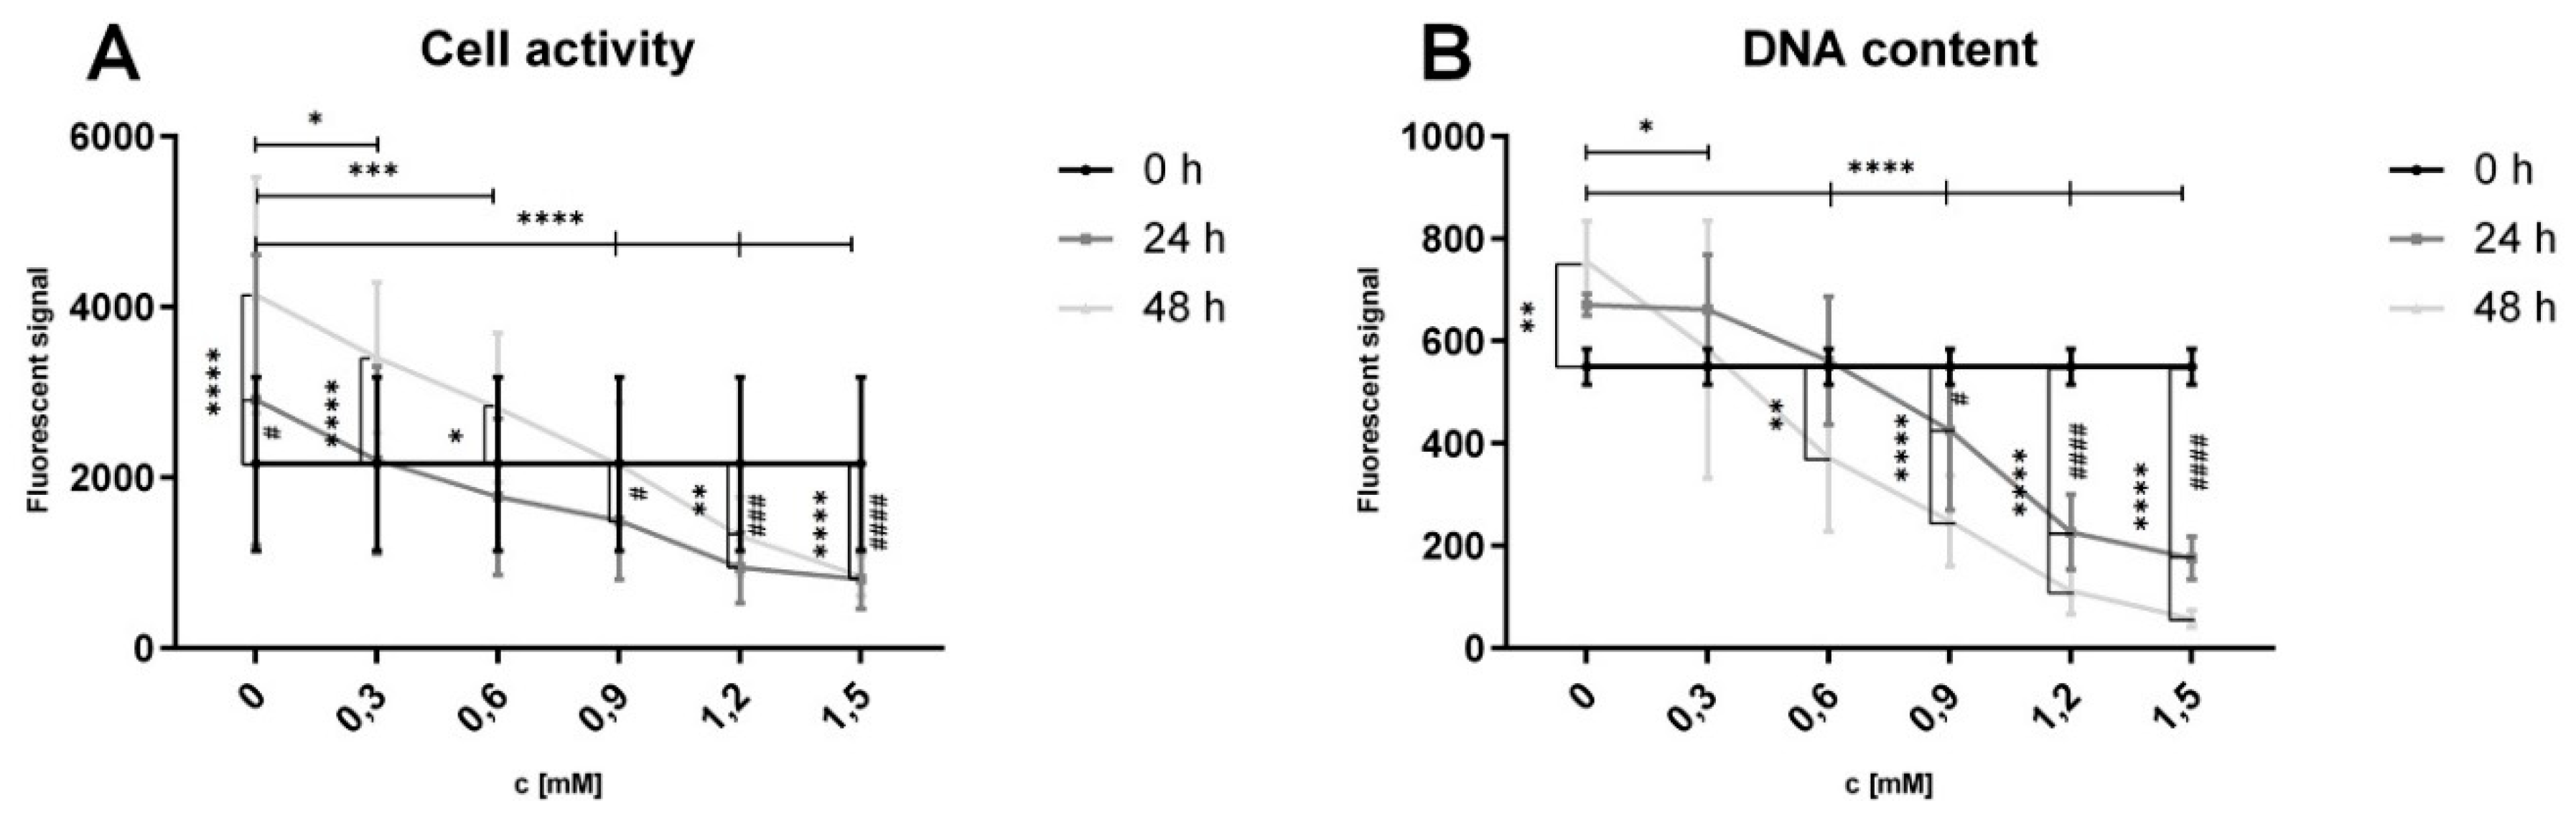

Table 1.
Donor characteristics.
| Donor | Age | Sex | Diagnosis | BMI (kg/m2) |
|---|---|---|---|---|
| Donor 1 | 39 | Female | FNH 1 | 19.9 |
| Donor 2 | 68 | Male | PHC 2 | 30 |
| Donor 3 | 71 | Female | iCCA 3 | 18 |
| Donor 4 | 85 | Female | XGC and BH 4 | 19.2 |
1 Focal nodular hyperplasia; 2 Perihilar cholangiocarcinoma; 3 Intrahepatic cholangiocarcinoma, 4 XGC: Xanthogranulomatous cholecystitis; BH: Biliary hamartoma.
Disclaimer/Publisher’s Note: The statements, opinions and data contained in all publications are solely those of the individual author(s) and contributor(s) and not of MDPI and/or the editor(s). MDPI and/or the editor(s) disclaim responsibility for any injury to people or property resulting from any ideas, methods, instructions or products referred to in the content. |
© 2024 by the authors. Licensee MDPI, Basel, Switzerland. This article is an open access article distributed under the terms and conditions of the Creative Commons Attribution (CC BY) license (http://creativecommons.org/licenses/by/4.0/).
Copyright: This open access article is published under a Creative Commons CC BY 4.0 license, which permit the free download, distribution, and reuse, provided that the author and preprint are cited in any reuse.


