
Submitted:
30 December 2024
Posted:
31 December 2024
You are already at the latest version
Abstract
Metabolic dysfunction-associated steatotic liver disease (MASLD) is a global health concern associated with various metabolic disorders and a high prevalence of vitamin D deficiency. Current animal models face limitations in accurately mimicking human metabolic pathways and are constrained by ethical considerations. This study aimed to develop an in vitro MASLD-induced liver micro-organoid model to investigate the impact of MASLD on vitamin D metabolism. The model incorporates HepaRG cells as hepatocytes, LX-2 cells as stellate cells, and human umbilical vein endothelial cells (HUVECs). Fatty liver characteristics were induced by treating the micro-organoids with palmitic/oleic acids. fatty acid accumulation was quantified and visualized using Bodipy staining. The expression of genes involved in drug and vitamin D metabolism was evaluated by RT-PCR. Dot blot analysis assessed secreted proteins indicative of liver damage. ELISA was used to examine vitamin D metabolism. The results confirmed the successful induction of MASLD, evidenced by altered cytochrome P450 gene expression, elevated markers of liver damage, and reduced vitamin D metabolism. These findings align with clinical studies and RNA-sequencing data from liver biopsies of MASLD patients. This innovative micro-organoid platform offers a robust tool for studying the molecular mechanisms of MASLD and represents a promising alternative to animal experiments.
Keywords:
MASLD
; Vitamin D
; Liver Micro-Organoids
; In Vitro Model
; Metabolic activity
1. Introduction
Metabolic dysfunction–associated fatty liver disease (MAFLD) is a leading cause of chronic liver disease [1] and has become a major health concern throughout the world [2,3]. In Germany alone, more than 18 million individuals have been diagnosed with MASLD [4]. This disease is characterized by increased lipid accumulation in more than 5% of hepatocytes [5]. It involves a spectrum of liver disorders ranging from simple steatosis (fatty liver) to metabolic dysfunction–associated steatohepatitis (MASH), which represents an advanced stage of MASLD and carries a higher risk for progressive liver damage, fibrosis, cirrhosis, and even in rare cases hepatocellular carcinoma [6].
Recently, there has been increased interest in the interplay between MASLD and vitamin D metabolism [7,8]. Vitamin D is an essential fat-soluble vitamin that plays a key role in maintaining calcium balance, supporting immune function, and exhibiting anti-inflammatory and anti-fibrotic properties [9,10,11]. These properties suggest vitamin D might reduce inflammation and fibrosis under liver damage. Furthermore, vitamin D deficiency has been linked to insulin resistance, a key feature of metabolic syndrome, contributing to the development of MASLD [12].
Vitamin D precursors (D2, D3) are obtained through dietary intake or synthesized from 7-dehydrocholesterol in the skin via ultraviolet (UV) light exposure [9,13]. Further vitamin D metabolism involves hydroxylation in the liver by cytochrome P450 (CYP) enzymes, including CYP2R1 and CYP27A1, to form 25-hydroxyvitamin D3 (25(OH)D3), the main circulating form of vitamin D [9]. The kidney further converts this into the active form of vitamin D, namely 1,25-dihydroxyvitamin D3 (1,25(OH)2D3) [13]. Any disruptions in these processes can significantly impact vitamin D levels and contribute to various health concerns [9,11,14].
Clinical studies have established an association between MASLD and altered vitamin D levels [8,15]. Unfortunately, these studies alone cannot fully explain the complex molecular changes and interactions that occur in the liver [16]. Research on vitamin D supplementation has shown conflicting results [12]. While different studies demonstrated the positive effects of vitamin D supplements in improving liver health [15,17,18], others did not confirm this benefit [19,20,21,22]. Therefore, more detailed studies are needed to better understand the mechanisms underlying MASLD and vitamin D deficiency.
Animal models are actually considered the gold standard for investigating disease mechanisms [23,24]. These models showed a correlation between vitamin D and MASLD. They also provided mechanistic insights into how vitamin D may influence lipid metabolism, inflammation, and fibrosis in the liver [25,26]. However, ethical concerns and interspecies differences limit their applications [27]. In vitro models using cells of human origin represent a promising alternative [28,29]. Freshly isolated primary human hepatocytes (PHHs) are the standard choice for such research. They retain essential liver functions required for disease progression, but their limited availability, scarcity, and inter-donor variability compromise experimental reproducibility [30]. Immortalized cell lines can overcome some of these issues. Still, their metabolic activity is strongly reduced compared with PHHs [28]. However, HepaRG cells are an exception to this limitation and have become a valuable in vitro model that can serve as a possible alternative to PHHs [31,32,33]. These progenitor cells can differentiate into biliary and hepatocyte cells and retain many functional characteristics of freshly isolated PHHs [34]. Despite their comparable metabolic capacity, HepaRG cells alone cannot mimic the liver’s complex architecture and cellular interactions, which are crucial to model MASLD accurately [35,36]. To overcome this limitation, an already established model incorporating additional cell types, such as LX-2 cells and human umbilical vein endothelial cells (HUVECs), has been utilized [37]. LX-2 cells are hepatic stellate cells; they are involved in lipid metabolism, can respond to lipid overload, and play a vital role in the progression of MASLD to fibrosis [38]. HUVECs help recreate the liver’s vascular environment, facilitating proper cellular interactions and nutrient exchange [39]. This previous study demonstrated the effectiveness of this cell combination. HepaRG cells maintained their drug metabolizing capability for 7 days. Additionally, activated LX-2 cells successfully induced fibrosis-like changes. The fibrotic-like organoid model also showed reduced liver functions, such as metabolic activity and albumin secretion, replicating in vivo observations [37]. These findings indicate that this cell combination provides a robust and physiologically relevant in vitro model for studying liver diseases.
This study aims to explore the molecular mechanisms underlying MASLD and its impact on vitamin D metabolism using this advanced liver micro-organoid model, providing a valuable platform for research and an alternative to animal models.
2. Materials and Methods
If not otherwise stated, all cell culture reagents and chemicals were purchased from Sigma Aldrich (Taufkirchen, Germany). Growth factors were purchased from Peprotech (Hamburg, Germany)
2.1. Cell Culture
In this study, three human cell lines were used. Undifferentiated HepaRG cells (Biopredic International, Saint Grégoire, France) were cultivated according to the standard protocol from Biopredic [34]. Briefly, HepaRG cells were grown in a T75 flask for two weeks (proliferation phase) in Williams Medium containing 10% fetal calf serum (FCS; 10270-106, Life Technologies), 2 mM L-Glutamine, 100 U/mL Penicillin/Streptomycin, 5 µg/mL Insulin (Novo Nordisk, Bagsvaerd, Dänemark) and 50 µM Hydrocortisone (Pfizer, New York, USA) [32].
LX-2 cells (PromoCell, Heidelberg, Germany) were cultured in Dulbecco’s modified Eagle’s medium containing 2% FCS, 2 mM L-Glutamine, and 100 U/mL Penicillin/Streptomycin [37].
HUVEC cells (kindly provided by Prof. Alexander-Friedrich) were cultured in 0.1% gelatin pre-coated T75 flask in Endothelial Cell Growth Basal Medium 2 (PromoCell, Heidelberg, Germany) supplemented with 2% FCS, 1% Antibiotic/Antimycotic, 0.5 ng/mL human Vascular Endothelial Growth Factor 165, 10 ng/mL human fibroblast growth factor, 5 ng/mL human Epidermal growth factor, 20 ng/mL recombinant analog of human insulin-like growth factor, 22.5 µg/mL Heparin (Leo Pharma, Bellerup, Denmark), 0.2 µg/mL Hydrocortisone, and 1 µg/mL L-ascorbic acid.
All cells were cultured at 37 °C in a humidified atmosphere with 5% CO2 until confluence, and the culture media was changed three times a week.
2.2. Generation of Liver Micro-Organoids
Non-adherent agarose microwell plates were prepared as previously described [37]. Briefly, 3.2 mL of warm 2% agarose was added to a well of a 6-well plate. While the agarose was still liquid, a mold with 300 pyramidal microwells (each 800 µm in diameter) was pressed into the agarose. The mold, made from polydimethylsiloxane, was kindly provided by Prof. Vosough. After the agarose solidified, the mold was gently removed, and the plate was sterilized under UV light for 1 h [37].
For liver micro-organoid seeding, a cell suspension of HepaRG, LX-2, and HUVEC cells was prepared in a 4:2:1 ratio. The cell density used for seeding was 1000 cells per microwell. The plates were centrifuged at 1200 rpm for 3 min to capture the cells in the microwells and ensure equal distribution. The cells were cultivated for two days in a mix of HepaRG and HUVEC culture media (50:50). For the following two weeks, 1.7% dimethyl sulfoxide (DMSO) was added to the media to induce HepaRG cell differentiation. The media was changed three times per week.
2.3. MASLD Induction in Liver Micro-Organoids
For MASLD induction, a protocol for the induction of hepatic steatosis in PHH was adapted [40]. Briefly, after the differentiation of liver micro-organoids, the culture media was replaced with control or FFA-containing liver micro-organoid media (50:50 mix of HepaRG and HUVEC culture media) for 7 days. Stimulation was repeated with every media change thrice a week. The FFA mix consists of 0.6 mM oleic and palmitic acid at a ratio of 2:1, dissolved in Methanol at 50 °C, stored at -20 °C, and thawed once at 50 °C before use. As a control, organoids were treated with Methanol without FFA.
2.4. Mitochondrial Activity
Resazurin conversion was used to measure cell viability as previously described [37]. The organoids were collected in Eppendorf tubes, washed 3 times with phosphate-buffered saline (PBS), and incubated in 0.0025% w/v resazurin in PBS for 120 min at 37 °C. After incubation, 100 µL supernatant was transferred to a 96-well plate, and the fluorescence was measured with an excitation wavelength of 544 nm and an emission wavelength of 590 nm using an OMEGA plate reader (BMG Labtech, Ortenberg, Germany).
2.5. DNA Isolation and Quantification
For cell viability assessment and normalization, DNA quantification was performed as previously described [41]. Liver micro-organoids were collected from agarose microwell plates, washed with PBS, and lysed with heated (98 °C) 50 mM NaOH solution. The samples were frozen at -20 °C. The following day, thawed samples were neutralized with Tris (0.1 M, pH 8) and centrifuged at 14,000× g for 10 min to remove impurities. DNA concentration was then quantified using an OMEGA plate reader.
2.6. Lactate Dehydrogenase
Following the manufacturer’s instructions, lactate dehydrogenase (LDH) was measured using CytoTox-ONE Homogeneous Membrane Integrity Assay (Promega, Madison, USA). Briefly, 100 μL cell culture media was transferred into a 96-well plate, and the same volume of CytoTox-ONE Reagent was added. After 10 min at room temperature, 50 μL of the stop solution was added. Afterward, fluorescence was measured with an excitation wavelength of 560 nm and an emission wavelength of 590 nm using an OMEGA plate reader.
2.7. Live-Dead Staining
Live-dead staining was performed using Calcein AM and ethidium bromide to assess the viability of liver micro-organoids [42]. Organoids were washed three times with PBS and incubated with 2 µM Calcein AM and 4 µM ethidium bromide in PBS for 30 min at 37 °C. Images were taken using the EVOS FL fluorescence microscope (Life Technologies, Darmstadt, Germany).
2.8. Fatty Acid Quantification and Fluorescence Microscopy
Intracellular lipid accumulation was visualized using Bodipy 493/503 [43]. Organoids were washed thrice with PBS and stained with 5 µM Bodipy in PBS for 30 min at 37 °C. Images were taken using the EVOS FL fluorescence microscope, and fluorescence was measured with an excitation wavelength of 485-12 nm and an emission wavelength of 520 nm using an OMEGA plate reader.
2.9. RNA Isolation, cDNA Synthesis, and PCR Analysis
As previously described, total RNA was extracted from the liver micro-organoids using self-made Trifast [44]. RNA quantity and purity were assessed using an OMEGA plate reader. Subsequently, 2.5 µg of purified RNA was used for cDNA synthesis employing a commercially available cDNA reverse-transcription kit (Thermo Fisher Scientific, Massachusetts, the USA) according to the manufacturer’s instructions. PCR was performed with sets of primers listed in Table 1 and using the Red HS Taq Master Mix (Biozym, Vienna, Austria) according to the manufacturer’s protocol. The amplified PCR products were visualized on an agarose gel containing ethidium bromide. Densitometric analysis of the bands was performed using ImageJ software (V. 1.54f, National Institute of Health, USA) for relative quantification of gene expression. The data were normalized to the expression of the housekeeping gene HPRT1.
2.10. Dot Blot Analysis
Secreted protein levels in the cell culture supernatants were quantified using dot blot analysis as previously described [33]. Briefly, 100 μL of each sample was spotted onto a nitrocellulose membrane using a 96-well dot-blotter (Carl Roth, Karlsruhe, Germany). The transfer of proteins was confirmed by Ponceau staining. The membrane was blocked with 5% bovine serum albumin in TRIS-buffered saline/Tween-20 (TBS-T) for 1 h, then incubated with primary antibodies against tissue nonspecific alkaline phosphatase (AP; sc-23430; Santa Cruz Biotech, Heidelberg, Germany) or Procollagen type 1 n-terminals propeptide (PINP; abx131414; Abbexa, Cambridge, UK) (1:1000 in TBS-T) for 1 h at room temperature and overnight at 4 °C. After washing, the membrane was incubated with the corresponding HRP-conjugated secondary antibodies (1:10,000 in TBS-T) for 1 h at room temperature. Protein dots were visualized using enhanced chemiluminescence reagent and imaged with a CCD camera (INTAS, Göttingen, Germany). Dot intensities were quantified using ImageJ software, with values normalized to the total proteins quantified using Ponceau staining for each sample.
2.11. Vitamin D Metabolism Activity Using Enzyme-Linked Immunosorbent Assays
Liver micro-organoids were washed trice with PBS and incubated with 20 µM vitamin D in plain Williams medium. After 4 h, the supernatants were stored at -80 °C for the analysis, and the organoids were collected for DNA isolation. An enzyme-linked immunosorbent assay (ELISA) kit for 25(OH)D3 (Immunodiagnostic Systems, Frankfurt, Germany) was used according to the manufacturer’s protocol. Absorbance was measured using an Omega Plate Reader, and concentrations were calculated from standard curves generated with known concentrations of 25(OH)D3. The concentrations were normalized to the total DNA of each condition.
2.12. Bioinformatics RNA-Sequencing Analysis
RNA-Seq analysis was performed on liver micro-organoids to identify genes affected by MAFLD. Raw sequence reads were downloaded from the NCBI (accession number PRJEB58091) [45]. Quality control was performed using FastQC, and reads were trimmed for adapters and low-quality. The processed reads were aligned to the human reference genome (GRCh38) using HISAT2 (version 2.1). Gene expression levels were quantified by counting mapped reads using featureCounts (version 2.0.1) from the Subread package. Raw counts were normalized to Transcripts Per Million (TPM) for between-sample comparisons. Differential expression analysis was conducted using DESeq2 (version 1.30.1) in R (version 4.0.3).
2.13. Statistical Analysis
All values are represented as mean ± SEM of three independent experiments (N = 3). Statistical significance was tested using one-way ANOVA (nonparametric Kruskal-Wallis test), followed by Dunn’s multiple comparison test (GraphPad Prism 8 Software, San Diego, USA). All statistical comparisons were performed two-sided in the sense of an exploratory data analysis using p < 0.05 (*) and p < 0.01 (**) as a level of significance.
3. Results
3.1. RNA-Sequencing Data Shows Impaired Expression of Genes Involved in Vitamin D Metabolism and Signaling
To explore the possible molecular mechanism underlying vitamin D deficiency in patients with MASLD, RNA-sequencing data of liver biopsies from 18 patients with MASLD and 17 controls were analyzed. Figure 1 shows no significant differences in the expression of genes involved in vitamin D transport, catabolism, and anabolism, specifically vitamin-D-binding protein (DBP), 7-dihydroxycholesterol-reductase (DHCR7), and CYP7A1. However, there was a significant decrease in the expression of CYP27A1 and a notable reduction in the expression of the vitamin D receptor (VDR).
3.2. Effects of Oleic and Palmitic Acid Treatment on Liver Micro-Organoid Viability
To induce MASLD, the micro-organoids are treated with FFA, however, non-cytotoxic concentrations are needed. Figure 2a–c shows that FFA treatment did not significantly affect cell viability. Live/dead staining (Figure 2d) revealed predominantly esterase activity (calcein AM green staining for live cells), indicating good overall viability across the organoids. However, free DNA (ethidium bromide red staining for dead cells) was observed at the highest FFA concentration (1000 μM), suggesting a cytotoxic effect.
3.3. Visualization and Quantification of Lipid Accumulation in Liver Micro-Organoids Treated with Oleic and Palmitic Acids
It has been described that MASLD hepatocytes take up lipids. Therefore, lipid accumulation in micro-organoids treated with FFA for 7 days was evaluated. Figure 3a demonstrates a clear increase in Bodipy fluorescence intensity (green) with increasing FFA concentrations. This visualization confirms the accumulation of fatty acids within the cells. The corresponding quantitative data in Figure 3b further strengthens this observation, showing a significant dose-dependent increase in the lipid content.
3.4. Gene Expression Analysis of Fatty Acid Metabolism in Liver Micro-Organoids Treated with Oleic and Palmitic Acids
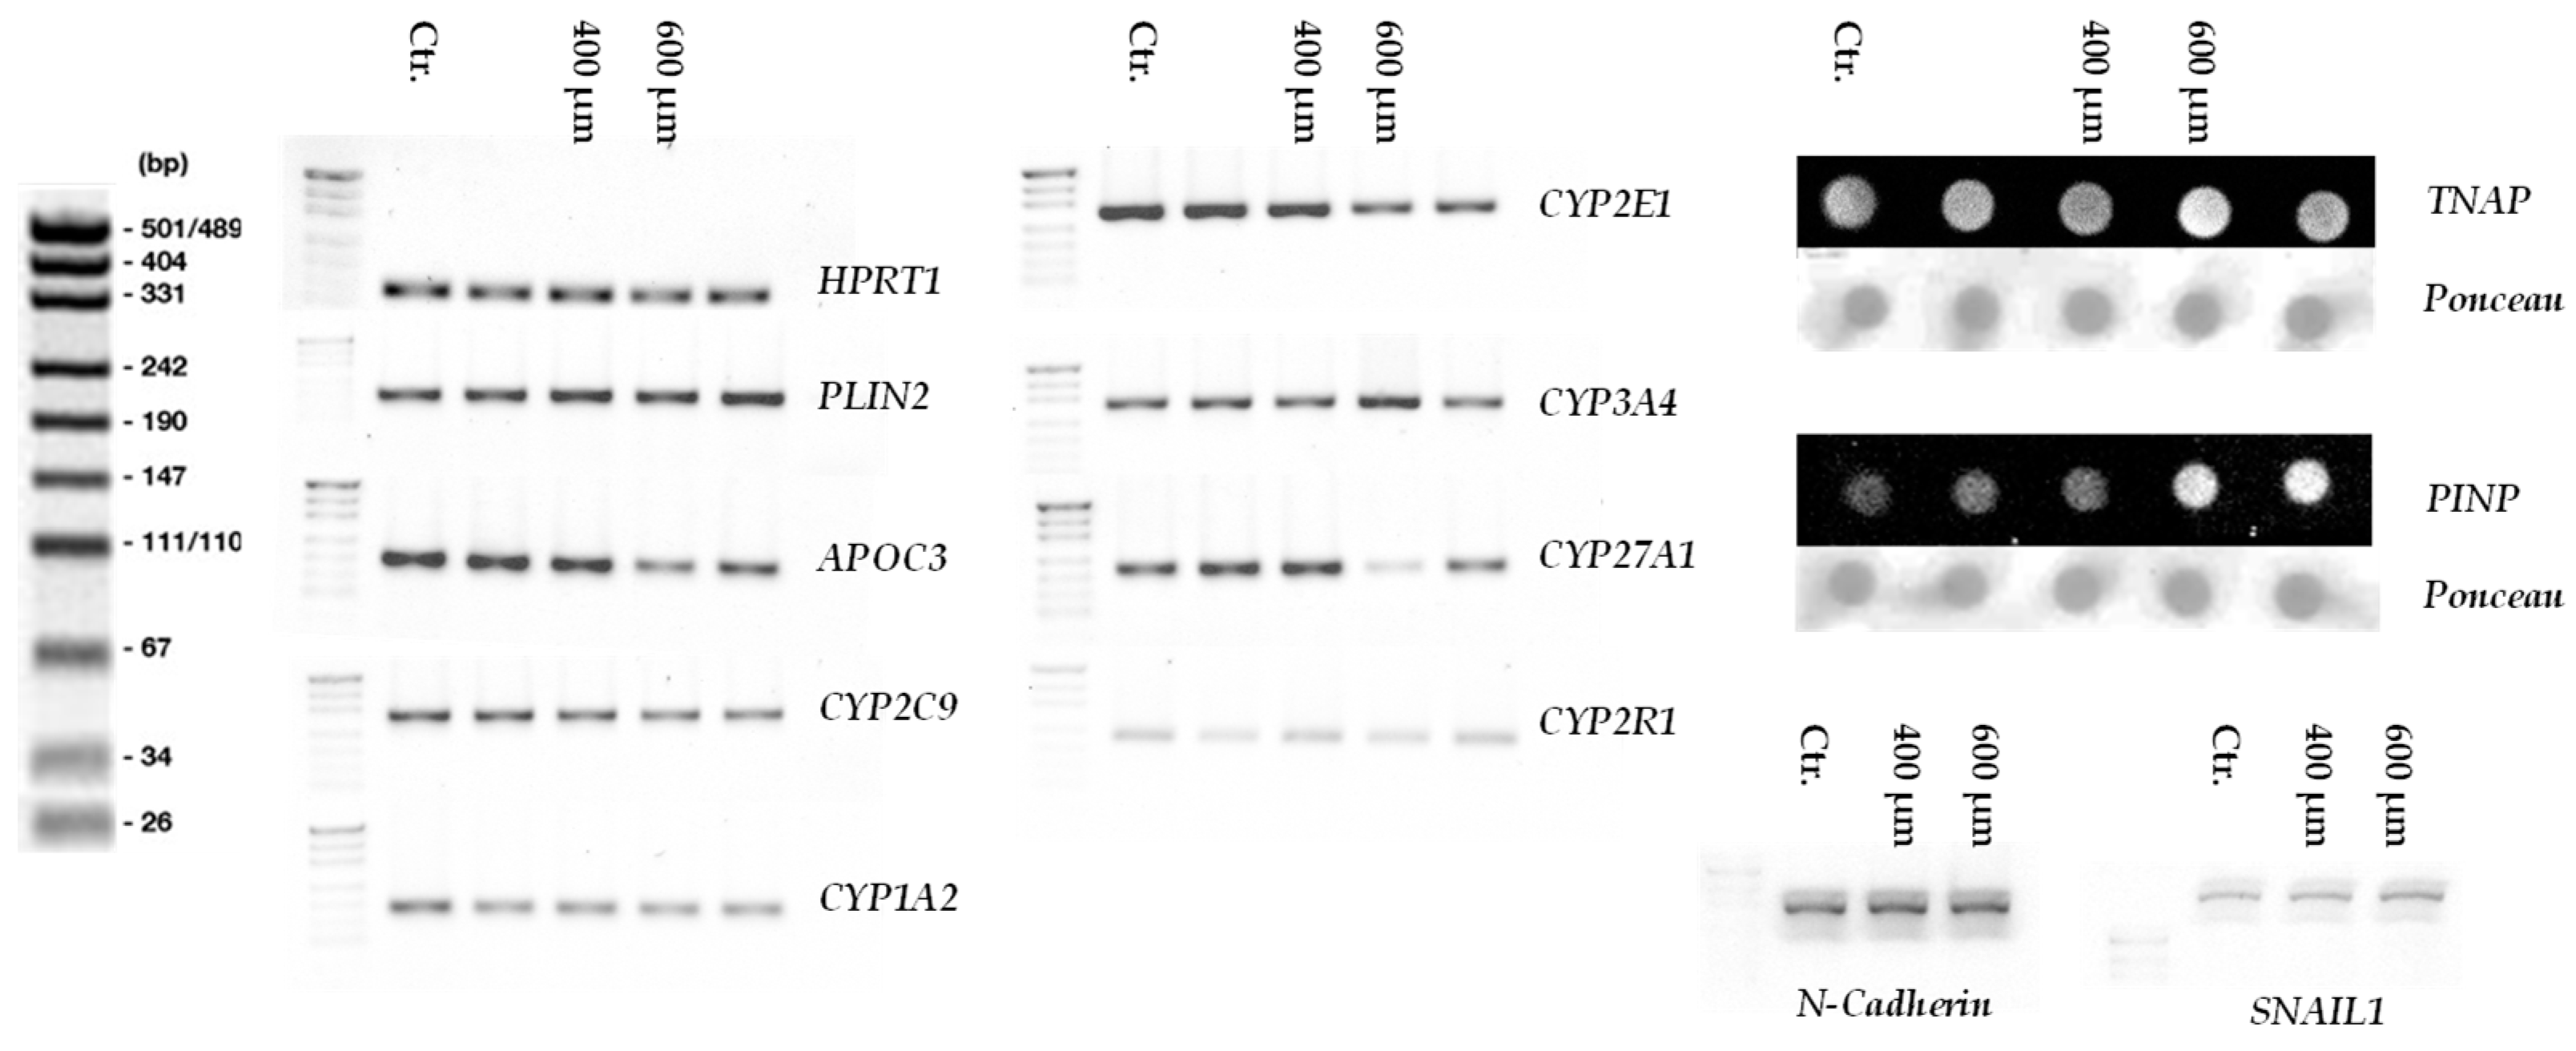
Disease induction was further validated at the molecular level by analyzing the expression of genes involved in fatty acid metabolism and lipid accumulation. Gene expression analysis showed a slight increase in Perilipin 2 (PLIN2) gene expression after 7 days of stimulation with 400 and 600 µM FFA (Figure 4a). Furthermore, apolipoprotein C3 (APOC3) gene expression decreased significantly after 7 days of exposure to 600 µM FFA (Figure 4b).
3.5. RT-PCR Analysis of CYP Enzyme Gene Expression in Liver Micro-Organoids Exposed to Oleic and Palmitic Acids
To investigate the potential link between MASLD and CYP dysfunction, the expression of genes that encode key CYPs involved in drug metabolism and known to be abundant in the liver were investigated. Figure 5 shows that FFA treatment of the liver micro-organoids affected the gene expression of key CYP genes. The downregulation of CYP2C9, CYP1A2, and CYP2E1 suggests a general impairment in the liver’s drug-metabolism capacity
3.7. Increased Liver Damage and Epithelial-Mesenchymal Transition Markers in Liver Micro-Organoids Treated with Oleic and Palmitic Acids
To assess the impact of free fatty acid treatment on liver damage and potential fibrotic changes, we examined key EMT markers. The results showed that the expression of SNAIL1 (Figure 6a) and N-Cadherin (Figure 6b) were significantly altered in FFA-treated liver micro-organoids.
In addition, the analysis of the cell culture supernatants revealed increased levels of PINP and AP. PINP showed elevated concentrations in the FFA-treated samples compared to controls (Figure 6c). AP levels were higher in the supernatants of FFA-treated liver micro-organoids (Figure 6d). This suggests an increase in collagen accumulation as well as markers associated with liver damage.
3.6. Impaired Vitamin D Metabolism in Liver Micro-Organoids Treated with Oleic and Palmitic Acids
Next, the metabolizing potential of vitamin D in FFA-treated micro-organoids was evaluated. As shown in Figure 7a,b, the gene expression of CYP27A1 and CYP2R1 were significantly downregulated in the FFA-stimulated liver micro-organoids. Furthermore, the metabolic capacity to metabolize vitamin D into 25(OH)D3 shown in Figure 7c is significantly reduced after the disease induction.
4. Discussion
Several studies have reported lower vitamin D serum levels in patients with MASLD [7,15]. Many of these studies indicated that vitamin D is an independent risk factor for MASLD and is associated with the severity of the disease [46,47]. These studies have delivered valuable information about the disease and its epidemiology. Still, they have provided a broad overview rather than a detailed understanding [16].
Vitamin D is known for its anti-fibrotic properties. It inhibits the activation of stellate cells and modulates the immune response, reducing inflammation and fibrogenesis [11]. It has been reported that overexpression of CYP27A1 in mice reduces hepatic inflammation [48]. Additionally, Liver-specific VDR deletion in a mouse model induces MASLD and insulin resistance [26]. Recent advancements in technology and computational power have enabled a more comprehensive exploration of biological samples. Next-generation sequencing, in particular, has led to significant breakthroughs in genomics research and clinical practice [49]. Reduced CYP27A1 and VDR expression in the RNA-sequencing data indicate that vitamin D metabolism is impaired in patients with MASLD. Hence, disruption in vitamin D homeostasis and its protective role in the body may contribute to accelerated MASLD progression and severity, as reported previously [46,47]. Clinical studies and transcriptomics have provided essential information regarding how MASLD influences vitamin D metabolism. However, these approaches have limitations. For example, clinical studies provide only an overview of the disease mechanism, and the results may not be generalizable [16,50]. Moreover, these studies often have more potential for bias due to the selection criteria or data quality [51]. Transcriptomics data from patients provide comprehensive gene expression profiles, allowing investigation of the entire transcriptome and identifying novel biomarkers and pathways [52,53,54]. Unfortunately, transcriptomics in clinical studies also faces challenges, including sample quality issues, lack of standardization, ethical restrictions, intraspecies variations, and high costs [52,53,54].
To investigate the mechanisms behind impaired vitamin D metabolism in MASLD patients and to facilitate drug and therapy development, it is crucial to develop a model that accurately mimics the complex interactions of this disease. Animal models often fail to be translated directly to humans due to differences in metabolic pathways [27]. Additionally, the principle of the 3Rs—replacement, reduction, and refinement—emphasizes the need to minimize animal experiments and seek alternative models [55].
In vitro models consisting of PHHs are the standard alternatives [28,29]. However, their rapid dedifferentiation in 2D culture restricts their usage in long-term experiments where disease induction or outcomes require prolonged culture [30]. 3D spheroid models of PHHs have been developed to address this limitation, offering improved long-term functionality and stability [56]. Still, the limited availability and batch-to-batch variability of PHHs have to be considered. Commercially available 3D liver spheroids offer promising alternatives. Typically, these models incorporate all relevant primary liver cells, mimicking the most important features of the offered model [57]. However, they are often prohibitively expensive, unsuitable for high-throughput analysis, and share similar limitations of PHHs. Despite these limitations, 3D PHH spheroids have shown promise in drug metabolism studies and toxicity screening, maintaining hepatocyte-specific functions for extended periods [56,57,58,59].
Immortalized cell lines provide a practical alternative, offering greater reproducibility, scalability, and cost-effectiveness. HepaRG cells stand out as a robust model due to their metabolic capabilities and ability to differentiate into hepatocyte- and biliary-like cells, making them a reliable alternative for PHHs [31,32,33]. They express high levels of important drug-metabolizing enzymes, including CYP3A4, CYP2E1, and CYP1A2, at levels comparable to human liver tissue [60]. However, HepaRG cells alone cannot replicate the complex multicellular architecture of the liver, which is crucial for accurately modeling diseases like MASLD [35,36].
In this study, a 3D in vitro liver micro-organoid model was established. The model utilized human cell lines and was adapted from an earlier study that modeled fibrosis [37]. The organoids consist of HepaRG cells, LX-2 cells, and HUVECs. HepaRG cells closely mimic PHHs metabolic capabilities and gene expression profiles [31,32]. LX-2 cells represent hepatic stellate cells responsible for fatty acid storage and are involved in the progression of MASLD to fibrosis [38]. HUVECs, although not liver-specific endothelial cells, contribute to vascularization and nutrient exchange, making the model more physiologically relevant [39]. While HUVECs lack the fenestrations characteristic of liver sinusoidal endothelial cells, they still provide a functional substitute for creating complex liver microenvironments.
To establish an in vitro MASLD-induced model, selecting a concentration of FFA that maintains cell viability is essential, as it allows subsequent metabolic changes to reflect the disease pathology accurately rather than being influenced by cellular death. This approach differs from many existing models that use bovine serum albumin (BSA) as a carrier for fatty acids. While BSA-conjugated FFA models have been widely used, they present several limitations, including variability in FFA-BSA binding, potential BSA interference with cellular processes, limited physiological relevance, and difficulty in achieving high FFA concentrations [61]. Our study employed a direct FFA treatment approach, thereby enhancing control over FFA concentrations and mitigating potential confounding factors associated with BSA. This method, while presenting its own challenges such as solubility issues and potential cytotoxicity at high concentrations, is an established technique for inducing MASLD-like conditions in hepatic models [40,62].
The organoids were incubated with different concentrations of FFAs consisting of oleic and palmitic acids at a ratio of 2:1 for 7 days to develop MASLD-like conditions. While FFA treatment did not significantly affect cell viability overall, live-dead staining revealed necrotic cores at the highest concentration (1000 µM), suggesting cytotoxic effects. Consequently, this concentration was excluded from further experiments. Increased FFA concentrations can also enhance extracellular matrix (ECM) production, potentially affecting nutrient exchange and spheroid size [63,64].
A hallmark of MASLD is excessive lipid accumulation in hepatocytes and changes in the liver environment, including matrix composition [65,66]. Bodipy staining confirmed dose-dependent fatty acid accumulation within the cells, validating the successful induction of MASLD. At the molecular level, disease induction was associated with altered expression of genes involved in fatty acid metabolism and lipid accumulation. Notably, PLIN2, a marker linked to lipid droplet formation, showed upregulated expression, consistent with previous findings in animal models of MASLD [67,68]. On the other hand, APOC3, a gene involved in lipid metabolism, transport, and clearance, exhibited significant downregulation following disease induction. This contrasts with the previously documented findings, which indicated an increase in APOC3 expression in MASLD [69,70,71]. It is also known that the progression of MASLD at this stage is reversible [6]. The downregulation of APOC3 in this model could reflect a cellular defense mechanism aimed at reversing disease progression. Additionally, prolonged FFA exposure can induce endoplasmic reticulum (ER) stress, potentially resulting in global protein translation inhibition, which may explain the observed APOC3 downregulation [40].
While excessive lipid accumulation is a hallmark of MASLD, the disease’s impact extends beyond fatty acid metabolism. Clinical observations and animal models have revealed altered activities of CYPs, which play a critical role in drug metabolism [5]. These alterations can significantly influence how medications are metabolized by the body, potentially increasing the risk of medication side effects and compromising treatment efficacy [5,72]. In this model, the downregulation of CYP2C9, CYP1A2, and CYP3A4 is in agreement with previously reported results. Interestingly, while there was a decrease in CYP2E1 gene expression, clinical and animal studies have reported elevated CYP2E1 gene expression and activity in patients and mice with MASLD [73,74]. This discrepancy might be due to the specific experimental conditions, and the effect could be post-translational. As previously mentioned, prolonged FFA treatment can lead to ER stress and potential global translation inhibition, elucidating the downregulation of CYP2E1 expression in our model [40]. One study showed that the gene expression of CYP2E1 was elevated in human liver biopsy with MASLD but not in the in vitro culture model [75]. The in vitro environment of the liver micro-organoids might not fully replicate the complex in vivo conditions of the liver in MASLD patients or animal models. Therefore, incorporating a platform mimicking the environment in which the liver cells are exposed in vivo could improve the model’s functionality and better represent the pathogenesis. For instance, a previous study showed that a scaffold representing the stiffness of a fibrotic-like liver negatively affected the metabolic activity of HepG2 cells compared to scaffolds mimicking a healthy-like liver [76].
Interestingly, the expressions of the EMT markers SNAIL1 and N-cadherin were significantly upregulated in the FFA-treated liver micro-organoids. EMT is a key process in fibrosis progression, as it involves the transition of epithelial-like cells to mesenchymal-like cells, enhancing fibrogenic capabilities [77,78]. This upregulation is further supported by the increased secretion of liver proteins such as AP and PINP, which are established markers of liver damage and fibrosis. PINP is directly related to ECM production and remodeling, particularly in the context of fibrosis and collagen formation. It serves as a valuable marker for monitoring ECM changes and increases in stiffness in various pathological conditions [79]. This increased stiffness can further trigger liver dysfunction and fibrosis by promoting hepatic stellate cell activation and enhancing the fibrogenic response [80]. Stiffer matrices have been shown to influence cell behavior, leading to cellular morphology, migration, and proliferation changes [81]. Moreover, the potential increase in ECM stiffness disrupts the hepatic functions, including the synthesis and activation of vitamin D [76].
Finally, the expression of genes encoding vitamin D metabolism-related enzymes were investigated. CYP27A1 and CYP2R1 were significantly downregulated in the FFA-stimulated liver micro-organoids. These enzymes are critical for converting vitamin D into 25(OH)D3, the main circulating form in the body. Additionally, the capacity of metabolizing vitamin D into 25(OH)D3 was shown to be significantly decreased in this model. The reduced expression and activity in vitamin D metabolism offer a potential mechanism for the well-documented vitamin D deficiency in MASLD patients [7,15].
In summary, these results illustrate the potential of this 3D human liver micro-organoid model to investigate the alteration of MASLD and lipid accumulation in the liver. The observed downregulation of CYPs and vitamin D metabolism-related enzymes suggests potential mechanisms underlying the metabolic complications associated with MASLD.
While this model has strengths, it also has some limitations. For instance, the model cannot fully replicate the advanced stages of MASLD, such as MASH, due to the lack of Kupffer cells. These cells are crucial for modeling liver inflammation and fibrosis. Future studies using this model system could investigate the effect of vitamin D supplementation on disease progression. Additionally, incorporating Kupffer cells into the model could be crucial for studying the inflammatory aspects of advanced MASLD stages. This comprehensive approach will provide a deeper understanding of MASLD pathogenesis and the way for the development of novel therapeutic strategies targeting these disrupted pathways.
5. Conclusions
Our 3D human cell-based liver micro-organoid model successfully mimicked clinical observations of MASLD, particularly regarding a disturbed vitamin D metabolism. These findings illustrate the potential of this model to investigate the effects of MASLD beyond lipid accumulation. The observed upregulation of EMT markers, fibrotic activity, and downregulation of CYPs and vitamin D metabolism-related enzymes highlight potential mechanisms underlying the metabolic complications associated with MASLD.
Author Contributions
Conceptualization, A.K.N.; Formal analysis, G.C. and Y.X.; Funding acquisition, A.K.N.; Methodology, G.D. and M.V.; Project administration, A.K.N.; Supervision, A.K.N. and R.H.A.-W.; Visualization, M.M.H.; Writing—original draft, M.M.H.; Writing—review & editing, G.C., Y.X., G.D., M.V., B.K., A.K.N. and R.H.A.-W. All authors have read and agreed to the published version of the manuscript.
Funding
This research received no external funding.
Data Availability Statement
Data are available at direct request.
Acknowledgments
We would like to thank Bianca Braun, Oliver Stähler, and Kevin Schulz for their excellent technical assistance. We acknowledge support from the Deutsche Forschungsgemeinschaft and Open Access Publishing Fund of the University of Tübingen. Mohammad Majd Hammour has performed parts of this work as part of his dissertation.
Conflicts of Interest
The authors declare no conflicts of interest.
Appendix
Representative gel images of the RT-PCR results and membrane images of the the Dot blot results are shown in Figure A1.
Figure A1.
Representative gel images of the Dot blot and the RT-PCR results in liver micro-organoids after 7 days of treatment with different concentrations of oleic:palmitic acids (2:1 ratio): Control (Ctr.), 400, 600 µM FFA. Graphics represent the following targets: The housekeeping gene Hypoxanthin-Phosphoribosyl-Transferase 1 (HPRT1), perilipin 2 (PLIN2), apolipoprotein C3 (APOC3), CYP2C9, CYP1A2, CYP2E1. CYP3A4, CYP27A1, CYP2R1, N-Cadherin, SNAIL1, tissue nonspecific alkaline phosphatase (TNAP), and Procollagen type 1 n-terminals propeptide (PINP).
References
- Pipitone, R.M.; Ciccioli, C.; Infantino, G.; La Mantia, C.; Parisi, S.; Tulone, A.; Pennisi, G.; Grimaudo, S.; Petta, S. MAFLD: a multisystem disease. Ther Adv Endocrinol Metab 2023, 14, 20420188221145549. [Google Scholar] [CrossRef] [PubMed]
- Li, J.; Zou, B.; Yeo, Y.H.; Feng, Y.; Xie, X.; Lee, D.H.; Fujii, H.; Wu, Y.; Kam, L.Y.; Ji, F.; et al. Prevalence, incidence, and outcome of non-alcoholic fatty liver disease in Asia, 1999–2019: a systematic review and meta-analysis. The Lancet Gastroenterology & Hepatology 2019, 4, 389–398. [Google Scholar] [CrossRef]
- Li, L.; Wang, Z.; Jiang, Y. Global incidence of NAFLD: Sets alarm bells ringing about NAFLD in China again. Journal of Hepatology 2023. [Google Scholar] [CrossRef]
- Geier, A.; Rau, M.; Pathil-Warth, A.; von der Ohe, M.; Schattenberg, J.; Dikopoulos, N.; Stein, K.; Serfert, Y.; Berg, T.; Buggisch, P. Clinical characteristics of patients with non-alcoholic fatty liver disease (NAFLD) in Germany–First data from the German NAFLD-Registry. Zeitschrift für Gastroenterologie 2023, 61, 60–70. [Google Scholar] [CrossRef] [PubMed]
- Cobbina, E.; Akhlaghi, F. Non-alcoholic fatty liver disease (NAFLD)—pathogenesis, classification, and effect on drug metabolizing enzymes and transporters. Drug Metab Rev 2017, 49, 197–211. [Google Scholar] [CrossRef] [PubMed]
- Wree, A.; Broderick, L.; Canbay, A.; Hoffman, H.M.; Feldstein, A.E. From NAFLD to NASH to cirrhosis—new insights into disease mechanisms. Nature reviews Gastroenterology & hepatology 2013, 10, 627–636. [Google Scholar]
- Lee, S.-b.; Jin, M.H.; Yoon, J.-H. The contribution of vitamin D insufficiency to the onset of steatotic liver disease among individuals with metabolic dysfunction. Scientific Reports 2024, 14, 6714. [Google Scholar] [CrossRef]
- Wan, B.; Gao, Y.; Zheng, Y.; Chen, R. Association between serum 25-hydroxy vitamin D level and metabolic associated fatty liver disease (MAFLD)—a population-based study. Endocrine Journal 2021, 68, 631–637. [Google Scholar] [CrossRef]
- Wintermeyer, E.; Ihle, C.; Ehnert, S.; Stöckle, U.; Ochs, G.; de Zwart, P.; Flesch, I.; Bahrs, C.; Nussler, A.K. Crucial Role of Vitamin D in the Musculoskeletal System. Nutrients 2016, 8. [Google Scholar] [CrossRef]
- Giannini, S.; Giusti, A.; Minisola, S.; Napoli, N.; Passeri, G.; Rossini, M.; Sinigaglia, L. The Immunologic Profile of Vitamin D and Its Role in Different Immune-Mediated Diseases: An Expert Opinion. Nutrients 2022, 14. [Google Scholar] [CrossRef]
- Keane, J.T.; Elangovan, H.; Stokes, R.A.; Gunton, J.E. Vitamin D and the Liver-Correlation or Cause? Nutrients 2018, 10. [Google Scholar] [CrossRef]
- Argano, C.; Mirarchi, L.; Amodeo, S.; Orlando, V.; Torres, A.; Corrao, S. The Role of Vitamin D and Its Molecular Bases in Insulin Resistance, Diabetes, Metabolic Syndrome, and Cardiovascular Disease: State of the Art. International Journal of Molecular Sciences 2023, 24, 15485. [Google Scholar] [CrossRef] [PubMed]
- Ehnert, S.; Aspera-Werz, R.H.; Ruoß, M.; Dooley, S.; Hengstler, J.G.; Nadalin, S.; Relja, B.; Badke, A.; Nussler, A.K. Hepatic Osteodystrophy—Molecular Mechanisms Proposed to Favor Its Development. International Journal of Molecular Sciences 2019, 20, 2555. [Google Scholar] [CrossRef] [PubMed]
- Khan, M.A.; Dar, H.A.; Baba, M.A.; Shah, A.H.; Singh, B.; Shiekh, N.A. Impact of Vitamin D Status in Chronic Liver Disease. J Clin Exp Hepatol 2019, 9, 574–580. [Google Scholar] [CrossRef]
- Barchetta, I.; Cimini, F.A.; Cavallo, M.G. Vitamin D and Metabolic Dysfunction-Associated Fatty Liver Disease (MAFLD): An Update. Nutrients 2020, 12. [Google Scholar] [CrossRef] [PubMed]
- Nissen, T.; Wynn, R. The clinical case report: a review of its merits and limitations. BMC Research Notes 2014, 7, 264. [Google Scholar] [CrossRef]
- Dawson-Hughes, B.; Staten, M.A.; Knowler, W.C.; Nelson, J.; Vickery, E.M.; LeBlanc, E.S.; Neff, L.M.; Park, J.; Pittas, A.G. Intratrial Exposure to Vitamin D and New-Onset Diabetes Among Adults With Prediabetes: A Secondary Analysis From the Vitamin D and Type 2 Diabetes (D2d) Study. Diabetes Care 2020, 43, 2916–2922. [Google Scholar] [CrossRef]
- Li, X.; Liu, Y.; Zheng, Y.; Wang, P.; Zhang, Y. The Effect of Vitamin D Supplementation on Glycemic Control in Type 2 Diabetes Patients: A Systematic Review and Meta-Analysis. Nutrients 2018, 10. [Google Scholar] [CrossRef]
- Bouillon, R.; Manousaki, D.; Rosen, C.; Trajanoska, K.; Rivadeneira, F.; Richards, J.B. The health effects of vitamin D supplementation: evidence from human studies. Nature Reviews Endocrinology 2022, 18, 96–110. [Google Scholar] [CrossRef]
- Grimnes, G.; Figenschau, Y.; Almås, B.; Jorde, R. Vitamin D, insulin secretion, sensitivity, and lipids: results from a case-control study and a randomized controlled trial using hyperglycemic clamp technique. Diabetes 2011, 60, 2748–2757. [Google Scholar] [CrossRef]
- Mitchell, D.M.; Leder, B.Z.; Cagliero, E.; Mendoza, N.; Henao, M.P.; Hayden, D.L.; Finkelstein, J.S.; Burnett-Bowie, S.A. Insulin secretion and sensitivity in healthy adults with low vitamin D are not affected by high-dose ergocalciferol administration: a randomized controlled trial. Am J Clin Nutr 2015, 102, 385–392. [Google Scholar] [CrossRef] [PubMed]
- Jamka, M.; Woźniewicz, M.; Jeszka, J.; Mardas, M.; Bogdański, P.; Stelmach-Mardas, M. The effect of vitamin D supplementation on insulin and glucose metabolism in overweight and obese individuals: systematic review with meta-analysis. Scientific Reports 2015, 5, 16142. [Google Scholar] [CrossRef] [PubMed]
- Lange, S.; Inal, J.M. Animal Models of Human Disease. International Journal of Molecular Sciences 2023, 24, 15821. [Google Scholar] [CrossRef] [PubMed]
- Loewa, A.; Feng, J.J.; Hedtrich, S. Human disease models in drug development. Nature Reviews Bioengineering 2023, 1, 545–559. [Google Scholar] [CrossRef]
- Kim, G.H.; Jeong, H.-J.; Lee, Y.J.; Park, H.Y.; Koo, S.K.; Lim, J.H. Vitamin D ameliorates age-induced nonalcoholic fatty liver disease by increasing the mitochondrial contact site and cristae organizing system (MICOS) 60 level. Experimental & Molecular Medicine 2024, 56, 142–155. [Google Scholar] [CrossRef]
- Zhang, H.; Shen, Z.; Lin, Y.; Zhang, J.; Zhang, Y.; Liu, P.; Zeng, H.; Yu, M.; Chen, X.; Ning, L.; et al. Vitamin D receptor targets hepatocyte nuclear factor 4α and mediates protective effects of vitamin D in nonalcoholic fatty liver disease. J Biol Chem 2020, 295, 3891–3905. [Google Scholar] [CrossRef]
- Punt, A.; Peijnenburg, A.A.; Hoogenboom, R.L.; Bouwmeester, H. Non-animal approaches for toxicokinetics in risk evaluations of food chemicals. ALTEX-Alternatives to animal experimentation 2017, 34, 501–514. [Google Scholar] [CrossRef]
- Guo, L.; Dial, S.; Shi, L.; Branham, W.; Liu, J.; Fang, J.L.; Green, B.; Deng, H.; Kaput, J.; Ning, B. Similarities and differences in the expression of drug-metabolizing enzymes between human hepatic cell lines and primary human hepatocytes. Drug Metab Dispos 2011, 39, 528–538. [Google Scholar] [CrossRef]
- Godoy, P.; Hewitt, N.J.; Albrecht, U.; Andersen, M.E.; Ansari, N.; Bhattacharya, S.; Bode, J.G.; Bolleyn, J.; Borner, C.; Böttger, J.; et al. Recent advances in 2D and 3D in vitro systems using primary hepatocytes, alternative hepatocyte sources and non-parenchymal liver cells and their use in investigating mechanisms of hepatotoxicity, cell signaling and ADME. Arch Toxicol 2013, 87, 1315–1530. [Google Scholar] [CrossRef]
- Ruoß, M.; Vosough, M.; Königsrainer, A.; Nadalin, S.; Wagner, S.; Sajadian, S.; Huber, D.; Heydari, Z.; Ehnert, S.; Hengstler, J.G.; et al. Towards improved hepatocyte cultures: Progress and limitations. Food Chem Toxicol 2020, 138, 111188. [Google Scholar] [CrossRef]
- Lübberstedt, M.; Müller-Vieira, U.; Mayer, M.; Biemel, K.M.; Knöspel, F.; Knobeloch, D.; Nüssler, A.K.; Gerlach, J.C.; Zeilinger, K. HepaRG human hepatic cell line utility as a surrogate for primary human hepatocytes in drug metabolism assessment in vitro. Journal of pharmacological and toxicological methods 2011, 63, 59–68. [Google Scholar] [CrossRef] [PubMed]
- Hammour, M.M.; Othman, A.; Aspera-Werz, R.; Braun, B.; Weis-Klemm, M.; Wagner, S.; Nadalin, S.; Histing, T.; Ruoß, M.; Nüssler, A.K. Optimisation of the HepaRG cell line model for drug toxicity studies using two different cultivation conditions: advantages and limitations. Archives of Toxicology 2022, 96, 2511–2521. [Google Scholar] [CrossRef] [PubMed]
- Chen, G.; Xin, Y.; Hammour, M.M.; Braun, B.; Ehnert, S.; Springer, F.; Vosough, M.; Menger, M.M.; Kumar, A.; Nüssler, A.K.; et al. Establishment of a human 3D in vitro liver-bone model as a potential system for drug toxicity screening. Arch Toxicol 2024. [Google Scholar] [CrossRef] [PubMed]
- Gripon, P.; Rumin, S.; Urban, S.; Le Seyec, J.; Glaise, D.; Cannie, I.; Guyomard, C.; Lucas, J.; Trepo, C.; Guguen-Guillouzo, C. Infection of a human hepatoma cell line by hepatitis B virus. Proc Natl Acad Sci U S A 2002, 99, 15655–15660. [Google Scholar] [CrossRef]
- Kanuri, G.; Bergheim, I. In Vitro and in Vivo Models of Non-Alcoholic Fatty Liver Disease (NAFLD). International Journal of Molecular Sciences 2013, 14, 11963–11980. [Google Scholar] [CrossRef]
- Kim, J.; Koo, B.K.; Knoblich, J.A. Human organoids: model systems for human biology and medicine. Nat Rev Mol Cell Biol 2020, 21, 571–584. [Google Scholar] [CrossRef]
- Zahmatkesh, E.; Othman, A.; Braun, B.; Aspera, R.; Ruoß, M.; Piryaei, A.; Vosough, M.; Nüssler, A. In vitro modeling of liver fibrosis in 3D microtissues using scalable micropatterning system. Arch Toxicol 2022, 96, 1799–1813. [Google Scholar] [CrossRef]
- Xu, L.; Hui, A.Y.; Albanis, E.; Arthur, M.J.; O’Byrne, S.M.; Blaner, W.S.; Mukherjee, P.; Friedman, S.L.; Eng, F.J. Human hepatic stellate cell lines, LX-1 and LX-2: new tools for analysis of hepatic fibrosis. Gut 2005, 54, 142–151. [Google Scholar] [CrossRef]
- Medina-Leyte, D.J.; Domínguez-Pérez, M.; Mercado, I.; Villarreal-Molina, M.T.; Jacobo-Albavera, L. Use of Human Umbilical Vein Endothelial Cells (HUVEC) as a Model to Study Cardiovascular Disease: A Review. Applied Sciences 2020, 10, 938. [Google Scholar] [CrossRef]
- Rennert, C.; Heil, T.; Schicht, G.; Stilkerich, A.; Seidemann, L.; Kegel-Hübner, V.; Seehofer, D.; Damm, G. Prolonged Lipid Accumulation in Cultured Primary Human Hepatocytes Rather Leads to ER Stress than Oxidative Stress. Int J Mol Sci 2020, 21. [Google Scholar] [CrossRef]
- Meeker, N.D.; Hutchinson, S.A.; Ho, L.; Trede, N.S. Method for isolation of PCR-ready genomic DNA from zebrafish tissues. Biotechniques 2007, 43, 610–612. [Google Scholar] [CrossRef]
- Sreekumar, V.; Aspera-Werz, R.; Ehnert, S.; Strobel, J.; Tendulkar, G.; Heid, D.; Schreiner, A.; Arnscheidt, C.; Nussler, A.K. Resveratrol protects primary cilia integrity of human mesenchymal stem cells from cigarette smoke to improve osteogenic differentiation in vitro. Archives of Toxicology 2018, 92, 1525–1538. [Google Scholar] [CrossRef]
- Das, S.; Dey, S.; Patra, S.; Bera, A.; Ghosh, T.; Prasad, B.; Sayala, K.D.; Maji, K.; Bedi, A.; Debnath, S. BODIPY-Based Molecules for Biomedical Applications. Biomolecules 2023, 13. [Google Scholar] [CrossRef] [PubMed]
- Rodríguez-Ezpeleta, N.; Teijeiro, S.; Forget, L.; Burger, G.; Lang, B.F. Construction of cDNA Libraries: Focus on Protists and Fungi. In Expressed Sequence Tags (ESTs): Generation and Analysis, Parkinson, J., Ed.; Humana Press: Totowa, NJ, 2009; pp. 33–47. [Google Scholar]
- European Bioinformatics, I. RNA-seq of human with nonalcoholic fatty liver disease against untreated controls. 2023.
- Küçükazman, M.; Ata, N.; Dal, K.; Yeniova, A.Ö.; Kefeli, A.; Basyigit, S.; Aktas, B.; Akin, K.O.; Ağladioğlu, K.; Üre, Ö.S.; et al. The association of vitamin D deficiency with non-alcoholic fatty liver disease. Clinics 2014, 69, 542–546. [Google Scholar] [CrossRef] [PubMed]
- Park, D.; Kwon, H.; Oh, S.W.; Joh, H.K.; Hwang, S.S.; Park, J.H.; Yun, J.M.; Lee, H.; Chung, G.E.; Ze, S.; et al. Is Vitamin D an Independent Risk Factor of Nonalcoholic Fatty Liver Disease?: a Cross-Sectional Study of the Healthy Population. J Korean Med Sci 2017, 32, 95–101. [Google Scholar] [CrossRef]
- Hendrikx, T.; Jeurissen, M.L.J.; Bieghs, V.; Walenbergh, S.M.A.; van Gorp, P.J.; Verheyen, F.; Houben, T.; Guichot, Y.D.; Gijbels, M.J.J.; Leitersdorf, E.; et al. Hematopoietic overexpression of Cyp27a1 reduces hepatic inflammation independently of 27-hydroxycholesterol levels in Ldlr−/− mice. Journal of Hepatology 2015, 62, 430–436. [Google Scholar] [CrossRef] [PubMed]
- Qin, D. Next-generation sequencing and its clinical application. Cancer Biol Med 2019, 16, 4–10. [Google Scholar] [CrossRef]
- Zhi, Y.; Dong, Y.; Li, X.; Zhong, W.; Lei, X.; Tang, J.; Mao, Y. Current Progress and Challenges in the Development of Pharmacotherapy for Metabolic Dysfunction-Associated Steatohepatitis. Diabetes Metab Res Rev 2024, 40, e3846. [Google Scholar] [CrossRef]
- Kostis, J.B.; Dobrzynski, J.M. Limitations of Randomized Clinical Trials. The American Journal of Cardiology 2020, 129, 109–115. [Google Scholar] [CrossRef]
- Zhang, L.; Chen, D.; Song, D.; Liu, X.; Zhang, Y.; Xu, X.; Wang, X. Clinical and translational values of spatial transcriptomics. Signal Transduction and Targeted Therapy 2022, 7, 111. [Google Scholar] [CrossRef]
- Klopfleisch, R.; Gruber, A.D. Transcriptome and proteome research in veterinary science: what is possible and what questions can be asked? ScientificWorldJournal 2012, 2012, 254962. [Google Scholar] [CrossRef] [PubMed]
- Stokes, T.; Cen, H.H.; Kapranov, P.; Gallagher, I.J.; Pitsillides, A.A.; Volmar, C.-H.; Kraus, W.E.; Johnson, J.D.; Phillips, S.M.; Wahlestedt, C.; et al. Transcriptomics for Clinical and Experimental Biology Research: Hang on a Seq. Advanced Genetics 2023, 4, 2200024. [Google Scholar] [CrossRef] [PubMed]
- Russell, W.M.S.; Burch, R.L.; Hume, C.W. The principles of humane experimental technique; Methuen London: 1959; Volume 238.
- Bell, C.C.; Hendriks, D.F.G.; Moro, S.M.L.; Ellis, E.; Walsh, J.; Renblom, A.; Fredriksson Puigvert, L.; Dankers, A.C.A.; Jacobs, F.; Snoeys, J.; et al. Characterization of primary human hepatocyte spheroids as a model system for drug-induced liver injury, liver function and disease. Scientific Reports 2016, 6, 25187. [Google Scholar] [CrossRef] [PubMed]
- Ströbel, S.; Kostadinova, R.; Fiaschetti-Egli, K.; Rupp, J.; Bieri, M.; Pawlowska, A.; Busler, D.; Hofstetter, T.; Sanchez, K.; Grepper, S.; et al. A 3D primary human cell-based in vitro model of non-alcoholic steatohepatitis for efficacy testing of clinical drug candidates. Sci Rep 2021, 11, 22765. [Google Scholar] [CrossRef]
- Hurrell, T.; Kastrinou-Lampou, V.; Fardellas, A.; Hendriks, D.F.G.; Nordling, Å.; Johansson, I.; Baze, A.; Parmentier, C.; Richert, L.; Ingelman-Sundberg, M. Human Liver Spheroids as a Model to Study Aetiology and Treatment of Hepatic Fibrosis. Cells 2020, 9, 964. [Google Scholar] [CrossRef]
- Berger, B.; Donzelli, M.; Maseneni, S.; Boess, F.; Roth, A.; Krähenbühl, S.; Haschke, M. Comparison of Liver Cell Models Using the Basel Phenotyping Cocktail. Front Pharmacol 2016, 7, 443. [Google Scholar] [CrossRef]
- Nelson, L.J.; Morgan, K.; Treskes, P.; Samuel, K.; Henderson, C.J.; LeBled, C.; Homer, N.; Grant, M.H.; Hayes, P.C.; Plevris, J.N. Human Hepatic HepaRG Cells Maintain an Organotypic Phenotype with High Intrinsic CYP450 Activity/Metabolism and Significantly Outperform Standard HepG2/C3A Cells for Pharmaceutical and Therapeutic Applications. Basic Clin Pharmacol Toxicol 2017, 120, 30–37. [Google Scholar] [CrossRef]
- Römer, A.; Rawat, D.; Linn, T.; Petry, S.F. Preparation of fatty acid solutions exerts significant impact on experimental outcomes in cell culture models of lipotoxicity. Biol Methods Protoc 2022, 7, bpab023. [Google Scholar] [CrossRef]
- Seidemann, L.; Krüger, A.; Kegel-Hübner, V.; Seehofer, D.; Damm, G. Influence of Genistein on Hepatic Lipid Metabolism in an In Vitro Model of Hepatic Steatosis. Molecules 2021, 26, 1156. [Google Scholar] [CrossRef]
- Pingitore, P.; Sasidharan, K.; Ekstrand, M.; Prill, S.; Lindén, D.; Romeo, S. Human Multilineage 3D Spheroids as a Model of Liver Steatosis and Fibrosis. Int J Mol Sci 2019, 20. [Google Scholar] [CrossRef]
- Redenšek Trampuž, S.; van Riet, S.; Nordling, Å.; Ingelman-Sundberg, M. Mechanisms of 5-HT receptor antagonists in the regulation of fibrosis in a 3D human liver spheroid model. Scientific Reports 2024, 14, 1396. [Google Scholar] [CrossRef] [PubMed]
- Badmus, O.O.; Hillhouse, S.A.; Anderson, C.D.; Hinds, T.D.; Stec, D.E. Molecular mechanisms of metabolic associated fatty liver disease (MAFLD): functional analysis of lipid metabolism pathways. Clin Sci (Lond) 2022, 136, 1347–1366. [Google Scholar] [CrossRef] [PubMed]
- Sangro, P.; de la Torre Aláez, M.; Sangro, B.; D’Avola, D. Metabolic dysfunction–associated fatty liver disease (MAFLD): an update of the recent advances in pharmacological treatment. Journal of Physiology and Biochemistry 2023, 79, 869–879. [Google Scholar] [CrossRef]
- Najt, C.P.; Senthivinayagam, S.; Aljazi, M.B.; Fader, K.A.; Olenic, S.D.; Brock, J.R.; Lydic, T.A.; Jones, A.D.; Atshaves, B.P. Liver-specific loss of Perilipin 2 alleviates diet-induced hepatic steatosis, inflammation, and fibrosis. Am J Physiol Gastrointest Liver Physiol 2016, 310, G726–G738. [Google Scholar] [CrossRef] [PubMed]
- Doncheva, A.I.; Li, Y.; Khanal, P.; Hjorth, M.; Kolset, S.O.; Norheim, F.A.; Kimmel, A.R.; Dalen, K.T. Altered hepatic lipid droplet morphology and lipid metabolism in fasted Plin2-null mice. Journal of Lipid Research 2023, 64. [Google Scholar] [CrossRef] [PubMed]
- Paiva, A.A.; Raposo, H.F.; Wanschel, A.C.; Nardelli, T.R.; Oliveira, H.C. Apolipoprotein CIII Overexpression-Induced Hypertriglyceridemia Increases Nonalcoholic Fatty Liver Disease in Association with Inflammation and Cell Death. Oxid Med Cell Longev 2017, 2017, 1838679. [Google Scholar] [CrossRef]
- Heeren, J.; Scheja, L. Metabolic-associated fatty liver disease and lipoprotein metabolism. Mol Metab 2021, 50, 101238. [Google Scholar] [CrossRef]
- Mahmoudi, S.K.; Tarzemani, S.; Aghajanzadeh, T.; Kasravi, M.; Hatami, B.; Zali, M.R.; Baghaei, K. Exploring the role of genetic variations in NAFLD: implications for disease pathogenesis and precision medicine approaches. Eur J Med Res 2024, 29, 190. [Google Scholar] [CrossRef]
- Newman, E.M.; Rowland, A. A Physiologically Based Pharmacokinetic Model to Predict the Impact of Metabolic Changes Associated with Metabolic Associated Fatty Liver Disease on Drug Exposure. Int J Mol Sci 2022, 23. [Google Scholar] [CrossRef]
- Chalasani, N.; Gorski, J.C.; Asghar, M.S.; Asghar, A.; Foresman, B.; Hall, S.D.; Crabb, D.W. Hepatic cytochrome P450 2E1 activity in nondiabetic patients with nonalcoholic steatohepatitis. Hepatology 2003, 37, 544–550. [Google Scholar] [CrossRef]
- Abdelmegeed, M.A.; Banerjee, A.; Yoo, S.-H.; Jang, S.; Gonzalez, F.J.; Song, B.-J. Critical role of cytochrome P450 2E1 (CYP2E1) in the development of high fat-induced non-alcoholic steatohepatitis. Journal of Hepatology 2012, 57, 860–866. [Google Scholar] [CrossRef] [PubMed]
- Aljomah, G.; Baker, S.S.; Liu, W.; Kozielski, R.; Oluwole, J.; Lupu, B.; Baker, R.D.; Zhu, L. Induction of CYP2E1 in non-alcoholic fatty liver diseases. Experimental and Molecular Pathology 2015, 99, 677–681. [Google Scholar] [CrossRef] [PubMed]
- Ruoß, M.; Rebholz, S.; Weimer, M.; Grom-Baumgarten, C.; Athanasopulu, K.; Kemkemer, R.; Käß, H.; Ehnert, S.; Nussler, A.K. Development of Scaffolds with Adjusted Stiffness for Mimicking Disease-Related Alterations of Liver Rigidity. J Funct Biomater 2020, 11. [Google Scholar] [CrossRef] [PubMed]
- Choi, S.S.; Diehl, A.M. Epithelial-to-mesenchymal transitions in the liver. Hepatology 2009, 50, 2007–2013. [Google Scholar] [CrossRef]
- Zhao, Y.L.; Zhu, R.T.; Sun, Y.L. Epithelial-mesenchymal transition in liver fibrosis. Biomed Rep 2016, 4, 269–274. [Google Scholar] [CrossRef]
- Andersen, T.; Ueland, T.; Aukrust, P.; Nilsen, D.W.T.; Grundt, H.; Staines, H.; Pönitz, V.; Kontny, F. Procollagen type 1 N-terminal propeptide is associated with adverse outcome in acute chest pain of suspected coronary origin. Front Cardiovasc Med 2023, 10, 1191055. [Google Scholar] [CrossRef]
- Roehlen, N.; Crouchet, E.; Baumert, T.F. Liver Fibrosis: Mechanistic Concepts and Therapeutic Perspectives. Cells 2020, 9. [Google Scholar] [CrossRef]
- Ge, H.; Tian, M.; Pei, Q.; Tan, F.; Pei, H. Extracellular Matrix Stiffness: New Areas Affecting Cell Metabolism. Front Oncol 2021, 11, 631991. [Google Scholar] [CrossRef]
Figure 1.
Differential expression analysis of RNA-sequencing data from liver biopsies of patients with MASLD and “healthy” controls. Graphics represent the differential expression of (a) 7-dihydroxycholesterol-reductase (DHCR7), (b) Vitamin D binding protein (DBP), (c) CYP7A1, (d) CYP2R1, (e) CYP27A1, (f) Vitamin D receptor (VDR). The RNA-seq data were aligned using HISAT2, feature counts were obtained with FeatureCounts, and differential expression analysis was conducted using DESeq2. Data were submitted by the European Bioinformatics Institute to the NCBI (accession number PRJEB58091). Box plots represent the normalized counts for each gene. The box plots display the mean ± SEM of 17 controls and 18 MASLD patients. Statistical significance was assessed using the Mann-Whitney test, with significance indicated by * p < 0.05.
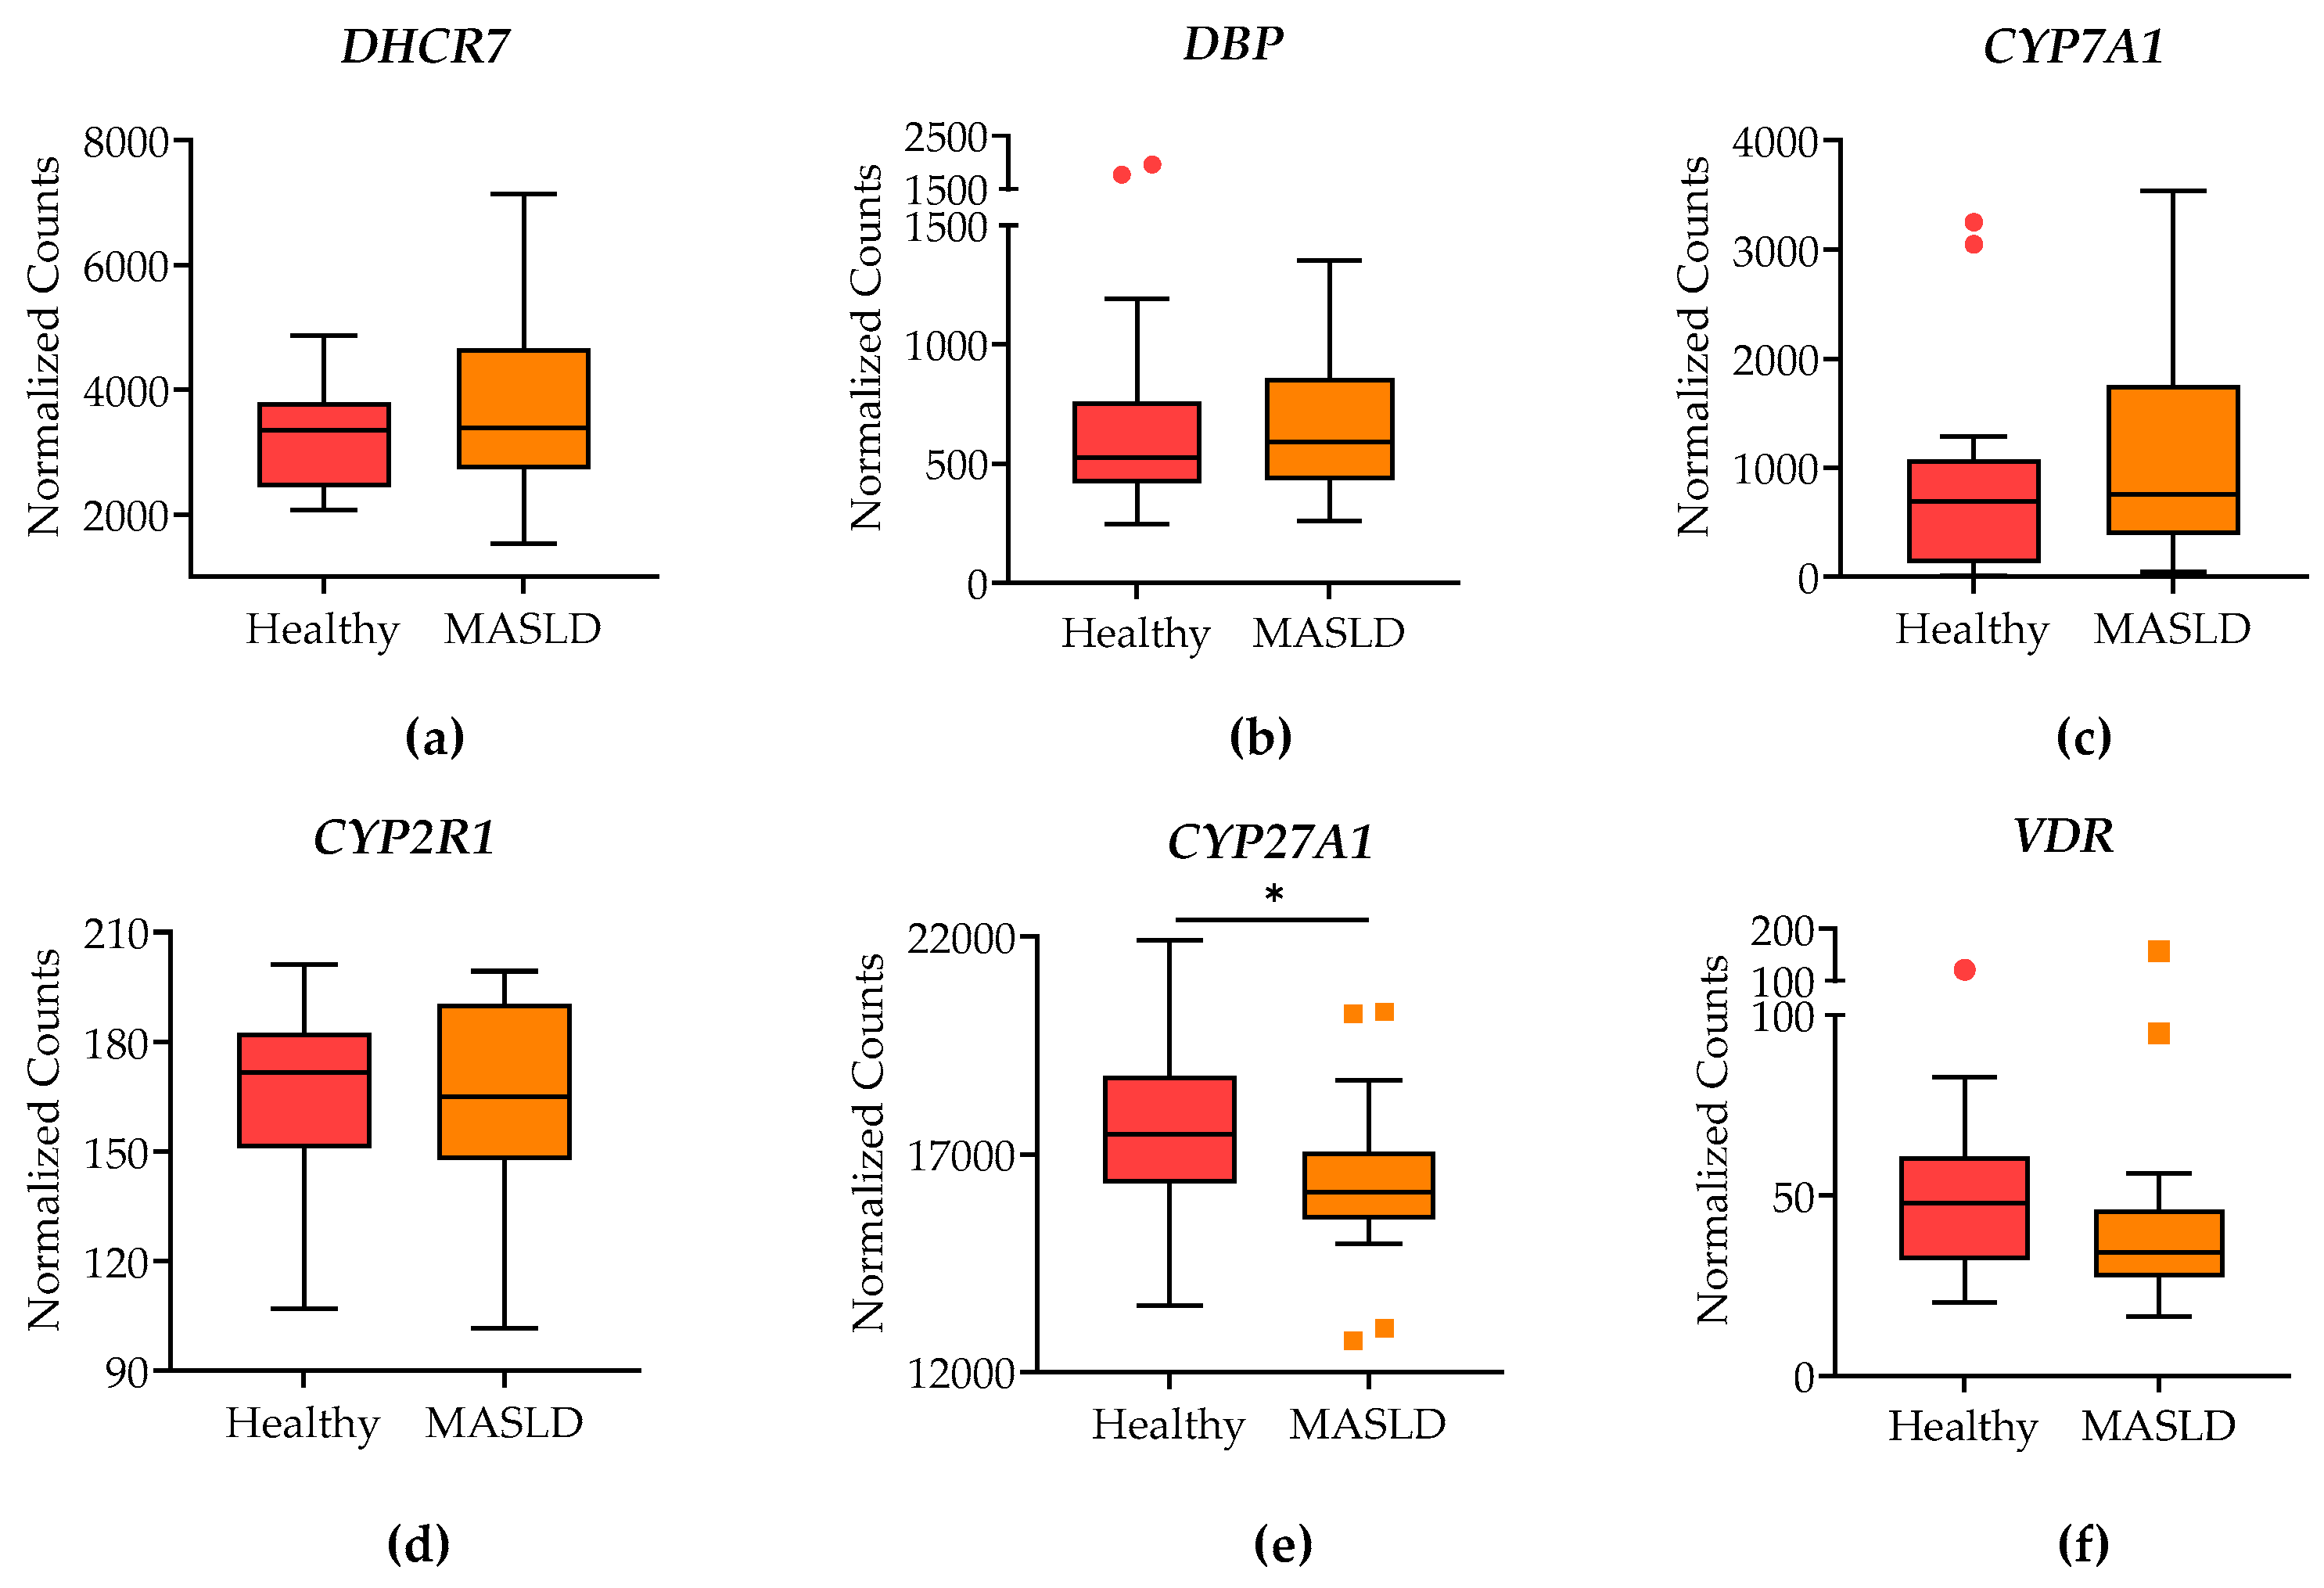
Figure 2.
Viability assessment of liver micro-organoids after 7 days of treatment with different concentrations of oleic:palmitic acids (2:1 ratio): Control (Ctr.), 200–1000 µM FFA. Graphics represent (a) Mitochondrial activity was measured by resazurin conversion. (b) DNA content quantification. (c) Cell membrane integrity is assessed by lactate dehydrogenase release. (d) live-dead staining was conducted using Calcein AM (green for live cells) and ethidium bromide (red for dead cells). The scale bar represents 200 μm. Data are presented as mean ± SEM (N ≥ 3, n ≥ 1). Statistical significance was tested using the Kruskal-Wallis test.
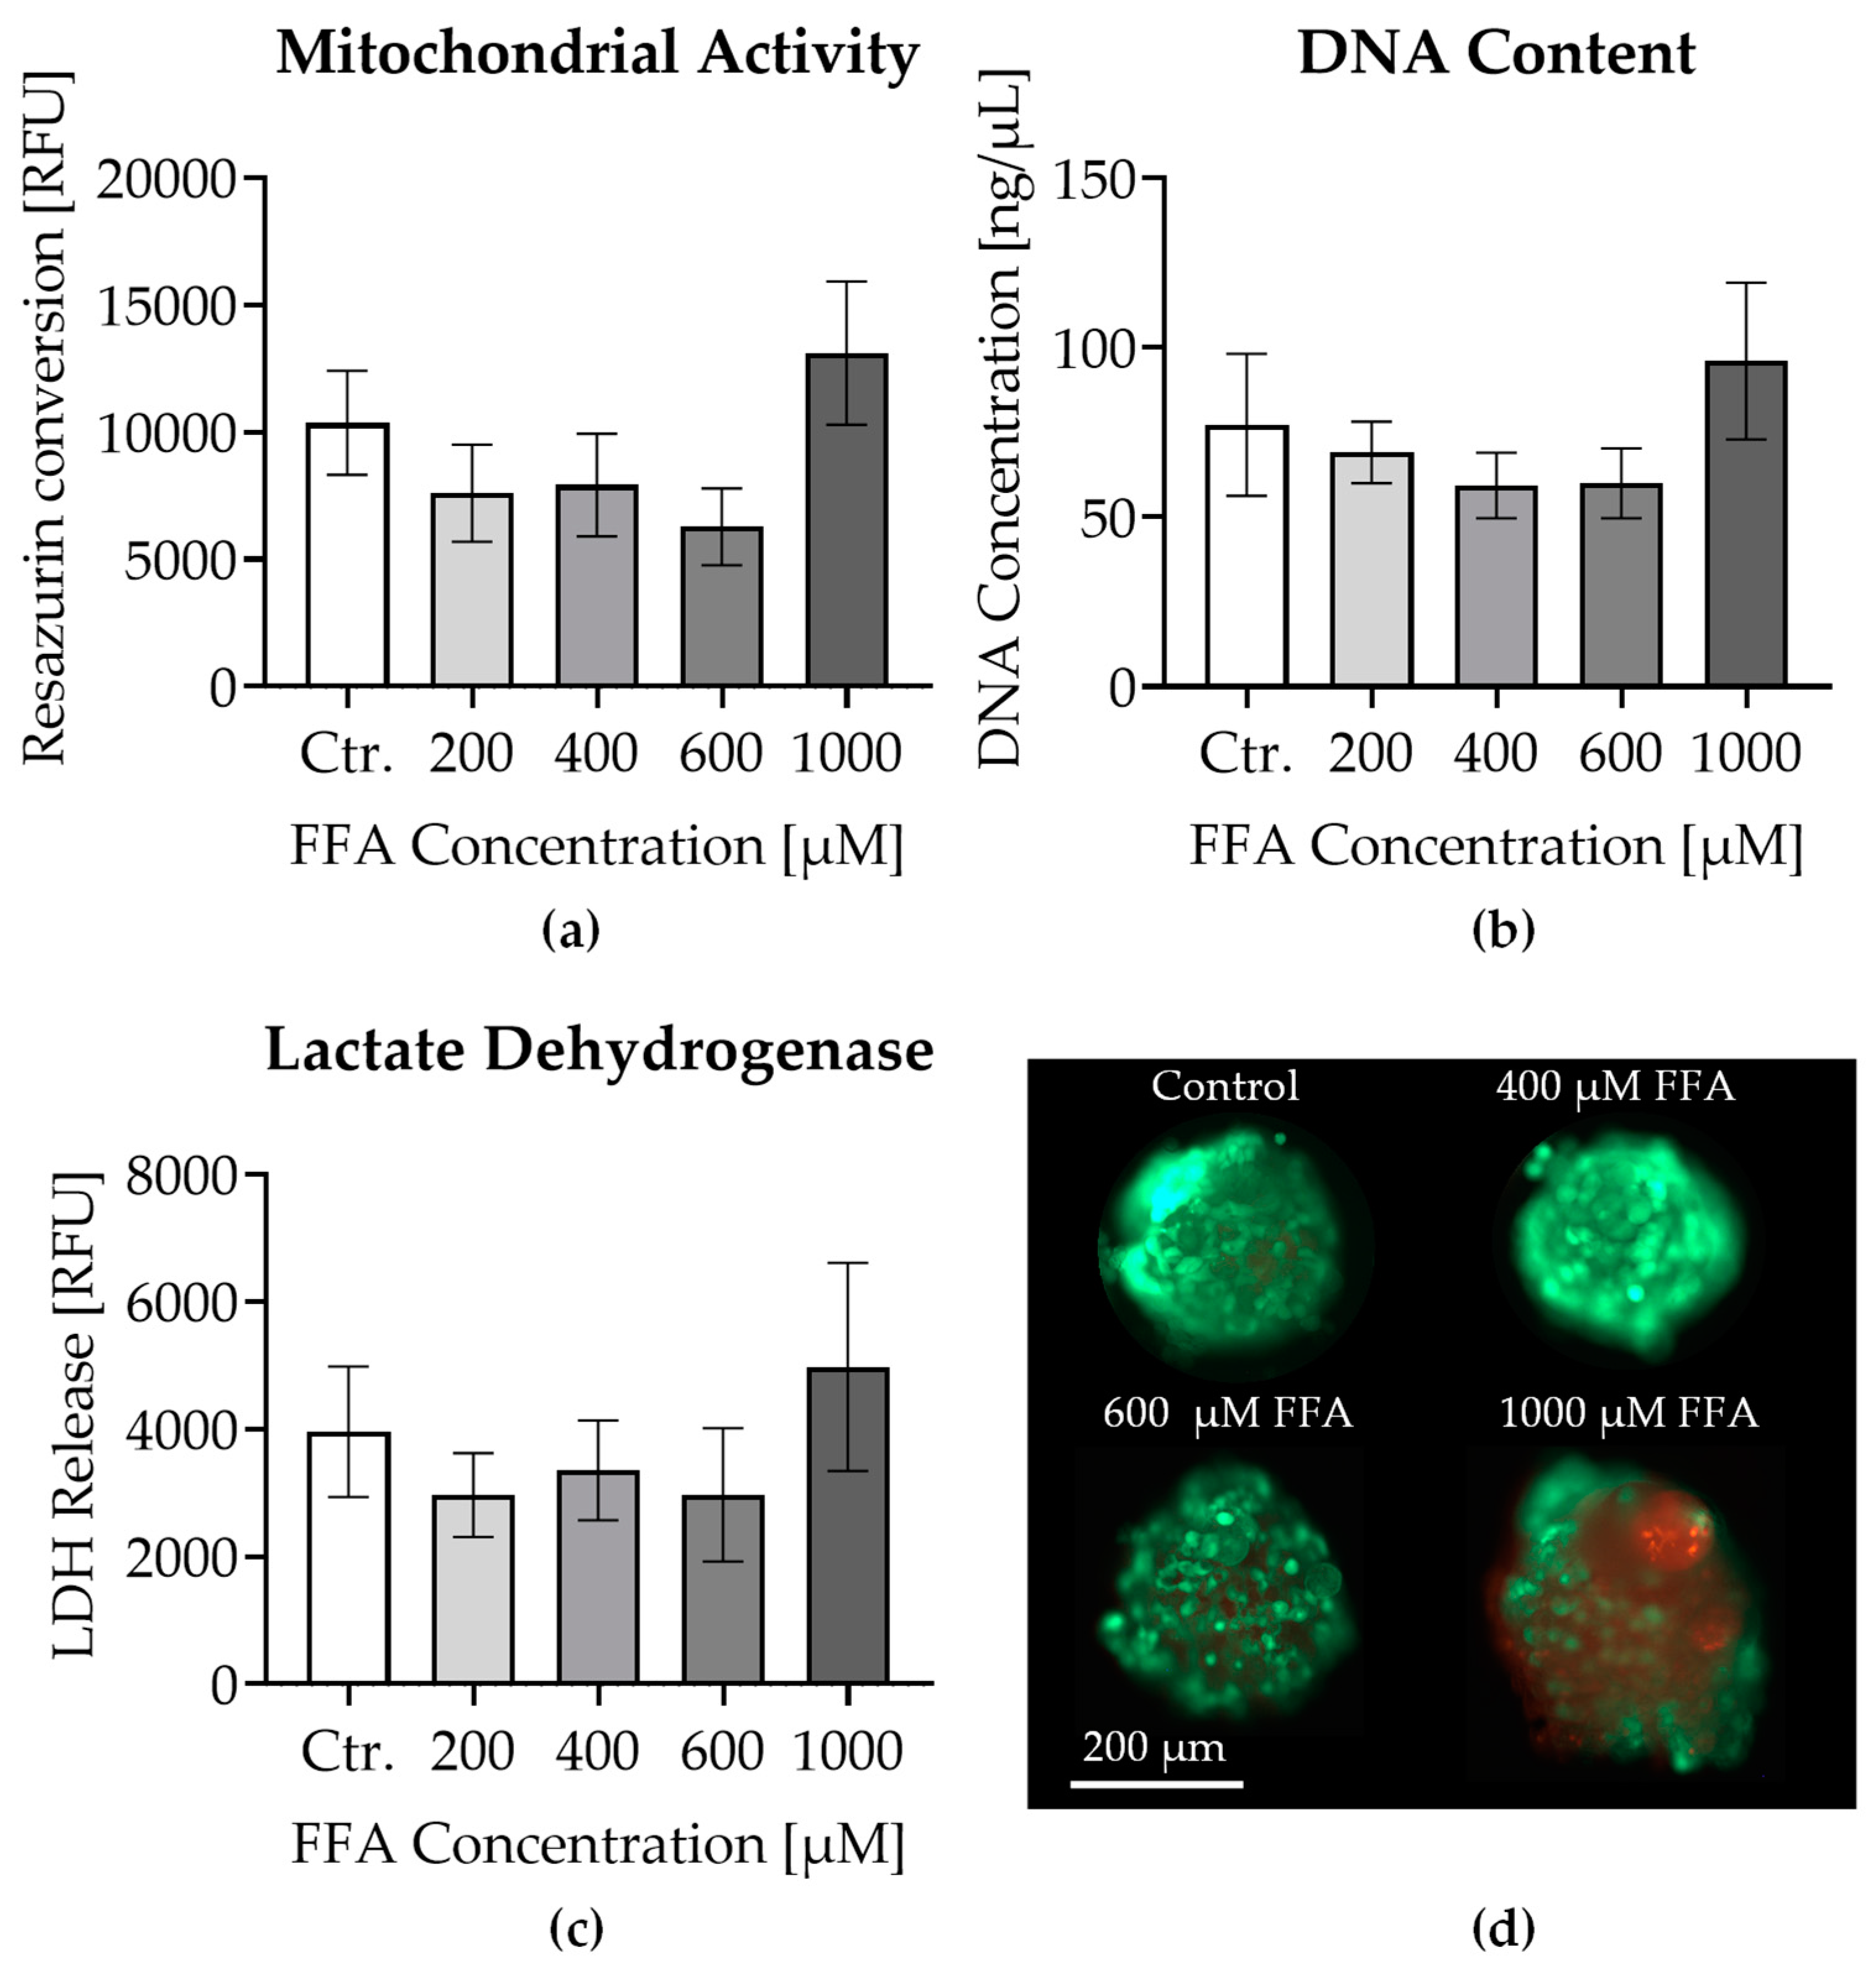
Figure 3.
(a) Fluorescence microscopy images showing liver micro-organoids after 7 days of treatment with different concentrations of oleic:palmitic acids (2:1 ratio): Control (Ctr.), 200–600 µM FFA. Lipid staining was performed using Bodipy (green). The scale bar represents 100 μm. The images illustrate the lipid accumulation in the micro-organoids under different treatment conditions. (b) Quantification of intracellular lipids measured by the relative fluorescence units (RFU) of Bodipy staining. Data are presented as mean ± SEM (N = 3, n = 1). Statistical significance was assessed using the Kruskal-Wallis test, with significance indicated by * p < 0.05 compared to control.
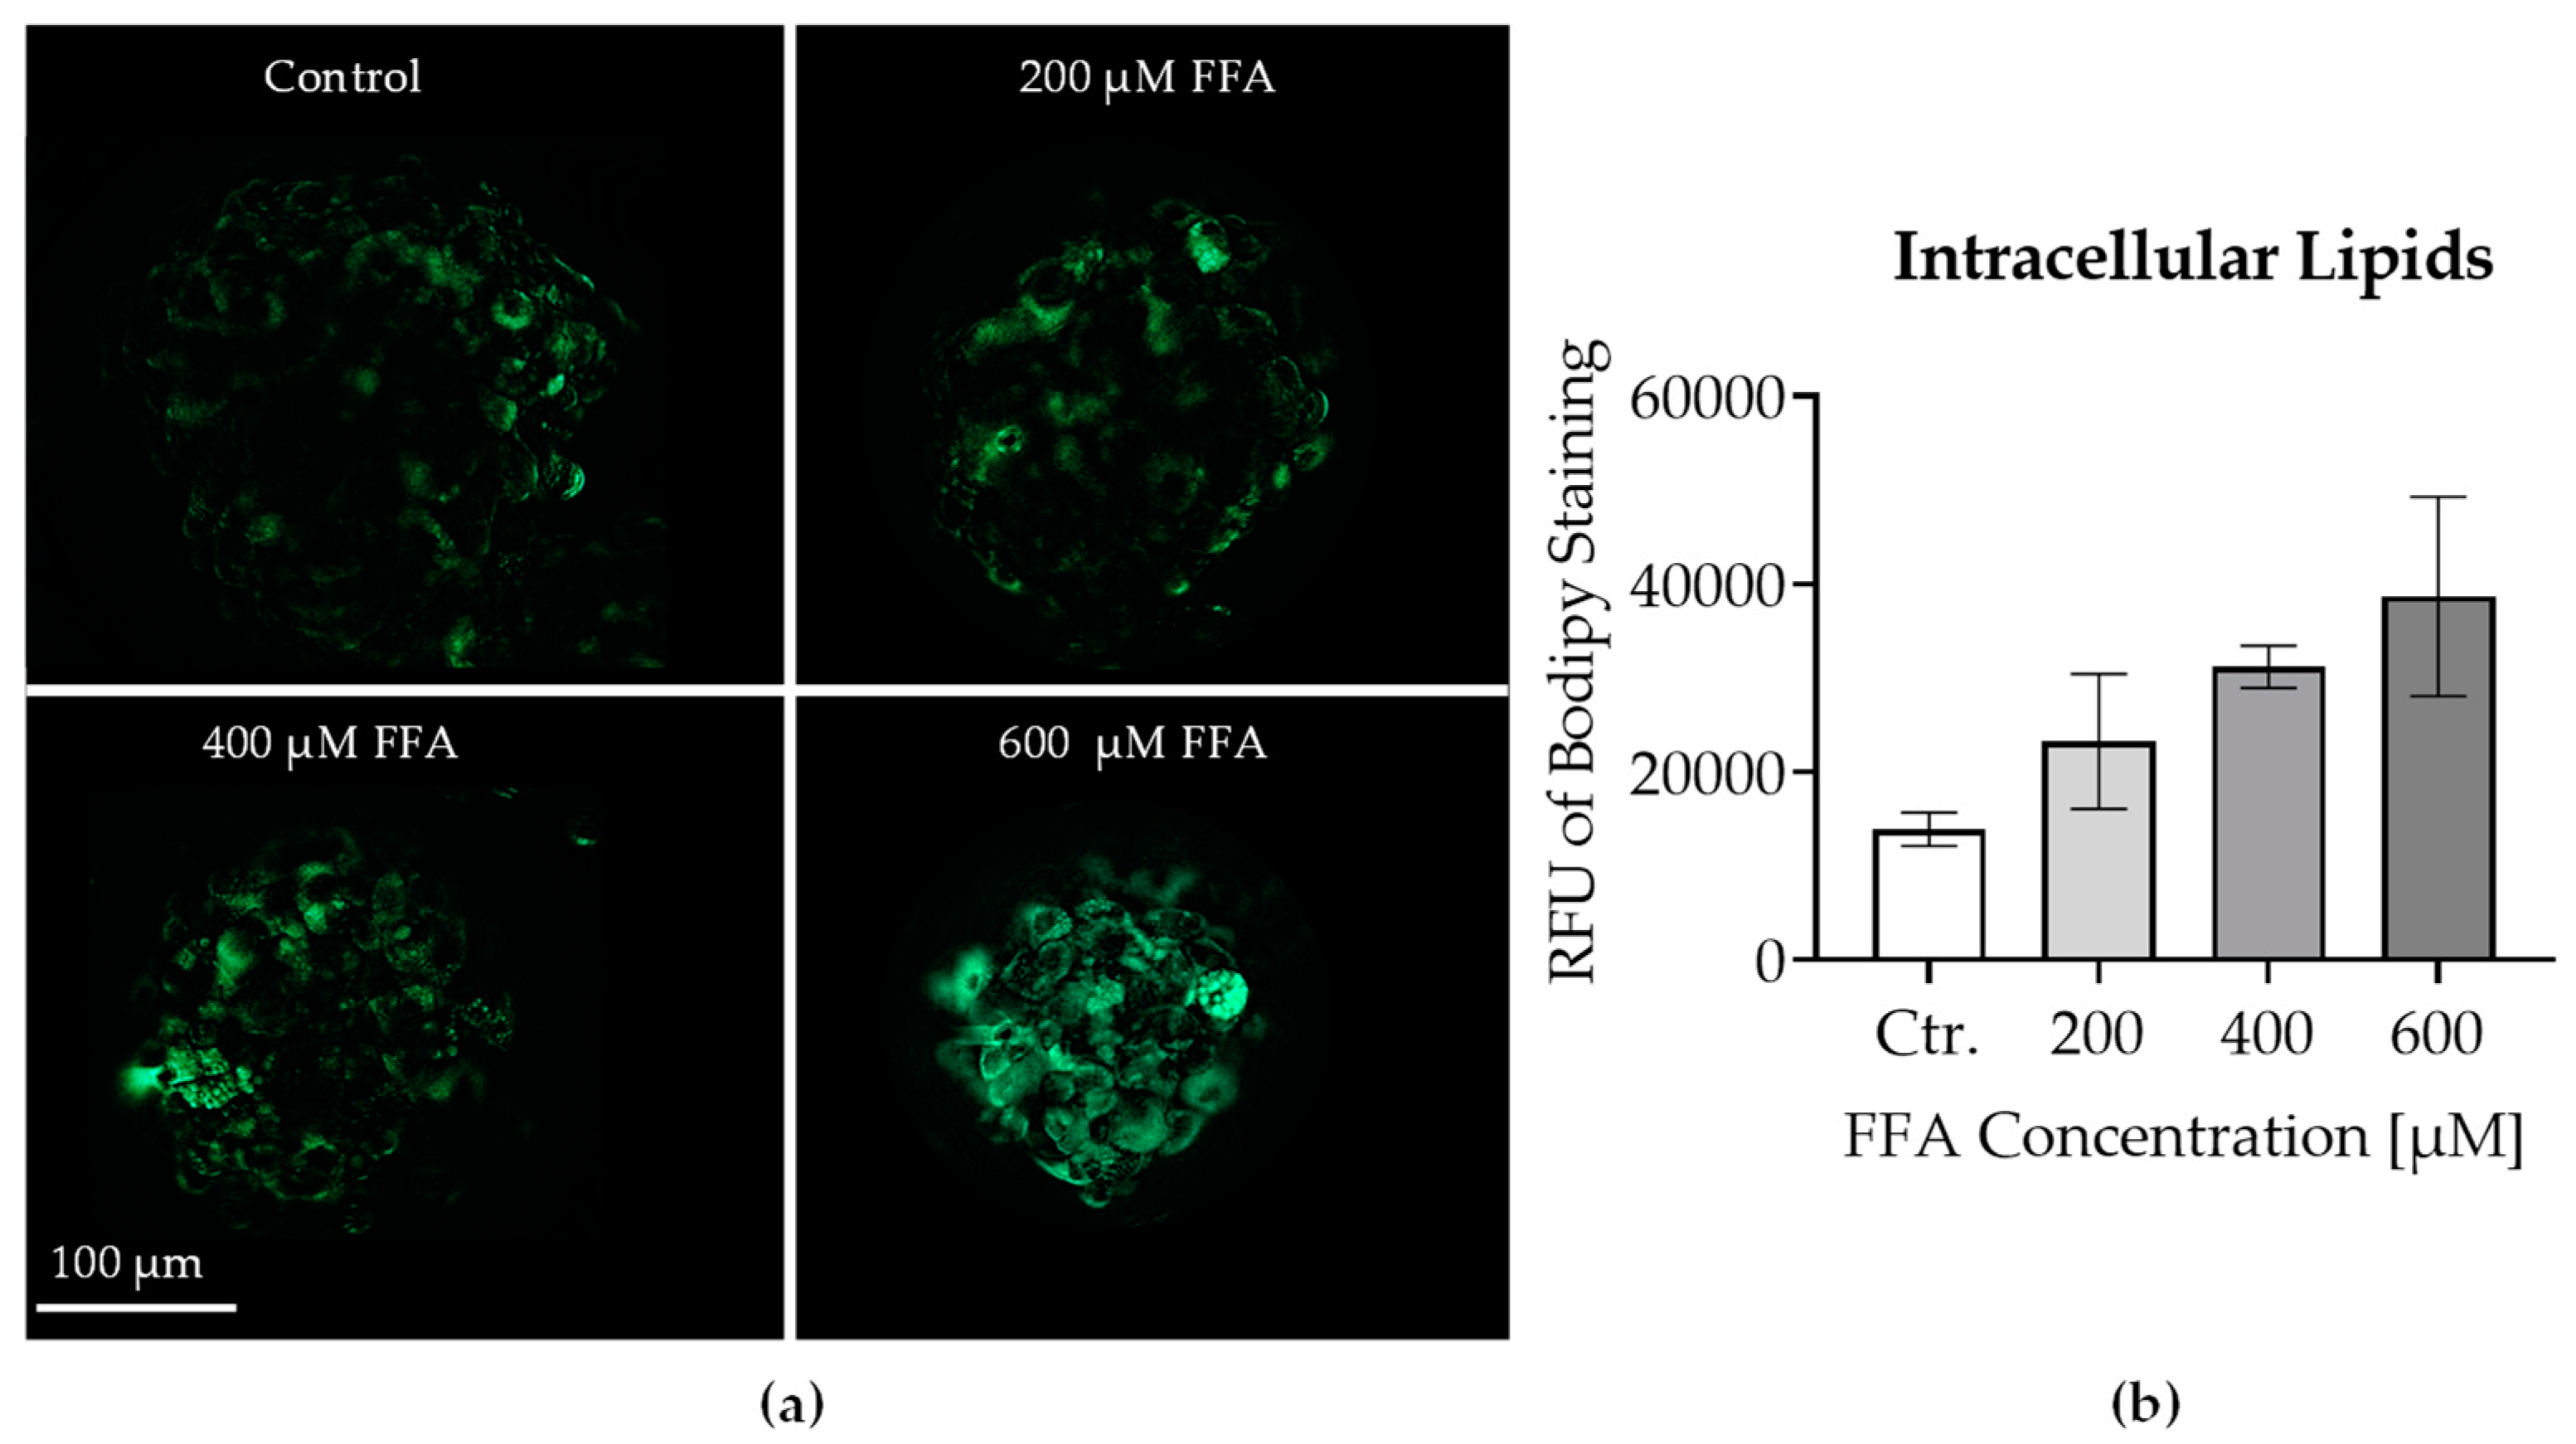
Figure 4.
RT-PCR analysis, gene expression of genes involved in fatty acid accumulation and metabolism of liver micro-organoids after 7 days of treatment with different concentrations of oleic:palmitic acids (2:1 ratio): Control (Ctr.), 400, 600 µM FFA. Graphics represent the gene expression of (a) Perilipin 2 (PLIN2). (b) Apolipoprotein C3 (APOC3). The data are normalized to the housekeeping gene Hypoxanthine-Phosphoribosyl-Transferase 1 (HPRT1) expression and presented as an x-fold change relative to the control for each FFA concentration. The dotted line represents the control. Each bar represents the mean ± SEM (N= 3 pooled samples, n = 2). Statistical significance was assessed using the Kruskal-Wallis test, with significance indicated by ** p < 0.01 compared to control.
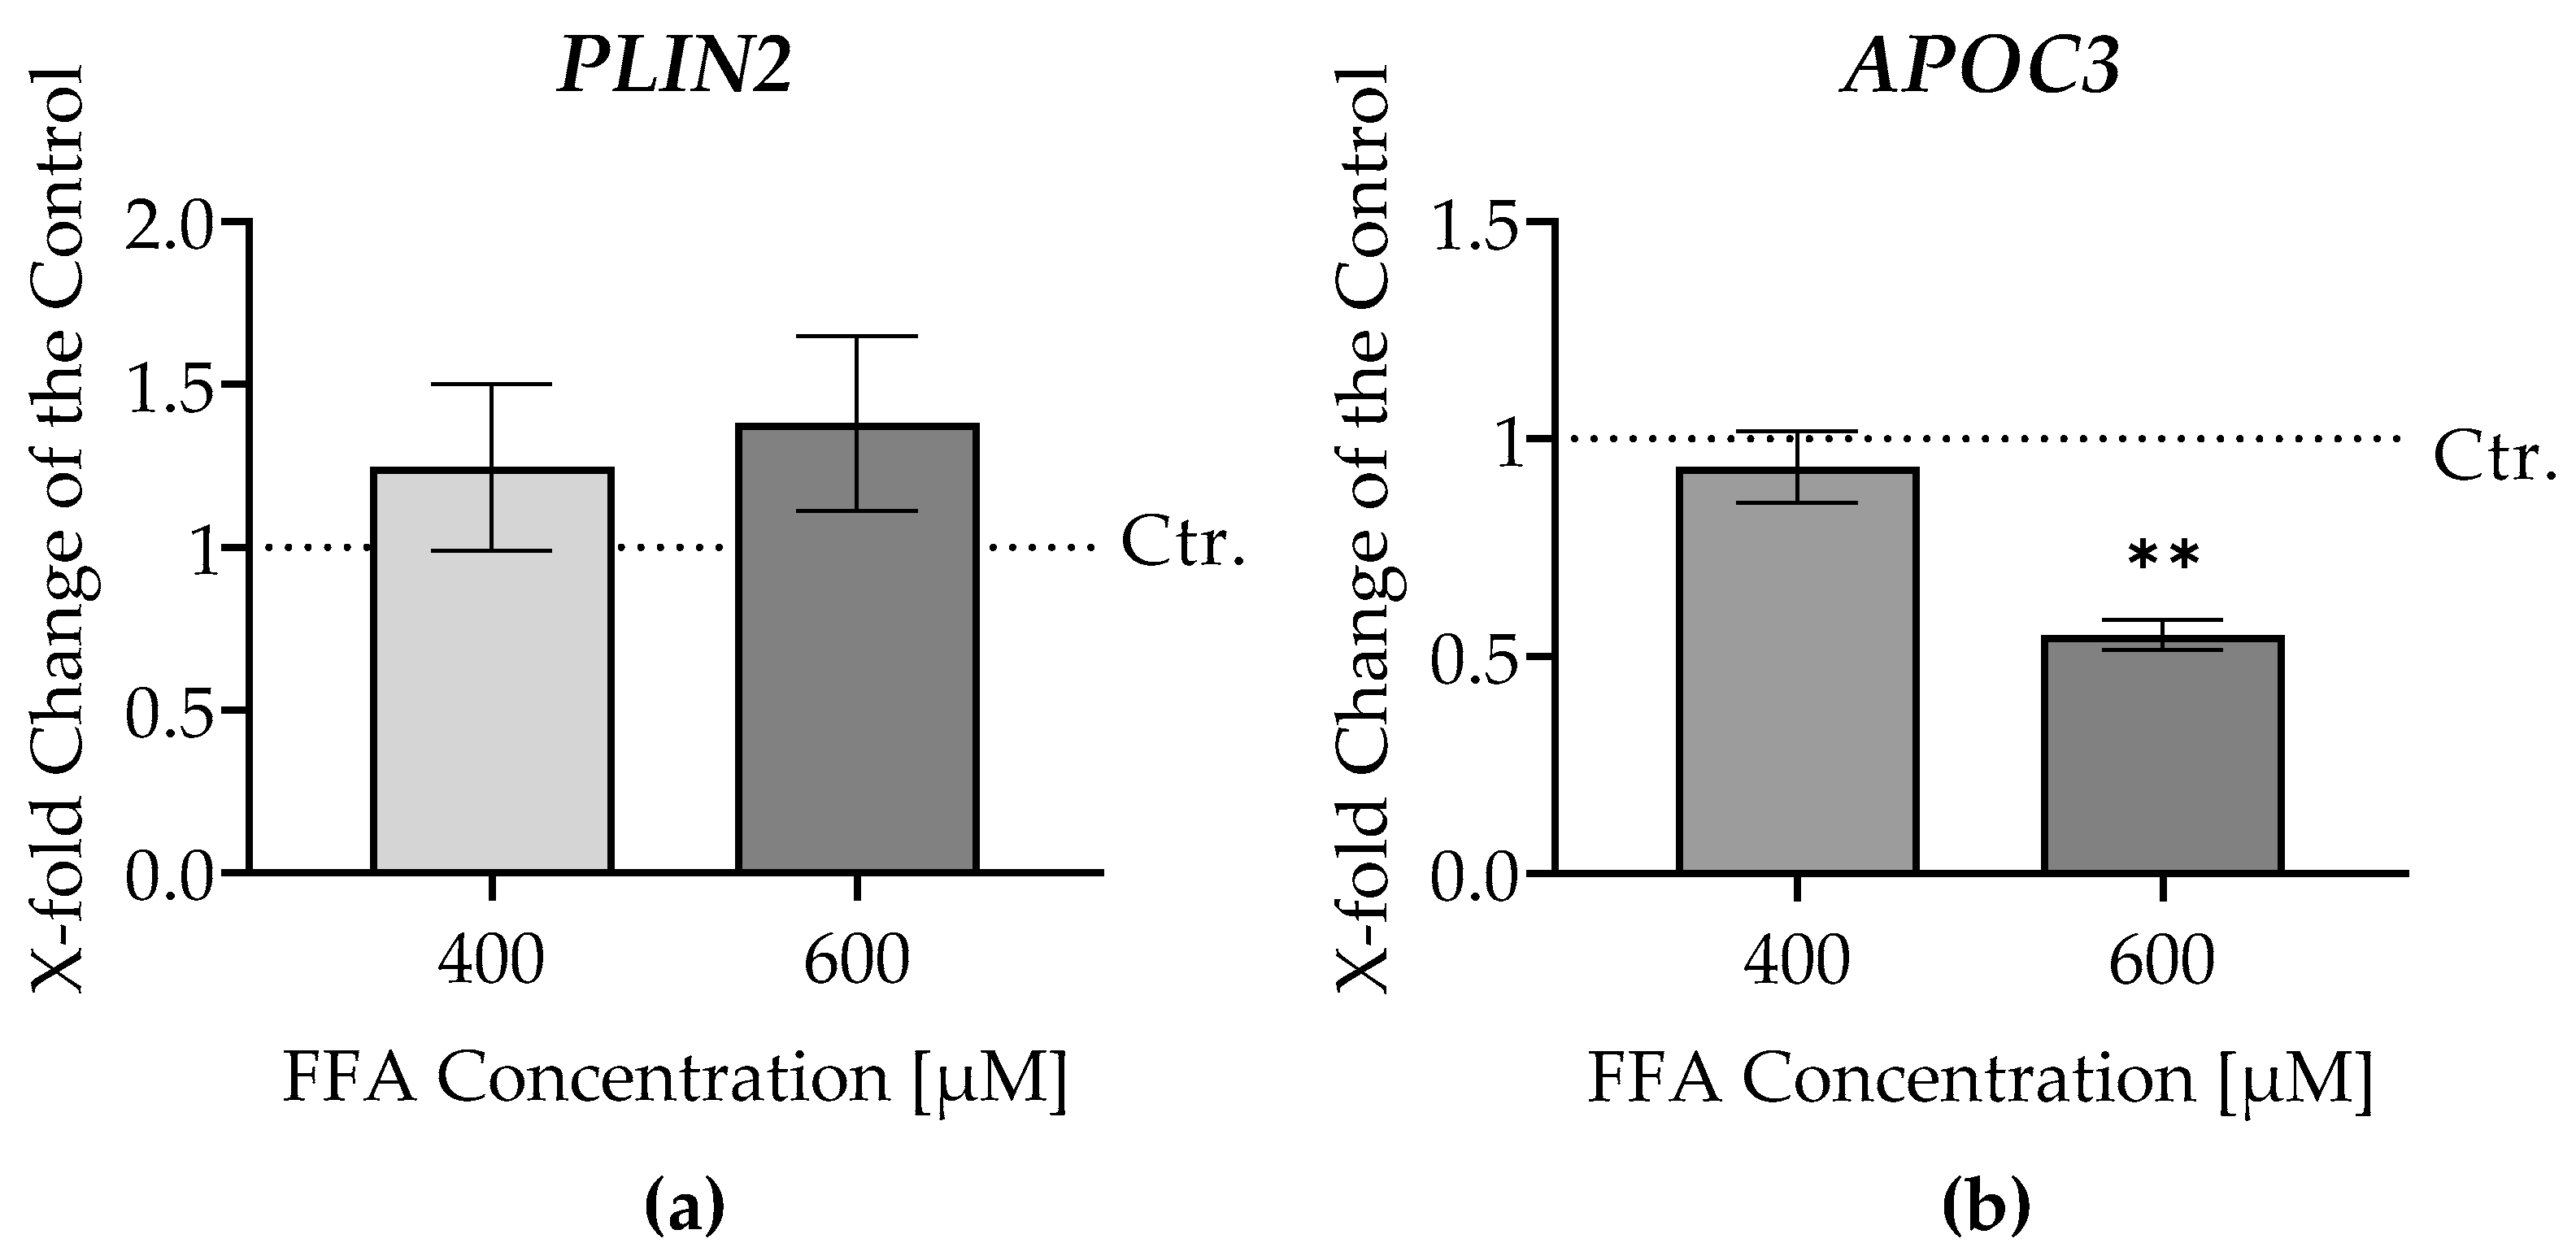
Figure 5.
RT-PCR analysis of CYP enzyme gene expression in liver micro-organoids after 7 days of treatment with different concentrations of oleic:palmitic acids (2:1 ratio): Control (Ctr.), 400, 600 µM FFA. Graphics represent the gene expression of (a) CYP2C9, (b) CYP1A2, (c) CYP3A4 (d) CYP2E1. The data are normalized to the housekeeping gene Hypoxanthin-Phosphoribosyl-Transferase 1 (HPRT1) expression and presented as an x-fold change relative to the control for each FFA concentration. The dotted line represents the control. Each bar represents the mean ± SEM (N= 3 pooled samples, n = 2). Statistical significance was assessed using the Kruskal-Wallis test, with significance indicated by * p < 0.05, ** p < 0.01 compared to control.
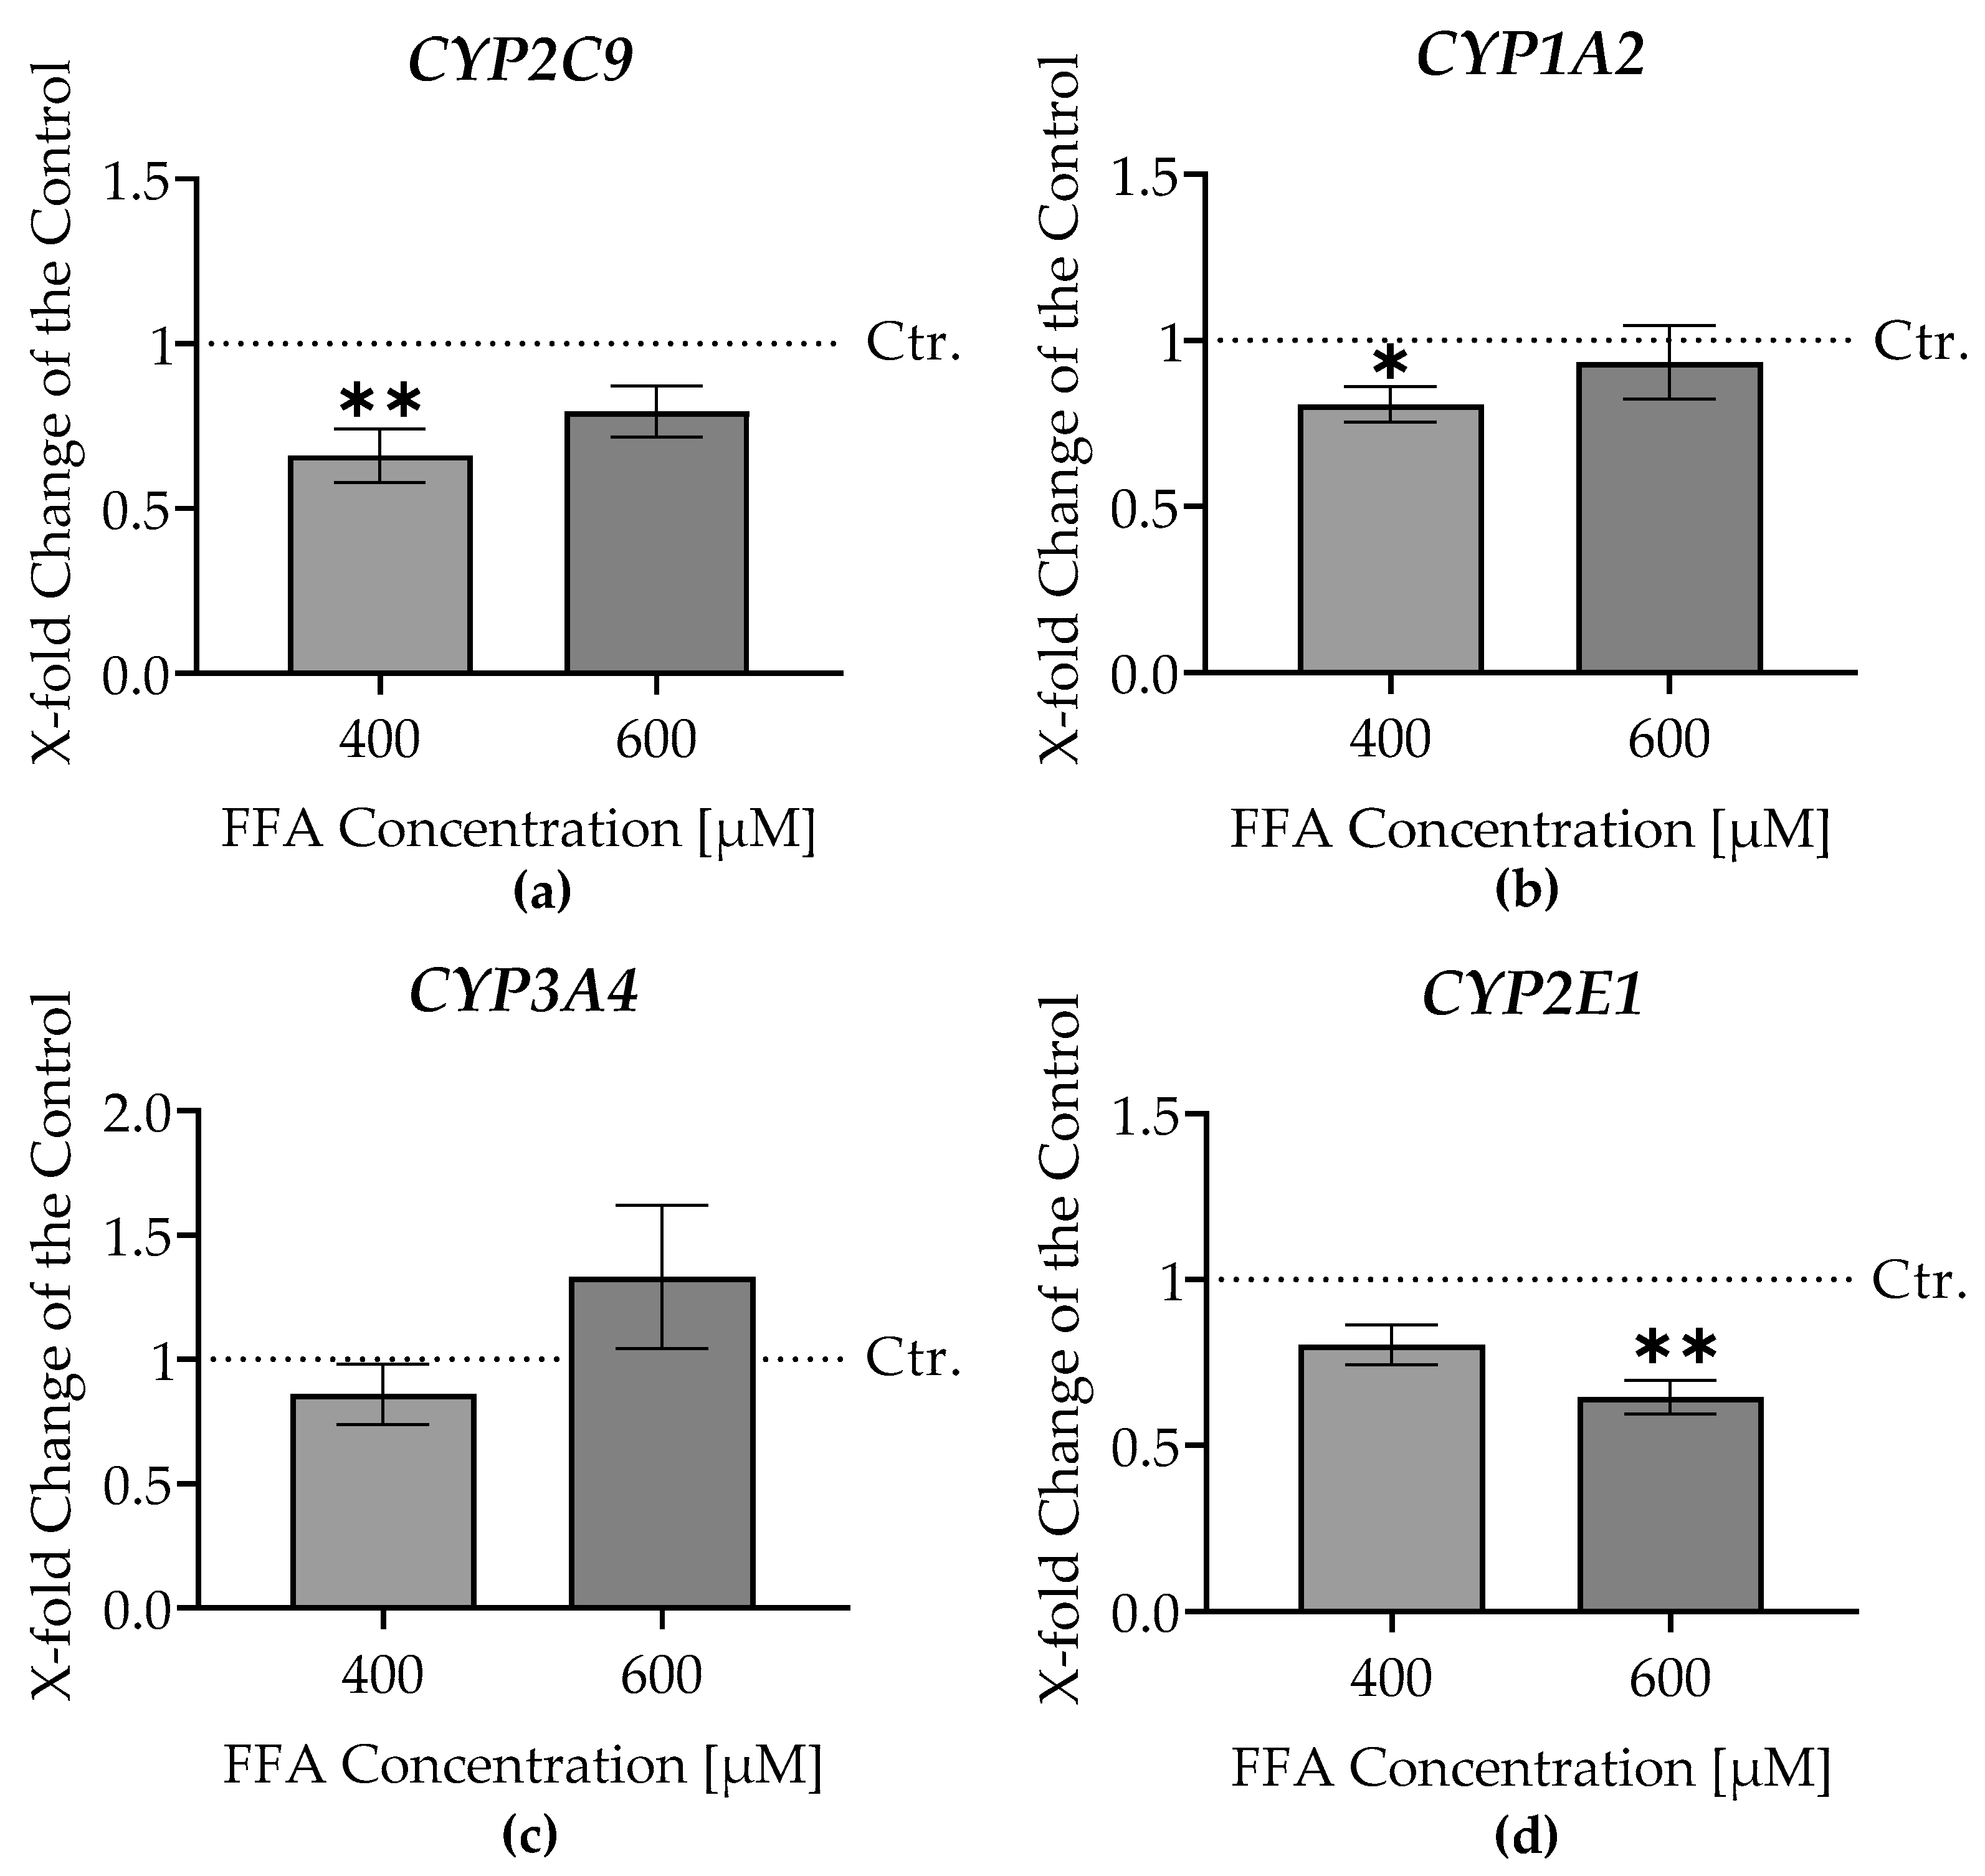
Figure 6.
RT-PCR analysis of epithelial-mesenchymal transition (EMT) markers and protein expression of fibrosis-related proteins in liver micro-organoids after 7 days of treatment with different concentrations of oleic:palmitic acids (2:1 ratio): Control (Ctr.), 400, 600 µM FFA. Graphics represent (a) Gene expression of SNAIL1. (b) Gene expression of N-cadherin. (c) Protein levels of procollagen type I N-terminal propeptide (PINP). (d) Protein levels of alkaline phosphatase (AP). The dotted line represents the control. Each bar represents the mean ± SEM (N = 3 pooled samples, n = 2). PCR data are normalized to the housekeeping gene Hypoxanthin-Phosphoribosyl-Transferase 1 (HPRT1) expression. Protein data were normalized to the total proteins quantified using Ponceau staining for each sample. Statistical significance was assessed using the Kruskal-Wallis test, with significance indicated by * p < 0.05, ** p < 0.01 compared to control.
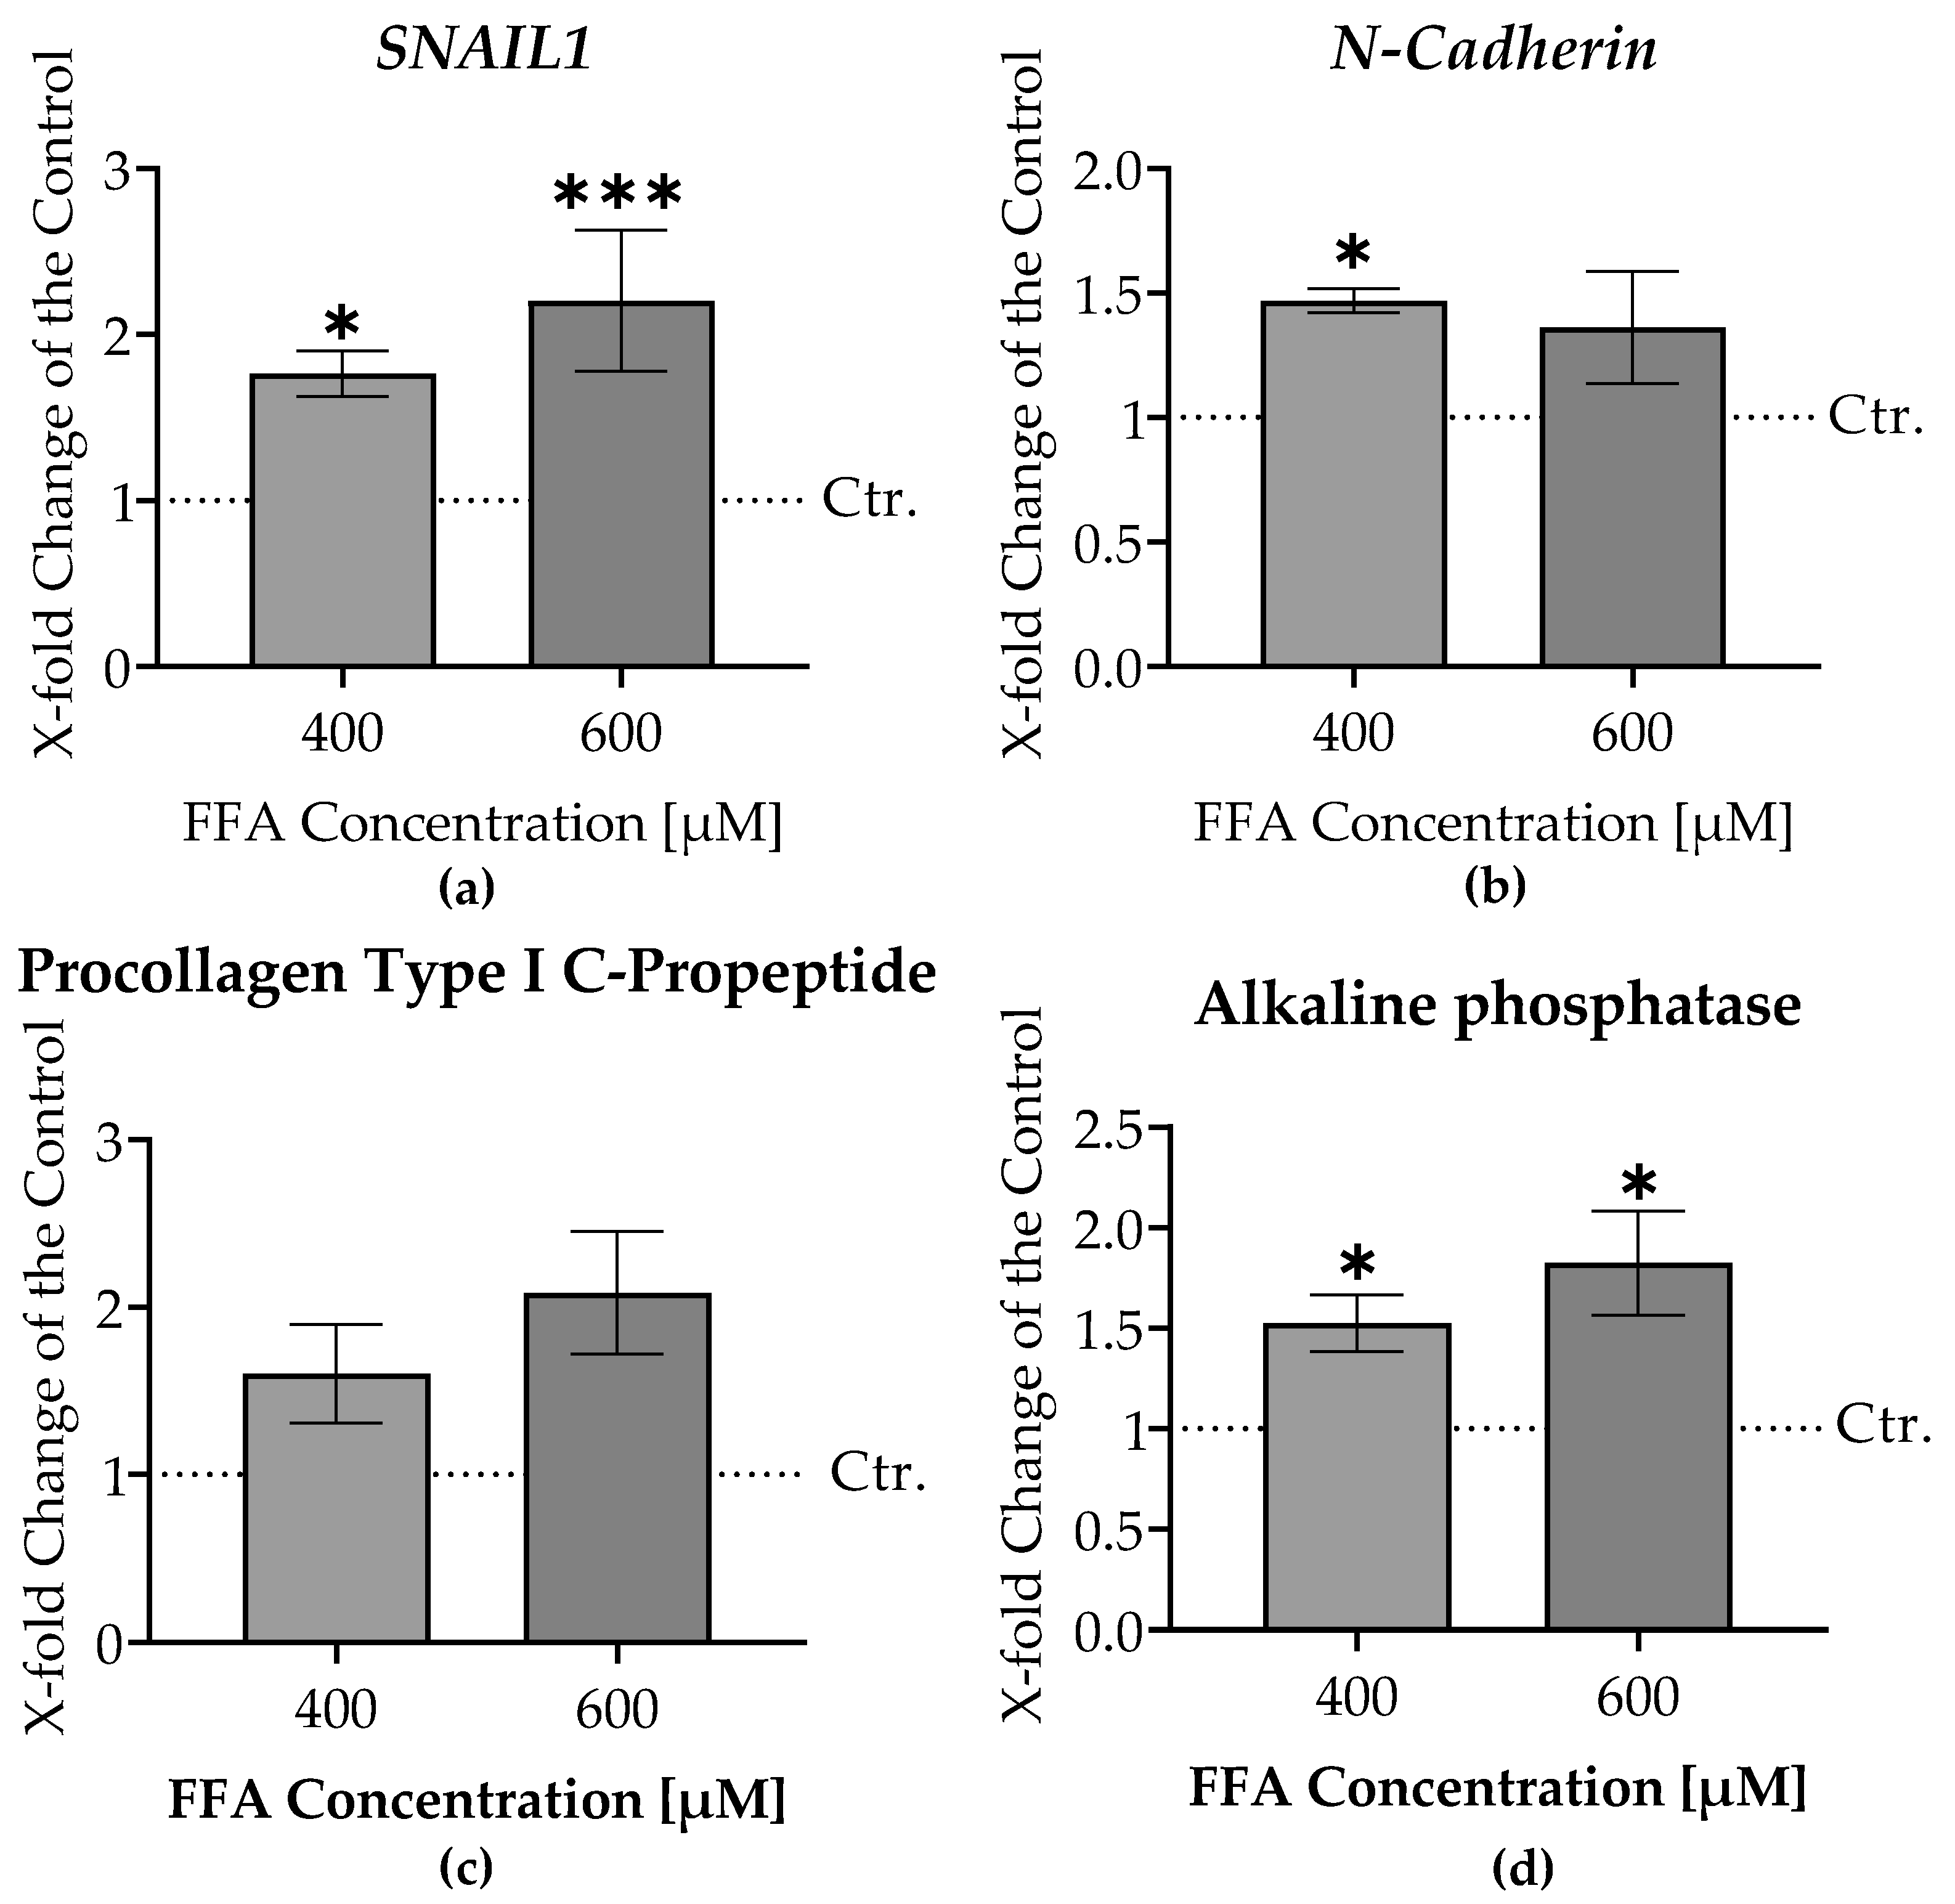
Figure 7.
RT-PCR analysis of vitamin D metabolism-related gene expression and vitamin D metabolic capacity in liver micro-organoids after 7 days of treatment with different concentrations of oleic:palmitic acids (2:1 ratio): Control (Ctr.), 400, 600 µM FFA. Graphics represent (a) Gene expression of CYP27A1, (b) Gene expression of CYP24A1, and (c) Vitamin D metabolism capacity normalized to the total DNA. The gene expression data are normalized to the expression of the housekeeping gene Hypoxanthine-Phosphoribosyl-Transferase 1 (HPRT1) and presented as an x-fold change relative to the control for each FFA concentration. The dotted line represents the control. Each bar represents the mean ± SEM (N = 3 pooled samples, n = 3). Statistical significance was assessed using the Kruskal-Wallis test, with significance indicated by * p < 0.05, ** p < 0.01.
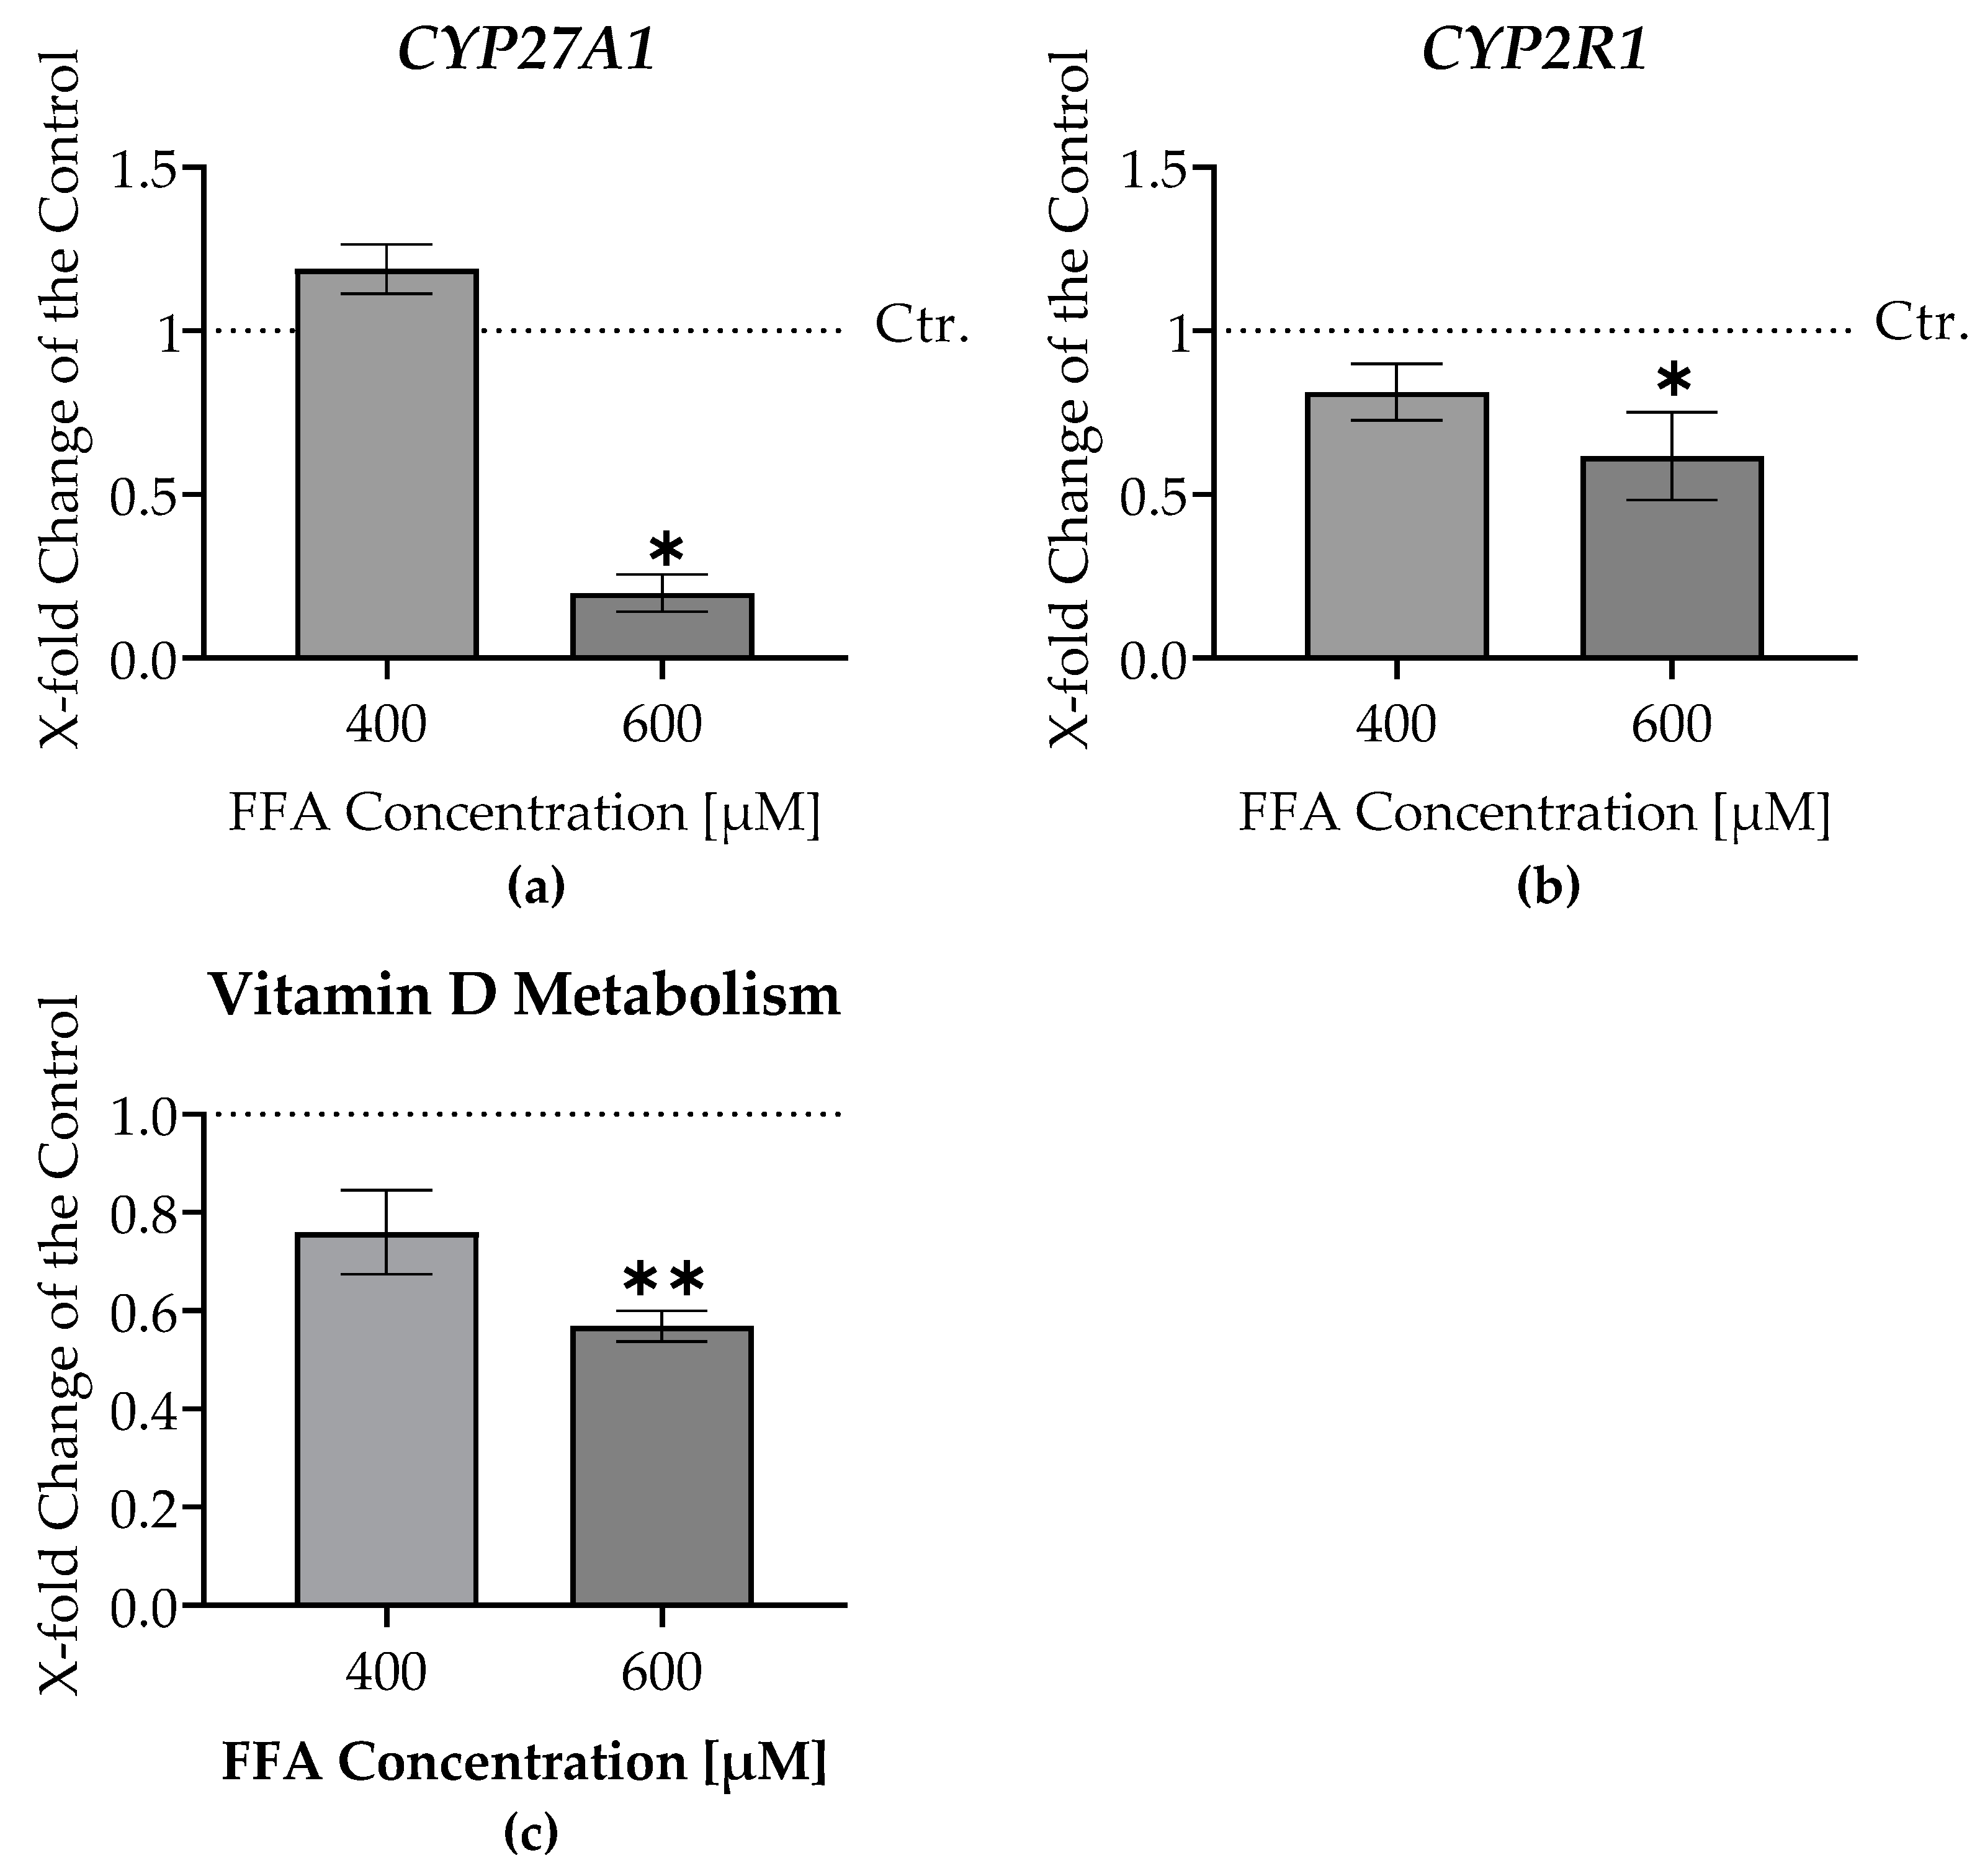

Table 1.
Primer sequences used for the reverse transcriptase PCR.
| Gen | Forward/ Reverse sequences |
GenBank accession | Tm[a] (°C) |
|---|---|---|---|
| HPRT1 | CCTGGCGTCGTGATTAGTGA CGAGCAAGACGTTCAGTCCT |
NM_000194.2 | 58 |
| PLIN2 | TGAGATGGCAGAGAACGGTG TTTGGCATTGGCAACAATCTGA |
NM_001122.4 | 60 |
| APOC3 | CTCCTTGTTGTTGCCCTCCT GGAACTGAAGCCATCGGTCA |
NM_000040.3 | 56 |
| CYP2C9 | CTGGATGAAGGTGGCAATTT AGATGGATAATGCCCCAGAG |
NM_000771.3 | 59 |
| CYP1A2 | CTCTACAGTTGGTACAGATGGCA AGGTGTTGAGGGCATTCTGG |
NM_000761.3 | 60 |
| CYP2E1 | GACTGTGGCCGACCTGTT ACTACGACTGTGCCCTTGG |
NM_000773.3 | 59 |
| CYP3A4 | ATTCAGCAAGAAGAACAAGGACA TGGTGTTCTCAGGCACAGAT |
NM_017460.5 | 64 |
| CYP27A1 | GTGGACACGACATCCAACAC ATGATCCGGGAGTTTGTGG |
NM_000784.4 | 63 |
| CYP2R1 | TGGAAGCTTTGGAGAGCTGA ATCTCTCCGTACACCTGGCT |
NM_024514.5 3 | 64 |
| SNAIL1 | ACCACTATGCCGCGCTCTT GGTCGTAGGGCTGCTGGAA |
NM_005985.3 | 62 |
| N-Cadherin | TGGAGAACCCCATTGACATT GGATTGCCTTCCATGTCTGT |
NM_001792.3 | 56 |
[a] Annealing temperature.
Disclaimer/Publisher’s Note: The statements, opinions and data contained in all publications are solely those of the individual author(s) and contributor(s) and not of MDPI and/or the editor(s). MDPI and/or the editor(s) disclaim responsibility for any injury to people or property resulting from any ideas, methods, instructions or products referred to in the content. |
© 2024 by the authors. Licensee MDPI, Basel, Switzerland. This article is an open access article distributed under the terms and conditions of the Creative Commons Attribution (CC BY) license (http://creativecommons.org/licenses/by/4.0/).
Copyright: This open access article is published under a Creative Commons CC BY 4.0 license, which permit the free download, distribution, and reuse, provided that the author and preprint are cited in any reuse.


