
Submitted:
28 December 2024
Posted:
30 December 2024
You are already at the latest version
Abstract
Proline, a critical osmoregulatory compound, is integral to various plant stress responses. The P5CS gene, which encodes the rate-limiting enzyme in proline biosynthesis, known as ∆1-pyrroline-5-carboxylate synthetase, is fundamental to these stress response pathways. While the functions of P5CS genes in plants have been extensively documented, their specific roles in cotton remain inadequately characterized. In this study, we identified 40 P5CS genes across four cotton species with diverse sequence lengths and molecular weights. Phylogenetic analysis of 100 P5CS genes from nine species revealed three subgroups, with Gossypium hirsutum closely related to Gossypium barbadense. Collinearity analysis highlighted significant differences in collinear gene pairs, indicating evolutionary divergence among P5CS genes in tetraploid and diploid cotton. Exon-intron structures and conserved motifs correlated with phylogenetic relationships, suggesting functional differentiation. Stress-responsive elements in P5CS promoters suggest involvement in abiotic stress. Expression analysis under salt stress revealed differential expression of GhP5CS genes, with GhP5CS1 emerging as a potential key regulator. Virus-induced gene silencing confirmed the pivotal role of GhP5CS1 in cotton’s salt stress response, as evidenced by increased salt sensitivity in the silenced plants. This study enhances our understanding of the functional diversity and stress response mechanisms of P5CS genes in cotton.
Keywords:
Cotton genomics
; P5CS gene family
; GhP5CS1 function
; salt stress
; proline
; Virus-Induced Gene Silencing (VIGS)
1. Introduction
Proline, characterized by its unique and multifunctional properties, plays a crucial role in various biological processes. Its distinctive side chain structure contributes to the structural stability and functionality of proteins, rendering it an indispensable element in protein structure and activity [1,2]. Additionally, proline functions as a compatible solute and an active oxygen scavenger, thereby shielding plants from oxidative stress. Consequently, proline is integral to plant growth and development, particularly in response to environmental stresses. The accumulation of proline in plants can be triggered by a range of abiotic and biotic stresses, including salinity [3,4,5], drought [6,7], ultraviolet (UV) radiation [8,9], heavy metal exposure [10], and various biotic challenges [11,12], among others.
Proline biosynthesis occurs through two distinct pathways: one that derives from glutamic acid and the other from ornithine. In the glutamate pathway, the initial two enzymatic reactions are catalyzed by the bifunctional enzyme P5CS, which exhibits both γ-glutamyl kinase and glutamic-γ-semialdehyde dehydrogenase activities [13]. P5CS represents the rate-limiting step in proline biosynthesis and is pivotal in regulating this metabolic process [13,14]. An upregulation of P5CS gene expression can effectively enhance proline accumulation, thereby augmenting the capacity of plants to withstand stresses [15,16,17]. The glutamic acid pathway predominantly facilitates proline accumulation under stress conditions, whereas the ornithine pathway serves as an alternative route that primarily operates under conditions of adequate nitrogen availability, and does not participate in proline accumulation during stress.
Given the critical biological functions of proline, there has been a growing number of research focused on the role of P5CS genes, particularly in the context of abiotic stress regulation across various plant species. Numerous strategies have been employed to enhance plant stress resistance through the manipulation of the P5CS gene to promote proline accumulation. For instance, the overexpression of NtP5CS, a P5CS gene derived from the halophyte Nitraria tangutorum, has been shown to improve growth in Escherichia coli under diverse conditions [18]. Furthermore, the microRNA ath-miR164c has been identified to be a regulator of pathogen resistance and drought tolerance in Arabidopsis by modulating AtP5CS1 expression and proline levels; in a loss-of-function mutant of ath-miR164c, both AtP5CS1 expression and proline content were elevated compared to the control under combined stress conditions [11]. In wheat, lines overexpressing TaP5CS1 exhibits increased proline levels and enhanced drought tolerance relative to wild-type plants [19] Similar findings have been reported in various other species, including the loss-of-function mutant of Mtp5cs3 in Medicago truncatula under saline conditions [20], the ectopic overexpression of the LpP5CS gene (Lolium perenne) in switchgrass under salt stress [21], the ectopic overexpression of SpP5CS (Stipa purpurea) in Arabidopsis under drought conditions [22], and the ectopic overexpression of PgP5CS (Pennisetum glaucum) in tobacco under heat stress [23]. Collectively, these studies underscore the essential role of P5CS genes in mediating plant responses to environmental stresses.
Gene family analysis is essential for deciphering the functional roles and regulatory mechanisms associated with specific genes. To date, members of the P5CS gene family have been characterized in various species [15,24,25,26]; however, there is limited information regarding this gene in cotton. Cotton is a crop of significant economic importance globally, primarily due to its soft fibers, which are vital to the textile industry. The phenomenon of soil salinization presents a considerable challenge to cotton cultivation, negatively impacting growth and productivity by inducing osmotic and ionic imbalances within the plants [27,28]. Consequently, this study undertook a comprehensive analysis of the P5CS gene family across four cotton species: Gossypium hirsutum (hereafter G. hirsutum), Gossypium arboretum (G. arboretum), Gossypium raimondii (G. raimondii) and Gossypium barbadense (G. barbadense). The analysis encompassed phylogenetic evolution, gene structure, cis-acting elements, expression profiles in response to salt stress treatment, and functional validation through gene silencing mediated by VIGS. The results of this study will contribute to a deeper understanding of the regulatory mechanisms governing the P5CS genes in response to stress in cotton.
2. Results
2.1. Identification and Sequence Analysis of the P5CS Gene Family in Cotton
Following a rigorous screening process using SMART, NCBI-CDD and Pfam databases, a total of 40 P5CS genes were identified across four cotton species in the cotton Phytozome database. Specifically, G. hirsutum harbored 8 genes, G. barbadense contained 18 genes, G. raimondii contained 9 genes, and G. arboreum included 5 genes. These genes were designated as GhP5CS1 - GhP5CS8, GbP5CS1 - GbP5CS18, GrP5CS1 - GrP5CS9, and GaP5CS1 - GaP5CS5, respectively, based on their physical positions on the chromosomes (Figure S1). The distribution of these genes was uneven, with a majority localized to both ends of each chromosome, and each chromosome typically hosts only one or two genes. Among the eight GhP5CS genes, four genes were mapped to four chromosomes of the A subgenome, namely, A01, A07, A08, and A09, whereas the remaining four genes were found on four chromosomes of the D subgenome, namely, D01, D04, D07, and D10. We subsequently analyzed the physical and chemical properties, as well as the sequences, of all identified P5CS genes (Table S2). The 40 P5CS proteins exhibited varying sequence lengths, from 313 amino acids in GbP5CS17 to 916 amino acids in GrP5CS4, with corresponding molecular weights ranging from 33494 Da (GbP5CS17) to 99854.2 Da (GrP5CS4), which suggested a positive correlation between protein length and molecular weight. These findings indicate potential variations in protein sequences, domains and expression patterns, which may underlie the functional diversity. Furthermore, the theoretical isoelectric points (PIs) of the identified P5CS proteins spanned from 5.87 to 9.61, with the majority being weakly acidic and a few being weakly alkaline (Table S2). This further indicates functional differentiation among the P5CS proteins.
2.2. Evolutionary and Selection Analysis of P5CS Genes in Cotton
To elucidate the evolutionary relationships among P5CS genes in both monocotyledonous and dicotyledonous plants, we constructed a phylogenetic tree using protein sequences from nine species. It contains six dicot species, such as G. hirsutum (8 members), G. barbadense (18 members), G. raimondii (9 members), G. arboretum (5 members), Arabidopsis thaliana (8 members) and Theobroma cacao (9 members), as well as three monocot species, namely, Oryza sativa (12 members), Zea mays (13 members), and Sorghum bicolor (18 members) (Figure 1). A total of 100 P5CS proteins were categorized into three subgroups, designed as Groups A to C. Group A comprised 47 members, Group B had 13 members, and Group C included 40 members. The P5CS proteins in G. hirsutum were evenly distributed in Groups A and C, with four members in each. Phylogenetic analysis revealed that P5CS genes in cotton are closely related to the evolutionary branches of monocot plants, suggesting potential functional divergency between monocots and dicots. Furthermore, the P5CS genes in G. hirsutum tended to cluster with those in the tetraploid G. barbadense on the phylogenetic tree, indicating a closer evolutionary relationship.
Collinearity analysis effectively reflects gene homology, and collinear homologous genes are likely to share similar functions. We analyzed the interchromosomal collinearity of P5CS genes across the genomes of four cotton species. In G. hirsutum, we identified five collinear gene pairs involving six GhP5CS genes. In G. barbadense, 15 collinear gene pairs related to 14 GbP5CS genes were detected, primarily between homologous chromosomes. Additionally, five and one collinear gene pairs were identified in the genomes of G. raimondii and G. arboretum, respectively (Figure S2). The presence of collinear gene pairs within a species suggests evolutionary events such as gene duplication and chromosomal rearrangements, potentially leading to functional divergence among gene family members.
To further investigate the evolutionary relationships of P5CS genes, we performed collinearity analysis of P5CS genes between G. hirsutum and three other cotton species, namely, G. barbadense, G. raimondii, and G. arboretum. We found significant differences in collinear gene pairs between tetraploid G. hirsutum and G. barbadense, and between tetraploid G. hirsutum and the two diploid cotton species (Figure 2). Specifically, 26 collinear gene pairs were found between G. hirsutum and G. barbadense, while eight and two collinear gene pairs were found between G. hirsutum and G. raimondii, and G. arboretum, respectively. These results suggest substantial evolutionary divergence of P5CS genes between tetraploid and diploid cotton species. The high number of collinear gene pairs between G. hirsutum and G. barbadense indicates a closer genetic relationship, suggesting that they have undergone less genetic divergence since their divergence from a common ancestor, maintaining a greater degree of synteny. In contrast, a low number of collinear gene pairs (only three) were found between two diploid species, G. raimondii and G. arboretum, indicating a more distant evolutionary relationship (Figure S3).
To explore the selection events that the P5CS genes have undergone during evolution in cotton, we analyzed the selection pressure by calculating the KA, KS and their ratio of P5CS gene pairs. Across the four cotton species, we verified one to fifteen homologous pairwise genes, and their KA/KS ratios ranged from 0.046 to 0.221 (Table S3). These findings indicate that these P5CS genes were under purifying selection during evolution, with natural selection maintaining protein integrity by eliminating harmful mutations.
2.3. Gene Structure and Conserved Motif Analysis of P5CS Genes in Cotton
To elucidate the structural compositions of P5CS genes in cotton, we compared the DNA and cDNA sequences of each gene to deduce their exon-intron structures (Figure 3B). The results revealed that the majority of P5CS genes possess complex structures, with the number of exons ranging from 7 to 20, except for two genes that contain only one intron. A significant proportion of P5CS genes (82.5 %, 33/40) presented open reading frames with at least ten exons. Notably, all eight GhP5CS genes share the same structure, comprising ten exons, whereas the other three cotton species present varying exon numbers. Furthermore, our observations indicated that P5CS genes that are closely related in the evolutionary tree tend to have more similar exon and intron arrangements (Figure 3A and B). These findings suggest a strong correlation between exon-intron structure and phylogenetic relationships within this gene family.
To further delineate the characteristic regions of the P5CS proteins in cotton, which are closely associated with their functions, we employed MEME software to predict ten conserved motifs, designated as Motif 1 to Motif 10, among the P5CS proteins (Figure 3C). Two P5CS proteins, GbP5CS18 and GaP5CS4, were found to lack any motifs. The number of conserved motifs identified in the P5CS genes ranged from one to six. Interestingly, the distribution of these motifs was closely associated with the branches of the evolutionary tree. Motifs 2, 5, 6, 7, 9 and 10 were found in 11 P5CS genes within the blue clade; Motifs 2, 4, 5, 6, 7 and 9 were located in four P5CS genes within the light green clade; Motifs 1, 3, 4, 7, and 8 were detected in 15 P5CS genes within the red clade; and five P5CS genes in the orange clade contained Motifs 5, 6 and 10. In contrast, three P5CS genes in the purple clade possessed only Motif 8. These findings suggest that P5CS genes in different evolutionary clades exhibit distinct motif compositions and gene structures, indicating potential functional differentiation of P5CS genes in cotton. The variation in the distribution of conserved motifs may imply that these genes have evolved distinct functions within the cotton P5CS gene family.
2.4. Analysis of the Subcellular Localization of the P5CS Proteins in Cotton
Understanding the expression sites of proteins is crucial for exploring their functions and interaction patterns. Therefore, we predicted the expression locations of P5CS genes in cotton. The results revealed that almost all P5CS proteins across the four cotton species were expressed primarily in chloroplasts, mitochondria and cytoplasm (Figure S4), with no significant differences in expression patterns observed. Specifically, 11 P5CS genes in G. hirsutum, G. barbadense and G. raimondii were predicted to be located mainly in mitochondria; 19 genes were found to be predominantly localized to chloroplasts, with four, eight, four, and three genes in G. hirsutum, G. barbadense, G. raimondii and G. arboretum, respectively. In addition, six P5CS genes were predicted to be expressed primarily in the cytoplasm. Furthermore, two genes in G. barbadense and one P5CS gene in G. raimondii were most likely expressed in the nucleus (Figure S4A-D). These findings suggest that P5CS genes may play diverse roles at different cellular sites, primarily related to the metabolic pathways of proline in mitochondria and chloroplasts.
2.5. Cis-Acting Element Analysis of the P5CS Gene Promoters in Cotton
To further investigate the potential functions of the P5CS genes in the stress response, the 1.5-kb promoter sequence upstream of each P5CS gene in the four cotton species was isolated and analyzed to identify potential cis-acting regulatory elements (CAREs). A total of 18 CAREs within the promoter regions of P5CS genes were identified (Figure S5). The identification of these cis-acting elements was consistent with the results of the gene structure and evolution analyses. These elements included four stress-responsive elements, including MBSs (drought-induced MYB binding site elements), LTRs (low-temperature response elements), CAAT-box (salt and drought response elements) and WUN-motif (wounding induction elements), as well as eight hormone-responsive elements, such as ABREs, AREs, CGTCA-motif, GARE-motif, MYB, TGACG-motif, P-box and TCA-element. The MYB cis-acting elements, which are involved in controlling plant secondary metabolism, regulating cell morphogenesis, and responding to environmental factors, were found in most of the P5CS genes. Notably, the traditional promoter element, the CAAT-box, was present in all P5CS promoters. This element is involved in the regulation of gene expression in plants under different environmental stresses, such as drought, salinity and cold, and is also involved in normal growth and development. Under stress conditions, the CAAT-box may interact with ABRE (related to ABA), CGTCA-motif (related to methyl jasmonate) and P-box (gibberellin) elements to regulate downstream gene expression, thereby adapting to various stresses. These findings strongly suggest that cotton P5CS genes may play a role in mediating responses to abiotic stresses.
2.6. Secondary Structure Prediction and Three-Dimensional Modeling of the GhP5CS Proteins
Since the close relationship between protein structure and function, we further predicted the secondary and tertiary structures of eight GhP5CS genes in G. hirsutum to increase our understanding of their roles. The secondary structure predominantly consists of α-helices and random coils, followed by extended strands and β-turns (Table S4). α-helices were the most abundant, constituting 39.57% to 50.70% of the secondary structure, followed by random coils (26.40% to 38.13%), extended strands (approximately 16%), and β-turns (approximately 6%).
The three-dimensional structures of the GhP5CS proteins were modeled via homology modeling (Figure S6). These models facilitated clear visualization of the composition and positions of secondary structures within GhP5CS proteins. The secondary structure elements, α-helices, random coils, extended strands, and β-turns further fold into a compact globular spatial structure through interactions between side chain groups and the maintenance of various secondary bonds. Notably, two distinct types of three-dimensional models were identified, which exhibited significant structural differences. The three-dimensional conformations of GhP5CS1, GhP5CS5, GhP5CS6 and GhP5CS8 are similar, whereas the remaining four GhP5CS proteins exhibit another set of similar three-dimensional structures. These observations suggest potential functional differentiation among GhP5CS proteins and imply that they may participate in different biological processes.
2.7. Expression Patterns of GhP5CS Genes Under Salt Stress
Previous studies have established that P5CS genes play pivotal roles in abiotic stress response in various plants. The identification of cis-acting elements in the promoter region of P5CS genes further supports their involvement in stress response. Gene expression patterns can also provide crucial insights into gene function. Therefore, to explore the molecular function of the GhP5CS genes under salt stress, we assessed the expression levels of all eight GhP5CS genes in the leaves and roots of upland cotton TM-1 plants under control conditions and salt stress using qRT-PCR. Under salt stress, four out of the eight GhP5CS genes exhibited significant differences in expression in both leaves and roots, namely, GhP5CS1, GhP5CS5, GhP5CS6, and GhP5CS7, suggesting their potential role in response to salt stress, while the other four genes did not (Figure 4 and Figure 5). Among the four genes whose expression significantly differed, the expression of GhP5CS7 was downregulated in both the leaves and roots, whereas that of the remaining genes was upregulated under salt stress. Furthermore, GhP5CS1, which presented the greatest increase in expression under salt stress (23.9-fold in leaves and 11.6-fold in roots), may be the key regulatory gene involved in the response to salt stress in cotton. Collectively, these results indicate that some GhP5CS genes are indeed involved in the salt stress response of cotton, but they may operate through different mechanisms due to their distinct expression patterns.
2.8. Virus-Induced Gene Silencing of GhP5CS1 Leads to Salt Sensitivity in Cotton
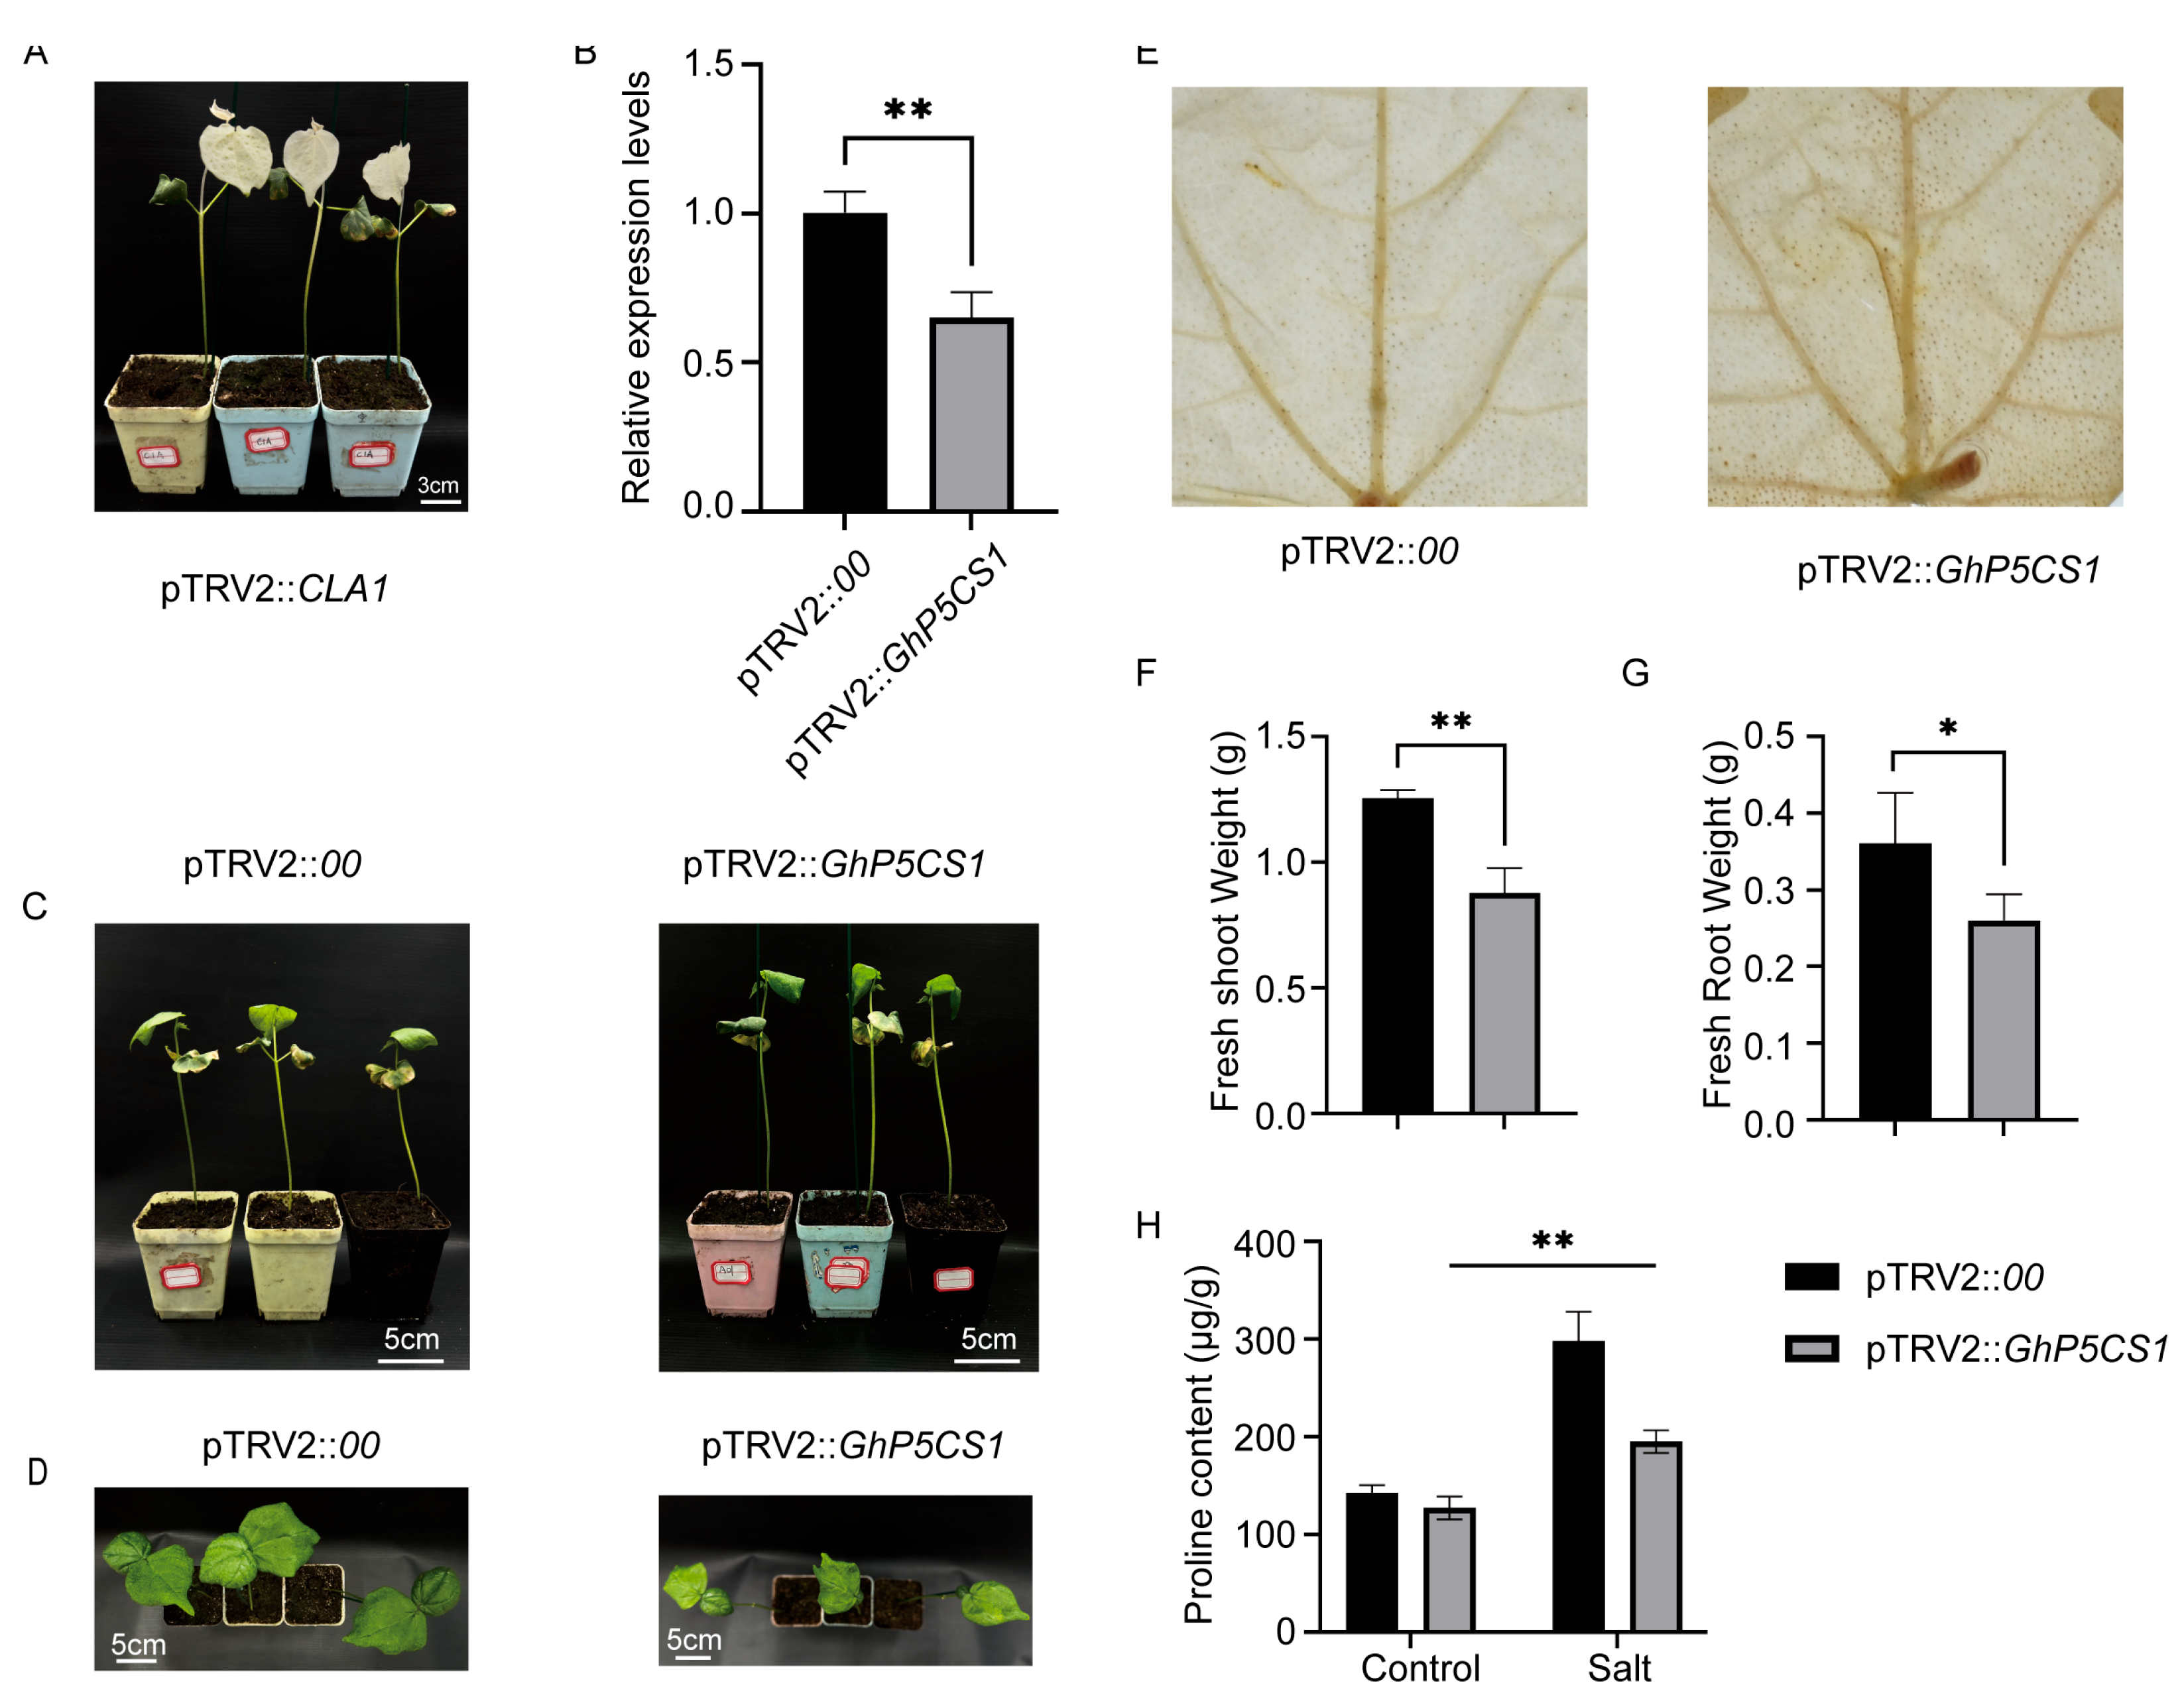
Recognizing the pronounced upregulation of GhP5CS1 under salt stress as confirmed by qRT-PCR, we used Virus-Induced Gene Silencing (VIGS) technology to downregulate its expression in upload cotton to definitively establish the role of GhP5CS1 in response to salt stress in cotton. We fused CLA1 (Cloroplastos alterados 1) with the pTRV2 vector, and the resulting construct was subsequently transformed into Agrobacterium tumefaciens to infect the cotton plants. The pTRV2::CLA1 plants, which served as a positive control, developed an albino phenotype in newly emerged true leaves, thereby validating the efficacy of our experimental system (Figure 6A).
Subsequently, we suppressed the expression of GhP5CS1 using the same VIGS system by constructing the pTRV2::GhP5CS1 fusion vector. Samples of young leaves from both pTRV2::00 and VIGS plants were collected, and qRT-PCR analysis confirmed a significant decrease in the expression levels of VIGS plants, indicative of successful gene silencing (Figure 6B). No significant differences in growth were detected between the qTRV2::00 and VIGS plants under normal conditions (Figure 6C). However, under salt stress, the growth of the GhP5CS1-silenced plants was markedly slower, and the size of their true leaves was considerably smaller than that of the control plants (Figure 6D). Additionally, compared with the control plants, the gene-silenced plants displayed more severe oxidative damage upon DAB staining (Figure 6E), suggesting increased susceptibility to salt stress-induced damage. The fresh weights of both the roots and shoots also noticeably differed between the gene-silenced and control plants, demonstrating that salt stress substantially hindered plant growth when the GhG5PS1 gene was silenced (Figure 6F and G). Moreover, the proline content in the gene-silenced plants was significantly lower than that in the control plants, further indicating the involvement of GhP5CS1 in proline biosynthesis, a key osmolyte that confers salt tolerance in cotton (Figure 6H). This reduction in proline accumulation in the silenced plants likely underpins their increased sensitivity to salt stress. Collectively, these findings confirm that GhP5CS1 plays a pivotal role in the response of cotton to salt stress, potentially by modulating proline biosynthesis.
3. Discussion
Proline, functioning as an osmoregulatory substance, alleviates plant stress by accumulating under adverse conditions [29]. In higher plants, the P5CS gene is a pivotal enzyme in proline biosynthesis and a rate-limiting enzyme in stress-induced proline synthesis [13,30]. P5CS, a bifunctional enzyme, possesses both glutamate kinase (γ-GK) and glutamate semialdehyde dehydrogenase (GSADH) activities, which are more efficient than the ornithine pathway found in bacteria and lower eukaryotes [31]. Consequently, P5CS genes are crucial for plant growth, development, and stress response. The structure and function of P5CS genes have been identified and characterized across numerous plant species [5,32,33]. However, a systematic study and analysis of the P5CS gene family in cotton, a globally significant commercial crop, has been lacking until now. With the completion of cotton genome assemblies and advancements in bioinformatics, we can now systematically investigate the structure, location, function and other aspects of cotton P5CS genes.
Many plant species have undergone a genome-wide replication event, known as polyploidy [34], which resulted in extensive chromosome doubling and the retention of numerous repetitive chromosomal fragments. Specifically, G. hirsutum and G. barbadense are identified as allotetraploids, having arisen from the hybridization of two distinct cotton species, with G. arboretum and G. raimondii serving as the genomic contributors to G. hirsutum [35,36,37,38,39]. In our analysis, we identified eight P5CS gene members in G. hirsutum, 18 in G. barbadense, five in G. arboretum and nine in G. raimondii. Notably, the number of P5CS genes in G. hirsutum does not correspond to the cumulative total of its progenitors, indicating that gene loss occurs to varying extents during the process of polyploidization [39]. Furthermore, the P5CS gene count in G. hirsutum is lower than that in G. barbadense, suggesting that chromosome doubling and rapid genomic rearrangements contribute to gene loss [40].
A phylogenetic analysis of P5CS genes across the four cotton species revealed the presence of three distinct subgroups, with certain genes from Arabidopsis and Theobroma cacao exhibiting close phylogenetic relationships with the dicotyledonous cotton plants. These observations imply that Arabidopsis and Theobroma cacao may serve as valuable reference points for P5CS gene research in cotton, reinforcing the hypothesis of a shared common ancestor between Theobroma cacao and cotton [35,41]. Gene localization studies indicated similar distribution patterns of P5CS genes in G. hirsutum and G. barbadense, further supporting the concept of a common ancestry.
The presence of duplicate genes on the same chromosome is likely attributable to tandem repeats, while those exhibiting high sequence similarity across different chromosomes are primarily the result of segmental duplications [42]. Tandem duplications, which predominantly occur in regions of chromosomal recombination, give rise to gene clusters with analogous sequences and functions [43]. Fragment replication, which often leads to dispersed duplicated genes, plays a significant role in the evolution of organisms, with many plants displaying multiple duplicated chromosomal blocks [44]. In our investigation, tandem repeats were exclusively observed on chromosomes A11 and D11 of G. barbadense, as well as on chromosome 7 of G. raimondii, each containing two genes. These duplications belong to the same subfamily within the evolutionary tree, suggesting closer evolutionary relationships and functional similarities. However, the limited occurrence of tandem repeats indicates a relatively minor contribution to the expansion of P5CS gene family in cotton.
Additionally, analyses of collinearity and selection pressure analysis revealed multiple pairs of duplicate genes among different cotton species, particularly between the tetraploid G. hirsutum and G. barbadense, likely as a consequence of their shared allopolyploidy events. During the process of polyploidization, tetraploid genomes expand gene families derived from diploid genomes (A and D) [36]. Similar amplifications have been documented in the Erf [45] and NFYA [46] gene families within cotton. We propose that extensive fragmental duplications and genomic polyploidy represent the primary mechanisms for the formation of P5CS genes in cotton. Collinearity analysis further indicated minimal relationships among G. hirsutum, G. arboretum and G. raimondii, suggesting that most P5CS genes have involved independently. The Ka/Ks analysis demonstrated that all the gene pairs exhibited KA/KS values significantly less than 1, indicating rapid evolution following duplication [47]. This genetic diversity enhances cotton’s ability to regulate complex traits, thereby augmenting its evolutionary and adaptive potential. These findings are pivotal for advancing our understanding of the genetics, evolution and breeding of cotton.
In Arabidopsis, two P5CS genes exhibit distinct functional roles, with P5CS1 being critical for proline accumulation in response to osmotic stress, while P5CS2 is implicated in seed development, indicating a divergence in function [33]. In G. hirsutum, evidence suggests a similar divergency among the P5CS genes, as indicated by their differential expression patterns under salt stress. Specifically, qRT-PCR analysis revealed that four out of the eight GhP5CS genes were significantly upregulated in response to salt stress, whereas the remaining genes exhibited no change in expression. These observations imply a functional diversity among P5CS genes and highlight their critical role in plant stress responses. Additionally, the regulatory functions of P5CS genes in various crops have been documented in the literature. Consequently, based on the qRT-PCR findings, we employed the VIGS technology to silence the GhP5CS1 gene, which demonstrated the most significant upregulation under salt stress. This intervention resulted in a marked reduction in GhP5CS1 expression, delayed growth and increased oxidative damage in the gene-silenced plants compared to the control plants. Furthermore, the proline content in the gene-silenced plants decreased under salt stress, indicating a compromised ability to accumulate proline when GhP5CS1 expression was inhibited. These results not only enhance our understanding of the functional diversity of the P5CS genes in cotton but also emphasize the potential significance of GhP5CS1 in the plant’s response to salt stress. Moreover, these findings provide a robust foundation for the molecular breeding of the GhP5CS1 gene aimed at developing salt-tolerant cotton germplasm.
4. Materials and Methods
4.1. Identification of P5CS Gene Members in Different Species
The genomic data for five species, including the tetraploid Gossypium hirsutum and Gossypium barbadense and the diploid Gossypium raimondii, as well as Theobroma cacao and Zea mays, were retrieved from the Phytozome database (https://phytozome-next.jgi.doe.gov/). For the diploid Gossypium arboretum, the CRI genome database was obtained via the CottonFGD (https://cottonfgd.net/). The genomic data for Arabidopsis thaliana, Oryza sativa, and Sorghum bicolor were sourced from the Ensembl Plants database (http://plants.ensembl.org/index.html). These databases include coding sequences (CDSs), gene annotation files, and protein sequences.
We employed a hidden Markov model (HMM) to query the P5CS protein sequences harboring the PPbinding domain (PF00696) in Pfam (http://pfam.xfam.org/) across the various genomes via default parameters in HMMER software [48,49,50]. The Hummsearch program running on a Linux system was used to identify proteins with the conserved domain, setting an E-value threshold at 1E-20. The candidate protein sequences were then submitted to SMART (http://smart.embl.de/), Pfam (http://pfam-legacy.xfam.org/), and NCBI CDD (https://www.ncbi.nlm.nih.gov/cdd/) for validation [51,52]. The amino acid length and isoelectric point (PI) of the identified proteins were calculated via the ExPASy proteomics server (http://www.expasy.org) [53].
4.2. Chromosome Localization Analysis of P5CS Genes in Cotton Species
Genomic annotation data were utilized to ascertain the chromosome length and positional information of all P5CS genes. MapChart software [54] was then employed to create a chromosomal localization map for the P5CS genes across the four cotton species, which were subsequently refined and archived via Adobe Illustrator CS6.
4.3. Phylogenetic Analysis, Collinearity and Ka/Ks Ratios of P5CS Genes
A phylogenetic tree of P5CS proteins from nine species was constructed using the neighbor-joining method following multiple sequence alignment with MEGA 7.0 software [55]. Branch support was assessed via a bootstrap test with 1,000 iterations, and the evolutionary tree was further edited via the Evolview online platform [56]. The collinear gene pairs were identified through BLAST comparisons of P5CS protein sequences with the Multiple Collinearity Scan Toolkit (MCScanX) [57].
Ka, Ks and their ratios were determined to evaluate evolutionary selection pressures on the genes. The Calculator tools were employed to determine the nonsynonymous (Ka) and synonymous (Ks) substitution rates in P5CS genes across four cotton species.
4.4. Gene Structure and Protein Conserved Motif Analysis of P5CS Genes in Four Cotton Species
We employed the Gene Structure Display Server (GSDS) (http://gsds.cbi.pku.edu.cn) to analyze the gene structure of P5CS genes on the basis of their CDS, 3’UTR and 5’UTR sequences [58]. The MEME online platform (http://memesuite.org/) was employed to identify conserved motifs within P5CS genes, with parameters set to a maximum of 10 motifs and an optimal motif width ranging from 6 to 50 residues [59]. TBtools software was used to integrate and visualize the phylogenetic tree, gene structure and conserved motif images of the P5CS genes.
4.5. Subcellular Localization Prediction of P5CS Proteins
The CELLO website (http://cello.life.nctu.edu.tw/) was used to predict the subcellular localization of P5CS proteins by submitting their sequences. The results were then visualized via TBtools [60].
4.6. Cis-Acting Element Analysis of P5CS Gene Promoter Regions
Promoter sequences of 1.5-kb upstream of the transcription start site for each P5CS gene were extracted from four cotton species. The PlantCARE (Cis-acting Regulatory Elements, http://bioinformatics.psb.ugent.be/webtools/plantcare/html/) online platform was used to identify the CAREs within these promoter regions [61]. Visual representations of these CAREs were generated via the GSDS online platform.
4.7. Secondary Structure Prediction and Three-Dimensional Model Construction of GhP5CS Proteins
The Prabi online platform (https://npsa-prabi.ibcp.fr/) was used to predict the secondary structure of the GhP5CS proteins. For detailed structural analysis, three-dimensional models of GhP5CS proteins were constructed via a homology-based protein modeling approach by submitting their amino acid sequences to the SWISS-MODEL website (https://swissmodel.expasy.org/) [62].
4.8. Plant Materials, Salt Treatment, RNA Extraction and qRT-PCR Analysis
Seeds of the upland cotton line TM-1 were sterilized with 75% ethanol for 1 min and then soaked in sterile water for 6 hours. The seeds were subsequently sown in pots with a mixture of nutrient soil and vermiculite (at a ratio of 3:1) and grown in a greenhouse. The temperature and light cycle were set at 26 °C with a 14 h/10 h (light and dark) photoperiod. When the second true leaf fully expanded, the seedlings were transferred to Hoagland nutrient solution and acclimated for three days. The samples were subsequently divided into control and experimental groups, with the latter receiving a 200 mmol/L NaCl solution. The leaves and roots of both groups were collected after two days. Total RNA was extracted from the leaves and roots using the CWBIO Ultrapure RNA Kit (DNase I) (CWBIO, Beijing, China), and integrity was evaluated via 1.2% agarose gel electrophoresis. First-strand cDNA was synthesized using (+gDNA wiper) (Vazyme, Nanjing, China). qRT-PCR was performed in triplicate for each sample using ChamQ SYBR qPCR Master Mix (Low ROX Premixed) (Vazyme, Nanjing, China) to assess the expression levels of eight GhP5CS genes under the control and salt treatments, with the gene-specific primers listed in Table S1. The cotton Ubiquitin gene served as the internal reference gene, and the relative expression levels were calculated via the comparative threshold cycle method [63].
4.9. Virus-Induced Gene Silencing (VIGS)
The specific primers for the GhP5CS1 gene were designed to amplify a 313-bp fragment for VIGS. The empty plasmid pTRV2::00 was linearized with Sacl and BamHI restriction enzymes. The pTRV2::GhP5CS1 fusion vector was recombined via the ClonExpress® II One Step Cloning Kit (Vazyme, Nanjing, China). The recombinant plasmid, along with pTRV2::00 (negative control) and pTRV2::CLA1 (positive control) were transformed into Agrobacterium tumefaciens (GV3101) and injected into cotton seedling leaves via a sterile syringe.
4.10. DAB Staining and Proline Content Determination
DAB (3,3'-diaminobenzidine tetrachloride) staining was performed to locate hydrogen peroxide in the tissues via a DAB staining kit (Leagene, Beijing, China). The fully expanded true leaves of the seedlings (pTRV2::00 and pTRV2::GhP5CS1) after one week of salt treatment were collected and stained with 1 mg/mL DAB for 12 hours. After 21 days of salt treatment, true leaves were collected, and the proline content was determined via visible spectrophotometry methods using a proline (Pro) content assay kit (Solarbio, Beijing, China).
5. Conclusions
The P5CS genes in cotton exhibit a complex pattern of genomic organization, evolutionary relationships and functional diversity. Evolutionary and structural analyses revealed potential divergence and differentiation among these genes. VIGS-mediated downregulation of GhP5CS1 led to increased salt sensitivity and reduced proline content, confirming its key role in salt stress tolerance. These insights highlight the significance of P5CS genes in the adaptation of cotton to abiotic stress, and lay the foundation for further functional characterization and application in enhancing stress tolerance in cotton.
Supplementary Materials
The following supporting information can be downloaded at the website of this paper posted on Preprints.org. Figure S1: Chromosome localization of P5CS genes in four cotton species; Figure S2: Interchromosomal relationships of P5CS genes among four cotton species; Figure S3: Collinearity analysis of P5CS genes between G. raimondii and G. arboretum; Figure S4: Prediction of subcellular localization for P5CS proteins; Figure S5: Characterization of cis-acting elements in the promoter regions of P5CS genes across four cotton species; Figure S6: Three-dimensional structural modeling of eight GhP5CS proteins; Table S1: Primer sequences used in this study; Table S2: Physical, chemical properties, and subcellular location of P5CS genes; Table S3: Ka, Ks and their ratios of pairwise genes across four cotton species; Table S4: The secondary structure statistics of the GhP5CS genes.
Author Contributions
Conceptualization, B.W. and X.S; methodology, H.F., X.G., and H.G.; software, Y.W. (Yunhao Wu), T.G.M., and K.Z.; validation, X.G., Y.W. (Yunhao Wu) and J.L.; formal analysis, H.F., Y.W. (Ying Wu), and H.G.; investigation, Y.W. (Ying Wu), D.Q., R.L. and K.Z.; resources, X.G. and H.F.; data curation, T.G.M.; writing—original draft preparation, H.F. and X.G.; writing—review and editing, B.W. and X.S; visualization, X.G.; supervision, B.W. and X.S; project administration, B.W.; funding acquisition, B.W. All authors have read and agreed to the published version of the manuscript.
Funding
We appreciate the financial help from the Key Research and Development Project of Jiangsu Province, China (Modern Agriculture, BE2022364); the State Key Laboratory of Cotton Bio-breeding and Integrated Utilization Open Fund (CB2024A06); and the Practice Innovation Training Program Projects for College Students (202410304022Z).
Data Availability Statement
The datasets supporting the results of this article, mainly including the genomic sequences, are available from CottonFGD (https://cottonfgd.net/), Phytozome website (https://phytozome-next.jgi.doe.gov/) and Ensembl Plants database (http://plants.ensembl.org/index.html).
Conflicts of Interest
The authors declare no conflicts of interest.
References
- Levitt, M. Effect of proline residues on protein folding. J. Mol. Biol. 1981, 145, 251–263. [Google Scholar] [CrossRef]
- Szabados, L.; Savouré, A. Proline: a multifunctional amino acid. Trends Plant Sci. 2010, 15, 89–97. [Google Scholar] [CrossRef]
- Kiran Kumar Ghanti, S.; Sujata, K.G.; Vijay Kumar, B.M.; Nataraja Karba, N.; janardhan Reddy, K.; Srinath Rao, M.; Kavi Kishor, P.B. Heterologous expression of P5CS gene in chickpea enhances salt tolerance without affecting yield. Biol. Plantarum 2011, 55, 634. [Google Scholar] [CrossRef]
- Silva-Ortega, C.O.; Ochoa-Alfaro, A.E.; Reyes-Agüero, J.A.; Aguado-Santacruz, G.A.; Jiménez-Bremont, J.F. Salt stress increases the expression of p5cs gene and induces proline accumulation in cactus pear. Plant Physiol. Bioch. 2008, 46, 82–92. [Google Scholar] [CrossRef]
- Zhu, B.; Su, J.; Chang, M.; Verma, D.P.S.; Fan, Y.-L.; Wu, R. Overexpression of a Δ1-pyrroline-5-carboxylate synthetase gene and analysis of tolerance to water- and salt-stress in transgenic rice. Plant Sci. 1998, 139, 41–48. [Google Scholar] [CrossRef]
- Luan, Y.; An, H.; Chen, Z.; Zhao, D.; Tao, J. Functional Characterization of the Paeonia ostii P5CS Gene under Drought Stress. Plants 2024, 13. [Google Scholar] [CrossRef] [PubMed]
- Urmi, T.A.; Islam, M.M.; Zumur, K.N.; Abedin, M.A.; Haque, M.M.; Siddiqui, M.H.; Murata, Y.; Hoque, M.A. Combined Effect of Salicylic Acid and Proline Mitigates Drought Stress in Rice (Oryza sativa L.) through the Modulation of Physiological Attributes and Antioxidant Enzymes. Antioxidants 2023, 12. [Google Scholar] [CrossRef] [PubMed]
- Aksakal, O.; Tabay, D.; Esringu, A.; Icoglu Aksakal, F.; Esim, N. Effect of proline on biochemical and molecular mechanisms in lettuce (Lactuca sativa L.) exposed to UV-B radiation. Photochem Photobiol. Sci. 2017, 16, 246–254. [Google Scholar] [CrossRef]
- Salama, H.M.H.; Al Watban, A.A.; Al-Fughom, A.T. Effect of ultraviolet radiation on chlorophyll, carotenoid, protein and proline contents of some annual desert plants. Saudi J. Biol. Sci. 2011, 18, 79–86. [Google Scholar] [CrossRef]
- Hemadri Reddy, S.; Al-kalbani, H.; Al-Qalhati, S.; Al-Kahtani, A.A.; Al Hoqani, U.; Najmul Hejaz Azmi, S.; Kumar, A.; Kumar, S.; Saradhi Settaluri, V. Proline and other physiological changes as an indicator of abiotic stress caused by heavy metal contamination. J. King Saud Univ. Sci. 2024, 36, 103313. [Google Scholar] [CrossRef]
- Gupta, A.; Patil, M.; Qamar, A.; Senthil-Kumar, M. ath-miR164c influences plant responses to the combined stress of drought and bacterial infection by regulating proline metabolism. Environ. Exp. Bot. 2020, 172, 103998. [Google Scholar] [CrossRef]
- Rogan, C.J.; Pang, Y.-Y.; Mathews, S.D.; Turner, S.E.; Weisberg, A.J.; Lehmann, S.; Rentsch, D.; Anderson, J.C. Transporter-mediated depletion of extracellular proline directly contributes to plant pattern-triggered immunity against a bacterial pathogen. Nat. Commun. 2024, 15, 7048. [Google Scholar] [CrossRef] [PubMed]
- Turchetto-Zolet, A.C.; Margis-Pinheiro, M.; Margis, R. The evolution of pyrroline-5-carboxylate synthase in plants: a key enzyme in proline synthesis. Mol. Genet. Genomics 2009, 281, 87–97. [Google Scholar] [CrossRef] [PubMed]
- Verbruggen, N.; Hermans, C. Proline accumulation in plants: a review. Amino Acids 2008, 35, 753–759. [Google Scholar] [CrossRef]
- Anton, D.B.; Guzman, F.L.; Vetö, N.M.; Krause, F.A.; Kulcheski, F.R.; Coelho, A.P.D.; Duarte, G.L.; Margis, R.; Dillenburg, L.R.; Turchetto-Zolet, A.C. Characterization and expression analysis of P5CS (Δ1-pyrroline-5-carboxylate synthase) gene in two distinct populations of the Atlantic Forest native species Eugenia uniflora L. Mol. Biol. Rep. 2020, 47, 1033–1043. [Google Scholar] [CrossRef]
- Igarashi, Y.; Yoshiba*, Y.; Sanada, Y.; Yamaguchi-Shinozaki, K.; Wada, K.; Shinozaki, K. Characterization of the gene for Δ1-pyrroline-5-carboxylate synthetase and correlation between the expression of the gene and salt tolerance in Oryza sativa L. Plant Mol. Biol. 1997, 33, 857–865. [Google Scholar] [CrossRef]
- Kumar, V.; Shriram, V.; Kavi Kishor, P.B.; Jawali, N.; Shitole, M.G. Enhanced proline accumulation and salt stress tolerance of transgenic indica rice by over-expressing P5CSF129A gene. Plant Biotechnol. Rep. 2010, 4, 37–48. [Google Scholar] [CrossRef]
- Zheng, L.; Dang, Z.; Li, H.; Zhang, H.; Wu, S.; Wang, Y. Isolation and characterization of a Δ1-pyrroline-5-carboxylate synthetase (NtP5CS) from Nitraria tangutorum Bobr. and functional comparison with its Arabidopsis homologue. Mol. Biol. Rep. 2014, 41, 563–572. [Google Scholar] [CrossRef]
- Du, L.; Huang, X.; Ding, L.; Wang, Z.; Tang, D.; Chen, B.; Ao, L.; Liu, Y.; Kang, Z.; Mao, H. TaERF87 and TaAKS1 synergistically regulate TaP5CS1/TaP5CR1-mediated proline biosynthesis to enhance drought tolerance in wheat. New Phytol. 2023, 237, 232–250. [Google Scholar] [CrossRef]
- Kim, G.-B.; Nam, Y.-W. A novel Δ1-pyrroline-5-carboxylate synthetase gene of Medicago truncatula plays a predominant role in stress-induced proline accumulation during symbiotic nitrogen fixation. J. Plant Physiol. 2013, 170, 291–302. [Google Scholar] [CrossRef]
- Guan, C.; Huang, Y.-H.; Cen, H.-F.; Cui, X.; Tian, D.-Y.; Zhang, Y.-W. Overexpression of the Lolium perenne L. delta1-pyrroline 5-carboxylate synthase (LpP5CS) gene results in morphological alterations and salinity tolerance in switchgrass (Panicum virgatum L.). PLoS One 2019, 14, e0219669. [Google Scholar] [CrossRef] [PubMed]
- Yang, D.; Ni, R.; Yang, S.; Pu, Y.; Qian, M.; Yang, Y.; Yang, Y. Functional Characterization of the Stipa purpurea P5CS Gene under Drought Stress Conditions. Int. J. Mol. Sci. 2021, 22. [Google Scholar] [CrossRef] [PubMed]
- Sellamuthu, G.; Tarafdar, A.; Jasrotia, R.S.; Chaudhary, M.; Vishwakarma, H.; Padaria, J.C. Introgression of Δ1-pyrroline-5-carboxylate synthetase (PgP5CS) confers enhanced resistance to abiotic stresses in transgenic tobacco. Transgenic Res. 2024, 33, 131–147. [Google Scholar] [CrossRef] [PubMed]
- Signorelli, S.; Monza, J. Identification of Δ1-pyrroline 5-carboxylate synthase (P5CS) genes involved in the synthesis of proline in Lotus japonicus. Plant Signal. Behav. 2017, 12, e1367464. [Google Scholar] [CrossRef] [PubMed]
- Strizhov, N.; Ábrahám, E.; Ökrész, L.; Blickling, S.; Zilberstein, A.; Schell, J.; Koncz, C.; Szabados, L. Differential expression of two P5CS genes controlling proline accumulation during salt-stress requires ABA and is regulated by ABA1, ABI1 and AXR2 in Arabidopsis. Plant J. 1997, 12, 557–569. [Google Scholar] [CrossRef]
- Wei, C.; Cui, Q.; Zhang, X.-Q.; Zhao, Y.-Q.; Jia, G.-X. Three P5CS genes including a novel one from Lilium regale play distinct roles in osmotic, drought and salt stress tolerance. J. Plant Biol. 2016, 59, 456–466. [Google Scholar] [CrossRef]
- Abdelraheem, A.; Esmaeili, N.; O’Connell, M.; Zhang, J. Progress and perspective on drought and salt stress tolerance in cotton. Ind. Crop. Prod. 2019, 130, 118–129. [Google Scholar] [CrossRef]
- Feng, W.; Guo, L.; Fang, H.; Mehari, T.G.; Gu, H.; Wu, Y.; Jia, M.; Han, J.; Guo, Q.; Xu, Z.; et al. Transcriptomic profiling reveals salt-responsive long non-coding RNAs and their putative target genes for improving salt tolerance in upland cotton (Gossypium hirsutum). Ind. Crop. and Prod. 2024, 216, 118744. [Google Scholar] [CrossRef]
- Stewart, G.R.; Lee, J.A. The role of proline accumulation in halophytes. Planta 1974, 120, 279–289. [Google Scholar] [CrossRef]
- Funck, D.; Baumgarten, L.; Stift, M.; von Wirén, N.; Schönemann, L. Differential Contribution of P5CS Isoforms to Stress Tolerance in Arabidopsis. Front. Plant Sci. 2020, 11. [Google Scholar] [CrossRef]
- Arentson, B.W.; Sanyal, N.; Becker, D.F. Substrate channeling in proline metabolism. Front. biosci. 2012, 17, 375–388. [Google Scholar] [CrossRef] [PubMed]
- Mattioli, R.; Falasca, G.; Sabatini, S.; Altamura, M.M.; Costantino, P.; Trovato, M. The proline biosynthetic genes P5CS1 and P5CS2 play overlapping roles in Arabidopsis flower transition but not in embryo development. Physiol. Plantarum 2009, 137, 72–85. [Google Scholar] [CrossRef] [PubMed]
- Székely, G.; Ábrahám, E.; Cséplő, Á.; Rigó, G.; Zsigmond, L.; Csiszár, J.; Ayaydin, F.; Strizhov, N.; Jásik, J.; Schmelzer, E.; et al. Duplicated P5CS genes of Arabidopsis play distinct roles in stress regulation and developmental control of proline biosynthesis. Plant J. 2008, 53, 11–28. [Google Scholar] [CrossRef] [PubMed]
- Comai, L. The advantages and disadvantages of being polyploid. Nat. Rev. Genet. 2005, 6, 836–846. [Google Scholar] [CrossRef]
- Chen, Z.J.; Sreedasyam, A.; Ando, A.; Song, Q.; De Santiago, L.M.; Hulse-Kemp, A.M.; Ding, M.; Ye, W.; Kirkbride, R.C.; Jenkins, J.; et al. Genomic diversifications of five Gossypium allopolyploid species and their impact on cotton improvement. Nat. Genet. 2020, 52, 525–533. [Google Scholar] [CrossRef]
- Li, F.; Fan, G.; Lu, C.; Xiao, G.; Zou, C.; Kohel, R.J.; Ma, Z.; Shang, H.; Ma, X.; Wu, J.; et al. Genome sequence of cultivated Upland cotton (Gossypium hirsutum TM-1) provides insights into genome evolution. Nat. Biotechnol. 2015, 33, 524–530. [Google Scholar] [CrossRef]
- Liu, X.; Zhao, B.; Zheng, H.-J.; Hu, Y.; Lu, G.; Yang, C.-Q.; Chen, J.-D.; Chen, J.-J.; Chen, D.-Y.; Zhang, L.; et al. Gossypium barbadense genome sequence provides insight into the evolution of extra-long staple fiber and specialized metabolites. Sci. Rep-UK. 2015, 5, 14139. [Google Scholar] [CrossRef]
- Yuan, D.; Tang, Z.; Wang, M.; Gao, W.; Tu, L.; Jin, X.; Chen, L.; He, Y.; Zhang, L.; Zhu, L.; et al. The genome sequence of Sea-Island cotton (Gossypium barbadense) provides insights into the allopolyploidization and development of superior spinnable fibres. Sci. Rep-UK. 2015, 5, 17662. [Google Scholar] [CrossRef]
- Zhang, T.; Hu, Y.; Jiang, W.; Fang, L.; Guan, X.; Chen, J.; Zhang, J.; Saski, C.A.; Scheffler, B.E.; Stelly, D.M.; et al. Sequencing of allotetraploid cotton (Gossypium hirsutum L. acc. TM-1) provides a resource for fiber improvement. Nat. Biotechnol. 2015, 33, 531–537. [Google Scholar] [CrossRef]
- Filgueiras, J.P.C.; Zámocký, M.; Turchetto-Zolet, A.C. Unraveling the evolutionary origin of the P5CS gene: a story of gene fusion and horizontal transfer. Front. Mol. Biosci. 2024, 11. [Google Scholar] [CrossRef]
- Li, F.; Fan, G.; Wang, K.; Sun, F.; Yuan, Y.; Song, G.; Li, Q.; Ma, Z.; Lu, C.; Zou, C.; et al. Genome sequence of the cultivated cotton Gossypium arboreum. Nat. Genet. 2014, 46, 567–572. [Google Scholar] [CrossRef] [PubMed]
- He, H.; Dong, Q.; Shao, Y.; Jiang, H.; Zhu, S.; Cheng, B.; Xiang, Y. Genome-wide survey and characterization of the WRKY gene family in Populus trichocarpa. Plant Cell Rep. 2012, 31, 1199–1217. [Google Scholar] [CrossRef] [PubMed]
- Holub, E.B. The arms race is ancient history in Arabidopsis, the wildflower. Nat. Rev. Gene. 2001, 2, 516–527. [Google Scholar] [CrossRef] [PubMed]
- Zhu, Y.; Wu, N.; Song, W.; Yin, G.; Qin, Y.; Yan, Y.; Hu, Y. Soybean (Glycine max) expansin gene superfamily origins: segmental and tandem duplication events followed by divergent selection among subfamilies. Bmc Plant Biol. 2014, 14, 93. [Google Scholar] [CrossRef]
- Zafar, M.M.; Rehman, A.; Razzaq, A.; Parvaiz, A.; Mustafa, G.; Sharif, F.; Mo, H.; Youlu, Y.; Shakeel, A.; Ren, M. Genome-wide characterization and expression analysis of Erf gene family in cotton. BMC Plant Biol. 2022, 22, 134. [Google Scholar] [CrossRef]
- Xu, N.; Cui, Y.; Zhang, Y.; Zhang, H.; Fan, Y.; Feng, X.; Huang, H.; Ni, K.; Han, M.; Lu, X.; et al. GhNFYA16 was functionally observed positively responding to salt stress by genome-wide identification of NFYA gene family in cotton. Environ. Sci. Eur. 2022, 34, 95. [Google Scholar] [CrossRef]
- Wang, J.; Zhang, Y.; Xu, N.; Zhang, H.; Fan, Y.; Rui, C.; Han, M.; Malik, W.A.; Wang, Q.; Sun, L.; et al. Genome-wide identification of CK gene family suggests functional expression pattern against Cd2+ stress in Gossypium hirsutum L. Int. J. Biol. Macromol. 2021, 188, 272–282. [Google Scholar] [CrossRef]
- Finn, R.D.; Bateman, A.; Clements, J.; Coggill, P.; Eberhardt, R.Y.; Eddy, S.R.; Heger, A.; Hetherington, K.; Holm, L.; Mistry, J.; et al. Pfam: the protein families database. Nucleic Acids Res. 2014, 42, D222–D230. [Google Scholar] [CrossRef]
- Finn, R.D.; Clements, J.; Eddy, S.R. HMMER web server: interactive sequence similarity searching. Nucleic Acids Res. 2011, 39, W29–W37. [Google Scholar] [CrossRef]
- Potter, S.C.; Luciani, A.; Eddy, S.R.; Park, Y.; Lopez, R.; Finn, R.D. HMMER web server: 2018 update. Nucleic Acids Res. 2018, 46, W200–W204. [Google Scholar] [CrossRef]
- Letunic, I.; Copley, R.R.; Pils, B.; Pinkert, S.; Schultz, J.; Bork, P. SMART 5: domains in the context of genomes and networks. Nucleic Acids Res. 2006, 34, D257–D260. [Google Scholar] [CrossRef] [PubMed]
- Marchler-Bauer, A.; Derbyshire, M.K.; Gonzales, N.R.; Lu, S.; Chitsaz, F.; Geer, L.Y.; Geer, R.C.; He, J.; Gwadz, M.; Hurwitz, D.I.; et al. CDD: NCBI's conserved domain database. Nucleic Acids Res. 2015, 43, D222–D226. [Google Scholar] [CrossRef] [PubMed]
- Artimo, P.; Jonnalagedda, M.; Arnold, K.; Baratin, D.; Csardi, G.; de Castro, E.; Duvaud, S.; Flegel, V.; Fortier, A.; Gasteiger, E.; et al. ExPASy: SIB bioinformatics resource portal. Nucleic Acids Res. 2012, 40, W597–W603. [Google Scholar] [CrossRef] [PubMed]
- Voorrips, R.E. MapChart: Software for the Graphical Presentation of Linkage Maps and QTLs. J. Hered. 2002, 93, 77–78. [Google Scholar] [CrossRef]
- Kumar, S.; Stecher, G.; Tamura, K. MEGA7: Molecular Evolutionary Genetics Analysis Version 7.0 for Bigger Datasets. Mol. Biol. Evol. 2016, 33, 1870–1874. [Google Scholar] [CrossRef]
- He, Z.; Zhang, H.; Gao, S.; Lercher, M.J.; Chen, W.; Hu, S. Evolview v2: an online visualization and management tool for customized and annotated phylogenetic trees. Nucleic Acids Res. 2016, 44, W236–W241. [Google Scholar] [CrossRef]
- Wang, Y.; Tang, H.; DeBarry, J.D.; Tan, X.; Li, J.; Wang, X.; Lee, T.; Jin, H.; Marler, B.; Guo, H.; et al. MCScanX: a toolkit for detection and evolutionary analysis of gene synteny and collinearity. Nucleic Acids Res. 2012, 40, e49–e49. [Google Scholar] [CrossRef]
- Hu, B.; Jin, J.; Guo, A.-Y.; Zhang, H.; Luo, J.; Gao, G. GSDS 2.0: an upgraded gene feature visualization server. Bioinformatics 2015, 31, 1296–1297. [Google Scholar] [CrossRef]
- Bailey, T.L.; Boden, M.; Buske, F.A.; Frith, M.; Grant, C.E.; Clementi, L.; Ren, J.; Li, W.W.; Noble, W.S. MEME Suite: tools for motif discovery and searching. Nucleic Acids Res. 2009, 37, W202–W208. [Google Scholar] [CrossRef]
- Chen, C.; Chen, H.; Zhang, Y.; Thomas, H.R.; Frank, M.H.; He, Y.; Xia, R. TBtools: An Integrative Toolkit Developed for Interactive Analyses of Big Biological Data. Mol. Plant 2020, 13, 1194–1202. [Google Scholar] [CrossRef]
- Lescot, M.; Déhais, P.; Thijs, G.; Marchal, K.; Moreau, Y.; Van de Peer, Y.; Rouzé, P.; Rombauts, S. PlantCARE, a database of plant cis-acting regulatory elements and a portal to tools for in silico analysis of promoter sequences. Nucleic Acids Res. 2002, 30, 325–327. [Google Scholar] [CrossRef] [PubMed]
- Waterhouse, A.; Bertoni, M.; Bienert, S.; Studer, G.; Tauriello, G.; Gumienny, R.; Heer, F.T.; de Beer, T.A.P.; Rempfer, C.; Bordoli, L.; et al. SWISS-MODEL: homology modelling of protein structures and complexes. Nucleic Acids Res. 2018, 46, W296–W303. [Google Scholar] [CrossRef] [PubMed]
- Livak, K.J.; Schmittgen, T.D. Analysis of Relative Gene Expression Data Using Real-Time Quantitative PCR and the 2−ΔΔCT Method. Methods 2001, 25, 402–408. [Google Scholar] [CrossRef] [PubMed]
Figure 1.
Phylogenetic analysis of P5CS genes across nine species. The depicted phylogenetic tree includes representatives from six dicotyledonous species (G. hirsutum, G. barbadense, G. raimondii, G. arboretum, Arabidopsis thaliana and Theobroma cacao), and three monocots (Oryza sativa, Zea mays and Sorghum bicolor). The tree was constructed using MEGA 7.0 software with the maximum likelihood (ML) method. It is clustered into three distinct subgroups, each highlighted by a unique background color. GhP5CS genes are indicated with purple asterisks.
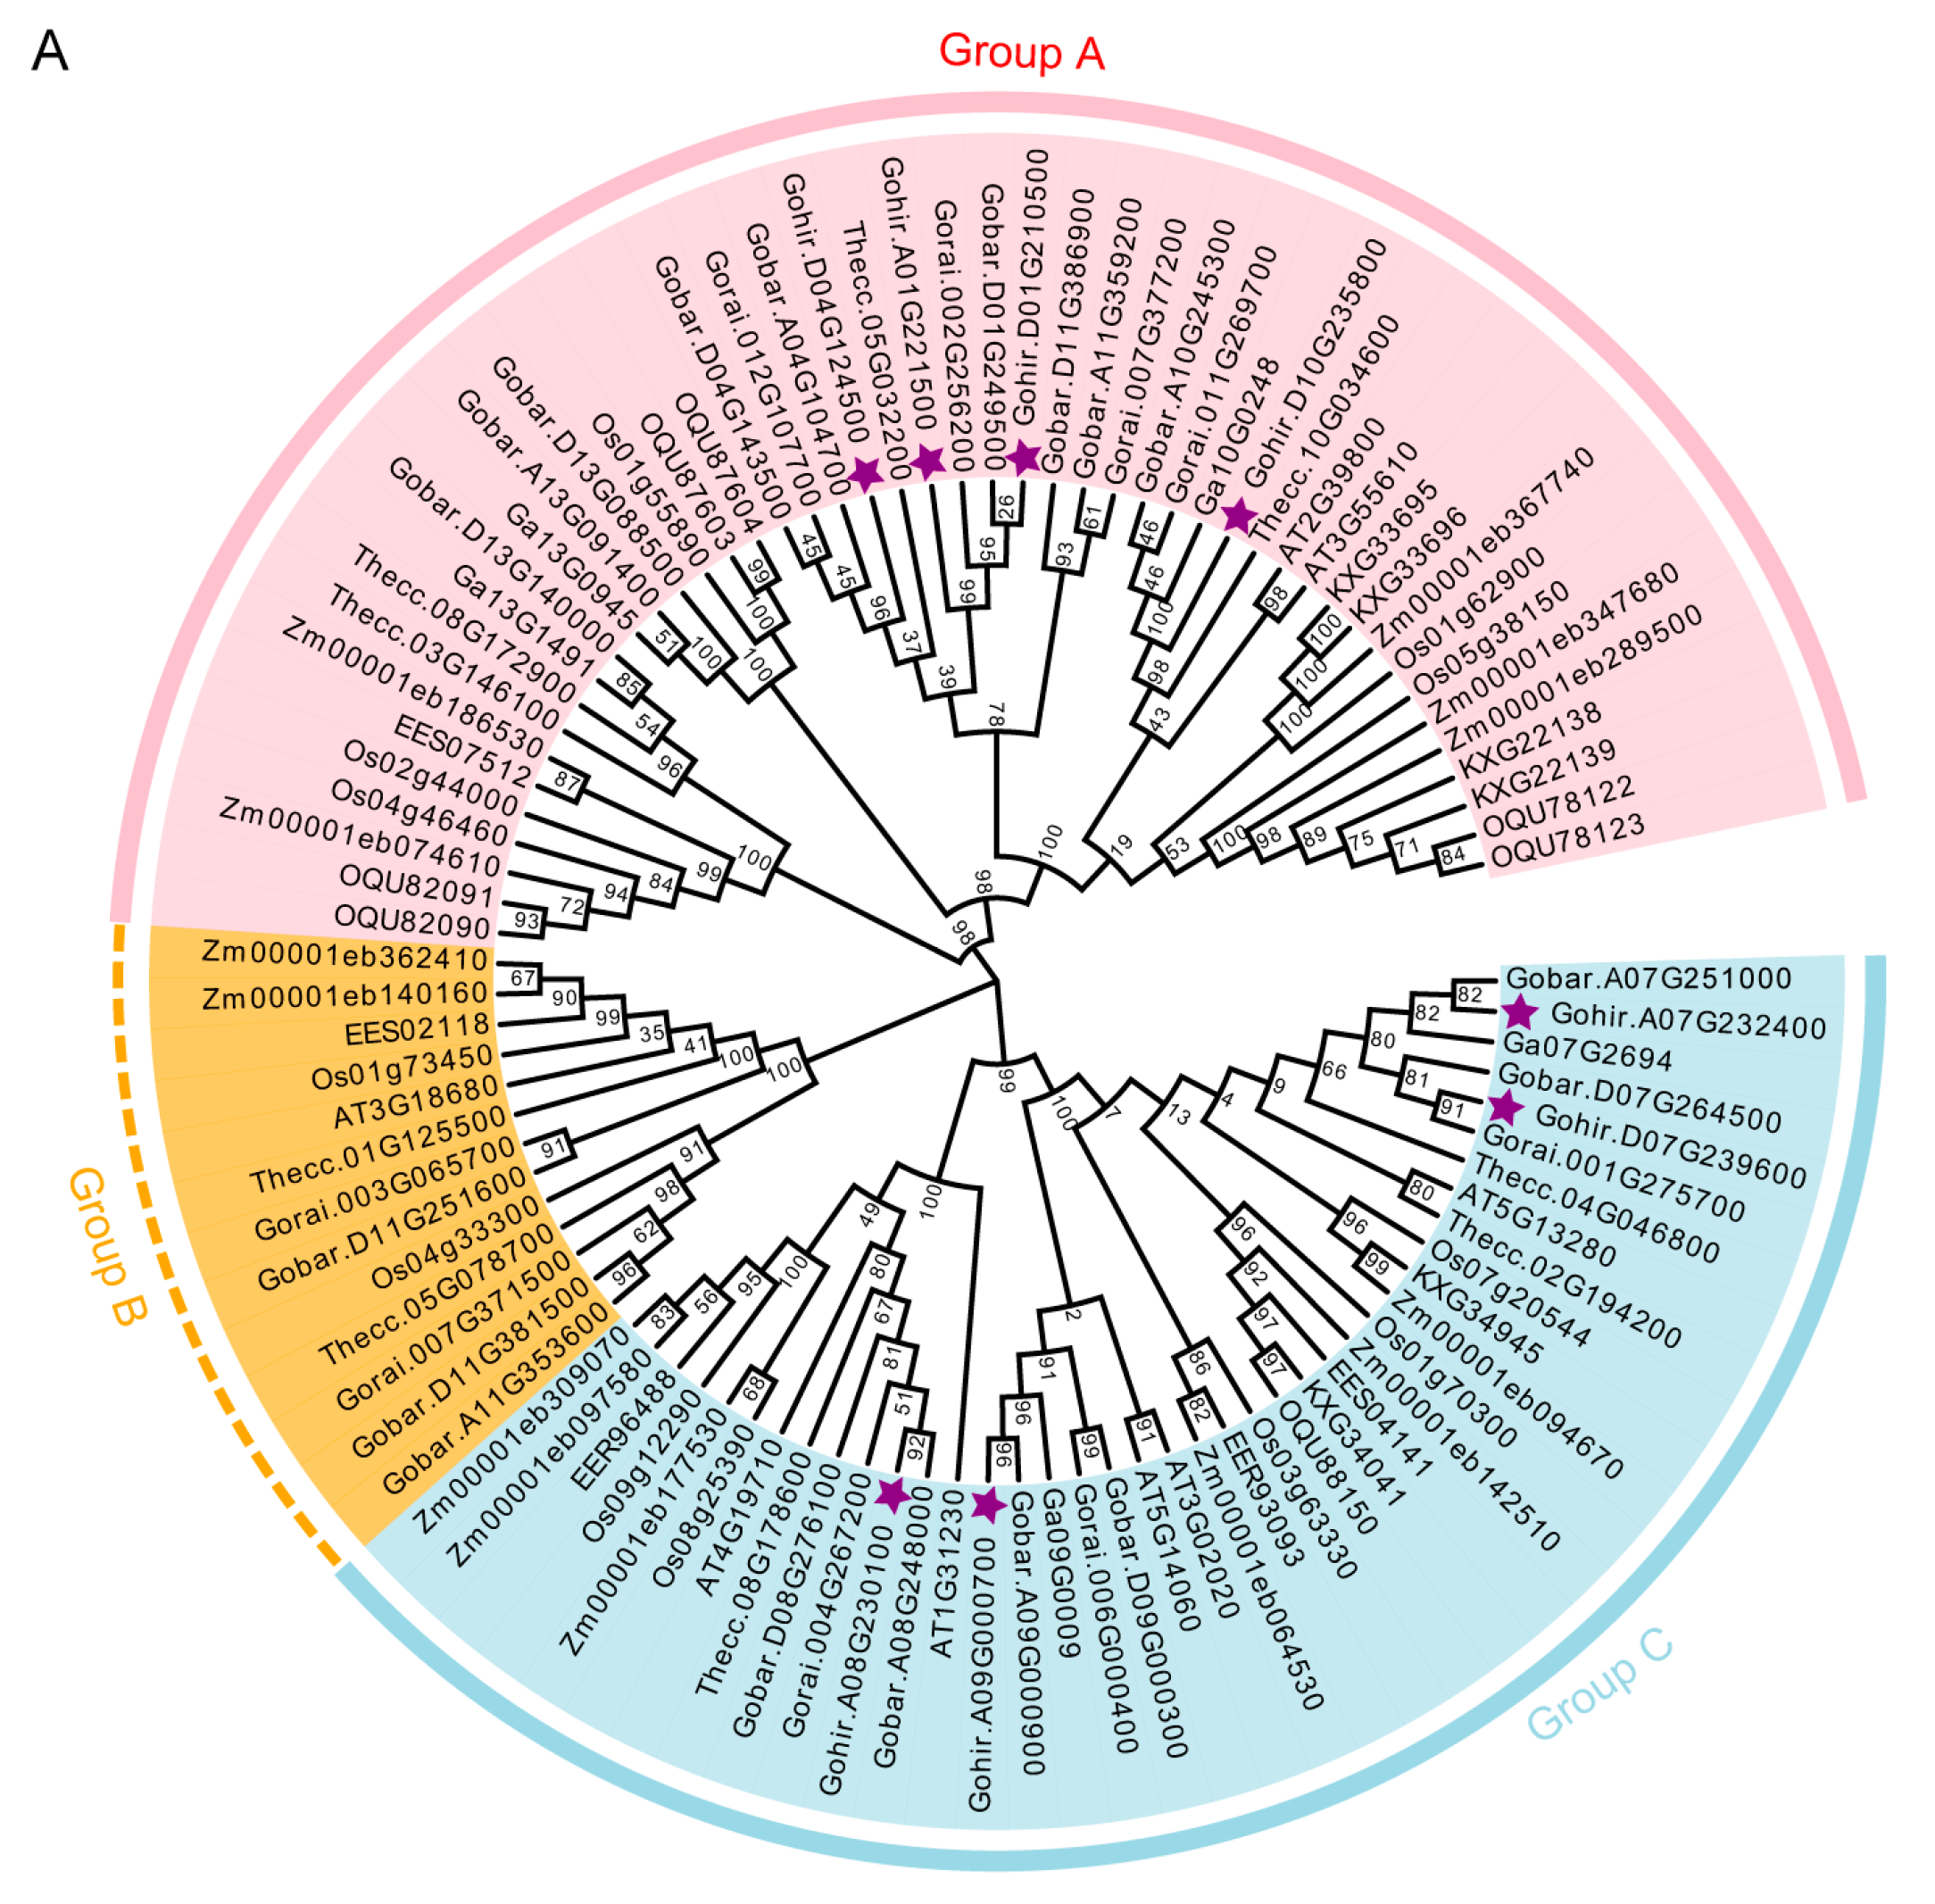
Figure 2.
Collinearity of P5CS genes between G. hirsutum and three other cotton species: G. barbadense, G. raimondii, and G. arboretum. The gray lines in the background delineate genome-wide collinear blocks, while the red and blue lines specifically denote the collinearity of P5CS genes, revealing evolutionary relationships and genomic conservation among these species.
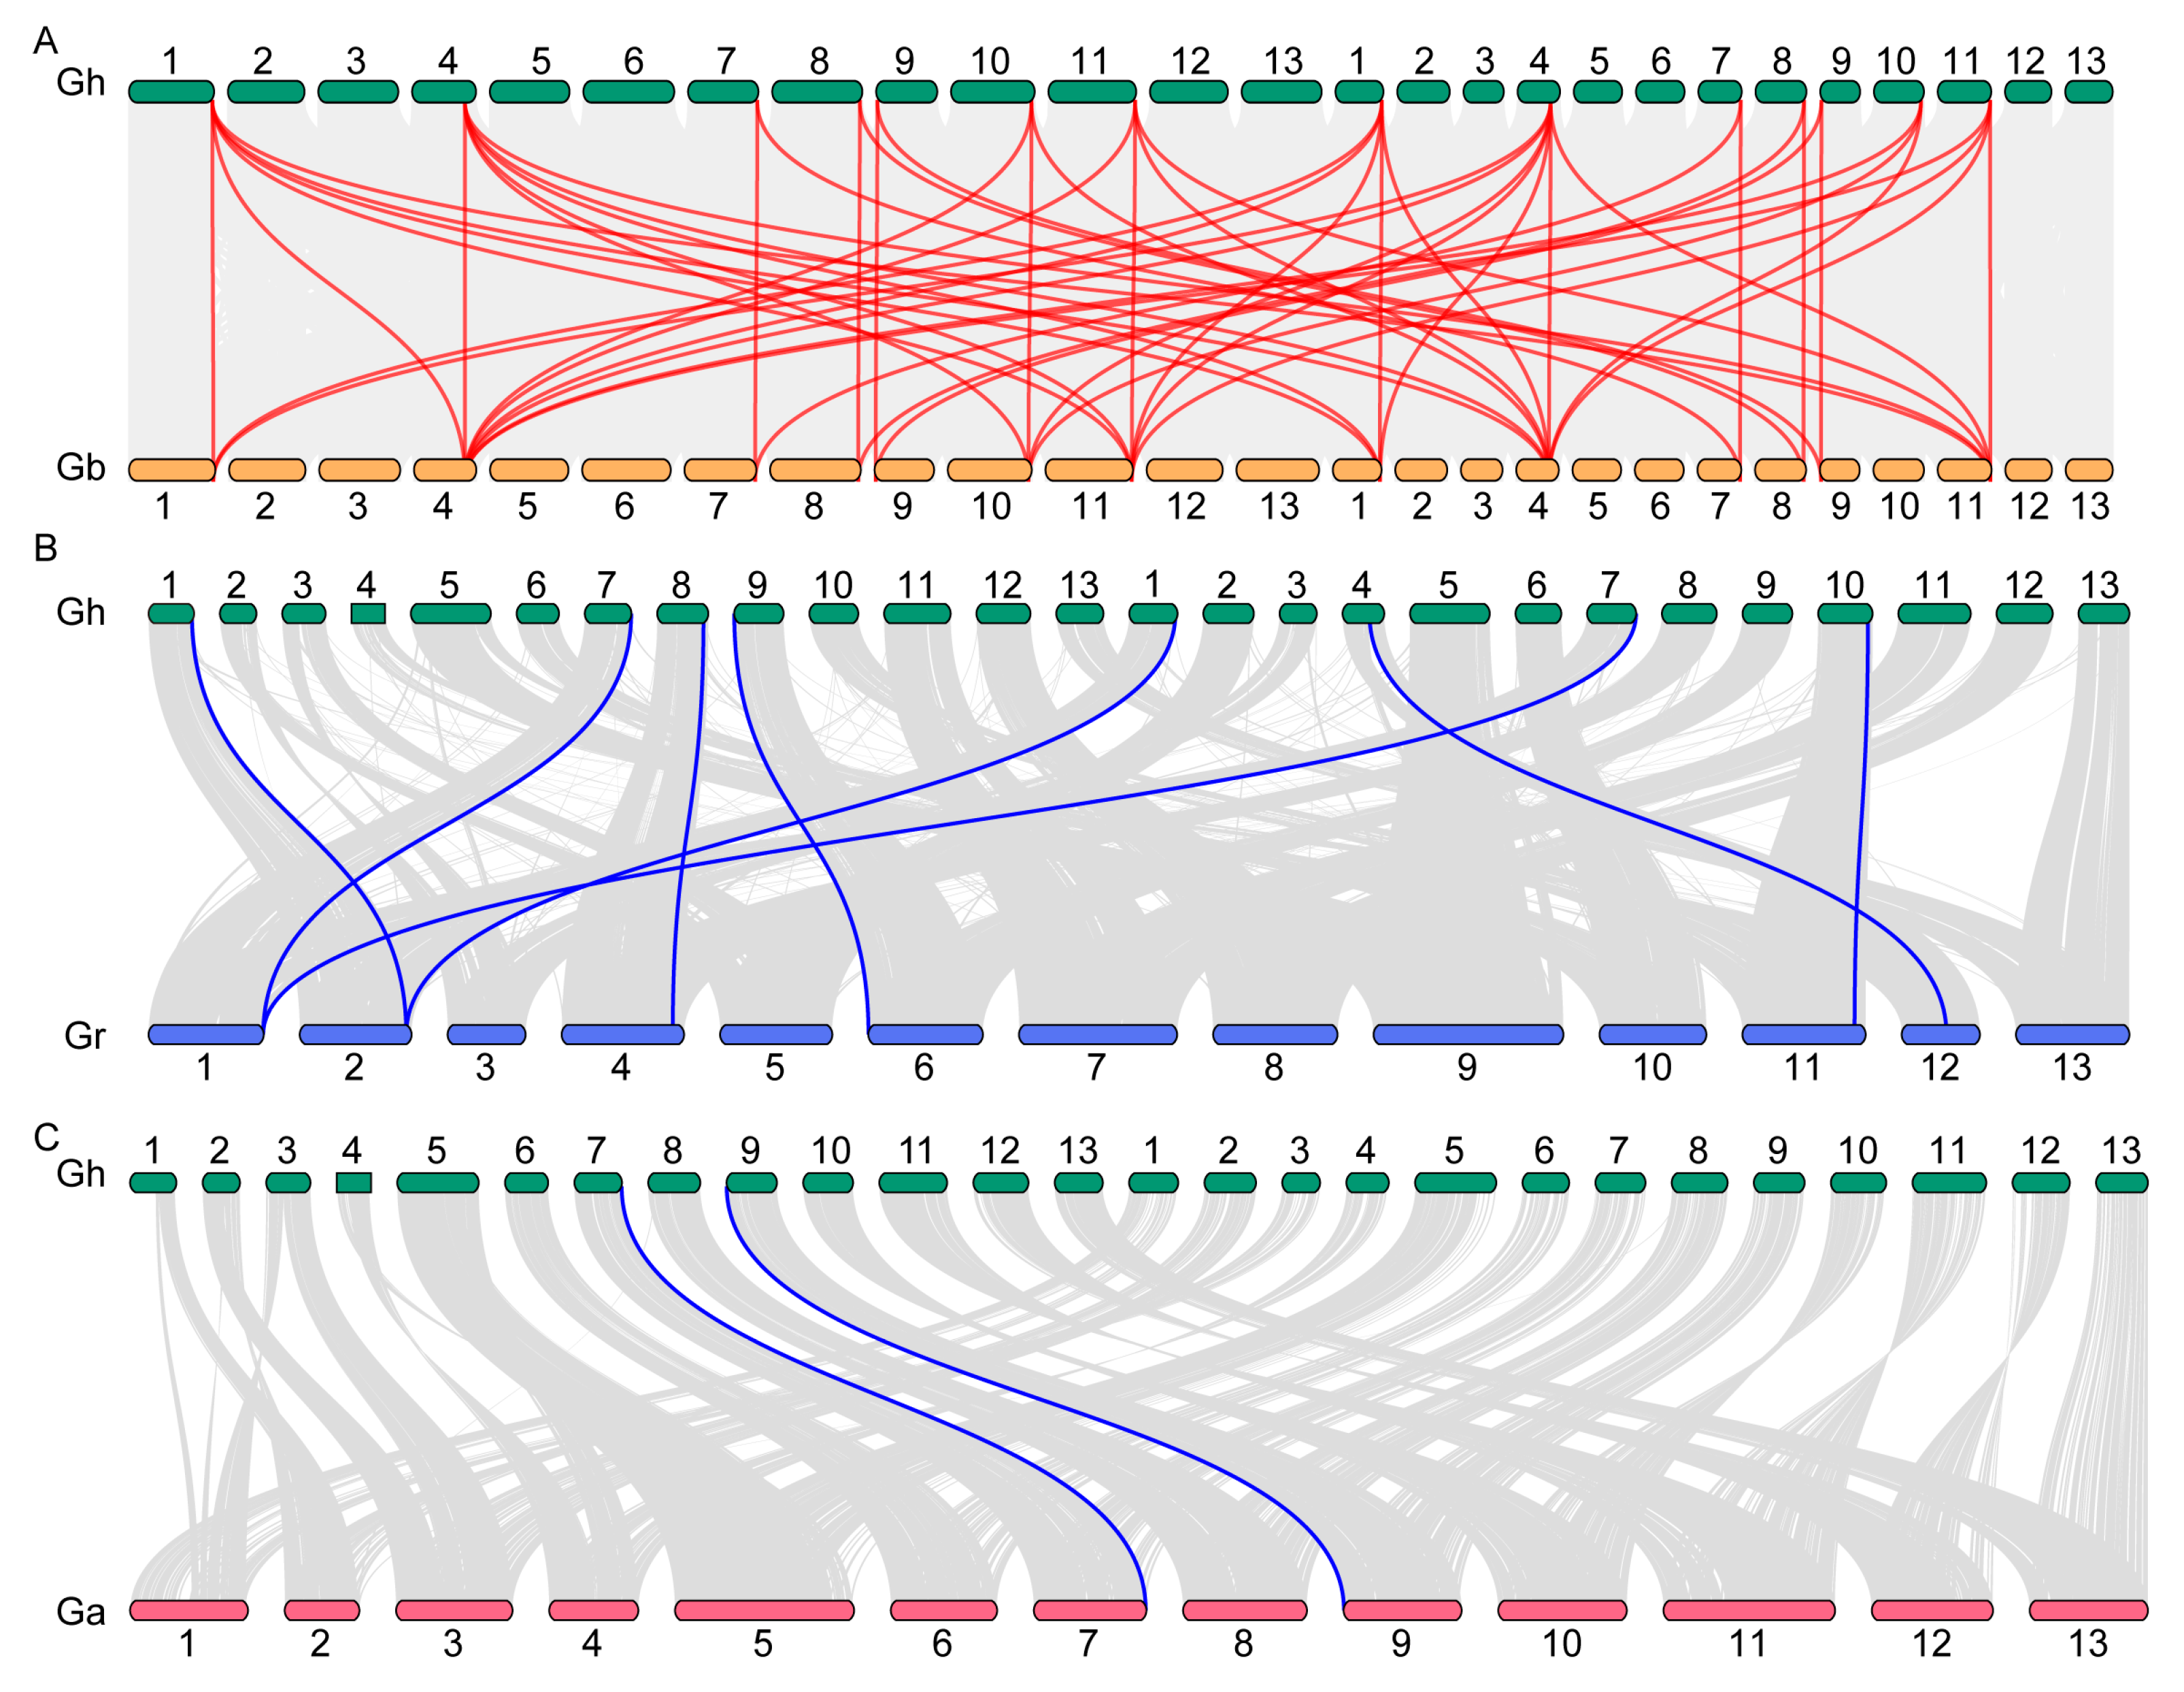
Figure 3.
Gene structure and conserved motifs of P5CS genes across four cotton species. (A) Phylogenetic tree of the 40 P5CS genes identified within the four cotton species (B) Schematic representation of the exon-intron structure of P5CS genes. (C) Analysis of conserved motifs within P5CS proteins, with 10 motifs identified across the 40 P5CS proteins, each represented by a distinct color. The length of each motif is proportional to its frequency within the proteins.
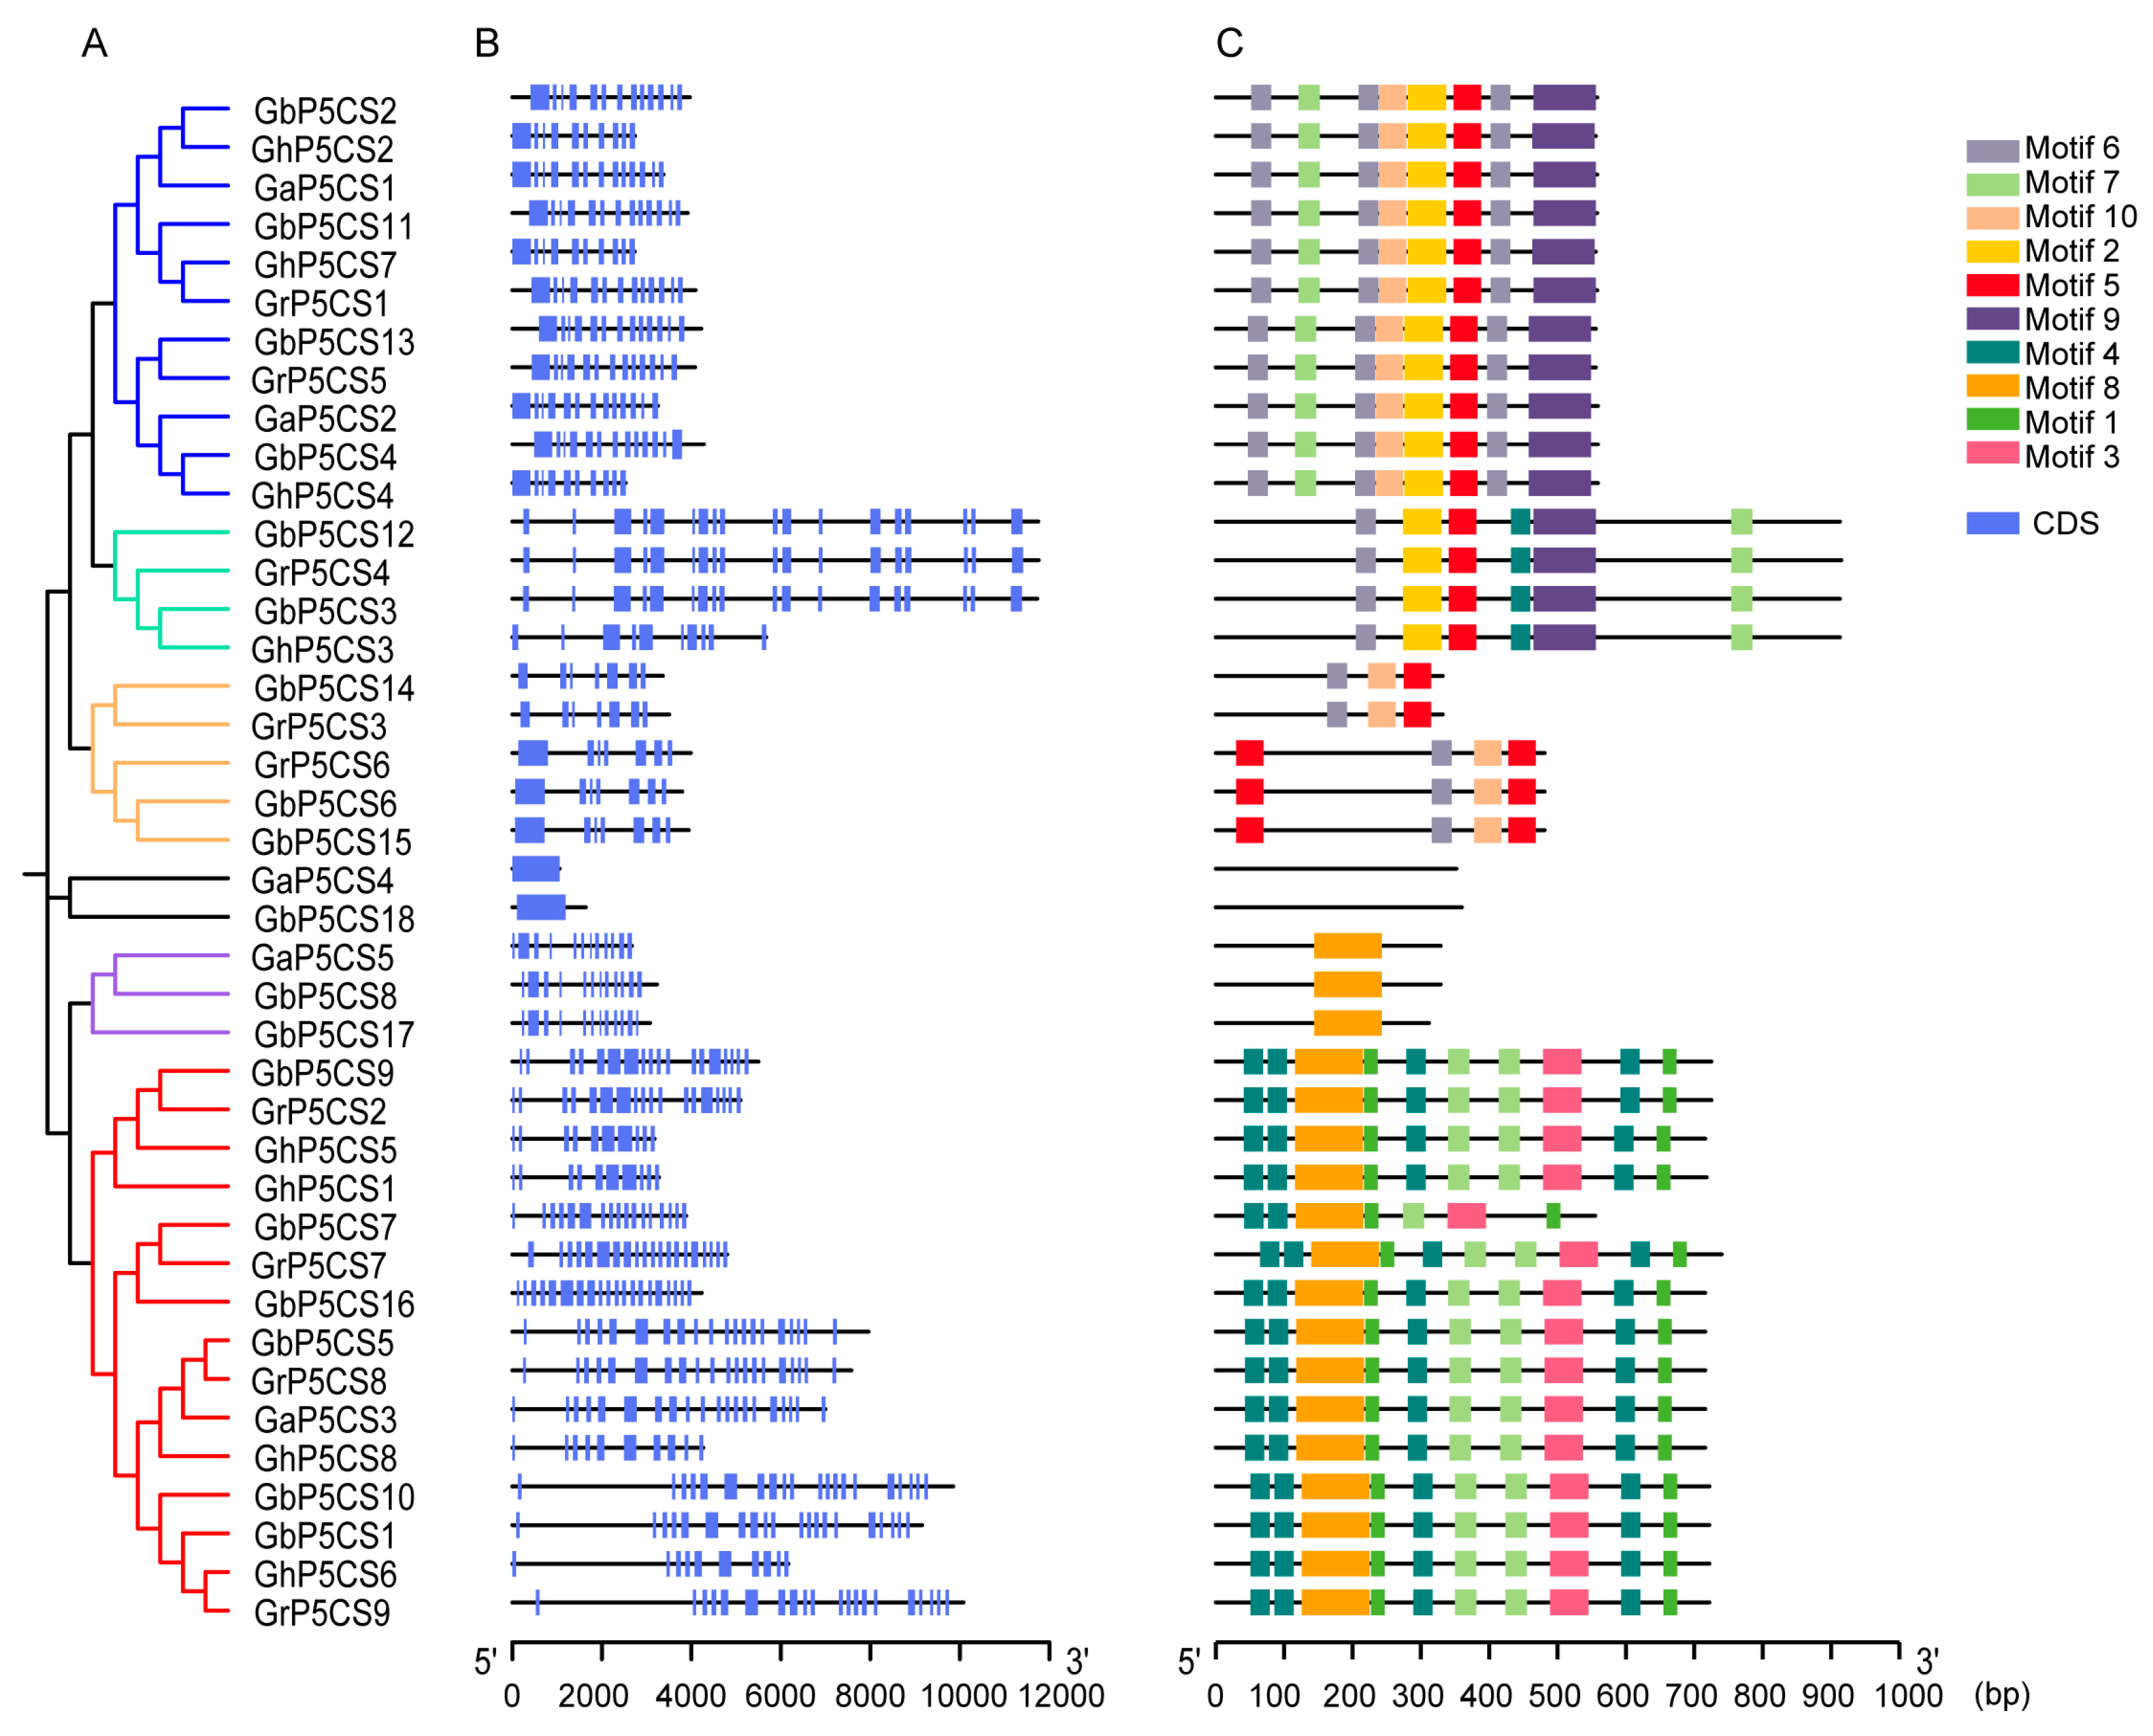
Figure 4.
qRT-PCR analysis of the expression of eight GhP5CS genes in cotton leaves under salt stress conditions. Data are represented as mean ± standard error (SE) from three biological replicates. * and ** indicate significant differences at P < 0.05 and P < 0.01, respectively, while ‘ns’ means no significant. Statistical analysis was performed using Student’s t-test to compare the relative expression of GhP5CS genes between salt-stressed and control groups.
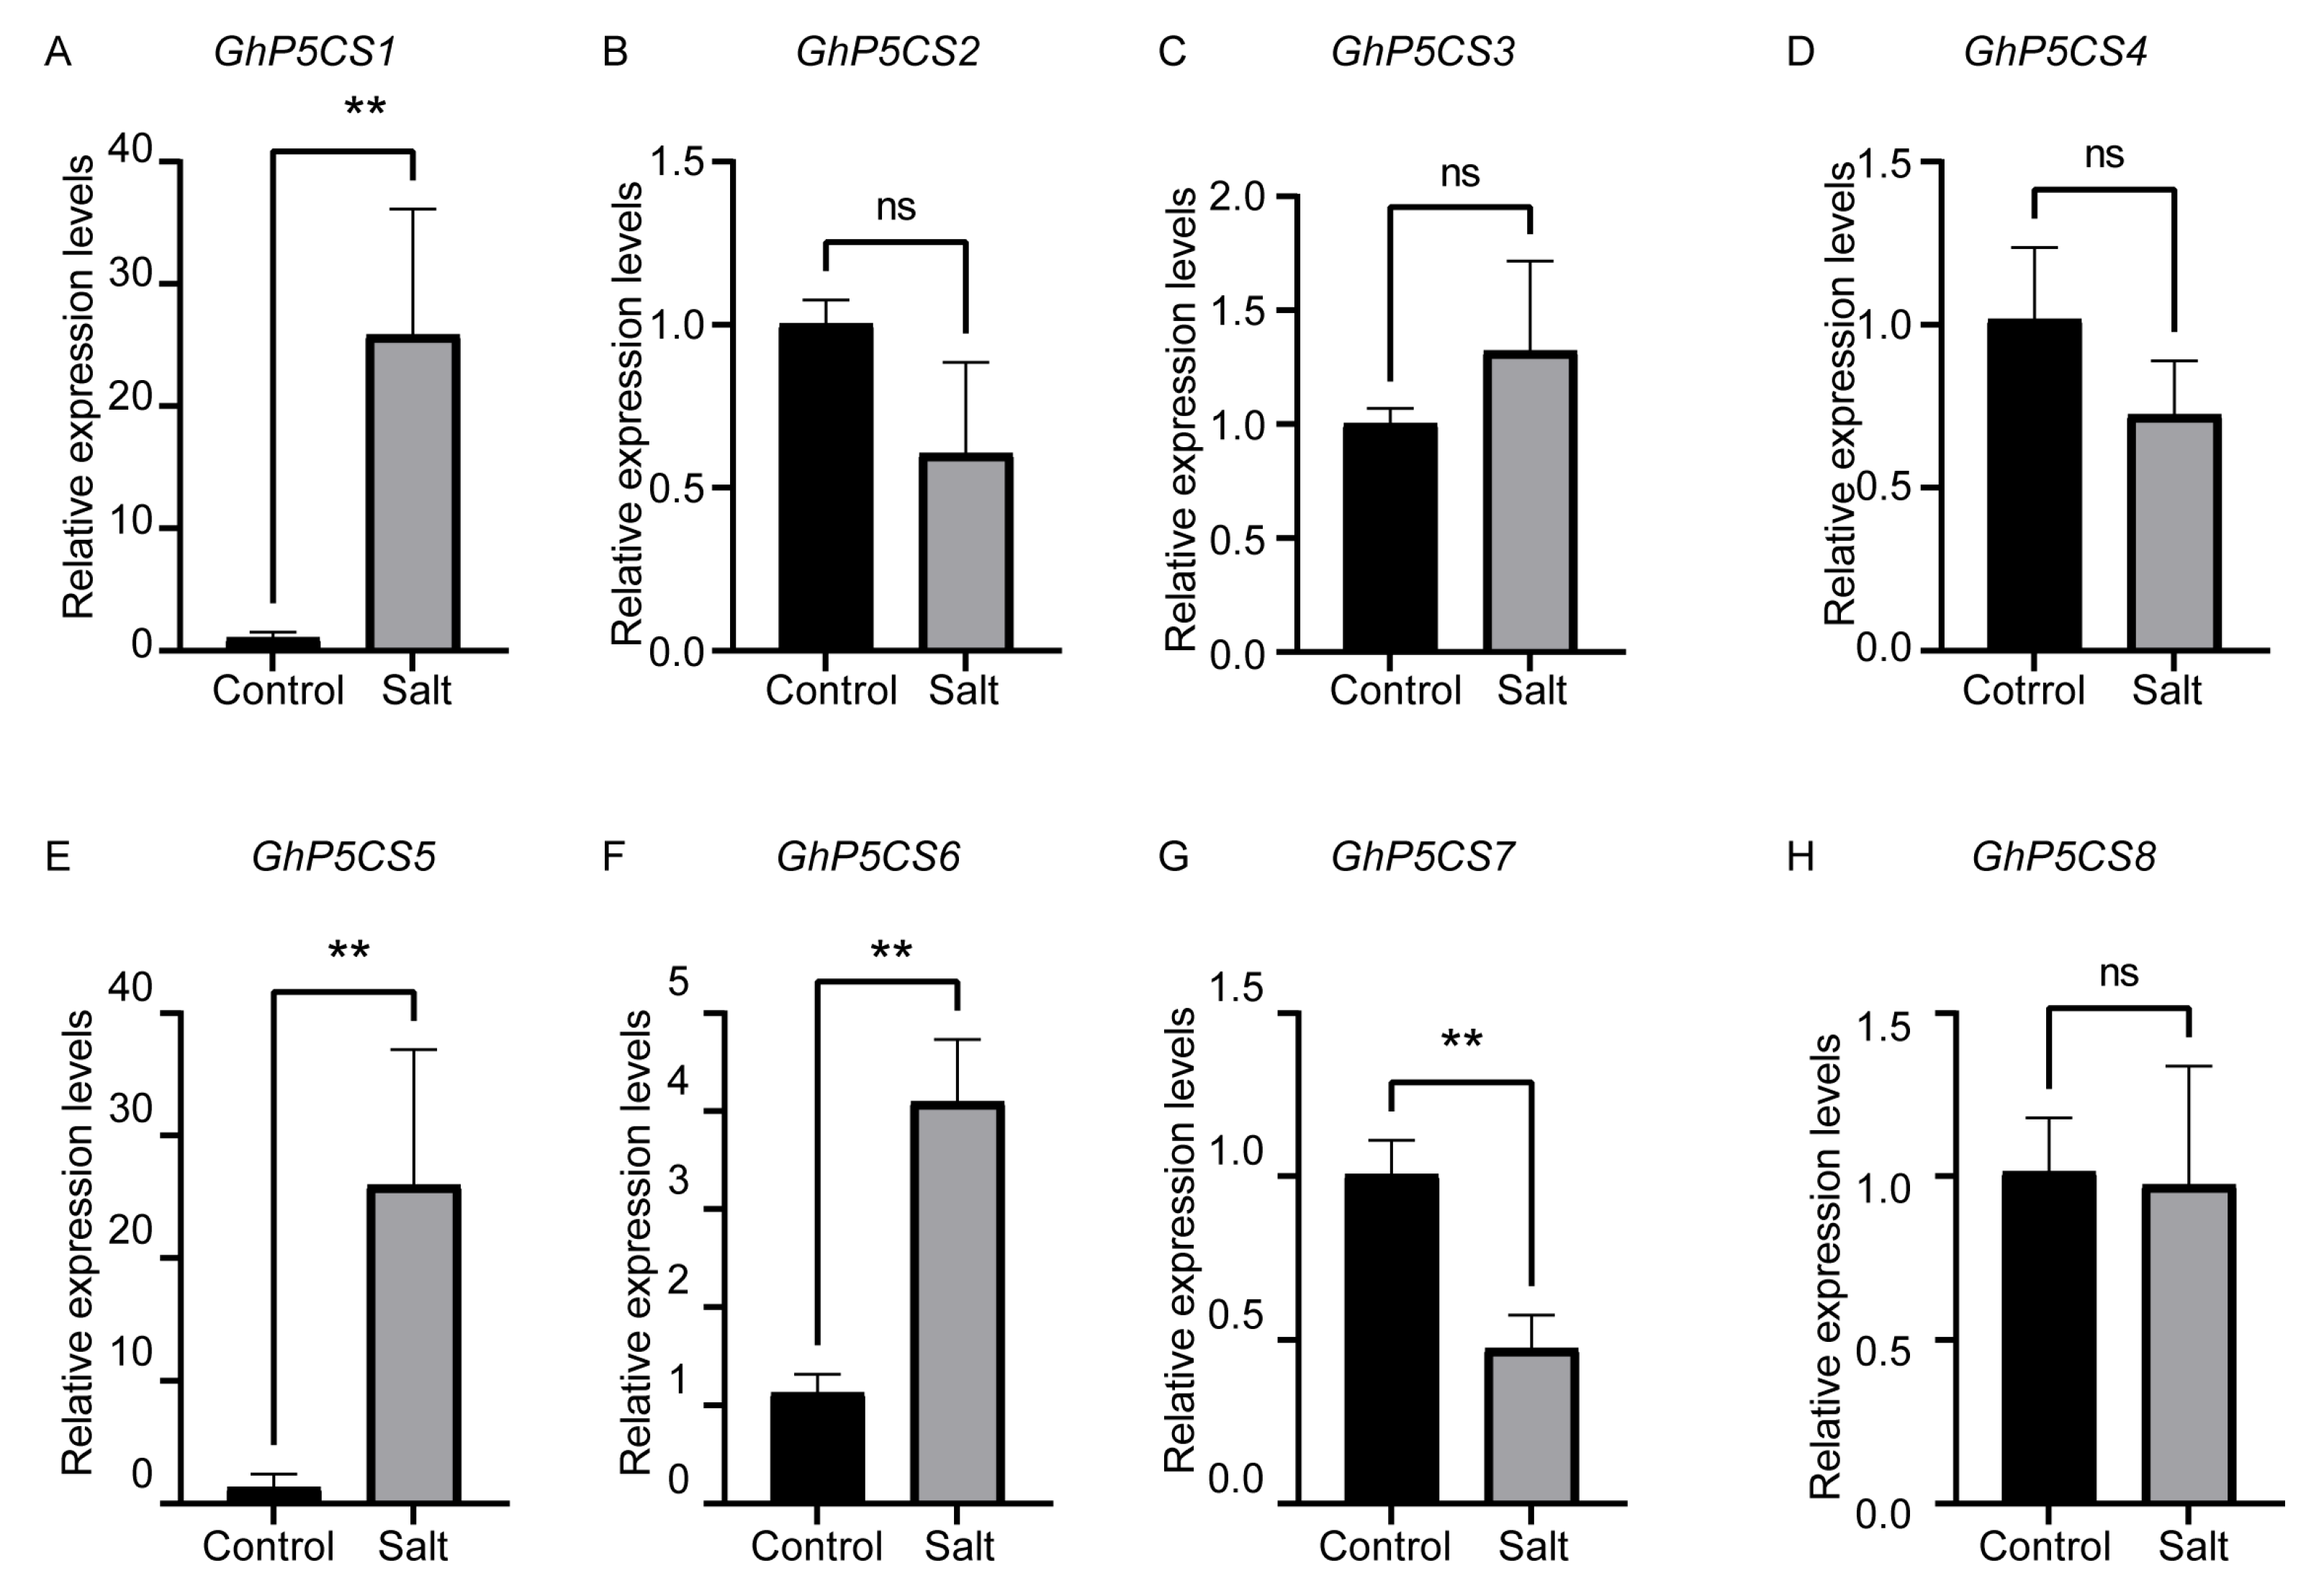
Figure 5.
qRT-PCR analysis of the expression of eight GhP5CS genes in cotton roots under salt stress conditions. Data are represented as mean ± standard error (SE) from three biological replicates. * and ** indicate significant differences at P < 0.05 and P < 0.01, respectively, while ‘ns’ means no significant. Statistical analysis was performed using Student’s t-test to compare the relative expression of GhP5CS genes between salt-stressed and control groups.
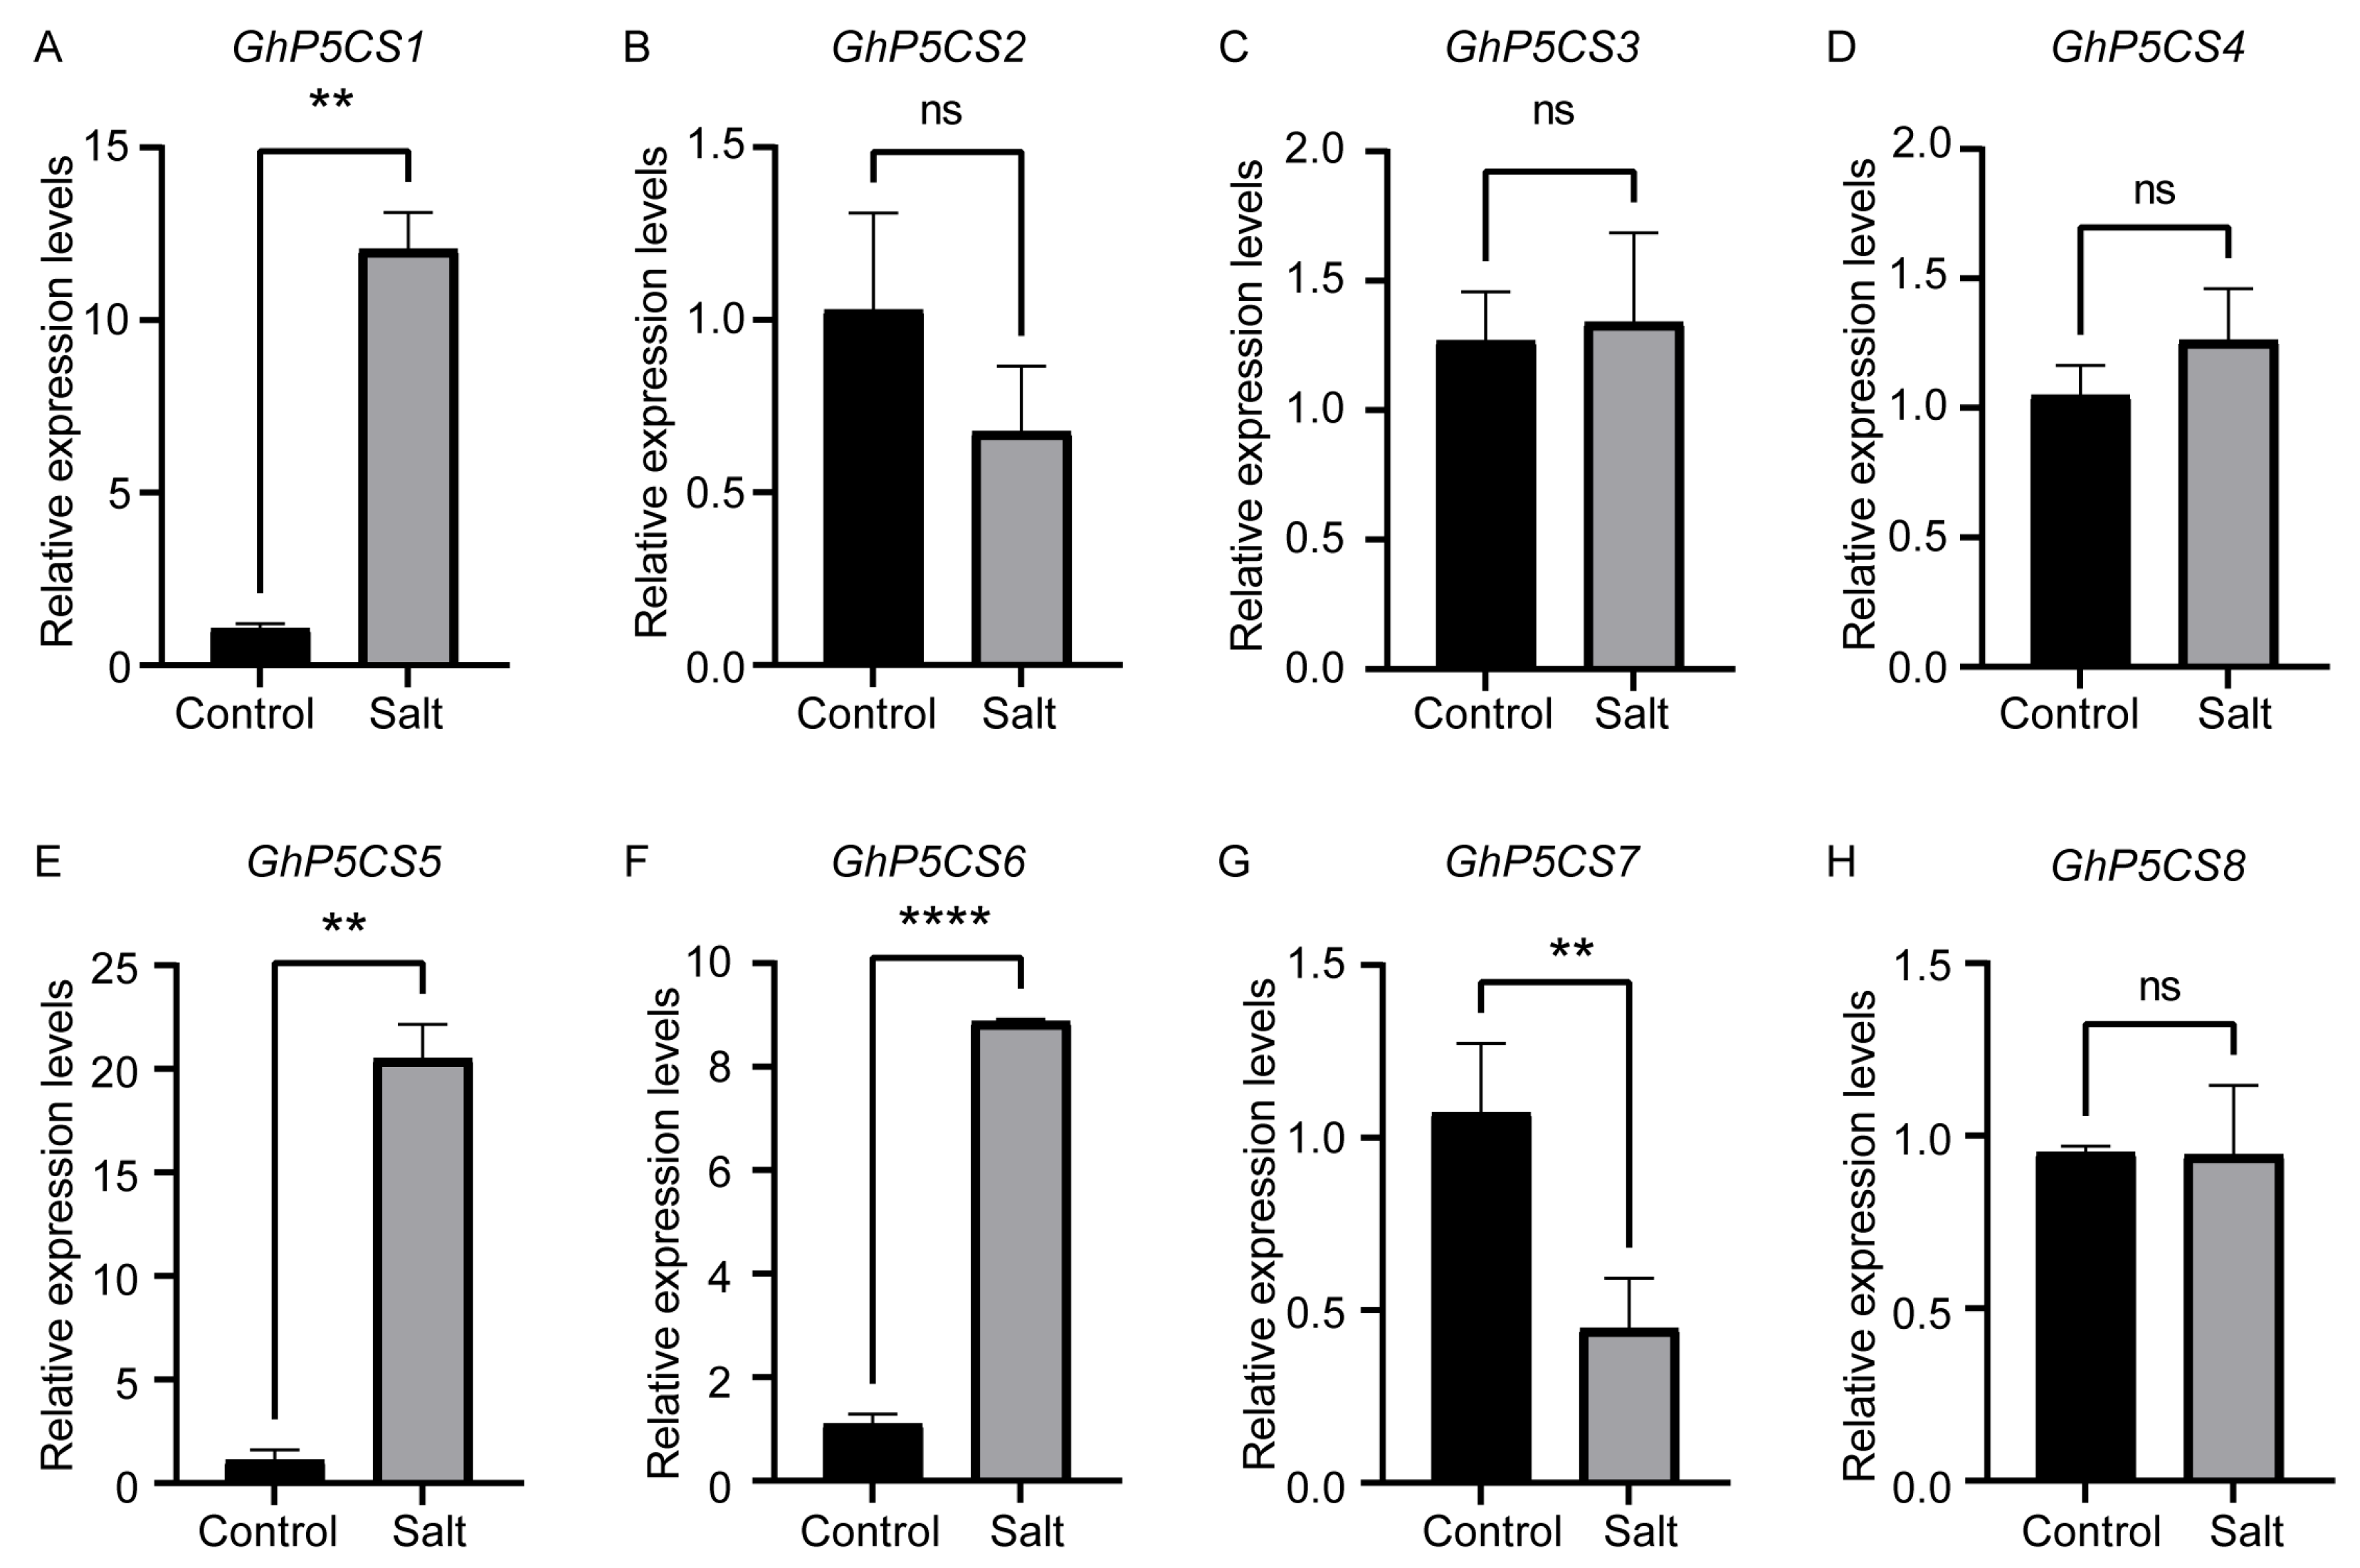
Figure 6.
Functional validation of GhP5CS1 under salt stress using VIGS. (A) The albino phenotype observed in newly emerged true leaves of the pTRV2::CLA1 plants. (B) Relative expression levels of GhP5CS1 in pTRV2::00 and pTRV2::GhP5CS1 plants. (C) pTRV2::00 and pTRV2::GhP5CS1 plants before salt stress treatment. (D) pTRV2::00 and pTRV2::GhP5CS1 plants treatment showed significant difference in leaf size after salt treatment. (E) DAB staining of leaves for pTRV2::00 and pTRV2::GhP5CS1 plants. (F) The fresh weight of shoots for both pTRV2::00 and pTRV2::GhP5CS1 plants. (G) The fresh weight of roots for both pTRV2::00 and pTRV2::GhP5CS1 plants. (H) Proline content in leaves of pTRV2::00 and pTRV2::GhP5CS1 plants under control and salt conditions. * and ** indicate significant differences at P < 0.05 and P < 0.01, respectively. Student’s t-test was used to analyze the differences in the relative expression of GhP5CS1 gene between pTRV2::00 and pTRV2::GhP5CS1 plants under salt treatment and control conditions.
Disclaimer/Publisher’s Note: The statements, opinions and data contained in all publications are solely those of the individual author(s) and contributor(s) and not of MDPI and/or the editor(s). MDPI and/or the editor(s) disclaim responsibility for any injury to people or property resulting from any ideas, methods, instructions or products referred to in the content. |
© 2024 by the authors. Licensee MDPI, Basel, Switzerland. This article is an open access article distributed under the terms and conditions of the Creative Commons Attribution (CC BY) license (http://creativecommons.org/licenses/by/4.0/).
Copyright: This open access article is published under a Creative Commons CC BY 4.0 license, which permit the free download, distribution, and reuse, provided that the author and preprint are cited in any reuse.


