
Submitted:
23 March 2025
Posted:
26 March 2025
You are already at the latest version
Abstract
Glutathione S-transferases (GSTs) are multifunctional enzymes involved in stress responses, detoxification, and secondary metabolite transport in plants. In this study, a genome-wide analysis of Crocus sativus identified 60 GST genes containing conserved GST_N and GST_C domains. Phylogenetic analysis classified these genes into multiple subfamilies, including Tau, Phi, and Theta, highlighting lineage-specific evolution. Motif and domain analyses revealed structural diversity within the GST family, while chromosomal mapping identified clustering patterns and hotspots, suggesting gene duplication as a key driver of GST family expansion. Promoter analysis uncovered cis-regulatory elements such as MEJA, ABRE, and GARE motifs, indicating the potential role of GST genes in hormone-mediated stress responses. Subcellular localization predictions placed most GST proteins in the cytoplasm, with some localized to chloroplasts and vacuoles, reflecting their functional diversity. Swiss-Model structural modeling of a representative GST protein revealed a homo-dimeric arrangement, with distinct domains responsible for substrate binding and catalysis. The model, supported by a high QMEANDisCo global score, identified key interactions with S-hexylglutathione. This study provides a comprehensive characterization of the GST gene family in Crocus sativus, offering insights into their structural, evolutionary, and functional attributes. The findings pave the way for further research on GST-mediated stress tolerance and secondary metabolite biosynthesis, with implications for agricultural improvement strategies.
Keywords:
Crocus sativus(Saffron)
; glutathione S-transferases proteins(GSTs)
; stress response
; genome-wide analysis
; secondary metabolite biosynthesis
1. Introduction
Glutathione S-transferases (GSTs; EC 2.5.1.18) are phase II metabolic isozymes common in fungi, mammals, and plants [1]. The first report of GSTs in plants dates back to 1970, when research revealed that GSTs extracted from maize participated in herbicide metabolism by facilitating the conjugation of synthetic chemicals with glutathione [GSH; γ-Glu–Cys–Gly] [2].Plant GST proteins are globular dimers, typically consisting of two separate N- and C-terminal domains [3]. The N-terminal domain has a structural configuration of β-strands and α-helices organized in a thioredoxin-like fold, with a GSH binding site (G-site) characterized by excellent substrate selectivity. The C-terminal domain is composed solely of α-helices, including an electrophilic substrate binding site (H-site) characterized by hydrophobic properties and extensive substrate specificities. This region accommodates many substrates and ligands [1,4]. Previous studies have classified plant GSTs categorizes into 14 classes, including phi, zeta, tau, theta, lambda, Ure2p, EF1Bγ, hemerythrin, iota, glutathionyl-hydroquinone reductases (GHRs) [5], dehydroascorbate reductase (DHAR), tetrachlorohydroquinone dehalogenase (TCHQD), metaxin, and microsomal prostaglandin E synthase type 2 (mPGES-2) [6,7,8]. Among these, tau, phi, DHAR, and lambda are plant-specific GST classes. The tau and phi classes are the most prevalent, likely due to their rapid development in plants. The Arabidopsis thaliana GST gene family consists of 57 members, categorized into nine classes, including 13 phiand 28 tau members [9]. The functions of GST classes apart from tau and phi remain poorly understood. DHAR GSTs diminished the production of ascorbic acid within the ascorbate–glutathione cycle to produce antioxidants [10]. GSTs of the zeta class exhibit isomerase activity and are involved in tyrosine catabolism [11]. Theta class GSTs function as glutathione peroxidases, contributing to the metabolism of oxidative stress [12]. Lambda GSTs use flavonols as high-affinity ligands. Dixon and Edwards [4] elucidated a unique glutathione-dependent function of these enzymes in the recycling of oxidized quercetin. DHAR and lambda GSTs exhibited action towards dehydroascorbic acid (DHA) [13].
Previous studies have also demonstrated the functional diversity among GST genes [14,15]. Despite limited understanding, iota class GSTs appear to function as oxidoreductases rather than conjugating GSTs, while hemerythrins facilitate the detoxification of heavy metals by promoting the conjugation of GSH with metal ions. Recent research has demonstrated the scavenging ability of members of tau class against most hazardous reactive carbonyl species (RCS) (i.e. acrolein) and proposed their participation in defense mechanism against RCS [16].GSTs primarily facilitate the conjugation of reduced tripeptide glutathione (GSH) to diverse reactive electrophiles. GST proteins are crucial for the appropriate growth and physiological functioning of plants. They are crucial in stress response [17,18] and participate in the breakdown of insecticides and herbicides [18]. GSTs exhibit responsiveness to plant hormones, including auxins, ethylene, salicylic acid, abscisic acid, and jasmonic acid [10,19]. Based on current advances in plant proteomics, genomes, and transcriptomics studies, Chronopoulou et al. (2017) examined the functions of GSTs. Apart from their catalytic activity, GSTs bind to flavonoids and anthocyanins, therefore acting as non-catalytic proteins by moving them from the cytoplasm into the central vacuole [5].Involved in plant development, GSTs have binding affinity to auxin [20] and cytokinin [21], phytohormones. Additionally binding to porphyrinogens [22] and oxylipins [9], GSTs guard plant cells against oxidative stress [23,24]. Furthermore crucial in responses to biotic and abiotic stressors like pathogen assault, heavy metals [25], dehydration [26] and salt [27], as well as salicylic acid signalling [13] are plant GSTs. Still, the specific processes are unknown.
Furthermore, GSTs may play a role in the transport and metabolism of secondary metabolites, including anthocyanins, flavonoids, and porphyrins [4]. Recent genome-wide analyses have identified 53 GST genes in Arabidopsis [24], 79 in rice [14,28], 25 in soybean, 42 in maize [29], 90 in tomato [30], 85 in pepper [31], 32 in pumpkin [32], 23 in sweet orange [33], 90 in potato [34], and 20 in Dracaena cambodiana [35]. Despite the identification of Glutathione S-Transferases (GSTs) as contributors to plant stress tolerance and detoxification, a comprehensive analysis of the GST gene family in Crocus sativus (saffron) remains unavailable. The absence of genetic and functional insights limits our understanding of the roles saffron GSTs play in stress adaption and overall plant resilience. Understanding GST operations may facilitate improvements in saffron production and quality among environmental challenges. This study conducted a genome-wide annotation and phylogenetic analysis of the GST gene family in Crocus sativus. Using computational tools such as BLAST [36], TBtools [37], and Python scripts, we identified and characterized GST genes, examined their motif structures, and assessed their physicochemical characteristics. Comparative analyses with Arabidopsis thaliana and other plant species revealed lineage-specific gene divergence and evolutionary trends. Promoter region analysis and phylogenetic tree construction provided deeper insights into the regulatory and functional diversity of GST genes. This study enhances our understanding of the evolution and functional divergence of GST gene families in Crocus sativus and other monocots, offering a foundation for future research on plant stress tolerance and metabolic adaptation.
2. Materials and Methods
2.1. Plant Materials
The study "Crocus genome reveals the evolutionary origin of crocin biosynthesis" [38] provided the genomic dataset of Crocus sativus used in this work. This dataset, which includes annotated genes, protein sequences, and genomic scaffolds, offers a comprehensive toolkit for identifying and studying the function roles of GST genes. Using GST protein sequences of Arabidopsis thaliana, we retrieved reference sequences, including NP_173160.1, AEE29554.1, and AAD34992, from NCBI databases for a comparative analysis. These sequences were curial for identifying homologous GSTs in Crocus sativus and evolutionary research. Building on a solid foundation created by merging the Crocus sativus genome with publicly available data from Arabidopsis thaliana, we began investigating the lineage-specific evolutionary and functional variations within GST gene families.
2.2. Identification and Annotation of GST Genes
Using known GST protein sequences from Arabidopsis thaliana (e.g., NP_173160.1, AEE29554.1, and AAD34992.1) as query sequences, BLASTp searches were performed against the annotated protein sequences of the Crocus sativus genome dataset to identify GST genes. High-confidence candidates were selected based on a stringent e-value cutoff (<1e-5) and the presence of GST-specific conserved domains, as confirmed by HMM-based searches using the Pfam [39] and SMART databases [40]. Redundant sequences were removed, and annotations of the selected GST genes were validated using TBtools [37]. The identified protein sequences were compiled into a FASTA [41] file for downstream analyses, including motif characterization, phylogenetic analysis, and structural studies. These procedures ensured the construction of a high-quality GST gene for Crocus sativus collection. Additionally, GST genes from Arabidopsis thaliana and other allied plant species were analyzed using the same pipeline to establish an evolutionary framework.
2.3. Phylogenetic Analysis
The evolutionary relationships of GST proteins in Crocus sativus were investigated using phylogenetic analysis. ClustalW [42] algorithm in MEGA [43] matched protein sequences of GST genes found in Crocus sativus with orthologous GST protein sequences from Arabidopsis thaliana and other related species. Multiple sequence alignment guaranteed exact comparison between conserved and divergent areas among the sequences.A phylogenetic tree was constructed using the Neighbor-Joining (NJ) [44]method in the MEGA program. The reliability of tree branches was assessed using 1,000 bootstrap replicates, with default settings including pairwise deletion for gaps. GST proteins were classified into several subfamilies (e.g., Tau, Phi, Zeta), and evolutionary events such as gene duplication and divergence were inferred from the resultant tree. This study provides a framework for understanding the functional specialization and lineage-specific evolution of the GST gene family in Crocus sativus.
2.4. Motif Analysis
The MEME Suite [45] was used to find conserved motifs among GST proteins of Crocus sativus. Using default settings for motif width and significance thresholds, the protein sequences found in the previous phase were analyzed under criteria allowing the detection of up to 15 motifs. By cross-referencing these motifs with domain annotations, their functional importance was evaluated.
The functional domains of GST proteins were confirmed using the Pfam and SMART databases, which identified characteristic GST domains, including C-terminal alpha-helical domain and the N-terminal thioredoxin-like domain. The processed data were systematically organized to facilitate visualization and further interpretation in the results stage. These analyses provided insights into the conserved structural elements and functional roles of GST proteins in Crocus sativus.
2.5. Domain Validation
Domain validation using the Pfam database was performed to confirm the identification of GST genes in Crocus sativus. Conserved domains characteristic of the GST family were identified, including the alpha-helical C-terminal domain (GST_C) and the thioredoxin-like N-terminal domain (GST_N). Reflecting the diversity of GST proteins in Crocus sativus, variations of these domains, such as GST_N_2, GST_N_3, and GST_N_4, as well as GST_C_2, GST_C_3, GST_C_7, and GST_C_6 were also found. Additionally, certain sequences contained other domains associated with functional specialization, such as DnaB_bind and CLIC-like_N. These domain variations highlight the structural and functional diversity of the GST gene family in Crocus sativus. Only genes containing conserved GST-specific domains were included in the final dataset for further phylogenetic and functional analysis.
2.6. Ka/Ks Analysis of GST Gene Sequences
Synonymous (Ks) and non-synonymous (Ka) substitution rates were calculated to evaluate the selective pressures acting on the GST gene family in Crocus sativus. To ensure high-quality alignment for subsequent analysis, coding sequences (CDS) of the identified GST genes were aligned using the ClustalW method in the MEGA program. Subsequently, a neighbor-joining phylogenetic tree was constructed from the aligned sequences to establish an evolutionary framework and guide pairwise comparisons.
The Codon-Based Test of Selection in MEGA computed pairwise Ka/Ks values. The Ka/Ks ratio of each gene pair provided insight into the type of selection acting on the sequences. Ratios greater than 1 indicated positive selection, suggesting adaptation to specific functional or environmental pressures. Ratios less than 1 suggested purifying selection, which works to preserve gene functionality by removing harmful mutations. A ratio equal to 1 indicated neutral evolution. Finally, the pairwise distance data, including the Ka/Ks ratios, were saved in an Excel file for further analysis. This approach facilitated the assessment of the evolutionary processes influencing the GST gene family in Crocus sativus as a whole.
2.7. Location Analysis of Chromosomes
The genomic structure of GST genes in Crocus sativus was analyzed through chromosomal distribution mapping. Genomic annotation data, including the locations of GST genes, was retrieved from the Crocus sativus genome. Using TBtools, the GST genes were mapped to the chromosomes. The mapping process involved charting the physical positions of GST genes on each chromosome and converting the genomic data into an appropriate format. A phenogram was created by grouping GST genes based on their chromosomal proximity or clustering patterns, thus revealing their genetic architecture. Each group was color-coded to enhance the visualization of their distribution across chromosomes. This analysis identified gene clusters that could be evolutionary hotspots or regions affected by gene duplication events. The generated graphics clearly illustrated the spatial arrangement and positions of GST genes within the Crocus sativus genome.
2.8. Predicting Subcellular Localization
WolfPsort [46], a computational technique designed to predict protein localization based on amino acid sequences, was used to project the subcellular localization of GST proteins in Crocus sativus. The amino acid sequences of all 60 identified GST genes were submitted to the WolfPsort server. The tool analyzed the sequences and assigned a score for each protein across various cellular compartments, including the cytoplasm, chloroplast, nucleus, vacuole, mitochondria, cytoskeleton, extracellular space, and others. These scores represent the likelihood of a protein localizing to a particular compartment. The compartment with the highest score was considered the primary localization site for each protein. If significant scores were observed, secondary and tertiary localization predictions were also considered to provide a comprehensive view of the subcellular location of each GST protein. The resulting data were compiled for further display and analysis.
2.9. Physicochemical Property Analysis
The structural and functional characteristics of the identified GST proteins in Crocus sativus were analyzed through physicochemical property assessments. The ExPASy [47] ProtParam tool was used to compute key parameters, including molecular weight (kDa), isoelectric point (pI), and hydrophobicity (GRAVY score). FASTA-format protein sequences were input into ProtParam, and the results for each sequence were recorded. The GST proteins were classified based on their physicochemical profiles, including their acidic or basic nature (based on pI) and their hydrophilic or hydrophobic tendencies (based on the GRAVY score). This analysis is crucial for predicting the biochemical functions of GST proteins and selecting candidates for further functional studies. By providing insights into the stability, solubility, and functional significance of these proteins, this analysis lays the groundwork for experimental validation and comparative studies.
2.10. Aligning
Multiple sequence alignments using TBtools were performed to examine the sequence conservation among GST genes. FASTA format protein sequences were aligned to identify conserved regions and motifs. Color schemes in the alignment facilitated visualization by highlighting both similarities and differences in amino acid residues. Accurate representation was ensured using the default settings, and the data were exported for further annotation and analysis.
2.11. Hormone Response Element Promoter Analysis
Using genome annotation data, a 1500 bp upstream sequence from the transcription start site (TSS) was extracted to identify hormone-responsive cis-regulatory elements in the promoter regions of the discovered Crocus sativus GST genes using PlantCare website [48]. The TBtools software package was used for promoter region analysis. Specifically, hormone-responsive motifs such as MEJA (Methyl Jasmonate), ABRE (Abscisic Acid Responsive Element), and GARE (Gibberellin Responsive Element) were selected for study. Pattern matching against a known database of hormone-regulating sequences formed the basis for cis-element identification. To visualize their presence and distribution throughout the promoter regions of each gene, graphical representations of the hormone-responsive element density were created.
2.12. Protein Modeling and Functional Analysis Using Swiss-Model and PDBSum Tools for GST
The target protein, glutathione S-transferase (GST), has an amino acid sequence obtained from a genomic database. The sequence was analyzed using the Swiss-Model [49] Interactive Workspace for structural modeling. After submitting the sequence for template search, the Swiss-Model server identified homologous templates with high structural similarity. Further analysis focused on the template with the highest sequence identity and query coverage. The Tau class GST from Mangifera indica, with a 56.89% sequence identity and 0.96 coverage (PDB ID: 5g5e), was selected as the template.X-ray diffraction at a 2.35 Å resolution was used to solve the structure, providing detailed information on ligand binding and the active site. PDBSum [50] was used to identify the N-terminal and C-terminal domains, thus confirming the structural features of the protein. Using the Swiss-Model and PDBSum tools, the selected model was further investigated for ligand-binding interactions and functional domains. Key ligands, including S-hexylglutathione and di(hydroxyethyl)ether, were examined for interactions with active site residues within a 4 Å radius.
2.13. Glutathione S-Transferase (GST) Gene Expression Variations in Source and Sink Tissues During the Development of Saffron (Crocus sativus L.) Corms
Raw sequencing data for this study were obtained from SRA run accessions SRR24751341 toSRR24751364, while RNA sequencing (RNA-Seq) data retrieved from the NCBI Sequence Read Archive (SRA) under project accession PRJNA976833.The datasets were generated from saffron (Crocus sativus L.) samples collected at various developmental stages, including both source (leaf) and sink (corm) tissues. Raw sequencing data were analyzed and their quality assessed using FastQC (v0.11.9). Low-quality reads and adapter sequences were trimmed using Trimmomatic (v0.39), ensuring high-quality sequences for further analysis. HISAT2 (v2.2.1) was used to align the processed reads to a custom saffron transcriptome, and SAMtools (v1.11) [51] was applied to convert the resulting SAM files into BAM format. FeatureCounts (v1.6.5) [52] was used to quantify gene expression levels, and DESeq2 (v1.30.1) in R was employed for differential gene expression (DEG) analysis. Genes with an adjusted p-value < 0.05 and a log2 fold change > 2 were considered significant. The expression patterns of glutathione S-transferase (GST) genes across various tissues and developmental stages were visualized using a heatmap.
3. Results
3.1. Discovery of GST Genes in Crocus sativus
A comprehensive genome-wide study identified 60 GST genes in Crocus sativus. These genes are distributed across the genome and annotated based on the presence of conserved GST-specific domains, such as the C-terminal alpha-helical domain and the thioredoxin-like N-terminal domain. Comprehensive genomic data for the identified Crocus sativus GST genes are provided in Supplementary Table S1, which includes key information such as gene ID, gene name, chromosome, strand orientation (start and end), and amino acid count. This dataset offers a detailed overview of the genes, highlighting their genomic locations, structural features, and potential functions, serving as a foundational resource for further research on the GST gene family in Crocus sativus.
3.2. Phylogenetic Analysis of GST Genes
A comprehensive phylogenetic analysis was conducted to explore the functional diversity and evolutionary relationships of GST genes in Crocus sativus. Protein sequences of the identified Crocus sativus GST genes were selected based on their functional relevance in previous studies and aligned with well-characterized GST genes from other plant species. These included CkmGST3 from Cyclamen persicum (associated with anthocyanin storage), AtGSTU19 and AtGSTF10 from Arabidopsis thaliana (linked to abiotic stress tolerance and oxidative stress response), and LcGST4 from Litchi chinensis (involved in anthocyanin transport to vacuoles for pigmentation). These genes were retrieved from NCBI using their respective accession numbers: LcGST4 (ALY05897.1), AtGSTU19 (Q9ZRW8.1). Their roles in various plant physiological processes are well-documented in previous research [53,54].
Motif and domain analysis confirmed the presence of GST-specific conserved domains, including GST_N, GST_C, and their variants (e.g., GST_N_3, GST_C_7), highlighting their functional importance. Sequence alignment was performed using MEGA, and a neighbor-joining phylogenetic tree was constructed. TBtools was used for tree visualization. Specific clusters were identified that linked Crocus sativus GSTs with reference genes. For example, CSGST-14 grouped closely with LcGST4, suggesting a conserved role in anthocyanin transport, while CSGST-21 and CSGST-35 clustered with AtGSTU19, indicating potential involvement in detoxification and stress response pathways. This study provided insights into the evolutionary pathways and functional diversity of GST genes in Crocus sativus. Although indicating unique adaptations in Crocus sativus GST genes, the inclusion of reference genes from other species demonstrated shared functional characteristics such stress tolerance and secondary metabolite transport. Supplementary Table S2 includes a list of glutathione S-transferase (GST) genes discovered in Crocus sativus, along with their gene identifiers, protein family classifications (Pfam), gene locations with statistical significance (E-value), and brief descriptions of their functions. These genes belong primarily to the glutathione S-transferase family, which is involved in cellular detoxification processes. They are categorized based on the enzymes they encode, such as TAU, PHI, THETA, and others. This dataset provides critical information regarding the structure and classification of GST genes in Crocus sativus.
3.3. Motif Interpretive Analysis of GST Genes
A detailed investigation of the GST genes in Crocus sativus revealed conserved sequence patterns critical for their structural and functional roles. Using the MEME Suite, fifteen distinct motifs were identified, and their positions along with corresponding Pfam values were recorded. These motifs, crucial for maintaining GST-specific enzymatic activity and binding properties, highlight conserved regions common across GST family members. Every known GST gene contains motifs, some of which are ubiquitous, while others are restricted to specific gene sets. Supplementary Table S3 presents the sequence and width of each motif.
3.4. Domain Analysis Conservation in GST Genes
Motif and domain analysis of the identified Crocus sativus GST genes revealed several conserved domains unique to the GST family. Consistent with canonical GST activity and structural stability, the N-terminal GST domains (e.g., GST_N, GST_N_2, GST_N_3, GST_N_4) and C-terminal GST domains (e.g., GST_C, GST_C_2, GST_C_3, GST_C_6) were predominant throughout the sequences. In addition to these core GST domains, some sequences exhibited less common or more specialized domains, such as CLIC-like_N, DnaB_bind, and EF1G, potentially indicating functional divergence or specialization within the GST family.
As shown in Supplemental Table S2, the genes were further categorized based on their domain composition and phylogenetic relationships. The THETA group contains genes with GST_C and associated C-terminal domains, while the TAU group consists of genes with GST_N and GST_N-3 domains. Genes with less common domains, such as GST_N_2 and GST_N_4, are classified under the PHI category, and those with unique or unknown domains fall into the OTHER group. These classifications provide insight into the functional and evolutionary aspects of the GST gene family.
Figure 1 focuses on motif and domain structure. It depicts the genomic architecture of various gene sequences, including CSGST and GST family members. The evolutionary connections among different isoforms (e.g., CSGST-30-Theta, CSGST-31-Theta) are represented in a tree-like structure, showing their association with specific motifs or protein domains. The motifs are color-coded based on protein families, including MS_channel, glutaredoxin, atrophin-1, and the GST superfamily. These motifs are mapped along the gene sequences, with each bar representing a different domain within the sequences. The image on the right shows additional structural annotations, including coding sequences (CDS) with conserved motifs and potential functional regions across the isoforms. The variability in motif distribution observed in this study may reflect functional specialization or evolutionary divergence within the gene family. Among the significant protein domains relevant to functional studies are the GST and Atrophin-1 superfamilies, which could guide further research on gene functions in adaptive mechanisms or biochemical processes.
In Figure 2, Panel a presents an evolutionary tree illustrating the relationships among GST protein sequences from various species and isoforms (e.g., CGST and ATS). The tree highlights the phylogenetic groupings, with color-coding of different protein clades. This visualization underscores the structural and functional differences across protein variants, emphasizing the evolutionary diversification of GST proteins. Panel b shows sequence logos for the C-terminal (top) and N-terminal (bottom) regions of GST proteins. These logos encode the amino acid distribution at each position within the corresponding domains, with the height of each character representing the relative frequency of the matching amino acid. This provides a quantitative view of sequence conservation and variation. The visualization highlights the functional relevance and evolutionary conservation of the terminal regions, which are crucial for GST catalytic activity and structural integrity.
Taken together, these visualizations offer a comprehensive comparative study of GST protein evolution and sequence architecture, providing valuable insights into the functional implications of sequence variation and domain-specific conservation across species.
3.5. Ka/Ks Analysis of GST Gene Sequences
The Ka/Ks analysis of GST genes in Crocus sativus provided valuable insights into the evolutionary pressures shaping this gene family. Most gene pairs exhibited Ka/Ks ratios smaller than 1, indicating strong purifying selection that maintains the functional integrity of these genes. This suggests that most GST genes have evolved under constraints to preserve their essential roles in stress response and detoxification pathways. Gene pairs with Ka/Ks ratios greater than 1 indicated positive selection, suggesting adaptive changes to specific environmental or metabolic conditions. These gene pairs likely contribute to the functional diversity of the GST family by engaging in specialized functions or evolutionary divergence. Supplementary Table S4 presents the pairwise Ka/Ks values, highlighting the predominance of purifying selection and the occasional occurrence of positive selection within the Crocus sativus GST gene family. The table provides an evolutionary analysis of gene pairs, focusing on synonymous (KS) and nonsynonymous (KA) changes. The Ka/Ks ratio is used to assess the evolutionary pressure on these genes: values less than one indicate purifying (negative) selection, values around one suggest neutral evolution, and values greater than one indicate positive (diversifying) selection. Each gene pair is categorized according to its evolutionary selection type, such as "Negative or Purifying" or "Positive or Diversifying," to explain the origins of these genes within the species.
3.6. GST Genes Chromosomal Distribution
Figure 3 illustrates the distribution of GST genes across the eight chromosomes of Crocus sativus. While some chromosomes, particularly Chr1 and Chr2, contained a higher number of GST genes, others had fewer. On several chromosomes, genes were concentrated in specific regions, with notable hotspots observed on Chr8. These gene clusters likely reflect the results of gene duplication events, which may have facilitated the expansion and diversification of the GST gene family in Crocus sativus. The distribution pattern, with separate groups color-coded in the phenogram, also highlights the functional organization of GST genes. Group 1 (red), Group 2 (blue and purple), and Group 3 (green) suggest a potential functional or structural classification of the GST genes. These findings offer valuable insights into the evolutionary processes and genomic architecture of the GST gene family in Crocus sativus.
3.7. GST Proteins Subcellular Localization
Thesubcellular localization of GST proteins in Crocus sativus was analyzed using the WolfPsort tool, revealing diverse distributions across various cellular compartments, reflecting their multiple roles within the plant. Most GST proteins, including CSGST-1, CSGST-2, and CSGST-16, were predicted to localize primarily in the cytoplasm, supporting their involvement in detoxification and cellular redox maintenance.
Several GST proteins, such as CSGST-15 and CSGST-20, were predicted to localize in the vacuole, suggesting roles in the transport or sequestration of secondary metabolites. Proteins like CSGST-27 and CSGST-29 showed localization to the nucleus and mitochondria, implying potential regulatory functions or involvement in stress responses. Additionally, proteins such as CSGST-13 and CSGST-17 were predicted to be localized in the chloroplast, possibly linked to photosynthesis.
Supplementary Table S5 provides a detailed overview of the subcellular distribution of the CSGST genes, including their localization in the cytoplasm, nucleus, chloroplast, and mitochondria. The localization patterns of these proteins highlight their diverse functional roles in cellular metabolism and stress response pathways, with some proteins showing distribution across multiple compartments.
3.8. Physicochemical Characteristics of GST Proteins
The physicochemical properties of the GST proteins in Crocus sativus exhibited a range of structural and functional characteristics. The molecular weights of these GST proteins ranged from 20.49 kDa to 68.49 kDa, while the isoelectric points (pI) varied between 5.15 and 7.56, indicating a predominance of neutral to moderately acidic proteins. The Grand Average of Hydropathy (GRAVY) scores ranged from -0.281 to 0.143, suggesting that most GST proteins are hydrophilic, consistent with their enzymatic activity in aqueous environments. Based on subcellular localization predictions, most GST proteins were identified in the cytoplasm, with several showing dual localization to both the cytoplasm and chloroplast. These results highlight the functional diversity of GST proteins in Crocus sativus and suggest their potential roles in maintaining redox balance, responding to stress, and facilitating cellular detoxification processes. Supplementary Table S6 provides a comprehensive list of the molecular characteristics and subcellular localization of CSGST proteins, including Gene ID, protein molecular weight (kDa), isoelectric point (pI), GRAVY score, and predicted subcellular localization. While most of the CSGST proteins are expected to be cytoplasmic, others are predicted to localize in the chloroplast, mitochondria, nucleus, or plasma membrane, reflecting their specialized roles in cellular processes. Most of these proteins exhibit hydrophilic properties based on the GRAVY scores.
3.9. Alignment
The multiple sequence alignment (MSA) of GST proteins revealed highly conserved regions that correspond to their functional domains. Notably, conserved regions matched the N-terminal and C-terminal GST domains, highlighting their evolutionary importance in maintaining catalytic activity and structural integrity. Variations in non-conserved regions suggest functional diversity among the GST members. The alignment also highlighted unusual residue patterns in several sequences, which may indicate adaptations to specific biological activities or stress responses. The alignment is color-coded to emphasize conserved motifs and variants. Figure 4 presents the multiple sequence alignment (MSA) of protein sequences derived from CSGST genes. Various colors highlight conserved amino acid residues, with the letter height in the sequence logo reflecting the degree of conservation. The sequence logo underscores the critical conserved sections that are essential for protein activity, illustrating the frequency of specific amino acids at each position. This work provides a detailed analysis of structural elements, sequence conservation, and functional domains within the aligned sequences.
3.10. Hormone-Responsive Element Distribution in Promoter Regions
Analysis of the promoter regions of Crocus sativus GST genes revealed the presence of hormone-responsive cis-elements, including MEJA, ABRE, and GARE motifs, with varying distribution patterns. MEJA elements, which are linked to methyl jasmonate regulation, were the most abundant and prominently located in the upstream sequences of genes such as Csativus01200 (CSGST-14), Csativus27729 (CSGST-21), and Csativus51083 (CSGST-7), as illustrated in the distribution map (Figure 5). ABRE motifs, associated with abscisic acid response, were predominantly identified in genes like Csativus40095 (CSGST-26) and Csativus55558 (CSGST-52). Although less common, GARE motifs were also found in genes such as Csativus57966 (CSGST-16) and Csativus44106 (CSGST-27), indicating potential involvement in gibberellin-mediated regulation. The positioning and abundance of these motifs suggest their crucial role in regulating GST gene expression, contributing to plant stress responses and growth through complex hormonal signaling networks.
3.11. Protein Modeling and Functional Analysis of Glutathione S-Transferase Using Swiss-Model and PDBSum Tools
The structural modeling of the GST protein from Crocus sativus (sequence: MSNNGAGEEVKLLGLWASPYVIRARIALNIKGVDHEFLEETFGRKSDLLIESNPVYKKMPVLIHQGKTVCESMIIVQYIDDVWNSAKPSIVPSDPYELAMARFWAVYIDDNWTSSVIGMMRATTEEARVAAIEQAAKALQTLENAFEKHYKGKLFFGGEKIGYLDIALGSSVGWIGVLEKISGVTLLDEARTPQLMGWVARFWSQDVVRSVIPETDRFVEFSKEVFATRAAQAAK, Sequence length: 235 residues) was conducted with the template PDB ID 5g5e, corresponding to a Tau-class GST from Mangifera indica. This template, with 56.89% sequence identity and 96% query coverage, proved to be a reliable foundation for accurate structural representation. Structural analysis revealed two critical domains: an N-terminal domain facilitating substrate binding and a C-terminal domain regulating catalytic activity. These domains were visualized using the Swiss-Model platform and further validated with PDBSum annotations. Functional site analysis showed interactions between the GST protein and the ligand S-hexylglutathione, including 11 residues within a 4 Å radius that formed hydrogen bonds and hydrophobic interactions. Non-functional ligand di(hydroxyethyl) ether suggested additional binding sites in the active pocket. The modeled GST protein structure is homo-dimeric, with a QMEANDisCo global score of 0.80 ± 0.05, indicating excellent structural reliability. These findings provide valuable insights into the structural and functional characteristics of the GST protein. Figure 6 illustrates the structural and functional aspects of the Tau-class glutathione S-transferase (GST) from Mangifera indica, including: (a) a 3D structural representation, (b) the enzyme's role in detoxification via glutathione conjugation, (c) key conserved domains essential for GST function, (d) the secondary structure composed of β-sheets and α-helices, (e) the importance of two distinct structural domains in enzymatic activity, and (f) its involvement in redox homeostasis and detoxification pathways, as shown in the KEGG pathway for glutathione metabolism.
3.12. Glutathione S-Transferase (GST) Gene Expression Variations in Source and Sink Tissues During the Development of Saffron (Crocus sativus L.) Corms
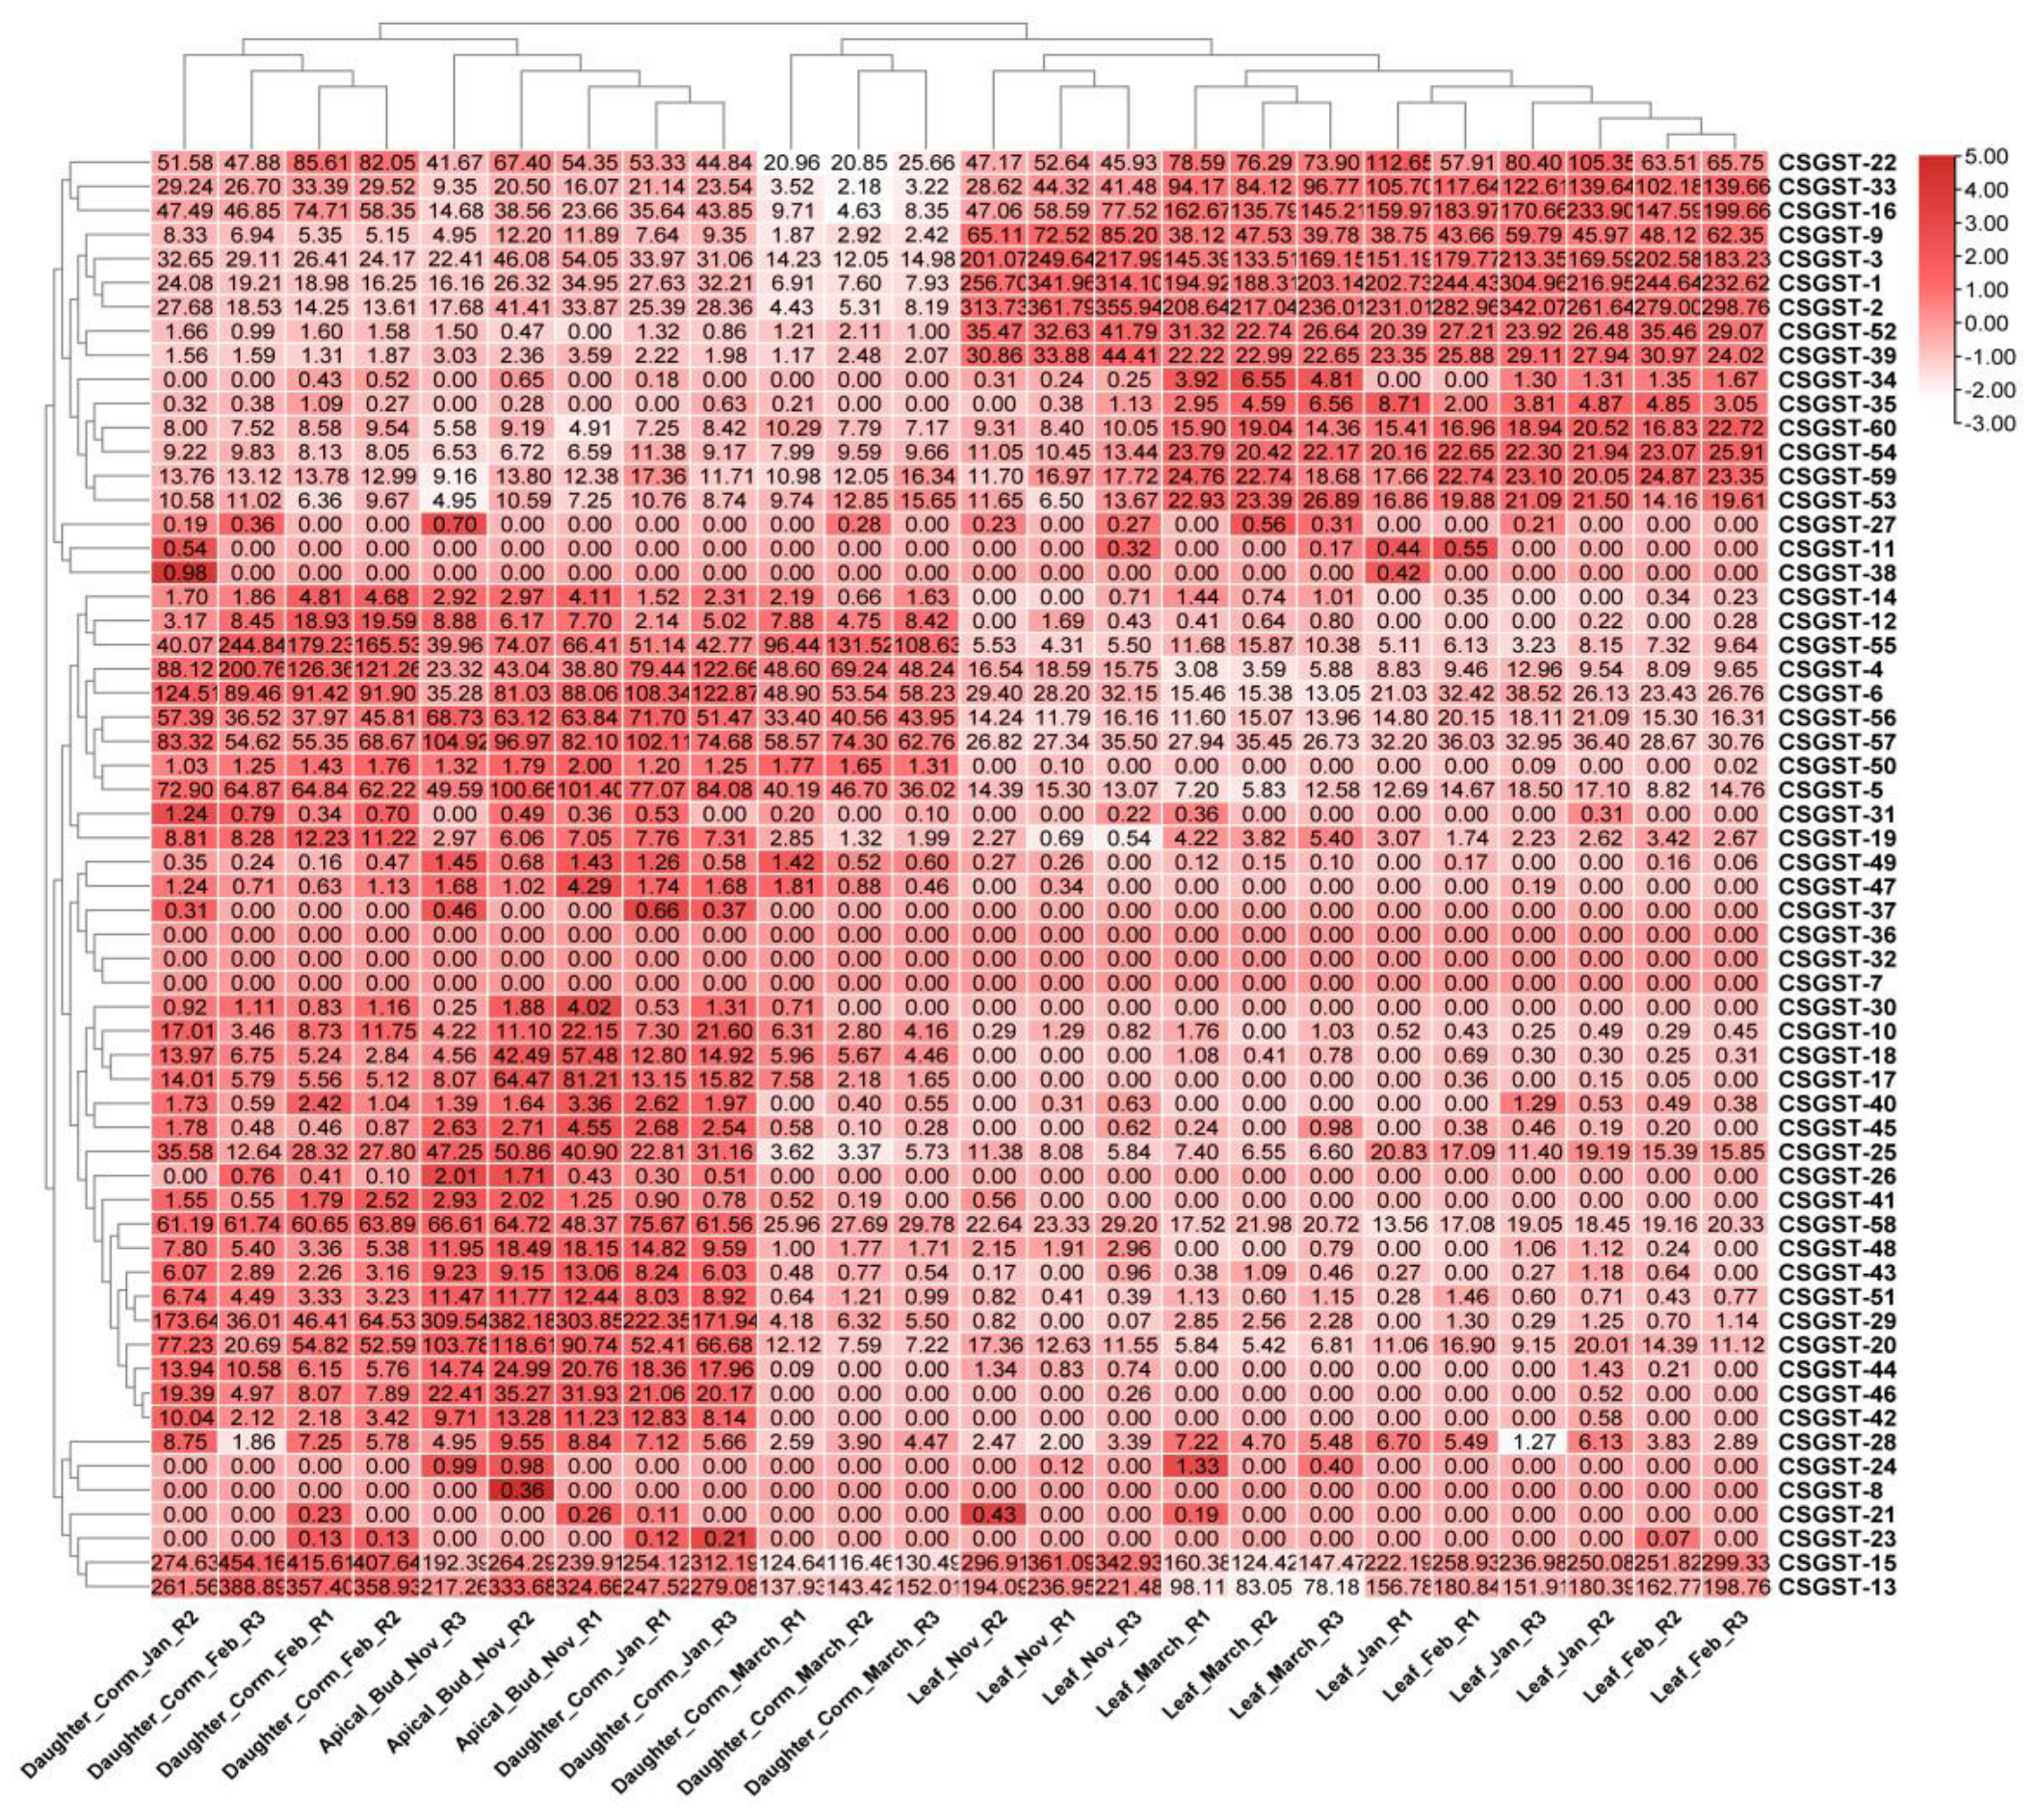
The analysis of RNA-Seq data revealed significant differential expression of GST genes between source (leaf) and sink (corm) tissues in saffron. A subset of GST genes was notably upregulated in corm tissues, particularly during the bulking and maturation phases, indicating their involvement in key metabolic and stress response pathways critical for corm development. In contrast, GST gene expression in leaf tissues exhibited varied patterns, with some genes showing increased expression during the early stages of corm development. The heatmap visualization in Figure 7 illustrates the differential expression levels of GST genes, with red hues representing upregulated genes, and expression values ranging from -3.00 to +5.00, reflecting the extent of gene regulation across different samples. These findings underscore the essential role of GST genes in the molecular regulation of saffron corm growth, particularly in relation to environmental stress and metabolic demands.
4. Discussion
The findings of this study provide a comprehensive understanding of the GST gene family in Crocus sativus, offering significant insights into their role in plant stress responses and secondary metabolism. The identification of 60 GST genes with conserved GST_N and GST_C domains supports the hypothesis that these genes are crucial for secondary metabolites transport and detoxification, functions well-documented in other plant species such as Arabidopsis thaliana and Vitis vinifera [55]. The observed gene duplications align with previous studies, suggesting that these duplications contribute to the functional diversity of GSTs in response to environmental stresses [19]. Additionally, the presence of hormone-responsive motifs in the promoters of GST genes indicates their potential involvement in mediating hormone-regulated stress responses. This role is further supported by studies of other plants susceptible to abiotic stresses, such as oxidative damage and drought. The subcellular localization analysis confirms the involvement of many GSTs in cellular detoxification systems, with several proteins detected in the cytoplasm, chloroplasts, and vacuoles. Based on their localization patterns, which suggest various plant functions, it is hypothesized that GSTs may play roles beyond stress responses, including in the transport of secondary metabolites and other cellular processes.
The localization pattern of GSTs, along with their diverse functions in plants, supports the hypothesis that these enzymes participate in cellular processes beyond stress regulation, including the synthesis and transport of secondary metabolites. Phylogenetic analysis of the GST family revealed both conserved and species-specific evolutionary patterns, suggesting that while certain functions are conserved across plant species, the Crocussativus GSTs may have evolved specific roles contributing to the plant's unique biochemical pathways, such as the biosynthesis of crocin. From an agricultural perspective, these findings provide valuable insights into the molecular mechanisms that could be harnessed to enhance saffron's stress tolerance and productivity, essential for sustaining its high-value cultivation amid changing climatic conditions. The identification of conserved functional domains involved in stress responses and detoxification pathways opens avenues for future research aimed at genetically improving saffron’s resilience. Functional validation of these GSTs through gene-editing technologies like CRISPR, along with investigations into their interactions with other stress-related proteins, should be a priority for future studies. Furthermore, exploring the role of GSTs in the biosynthesis of crocin and other bioactive compounds could help optimize saffron cultivation and maximize the production of these valuable metabolites.
5. Conclusions
This comprehensive study focused on the identification, annotation, and functional analysis of glutathione S-transferase (GST) genes in Crocus sativus. Sixty GST genes were identified through genome-wide searches and categorized into distinct subfamilies based on conserved domains, motif characteristics, and evolutionary relationships. Chromosomal distribution analysis revealed clustering of GST genes, indicating gene duplication events. Ka/Ks analysis suggested that purifying selection is the primary evolutionary driver, with sporadic positive selection pointing to functional diversity. Promoter analysis uncovered hormone-responsive cis-elements, including MEJA, ABRE, and GARE, highlighting the role of GST genes in hormone-mediated stress responses. Predictions regarding subcellular localization showed that GST proteins are predominantly localized in the cytoplasm, with occasional presence in the nucleus, vacuole, or chloroplast, emphasizing their versatile functions. The structural characteristics of a GST protein were analyzed using the Swiss-Model platform and PDBSum tools, revealing the N-terminal and C-terminal domains responsible for substrate binding and catalytic activity. The reliability of the model was confirmed through ligand interaction analysis, which identified key residues involved in functional connections. These findings enhance our understanding of the structure, evolution, and function of GST genes in Crocus sativus, and open new avenues for research on GST-mediated stress tolerance, plant growth, and the enhancement of crop resilience and secondary metabolite synthesis.
Supplementary Materials
The following supporting information can be downloaded at the website of this paper posted on Preprints.org., Table S1: Genomic Information of Crocus sativus GST Genes; Table S2: Glutathione S-transferase Genes in Crocus sativus; Table S3: Motif Sequences and Widths; Table S4: Evolutionary Analysis of GST Gene Family in Crocus sativus; Table S5: Subcellular Distribution of CSGST Genes; Table S6: Overview of CSGST Proteins.
Author Contributions
Conceptualization, M.B., X.Z., X.L and A.Z.; methodology, M.B. and A.Z.; software, M.B., A.Z.; validation, M.B.; writing—original draft preparation, M.B.; writing—review and editing, M.B., A.Z., K.H. and E.H.S.; visualization, X.Z., F.L. and A.Z.; supervision, X.Z.; project administration, X.Z.; funding acquisition, X.Z. All authors have read and agreed to the published version of the manuscript.
Funding
This research was funded by the International Science and Technology Cooperation Program of Hubei Province (2023EHA048), the National Natural Science Foundation of China (32070682, 32200504), and CAS Pioneer Hundred Talents Program.
Data Availability Statement
Raw reads used in this work were deposited in NCBI Bio-Project under the accession numbers PRJNA976833.
Acknowledgments
We would like to thank the members of the Bioinformatics Group of Wuhan Botanical Garden, Chinese Academy of Sciences for the discussion and suggestions to improve the manuscript.
Conflicts of Interest
The authors declare no conflicts of interest.
References
- Dixon, D.P.; Lapthorn, A.; Edwards, R. Plant glutathione transferases. Genome Biol. 2002, 3, reviews3004.1. [Google Scholar] [CrossRef]
- Frear, D.; Swanson, H. Biosynthesis of S-(4-ethylamino-6-isopropylamino- 2-s-triazino) glutathione: Partial purification and properties of a glutathione S-transferase from corn. Phytochemistry 1970, 9, 2123–2132. [Google Scholar] [CrossRef]
- Sylvestre-Gonon, E.; Law, S.R.; Schwartz, M.; Robe, K.; Keech, O.; Didierjean, C.; Dubos, C.; Rouhier, N.; Hecker, A. Functional, Structural and Biochemical Features of Plant Serinyl-Glutathione Transferases. Front. Plant Sci. 2019, 10, 608. [Google Scholar] [CrossRef]
- Dixon, D.P.; Edwards, R. Roles for Stress-inducible Lambda Glutathione Transferases in Flavonoid Metabolism in Plants as Identified by Ligand Fishing. J. Biol. Chem. 2010, 285, 36322–36329. [Google Scholar] [CrossRef]
- Kitamura, S.; Shikazono, N.; Tanaka, A. TRANSPARENT TESTA 19 is involved in the accumulation of both anthocyanins and proanthocyanidins in Arabidopsis. Plant J. 2003, 37, 104–114. [Google Scholar] [CrossRef]
- Lallement, P.-A. , et al., Structural and enzymatic insights into Lambda glutathione transferases from Populus trichocarpa, monomeric enzymes constituting an early divergent class specific to terrestrial plants. Biochemical Journal, 2014. 462(1): p. 39-52.
- Hasan, M.S. , et al., Genome-wide identification and expression profiling of glutathione S-transferase family under multiple abiotic and biotic stresses in Medicago truncatula L. PLoS one, 2021. 16(2): p. e0247170.
- Dong, Y.; Li, C.; Zhang, Y.; He, Q.; Daud, M.K.; Chen, J.; Zhu, S. Glutathione S-Transferase Gene Family in Gossypium raimondii and G. arboreum: Comparative Genomic Study and their Expression under Salt Stress. Front. Plant Sci. 2016, 7, 139. [Google Scholar] [CrossRef]
- Dixon, D.P.; Hawkins, T.; Hussey, P.J.; Edwards, R. Enzyme activities and subcellular localization of members of the Arabidopsis glutathione transferase superfamily. J. Exp. Bot. 2009, 60, 1207–1218. [Google Scholar] [CrossRef]
- Moons, A. Regulatory and Functional Interactions of Plant Growth Regulators and Plant Glutathione S-Transferases (GSTs). Vitam. Horm. 2005, 72, 155–202. [Google Scholar] [CrossRef]
- Edwards, R. and D.P. Dixon, Plant glutathione transferases. Methods in enzymology, 2005. 401: p. 169-186.
- Basantani, M. and A. Srivastava, Plant glutathione transferases—a decade falls short. Botany, 2007. 85(5): p. 443-456.
- Liu, Y.-J.; Han, X.-M.; Ren, L.-L.; Yang, H.-L.; Zeng, Q.-Y. Functional Divergence of the Glutathione S-Transferase Supergene Family in Physcomitrella patens Reveals Complex Patterns of Large Gene Family Evolution in Land Plants. Plant Physiol. 2012, 161, 773–786. [Google Scholar] [CrossRef]
- Jain, M.; Ghanashyam, C.; Bhattacharjee, A. Comprehensive expression analysis suggests overlapping and specific roles of rice glutathione S-transferase genes during development and stress responses. BMC Genom. 2010, 11, 73–73. [Google Scholar] [CrossRef]
- Lan, T.; Yang, Z.-L.; Yang, X.; Liu, Y.-J.; Wang, X.-R.; Zeng, Q.-Y. Extensive Functional Diversification of thePopulusGlutathioneS-Transferase Supergene Family. Plant Cell 2009, 21, 3749–3766. [Google Scholar] [CrossRef] [PubMed]
- French, C.E.; Bell, J.M.L.; Ward, F.B. Diversity and distribution of hemerythrin-like proteins in prokaryotes. FEMS Microbiol. Lett. 2008, 279, 131–145. [Google Scholar] [CrossRef] [PubMed]
- Roxas, V.P.; Lodhi, S.A.; Garrett, D.K.; Mahan, J.R.; Allen, R.D. Stress Tolerance in Transgenic Tobacco Seedlings that Overexpress Glutathione S-Transferase/Glutathione Peroxidase. Plant Cell Physiol. 2000, 41, 1229–1234. [Google Scholar] [CrossRef] [PubMed]
- Csiszár, J.; Horváth, E.; Váry, Z.; Gallé, Á.; Bela, K.; Brunner, S.; Tari, I. Glutathione transferase supergene family in tomato: Salt stress-regulated expression of representative genes from distinct GST classes in plants primed with salicylic acid. Plant Physiol. Biochem. 2014, 78, 15–26. [Google Scholar] [CrossRef]
- Marrs, K.A. THE FUNCTIONS AND REGULATION OF GLUTATHIONE S-TRANSFERASES IN PLANTS. Annu. Rev. Plant Biol. 1996, 47, 127–158. [Google Scholar] [CrossRef]
- Smith, A.P. , et al., Arabidopsis AtGSTF2 is regulated by ethylene and auxin, and encodes a glutathione S-transferase that interacts with flavonoids. The Plant Journal, 2003. 36(4): p. 433-442.
- Gonneau, M.; Mornet, R.; Laloue, M. A Nicotiana plumbaginifolia protein labeled with an azido cytokinin agonist is a glutathione S-transferase. Physiol. Plant. 1998, 103, 114–124. [Google Scholar] [CrossRef]
- Dixon, D.P.; Lapthorn, A.; Madesis, P.; Mudd, E.A.; Day, A.; Edwards, R. Binding and Glutathione Conjugation of Porphyrinogens by Plant Glutathione Transferases. J. Biol. Chem. 2008, 283, 20268–20276. [Google Scholar] [CrossRef]
- Shen, M.; Zhao, D.-K.; Qiao, Q.; Liu, L.; Wang, J.-L.; Cao, G.-H.; Li, T.; Zhao, Z.-W. Identification of Glutathione S-Transferase (GST) Genes from a Dark Septate Endophytic Fungus (Exophiala pisciphila) and Their Expression Patterns under Varied Metals Stress. PLOS ONE 2015, 10, e0123418. [Google Scholar] [CrossRef]
- Sappl, P.G.; Carroll, A.J.; Clifton, R.; Lister, R.; Whelan, J.; Millar, A.H.; Singh, K.B. The Arabidopsis glutathione transferase gene family displays complex stress regulation and co-silencing multiple genes results in altered metabolic sensitivity to oxidative stress. Plant J. 2009, 58, 53–68. [Google Scholar] [CrossRef]
- Gunning, V.; Tzafestas, K.; Sparrow, H.; Johnston, E.J.; Brentnall, A.S.; Potts, J.R.; Rylott, E.L.; Bruce, N.C. Arabidopsis Glutathione Transferases U24 and U25 Exhibit a Range of Detoxification Activities with the Environmental Pollutant and Explosive, 2,4,6-Trinitrotoluene. Plant Physiol. 2014, 165, 854–865. [Google Scholar] [CrossRef]
- Xu, J.; Xing, X.-J.; Tian, Y.-S.; Peng, R.-H.; Xue, Y.; Zhao, W.; Yao, Q.-H. Transgenic Arabidopsis Plants Expressing Tomato Glutathione S-Transferase Showed Enhanced Resistance to Salt and Drought Stress. PLOS ONE 2015, 10, e0136960. [Google Scholar] [CrossRef] [PubMed]
- Sharma, R.; Sahoo, A.; Devendran, R.; Jain, M. Over-Expression of a Rice Tau Class Glutathione S-Transferase Gene Improves Tolerance to Salinity and Oxidative Stresses in Arabidopsis. PLOS ONE 2014, 9, e92900. [Google Scholar] [CrossRef] [PubMed]
- Soranzo, N.; Gorla, M.S.; Mizzi, L.; De Toma, G.; Frova, C. Organisation and structural evolution of the rice glutathione S-transferase gene family. Mol. Genet. Genom. 2004, 271, 511–521. [Google Scholar] [CrossRef] [PubMed]
- McGonigle, B.; Keeler, S.J.; Lau, S.-M.C.; Koeppe, M.K.; O'Keefe, D.P. A Genomics Approach to the Comprehensive Analysis of the Glutathione S-Transferase Gene Family in Soybean and Maize. Plant Physiol. 2000, 124, 1105–1120. [Google Scholar] [CrossRef]
- Islam, S.; Rahman, I.A.; Islam, T.; Ghosh, A. Genome-wide identification and expression analysis of glutathione S-transferase gene family in tomato: Gaining an insight to their physiological and stress-specific roles. PLOS ONE 2017, 12, e0187504–e0187504. [Google Scholar] [CrossRef]
- Islam, S.; Das Sajib, S.; Jui, Z.S.; Arabia, S.; Islam, T.; Ghosh, A. Genome-wide identification of glutathione S-transferase gene family in pepper, its classification, and expression profiling under different anatomical and environmental conditions. Sci. Rep. 2019, 9, 1–15. [Google Scholar] [CrossRef]
- Abdul Kayum, M. , et al., Genome-wide identification, characterization, and expression profiling of glutathione S-transferase (GST) family in pumpkin reveals likely role in cold-stress tolerance. Genes, 2018. 9(2): p. 84.
- Licciardello, C.; D’agostino, N.; Traini, A.; Recupero, G.R.; Frusciante, L.; Chiusano, M.L. Characterization of the glutathione S-transferase gene family through ESTs and expression analyses within common and pigmented cultivars of Citrus sinensis(L.) Osbeck. BMC Plant Biol. 2014, 14, 39–39. [Google Scholar] [CrossRef]
- Islam, M.S. , et al., Comprehensive genome-wide analysis of glutathione S-transferase gene family in potato (Solanum tuberosum L.) and their expression profiling in various anatomical tissues and perturbation conditions. Gene, 2018. 639: p. 149-162.
- Zhu, J.-H.; Li, H.-L.; Guo, D.; Wang, Y.; Dai, H.-F.; Mei, W.-L.; Peng, S.-Q. Transcriptome-wide identification and expression analysis of glutathione S-transferase genes involved in flavonoids accumulation in Dracaena cambodiana. Plant Physiol. Biochem. 2016, 104, 304–311. [Google Scholar] [CrossRef]
- Ye, J.; McGinnis, S.; Madden, T.L. BLAST: improvements for better sequence analysis. Nucleic Acids Res. 2006, 34, W6–W9. [Google Scholar] [CrossRef]
- Chen, C.J.; Chen, H.; Zhang, Y.; Thomas, H.R.; Frank, M.H.; He, Y.H.; Xia, R. TBtools: An Integrative Toolkit Developed for Interactive Analyses of Big Biological Data. Mol. Plant 2020, 13, 1194–1202. [Google Scholar] [CrossRef]
- Xu, Z.; Chen, S.; Wang, Y.; Tian, Y.; Wang, X.; Xin, T.; Li, Z.; Hua, X.; Tan, S.; Sun, W.; et al. Crocus genome reveals the evolutionary origin of crocin biosynthesis. Acta Pharm. Sin. B 2023, 14, 1878–1891. [Google Scholar] [CrossRef] [PubMed]
- Bateman, A. , et al., The Pfam protein families database. Nucleic acids research, 2004. 32(suppl_1): p. D138-D141.
- Letunic, I. , et al., SMART 4.0: towards genomic data integration. Nucleic acids research, 2004. 32(suppl_1): p. D142-D144.
- Pearson, W.R. , Using the FASTA program to search protein and DNA sequence databases. Computer Analysis of Sequence Data: Part I, 1994: p. 307-331.
- Li, K.-B. ClustalW-MPI: ClustalW analysis using distributed and parallel computing. Bioinformatics 2003, 19, 1585–1586. [Google Scholar] [CrossRef] [PubMed]
- Tamura, K.; Stecher, G.; Kumar, S. MEGA11: Molecular Evolutionary Genetics Analysis Version 11. Mol. Biol. Evol. 2021, 38, 3022–3027. [Google Scholar] [CrossRef]
- Hollingsworth, P.M.; A Ennos, R. Neighbour joining trees, dominant markers and population genetic structure. Heredity 2004, 92, 490–498. [Google Scholar] [CrossRef]
- Bailey, T.L. , et al., The MEME suite. Nucleic acids research, 2015. 43(W1): p. W39-W49.
- Horton, P.; Park, K.-J.; Obayashi, T.; Fujita, N.; Harada, H.; Adams-Collier, C.J.; Nakai, K. WoLF PSORT: protein localization predictor. Nucleic Acids Res. 2007, 35, W585–W587. [Google Scholar] [CrossRef]
- Duvaud, S.; Gabella, C.; Lisacek, F.; Stockinger, H.; Ioannidis, V.; Durinx, C. Expasy, the Swiss Bioinformatics Resource Portal, as designed by its users. Nucleic Acids Res. 2021, 49, W216–W227. [Google Scholar] [CrossRef]
- Lescot, M.; Déhais, P.; Thijs, G.; Marchal, K.; Moreau, Y.; Van de Peer, Y.; Rouzé, P.; Rombauts, S. PlantCARE, a database of plant cis-acting regulatory elements and a portal to tools for in silico analysis of promoter sequences. Nucleic Acids Res. 2002, 30, 325–327. [Google Scholar] [CrossRef]
- Kiefer, F.; Arnold, K.; Künzli, M.; Bordoli, L.; Schwede, T. The SWISS-MODEL Repository and associated resources. Nucleic Acids Res. 2009, 37, D387–D392. [Google Scholar] [CrossRef]
- Laskowski, R.A.; Jabłońska, J.; Pravda, L.; Vařeková, R.S.; Thornton, J. PDBsum: Structural summaries of PDB entries. Protein Sci. 2017, 27, 129–134. [Google Scholar] [CrossRef]
- Li, H. , Handsaker, B., Wysoker, A., Fennell, T., Ruan, J., Homer, N. The Sequence Alignment/Map format and SAMtools. Bioinformatics 2009, 25, 2078–2079. [Google Scholar] [CrossRef]
- Liao, Y.; Smyth, G.K.; Shi, W. feature Counts: An efficient general purpose program for assigning sequence reads to genomic features. Bioinformatics 2014, 30, 923–930. [Google Scholar] [CrossRef] [PubMed]
- Hu, B.; Zhao, J.; Lai, B.; Qin, Y.; Wang, H.; Hu, G. LcGST4 is an anthocyanin-related glutathione S-transferase gene in Litchi chinensis Sonn. Plant Cell Rep. 2016, 35, 831. [Google Scholar] [CrossRef] [PubMed]
- Ryu, H.Y.; Kim, S.Y.; Park, H.M.; You, J.Y.; Kim, B.H.; Lee, J.S.; Nam, K.H. Modulations of AtGSTF10 expression induce stress tolerance and BAK1-mediated cell death. Biochem. Biophys. Res. Commun. 2009, 379, 417–422. [Google Scholar] [CrossRef]
- Dixon, D.P.; Edwards, R. Selective Binding of Glutathione Conjugates of Fatty Acid Derivatives by Plant Glutathione Transferases. J. Biol. Chem. 2009, 284, 21249–21256. [Google Scholar] [CrossRef]
Figure 1.
Illustration of the evolutionary relationships among glutathione S-transferase (GST) protein sequences from various species, highlighting distinct isoforms and their phylogenetic groupings through a color-coded tree structure. The figure emphasizes structural and functional differences among protein variations, showcasing sequence homology and evolutionary diversification. Additionally, sequence logos for the C-terminal and N-terminal regions of GST proteins show amino acid distribution, highlighting both conserved and variable regions critical for catalytic function and structural integrity. Together, these visualizations provide insights into the evolution of GST proteins and the functional implications of sequence variation across species.
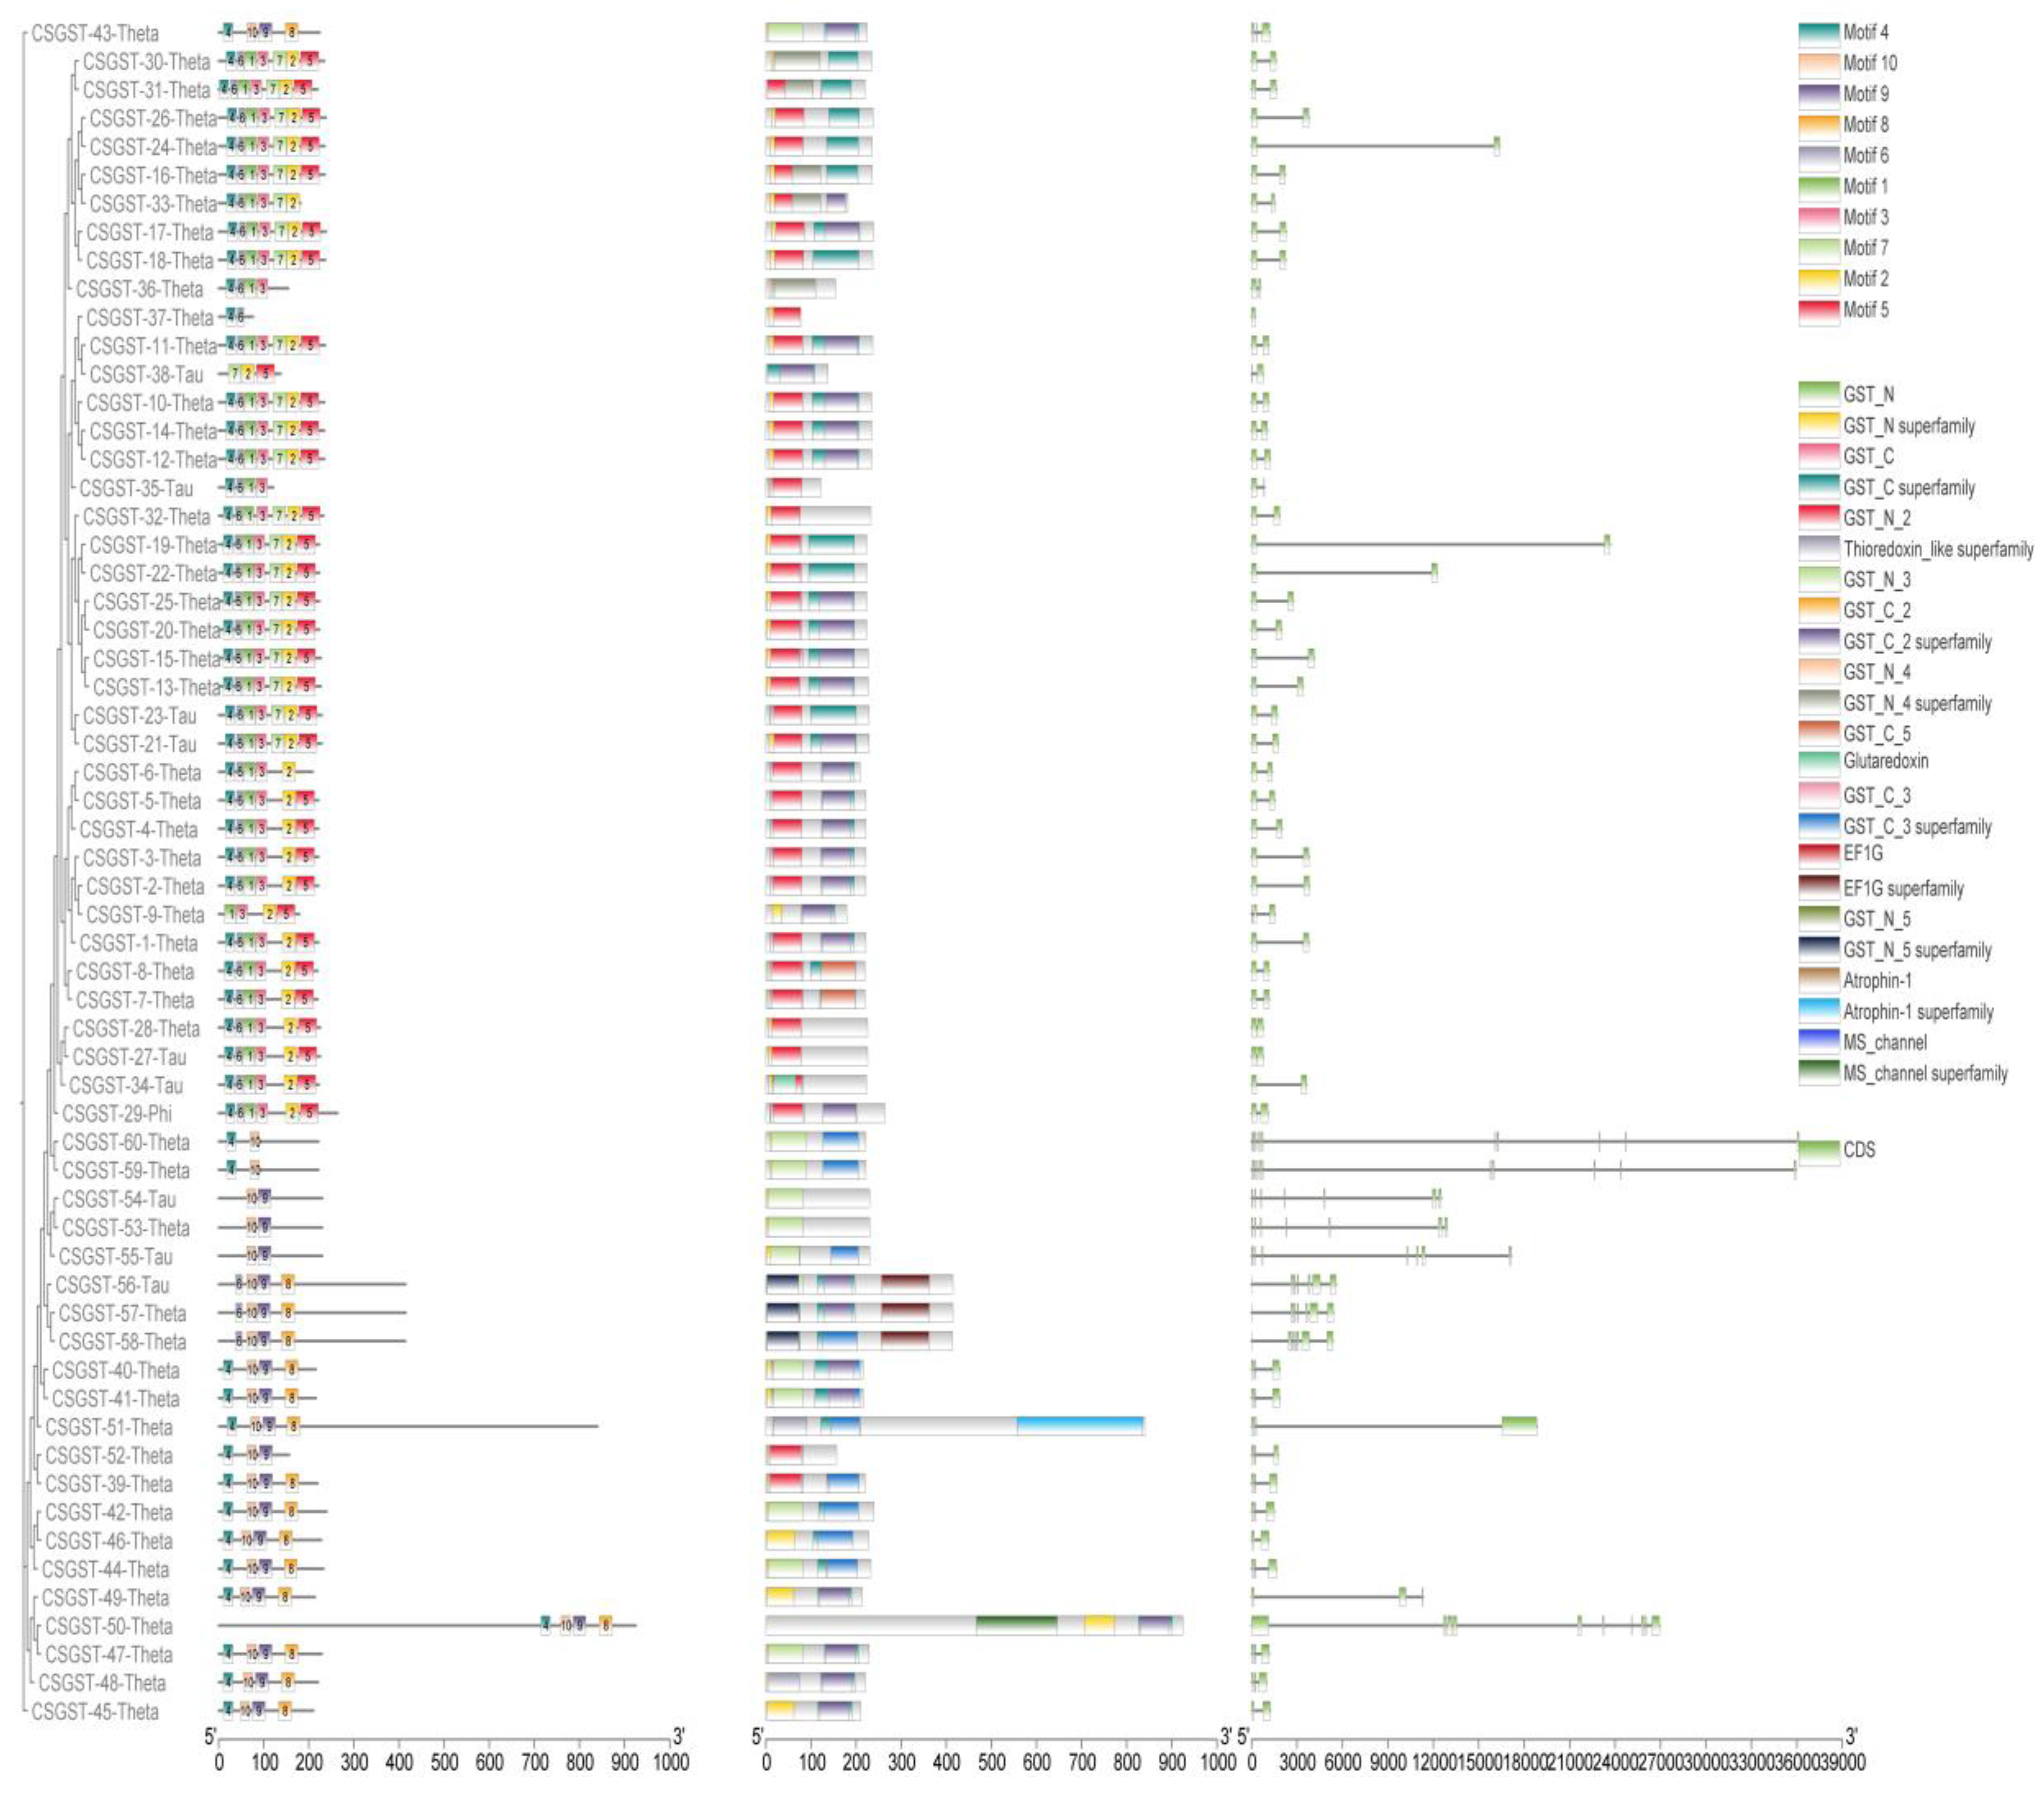
Figure 2.
Phylogenetic relationships and sequence logos of GST proteins, highlighting structural conservation and variation across species.(a)The evolutionary tree showing the relationships among glutathione S-transferase (GST) protein sequences from various species and isoforms, with phylogenetic groupings color-coded. (b) Sequence logos for the C-terminal and N-terminal regions of GST proteins, depicting amino acid distribution and frequency, emphasizing the conservation and variation critical for GST function and structure.Together, these visualizations provide insights into GST protein evolution and the implications of sequence variation across species.
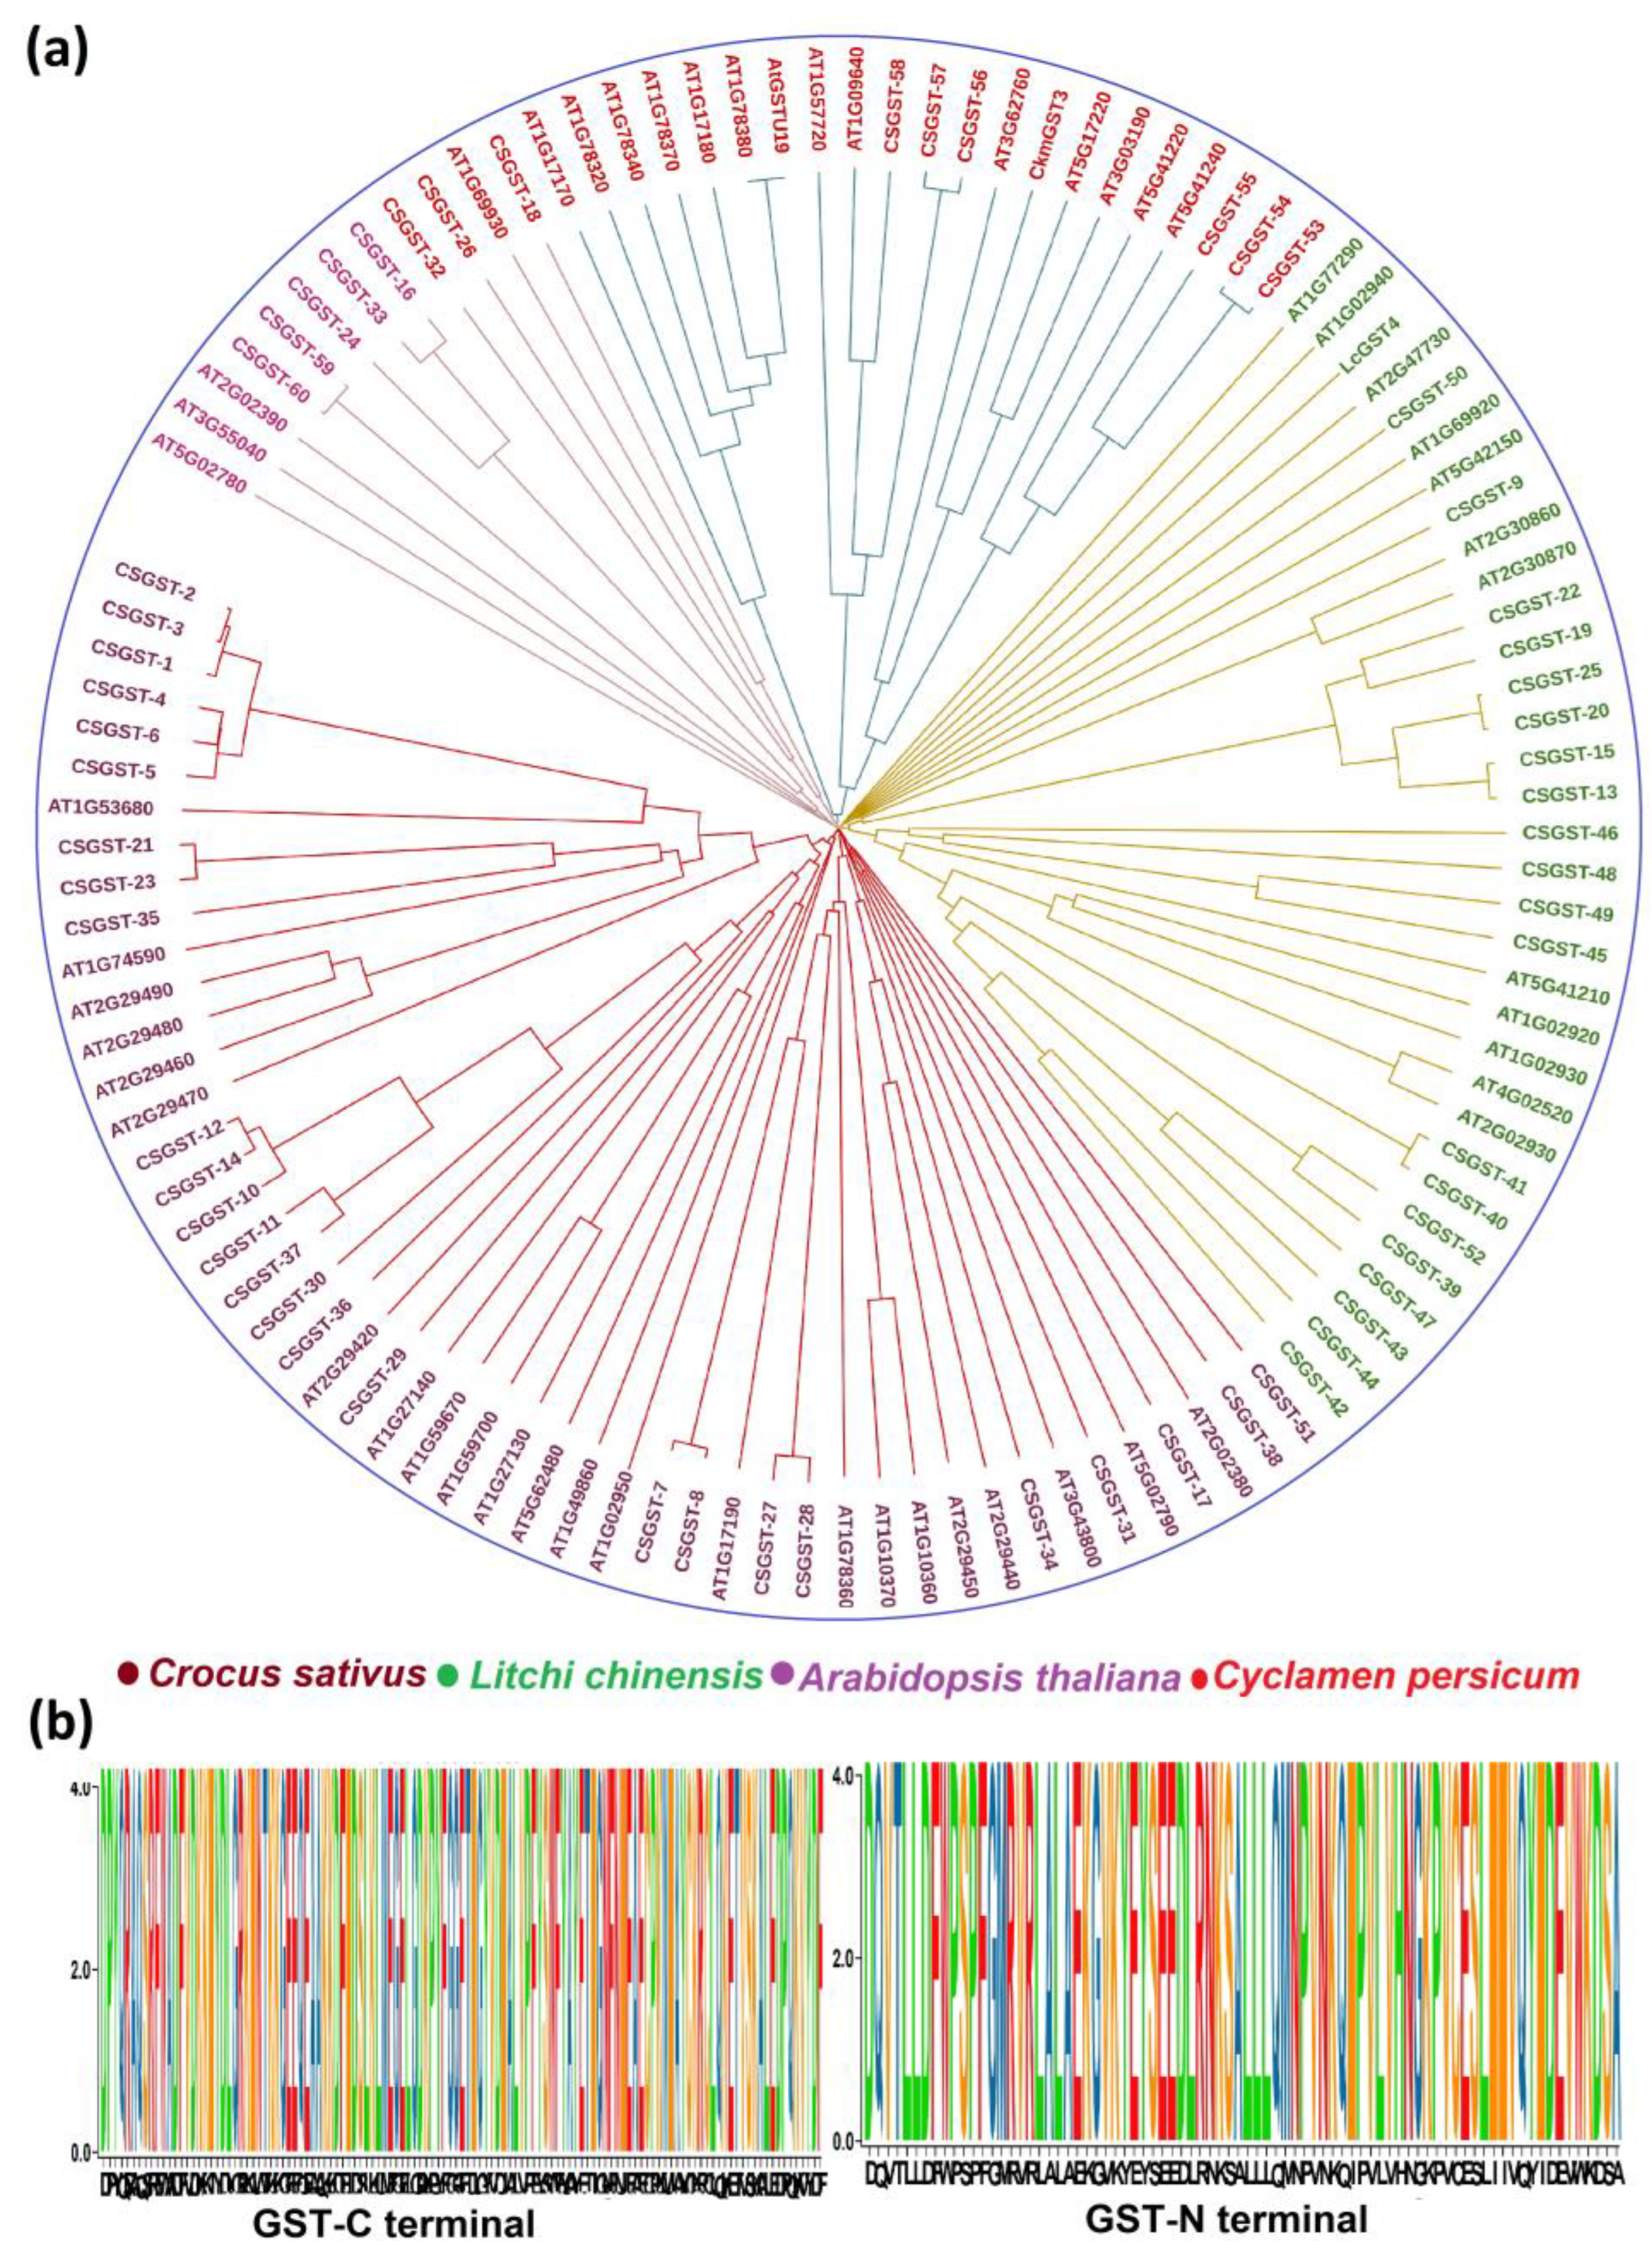
Figure 3.
Genomic distribution of GST (glutathione S-transferase) genes. This figure illustrates the distribution of GST genes across the eight chromosomes of Crocus sativus, with each chromosome (Chr 1 to Chr 8) represented as a vertical bar. The locations of GST genes are indicated by color-coded nodes, highlighting their positions and grouping. The gene arrangement on specific chromosomes suggests potential functional specialization or gene duplication events within the GST family. This visualization provides insight into the GST gene distribution and the overall genomic architecture of Crocus sativus.
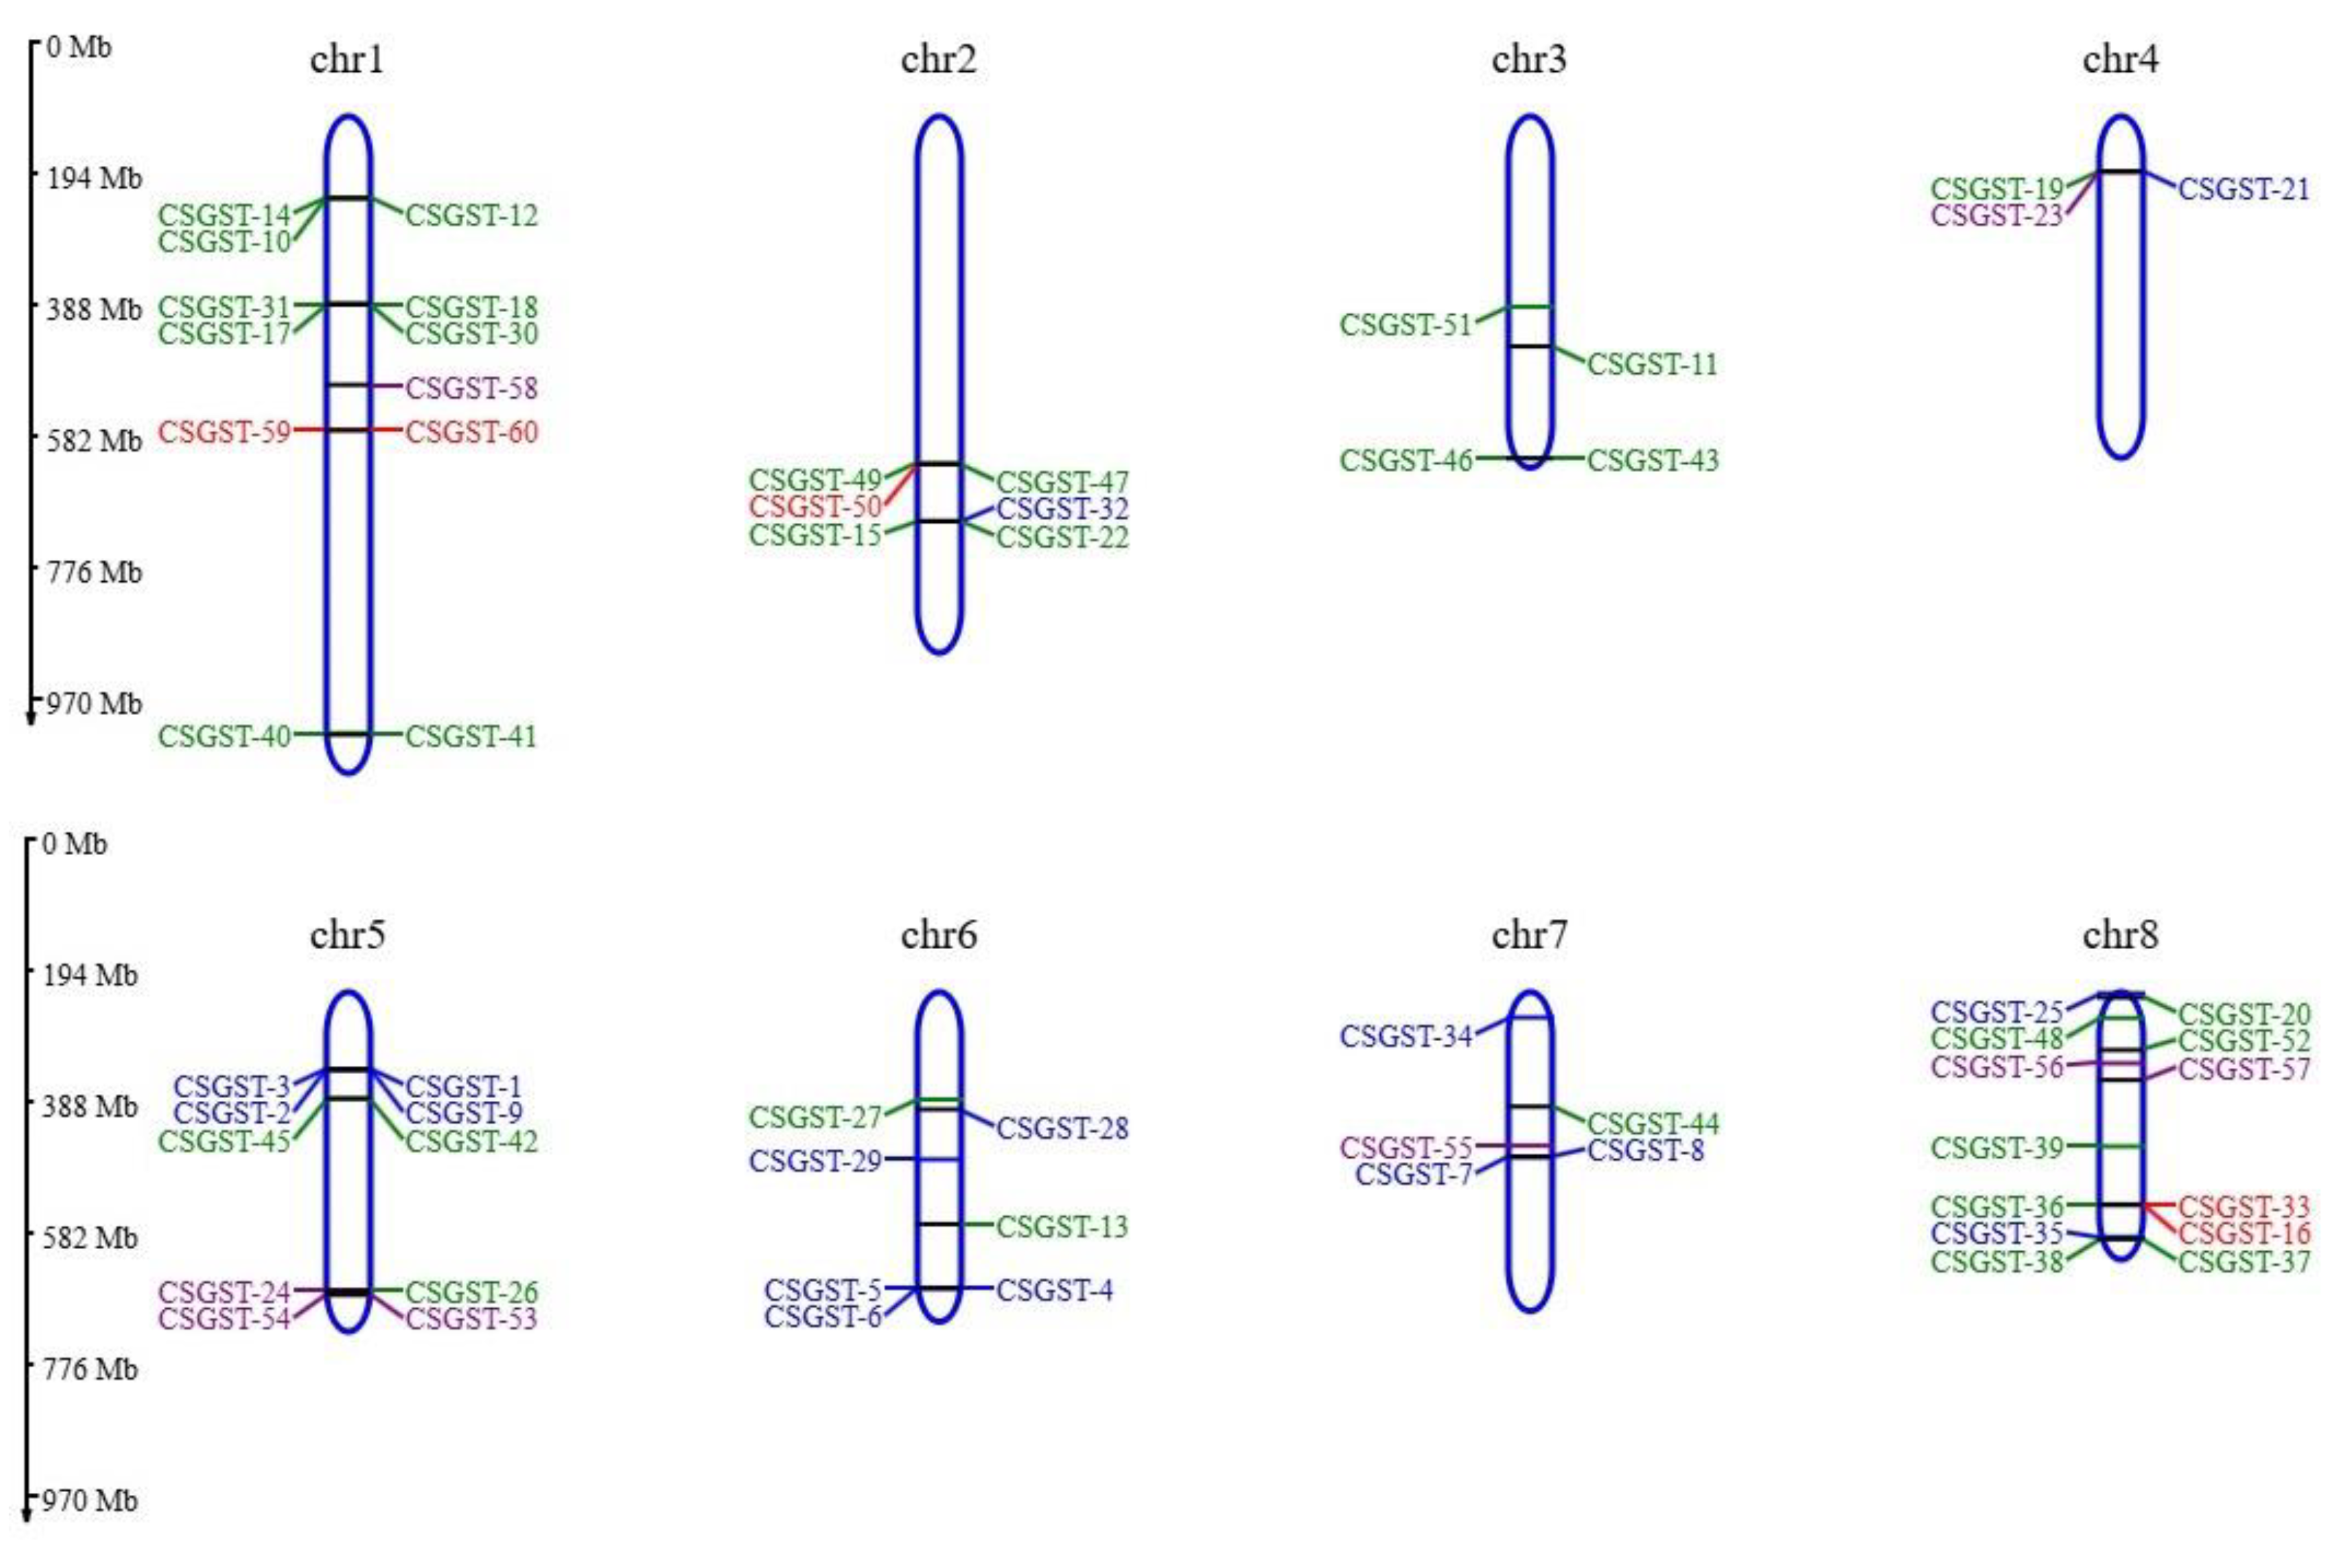
Figure 4.
Multiple sequence alignment (MSA) of protein sequences from CSGST Genes. This figure illustrates the multiple sequence alignment (MSA) of protein sequences derived from the CSGST gene family in Crocus sativus. The alignment highlights conserved motifs critical for GST protein function, with color-coding to emphasize the degree of conservation across different sequences. Variations in non-conserved regions are also indicated, suggesting potential functional divergence within the GST family. The sequence logo provides a quantitative representation of amino acid distribution, reflecting the evolutionary conservation and functional significance of specific residues in the protein structure.
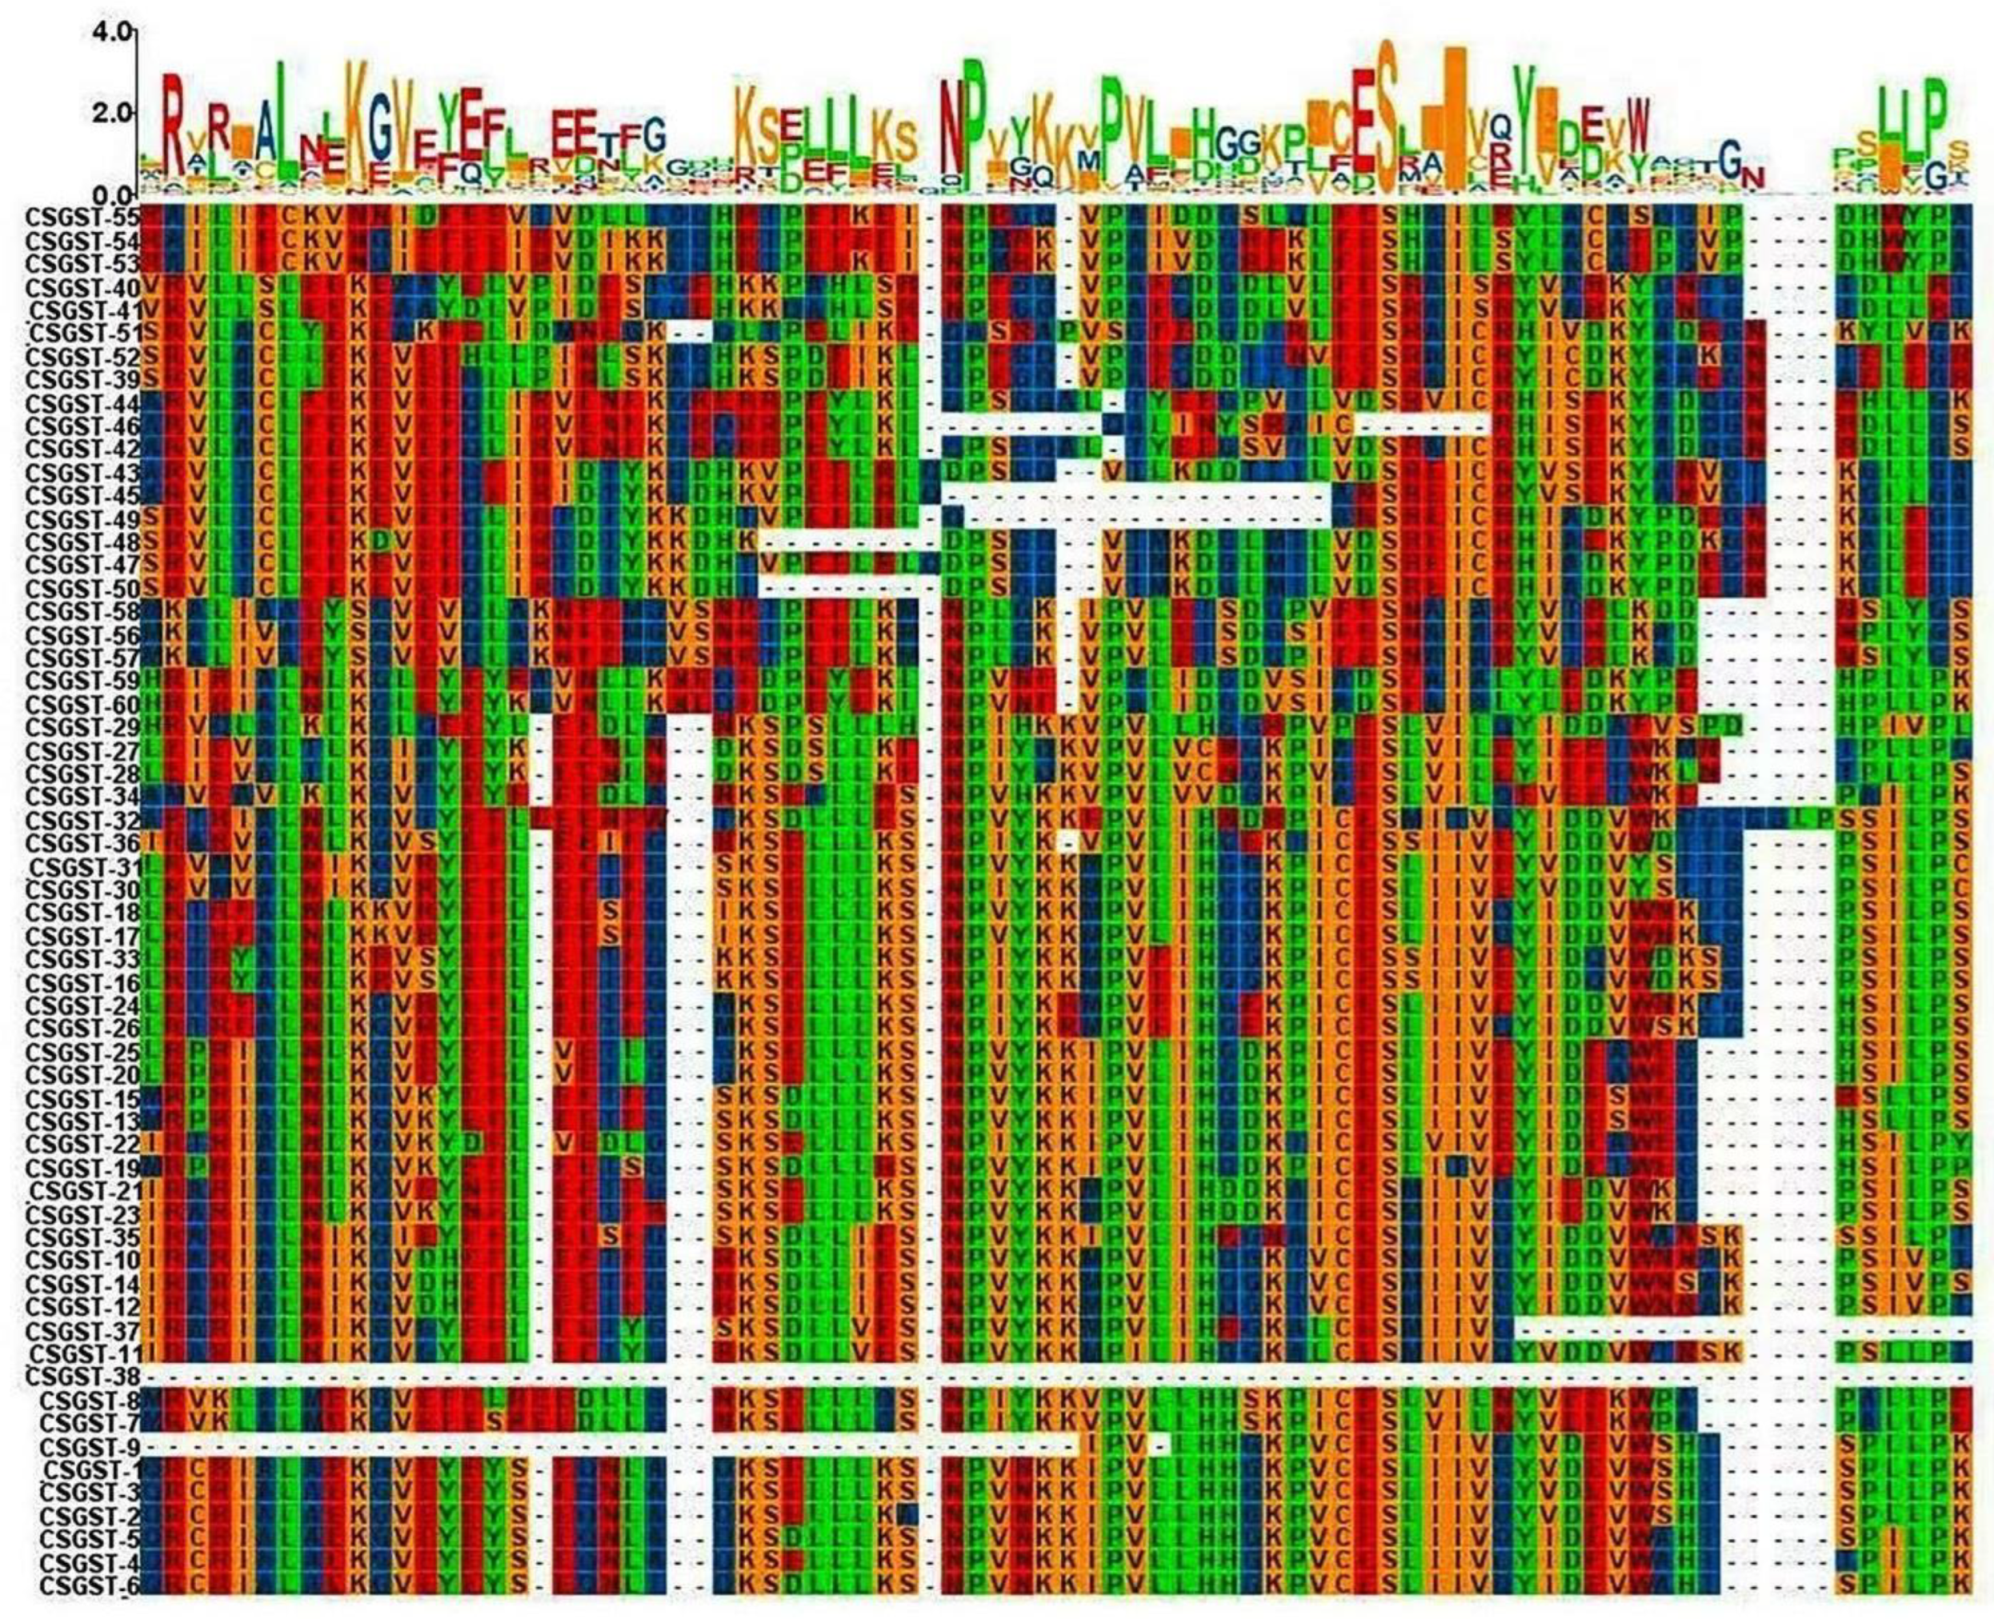
Figure 5.
Distribution of cis-regulatory elements (CREs) across Csativus genes. The positions of MEJA (methyl jasmonate-responsive, green), ABRE (abscisic acid-responsive, yellow), and GARE (gibberellin-responsive, blue) motifs are mapped along the gene sequences (0–1500 bp). The variation in CRE density and positioning highlights their potential role in regulating gene expression and hormonal control mechanisms.
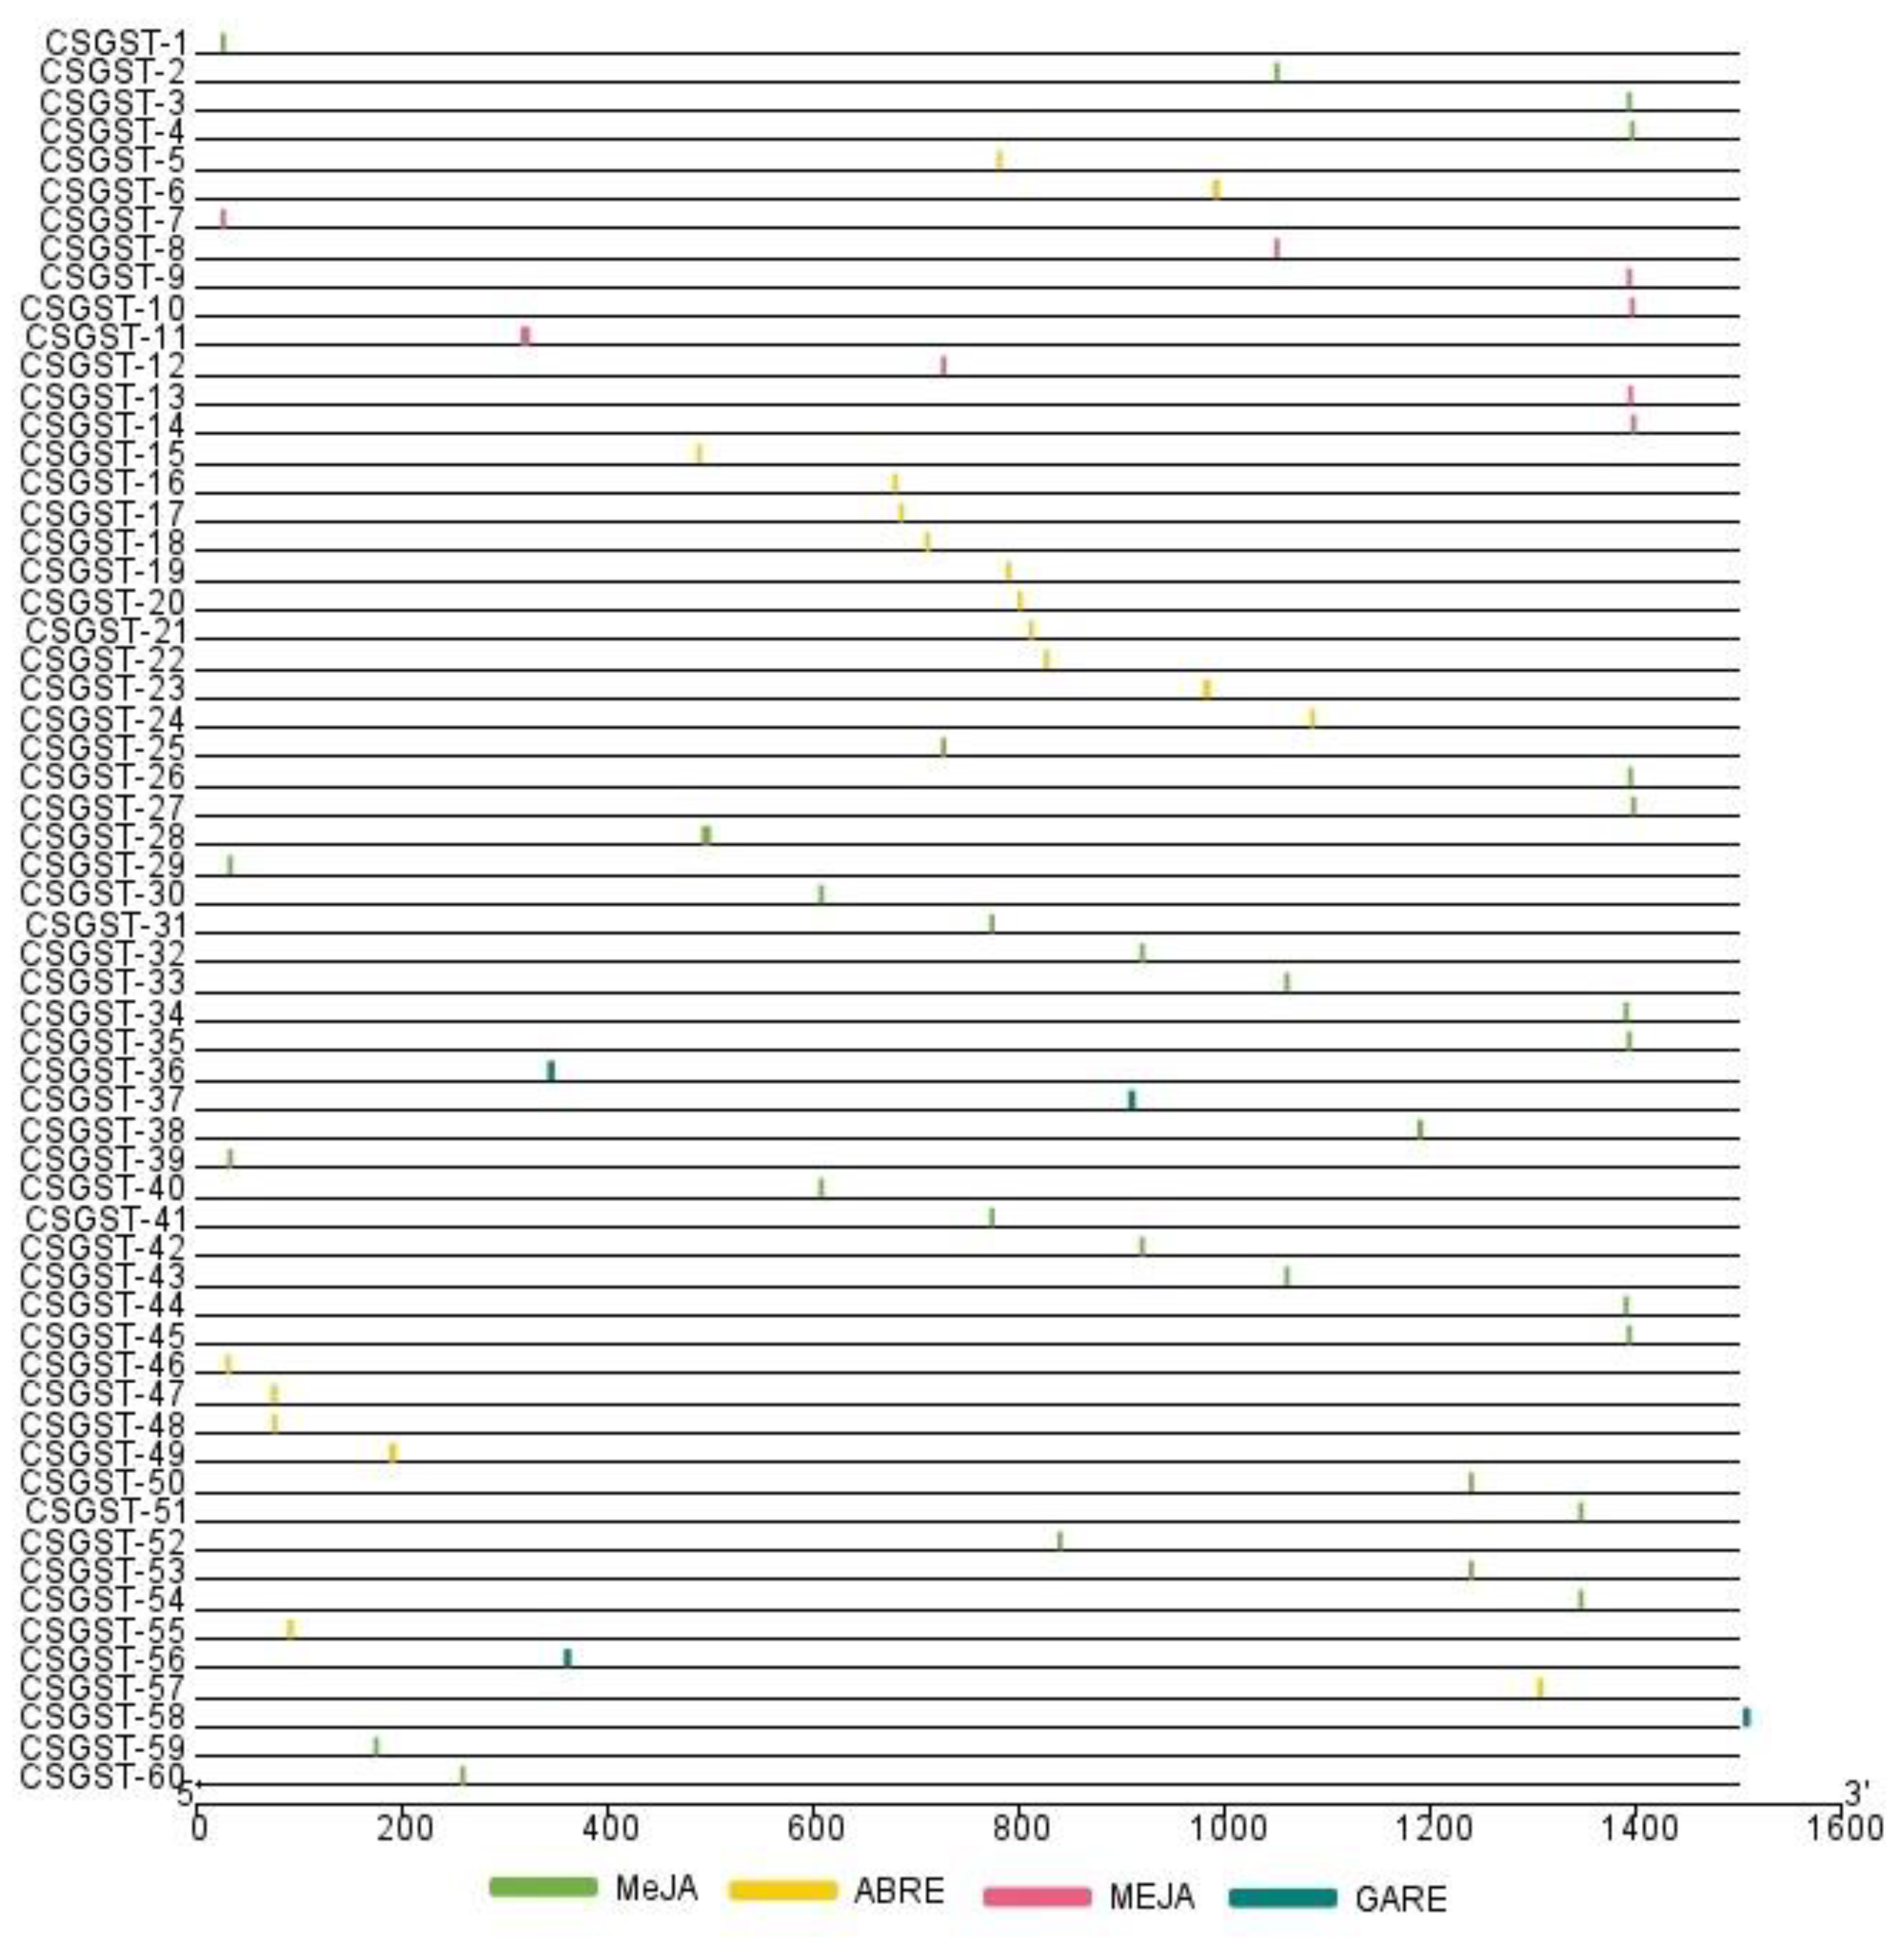
Figure 6.
Structural and functional analysis of Tau class glutathione S-transferase (GST) from Mangifera indica. (a) Three-dimensional structure of Tau-class glutathione S-transferase (GST) from Mangiferaindica. (b) Enzymatic activity of GST, catalyzing detoxification through glutathione conjugation. (c) Primary structure of the GST protein, showing the amino acid sequence. (d) Secondary structure of the GST protein, highlighting β-sheets and α-helices. (e) The enzyme’s domain architecture, emphasizing the importance of two distinct structural domains essential for its enzymatic activity. (b) The KEGG pathway for glutathione metabolism, illustrating the role of GST in redox homeostasis and detoxification.
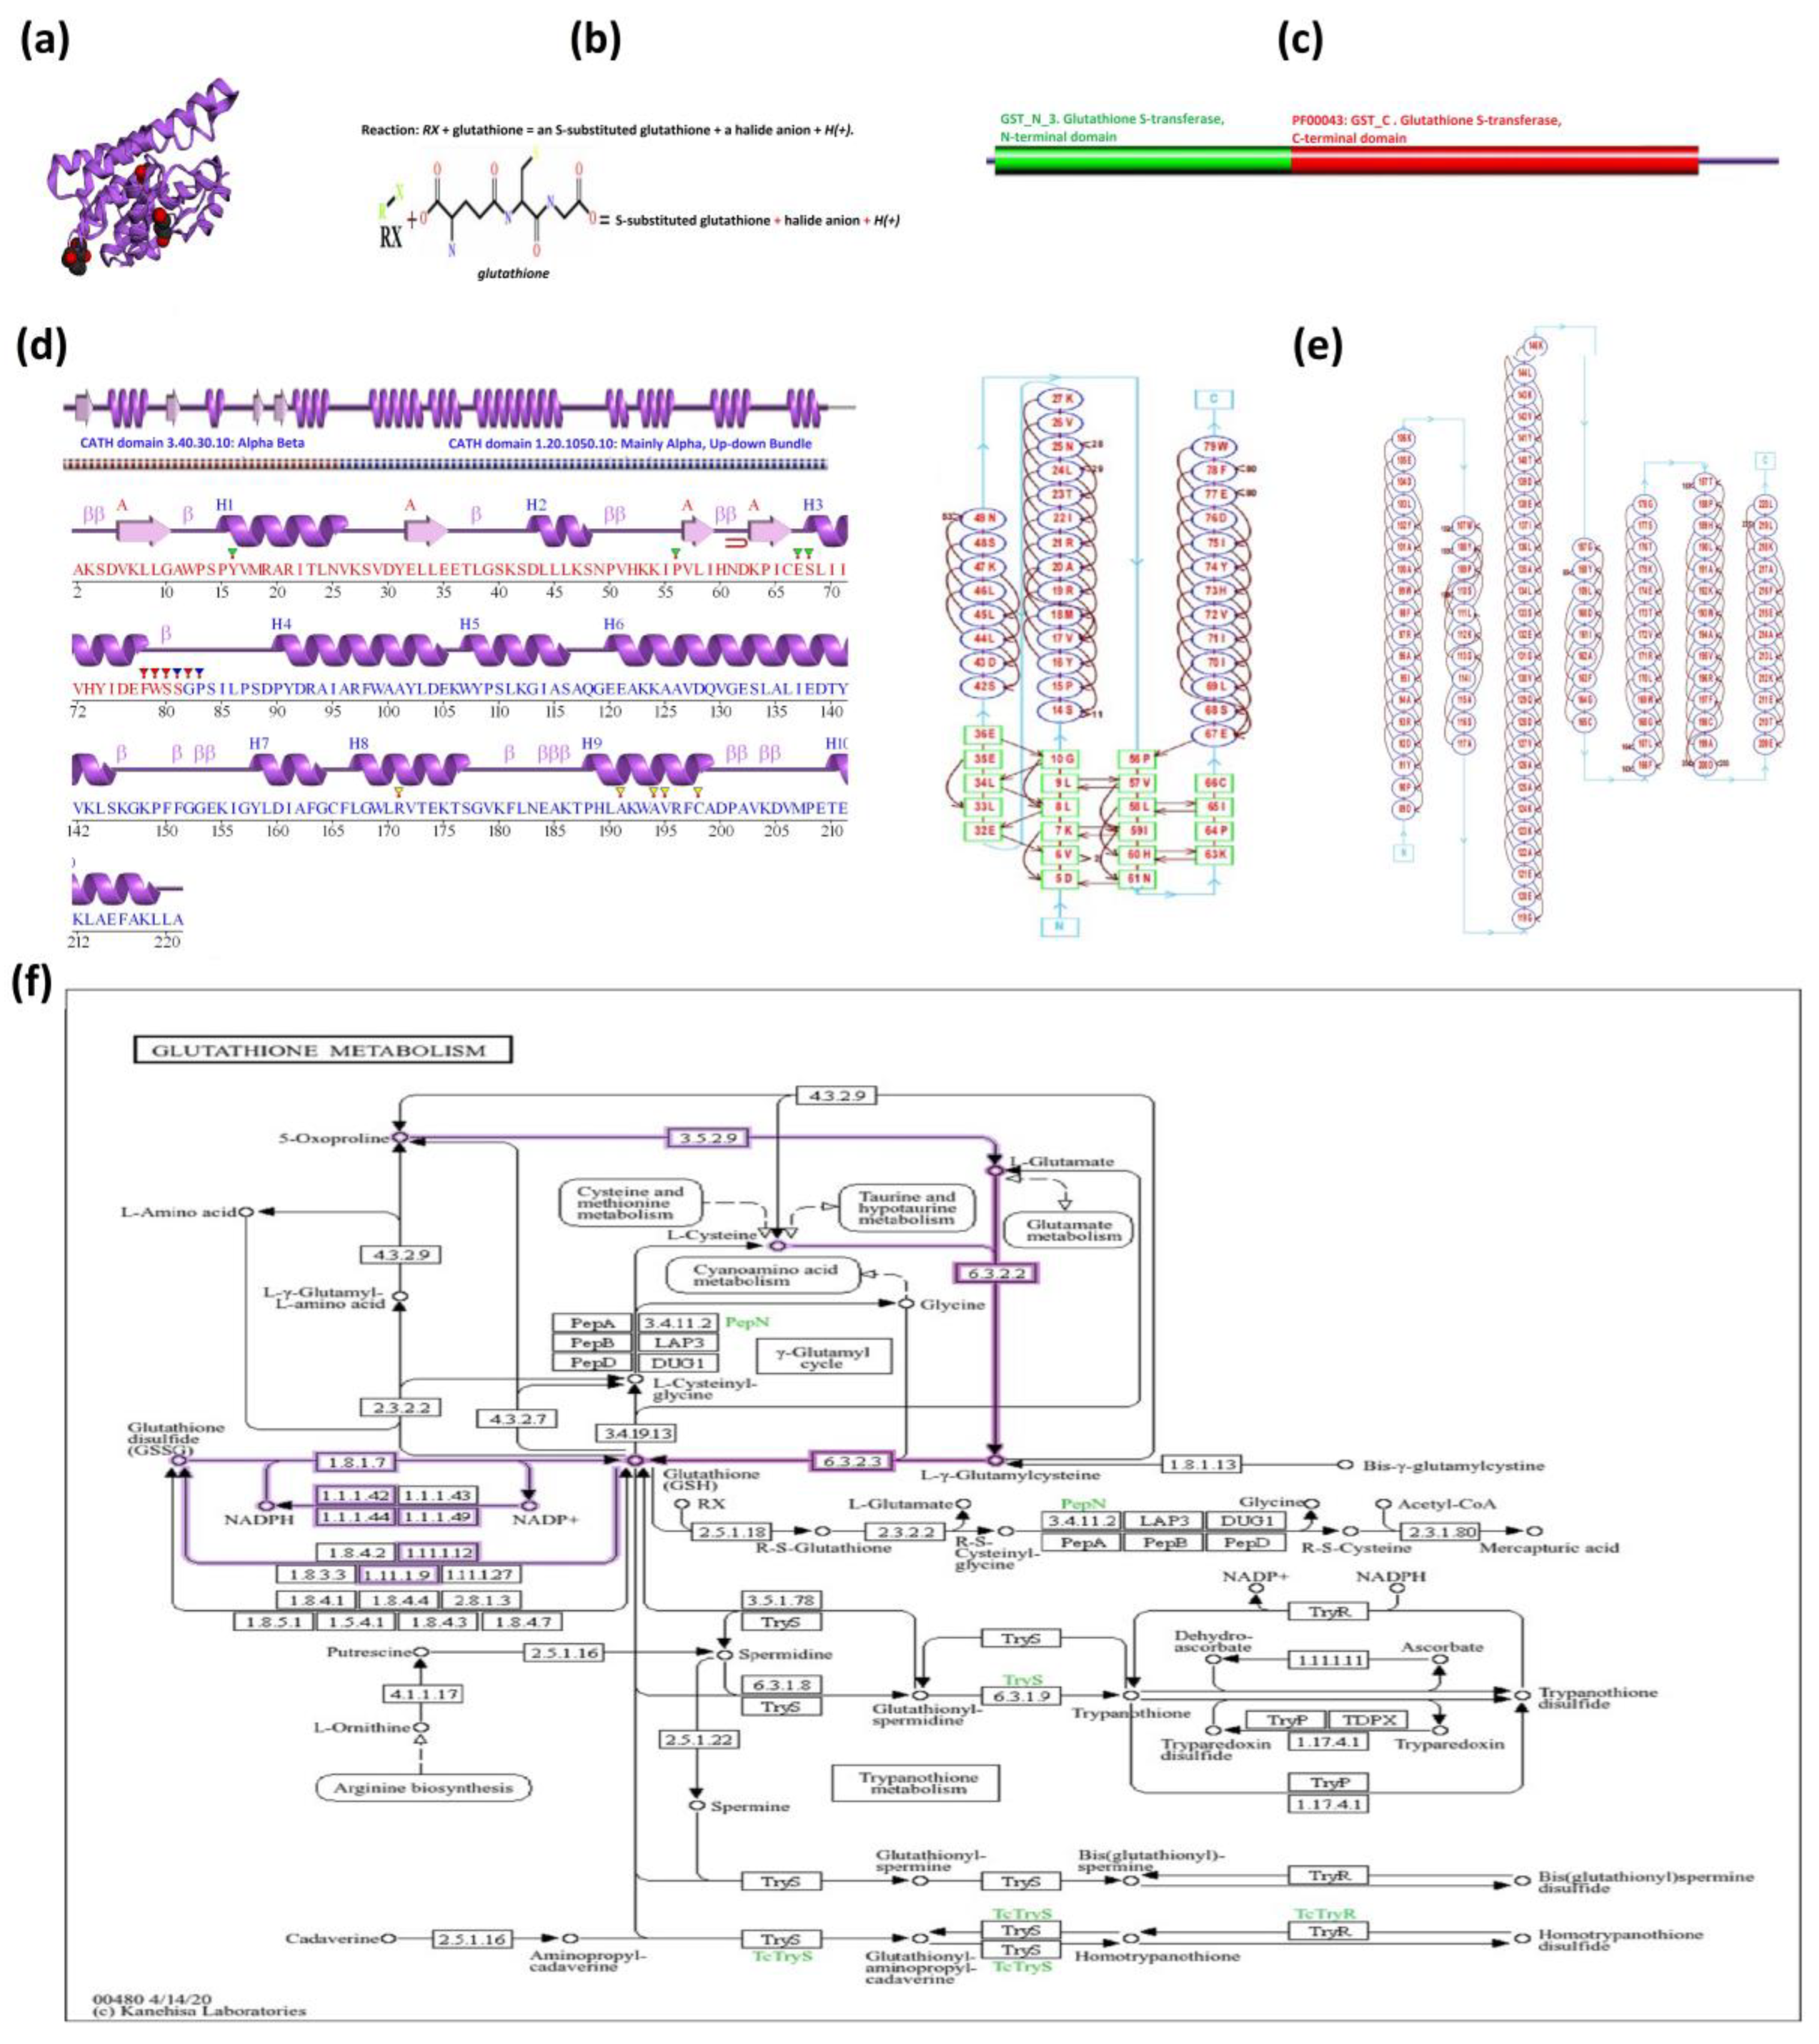
Figure 7.
The heatmap for differential expression of GST genes in source and sink tissues of Saffron (Crocus sativus L.) The heatmap illustrates the differential expression levels of GST genes across source (leaf) and sink (corm) tissues of saffron, highlighting varying expression patterns associated with corm growth and metabolic processes.
Disclaimer/Publisher’s Note: The statements, opinions and data contained in all publications are solely those of the individual author(s) and contributor(s) and not of MDPI and/or the editor(s). MDPI and/or the editor(s) disclaim responsibility for any injury to people or property resulting from any ideas, methods, instructions or products referred to in the content. |
© 2025 by the authors. Licensee MDPI, Basel, Switzerland. This article is an open access article distributed under the terms and conditions of the Creative Commons Attribution (CC BY) license (http://creativecommons.org/licenses/by/4.0/).
Copyright: This open access article is published under a Creative Commons CC BY 4.0 license, which permit the free download, distribution, and reuse, provided that the author and preprint are cited in any reuse.


