1. Introduction
The power grid system is one of the most critical energy infrastructure formed by power plants, transmissions lines, sub-stations with transformers and consumers. The infrastructure aging, electricity demand and climate change impact are addressed to ensure smart grid management, high quality service and increasing reliability requirements. In this sense, efficient monitoring and controlling systems based on information and communication technologies are introduced in power line monitoring to enhance normal operation and infrastructure damages. The use of information and communication technologies ensure robust, cost-efficient and proactive power grid operation [
1,
2]. Sensor and camera based remote monitoring have recently gained great attention. The advantages of the wireless sensor networks (WSNs) such as adaptability, and scalability, lead to the fact of being able to find solutions in a variety of engineering environments, including military, and defense applications [
3], environmental disaster control applications [
4], monitoring of biomedical parameters affecting health [
5], household applications [
6], and also in what is called "precision agriculture" [
7].
The use of WSNs in power grid system offers real time information to improve high voltage power network monitoring and controlling to face climate change scenario and electricity sector demands in a collaborative, cost-effective, and energy-constrained way [
8]. Especially for long chain of towers covering mountains areas, wireless sensor networks (WSNs) are gaining attention due to its easy installation and high adaptability to connect different types of sensors to work collaboratively, as the insect nets, monitoring great variety of physical variables [
9,
10].
Protocols like 3G and WiFi have achieved a wide coverage area around the world, although the connectivity cannot be guaranteed in some remote or non-urban areas. The coverage lack limits the effective smart grid deployment centred on an Internet of Things (IoT) solution. To overcome this coverage constrain and expand the monitoring and controlling capabilities in remote areas, LoRa protocol is gaining attention by offering a wide range of coverage with efficient energy consumption and low-cost infrastructure [
8,
10]. In contrast to other IoT protocols, LoRa operates in unauthorized frequency bands and allows self-organize the network topology like WSNs [
11,
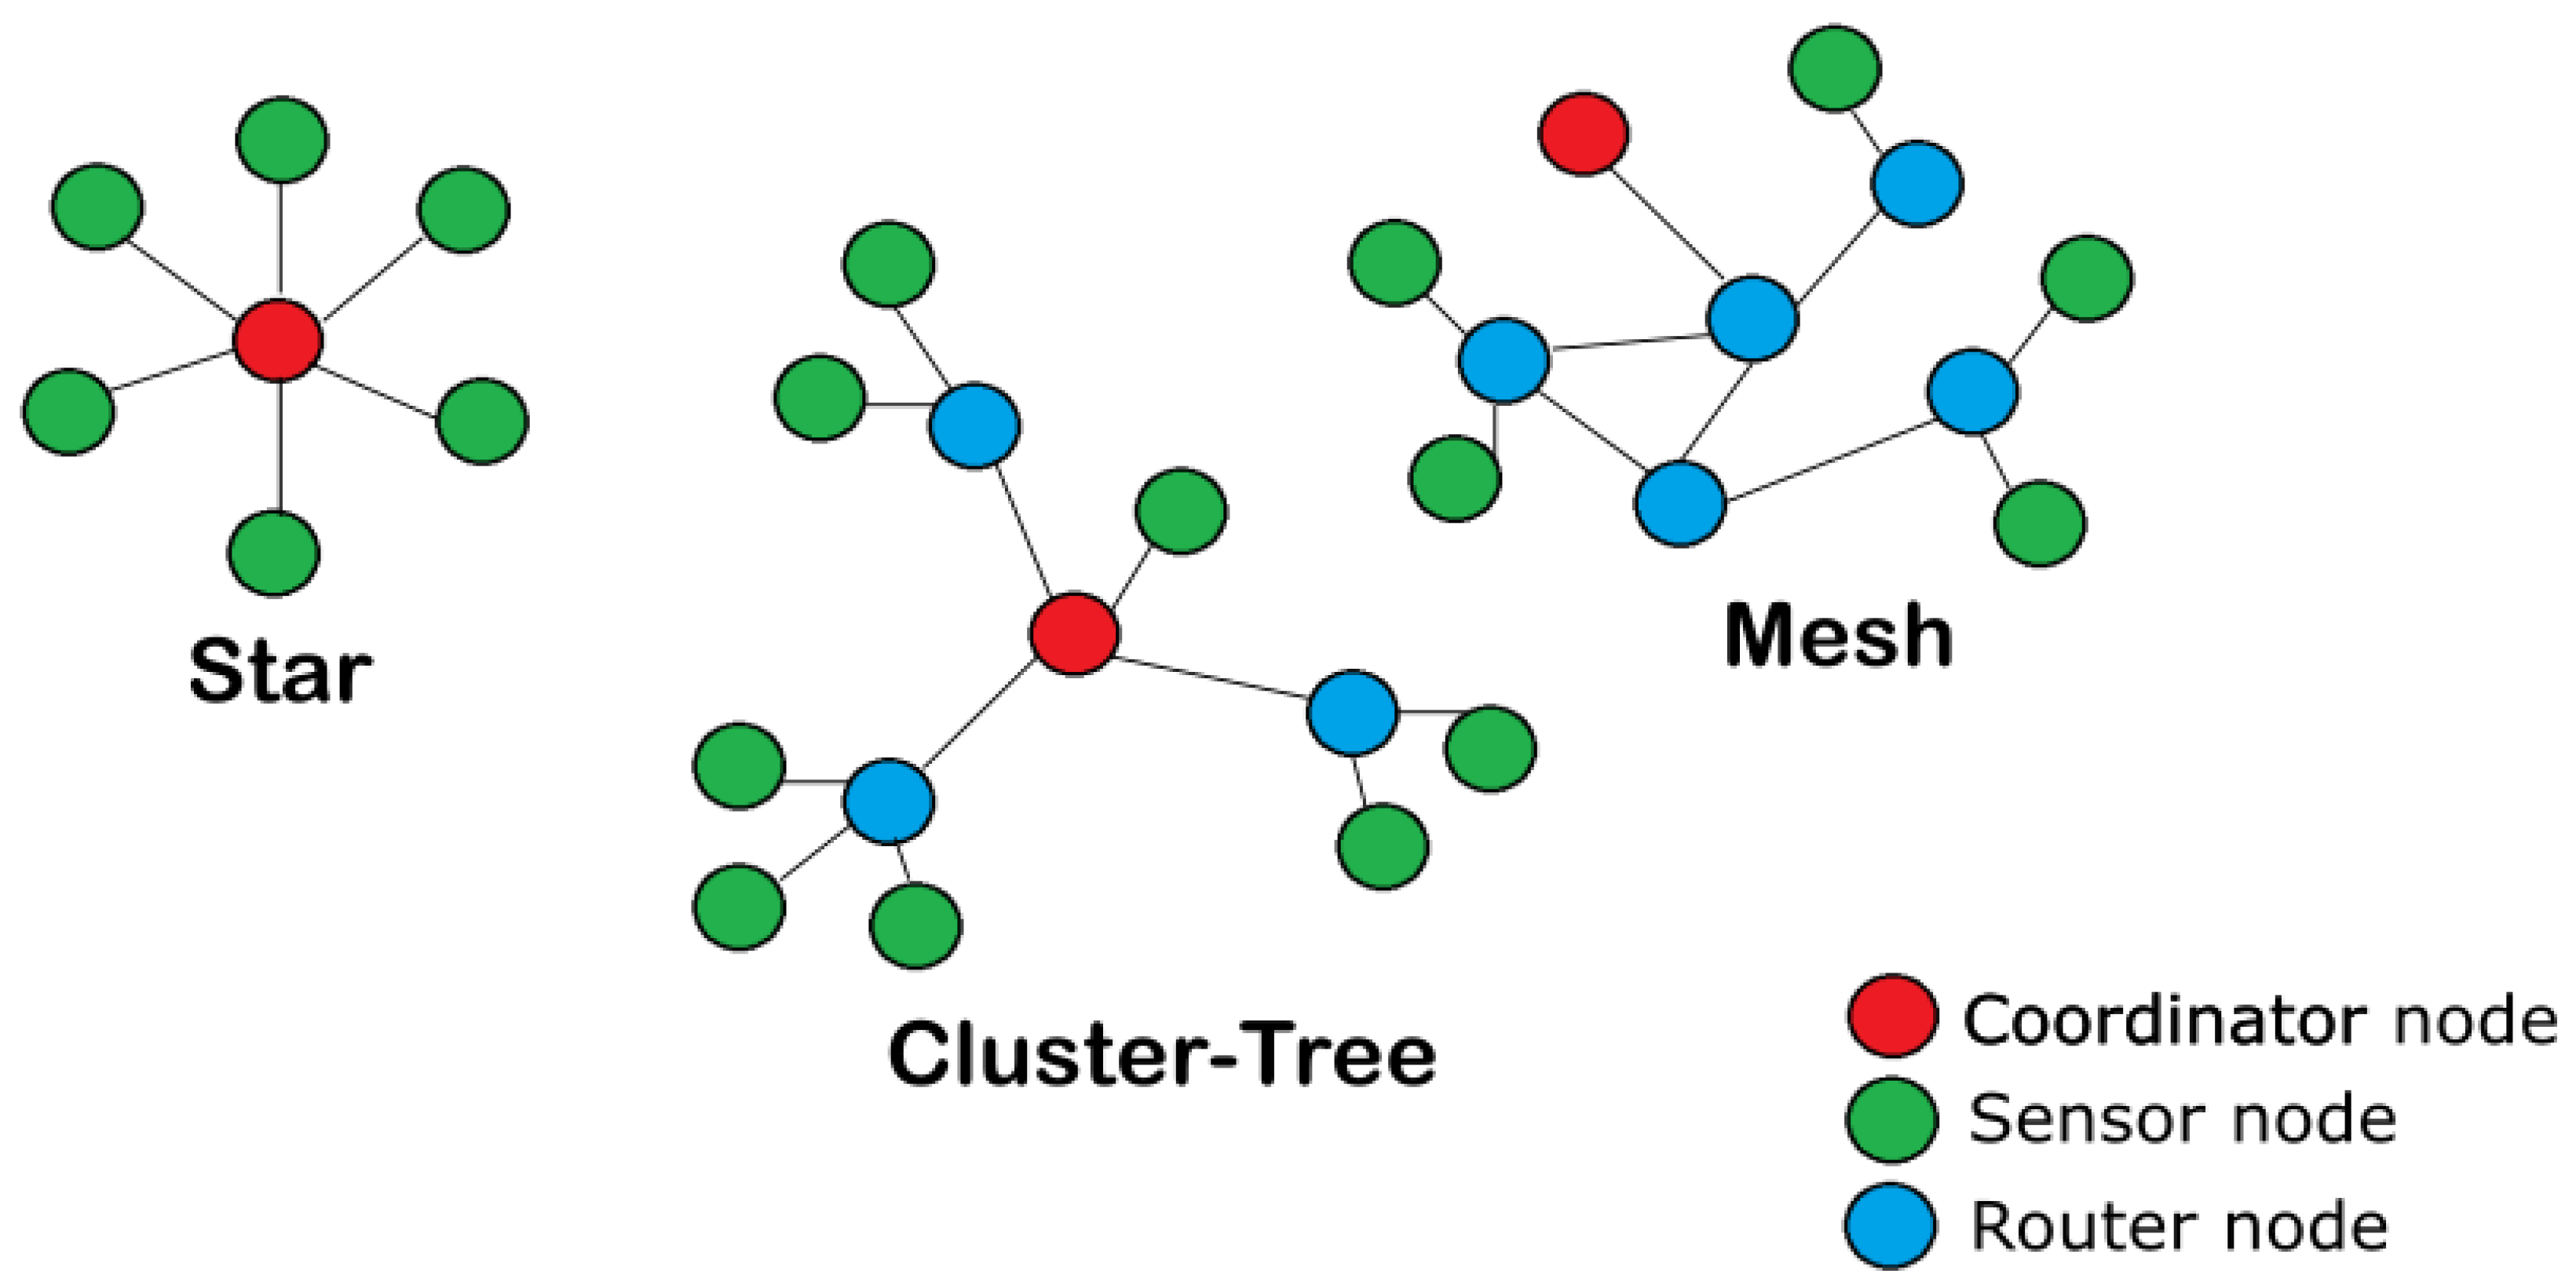
12]. The LoRa protocol can be configured to deploy communication solutions with one of the three most common network topologies: star, mesh, or cluster tree. As it is shown in
Figure 1, the differences between these network topologies are based on the type of nodes which they include, and the connection between them. In short, the nodes can be classified as "
sensor nodes" which are able to measure and communicate some variable of interest, the "
router nodes" that are used to connect sensor nodes located outside the coverage area with the coordinator node, and the "
coordinator or gateway node" which is the link between an end-user and the sensor network.
In the case of large power tower chains across remote or mountainous areas, LoRa has been identified as the most suitable protocol compared to alternatives like Narrowband Internet of Things (NB-IoT), which is more dependent on cellular mobile coverage [
10]. However, the low communication speed of LoRa is the main constraint in meeting the real-time requirements of power line monitoring systems. Therefore, the combination of network technologies is a promising alternative to achieve an optimal balance between network performance of enough quality and the increase in cost that they may entail.
Compared with ordinary infrastructure monitoring located near urban areas with easy access, the monitoring challenges in mountainous and remote areas presents differences in terms of maintenance, implementation and monitoring operation [
10]. In this work a linear topology-based WSN combining LoRa and LoRaWAN nodes for non-urban power transmission lines monitoring is proposed. LoRaBUS is able to transmit operational monitoring data in a regular mode or generate warning messages in emergency scenarios. The complete system monitoring scheme in mountainous areas is based on the three-layer network structure presented in [
10], where LoRa is selected as the collecting protocol for sensor data. This protocol offers a balanced delay time and costs results when it is combined with cellular mobile network at the second layer to transmit sensor data to the monitoring center.
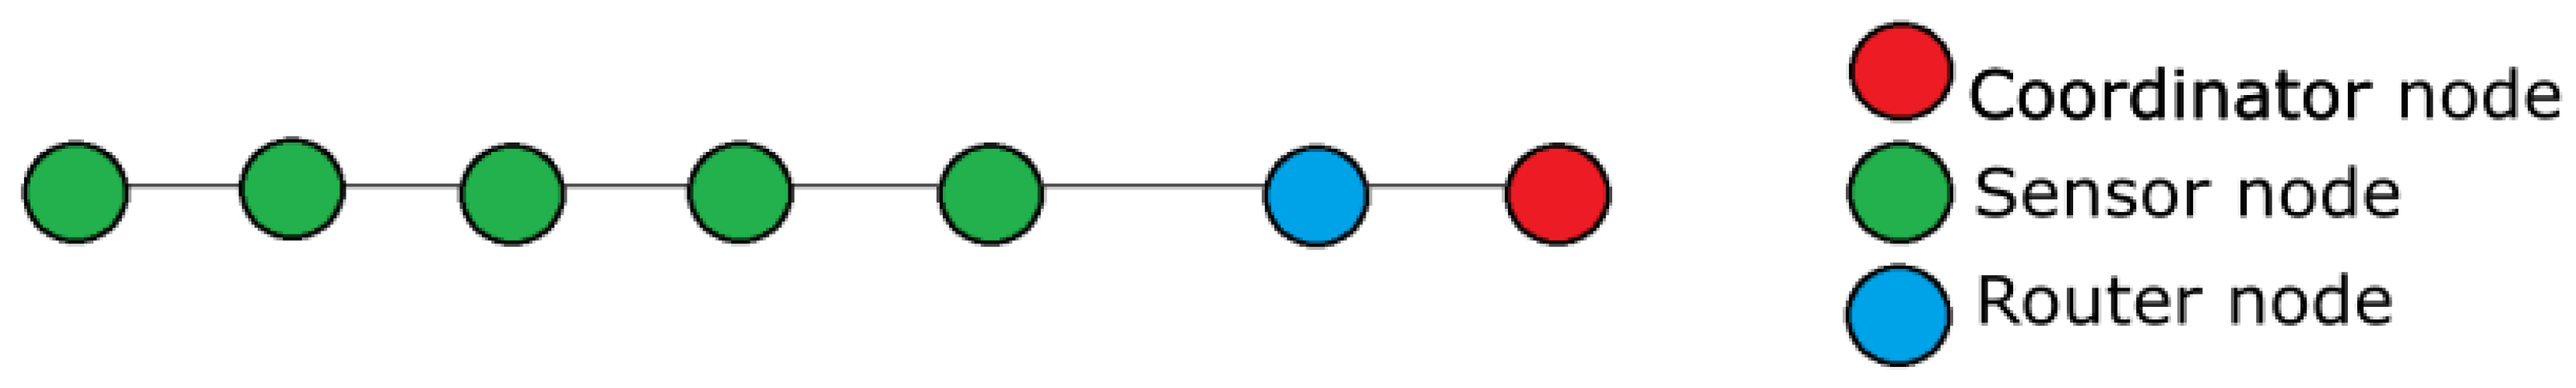
The proposed LoRaBUS topology is shown in
Figure 2 formed by three types of nodes: the Coordinator, the Sensor and the Router. The coordinator node is responsible for maintaining communication between the entire network of nodes and the data processing centre. The Router node is the first node of the LoRaBUS and is responsible for connect all the nodes forming the bus to the Coordinator node. And finally, the Sensor nodes in charge of creating the communication bus, sending the data from the sensors and maintaining the links between them.
The main contribution of LoRaBUS is the concept and practical implementation of a robust and self-configurable tower chain communication system, which transmits sensor values during normal operation or warning messages in emergency mode. LoRaBUS uses long-range wireless communication creating a self-configuration protocol to recognize closed nodes for easy management and fail-node recovery.
The main contributions of this paper are summarized as follows:
The concept of a BUS topology in WSN with two final nodes acting as a routers to improve connectivity with upper system layers.
The self-configuring algorithm which detects nearby nodes and adjust power consumption during transmission to avoid channel interference between adjacent nodes.
The algorithm to transmit data between nodes avoiding data duplication and reducing power consumption.
The communication architecture based on a combination of LoRa and LoraWAN for world-wide connection with controlling center.
The proposed network topology is implemented in real prototype to test power consumption and quality coverage in a campus and non-urban scenarios.
The remaining sections of this paper are presented as follows. Section II discusses the network architecture by defining the different elements and connections between them. Section III defines the designed communication protocol and the self-configuration algorithm. Section IV presents the experimental results obtained with the prototype in a campus and non-urban scenarios. Section V concludes the paper and outlines directions for future work.
2. System Architecture
The designed system architecture consists of three main parts: the nodes forming the BUS topology, the LoRa Network Server, and the display platform where the data is represented. In this work, the LoRaBUS topology requires four different nodes: , the sensor nodes (represented as sensor nodes in
Figure 2), the final node (special case of the sensor nodes in
Figure 2), and the gateway (represented as Coordinator node in
Figure 2).
The Gatewaynode maintains the connection between the LoRaWAN network with the Network Server. The data received from the BUS nodes is re-transmitted to the TTN via TCP/IP connections, such as WiFi or 3G.
The
Main node is represented as Router node in
Figure 2 and is the node placed nearest to the
Gateway. Its main function is to convert the messages from the sensor nodes (via raw-LoRa) to a LoRaWAN message that could be sent to the gateway. Furthermore, this node decides which sensor node in the BUS topology will take control of the BUS to transmit the information at each transmission cycle.
The Sensor nodes are able to measure the environmental conditions near their position and then send this information through the LoRaBUS implemented by themselves. The designed LoRaBUS protocol has not restriction on the maximum number of nodes, so the total distance that could be covered by the proposed LoRaBUS topology has no theoretical limitations.
The
Final sensor is a particular node similar to the sensor nodes which is located at the last position of the bus, i.e., at this node the sequence of nodes in the bus topology ends. Because the bus communication finish on this node, it has a different firmware although the hardware is the same that the sensors nodes. The complete functionality of this special node and other advantages are explained in
Section 3.
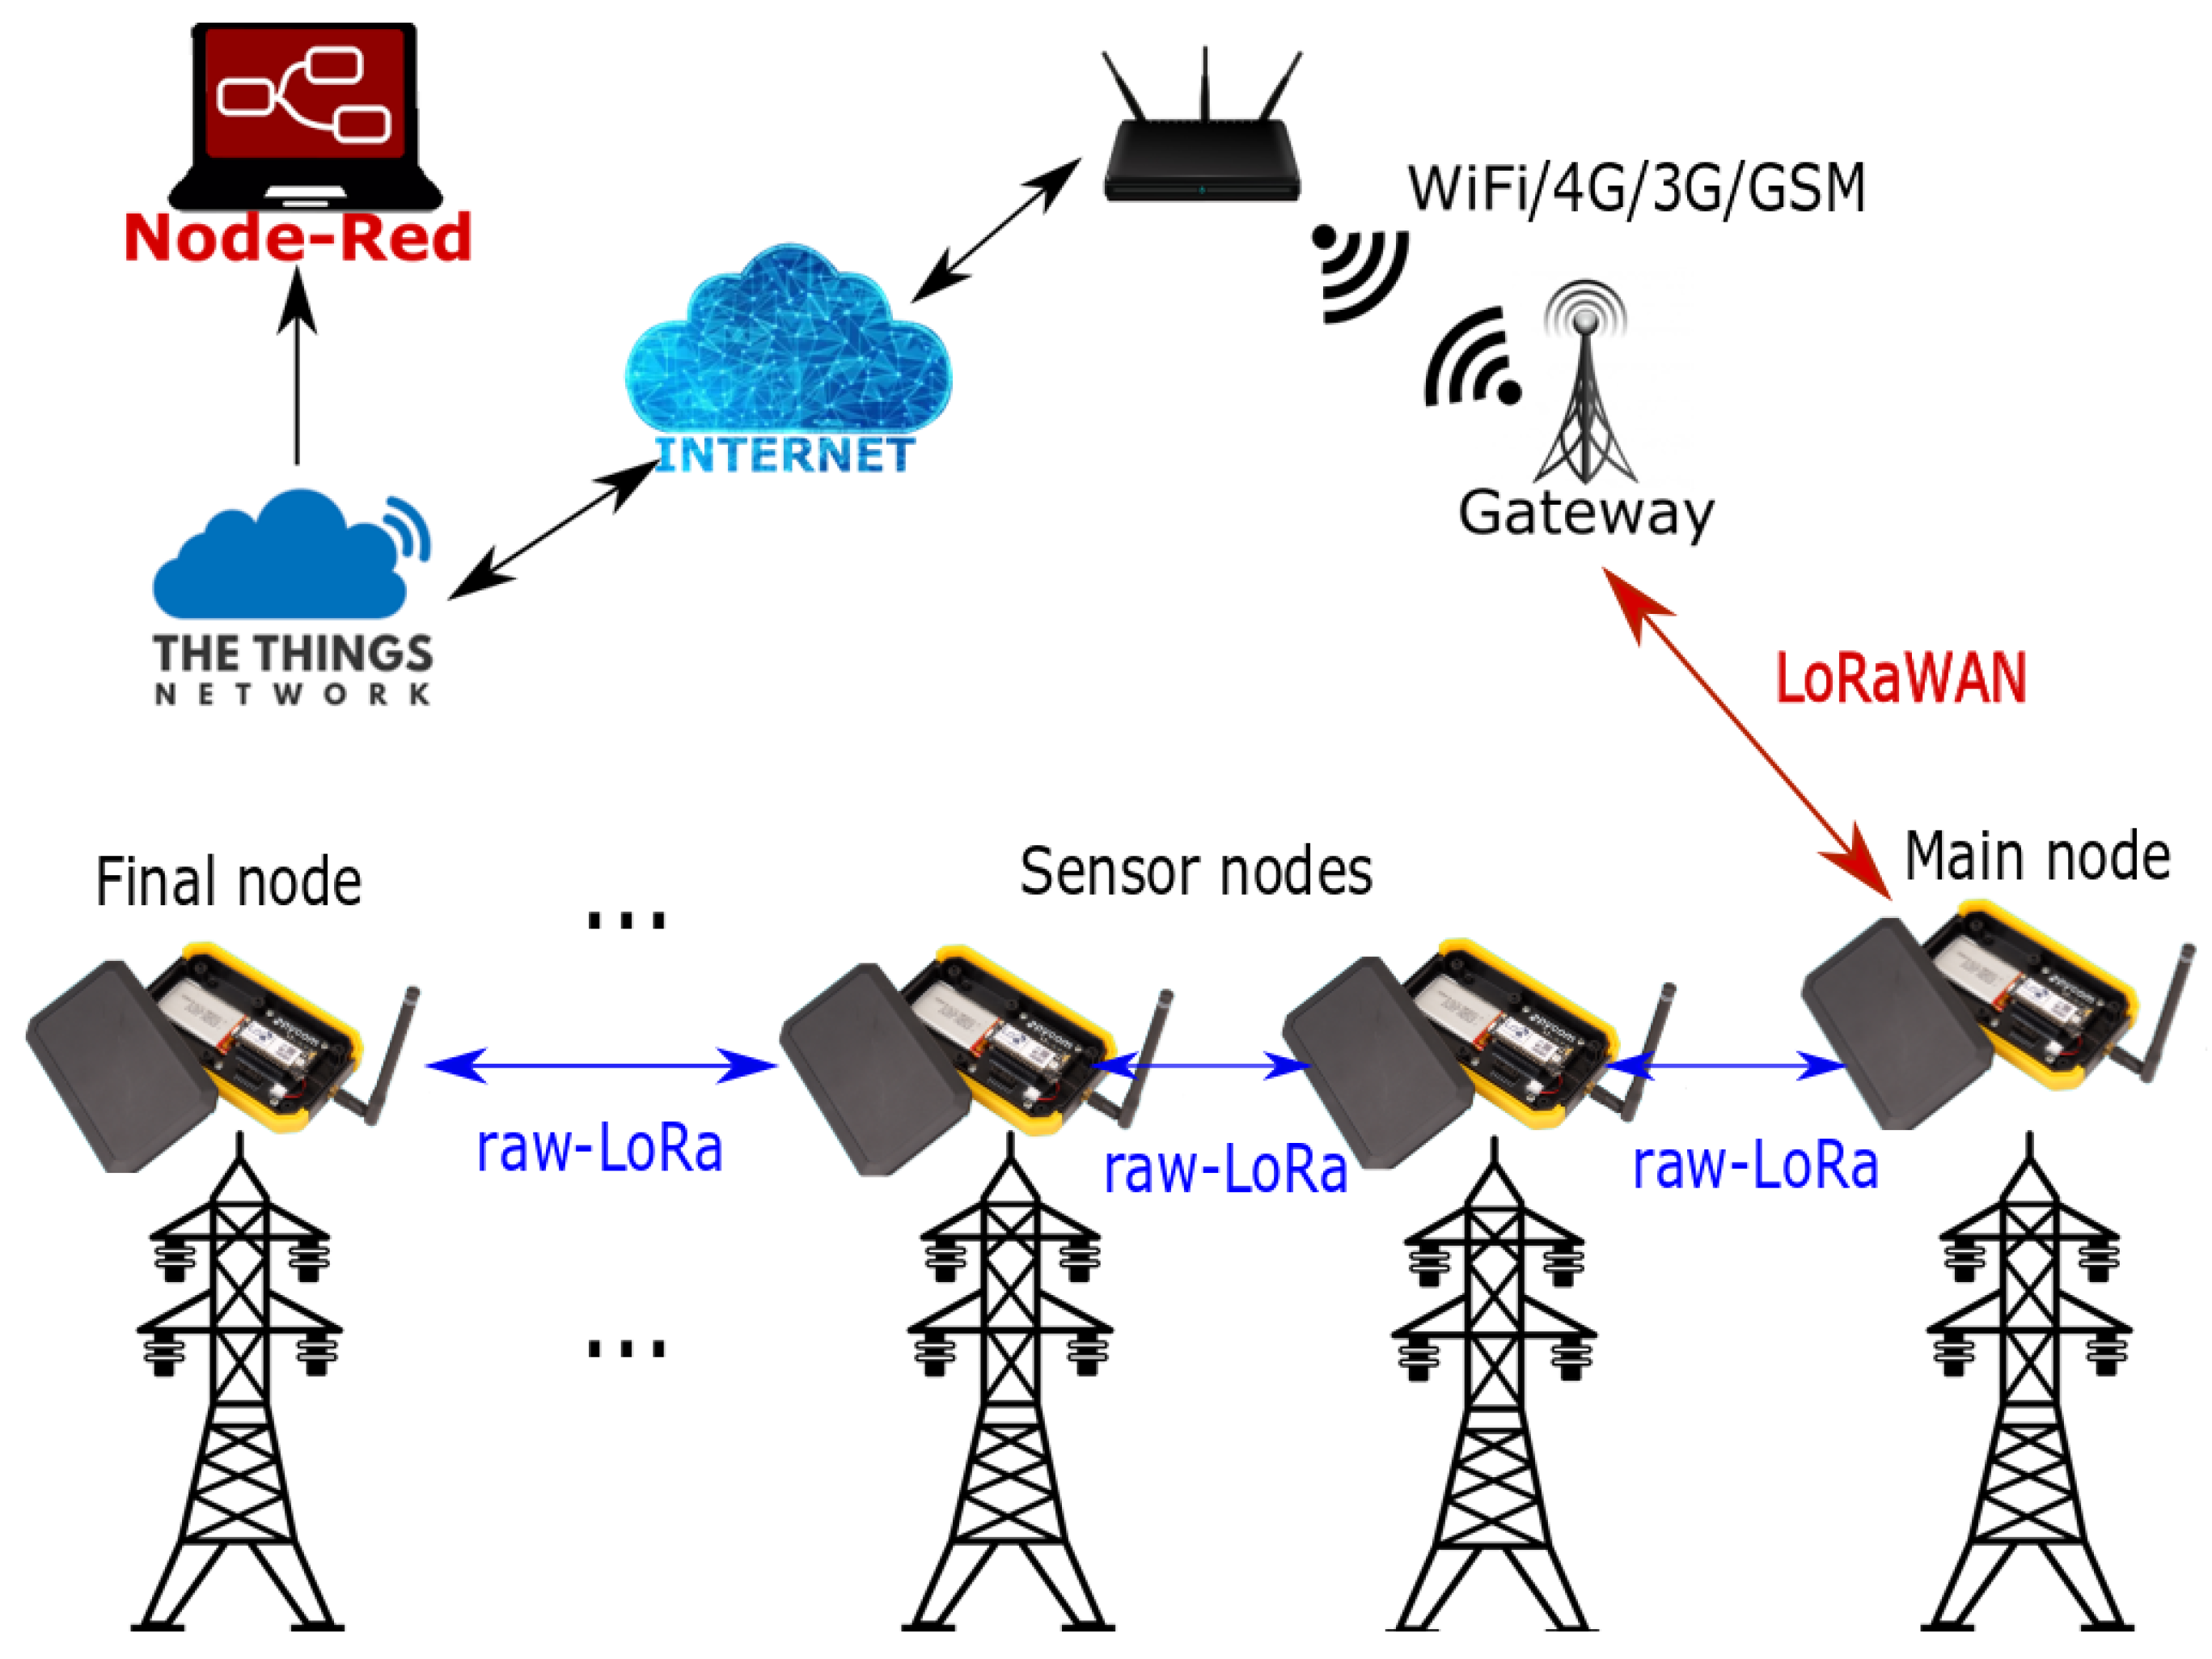
The proposed overall system architecture described as LoRaBUS is illustrated in
Figure 3, which mainly includes the different elements and the proposed connections between them.
The LoRaBUS system proposal makes use of the LoRaWAN and raw-LoRa protocols to implement the different links of the proposed topology. The LoRaWAN protocol is used to communicate between the main node and the Gateway. Consequently, using the LoraWAN protocol to communicate the main node with the gateway node allows the integration of several LoRaBUS topologies into a larger LoRaWAN network. That is, the gateway node could communicate with different LoRaBUS sections through the link to the main node of each section. By contrast, the raw-LoRa protocol is used to create the BUS topology between the Main Node, the Sensor nodes and the Final Node. The raw-LoRa protocol is used to build the LoRaBUS protocol described in this work taking benefit from the long range features of the LoRa modulation. Therefore, the node accesses the radio hardware directly and messages are transmitted using LoRa modulation on the selected frequency, without message format or encryption. Next section will describe the benefits of both protocols on the LoRaBUS topology approach.
The rest of the parts of the system architecture have been selected using freeware options. In this way, an open-source platform called
The Things Network (TTN) has been selected as the LoRaWAN Network Server. This platform provide easygoing functions to manage messages received using LoRaWAN protocol. Thus, the information from the sensors is transmitted to the Gateway which upload it to a user-friendly display platform with a web based GUI called Node-Red. These software solutions are used to validate the LoRaBUS topology configuration in real experiments summarized in
Section 4.
2.1. raw-LoRa and LoRaWAN
LoRa is a wireless communication technology that was patented by
Smetech [
14] and uses a radio-frequency modulation to transmit data through the ISM bands (in Europe it represents frequencies between 867-869 MHz). LoRa is part of the
Low-Power Wide-Area Networks (LPWAN) and represents one of the most popular technologies in IoT projects together with Bluetooth, Zigbee or SigFox. LoRa specifications state that its coverage is up to 15 km in rural areas, and uses very low transmission rates, from 250 bps to a maximum of 5.5 kbps. Besides, this technology aims to ensure high power efficiency which is an important feature when remote deployments are considered.
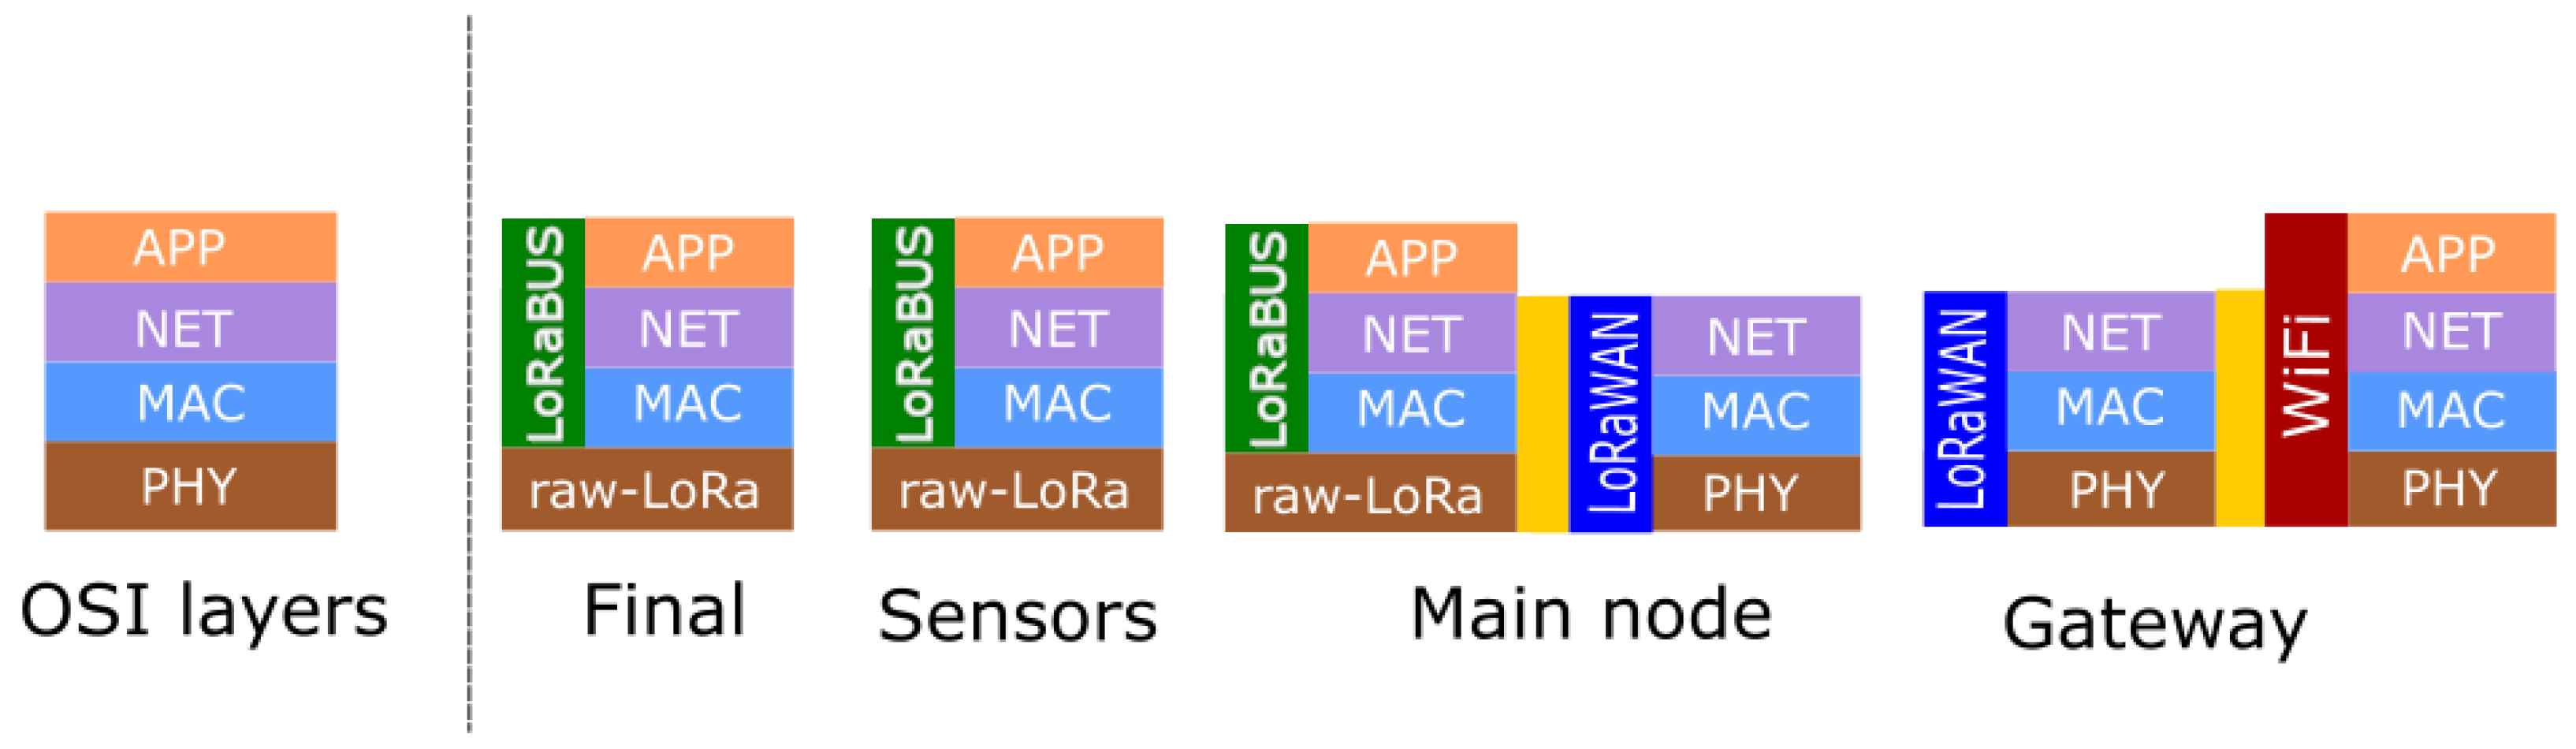
Communication through LoRa is defined in two different ways: raw-LoRa, and LoRaWAN. The difference between them is related to the OSI layers that they use. For example, in a raw-LoRa mode, the communication is set point-to-point only by using the physical layer. Instead, the LoRaWAN connection defines both MAC and NET layers. Another difference is that in a LoRaWAN connection, any node needs to be in the coverage area of the coordinator or router nodes, which is unusual in remote scenarios such as forests. For that reason, we have designed a prototype of communication protocol, and different types of nodes
Figure 4 represents the different types of nodes, showing the OSI layers stack used to implement each of them in the LoRaBUS.
The proposed LoRaBUS is implemented in the nodes forming the BUS topology and it uses the raw-LoRa as a physical layer as
Figure 4 shows. The Main Node is the first node of the bus topology and it is responsible to making the translation between data to and from the BUS nodes, from and to the LoRaWAN Gateway. While the LoRaWAN Gateway is capable to send and receive data from the TTN platform using Wifi connection to the Internet. The data received from TTN platform is visualized using Node-Red web based GUI.
3. LoRaBUS Communication Protocol
In this section, the LoRaBUS communication protocol is described and explained in detail. The proposed approach tries to implement a bus topology using LoRa based nodes improving the autonomy of the network. This configuration is important for the deployment of nodes in remote environments, where it is necessary to resolve situations such as the inclusion of nodes for maintenance or the addition of a new nodes to the BUS. Next sections will describe the protocol implemented by the LoRaBUS to create a robust and efficient approach.
3.1. Discovering Neighbours
When the nodes are initialized, the first stage involves self-definition and self-configuration of the linear communication bus. This process, referred to as "Discovering neighbours", is based on a methodology in which each node identifies its closest neighboring nodes on the bus, and also the correct direction for information flow to reach the Main Node and, consequently, the user’s application.
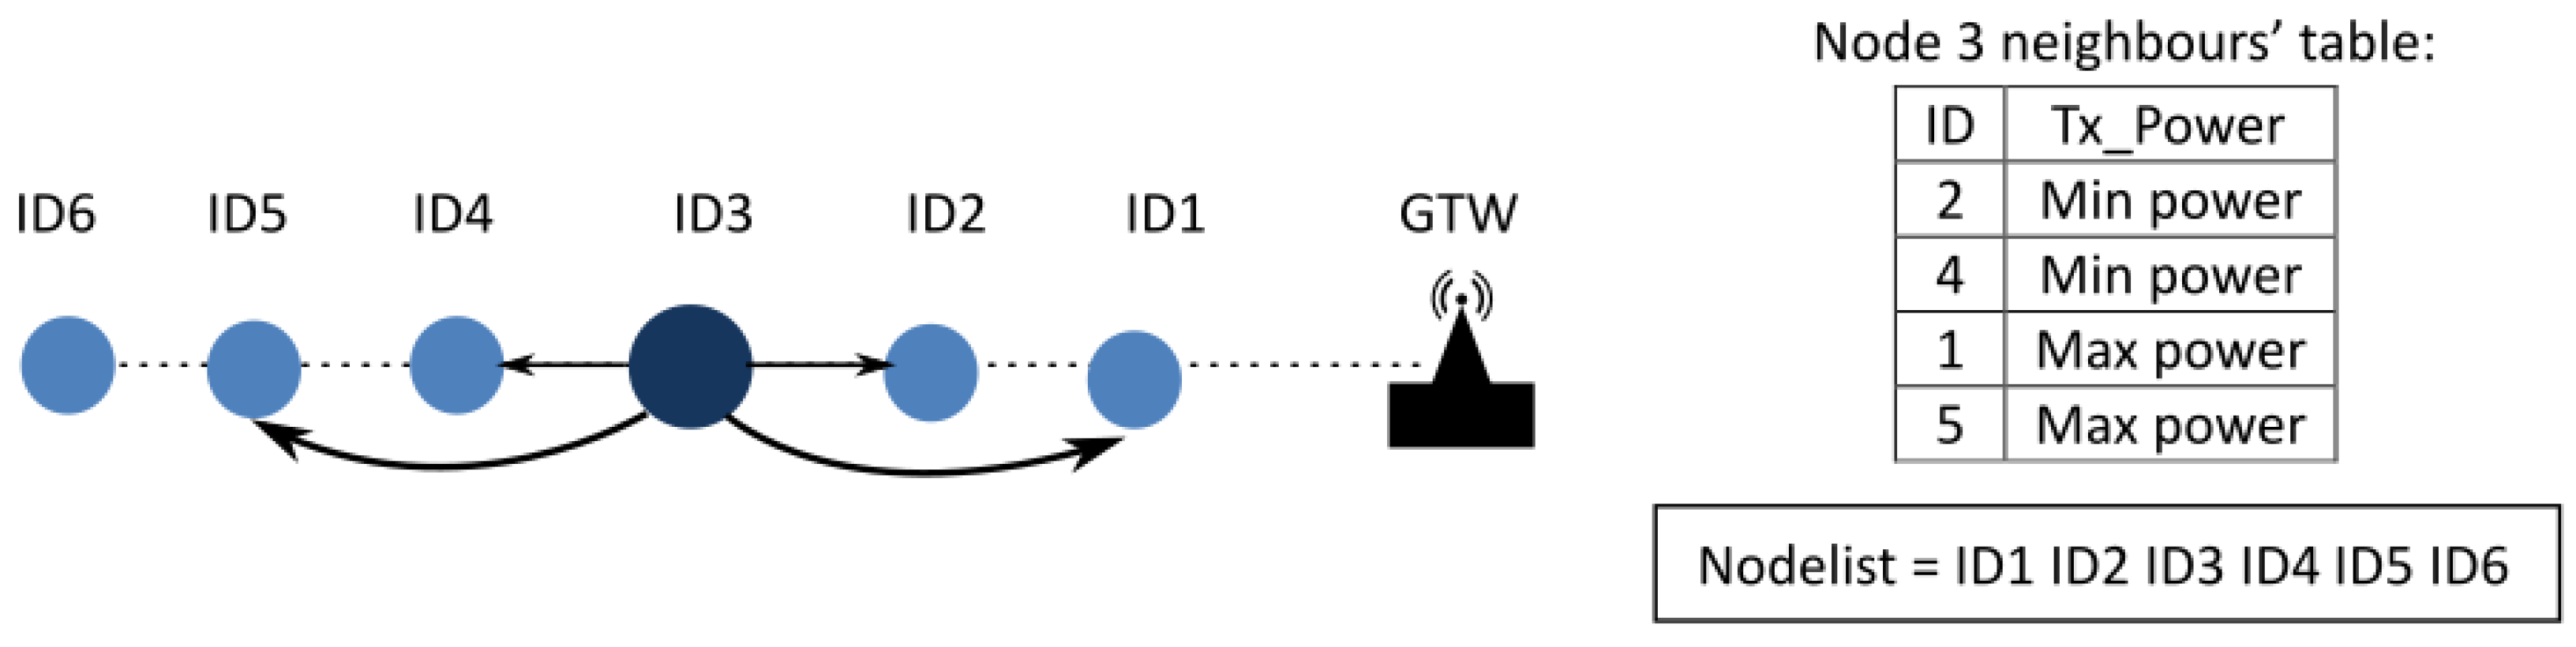
The purpose of the "Discovering Neighbors" methodology is to construct the
nodelist and the neighbors’ table, as depicted in
Figure 5. The
nodelist is an array containing the identifiers of all
Sensor Nodes comprising the bus, sorted sequentially from the main node to the final node.
Figure 5 illustrates an example of a bus with six nodes, where the
Main Node is identified as "ID1" and the
Final Node is labeled "ID6." The detailed procedure for obtaining the
nodelist is described in
Section 3.1.1.
On the other hand, each node in the bus must discover and construct its neighbour’s table. This table contains the identifiers of the four nearest nodes. For example, in
Figure 5, the Sensor Node "ID3" will identifie that its closest nodes are "ID2" and "ID4," while the next closest nodes are "ID1" and "ID5.". In addition, the Discovering neighbours methodology is designed to define the minimum power required to transmit data between each node, i.e., to determine the lowest possible energy needed for communication. Initially, the required transmission power will be set to the minimum capable by the transmitter for the closest nodes, and to the maximum power available for the next closes nodes. This initial configuration,as shown in the table in
Figure 5, will be evaluated and adjusted during the normal operation of the bus network to determine the optimal minimal transmission power requirements for each neighboring node. The procedure designed to obtain the
final power requirements, the
neighbour’s table and the
nodelist will be explained in subsequent sections.
3.1.1. Getting the "Nodelist"
The process to obtain the
nodelist in a certain BUS topology can be initiated every time the end user decide it, for example, in case new
Sensor nodes have been introduced, or due to a network maintenance event (battery replacement, sensor repair, or other actions). The methodology to obtain a new
nodelist is initiated by the
Main node transmitting a CONFIG message. The payload of CONFIG message is detailed in
Table 1. It contains the level of the power transmission used to send this message (
tx_power, the list of node identifiers of the current
nodelist that the message has passed through and a checksum based on CRC16.
The first node that sends the CONFIG message is the main node. After that, whenever a node receives a CONFIG message, it will check if its identifier (idx) is already included in the payload of the message. If not, it will add its identifier idx at the end of the list, recalculate the checksum and resend the message using the lowest transmitting power available at the transmitter. On the other hand, if it receive a CONFIG message with its idx included, the node should consider the message as a confirmation that a previous message sent has been received correctly by the next node so, when it happens, the node stops to resending the message again withi higher transmission power. With this procedure, we reduce the duplicity of the messages in both senses of the bus because we suppose that there will be a minimum level of power transmission which allows a node to communicate with its nearest neighbour without reaching the next closest neighbour in the bus due to the increment in the distance between consecutive nodes. When the CONFIG message is received by the Final Node, this node will wait for the reception of other CONFIG messages with different versions of nodelist as payload. Among all the received CONFIG messages, the final node will determine the complete nodelist by selecting the message that contains the largest number of identifiers in the nodelist.
Finally, with the final
nodelist at the
Final node, the STOP message (see
Table 1) is sent from the
Final node to the
Main node. In this case, the information about who is sending this message is appended at the end of the message (
idSend in
Table 1). When a
Sensor node receives an STOP message, firstly, it stores the final
nodelist. Next, it checks who is the sender to determine if the message originated from the its previous node in the
nodelist. If so, the message must be forwarded to the next nearest
Sensor Node in the direction of the
Main Node. Otherwise, It is not necessary the message retransmission, and it should be considered as the confirmation reception of a previous STOP message which comes from a
Sensor Node nearest to the
Main Node. In this case, the
Sensor Node completes its configuration process and remains listening to the BUS.
Finally, when the STOP message arrive to the Main node, all the Sensor nodes in the BUS will continue listening the BUS, and the nodelist is completed and fully propagated to all nodes.
3.1.2. Getting the Neighbour’s Table
Afterwards the
nodelist is known for all nodes, the
Discovering Neighbours process continues at each
Sensor node with the extraction of their nearest neighbours. Each
Sensor node creates the
neighbour’s table with the closest and next closest nodes (four nodes at each
Sensor node). The inclusion of up to four neighbours instead of just the two nearest neighbours was made to serve as a backup to automatically resolve communication conflicts, or BUS topology outages (e.g., in case of failures of the nearest nodes). Therefore, each
Sensor node will be able to communicate with two neighbours in each direction of the BUS topology, see
Figure 5. Only the two
Sensor nodes nearest to the BUS ends reduce the number of nodes included in the
neighbour’s table.
The
neighbour’s table is completed, initially, with the minimum transmission power observed during transmissions in the
Discovering Neighbours process. This minimum transmission power is obtained from the payload of CONFIG and STOP messages, see details in
Table 1. With the objective of improving the energy efficiency of the LORABUS network, the transmission power is optimized at each node to the minimum necessary to send messages to all nodes included in the
neighbour’s table. This process is performed by one
Sensor node at a time while the rest of the nodes are only listening to the BUS. The use of the BUS to transmit is self-arbitrated by
Sensor nodes to reduce the interferences and retransmissions between nodes sharing the BUS.
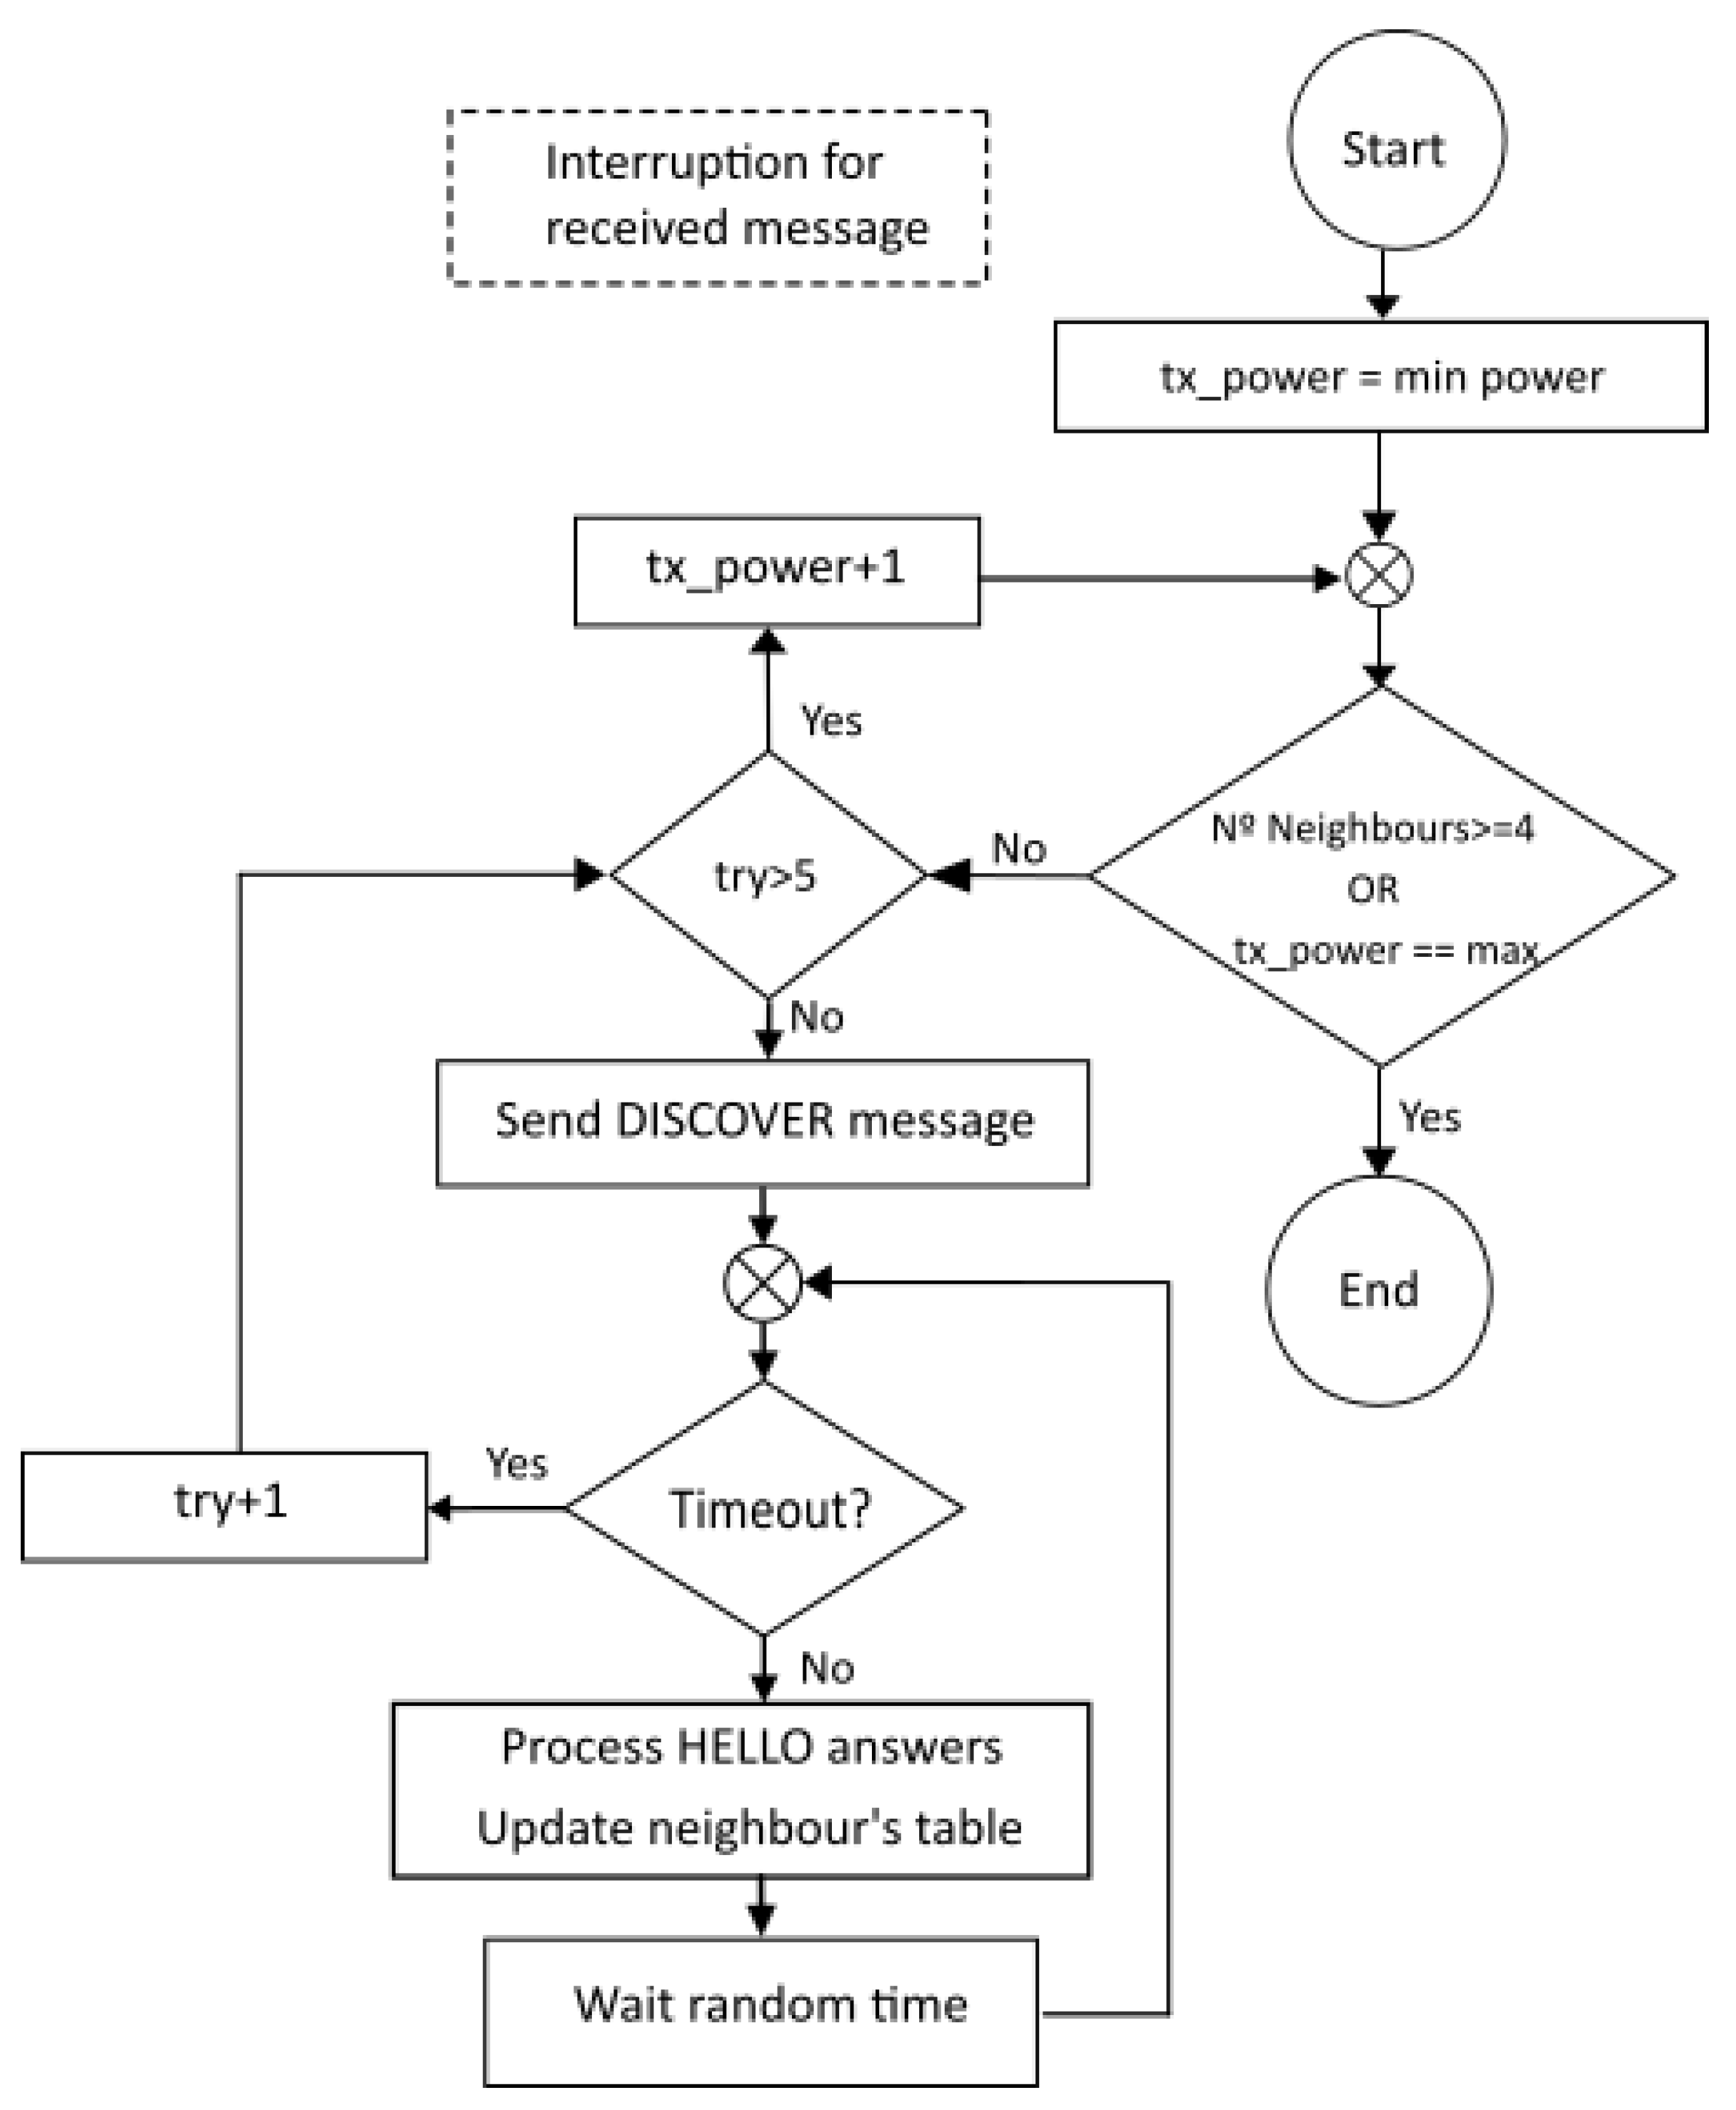
The power of each node in the
neighbour’s table is estimated using the procedure shown in
Figure 6. The channel between nodes is tested using the specific
DISCOVERY message (see
Table 2). If the node receives a
HELLO message with the correct
neighbour node id value then the level of transmission power is stored in the
neighbour’s table because the both nodes can send messages using this minimum power level. The final transmission power for each node in the table will be between minimum transmission power used during
"nodelist process" and the maximum transmission power available at the
Sensor node. If after a timeout period, any correct
HELLO message is received, then the
Sensor node will increase the transmission power level and repeat the evaluation for each node in the
neighbour’s table with still no response. The process finishes when the table is completed and the minimum transmission power is established. The first node which will start the neighbour’s table will always be the
Final node after receiving the response message from next node to the
STOP message. This is because, the
Final node is the first node which will send the
STOP message to the rest of the nodes in the BUS highlighting that
nodelist is completed. The process (detailed in
Figure 6) uses the
DISCOVER messages to send from the
Sensor node that is discovering its table, while
HELLO messages are the answers from its neighbour nodes. In both message types, the nodes include the power transmission level used to send the message and, therefore, the receiver can store the level used by the other node.
When the minimum power of the four nodes in the table is established. The node which is discovering neighbour must send a final transmission using the DISCOVER_NEXT message. This special message define the next node in the BUS which will start the process to complete its own neighbour’s table. The next node is defined following the nodelist from Final node to the Main node. Therefore, the last node in completing the neighbour’s table will be the Main node. If the next Sensor node does not send its DISCOVER message after a timeout, the DISCOVER_NEXT message is resend to the next node. If the resend fails again, the DISCOVER_NEXT message is sent to the second nearest node, considering that the closest neighbour node is not working properly. This fail condition is reported to the Main Node for maintenance prouposes. Finally, when all nodes have defined its own neighbour’s table the Main Node will send the DISCOVER_END message which will be re-transmitted to all nodes in the BUS, finishing the Discovering Neighbours process with the LoRABUS configured for Data communications between Sensor nodes.
3.2. LoRaBUS Data Communication
The LoRaBUS configuration is proposed to create a BUS topology to be used in remote serial communication applications without routers or coordinators nodes along the network. As it has been mentioned previously, the LoRaBUS is proposed to implement a remote monitoring system near the high voltage power lines along long distances without communication coverage. For this reason, the proposed communication protocol includes different transmission modes (stable or alarm) depending on the data value.
In alarm mode, the
Sensor node will periodically send an
ALARM message which includes sensor measurement data and node identifier (see
Table 3). When this kind of message is received by any other node in the network will put the receiver node into alarm mode, and the message will be retransmitted to ensure it reaches the
Main node. The end user must then evaluate the situation and decide whether to ignore the alert or notify emergency services. This person can also deactivate the alarm mode, allowing all nodes to return to stable operation.
On the other hand, in stable mode, the information will be sent by each node in the network like a remote monitoring system. The arbitration methodology used to access to the BUS is based on a combination of the well-known
Master-Slave organization, and the
Token-Ring arbitration. LoRaBUS defines the
Main Node as the
Master of the BUS. This means that the main node has to decide which node is going to send its information during stable period. This decision is managed using a
TOKEN message described in
Table 3 where
id_token refers to the identifier of the node that has to receive the
token,
id_from is the node identifier of the sender of this message, and
id_to is the identifier of the addressed node.
In order to achieve maximum power efficiency, the first node that will send its monitored information will be the furthest one from the gateway. This means that the final node will be the first one in sending its data to the server so it will be the first one that will receive the TOKEN. Following this strategy, each node in the bus can be in a low power consumption mode, with to the function called DeepSleep, a time proportional to the number of nodes which are in front of it. This provides a reliable guarantee for the long-term operation of the system.
After the reception of the TOKEN, the monitored data will be transmitted by the sensor node with a message of type INFO which includes the identifiers of the owner of that data, and the addressed node obtained from the nodelist. Usually the destination node will be the Main Node, but the proposal is able to allow transmissions between nodes too. The total length of data field is considered in this work equal to 20 bytes, enough to include the data collected from the sensors connected to the node. The power transmission level that will use any node would be, initially, the value saved in the neighbour’s table. Even so, if the transmitter doesn’t detect the INFO message from the next node, the node will try a new transmission increasing the transmission power level. After three failed transmissions, the node which has the token will send its information to the next neighbour available in the neighbour’s table, considering that the previous node was out of service.
4. System Test and Analysis
A proof of concept implementation has been developed using one Gateway, one Main Node, three Sensor Nodes. The last node in the BUS will work as the Final Node. The Sensor nodes are the most critical part of the system in terms of power requirements because they are supposed to be distributed in a remote and non-controlled area so that they would have to be powered with batteries and/or solar panels. This implies assuring an efficient management of the power consumption.
The
Sensor nodes have been designed to calculate some fire indexes such as the Fire Weather Index (FWI) [
15]. Therefore, the sensors considered include the SEN0114 (soil moisture), the HPMA115S0 (particle sensor), the AMG8833 (tiny thermal camera), the HTU21D (temperature, and humidity), and BMP085 the (pressure, and temperature). Of course other sensors could be considered depending on final application.
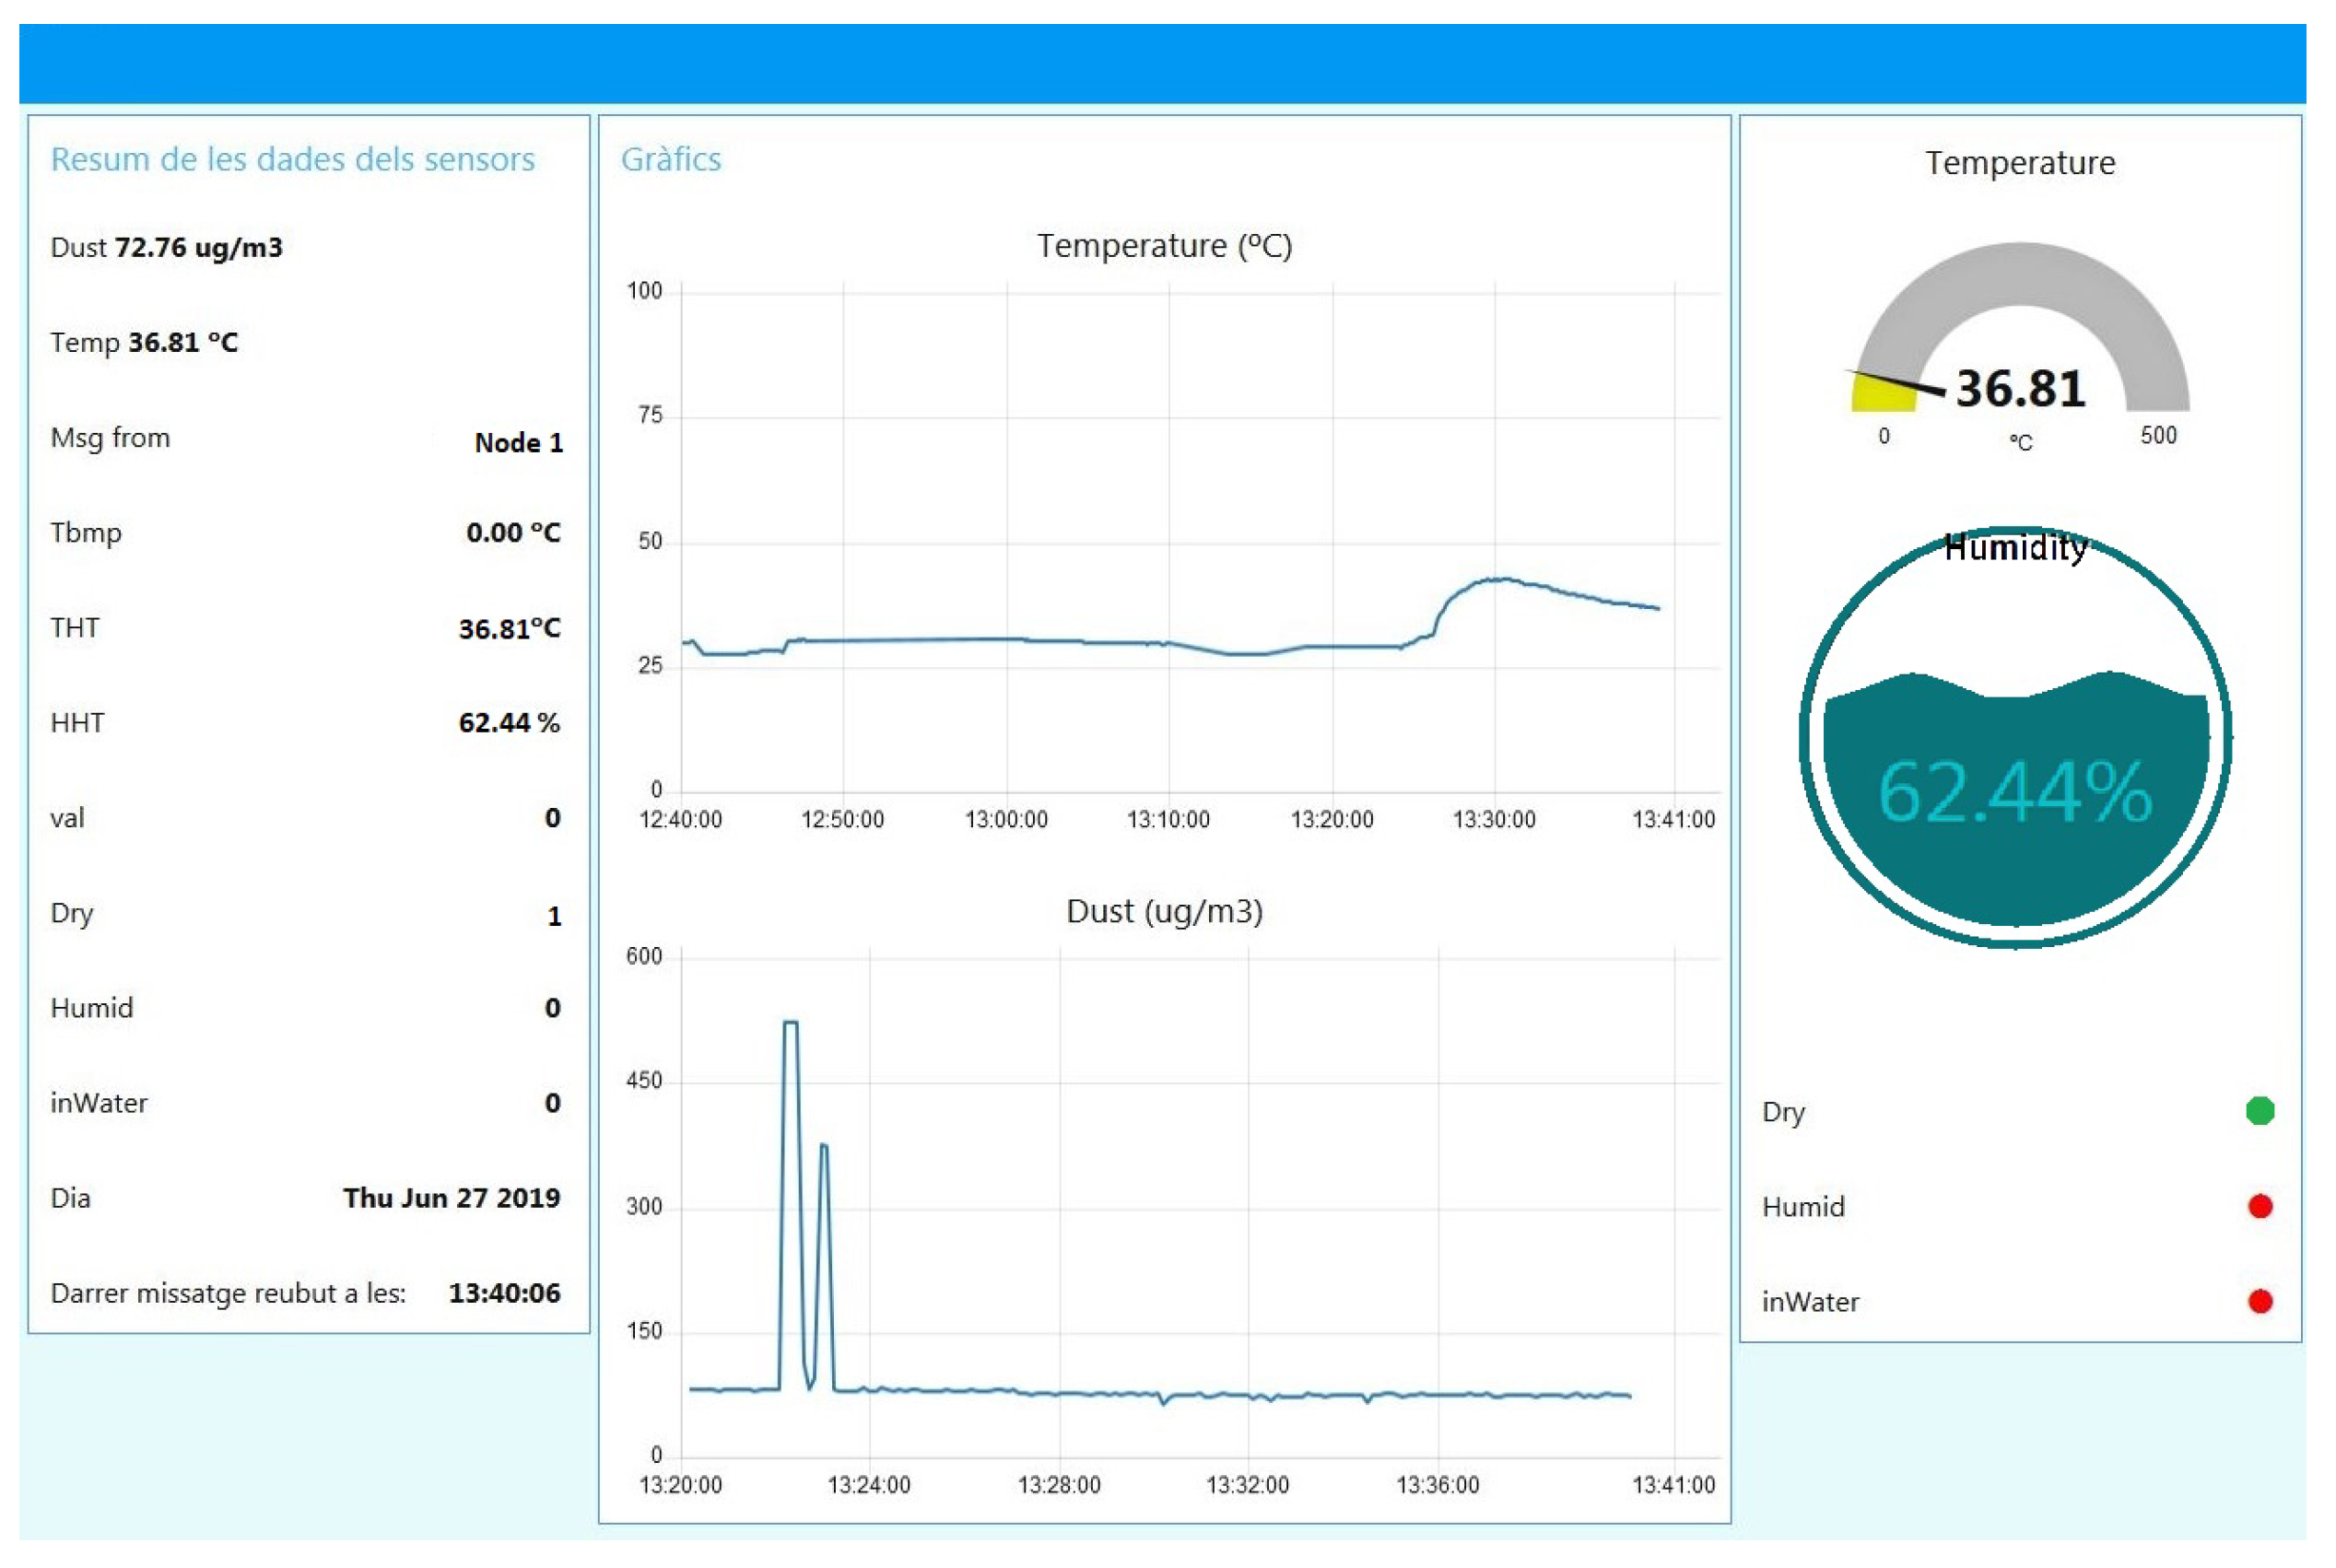
The rest of the system aproach has been implemented to validate not only the BUS topology, but also the connection with the end user is a realistic context. Therefore, the
Main Node connects to the
Gateway using the LoRaWAN protocol. Finally, the
Gateway is registered in the Network Server TTN platform and all messages sent and received from the BUS nodes are transmitted to the Node_Red App as the final application, where the sensor data can be displayed in the user-friendly platform. The measurements can be represented in graphs, levels, and warning pop-ups indicators so an end user can easily interpret the data efficiently. The sensor data is visualized using the App implemented using TTN and Node_Red tools and presented in
Figure 7.
This complete approach has been used to analyse and evaluate the LoRaBUS approach considering its power requirements, the link quality and its performance in different scenarios.
4.1. Sensor nOde Power Consumption Requirements
The power consumption of a
Sensor node has been measured during different stages of its workflow. The experimental results show that the highest current consumption corresponds to the LoRa transmission with a value of 160 mA. The transmission was performed with frequency=868MHz, tx-power=2 dBm, bandwidth= 125KHz, Spread Factor (SF)=7, and Coding-Rate (CR)=4/5. On the contrary, when the LoRa transcesiver was turned off and CPU is in the Deep Sleep mode, the consumption dropped to 7 mA. As was expected, results presented in
Table 4 demonstrate that the transmission task is one of the most energy-wasting processes in the entire workflow of a
Sensor node.
On the contrary, when analyzing the total time allocated to each task, it becomes evident that the Sensor Node spends most of its time idle in DeepSleep mode (refer to the
Time column in
Table 4). Consequently, the energy consumption over a complete node cycle must consider the time dedicated to each task. Although the LoRa transmission task exhibits the highest energy consumption per unit time, the duration of this task is very short. As a result, the
Consumption column in
Table 4 shows that the energy consumption attributed to transmission is negligible compared to the energy consumed during the node’s standby periods.
These results highlight the importance of optimizing both the choice of sensor devices and the CPU, particularly concerning their idle (particularly, the DeepSleep mode) power consumption. Reducing idle power consumption is critical to significantly lowering the overall energy requirements, especially given the operational cycle anticipated for these remote monitoring systems.
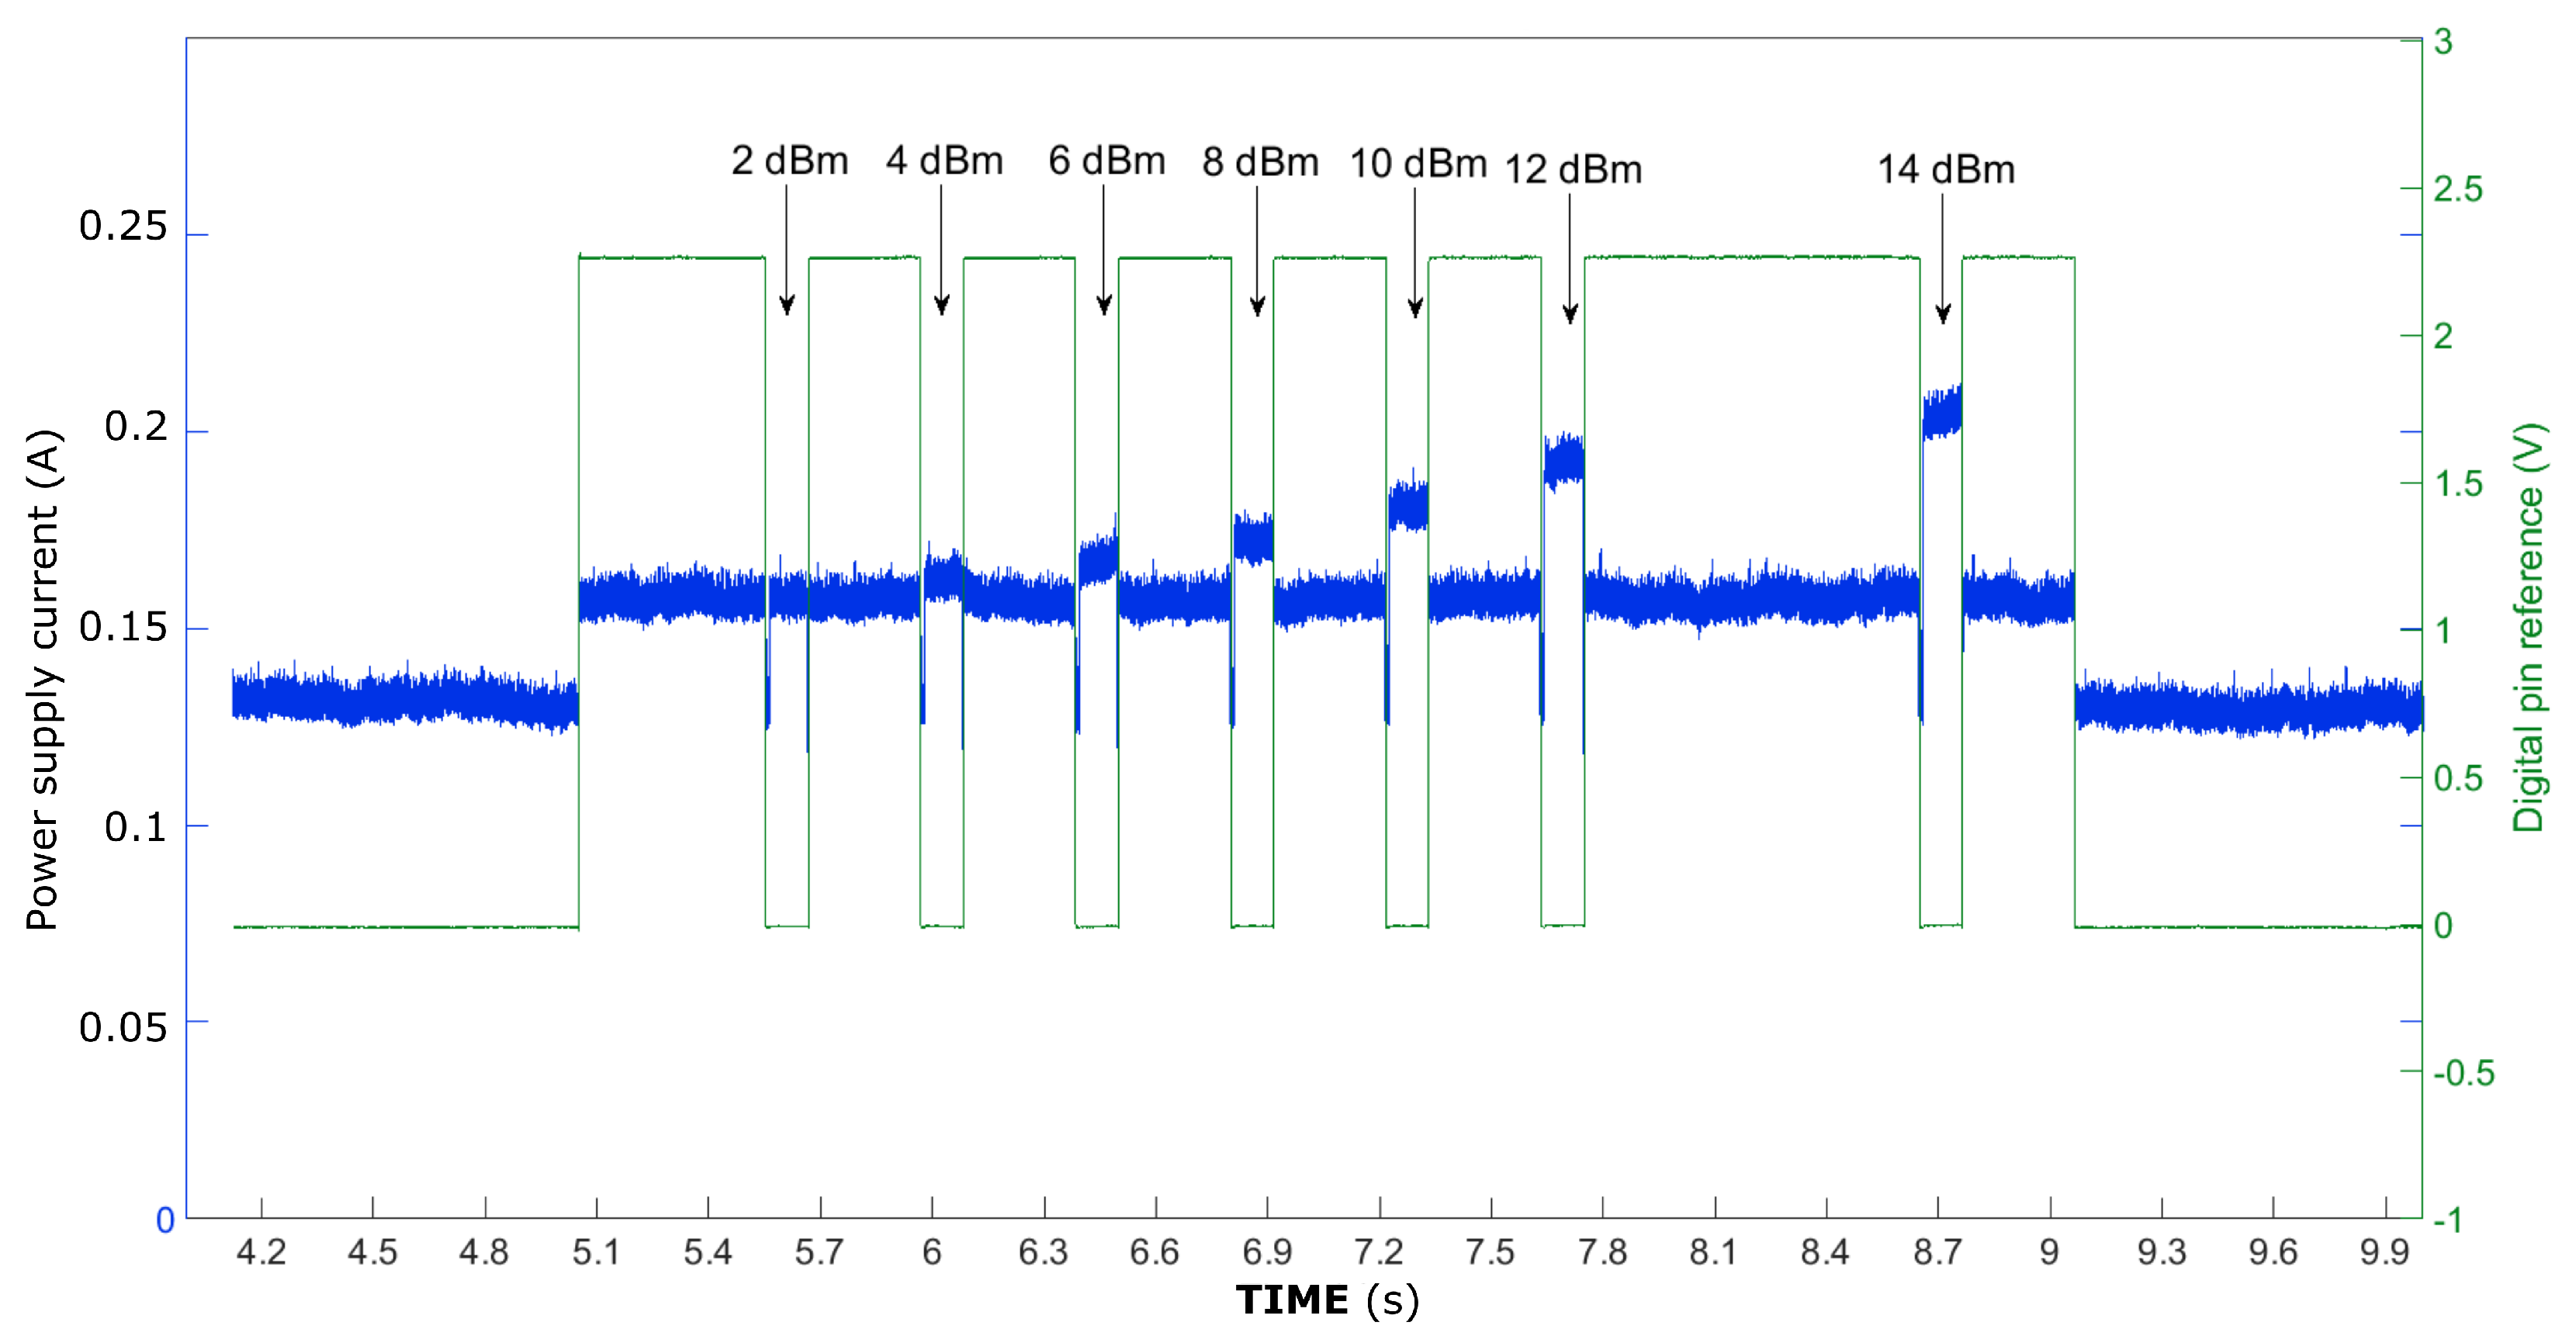
An important parameter to adjust when sending a message is the transmission power level. In order to evaluate its impact on power consumption, two sensor nodes were placed 5 meters apart, and the same message was transmitted while gradually increasing the transmission power level from 2 dBm (minimum) to 14 dBm (maximum). The results, shown in
Figure 8, indicate that reducing the transmission power level to the minimum can decrease power consumption by 50 mA (a reduction of 25%). This behaviour is aligned with the reported in work [
16], where similar IoT transmitters were evaluated reporting exponential dependence between the power consumption and the transmission power level used to send messages.
Taking into account that the hardware used was not specifically selected for low power consumption, as show the data in
Table 4, the battery lifetime is estimated considering a battery with a capacity of 2000 mAh. The lifetime would be 2022 cycles = 7.27 days), assuming one transmission with x_power of 2dBm every 5 min. It must be noted that the hardware used to prototype the nodes was not specifically designed for long periods of Deep Sleep function. In the current implementation the use of renewable power sources such as solar panels are mandatory.
4.2. Node Communication Quality
The quality and reliability of the LoRa-based communications have been also evaluated using the implemented prototype. Because the communication links are based using two types of LoRa-based protocols, firstly, the LoRaWAN communication between the Main Node and the Gateway is tested. Afterwards, the coverage between Sensor nodes using LoRaBUS, followed by a performance test of the proposed protocol.
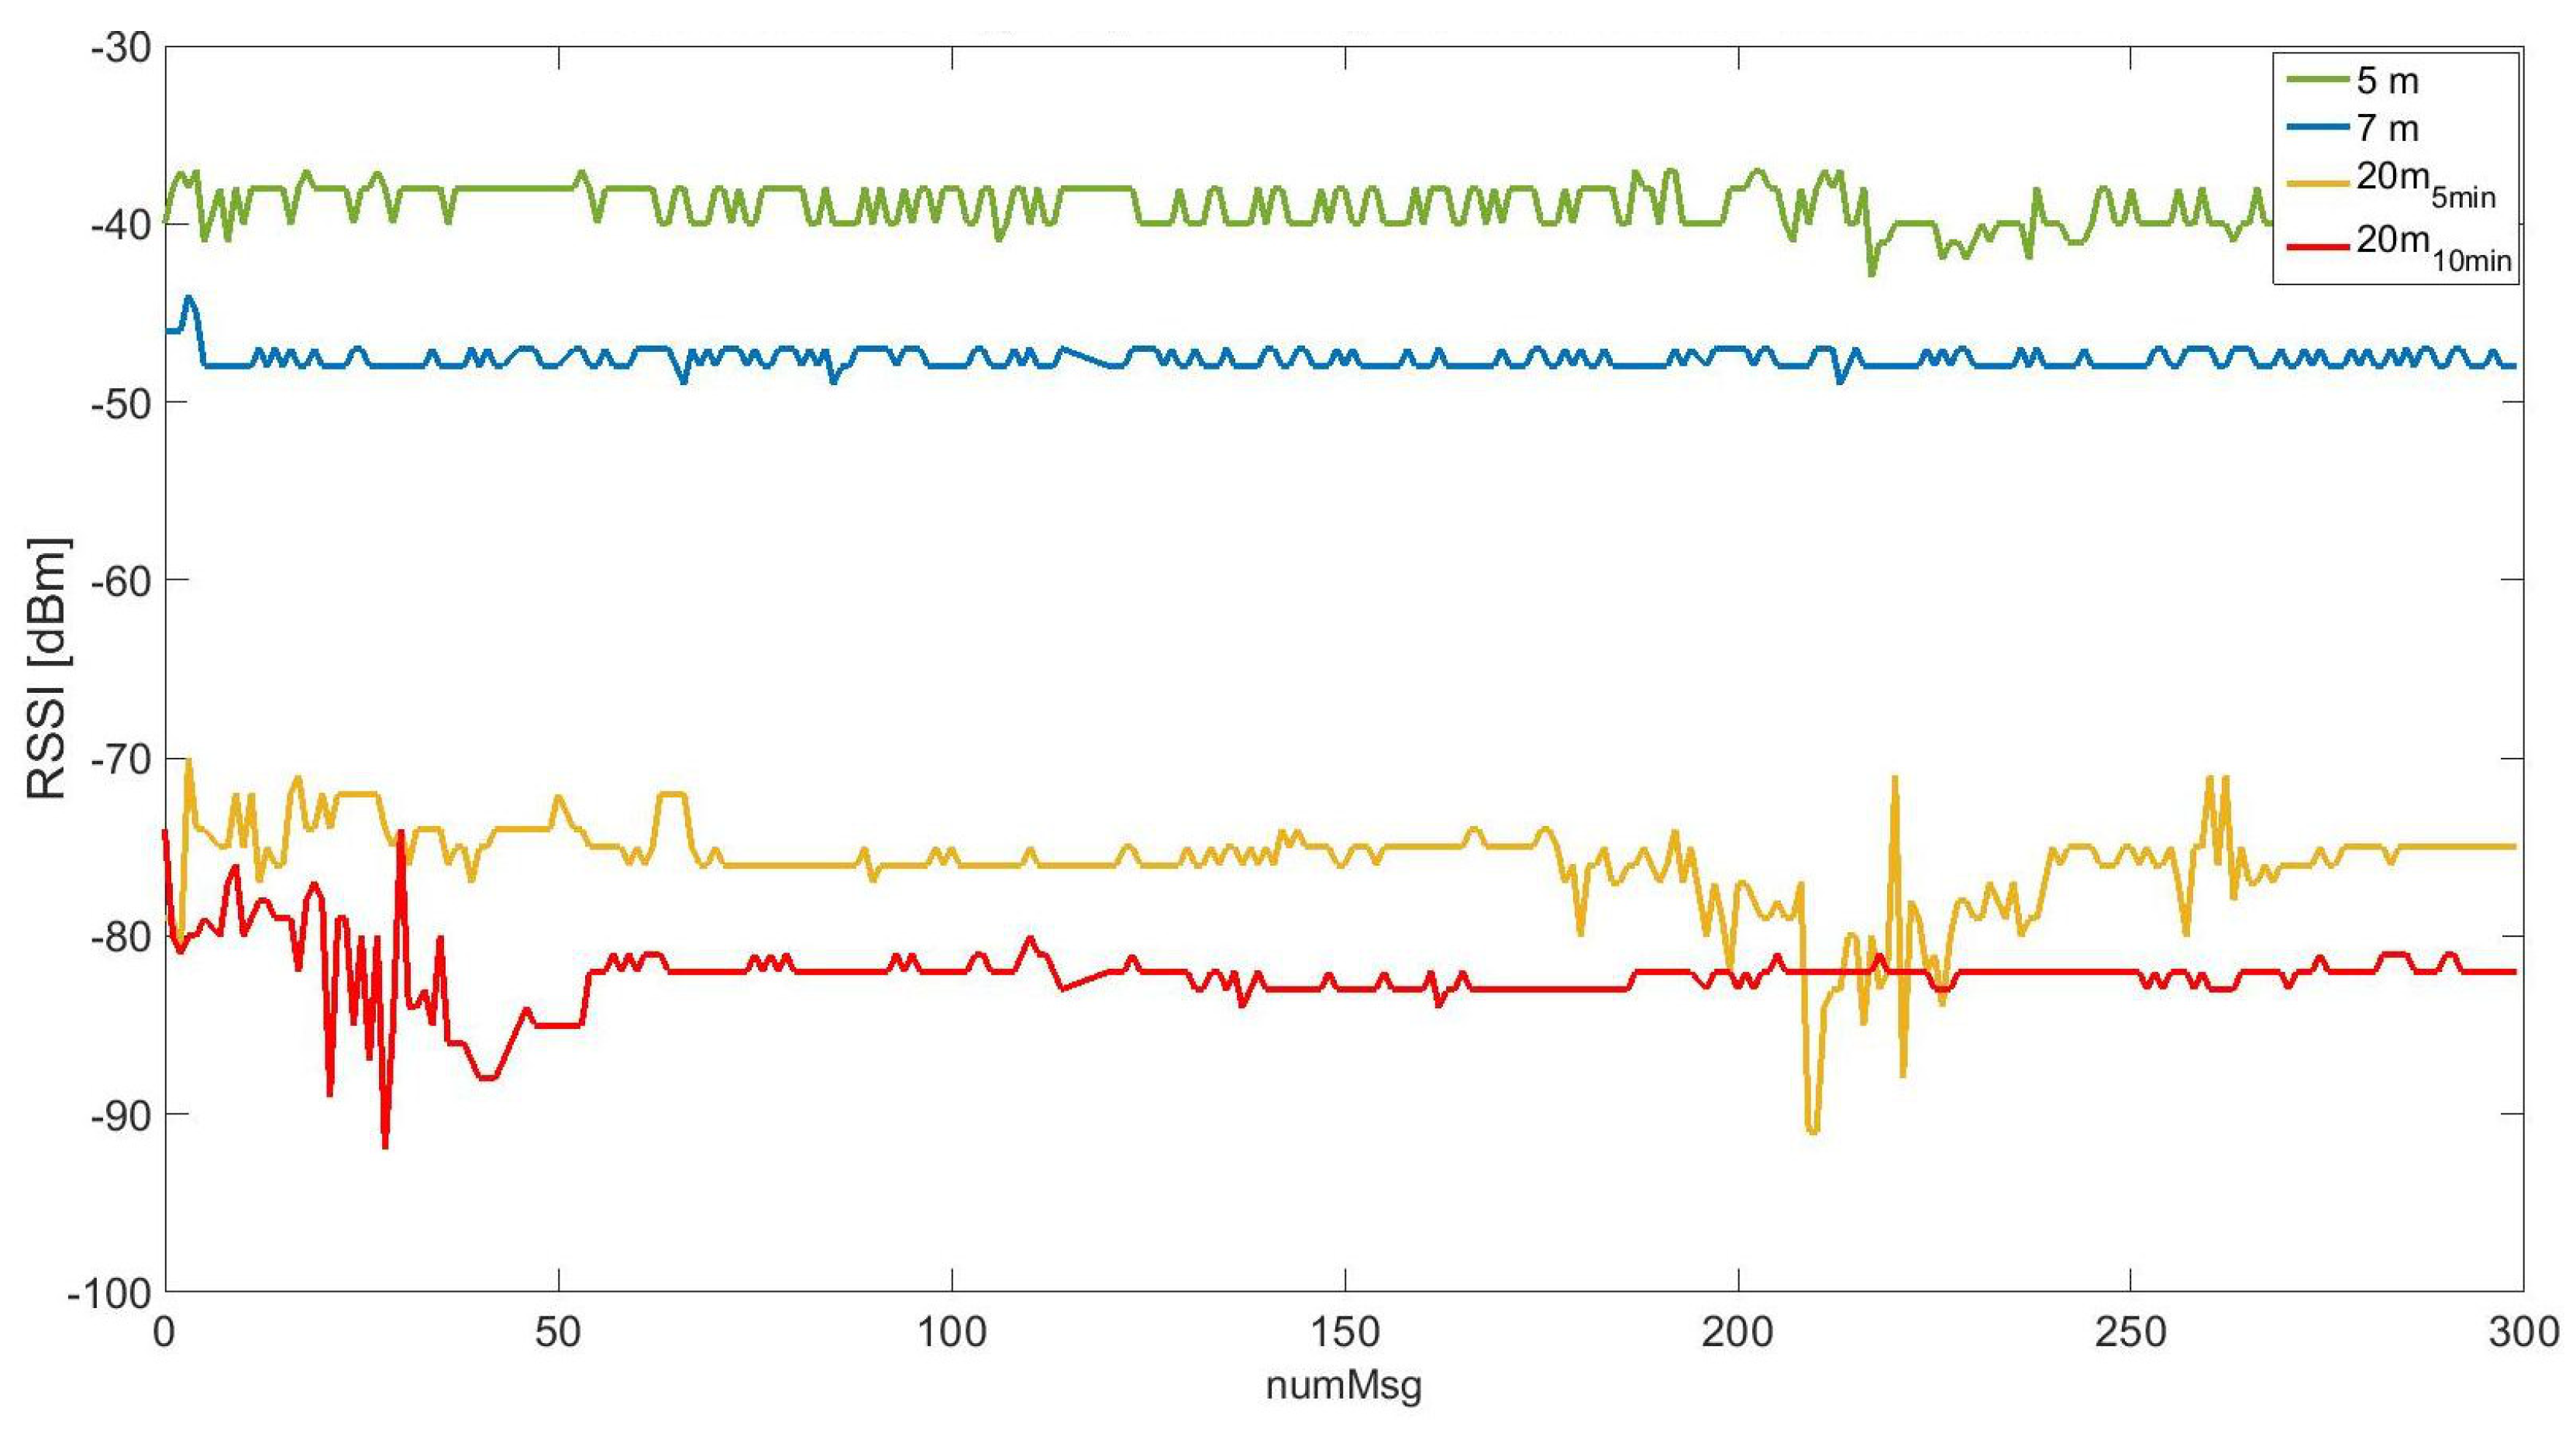
The main goal of the LoRaWAN test was to evaluate three characteristic parameters of the communications, observing the influence of physical, and electromagnetic interference on the communication link between the Main Node and the Gateway. The metrics used in this test are: Packet Delivery Ratio (PDR), Signal-to-Noise Ratio (SNR), and Received Signal Strength Indication (RSSI). The obstacles of this test were implemented by increasing the distance and building elements between the nodes that were continuously trying to communicate up to 300 messages every 5 minutes with a payload of 22 bytes (frequency= 868MHZ, bandwith= 125kHz, SF= 7, CR= 4/5). Overall, three different scenarios have been evaluated:
Scenario 5m: This represents direct communication over a 5-meter distance with no obstacles. The test was carried out in a laboratory on the first floor of the University of the Balearic Islands.
Scenario 7m: In this scenario, the two nodes were placed in separate rooms, having a single wall between them.
Scenario 20m: The most complex scenario, where one node was placed 20 meters away, separated by three walls and an aisle.
The RSSI results are presented in
Figure 9 considering all scenarios. The x-axis is the number of messages send from the transmitter, while the y-axis is the RSSI value expresed in dBm.
This results are coherent because when the signal propagation and received signal parameters in scenario
5m are stronger, the RSSI is greatest (around -37dBm). On the contrary, when some obstacles are added between the nodes, the RSSI goes down to lower values below -75dBm. Additionally to the three scenarios considered, for the
20m scenario the time between message transmission has been increased, from 5 minutes to 10 minutes. This change was motivated to explore the impact of TTN servers on the message processing cue. In
Figure 9 the increasing in time between messages during the test is observed in the RSSI values as a lightly reduction, explainable by a reduction in the transmission power level used by the transmitter node due to the presence of less noise in the wireless channel.
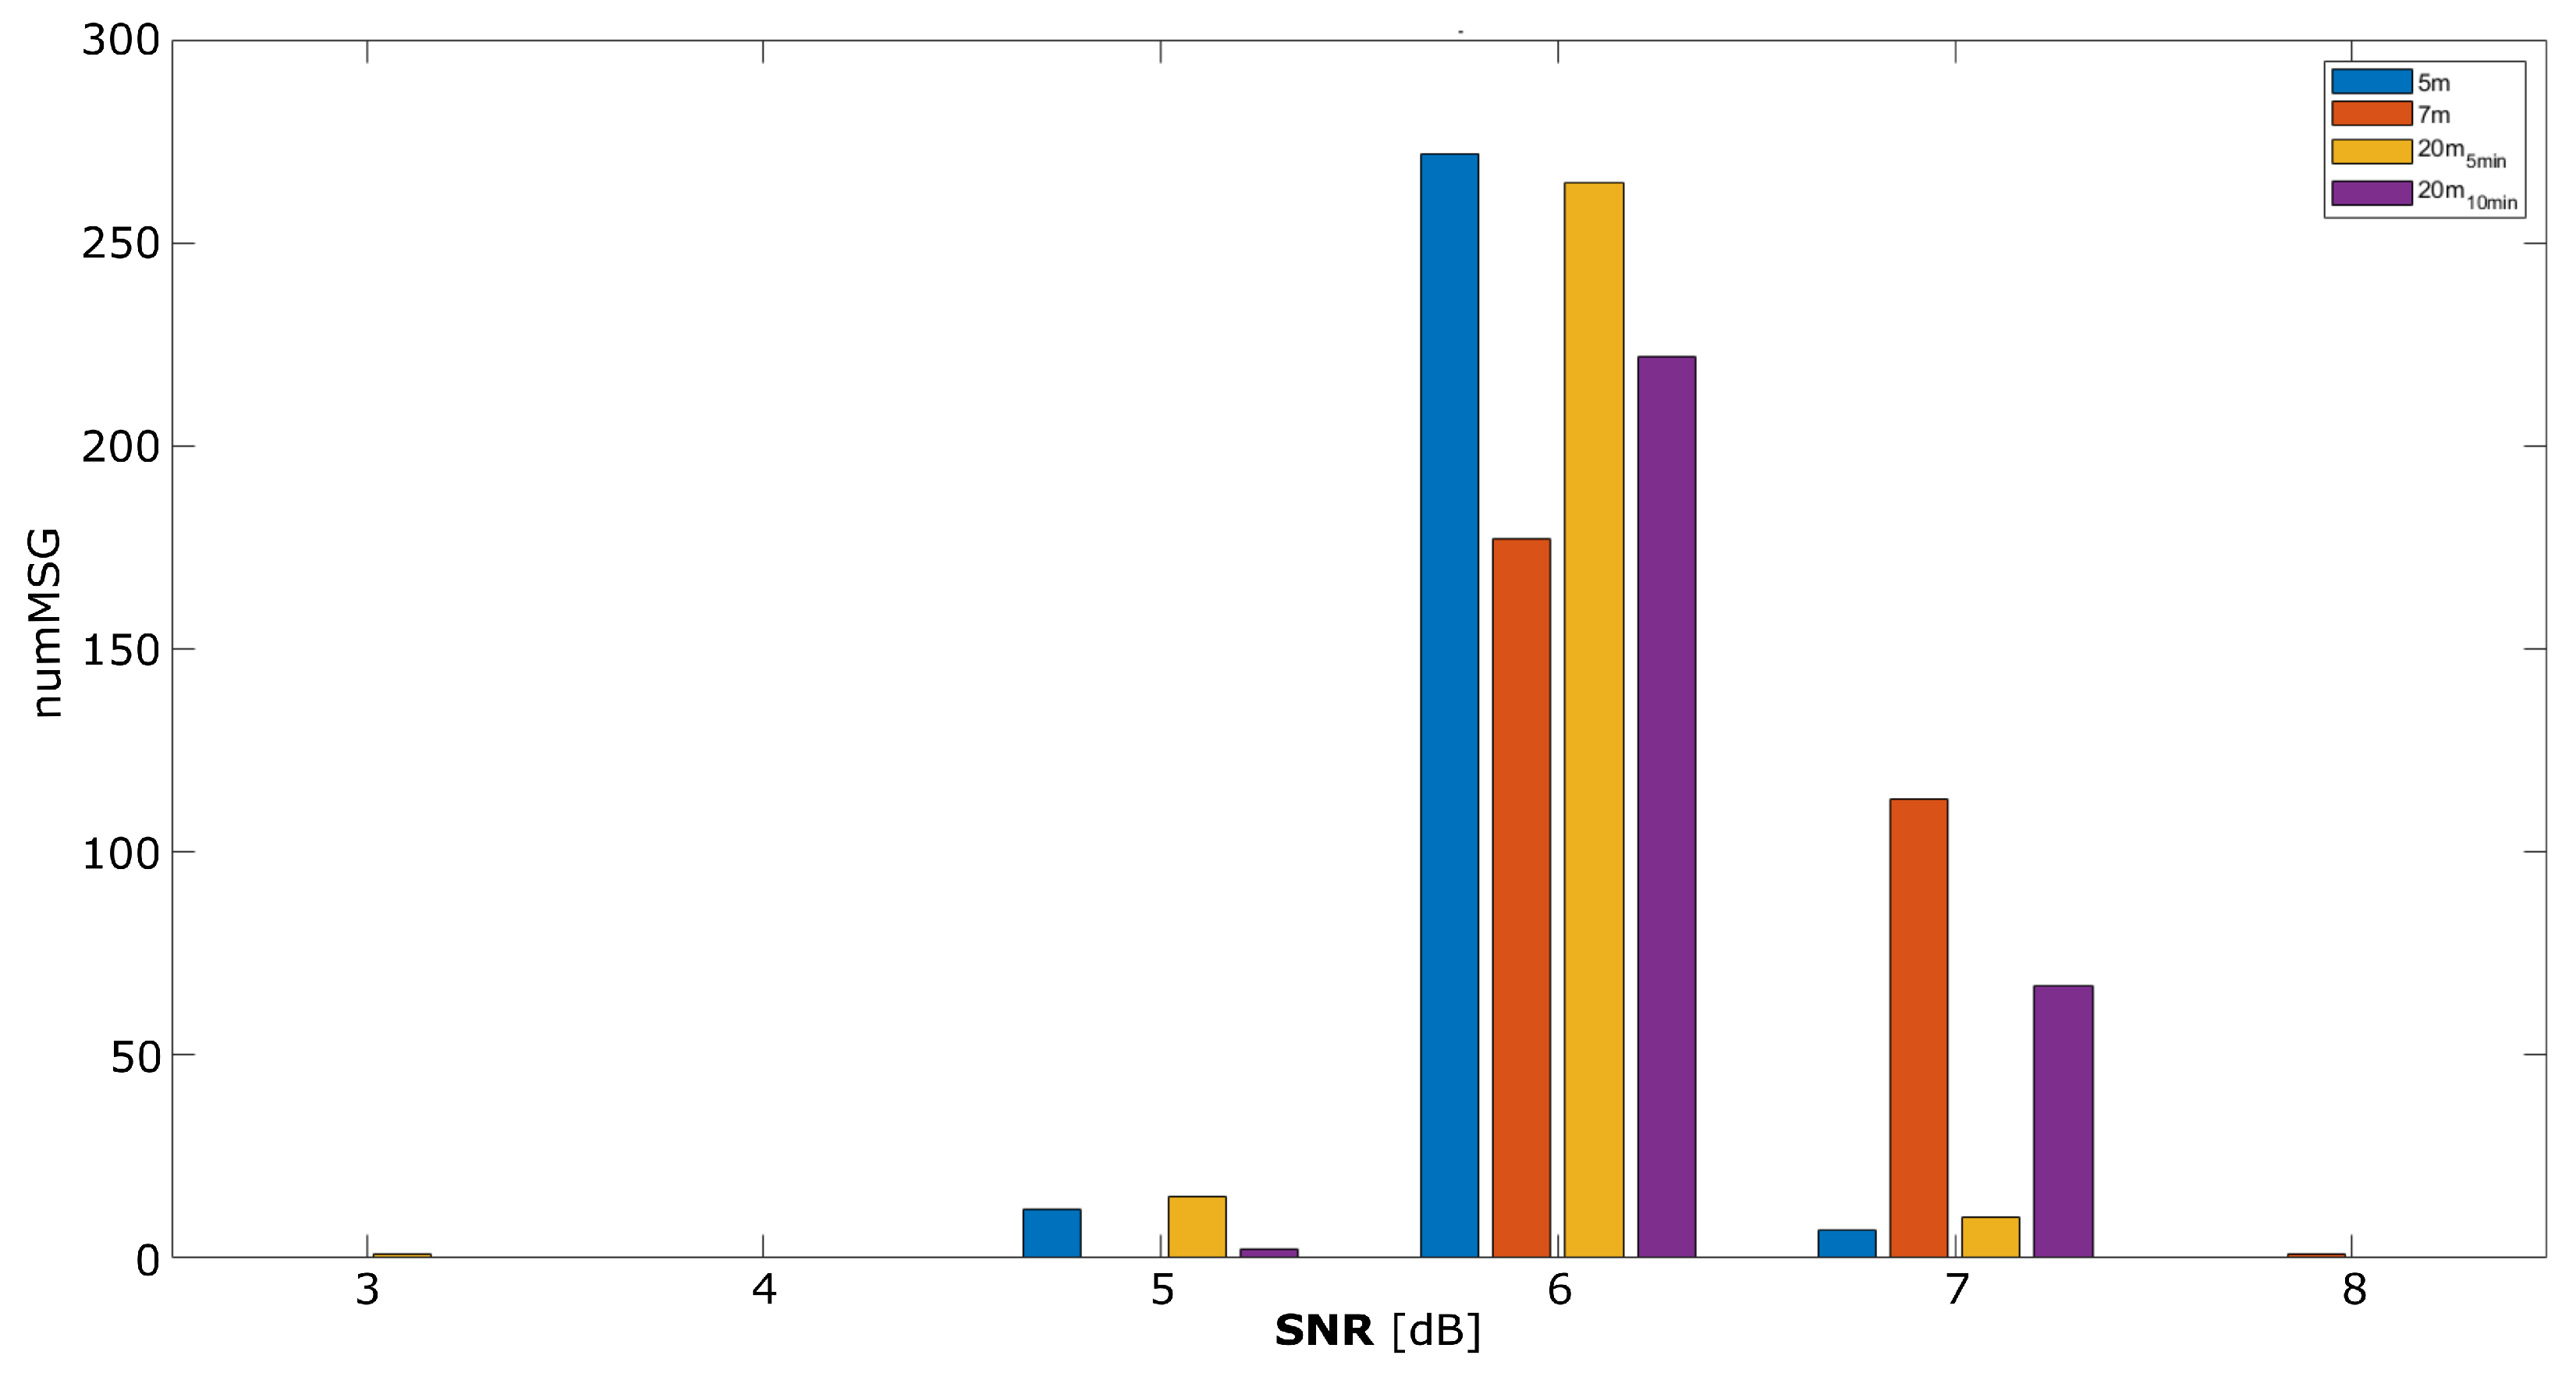
The LoRaWAN protocol automatically adjusts the power transmission needed to ensure a stable value for the SNR parameter. Again, this behaviour is the main reason to explain the low differences between scenarios reported in
Figure 10 in line with the RSSI results. Most messages were received with an SNR of 6 dB, which is considered acceptable for LoRa-based communications [
17].
The methodology followed to analyze the PDR values consisted in using the gateway to send all the messages received from the
Main Node to the Network Server (based on the TTN platform), and then the Network Server will send them to NodeRed environment, which stores all the received data. As it can be seen in
Table 5, the PDR value computed by sending messages every 5 min was not as high as expected, but this values can not be explained only due to the poor quality of the communication channel because the other parameters reported satisfactory behaviour. In order to understand these results, a review of the temporary uses of the communications space has been carried out to verify compliance with the recommendations for the use of the LoRa channel. In this sense, the experiment has been designed to archieve a Time on Aire (ToA) of 0,0566 s per message, and the transmissions were done at frequency of 868MHz every 5 min so the duty cycle was 0.02%. This means that the experiment complies with the ETSI duty cycle (<1%) [
18], and the TTN Fair Use Policy (maximum uplink airtime of 30 seconds per day) [
19]. Even so, the scenario
20m was repeated with a interval time between messages of 10 min, as a result the PDR obtained was 97%. Clearly, the total message received at is directly related to TTN workload.
The obtained results can be compared with the study in [
20], which involved indoor experiments conducted in a nine-story building at the National Research University. According to this study, for a one-floor distance (@868 MHz, SF=7), the average RSSI was -77.83 dBm, the SNR was 9.55 dB, and the PDR was 99.8%.
4.3. Point-to-Point Communication
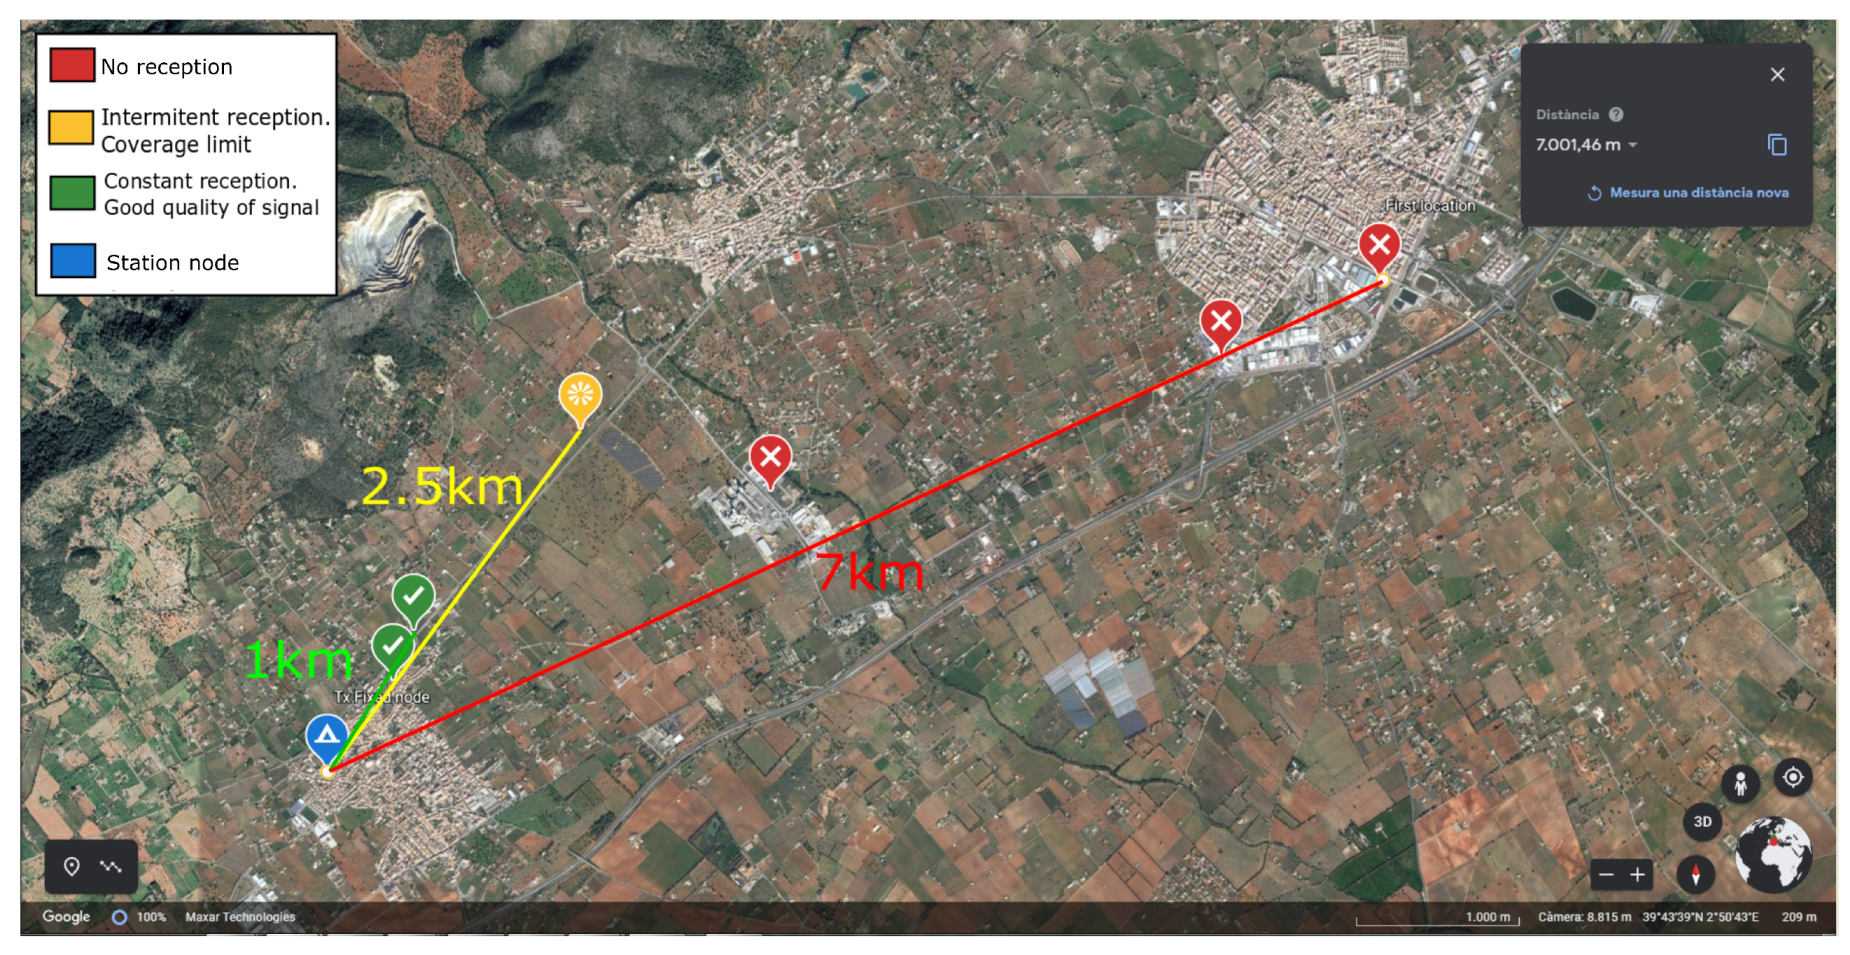
In order to evaluate the feasibility of the raw-LoRa connection in a non-controlled scenario, a
Sensor Node (station) was placed in an urban area near Binissalem, a village of Mallorca (Spain), while another
Sensor Node (rover) was located at different places and distances. The station node was activated to constantly transmit messages every 5 minutes at 14 dBm using raw-LoRa. The payload of the message was formed by an increasing counter to measure how many consecutive messages could be received at the rover node location.
Figure 11 shows the position of the station node (blue point) and the different places for the rover node. The initial rover position was in another city (Inca), 7 km away from the station node.
The rover node moved from the initial point to places closer to the station node. In each location, the rover node was left 30 minutes to receive messages from the station node. Considering the number of consecutive messages received, the different positions were classified into 3 types: good quality (green), limited coverage (yellow), and out of coverage (red). From results reported in
Figure 11, the distance raw_LoRa communication between nodes can be considered acceptable in the range of 1 and 2.5kms, considering urban environments and the specific hardware selected. This result aligns closely with the analysis presented in [
12] by X. Zhang
et al, where concluded that the point-to-point communication range of LoRa is around 1km under complex environmental conditions.
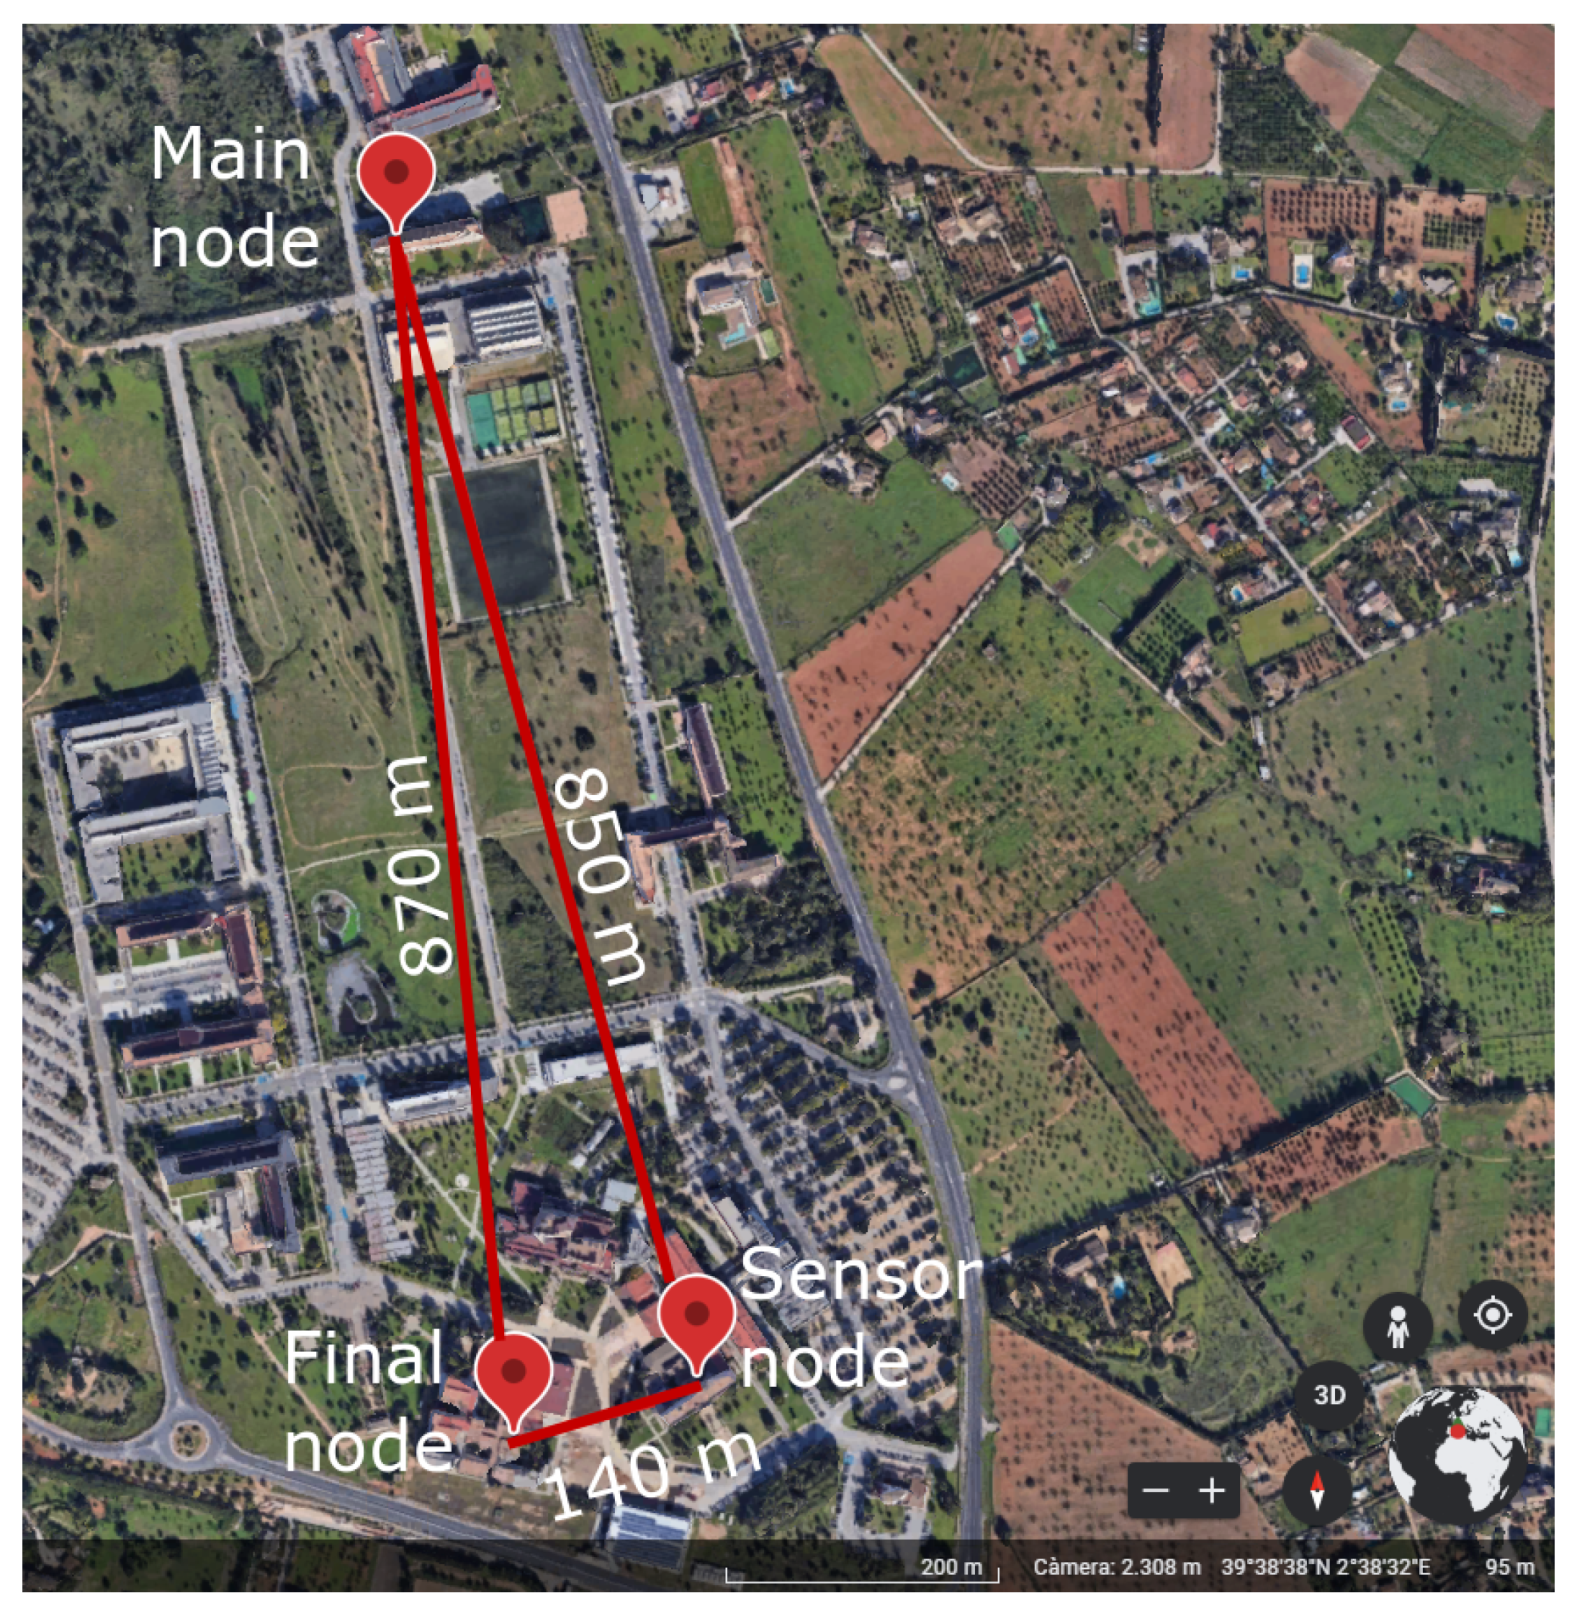
4.4. LoRaBUS Performance Analysis
Finally, the LoRaBUS proposal has been tested by means of a performance analysis that has included the evaluation of the duration of node management periods, the auto-configuration of node discovery and transmission power management, as well as the sending of messages from one end to the other of the created BUS topology network. In this performance test, three nodes were deployed on the rooftops of various buildings at the University of the Balearic Islands. The spatial distribution of these nodes is shown in
Figure 12.
Once all nodes were installed in the designed location, the self-configuration stage was initialized assuming stable (no alarm) state. This process involves the Neighbour’s Discovering stage described in
Section 3, after which the main node queried the monitored data from the other nodes.
Table 6 summarizes the time increments, following the HH:MM:SS format, required by all nodes considering the initial time as the instant of time where the
Main Node send the first
CONFIG message. These temporal references were extracted from all transmitted and received messages, stored on SD cards at each node.
The main findings of the performance test are as follows:
The nodelist was correctly generated in various configurations and locations. All BUS nodes successfully recognized which node identifier corresponds to the main, and final node, and also which nodes are its neighbors. Furthermore, in some locations, the Final Node directly received the CONFIG message from the Main Node. While this message could have been interpreted as the nodelist, the Final Node correctly waited for an alternative version and ultimately determined that the version forwarded by the Sensor Node was the correct one.
The total time elapsed from the moment the Main Node sent the initial CONFIG message to the point where all three nodes had established the nodelist was approximately 1 min and 10 sec (from 00:02:01 to 00:03:12).
The neighbors’ table of the Main Node and the Sensor Node included the identifiers of the other two nodes. Additionally, the Final Node correctly registered the identifier of the Sensor Node.
The time required to construct the neighbors’ table was approximately 8 seconds per node, resulting in a total process duration of approximately 14 seconds.
Following the configuration phase, the Main Node initiated a request for monitored data from the Final Node by sending a TOKEN message. The Sensor Node received this message and forwarded it to the Final Node. In response, the Final Node transmitted the monitored sensor data back to the Main Node, completing the process in 46 seconds. All communications during this phase were conducted using the minimum transmission power level.
Finally, the Main Node sent a TOKEN to the Sensor Node, and the response was received in 17 seconds. The total time required to collect data from both nodes was approximately 64 seconds.
5. Conclusions
In this work, we presented a linear, LoRa-based Wireless Sensor Network approach (LoRaBUS) designed for monitoring transmission power lines. This network aims to provide a reliable communication system for electrical companies to monitor variables of interest, such as weather conditions and early forest fire detection.
Related works in the literature include the study cited in [
8], where the authors propose a sensor network for monitoring overhead transmission line sag and temperature. However, their approach utilizes a LoRa-Mesh topology, requiring a gateway with GSM/LTE connectivity every 4 km. The proposed LoRaBUS approach requires only one gateway on one side of the BUS, while the last node acts as a BUS termination. In the same sense, the proposed LoRaBUS system was focused on overhead transmission lines which often follow linear paths in remote areas where conventional communication technologies may not be reliable. Additionally, these infrastructures are often difficult to access, necessitating a system that is autonomous in terms of operation, maintenance, and power supply. Experimental evaluations of the LoRa communication demonstrated that, with the selected hardware, sensor nodes can be spaced up to 2.5 km apart in suburban areas. However, this distance is highly dependent on the presence of obstacles between nodes. Furthermore, the network prototype was used to assess the performance of the communication protocol, and the results indicate that the network’s autonomous configuration can be completed within approximately 2 minutes.
Future work will involve studying the impact of distribution power lines on LoRa communication, exploring other low-power concerned hardware prototypes to enhance LoRaBUS autonomy, and evaluating the benefits of small solar panels to sustain the system’s energy requirements.
Author Contributions
Conceptualization, M.P. and B.A.-L.; methodology, M.P. and B.A.-L; software, M.P.; validation, M.P. and B.A.-L.; formal analysis, B.A.-L and E.I.; investigation, M.P.; resources, B.A.-L.; data curation, M.P. and B.A.-L.; writing—original draft preparation, B.A.-L.; writing—review and editing, B.A.-L. and E.I.; visualization, M.P. and B.A.-L.; supervision, B.A.-L. and E.I.; funding acquisition, E.I. All authors have read and agreed to the published version of the manuscript.
Funding
This research was partially funded by the
Data Availability Statement
The original contributions presented in this study are included in the article/supplementary material. Further inquiries can be directed to the corresponding author(s)
Acknowledgments
The authors would like to thank to the University of the Balearic Island and the IOTIB Laboratory for supporting this work.
Conflicts of Interest
The authors declare no conflicts of interest. The funders had no role in the design of the study; in the collection, analyses, or interpretation of data; in the writing of the manuscript; or in the decision to publish the results.
References
- Calderaro, V.; Hadjicostis, C.N.; Piccolo, A.; Siano, P. Failure Identification in Smart Grids Based on Petri Net Modeling. IEEE Transactions on Industrial Electronics 2011, 58, 4613–4623. [Google Scholar] [CrossRef]
- Moslehi, K.; Kumar, R. A Reliability Perspective of the Smart Grid. IEEE Transactions on Smart Grid 2010, 1, 57–64. [Google Scholar] [CrossRef]
- Simon, G.; Maróti, M.; Lédeczi, Á.; Balogh, G.; Kusy, B.; Nádas, A.; Pap, G.; Sallai, J.; Frampton, K. Sensor network-based countersniper system. In Proceedings of the Proceedings of the 2nd international conference on Embedded networked sensor systems, 2004; pp. 1–12. [CrossRef]
- Castillo-Effer, M.; Quintela, D.; Moreno, W.; Jordan, R.; Westhoff, W. Wireless sensor networks for flash-flood alerting. In Proceedings of the Proceedings of the Fifth IEEE International Caracas Conference on Devices, Circuits and Systems, 2004.; pp. 20041142–146. [CrossRef]
- Lo, B.P.L.; Thiemjarus, S.; King, R.C.; Yang, G.Z. BODY SENSOR NETWORK – A WIRELESS SENSOR PLATFORM FOR PERVASIVE HEALTHCARE MONITORING. 2005.
- Chinrungrueng, J.; Sunantachaikul, U.; Triamlumlerd, S. Smart Parking: An Application of Optical Wireless Sensor Network. In Proceedings of the 2007 International Symposium on Applications and the Internet Workshops; 2007; pp. 66–66. [Google Scholar] [CrossRef]
- Mohd Kassim, M.R.; Mat, I.; Harun, A.N. Wireless Sensor Network in precision agriculture application. In Proceedings of the 2014 International Conference on Computer, Information and Telecommunication Systems (CITS); 2014; pp. 1–5. [Google Scholar] [CrossRef]
- Wydra, M.; Kubaczynski, P.; Mazur, K.; Ksiezopolski, B. Time-Aware Monitoring of Overhead Transmission Line Sag and Temperature with LoRa Communication. Energies 2019, 12. [Google Scholar] [CrossRef]
- Gascón, D. Redes de Sensores Inalámbricos, la tecnología invisible. Tecnología y sociedad.
- Zeng, H.; Zuo, P.; Deng, F.; Zhang, P. Monitoring System of Transmission Line in Mountainous Area Based on LPWAN. Energies 2020, 13. [Google Scholar] [CrossRef]
- Augustin, A.; Yi, J.; Clausen, T.; Townsley, W.M. A Study of LoRa: Long Range & Low Power Networks for the Internet of Things. Sensors 2016, 16. [Google Scholar] [CrossRef] [PubMed]
- Zhang, X.; Zhang, M.; Meng, F.; Qiao, Y.; Xu, S.; Hour, S. A Low-Power Wide-Area Network Information Monitoring System by Combining NB-IoT and LoRa. IEEE Internet of Things Journal 2019, 6, 590–598. [Google Scholar] [CrossRef]
- Ergen, S.C. ZigBee/IEEE 802.15. 4 Summary. UC Berkeley, September 2004, 10, 11. [Google Scholar]
- Alliance, L. Lorawan specification. LoRa Alliance, 2015; 1–82. [Google Scholar]
- Liu, Y.; Liu, Y.; Xu, H.; Teo, K.L. Forest fire monitoring, detection and decision making systems by wireless sensor network. In Proceedings of the 2018 Chinese Control And Decision Conference (CCDC). IEEE; 2018; pp. 5482–5486. [Google Scholar] [CrossRef]
- Rodriguez-Navas, G.; Ribot, M.A.; Alorda, B. Understanding the Role of Transmission Power in Component-Based Architectures for Adaptive WSN. In Proceedings of the 2012 IEEE 36th Annual Computer Software and Applications Conference Workshops; 2012; pp. 520–525. [Google Scholar] [CrossRef]
- Mobilefish. LoRa/LoRaWAN tutorial 10: RSSI and SNR.
- (ETSI), E.T.S.I. Final Draft ETSI EN 300 220-2 V3.2.1. 33.
- TTN Documentation: Maximum duty cycle. The Things Industries.
- Bobkov, I.; Rolich, A.; Denisova, M.; Voskov, L. Study of LoRa Performance at 433 MHz and 868 MHz Bands Inside a Multistory Building. In Proceedings of the 2020 Moscow Workshop on Electronic and Networking Technologies (MWENT); 2020; pp. 1–6. [Google Scholar] [CrossRef]
Figure 1.
Typical topologies of WSN. Adapted from [
13].
Figure 1.
Typical topologies of WSN. Adapted from [
13].
Figure 2.
Linear topology of LoRaBUS.
Figure 2.
Linear topology of LoRaBUS.
Figure 3.
Elements of the proposed LoRaBUS system, and their connections.
Figure 3.
Elements of the proposed LoRaBUS system, and their connections.
Figure 4.
OSI layers defined in each node type.
Figure 4.
OSI layers defined in each node type.
Figure 5.
Schematic example of the results obtained with the Discovering Neighbours process on a 6-node BUS network: nodelist, neighbour’s table of node 3 and initial transmission power level.
Figure 5.
Schematic example of the results obtained with the Discovering Neighbours process on a 6-node BUS network: nodelist, neighbour’s table of node 3 and initial transmission power level.
Figure 6.
Procedure followed to completing neighbour’s table with minimum transmission power for each node.
Figure 6.
Procedure followed to completing neighbour’s table with minimum transmission power for each node.
Figure 7.
Data screen implemented on Node_Red where Sensor node information can be reviewed.
Figure 7.
Data screen implemented on Node_Red where Sensor node information can be reviewed.
Figure 8.
Consumption of a node with different LoRa power transmission levels.
Figure 8.
Consumption of a node with different LoRa power transmission levels.
Figure 9.
Received Signal Strength Indication (RSSI) with different distances between nodes. RSSI-axis range is [-30,-100] dBm.
Figure 9.
Received Signal Strength Indication (RSSI) with different distances between nodes. RSSI-axis range is [-30,-100] dBm.
Figure 10.
SNR for the different test scenarios. On the X-axis, we find the SNR values within the range [+3, +8] dB. On the Y-axis, we find the number of messages received with each corresponding SNR value.
Figure 10.
SNR for the different test scenarios. On the X-axis, we find the SNR values within the range [+3, +8] dB. On the Y-axis, we find the number of messages received with each corresponding SNR value.
Figure 11.
Experimental coverage test in an urban area, performed between Inca, and Binissalem (Mallorca, Spain).
Figure 11.
Experimental coverage test in an urban area, performed between Inca, and Binissalem (Mallorca, Spain).
Figure 12.
Map example of different locations used for the network operation test in the campus.
Figure 12.
Map example of different locations used for the network operation test in the campus.
Table 1.
Payloads of messages used in the Discovering Neighbours process.
Table 1.
Payloads of messages used in the Discovering Neighbours process.
| Message Type |
Payload |
| CONFIG |
CONFIG + power_tx + id1 + id2 +...+ idFinal + checksum |
| STOP |
STOP +power_tx + nodelist + idSend + checksum |
Table 2.
Payloads of messages used in the Neighbour’s table process.
Table 2.
Payloads of messages used in the Neighbour’s table process.
| Message Type |
Payload |
| DISCOVER |
DISCOVER + tx_power + id + checksum |
| DISCOVER_NEXT |
DISCOVER_NEXT + tx_power + id_next + checksum |
| DISCOVER_END |
DISCOVER_END + tx_power + id + checksum |
| HELLO |
HELLO + tx_power + id + checksum |
Table 3.
Payloads of messages used in the LoRaBUS for data transmission.
Table 3.
Payloads of messages used in the LoRaBUS for data transmission.
| Message Type |
Payload |
| TOKEN |
TOKEN + id_token + id_from + id_to + checksum |
| ALARM |
ALARM + id_from + sensor_data + checksum |
| INFO |
INFO + id_from + id_to + sensor_data + checksum |
Table 4.
Summary of energy consumption of a node.
Table 4.
Summary of energy consumption of a node.
| Mode |
Current [mA] |
Time [s] |
Consumption [mAh] |
| raw-LoRa Transmitt |
160 |
0,1150 |
0,0051 |
| Idle |
140 |
5 |
0,194 |
| To read sensors |
140 |
5,3 |
0,21 |
| DeepSleep |
7 |
300 |
0,58 |
| Cycle |
- |
310,415 |
0,9891 |
Table 5.
Packet Delivery Ratio in indoor environment.
Table 5.
Packet Delivery Ratio in indoor environment.
| Distance [m] |
Messages Sent |
Messages Received |
PDR[%] |
| 5 |
300 |
231 |
77 |
| 7 |
300 |
230 |
76,67 |
| 20 |
300 |
239 |
79,6 |
| 20 (10 min) |
300 |
291 |
97 |
Table 6.
Most relevant timestamps of the workflow (timestamp format HH:MM:SS ).
Table 6.
Most relevant timestamps of the workflow (timestamp format HH:MM:SS ).
| |
Main Node |
Sensor |
Final |
| Instant Description |
Node |
Node |
Node |
| To install & place the node |
00:00:00 |
00:00:00 |
00:00:00 |
| Sending the first CONFIG msg |
00:02:01 |
00:02:13 |
00:02:15 |
| Receiving the first CONFIG msg |
00:02:14 |
00:02:07 |
00:02:13 |
| Obtaining the nodelist
|
00:03:12 |
00:03:11 |
00:03:10 |
| Sending DISCOVER for the 1st time |
00:05:56 |
00:05:31 |
00:05:17 |
| Obtaining its neighbour’s table |
00:06:09 |
00:05:39 |
00:05:36 |
|
Disclaimer/Publisher’s Note: The statements, opinions and data contained in all publications are solely those of the individual author(s) and contributor(s) and not of MDPI and/or the editor(s). MDPI and/or the editor(s) disclaim responsibility for any injury to people or property resulting from any ideas, methods, instructions or products referred to in the content. |
© 2024 by the authors. Licensee MDPI, Basel, Switzerland. This article is an open access article distributed under the terms and conditions of the Creative Commons Attribution (CC BY) license (http://creativecommons.org/licenses/by/4.0/).