
Submitted:
27 December 2024
Posted:
30 December 2024
You are already at the latest version
Abstract
The development of technologies using the Internet of Things (IoT) concept evolves daily. These numerous technologies, such as LoRa (Long Range) transceivers, find applications in various domains, including monitoring natural disasters and those caused by human error. Security vulnerabilities arise concurrently with the advancement of these new technologies. Cyberattacks seeking to disrupt device availability, such as Denial of Service (DoS) attacks, can effectively exploit vulnerabilities in LoRa devices, hindering disaster monitoring efforts. Therefore, our goal is to assess the network parameters that impact the development of a disaster monitoring environment using LoRaWAN. Specifically, we aim to identify the parameters that could result in network availability issues, whether caused by malicious actors or configuration errors. Our results indicate that certain LoRa network parameters (collision checks, packet size, and the number of nodes) can significantly affect network performance, potentially rendering this technology unsuitable for building robust disaster monitoring systems.
Keywords:
LoRa networks
; availability
; internet of things
; disaster management
1. Introduction
The development of new devices utilizing the Internet of Things (IoT) has facilitated the application of this paradigm in numerous sectors, including business, medicine, security, agriculture, transportation, and entertainment. The fundamental concept underlying this idea is utilizing diverse objects or devices, such as radiofrequency identifiers, sensors, actuators, cameras, and smartphones. Interconnected through various networking techniques, these devices can collaborate to achieve many shared objectives [1].
An important application of IoT pertains to disaster management, encompassing both natural occurrences and those resulting from human error. Examples of this application include monitoring volcanic activities [2], implementing earthquake early warning systems [3], and deploying online monitoring systems for forest fire detection [4]. While detection devices and early warning systems cannot prevent natural disasters, they play a crucial role in preparing the population and initiating contingency measures to mitigate the extent of the disaster’s consequences [5].
LoRa (Long Range) is a radio frequency technology for transceivers that employs spread spectrum modulation techniques [6]. This technology utilizes more bandwidth for transmission than the original message requires while maintaining the signal strength, thereby increasing the difficulty of interception or obstruction [7]. LoRa technology was developed by Semtech specifically for IoT devices and applications that necessitate the collection of thousands of sensor readings from various regions, including those with limited access [6]. Consequently, it finds application in a wide range of fields, including IoT [8,9], smart cities [10,11], and disaster management [12,13,14,15,16,17].
The LoRaWAN protocol defines the architecture and communication rules for LoRa technology. LoRaWAN, short for Low Power Wide Area Network (LPWAN) [18], utilizes transceivers with extensive operational range, low power consumption, cost-effectiveness, and high scalability [19].
In light of the contemporary significance of disaster detection, these devices must incorporate robust security mechanisms to ensure uninterrupted service and secure communication. For example, Noura et al. [20] extensively discuss various security threats associated with the LoRaWan protocol. Several recent studies [21,22,23,24,25] have explored the performance of LoRaWAN networks across various scenarios. However, a gap in the literature regarding performance degradation in disaster monitoring contexts remains. This paper aims to address this gap by evaluating the impact of different network parameters on the performance of LoRaWAN-based disaster monitoring scenarios. Specifically, we investigate which parameters could lead to network exhaustion, akin to denial-of-service attacks. For this, we constructed an experimental disaster management scenario focusing on critical flooding points in Belo Horizonte, Brazil. Subsequently, we utilized LoRaSim, a discrete-event simulator based on SimPy, to simulate diverse experimental scenarios centered on LoRa networks.
The remainder of this paper is structured as follows. Section 2 discusses relevant literature on utilizing LoRa technology in disaster monitoring environments and research focused on exploiting vulnerabilities in LoRaWAN devices. Section 3 offers a concise overview of LoRa technology and introduces the LoRaSim tool. Section 4 details our simulated disaster management scenario, which is based on the city of Belo Horizonte, Brazil. Section 5 presents the experimental scenarios and their corresponding results. Finally, in Section 6, we provide concluding remarks and suggest potential avenues for future research.
2. Related Work
In this section, we provide a literature review about the following topics: i) solutions and architectures that use LoRa technology for disaster monitoring [12,13,14,15,16,17], ii) vulnerabilities in LoRaWAN devices and networks, which can be exploited to cause denial of service attacks [19,26], and iii) performance studies in LoRa networks.
[12] proposed a LoRa mesh network system for forest fire detection and location alerts through the Google Maps application. This system employs multiple nodes comprising Arduino Uno microcontrollers, LoRa modules, DHT11 humidity and temperature sensors, and MQ2 gas sensors. The authors concluded that, within the forest, it was feasible to transmit data using a LoRa device up to a maximum distance of 500 meters, with an acceptable Received Signal Strength Indication (RSSI) level threshold for data transmission within the forest set at -136 dBm. Data may be partially or entirely lost if the RSSI level falls below -136 dBm. To mitigate data collisions in a 4-node mesh network, they recommended a transmission interval exceeding 20,200 milliseconds. This research shares similarities with ours, as it also seeks to identify optimal LoRaWAN network configurations for monitoring potential disaster scenarios.
In their study [13], the authors proposed a flood monitoring system utilizing LoRa technology, which they tested in a real-world scenario. Information is collected by a device equipped with sensors and a microcontroller connected to a LoRa wireless module for data transmission. Subsequently, the data is processed and stored within a web-based infrastructure, where an alarm function is implemented during a flood. Our research also focuses on the investigation of flood monitoring systems.
The research presented in [14] addresses the challenge of selecting alternative communication methods when energy providers and the Internet experience disruptions. The authors employ a LoRaWAN architecture to establish the essential parameters, enabling residents of Coquimbo, Chile, to communicate their status to emergency services and public authorities following an earthquake. In alignment with the authors’ efforts, our study also delves into diverse system configurations to assess their attributes and constraints, enhancing our comprehension of their scalability and adaptability to other contexts.
In [26], the authors identified three vulnerabilities in the LoRaWAN protocol specification that could be exploited to launch denial-of-service attacks. They conducted simulations and analysis using the CPNTools tool, confirming the exploitability of these vulnerabilities in DoS attacks. The first vulnerability pertains to the absence of cryptographic or digital signature protection for ’beacons’ transmitted over ’gateways’ to device class B receive windows. This renders ’beacons’ susceptible to manipulation through eavesdropping and replay attacks. Exploiting this vulnerability can lead to the desynchronization of the receive windows of Class B devices, resulting in a denial of service for their downlink traffic. The analysis conducted by the authors further affirms that this vulnerability persists in the LoRaWAN v1.1 specification. Vulnerabilities two and three are also linked to eavesdropping and replay attacks.
In the study presented in [19], the authors investigate the resilience of LoRaWAN concerning energy attacks, which seek to deplete the energy of devices connected to the network. The author assumes that the device’s maximum energy consumption occurs during transmissions, with slightly lower consumption during receptions and very low consumption when the device is idle. Consequently, it was deduced that prolonging the energy consumption duration during transmissions and receptions would compromise the device’s overall energy efficiency. The study analyzed three methods for increasing energy consumption. The first method involves implementing a Denial of Service (DoS) attack. To maintain connectivity and manage device mobility, a device may periodically issue a link verification request or request confirmation of its data packet. In such cases, if no response is received, the device may assume that channel conditions have become more challenging, prompting it to switch to a higher transmit power or Spreading Factor (SF). Both options result in increased power consumption for the device. Specifically, depending on the device’s SF (Spreading Factor), the demonstrated attack increased the total power consumption during a single communication event by a range of 36% to 576%. Notably, this attack does not require the attacker to possess keys or sensitive data, and it can be executed against any class of LoRa devices.
[15] uses Unmanned Aerial Vehicles (UAVs) as intermediaries to transfer messages between ground-based Long Range (LoRa) nodes and remote base stations. These UAVs create an ad hoc WiFi network, serving as relays for communication. To enhance efficiency, a distributed topology control algorithm is introduced for the UAVs, which adapts to the movement of ground-based LoRa nodes. Simulation results demonstrate the feasibility of this approach, showcasing improvements in packet reception rate and average delay quality of service (QoS) metrics within a UAV-enabled LoRa network.
[16] discusses the need for communication solutions in the aftermath of disasters when the infrastructure is damaged. According to the authors, the main issue with existing systems is their limited communication range. The authors use LoRa to establish communication among rescuers and external parties, employing the epidemic forwarding protocol. The solution was implemented on commercially available PyCom LoPy4 devices equipped with LoRa and programmed using MicroPython. Initial results indicate that the proposed solution is viable for use by rescuers, and further improvements are planned to optimize its performance in real post-disaster rescue operations.
[17] proposes a relay station network using low-power wide-area network (LPWAN) technology to monitor environmental conditions in 3G-lacking, landslide-prone areas in Thailand. This network includes relay stations that transmit data from monitored areas to a destination station, which then sends it to a server via the 3G network. The study conducts experiments using the LoRa protocol for multi-hop communication with simple LoRa-based relay stations, focusing on packet loss and coverage area. The results indicate that adding a relay station can extend the communication range to 800 meters, albeit with a reduced packet receiving rate (PRR), suggesting the need for a higher-layer protocol to check received packets.
Regarding the performance of LoRa networks, [21] provides a comprehensive overview of this technology and its simulation tools. It highlights the increasing adoption of LoRaWAN in various IoT applications due to its low-power consumption and long-range communication capabilities. The authors conducted a literature survey, identifying variations in parameter configurations across studies, which hinders the reproducibility of results. The authors state that many simulation tools currently focus on European frequency scenarios (868 MHz) and often overlook variations needed for other regions. The authors also note the lack of detailed energy models that account for the entire system’s consumption, including microcontrollers and sensors, which limits the accuracy of network performance assessments. The study underscores the importance of defining and documenting simulation parameters to enhance the reproducibility of results.
[22] focuses on the performance of LoRaWAN technology, specifically examining Class B and Class C devices, which have been less studied than Class A. The authors conducted a simulation-based performance analysis using the ns-3 simulator to identify critical network parameters affecting these device classes. The study found that optimizing network parameters such as increasing the number of parallel receive paths at gateways and prioritizing reception over transmission significantly improves the performance of LoRaWAN Class B and Class C devices, particularly in uplink packet delivery ratios and confirmed packet success ratios, while also indicating that certain configurations yield diminishing returns beyond specific thresholds.
The study conducted in [23] provides a comparative analysis of two Internet of Things (IoT) protocols: 6LoWPAN and LoRaWAN, focusing on their performance in medium to large-scale scenarios with varying data rates. The study utilizes the NS-3 simulator to evaluate key performance metrics such as throughput, latency, and energy consumption. The main findings indicate that while LoRaWAN exhibits lower latency than 6LoWPAN, the latter demonstrates better throughput and lower average energy consumption across the tested scenarios. Specifically, as the number of nodes increases, packet throughput decreases for both protocols due to network congestion, but 6LoWPAN maintains a slight advantage in throughput. The authors conclude that 6LoWPAN can perform comparably to LoRaWAN and is suitable for deployment in medium to large-scale applications, providing a valuable baseline for future testbed implementations involving numerous nodes.
[24] focuses on optimizing the placement of LoRaWAN gateways in smart agriculture settings. It employs various clustering algorithms to enhance the network’s performance, particularly regarding energy efficiency. The authors used the LoRaWANSim Simulator to assess the following performance metrics: Uplink Data Rate (ULDR) and the total and mean energy consumption. They found that the FCM and K-Means clustering techniques significantly enhance energy efficiency and reduce power consumption across different scenarios.
[25] aims to model the performance of a multi-hop LoRaWAN linear sensor network for energy-efficient pipeline monitoring systems by employing an analytical approach that evaluates network performance metrics, identifies limiting factors such as bit rate and duty cycle, and compares single-hop and multi-hop scenarios, ultimately demonstrating the trade-offs and considerations necessary for effective deployment of such networks. The authors emphasize the importance of considering application requirements and network throughput when designing and evaluating multi-hop LoRaWAN networks.
The primary distinction between our research and related studies lies in our evaluation of the varying scenarios’ effects on degrading the performance of a LoRa network, specifically within the context of disaster monitoring. Prior research does not delve into this particular issue. Furthermore, aspects such as selecting a real-world disaster monitoring environment (Belo Horizonte, Brazil) and choosing a simulator for conducting experiments (LoRaSim) are additional facets that have not been addressed in prior works.
3. Simulating LoRa Networks
In this section we define the concept of LoRa networks and present the simulator - LoRaSim.
3.1. LoRa
LoRa (Long Range) is a radio frequency technology for transceivers developed by Semtech, employing spread spectrum modulation techniques [6]. Consequently, it utilizes more bandwidth for transmission than the original message requires while maintaining signal strength, thus enhancing resistance to interception or disruption [7]. A key advantage of LoRa lies in its long-range capabilities. A single gateway or base station can cover entire cities or hundreds of square kilometers, with the range determined by deployment environments and their associated obstructions [27].
LoRaWAN is an LPWAN (Low-Power, Wide Area Network) protocol designed for operation on LoRa networks. LoRaWAN networks are characterized by a star topology and consist of various components, including devices or nodes (often referred to as end-points or end-devices), base stations (also known as gateways), network servers, and application servers [28].
Data transmitted by a node (sensor or reader) is typically received by multiple gateways, meaning nodes are not tied to specific gateways. Each gateway forwards the packet received from the node to the cloud-based network server via a backhaul (such as cellular, Ethernet, satellite, or Wi-Fi). The network server holds responsibility for managing the information routed through gateways, filtering redundant packets, conducting security checks, and optimizing data rates. Subsequently, the web server dispatches the packets to the application server, which executes specific actions based on the received information [27,29].
Another significant feature of devices utilizing LoRa technology is their low power consumption, as highlighted in a study by Bouguera et al. [30]. This attribute results from the asynchronous behavior exhibited by the nodes, which engage in communication solely when data is prepared for transmission. In essence, they operate in an event-driven or scheduled manner.
3.2. LoRaSim
LoRaSim is a custom-built discrete event simulator developed by Thiemo Voigt and Martin Bor at Lancaster University in the United Kingdom. It is implemented in Python and relies on the SimPy, Matplotlib, and Numpy libraries. This tool enables the simulation of a network consisting of N LoRa devices and M base stations within a two-dimensional space, offering options for grid layout or random distribution [31].
According to [31], each LoRa device possesses distinct communication characteristics, delineated by transmission parameters including Transmission Power (TP), Carrier Frequency (CF), Spreading Factor (SF), Bandwidth (BW), and Coding Rate (CR). The transmission behavior of each node is described by the average transmission rate of packets and the payload of packet B. The behavior of the node during a simulation is therefore described by the tuple . Furthermore, it’s worth noting that each LoRa base station is equipped to receive multiple signals, each characterized by varying combinations of SF and BW for a given CF.
The primary metrics employed to gauge network scalability and performance are the Data Extraction Rate (DER) and Network Energy Consumption (NEC). The DER metric quantifies the ratio of packets received by base stations to those transmitted by network nodes within a specified time frame. Meanwhile, the NEC metric measures the energy consumption (in Joules) the network requires to extract a packet or message successfully. Throughout this study, we will specifically utilize the DER metric.
The DER value ranges from 0 to 1 and is contingent upon factors such as the quantity, placement, and conduct of nodes and base stations. A DER value approaching 1 signifies higher efficiency in the LoRa network implementation. Equation 1 is employed to calculate the DER value, where PR denotes the count of packets received by at least one base station during the simulation run, and PE represents the cumulative sum of packets transmitted by all nodes over the simulation time interval.
3.2.1. LoRaSim Input
The simulator receives the following parameters as input:
- Nodes (Nodes) – number of nodes or devices in the LoRa network;
- Avgsend (Average sending interval) – average packet sending time interval in milliseconds;
-
Experiment – an integer that determines with which radio settings the simulation is performed:
- 0.
- Use the settings with the slowest data rate (SF12, BW125, CR4/8).
- 1.
- Similar to experiment 0, but uses a random choice of 3 transmission frequencies.
- 2.
- Use the settings with the fastest data rate (SF6, BW500, CR4/5).
- 3.
- Optimizes configuration per node based on distance from gateway.
- 4.
- Uses the settings defined in LoRaWAN (SF12, BW125, CR4/5).
- 5.
- Similar to experiment 3, but also optimizes transmit power (TP).
It is important to note that the work focuses on LoRaWAN networks; thus, all experiments were performed using the parameter Experiment with the value 4, that is, the settings defined for LoRaWAN.
- Simtime – total simulation run time in milliseconds.
- Basestations – number of base stations or gateways used to simulate. This value can assume the integers 1, 2, 3, 4, 6, 8 or 24.
- Collision – the parameter can assume values of 0 or 1. A value of 1 is chosen to activate full collision checking, while 0 is used to employ a simplified check (the default option). With simplified checking, two messages collide if they arrive simultaneously at the same frequency and spreading factor. On the other hand, full collision checking takes into account the capture effect, where one of the two colliding messages may still successfully transmit based on the relative timing and the difference in received power.
- Directionality - can assume values 0 or 1. The value 1 is selected to activate the directional antenna for the nodes.
- Networks (LoRa Networks) - number of LoRa networks.
- Basedist (Distance between base stations) - Distance X between two base stations.
3.2.2. LoRaSim Output
The main output parameters found during the execution of experiments using the simulator are:
- nrCollisions – number of packet collisions during the experiment.
- Energy (in J) – NEC in Joule.
- Sent packets – number of packets sent by network nodes.
- Received Packets – number of packets received by base stations.
- Lost Packets – number of lost packets, i.e., packets that any base station did not receive.
- DER – proportion of packets received by packets sent.
- Packets at BS X – number of packets received by base station X (X varies from 1 to 24, according to the number of base stations provided as input to the simulator).
- Send to BS [X] – number of packets sent to base station X (X varies from 1 to 24, according to the number of base stations provided as input to the simulator).
- DER BS [X] – represents the ratio of packets sent to base station X and those received by base station X (X varies from 1 to 24, depending on the number of base stations specified as input to the simulator).
In addition to the outputs described above, the simulator also provides values for minimum airtime, Lpl (path lost), symbol time, received signal strength indication (RSSI), distance maximum possible between nodes and base stations, xy coordinates of base stations, xy coordinates of nodes and information about collisions.
4. Description of the Simulated Disaster Management Scenario
Belo Horizonte, Brazil, annually grapples with floods resulting from heavy rainfall and substantial precipitation. These torrential rains lead to landslides, flooding, destruction, property loss, and, tragically, even loss of life. The city has identified nine critical flooding areas dispersed across seven distinct regions [32,33].
The Córrego do Leitão watershed in the Center-South region of Belo Horizonte encompasses twenty-seven sub-basins and is particularly susceptible to the abovementioned issues. This susceptibility arises from its steep terrain and numerous narrow stretches of streams. We used the Córrego do Leitão watershed as our simulated monitoring environment. Figure 1 visually represents the Córrego do Leitão watershed 1.
To align the simulation environment with real-world conditions, several experiments were conducted to determine the following aspects: i) the required number of nodes (LoRa devices), ii) the number of base stations necessary to support the environment’s nodes and the optimal spacing between them, iii) the average packet sending interval, and iv) the number of LoRa networks essential for monitoring the environment.
After running several experiments and considering the characteristics of the chosen disaster scenario, we defined the following parameters:
- Number of nodes (LoRa devices) - 48;
- Number of base stations needed to support environment nodes - 24;
- Distance between two base stations - 200m;
- Average packet sending interval - 50000ms;
- Number of LoRa networks needed to monitor the environment - 1.
To stress the network and assess the impact of DoS attacks on LoRa devices, we proposed scenarios by modifying network input parameters. This involved increasing the number of nodes, reducing the average sending time, and decreasing the number of base stations. Moreover, we conducted experiments that involved adjusting multiple parameters and directly modifying the simulator code.
We conducted most experiments for both types of collision checking: standard collision checking and full collision checking. As previously discussed, full collision checking considers the capture effect, which allows one of the two colliding messages to pass through based on relative timing and differences in received power. In contrast, standard checking does not consider this effect.
Table 1 outlines the proposed scenarios’ objectives to impact network availability. Furthermore, it details the corresponding variables that will be adjusted in each scenario and specifies the number of experiments conducted for each scenario. Subsequent sections of this article provide comprehensive descriptions of each scenario and its respective experiments.
5. Results and Discussions
Here, we will present the results of each scenario described in Table 1. In broad terms, these experiments aim to assess how various parameters of a LoRa network, including the number of nodes, average packet sending interval, number of base stations, and packet size, impact the network’s availability within the context of disaster management.
5.1. Scenario 1 - Increase the Number of Nodes
The first scenario involves augmenting the number of nodes within the LoRa network while leaving the remaining parameters unchanged. The objective of conducting these simulations is to ascertain whether the influx of devices into the simulated monitoring network of the Córrego do Leitão watershed leads to an overload. The rationale behind this is that a higher number of nodes results in increased packets transmitted within a specific time interval.
In the first scenario, we conducted three experiments. The first one involved a slight increase in the number of nodes, the second experiment involved a more substantial increase in the number of nodes, and the third experiment aimed to amplify further the node count to degrade network performance using the full collision check deliberately. Details of the experiments within scenario 1 can be found in Table 2.
In our first experiment of Scenario 1, we incrementally increased the number of nodes by one per base station. Given that our baseline comprises 24 base stations, the total number of nodes was progressively raised to a maximum of 24 nodes per base station, resulting in a total of 240 nodes. We conducted the same experiment using standard and full collision checking. To account for the stochastic nature of collisions and node placements in LoRaSim, we performed 100 simulations for each node count configuration and calculated the average DER.
In the second experiment of Scenario 1, we progressively increased the number of nodes at a rate of 1,200, equivalent to 50 nodes per base station (24 in total), until we reached 12,000 nodes. This experiment aimed to assess the network’s performance as the number of connected devices escalated, comparing the standard collision check with the full collision check. Due to the substantial increase in execution time caused by the larger node count, we conducted only 10 simulations for each configuration. We calculated the DER average as a function of the node increase.
To intentionally degrade network performance, even with full collision checking enabled, we conducted a third experiment involving increasing the number of nodes. This time, we augmented the number of nodes per base station by 100, resulting in an incremental node rate of 2,400.
Our results for the first experiment of Scenario 1 are depicted in Figure 2. In this figure, the blue curve illustrates the DER variation concerning the increase in the number of nodes for the full collision check. In contrast, the orange curve portrays the DER variation as the number of nodes increases for the standard collision check.
We observe that the initial increase did not affect the network performance concerning the DER metric. The DER rate remains above 0.95 for both types of collision checking, even when operating with 10 nodes per base station, totaling 240 nodes in the LoRa network. Thus, the network continues to meet the requirements we set for disaster monitoring scenarios.
Even though the increase in the number of nodes leads to a rise in the number of packets transmitted and, consequently, an increase in collisions, our configured network maintains an average packet sending interval of about 1 minute and utilizes 24 base stations for receiving and forwarding packets to the network servers. This setup, therefore, represents a robust configuration capable of accommodating this volume of nodes.
Figure 3 illustrates the results of the second experiment within Scenario 1. This figure portrays the variation in the DER metric of the LoRa network, as impacted by the substantial increase in the number of nodes for both the standard collision check and the full collision check. We can observe that with 1,200 nodes, the DER for the standard collision check (0.719737) falls below 0.95 and continues to decrease to 0.01412 when the network reaches 12,000 nodes. In contrast, the DER for the full collision check remains above 0.95 and only drops below this threshold when the network reaches 8,400 nodes, representing a remarkably high number of connected devices.
As mentioned in Section 4, our primary goal in the third experiment of the first scenario was to attempt to overload the network by significantly increasing the number of nodes for the full collision check. In this case, there was no need to experiment with the standard collision check, as the previous experiment had already yielded a DER value close to zero using this parameter. Figure 4 illustrates the results of Experiment 3 of the first scenario.
From the results we’ve obtained, we can observe the robustness of the LoRa network implementation when exposed to a substantial surge in the number of nodes while utilizing complete collision detection. Remarkably, even with a substantial node count (48,000), the LoRa network continues to function at a capacity exceeding 50%.
5.2. Scenario 2 - Decreasing the Interval Between Sent Packets
In the second scenario, we aim to reduce the average packet sending interval while keeping the other input parameters constant. This approach allows us to assess the effects of diminishing this parameter on the LoRa network. We anticipate an increased load on the monitoring network because a smaller average packet sending interval results in more packets sent per node. Table 3 describes the experiments in scenario 2.
In Experiment 1, we reduced the average packet sending interval by 5,000ms, commencing from two initial configurations: 50,000ms (maximum) and 1,000ms (minimum). We conducted 100 repetitions of each experiment to account for node placement and collision variability. For each packet sending interval, we calculated the average DER.
The second experiment aimed to explore the consequences of further reducing the average packet sending interval. We initiated at 1,000ms and incrementally decreased by 100ms until reaching 100ms. We executed the simulation ten times for each average packet sending interval and computed the average DER for each interval.
To further explore the extent of network degradation, even with full collision checking enabled, we conducted a third experiment in which we gradually reduced the average packet sending interval by 10ms, starting at 100ms and continuing until it reached 10ms.
Figure 5 presents the outcomes of the initial experiment within Scenario 2. The blue curve illustrates the DER variation in response to the average packet sending interval reduction for the full collision check. In contrast, the orange curve represents the same for the standard collision check.
The results depicted in Figure 5 reveal that even with a reduction in the average sending time to 5000ms, the LoRa network maintains a DER greater than 0.95 for both the standard and full collision checks. This can be attributed to the use of only two nodes due to the high number of base stations (24). Consequently, despite the increased number of packets sent over time, the limited number of nodes transmitting packets allows the base stations to process them efficiently. Notably, a decline in the DER value is observed for the standard collision check when the average packet sending time is reduced to 1 second.
Figure 6 provides an overview of the results from the second experiment within Scenario 2. This experiment was designed to evaluate the performance of the LoRa network when subjected to a significant reduction in the average packet sending time, both for the full collision check and the standard collision check.
In this experiment, we reduced the average sending interval to values smaller than 1 second. Notably, the DER for the full collision check remained consistently above 0.95, even when reduced to 1/10th of a second. However, for the standard collision check, the DER dropped significantly, reaching values close to zero when the interval was reduced to 1/10th of a second.
This disparity in DER between collision checks can be attributed to a key factor: when the average packet sending interval is significantly reduced, a larger number of packets may be sent simultaneously, arriving at the same time, on the same frequency, and with the same propagation factor. In the case of full collision checking, some of these packets can still pass through and be delivered to a base station. However, with standard collision checking, these packets are not delivered, resulting in a reduced rate of packets delivered per packet sent.
The results of our third experiment in Scenario 2 are presented in Figure 7. Remarkably, even when we reduced the average packet sending interval to 1/100th of a second, the DER for full collision checking did not experience any decrease. This can be explained by the collision behavior described in the previous experiment.
5.3. Scenario 3 - Increasing the Number of Nodes and Decreasing the Interval Between Sent Packets
In Scenario 3, we conducted a single experiment where we doubled the number of nodes, increasing it from 48 to 1536, while simultaneously reducing the average packet sending interval from 50,000ms to 1,000ms. This experiment aimed to assess the network’s performance in terms of the DER metric when subjected to a high influx of packets. Both changes in these parameters were expected to result in an overload of network traffic.
We executed this experiment for both standard collision checking and full collision checking. For each configuration of average sending interval and number of nodes, we ran the simulations 10 times. We calculated the average DER concerning the increase in the number of devices on the network and the reduction of the average interval for sending packets.
The results of the experiment we conducted for Scenario 3 using full collision checking are illustrated in Figure 8, while the results for the standard collision check can be seen in Figure 9. Each colored curve in the figures represents the DER variation as a function of the average packet sending interval reduction for a specific number of nodes.
By analyzing Figure 8 and Figure 9, we can observe that, for the first time during our experiment executions, the DER decreased for both types of collision verification. This reduction occurred due to the changes in the two parameters we introduced in the experiment, leading to a significant increase in the number of packets. This increase exceeded the capacity of the 24 base stations specified in our setup.
5.4. Scenario 4 - Decreasing the Number of Base Stations and Increasing the Number of Nodes
The objective of Scenario 4 was to simulate a scenario where numerous devices send packets to a limited number of base stations. To achieve this, we conducted 100 simulations for each configuration, systematically doubling the number of nodes from 48 to 3072 while using various numbers of base stations (24, 8, 6, 4, 3, 2, 1) for both collision verification methods, standard and full collision checks.
In Figure 10, we present the DER results for the full collision check, illustrating the impact of increasing the number of nodes while decreasing the number of base stations. The results for the standard collision check are shown in Figure 11. Each curve with a distinct color represents the DER value in relation to the increase in the number of nodes for a specific number of base stations.
From the results presented in Figure 10 and Figure 11, we can observe how the number of nodes significantly impacts the DER when fewer base stations are connected to the network. This result holds true for both the full collision check and the standard collision check. Specifically, when the network comprises 768 nodes, and the standard collision check is applied, the DER falls below 0.95, regardless of the number of base stations. In the case of full collision verification, with 3072 nodes, we can observe that the DER drops below 0.95 for all numbers of base stations except 24.
In conclusion, increasing the number of nodes while decreasing the number of base stations leads to a substantial decline in network performance. This can be attributed to more nodes transmitting packets within the same time interval, and a limited number of base stations cannot efficiently handle the reception of packets from numerous nodes. Consequently, the increased collision rate further explains the notable reduction in network performance, especially when relying solely on standard collision checking.
5.5. Scenario 5 - Increasing the Packet Length and Decreasing the Interval Between Sent Packets
The idea behind Scenario 5 is to simulate an attack involving a fast transmission of large packets. Therefore, for each average sending time setting, ranging from 50,000ms to 1,000ms (decreasing in 10,000ms increments), we increased the packet size at a rate of 51 bytes, starting from 10 bytes and concluding at 255 bytes. We conducted 100 experiments for each configuration and calculated the average results for the DER metric.
The outcomes of the experiment for Scenario 5, utilizing the complete collision check, are visually depicted in Figure 12, while those for the standard collision check are presented in Figure 13. Each colored curve illustrates the DER value in relation to the reduction in the average packet sending interval for different packet size values.
From this experiment, we can conclude that when the packet size is increased, and the average packet sending interval is decreased, the network experiences a performance decline when standard collision checking is employed. For instance, when the average sending time is 1000ms, and the packet size is 255 bytes, the resulting DER is approximately 0.11. This is notably low for applications requiring sensitivity, such as disaster monitoring. However, in scenarios where full collision checking is enabled, even with the maximum packet payload and a low average sending time (1000ms), we achieve a DER higher than 0.95.
6. Conclusions and Future Work
The main objective of our work was to assess the impact of DoS attacks on LoRa devices. To achieve this, we first needed to determine the configurations for simulating the designated disaster environment (Córrego do Leitão watershed - Belo Horizonte, Brazil). Once we established the baseline for monitoring this area, we conducted experiments to analyze the performance of the LoRa network under various conditions, aiming to degrade its availability and simulate the effects of a denial-of-service attack.
These experiments significantly impacted network performance, particularly when employing standard collision checking. However, with full collision checking, the network’s performance remained optimal in many scenarios. Furthermore, based on the conducted experiments, we concluded that when multiple parameters are manipulated to attack the network, its performance experiences a substantial decline.
We conclude that in the context of disaster monitoring, the configuration of a LoRaWAN network must be robust. This ensures that even if one network parameter is affected, the others can maintain optimal performance, enabling continuous monitoring and mitigating the consequences of disasters. We recommend using network traffic monitoring services to detect anomalies and develop contingency and recovery plans in the event of a DoS attack.
For future work, we propose applying the network parameters established in this study to another LoRa simulator, such as LoRaWanSim [34], which does not use random node distribution. This allows us to test the proposed scenarios for network overload and observe the results. Additionally, we suggest focusing on experiments that simultaneously assess energy consumption (NEC) alongside data extraction rate (DER), which was impossible due to simulator limitations. Finally, for future research, we aim to physically implement the network and test various parameters of network degradation, such as reducing the average packet sending interval, decreasing the number of base stations, and increasing packet size.
Author Contributions
The authors contributed equally to this work. All authors have read and agreed to the published version of the manuscript.
Funding
“Coordenação de Aperfeiçoamento de Pessoal de Nível Superior - 88881.368742/2019-01 (STIC-AMSUD)” and “The APC was funded by XXX”.
Institutional Review Board Statement
Not applicable.
Informed Consent Statement
Not applicable.
Data Availability Statement
Not applicable.
Conflicts of Interest
The authors declare no conflict of interest. The funders had no role in the design of the study; in the collection, analyses, or interpretation of data; in the writing of the manuscript; or in the decision to publish the results.
References
- Atzori, L.; Iera, A.; Morabito, G. The internet of things: A survey. Computer networks 2010, 54, 2787–2805. [Google Scholar] [CrossRef]
- Awadallah, S.; Moure, D.; Torres-Gonzalez, P. An Internet of Things (IoT) Application on Volcano Monitoring. Sensors 2019, 19, 4651. [Google Scholar] [CrossRef] [PubMed]
- Ravi, G. Earthquake Early Warning System by IOT using Wireless Sensor Networks. 04 2016. [CrossRef]
- Miriyala, T.; Karthik, R.; Mahitha, J.; Reddy, V. IoT based forest fire detection system. International Journal of Engineering and Technology 2018, 7, 124. [Google Scholar] [CrossRef]
- Budholiya, A. Efforts in Disaster Prediction Take a Step Further with IoT Sensors. ReadWrite 2018.
- Bor, M.; Vidler, J.E.; Roedig, U. LoRa for the Internet of Things. ACM Digital Library 2016.
- Instruments, N. Understanding Spread Spectrum for Communications. National Instruments, 2020.
- Davcev, D.; Mitreski, K.; Trajkovic, S.; Nikolovski, V.; Koteli, N. IoT agriculture system based on LoRaWAN. In Proceedings of the 2018 14th IEEE International Workshop on Factory Communication Systems (WFCS). IEEE, 2018, pp. 1–4.
- Gallardo, J.L.; Ahmed, M.A.; Jara, N. LoRa IoT-based architecture for advanced metering infrastructure in residential smart grid. IEEE Access 2021, 9, 124295–124312. [Google Scholar] [CrossRef]
- Lachtar, A.; Val, T.; Kachouri, A. Elderly monitoring system in a smart city environment using LoRa and MQTT. IET Wireless Sensor Systems 2020, 10, 70–77. [Google Scholar] [CrossRef]
- Basford, P.J.; Bulot, F.M.; Apetroaie-Cristea, M.; Cox, S.J.; Ossont, S.J. LoRaWAN for smart city IoT deployments: A long term evaluation. Sensors 2020, 20, 648. [Google Scholar] [CrossRef] [PubMed]
- Adnan.; Salam, A.E.U.; Arifin, A.; Rizal, M. Forest Fire Detection using LoRa Wireless Mesh Topology. In Proceedings of the 2018 2nd East Indonesia Conference on Computer and Information Technology (EIConCIT), 2018, pp. 184–187. [CrossRef]
- Ragnoli, M.; Barile, G.; Leoni, A.; Ferri, G.; Stornelli, V. An Autonomous Low-Power LoRa-Based Flood-Monitoring System. Journal of Low Power Electronics and Applications 2020, 10. [Google Scholar] [CrossRef]
- Pueyo Centelles, R.; Freitag, F.; Meseguer, R.; Navarro, L.; Ochoa, S.; Santos, R. A LoRa-Based Communication System for Coordinated Response in an Earthquake Aftermath. Proceedings 2019, 31, 73. [Google Scholar] [CrossRef]
- Saraereh, O.A.; Alsaraira, A.; Khan, I.; Uthansakul, P. Performance evaluation of UAV-enabled LoRa networks for disaster management applications. Sensors 2020, 20, 2396. [Google Scholar] [CrossRef] [PubMed]
- Dalpathadu, Y.; Showry, T.; Kuppusamy, V.; Udugama, A.; Förster, A. Disseminating Data using LoRa and Epidemic Forwarding in Disaster Rescue Operations. In Proceedings of the Proceedings of the Conference on Information Technology for Social Good, 2021, pp. 293–296.
- Sangrit, K.; Tungpimolrut, K.; Lewlompaisarl, U.; Chatpoj, M.; Karnjana, J.; Murata, K.T.; Haji Suhaili, W.S.; Dela Cruz, J.; Asarias, F.; Siharath, P.; et al. Experiments on LoRa Communication Used in a Relay Station Network for Disaster Management. In Proceedings of the International Conference on Computational Intelligence in Information System. Springer, 2021, pp. 225–232.
- LoraAlliance. What is the LoRaWAN® Specification? Lora Alliance 2019.
- Mikhaylov, K.; Fujdiak, R.; Pouttu, A.; Miroslav, V.; Malina, L.; Mlynek, P. Energy Attack in LoRaWAN: Experimental Validation. In Proceedings of the Proceedings of the 14th International Conference on Availability, Reliability and Security, 2019, pp. 1–6.
- Noura, H.; Hatoum, T.; Salman, O.; Yaacoub, J.P.; Chehab, A. LoRaWAN security survey: Issues, threats and possible mitigation techniques. Internet of Things 2020, 12, 100303. [Google Scholar] [CrossRef]
- de Campos, M.G.; de Almeida, L.G.; Matheus, L.E.M.; Borin, J.F. On the Simulation of LoRaWAN Networks: A Focus on Reproducible Parameter Configuration. Computer Networks and Communications 2024, pp. 148–171.
- Jagatha, A.; Rimal, B.P.; Vaidyan, V.; Wang, Y. Exploring LoRaWAN Class B and Class C Devices: Performance Analysis and Parameter Optimization Strategies. In Proceedings of the 2024 IEEE International Conference on Electro Information Technology (eIT). IEEE, 2024, pp. 194–201.
- Corbo, M.G.F.; Bartolome, H.J.O.; Panes, G.H.M.; Sanchez, E.M.; Sanvictores, R.G.C.; Reyes, J.M.R. LoRaWAN and 6LoWPAN Simulations in Medium to Large-Scale IoT Applications. In Proceedings of the 2024 IEEE International Conference on Industry 4.0, Artificial Intelligence, and Communications Technology (IAICT). IEEE, 2024, pp. 280–284.
- Correia, F.P.; Silva, S.R.d.; Carvalho, F.B.S.d.; Alencar, M.S.d.; Assis, K.D.R.; Bacurau, R.M. Lorawan gateway placement in smart agriculture: An analysis of clustering algorithms and performance metrics. Energies 2023, 16, 2356. [Google Scholar] [CrossRef]
- Alhomyani, H.; Fadel, M.; Dimitriou, N.; Bakhsh, H.; Aldabbagh, G. Modeling the Performance of a Multi-Hop LoRaWAN Linear Sensor Network for Energy-Efficient Pipeline Monitoring Systems. Applied Sciences 2024, 14, 9391. [Google Scholar] [CrossRef]
- an Es, E.; Vranken, H.; Hommersom, A. Denial-of-Service Attacks on LoRaWAN, New York, NY, USA, 2018; ARES 2018. [CrossRef]
- LoRaAlliance. LoRaWAN, What is it? A technical Overview of LoRa and LoRaWAN 2015.
- Adelantado, F.; Vilajosana, X.; Tuset-Peiro, P.; Martinez, B.; Melia-Segui, J.; Watteyne, T. Understanding the limits of LoRaWAN. IEEE Communications magazine 2017, 55, 34–40. [Google Scholar] [CrossRef]
- Haxhibeqiri, J.; De Poorter, E.; Moerman, I.; Hoebeke, J. A survey of LoRaWAN for IoT: From technology to application. Sensors 2018, 18, 3995. [Google Scholar] [CrossRef]
- Bouguera, T.; Diouris, J.F.; Chaillout, J.J.; Jaouadi, R.; Andrieux, G. Energy consumption model for sensor nodes based on LoRa and LoRaWAN. Sensors 2018, 18, 2104. [Google Scholar] [CrossRef] [PubMed]
- Bor, M.; Roedig, U.; Voigt, T.; Alonso, J. Do LoRa Low-Power Wide-Area Networks Scale? 11 2016. [CrossRef]
- Rosa, D.W.B. Resposta Hidrológica de uma Bacia Hidrográfica Urbana à Implantação de Técnicas Compensatórias de Drenagem Urbana - Bacia do Córrego do Leitão, Belo Horizonte, Minas Gerais 2017. p. 220.
- Minas, G. "BH tem nove pontos críticos de alagamento para o período chuvoso". G1.Globo, 2019.
- Marini, R.; Mikhaylov, K.; Pasolini, G.; Buratti, C. LoRaWanSim: A flexible simulator for LoRaWAN networks. Sensors 2021, 21, 695. [Google Scholar] [CrossRef] [PubMed]
Figure 1.
Córrego do Leitão watershed. Red dotted lines represent pluviometric stations, blue lines waterways and numbers depict sub-basins. Extracted from [32].
Figure 1.
Córrego do Leitão watershed. Red dotted lines represent pluviometric stations, blue lines waterways and numbers depict sub-basins. Extracted from [32].
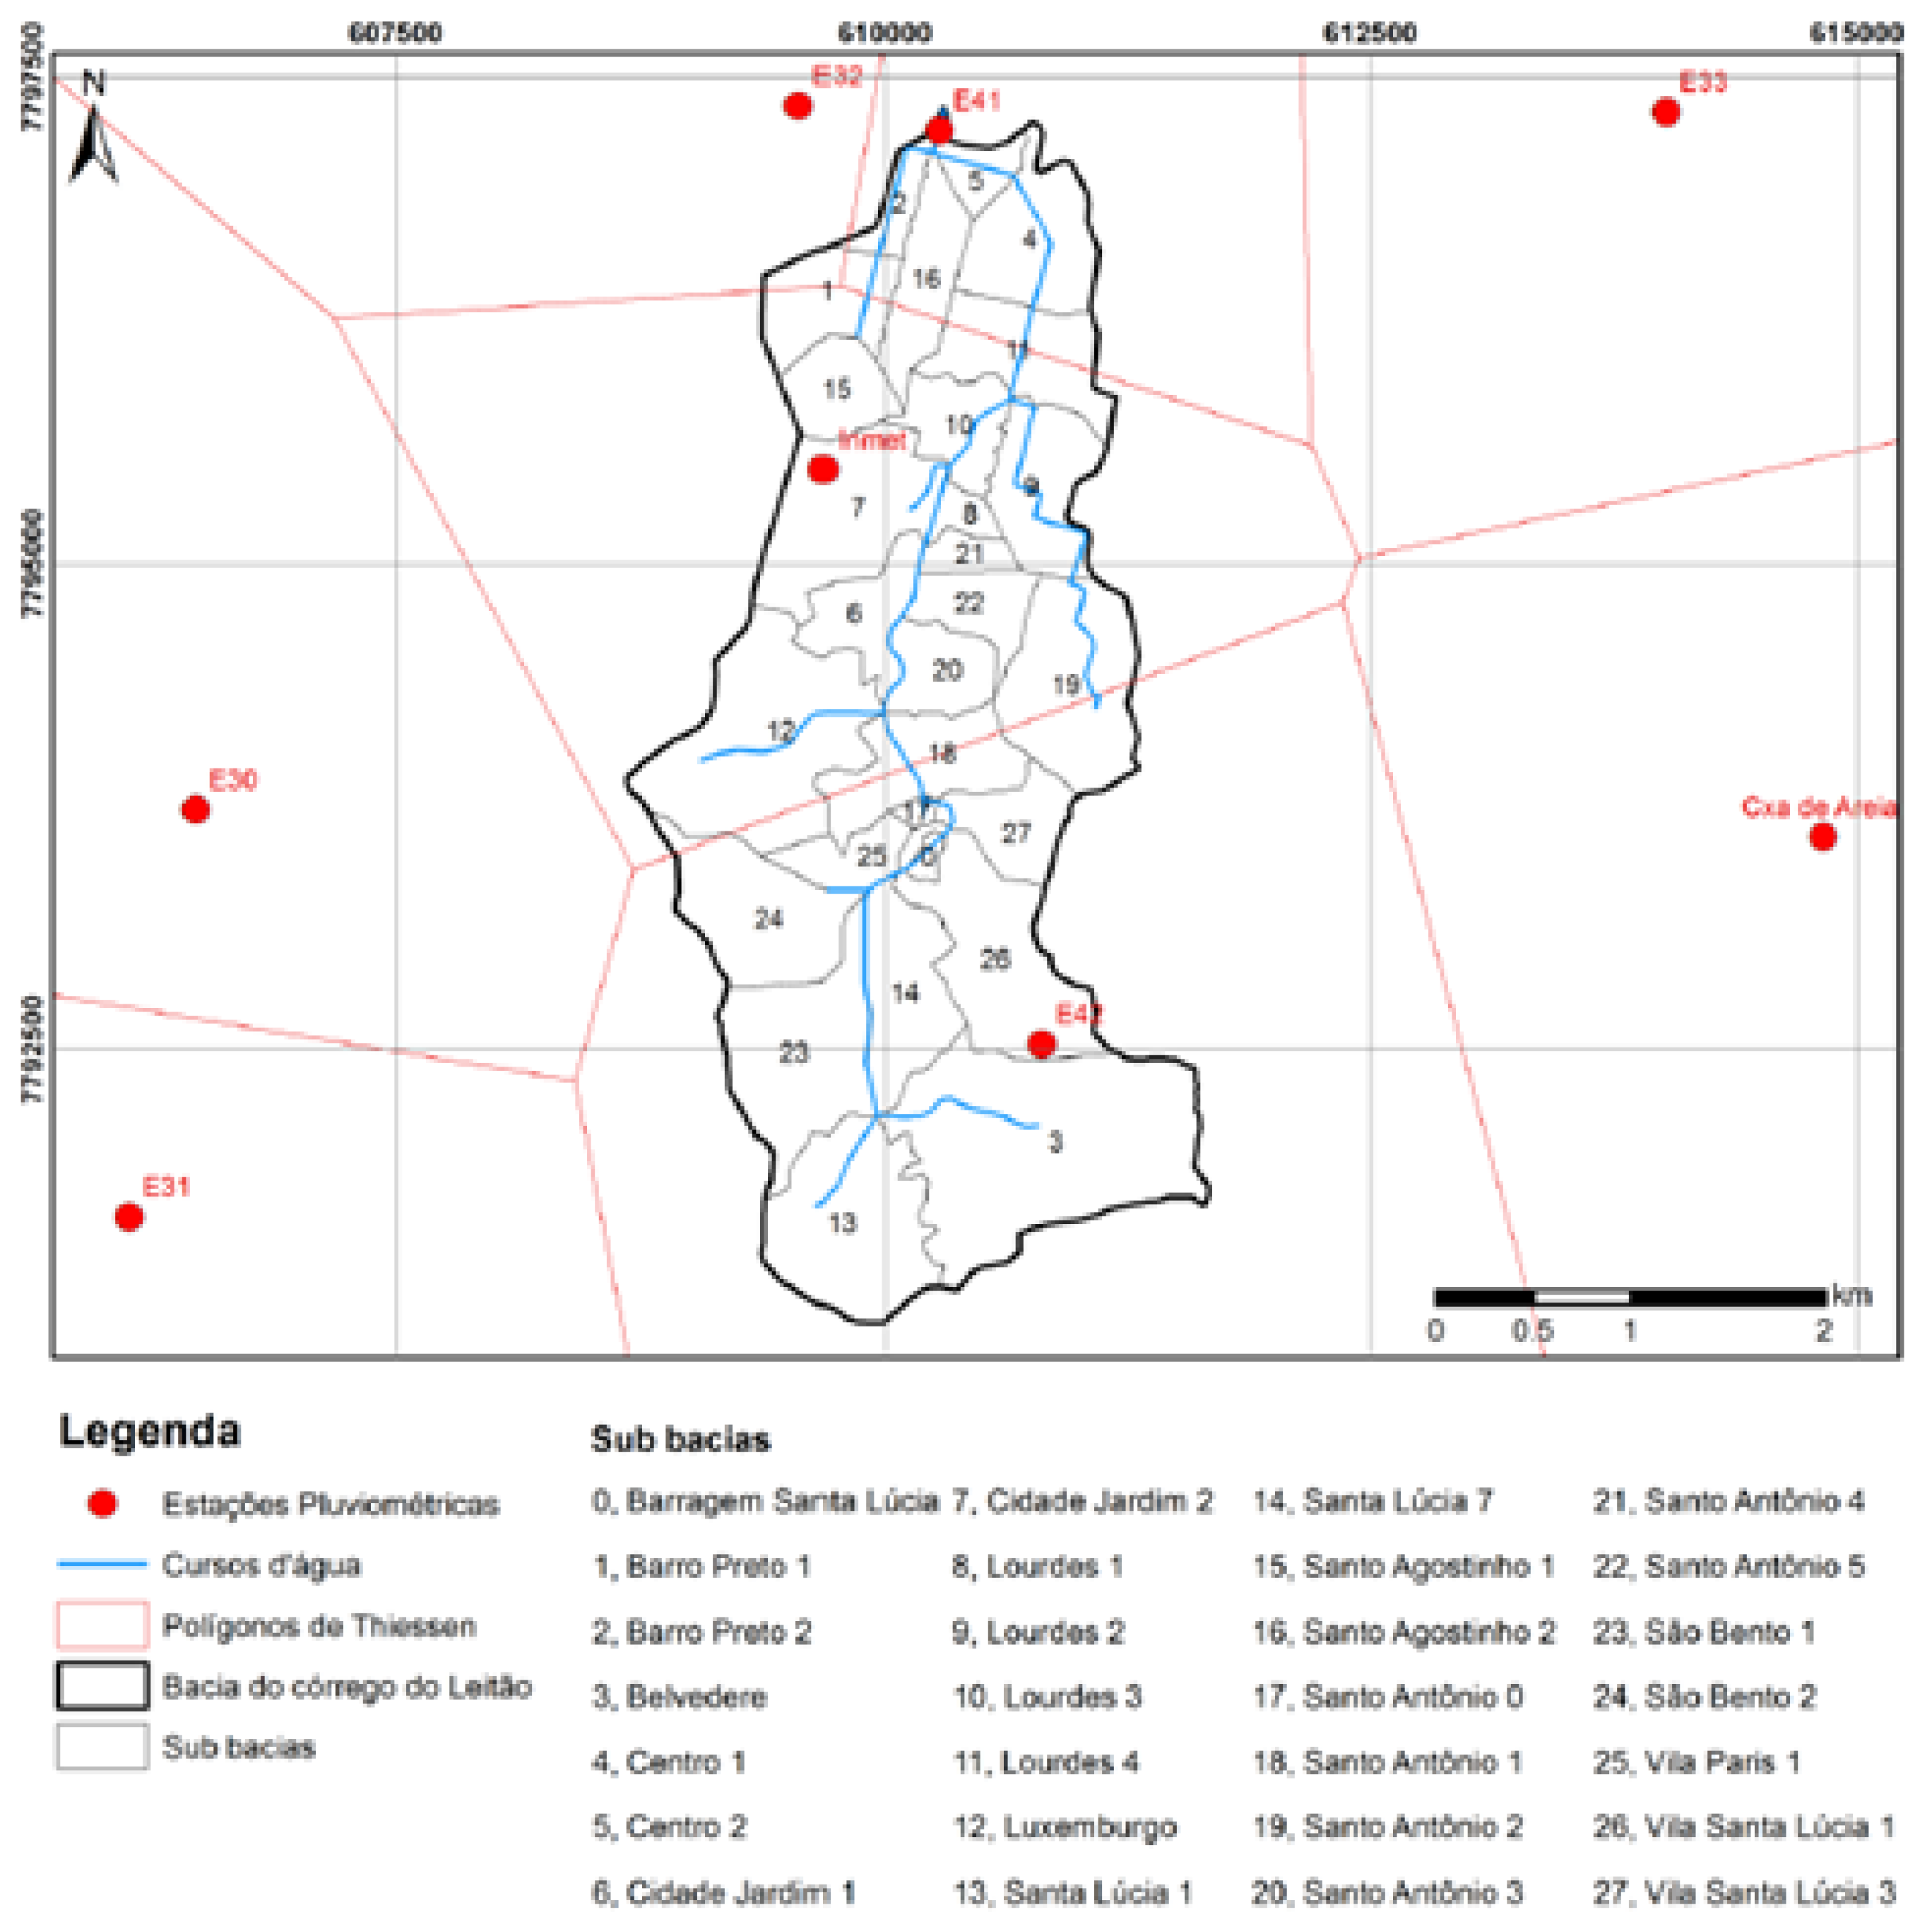
Figure 2.
Scenario 1, experiment 1 - DER behavior while increasing the number of nodes for simplified (0) and full collision checking (1).
Figure 2.
Scenario 1, experiment 1 - DER behavior while increasing the number of nodes for simplified (0) and full collision checking (1).
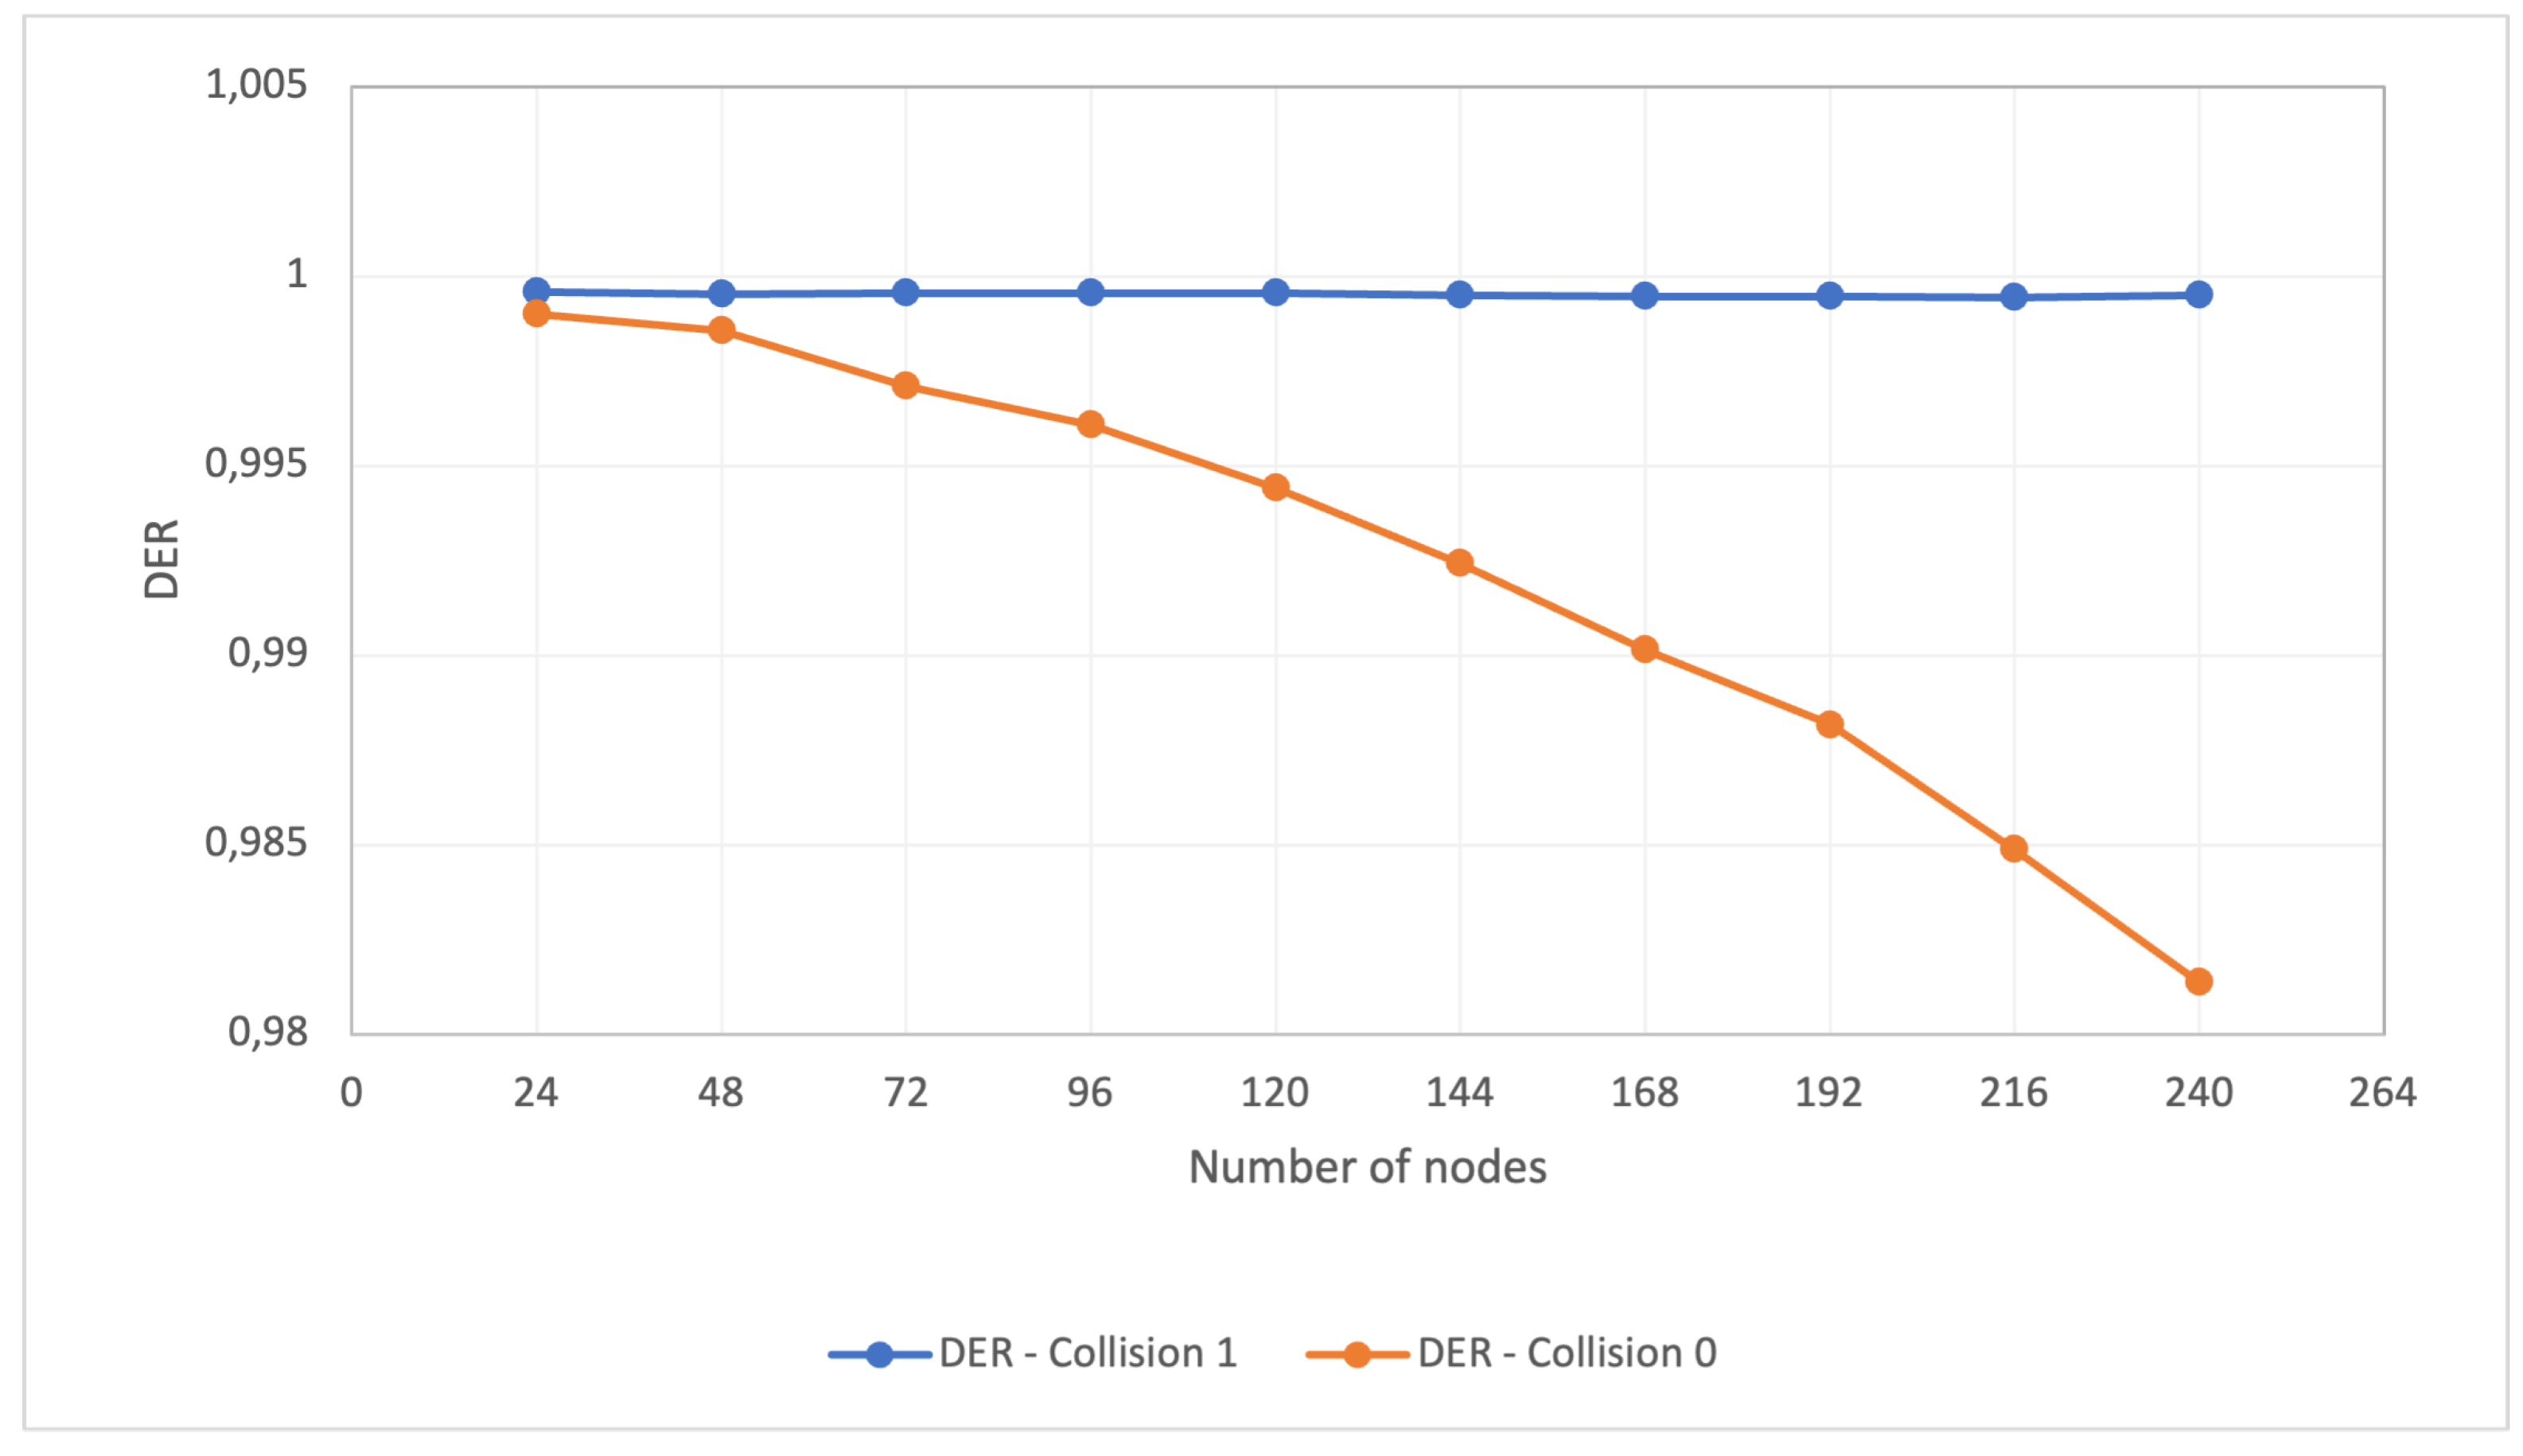
Figure 3.
Scenario 1, experiment 2 - DER behavior while increasing the number of nodes for simplified (0) and full collision checking (1).
Figure 3.
Scenario 1, experiment 2 - DER behavior while increasing the number of nodes for simplified (0) and full collision checking (1).
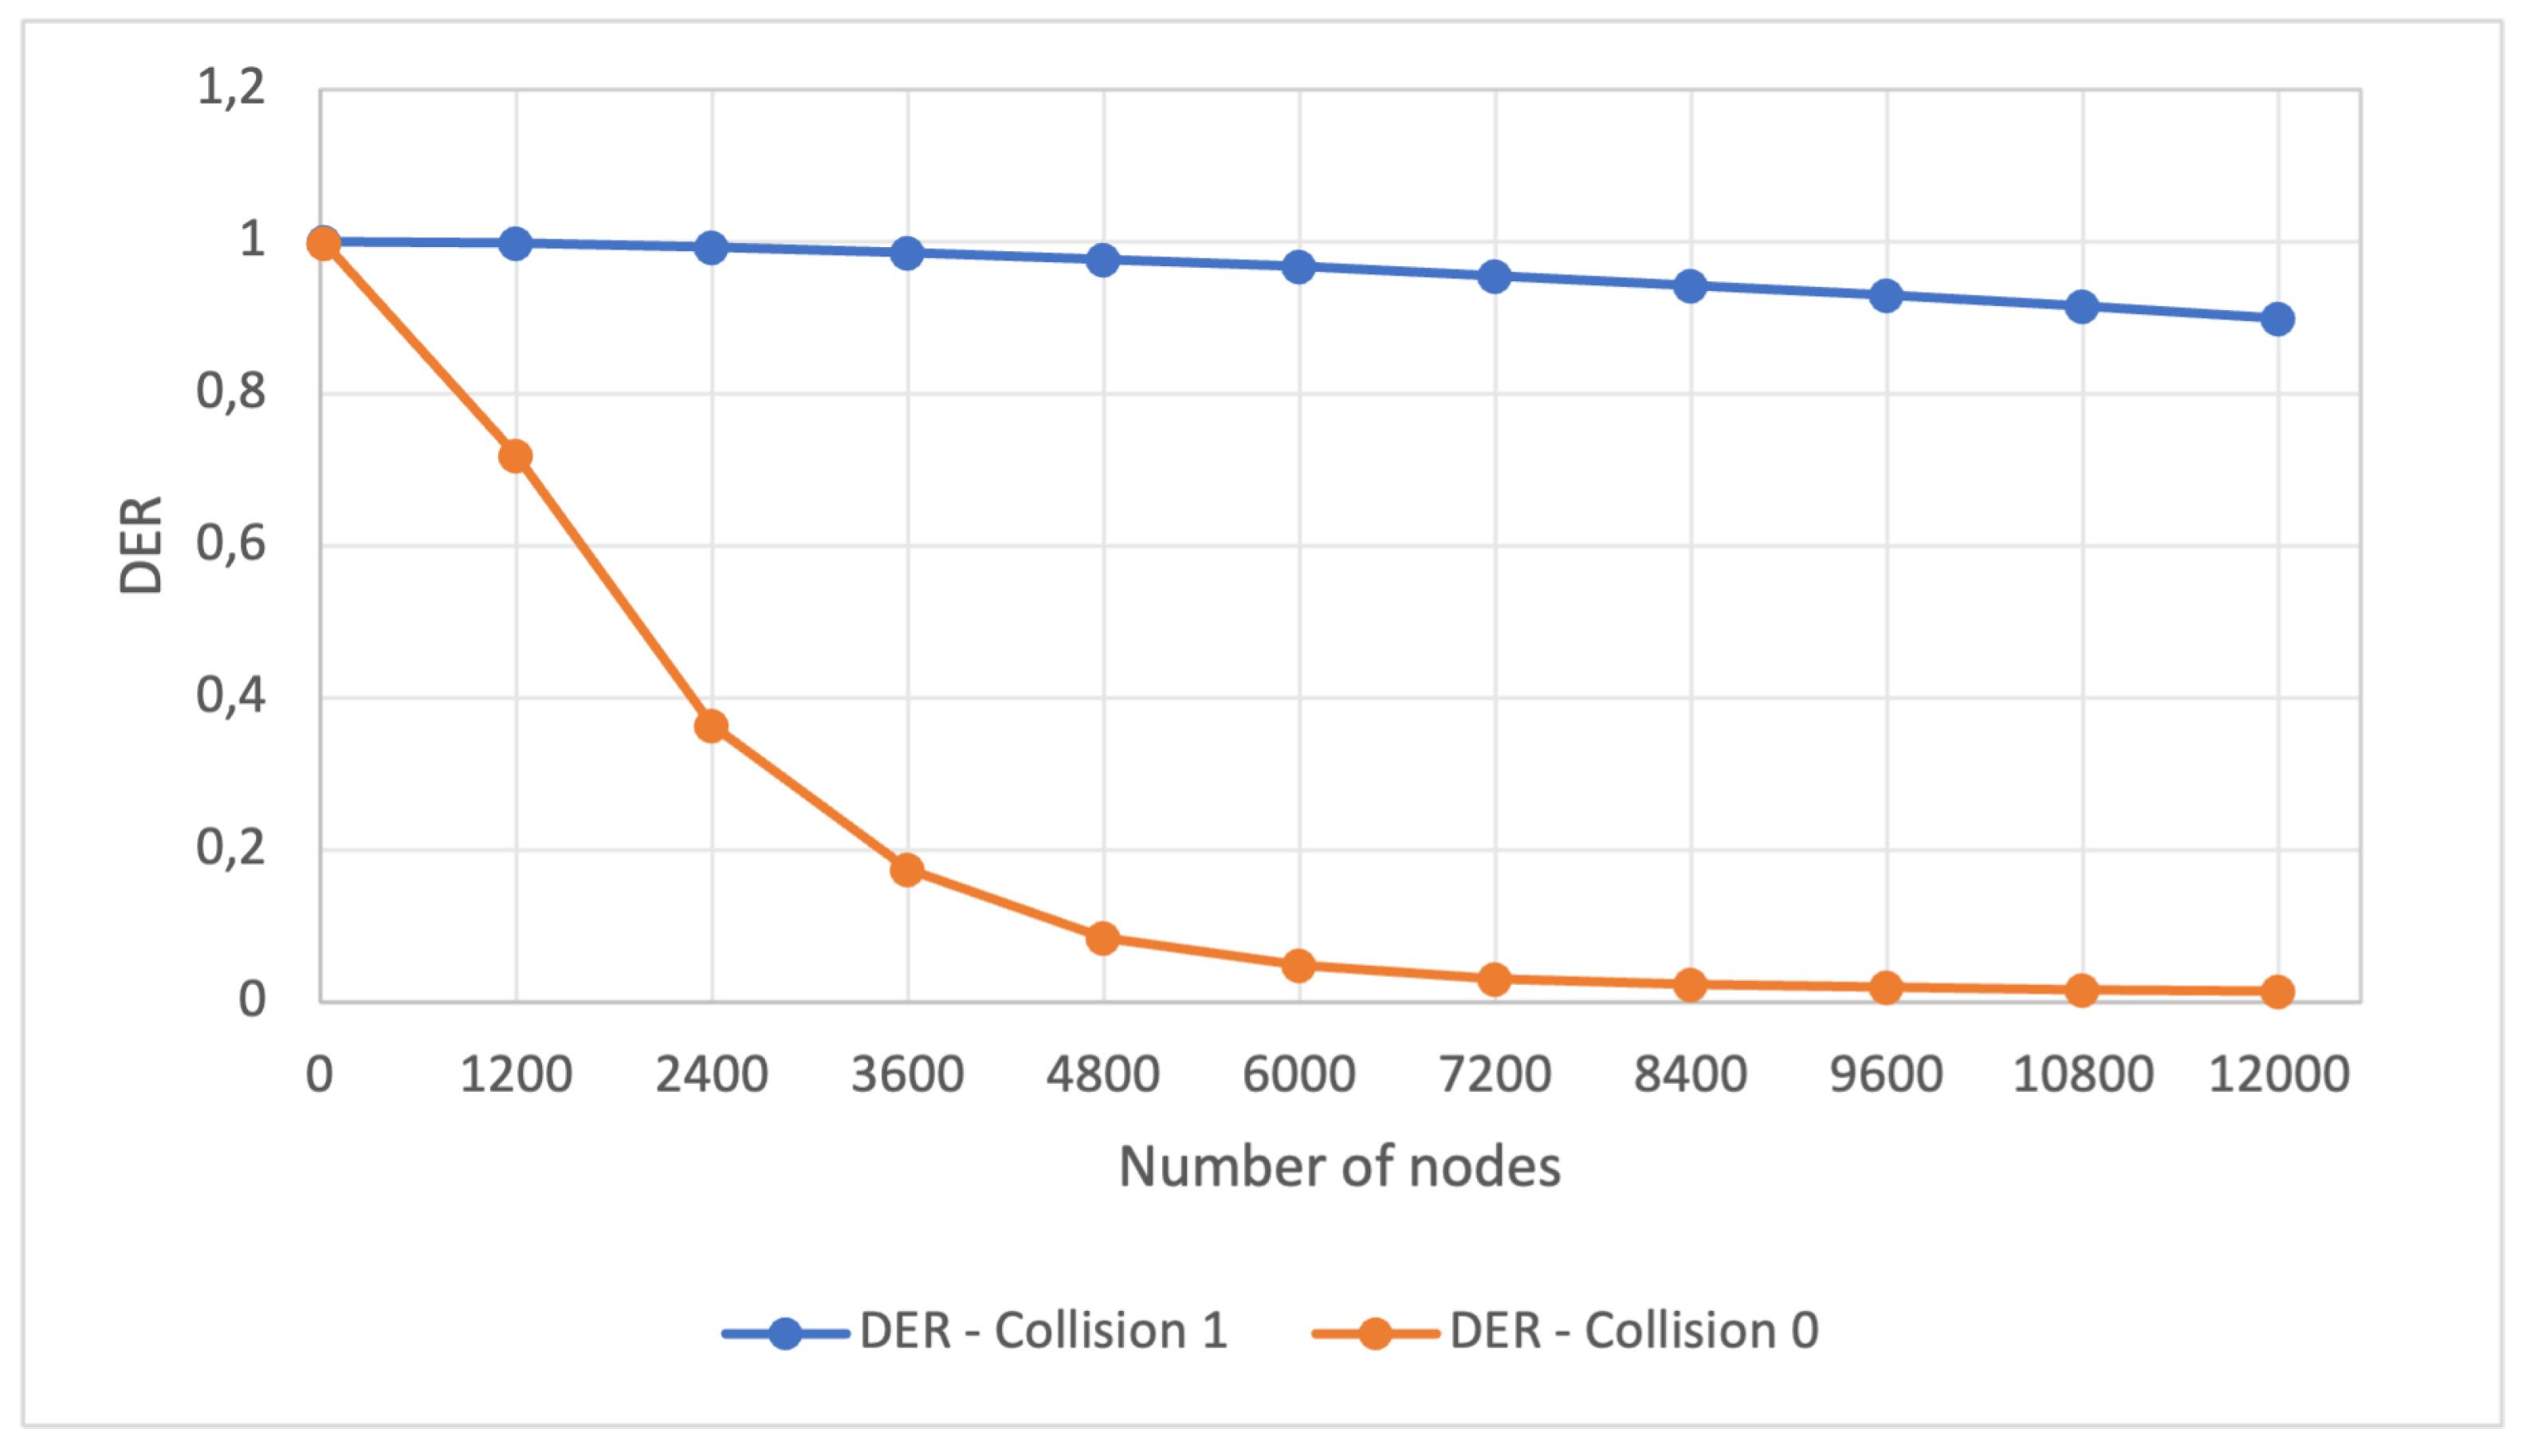
Figure 4.
Scenario 1, experiment 3 - Increasing the number of nodes with full collision check
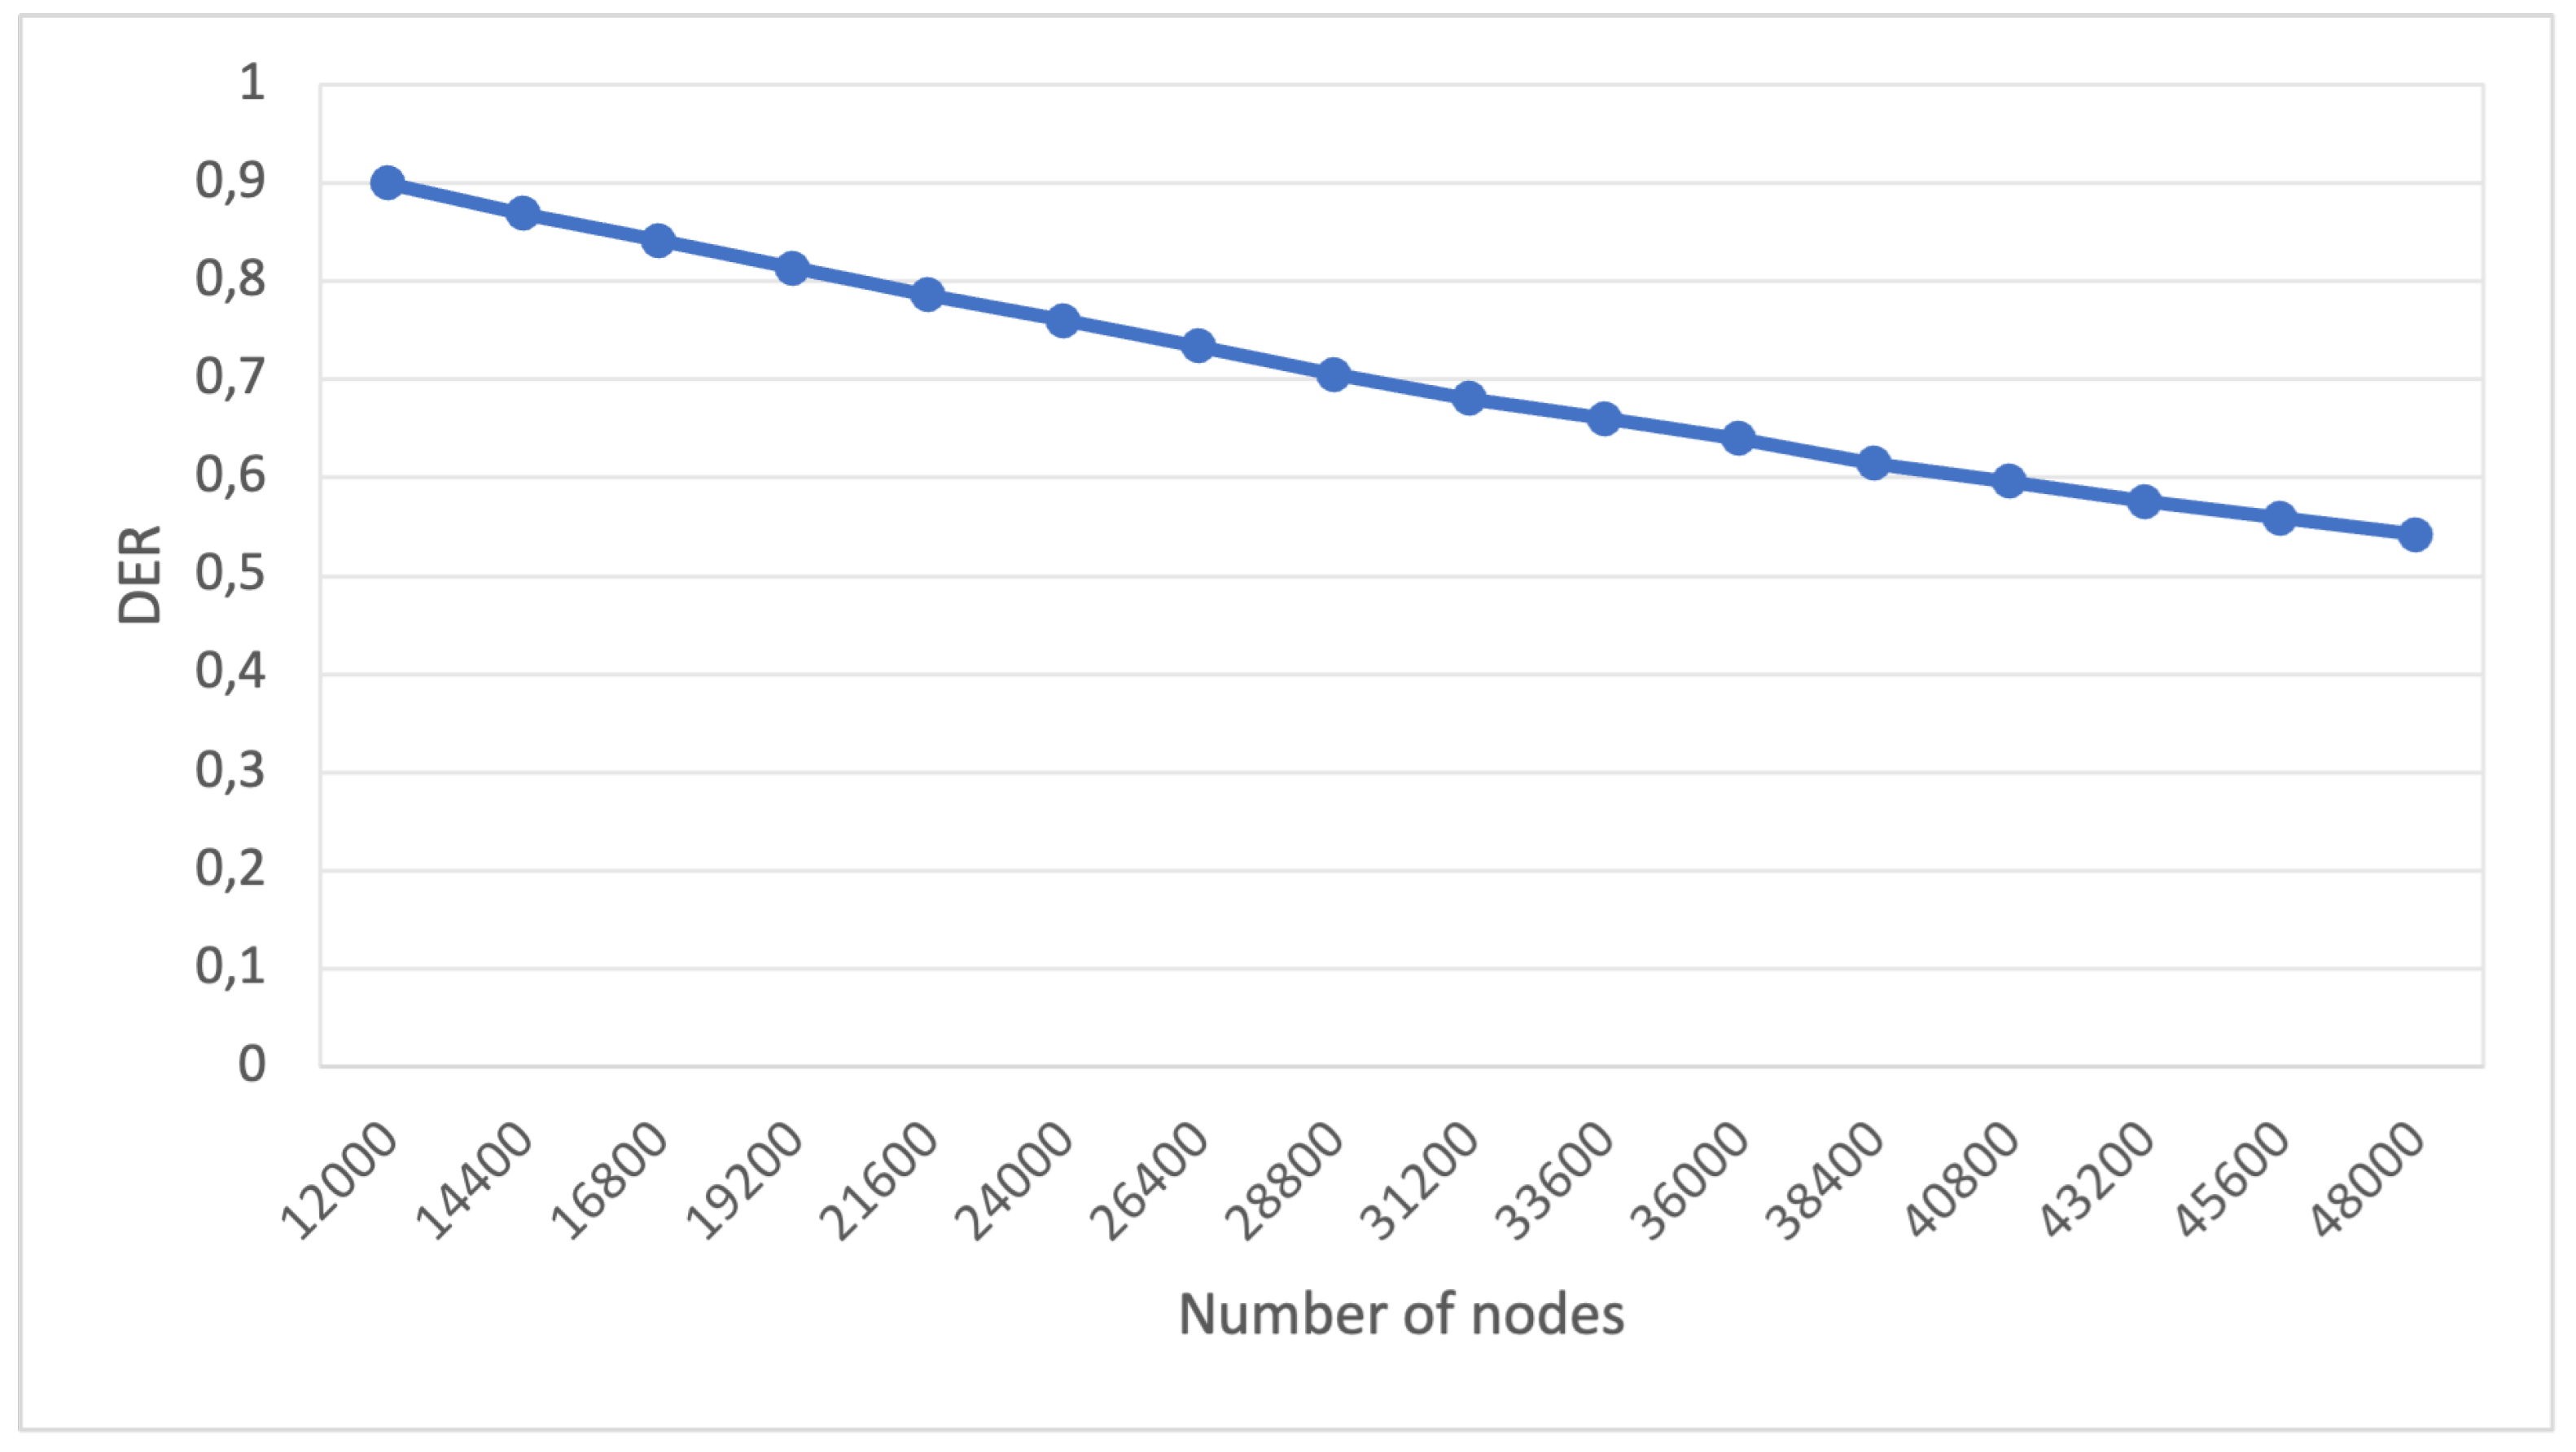
Figure 5.
Scenario 2, experiment 1 - DER behavior while decreasing the average packet sending interval.
Figure 5.
Scenario 2, experiment 1 - DER behavior while decreasing the average packet sending interval.
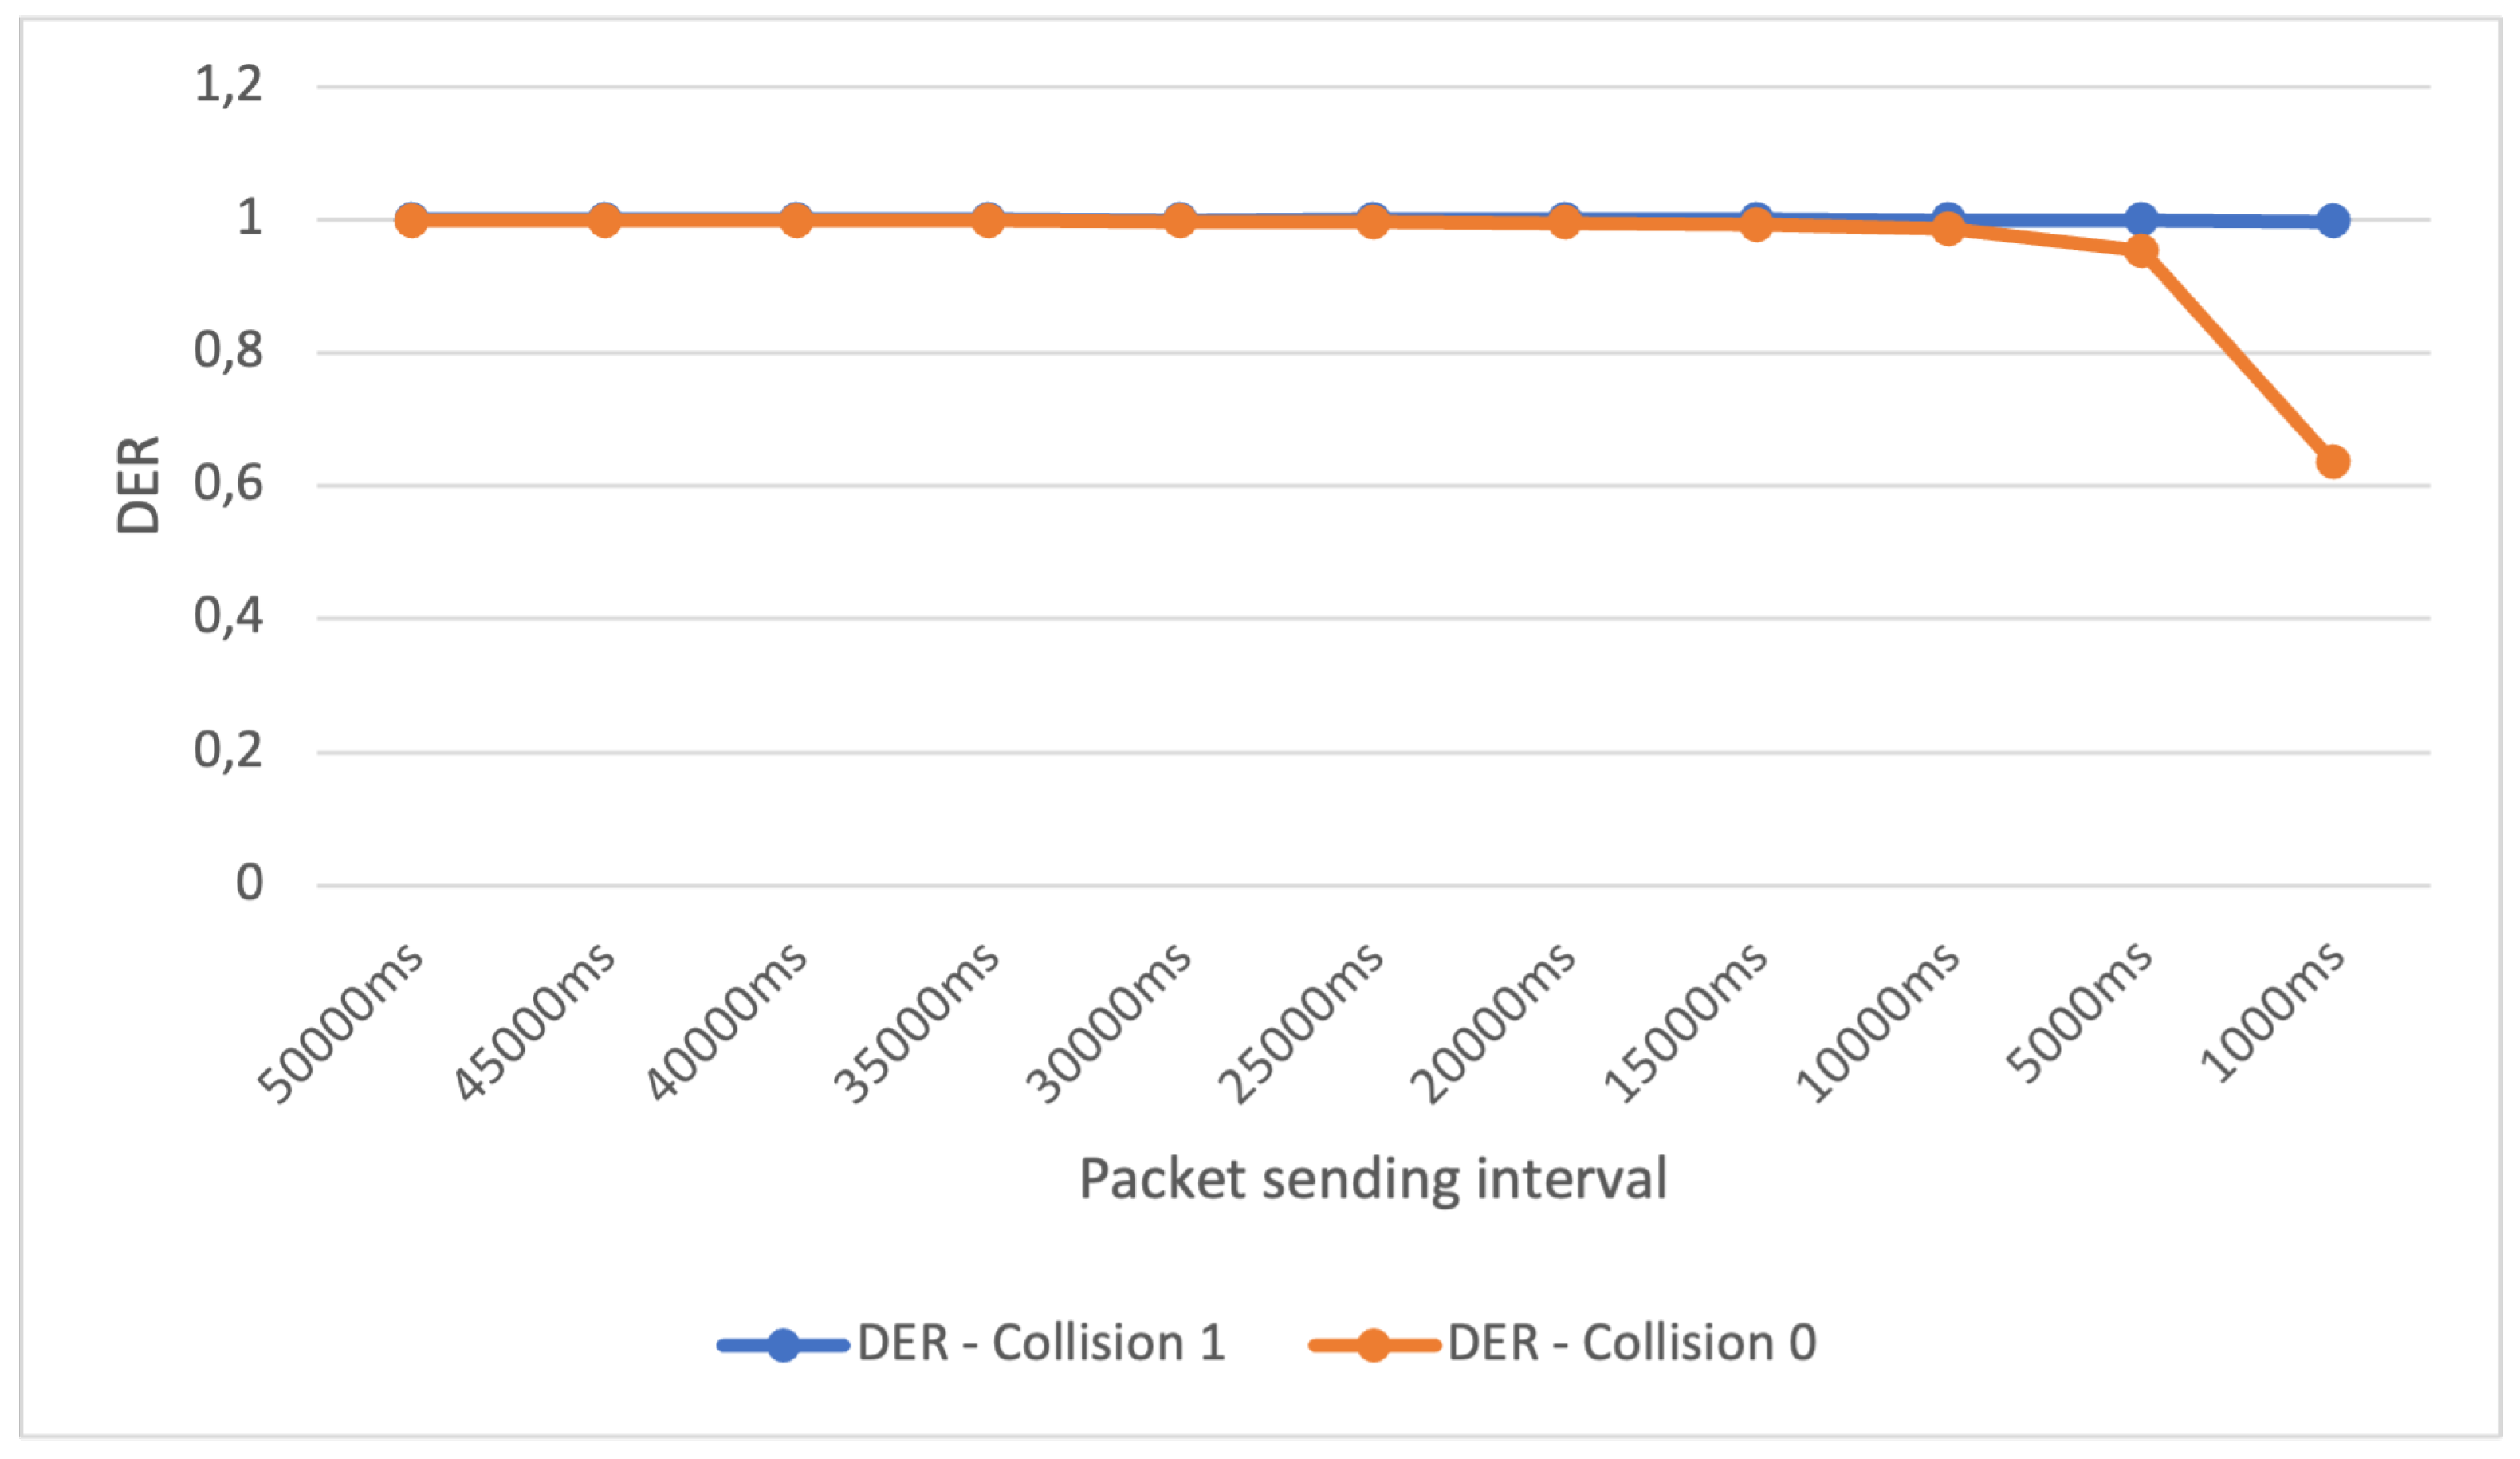
Figure 6.
Scenario 2, experiment 2 - DER behavior while forcing an extreme decreasing of the average packet sending interval.
Figure 6.
Scenario 2, experiment 2 - DER behavior while forcing an extreme decreasing of the average packet sending interval.
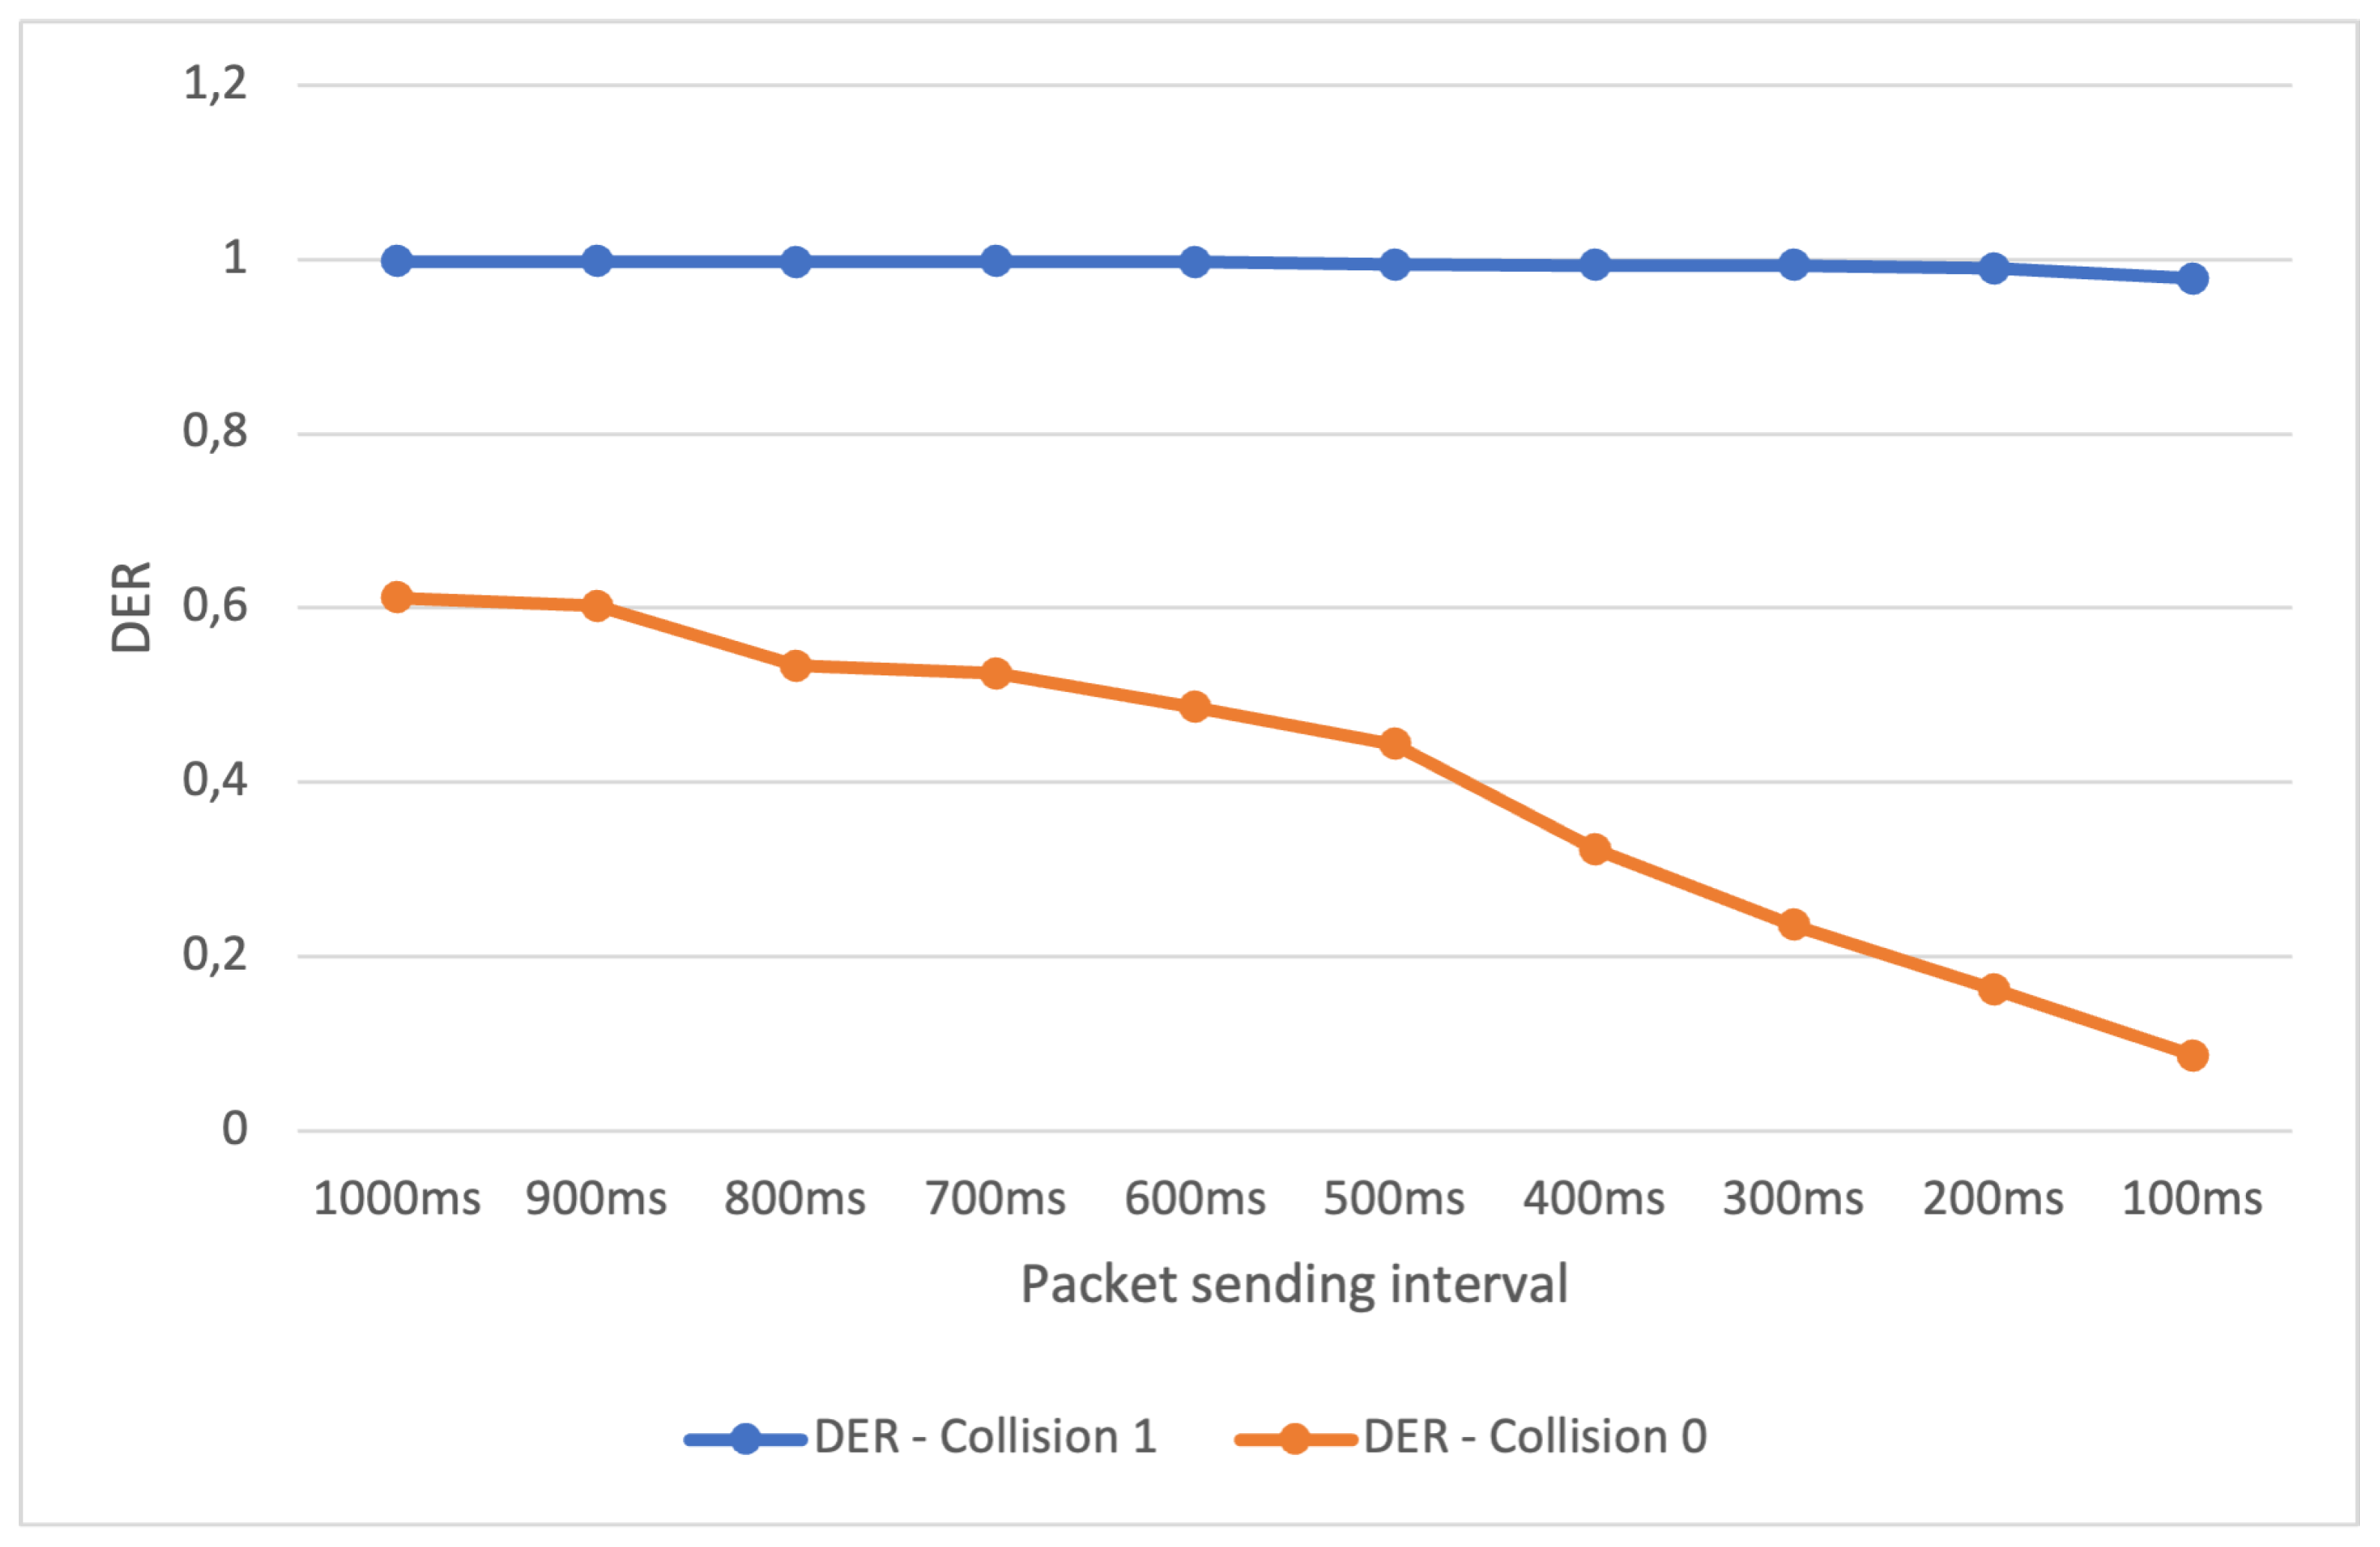
Figure 7.
Scenario 2, experiment 3 - DER behavior when decreasing the packet sending interval by 10ms - from 100ms until 10ms..
Figure 7.
Scenario 2, experiment 3 - DER behavior when decreasing the packet sending interval by 10ms - from 100ms until 10ms..
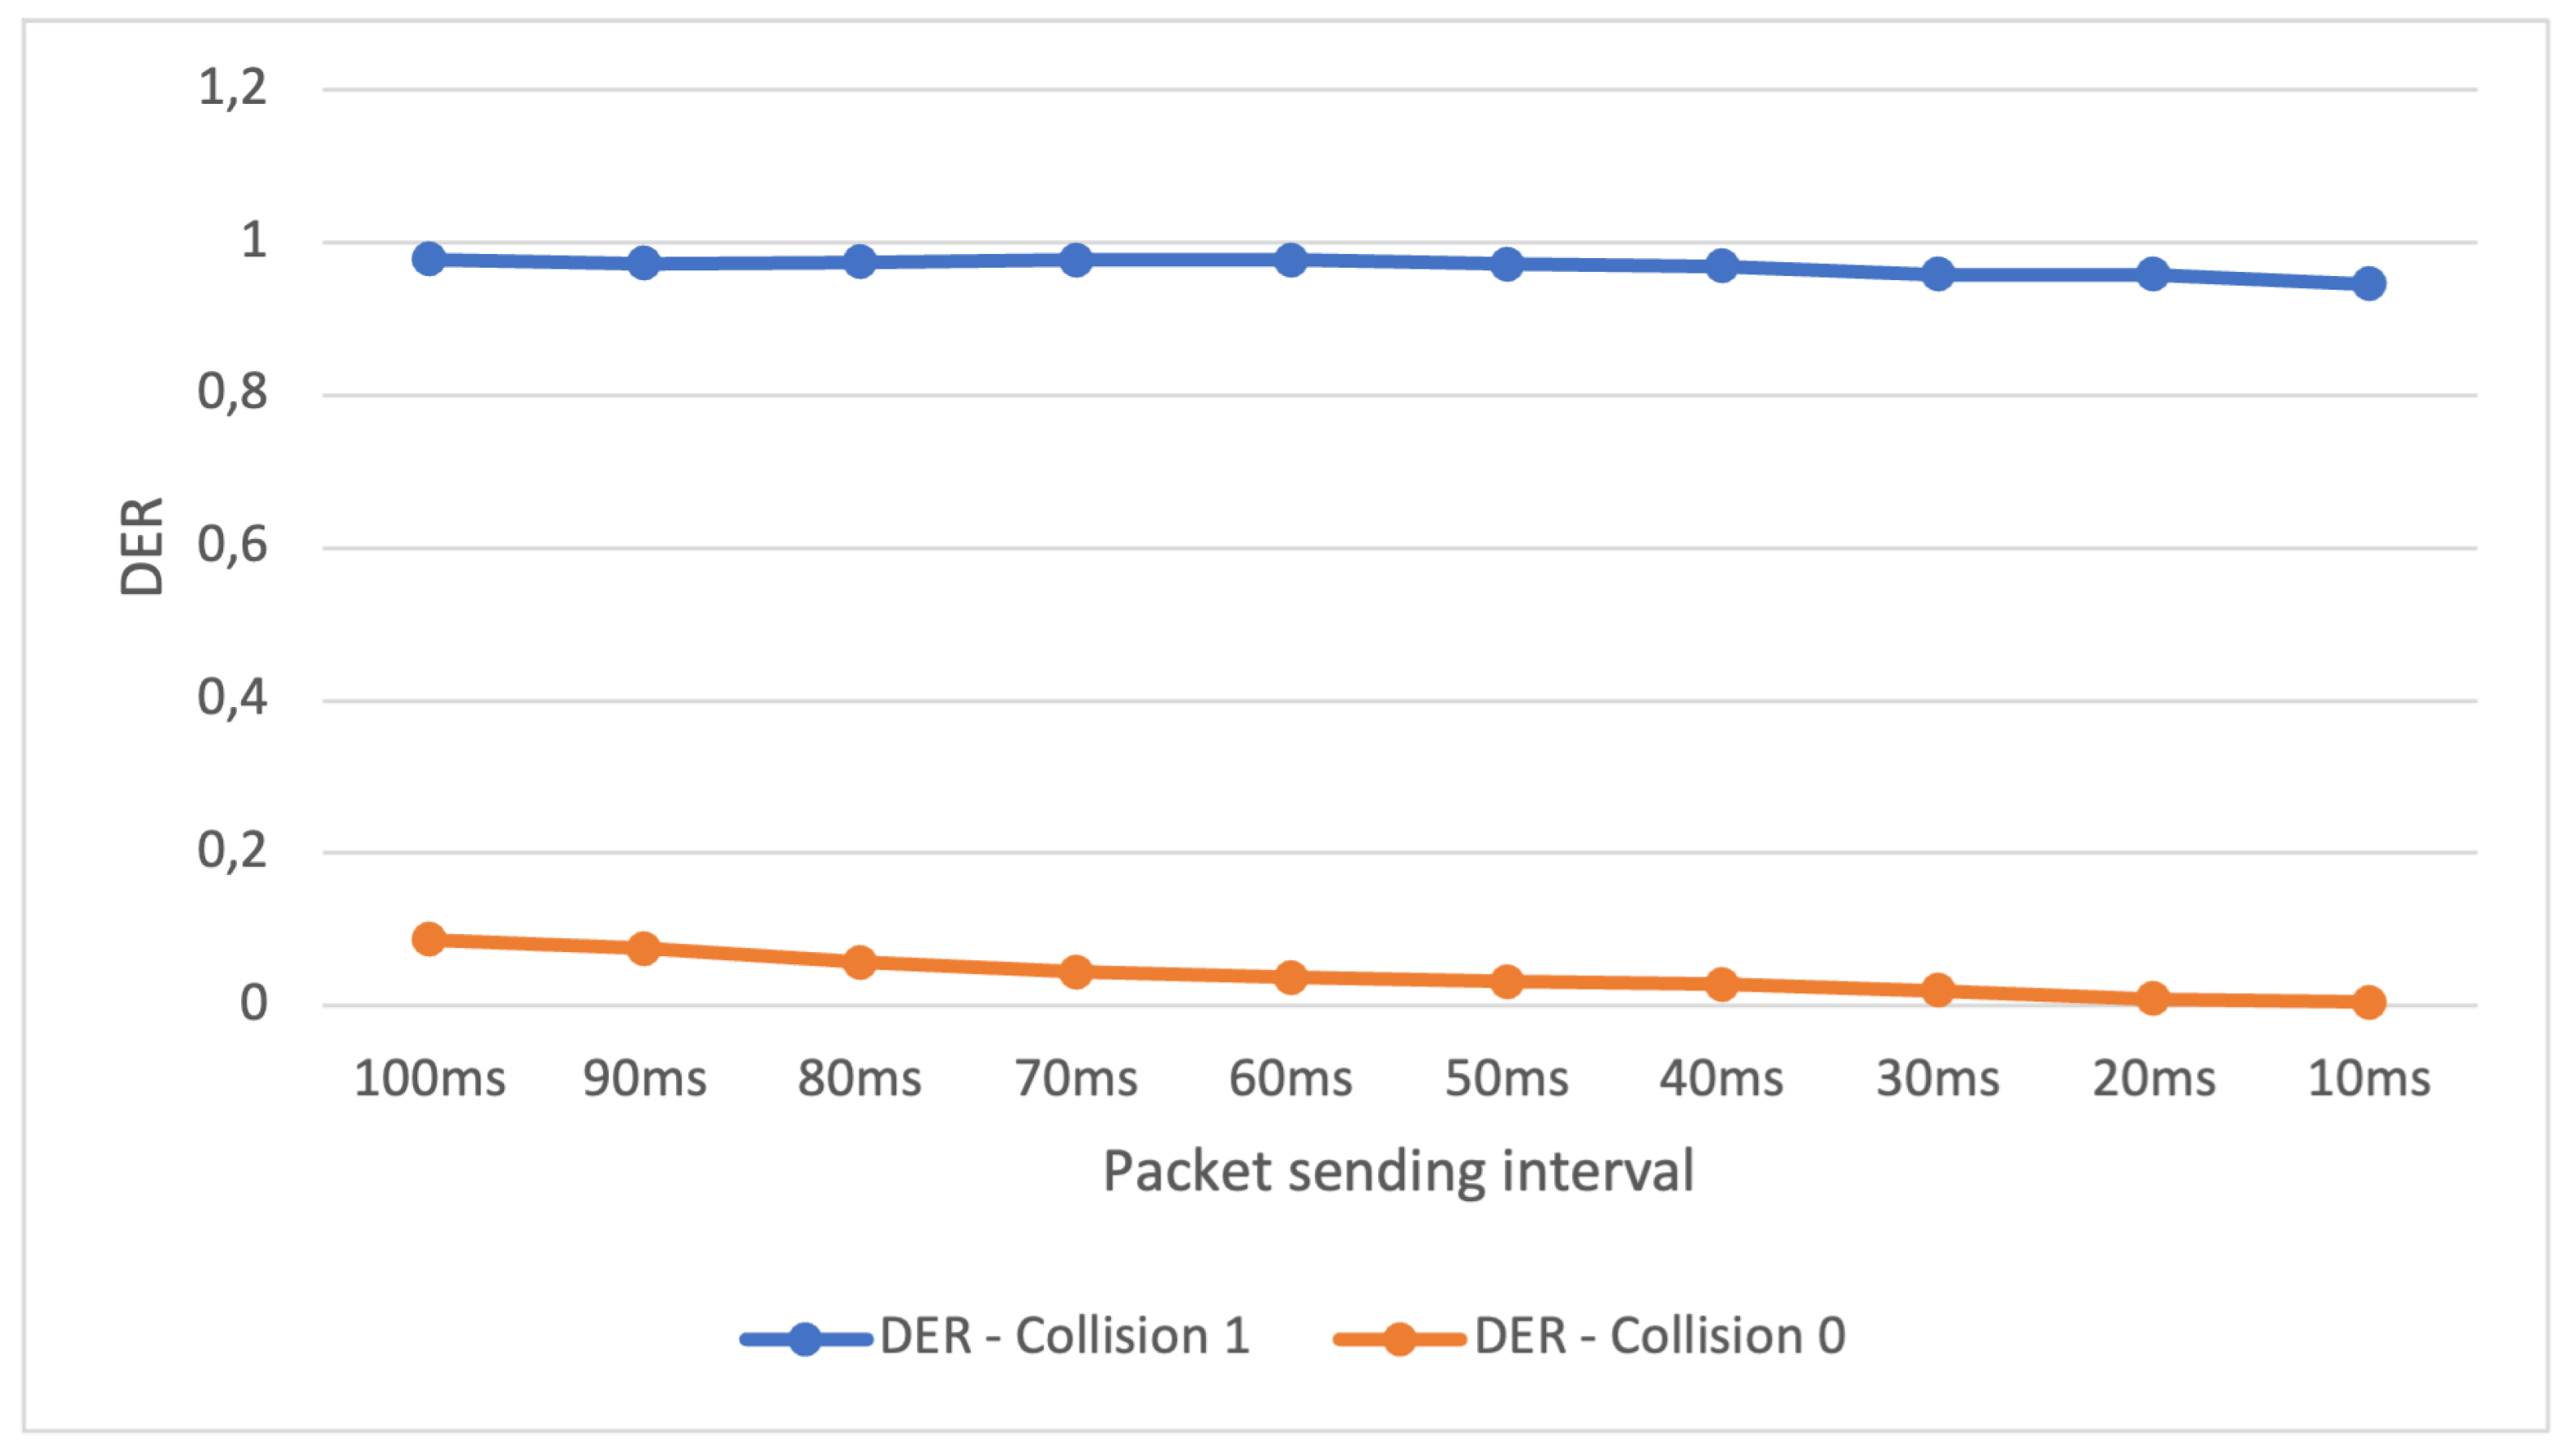
Figure 8.
Scenario 3, experiment 1 - DER behavior while increasing the number of nodes and decreasing the average packet sending interval - full collision check.
Figure 8.
Scenario 3, experiment 1 - DER behavior while increasing the number of nodes and decreasing the average packet sending interval - full collision check.
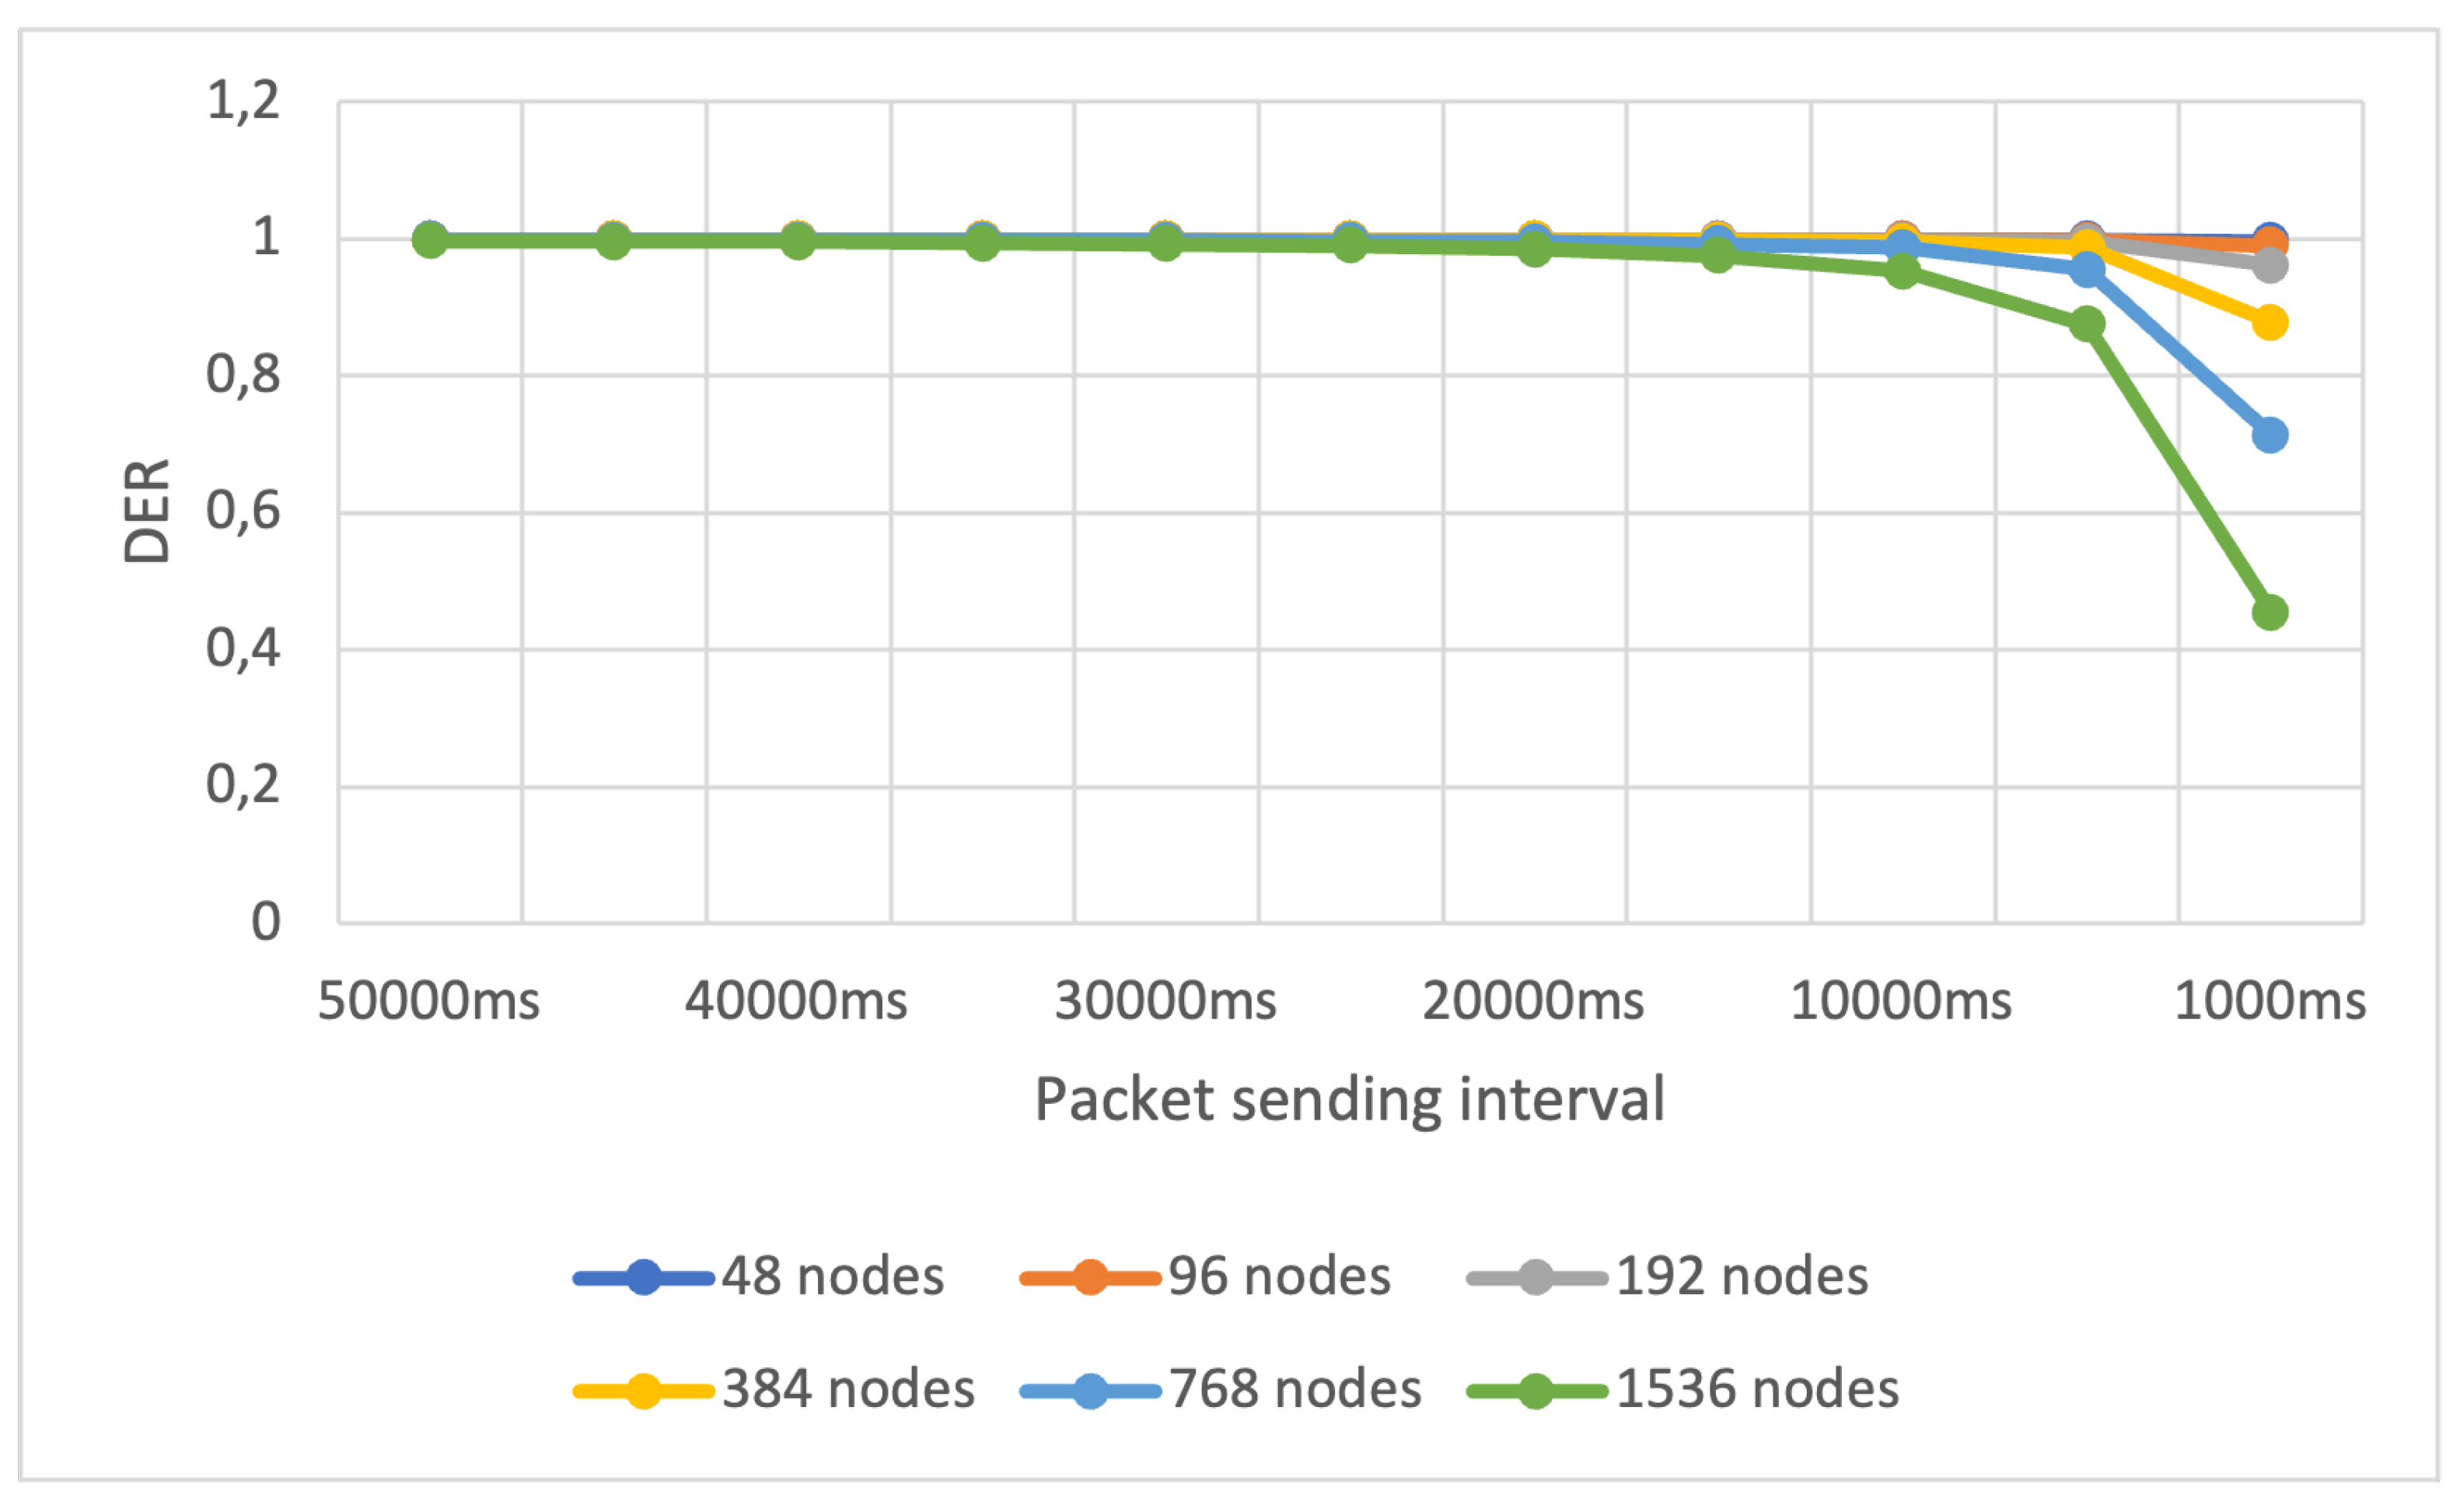
Figure 9.
Scenario 3, experiment 1 - DER behavior while increasing the number of nodes and decreasing the average packet sending interval - default collision check.
Figure 9.
Scenario 3, experiment 1 - DER behavior while increasing the number of nodes and decreasing the average packet sending interval - default collision check.
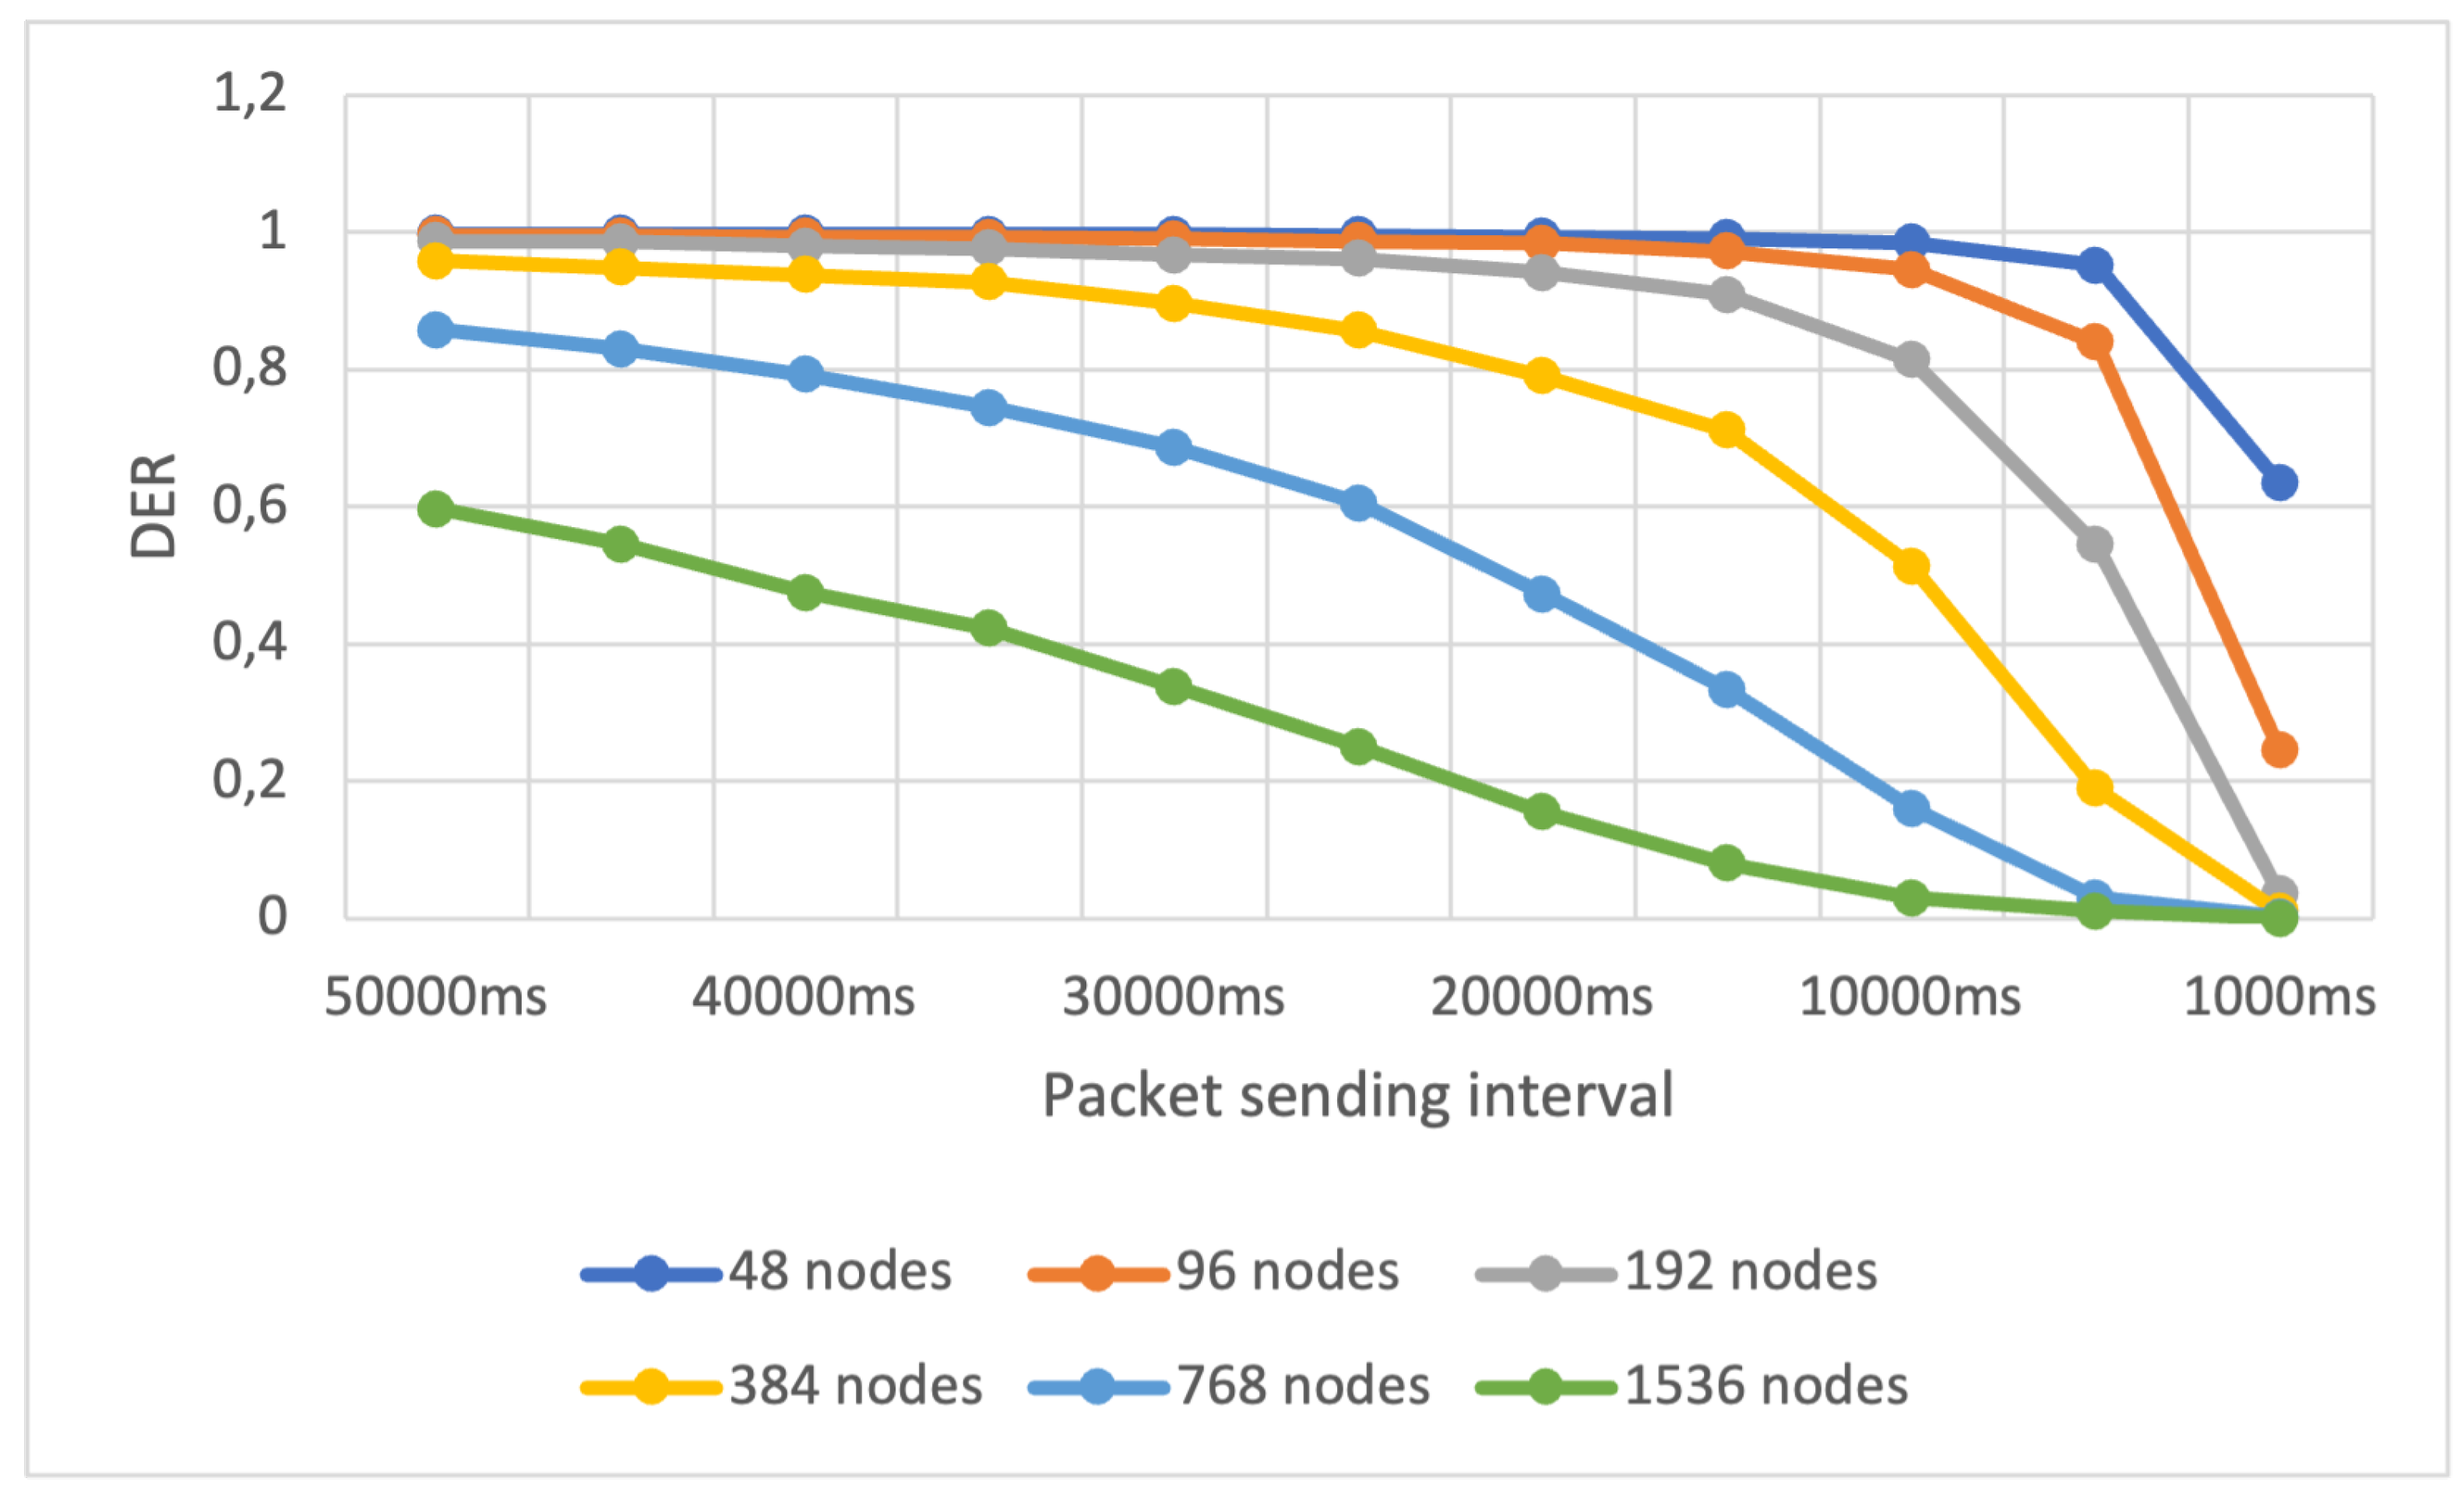
Figure 10.
Experiment 4 - DER behavior while increasing the number of nodes and decreasing the number of base stations for full collision check.
Figure 10.
Experiment 4 - DER behavior while increasing the number of nodes and decreasing the number of base stations for full collision check.
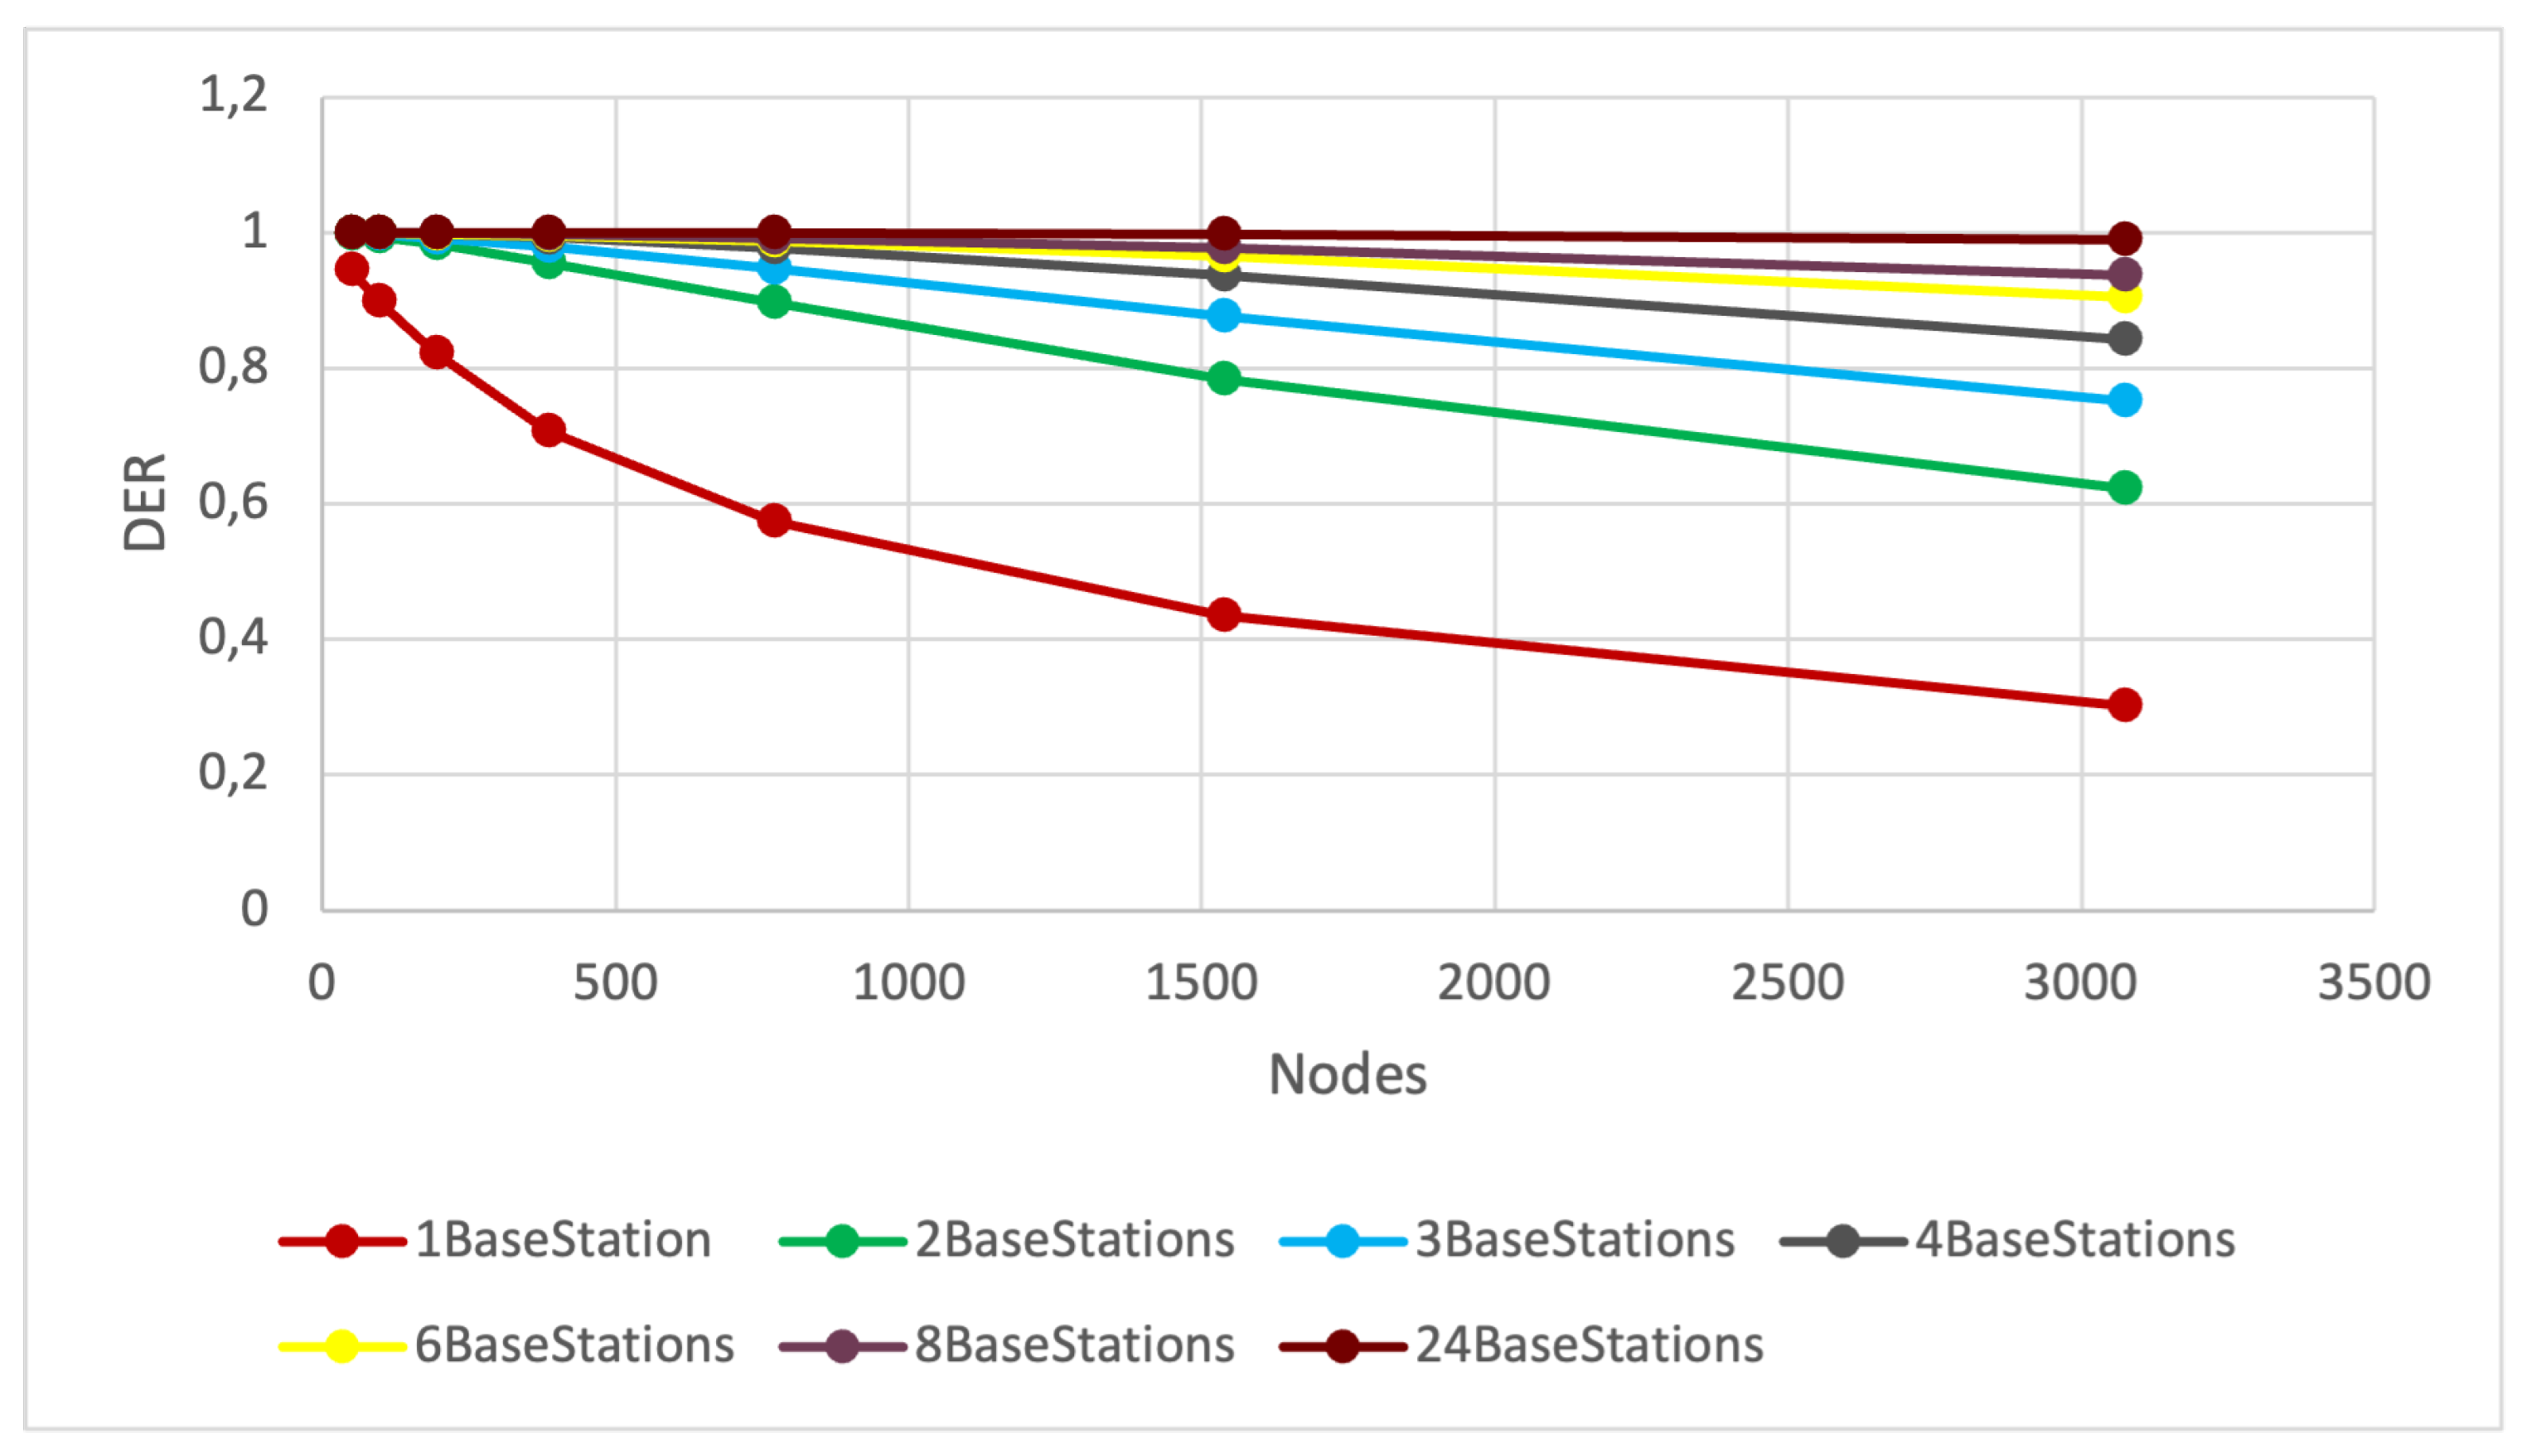
Figure 11.
Experiment 4 - DER behavior while increasing the number of nodes and decreasing the number of base stations for default collision check.
Figure 11.
Experiment 4 - DER behavior while increasing the number of nodes and decreasing the number of base stations for default collision check.

Figure 12.
Scenario 5, experiment 1 - DER behavior while increasing packet size and decreasing the average packet sending interval - full collision check.
Figure 12.
Scenario 5, experiment 1 - DER behavior while increasing packet size and decreasing the average packet sending interval - full collision check.
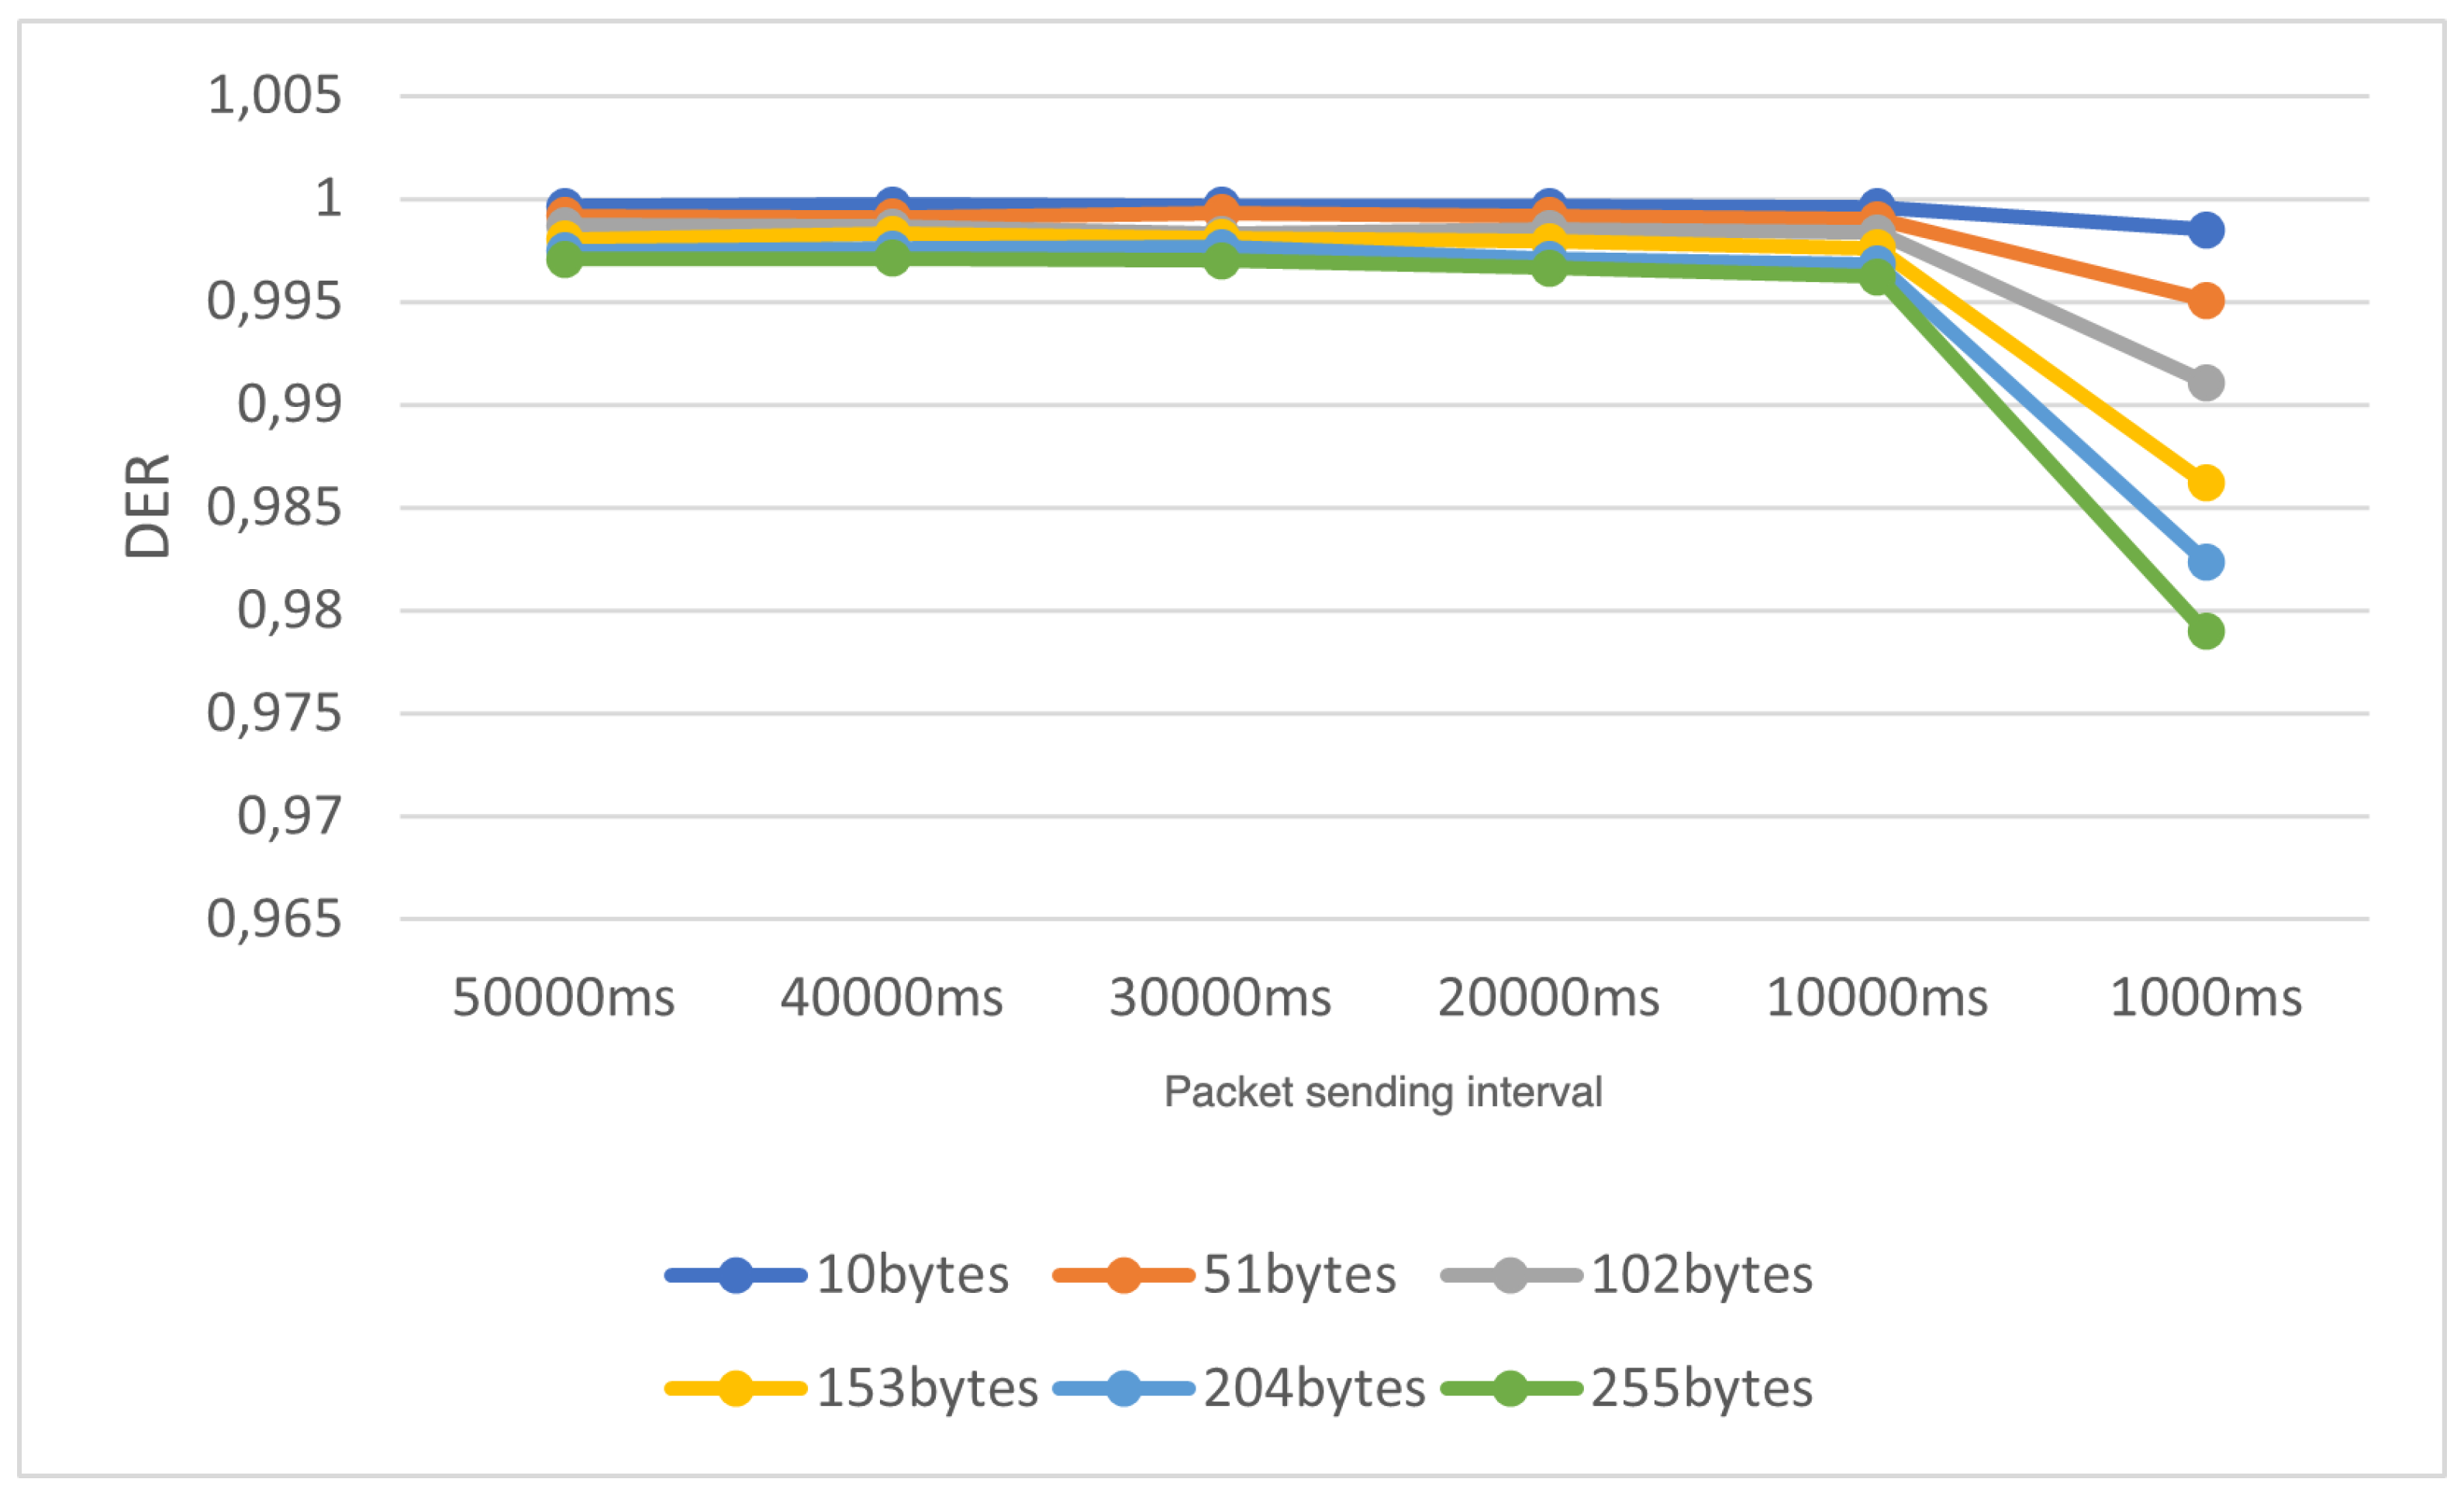
Figure 13.
Scenario 5, experiment 2 - DER behavior while increasing packet size and decreasing the average packet sending interval - default collision check.
Figure 13.
Scenario 5, experiment 2 - DER behavior while increasing packet size and decreasing the average packet sending interval - default collision check.
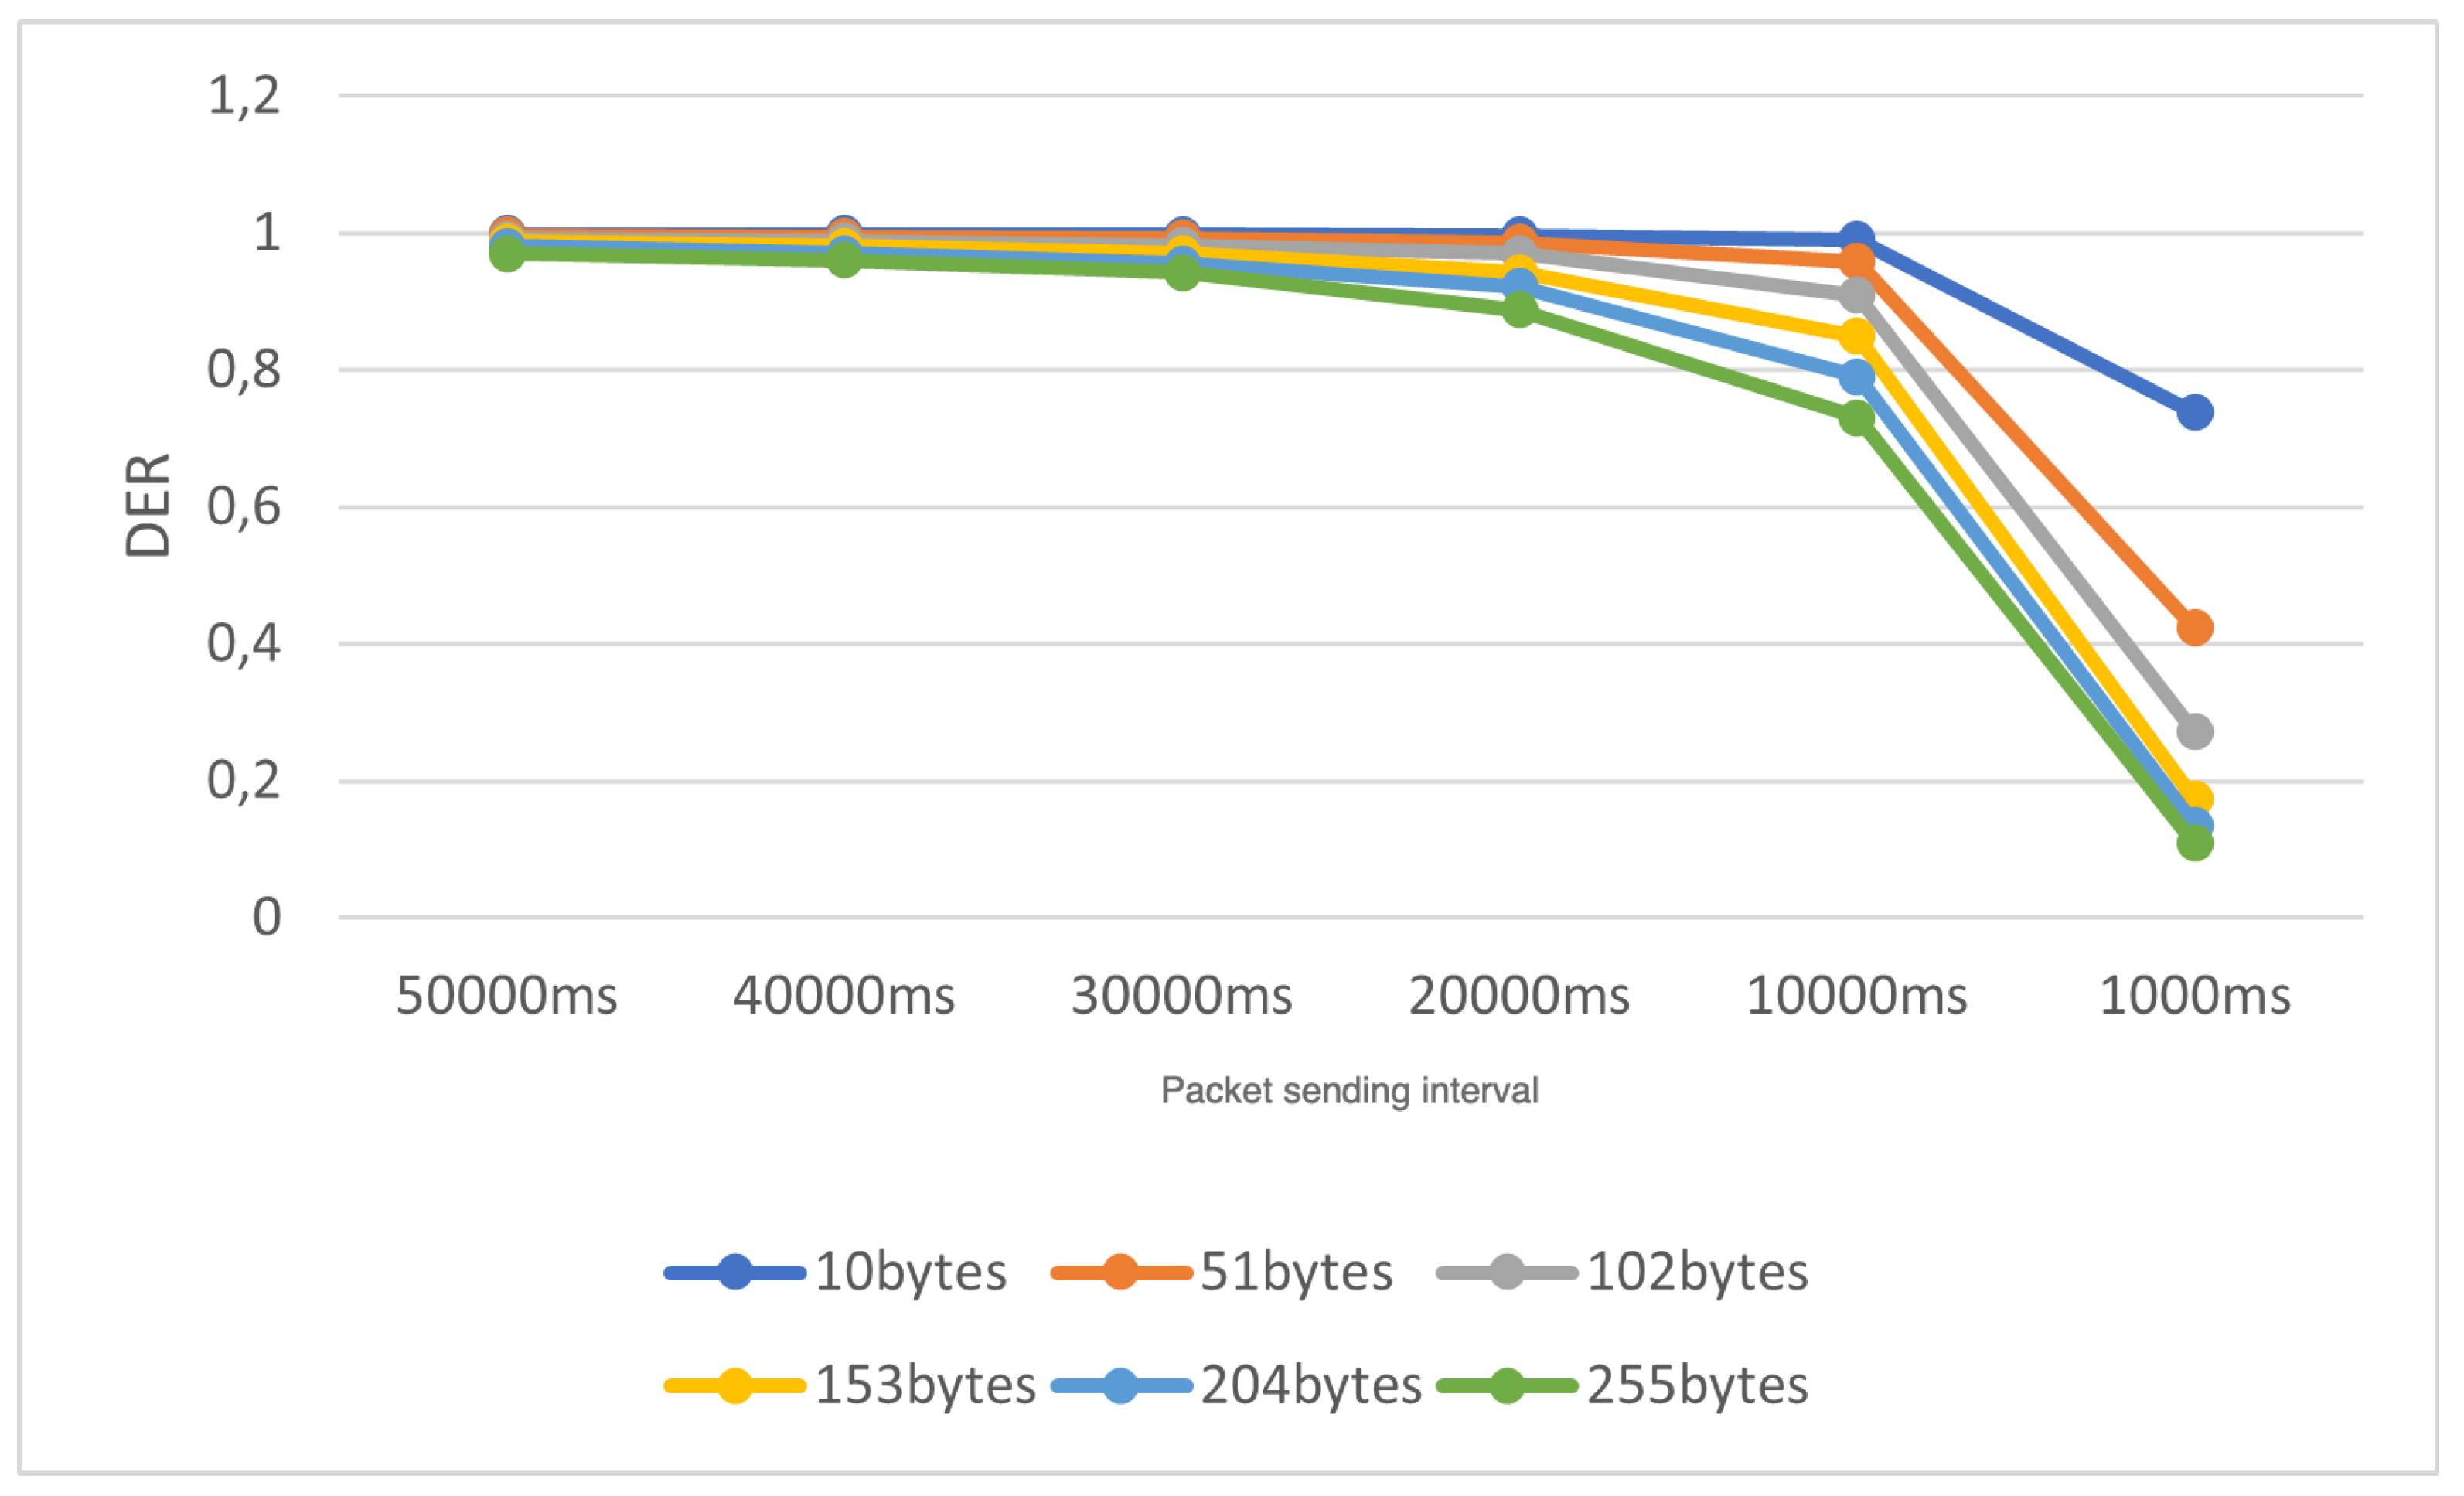

Table 1.
Description of proposed attacks on the availability of LoRa networks.
| Scenario | Goal | Variables | # of experiments |
| 1 | Analyze the impact of increasing the number of nodes on the network availability | number of nodes | 4 |
| 2 | Analyze the impact of decreasing the average packet sending interval on the network availability | average packet sending interval | 4 |
| 3 | Analyze the impact of increasing both the number of nodes and decreasing the average packet sending interval on the network availability | number of nodes and average packet sending interval | 1 |
| 4 | Analyze the impact of decreasing the number of base stations and increasing the number of nodes on the network availability | number of base stations and number of nodes | 1 |
| 5 | Analyze the impact of increasing packet length (size) and decreasing the average packet sending interval on the network availability | packet size and average packet sending interval | 1 |
Table 2.
Scenario 1 - experiments and network parameters.
| ID | Min. number of nodes | Max. number of nodes | Increasing node rate | Metric |
| 1 | 24 | 240 | 24 | DER |
| 2 | 24 | 12000 | 1200 | DER |
| 3 | 12000 | 48000 | 2400 | DER |
Table 3.
Scenario 2 - experiments and network parameters
| ID | Maximum packet sending interval | Minimum packet sending interval | Decreasing rate | Metric |
| 1 | 50,000 ms | 1,000 ms | 5,000 ms | DER |
| 2 | 1,000 ms | 100ms | 100 ms | DER |
| 3 | 100 ms | 10 ms | 10 ms | DER |
Disclaimer/Publisher’s Note: The statements, opinions and data contained in all publications are solely those of the individual author(s) and contributor(s) and not of MDPI and/or the editor(s). MDPI and/or the editor(s) disclaim responsibility for any injury to people or property resulting from any ideas, methods, instructions or products referred to in the content. |
© 2024 by the authors. Licensee MDPI, Basel, Switzerland. This article is an open access article distributed under the terms and conditions of the Creative Commons Attribution (CC BY) license (http://creativecommons.org/licenses/by/4.0/).
Copyright: This open access article is published under a Creative Commons CC BY 4.0 license, which permit the free download, distribution, and reuse, provided that the author and preprint are cited in any reuse.


