
Submitted:
29 December 2024
Posted:
30 December 2024
You are already at the latest version
Abstract
Background: During the last few years, significant pathophysiological differences between heart failure (HF) patients with “normal” ejection fraction (EF) (50% to 64%) and those with supra-normal EF (≥65%) have been highlighted. However, these distinct EF phenotypes have been poorly investigated in elderly patients aged ≥70 yrs. Methods: All patients aged ≥70 yrs discharged from our Institution with a first diagnosis of HF with preserved EF (HFpEF) be-tween January 2020 and March 2021 entered the study. All patients underwent clinical evalua-tion, blood tests and transthoracic echocardiography. The primary endpoint was “all-cause mortality”, while the secondary one was the composite of “all-cause mortality or rehospitali-zation for all causes” over a mid-term follow-up. Results: A total of 200 HFpEF patients (86.4±6.6 yrs, 70% females) were retrospectively evaluated. The “normal” EF group (n=99) and the “supra-normal” EF one (n=101) were separately analyzed. Compared to patients with “normal” EF, those with “supra-normal” EF were older, with greater comorbidity burden and moderate-to-severe frailty status. During a mean follow-up of 3.6±0.3 yrs, 79 patients died and 73 were re-hospitalized. On multivariate Cox regression analysis, age (HR 1.09, 95% CI 1.03-1.16, p = 0.002), EF (HR 1.08, 95% CI 1.03-1.14, p = 0.004), tricuspid annular plane systolic excursion (TAPSE)/systolic pulmonary artery pressure (sPAP) ratio (HR 0.14, 95% CI 0.03-0.61, p = 0.009) and infectious disease (HR 7.23, 95% CI 2.41-21.6, p < 0.001) were independently as-sociated with all-cause mortality in the whole study population. EF (HR 1.04, 95% CI 1.01-1.07, p = 0.02) also predicted the secondary endpoint. EF ≥65% was the best cut-off to predict both endpoints. Conclusions: “Supra-normal” EF (≥65%) at hospital admission is independently associated with all-cause mortality and rehospitalization for all causes in elderly HFpEF pa-tients over a mid-term follow-up.
Keywords:
elderly
; supra-normal ejection fraction
; heart failure
; HFpEF
; outcome
1. Introduction
Heart failure with preserved ejection fraction (HFpEF) is a clinical syndrome that derives from the interaction of relevant cardiovascular risk factors and multiple contributing factors, including advanced age, female sex, overweight/obesity, metabolic syndrome/diabetes mellitus, physical inactivity/deconditioning, arterial hypertension, chronic kidney disease (CKD) and non-cardiovascular comorbidities, such as anemia, cancers, dysthyroidism, electrolyte disorders, infective disorders, thoracic kyphosis, obstructive sleep apnea syndrome (OSAS) and chronic obstructive pulmonary disease (COPD) [1].
According to the latest ESC Guidelines [2], HFpEF is diagnosed in the presence of symptoms and signs of heart failure (HF), associated with a preserved ejection fraction (EF) (≥50%) on standard transthoracic echocardiography (TTE) and objective evidence of cardiac structural and/or functional abnormalities consistent with the presence of left ventricular (LV) diastolic dysfunction/raised left ventricular filling pressures (LVFP), including elevated natriuretic peptides [brain natriuretic peptide (BNP) ≥35 pg/ml or N-terminal pro-brain natriuretic peptide (NT-proBNP) ≥125 pg/ml].
The prevalence of HFpEF is increasing worldwide, accounting for more than 50% of HF cases [3]. Due to the increased burden of non-cardiovascular comorbidities in HFpEF patients, these individuals have a greater risk of all-cause hospitalisation and emergency visits and are more likely to experience non-cardiac death, in comparison to HF patients with reduced EF [3].
During the last few years, a new category of HFpEF characterized by “supra-normal” EF (≥65%) [4,5], named HF with “supra-normal” ejection fraction (HFsnEF), has been proposed. Some studies have highlighted significant pathophysiological differences between HF patients with EF 50% to 64% (the “normal” EF phenotype) in comparison to those with EF ≥65% (the “supra-normal” EF phenotype) in both chronic [6,7] and acute [8,9] HF. However, the majority of studies that evaluated the prognostic role of a “supra-normal” EF included predominantly middle-aged participants (aged <70 yrs), and, as far as we know, no previous study was specifically focused on elderly HFpEF patients aged ≥70 yrs. It is noteworthy that, due to the growing ageing of the population worldwide, HFpEF patients aged ≥70 yrs will be more frequently encountered in clinical practice [10]. Accordingly, the present study was primarily designed to assess the clinical, biochemical and echocardiographic characteristics of a retrospective cohort of elderly HFpEF patients (aged ≥70 yrs), categorized on the basis of “normal” EF (50 to 64%) or “supra-normal” EF (≥65%), and to determine the independent prognostic indicators of “all-cause mortality” and “re-hospitalizations for all-causes” over a mid-term follow-up in the whole study population.
2. Materials and Methods
2.1. Study Population
All elderly patients aged ≥70 yrs discharged from the Internal Medicine Division of San Giuseppe MultiMedica Hospital (Milan), a tertiary university institution, with a first diagnosis of HFpEF, between January 1st, 2020, and March 27th, 2021, were included in this retrospective observational study. The study group was selected from a larger population of HF patients, previously analyzed in a research that aimed to investigate the prevalence and clinical outcome of main echocardiographic and hemodynamic HF phenotypes [11].
As recommended by the 2021 ESC guidelines [2], HFpEF diagnosis was formulated in the presence of: symptoms (dyspnea, fatigue, or decreased exercise capacity); signs (edema or rales on chest auscultation); preserved EF (≥50%) on TTE examination performed at admission to the Internal Medicine Division; elevated levels of natriuretic peptides (NT-proBNP ≥125 pg/ml); and at least one of the following: relevant structural heart disease (LV hypertrophy or left atrial enlargement) and/or diastolic dysfunction.
Exclusion criteria were: heart failure with reduced ejection fraction (HFrEF) (EF ≤40%), heart failure with mildly reduced ejection fraction (HFmrEF) (EF 41-49%), age <70 yrs, hemodynamic instability requiring spoke-to-hub transfer, HF patients who did not perform conventional TTE during hospital stay, poor echocardiographic windows, lacking of a comprehensive laboratory panel. COVID-19 patients were excluded from this retrospective analysis, to avoid the risk of bias related to concomitant COVID-19 disease.
HFpEF patients were divided in two major groups, according to EF value obtained at TTE performed at hospital admission: (1) HFpEF patients with EF 50 to 64% (the “normal” EF group); (2) HFpEF patients with EF ≥65% (the “supra-normal” EF group). This cut-off was derived from previous population studies [5,12] that analyzed the prognostic role of “supra-normal” EF (≥65%) over a mid-term follow-up.
HFpEF patients were further classified as affected by one of the following clinical subtype of HF, based on predominant etiology and pathophysiology: (1) HF due to acute/chronic coronary artery disease (CAD); (2) HF due to acute/chronic valvular heart disease (VHD); (3) HF due to hypertensive cardiomyopathy; (4) HF due to acute/chronic pulmonary hypertension [2].
Echocardiographic and clinical categories of HF were assessed according to the above-mentioned standardized criteria by two expert clinicians (C.L. and A.S.) within 48 h from admission to the Internal Medicine Division.
The following data were collected from patients’ hospital medical charts: age; gender; prevalence of relevant cardiovascular risk factors (hypertension, smoking, type 2 diabetes and dyslipidemia); main comorbidities [CKD, defined as an estimated glomerular filtration rate (eGFR) <60 ml/min/m2 [13], history of CAD (previous acute coronary syndrome, previous percutaneous and/or surgical coronary revascularization), peripheral arteriopathy, previous stroke and/or transient ischemic attack, cognitive impairment, COPD, OSAS, hypothyroidism, anemia (defined as hemoglobin <12 g/dl for females or 13 g/dl for males)]; blood tests comprehensive of complete blood count, serum creatinine and eGFR, serum levels of glucose, sodium, potassium, uric acid, calcium, total bilirubin, total cholesterol, high-density lipoprotein (HDL) cholesterol, low-density lipoprotein (LDL) cholesterol, thyroid-stimulating hormone, C-reactive protein (CRP), NT-proBNP, high-sensitivity (HS) troponine; blood pressure measurements; electrocardiographic data (cardiac rhythm and pattern of intraventricular conduction); chest X-ray (CXR) results; current medical treatment.
All procedures were in accordance with the ethical standards of our Institutional Research Committee and with the 1964 Helsinki Declaration and its later amendments or comparable ethical standards. The study protocol was approved by the local Ethics Committee (Committee’s reference number 464.2021).
2.2. Clinical Prognostic Scores
For each HFpEF patient included in the present study, the following clinical scores were calculated: 1) H2FPEF score, which assigned 3 points for the presence of paroxysmal or persistent atrial fibrillation (AF); 2 points for obesity, defined as body mass index (BMI) >30 kg/m2; 1 point for each of the following criteria: age >60 years, treatment with ≥2 antihypertensive drugs, E/e′ ratio >9 and systolic pulmonary artery pressure (sPAP) >35 mmHg [14]; the total H2FPEF score ranges from 0 to 9 with the scores <2 and scores ≥6, respectively, reflecting low and high likelihoods of HFpEF, respectively; 2) Charlson Comorbidity Index (CCI), which was calculated as follows: 1 point for each of myocardial infarction, congestive heart failure, peripheral vascular disease, dementia, cerebrovascular disease, chronic lung disease, connective tissue disease, ulcer, chronic liver disease, diabetes; 2 points for each of hemiplegia, moderate or severe kidney disease, diabetes with end-organ damage, tumor, leukemia, lymphoma; 3 points for moderate or severe liver disease; 6 points for tumor metastasis or AIDS [15]; AGILE score, a rapid and effective tool for investigating the four domains of “multidimensional” frailty (physical, mental, nutritional, and socio-economic), that allowed to stratify each HFpEF patient into different frailty degrees: not-frail (score 0), light (score 1–3), moderate (score 4–7), or severe (score 8–10) frailty [16].
2.3. Conventional Transthoracic Echocardiography
All TTE examinations were performed by the same expert cardiologist (A.S.) within 48 hours after hospital admission, using commercially available Philips Sparq ultrasound machine (Philips, Andover, Massachusetts, USA) with a 2.5 MHz transducer. All parameters were measured according to the Recommendations of the American Society of Echocardiography and the European Association of Cardiovascular Imaging [17,18].
The following M-mode and 2D echocardiographic parameters were recorded: aortic root and ascending aorta by using the “leading edge-to-leading edge” convention; relative wall thickness (RWT), calculated with the formula RWT = 2 posterior wall thickness/LV internal diameter at end-diastole; LV end-diastolic and end-systolic volumes; EF estimated with the biplane modified Simpson’s method [17] and calculated as the average value of two and five different biplane measurements in non-AF and AF patients, respectively; left atrial (LA) antero-posterior diameter, LA longitudinal diameter and LA volume; right ventricular inflow tract and the tricuspid annular plane systolic excursion (TAPSE) using an apical four-chamber view; finally, the inferior vena cava (IVC) diameter by a subcostal view.
Doppler measurements included E/A ratio and E/average e’ ratio, the latter as index of LVFP [18]. sPAP was derived by the modified Bernoulli equation, where sPAP = 4 × [tricuspid regurgitation velocity (TRV)]2 + right atrial pressure [19]. The latter was estimated from IVC diameter and collapsibility. Finally, TAPSE/sPAP ratio was measured as noninvasive index of right ventricular (RV)/pulmonary artery (PA) coupling [20].
Degree of valvulopathy was assessed according to the AHA/ACC recommendations for the management of patients with VHD [21].
2.4. Endpoint Definition
The primary objective of the study was to identify the independent predictors of “all-cause mortality” (primary endpoint) in the whole population of HFpEF patients, over a medium-term follow-up. The secondary aim of the study was to evaluate the independent predictors of the composite of “all-cause mortality or re-hospitalization for all causes” (secondary endpoint) in the same study group.
Causes of death and rehospitalization for each HFpEF patient were collected by the same physician (V.S.) by accessing medical records available in the hospital archive and/or from telephone interviews.
2.5. Statistical Analysis
HFpEF patients enrolled in the study were stratified in two major groups: 1) HFpEF patients with EF 50 to 64% (the “normal” EF group); 2) HFpEF patients with EF ≥65% (the “supra-normal” EF group).
Each continuous variable was checked through the Shapiro-Wilk test and all data were determined to be normally distributed. Accordingly, for the whole study population and for each group of HFpEF patients, continuous data were summarized as mean ± standard deviation, while categorical data were presented as number (percentage). Continuous variables were compared using a two-sample independent t test, whereas categorical parameters were compared using the Chi-squared test or the Fisher’s exact test.
Univariate and multivariate Cox regression analyses were performed to identify the independent predictors of the primary endpoint “all-cause mortality” and of the secondary one “all-cause mortality or re-hospitalization for all causes” in the entire study population, over a mid-term follow-up. According to the “one in ten rule” (one predictive variable for every ten events), the following variables were included in the Cox regression analysis performed to determine the independent predictors of “all-cause mortality” in the entire group of HFpEF patients: female sex and age (as demographics), eGFR (as biochemical parameter), H2FPEF score (as clinical index of diastolic heart failure), AGILE score (as clinical index of frailty), LVEF (as echocardiographic index of LV systolic function), E/average e’ ratio (as noninvasive index of LVFP), TAPSE/sPAP ratio (as noninvasive index of RV/PA coupling), finally infectious disease (as indicator of the presence of pulmonary or nonpulmonary infection). For each variable investigated, correspondent hazard ratios with 95% confidence intervals (CIs) were calculated. Only the variables with statistically significant association on univariate analysis were thereafter included in the multivariate Cox regression model.
The receiver operating characteristics (ROC) curve analysis was performed to establish the sensitivity and the specificity of the statistically significant continuous variables at Cox multivariate analysis for predicting both outcomes. Area under curve (AUC) was estimated. The optimal cutoff of each statistically significant continuous variable was calculated using the maximum value of the Youden Index (determined as sensitivity + [1-specificity]).
The survival curves and the event-free survival curves of the variables statistically significant at Cox multivariate analysis were estimated using the Kaplan–Meier method and the survival curves were compared using the log-rank test.
To evaluate intra- and inter-observer variability in the assessment of LVEF, this parameter was remeasured in a sized subgroup of patients by the same cardiologist (A.S.) who performed all echocardiographic examinations and by a second one (M.L.). The analyses were performed in a blinded manner. We used the intraclass correlation coefficient (ICC) with its 95% confidence interval (CI) as a statistical method for assessing intra- and inter-observer measurement variability. An ICC of 0.70 or more was considered to indicate acceptable reliability.
Statistical analysis was performed with SPSS version 28 (SPSS Inc., Chicago, Illinois, USA), with two-tailed P values below 0.05 deemed statistically significant.
3. Results
3.1. Baseline Clinical Characteristics
During the study period, 215 HFpEF patients aged ≥70 yrs were selected from the original study population [11]; among them, 10 were excluded due to poor echocardiographic window and 5 due to lack of complete data. Therefore, a total of 200 HFpEF patients (mean age 86.4 ± 6.6 yrs) were retrospectively evaluated. The “normal” EF (50 to 64%) group (n = 99) and the “supra-normal” EF (≥65%) group (n = 101) were separately analyzed.
Table 1 summarizes main demographics and clinical parameters recorded in the whole study population and in the two EF groups at hospital admission.
Females represented the great majority of the whole study population (70%), with similar prevalence in both EF groups.
More than half of HFpEF patients were aged 85 yrs and older (“oldest-old”). The “oldest-old” patients were significantly more prevalent in the “supra-normal” EF group than in the “normal” EF one.
The HFpEF patients included showed a high prevalence of hypertension (detected in 76% of patients) and a moderate prevalence of dyslipidemia (observed in approximately half of patients), whereas type 2 diabetes mellitus and smoking history were much less commonly found.
The most frequent comorbidities detected in our study population were anaemia and CKD, observed in approximately two-third of patients. Cognitive impairment was found in one-third of patients, while COPD, OSAS, history of CAD and/or stroke and peripheral arteriopathy were observed in approximately one-fifth of patients. Arterial hypertension, CKD and hypothyroidism were more frequently diagnosed in HFpEF patients with “supra-normal” EF, whereas history of CAD was more commonly detected in those with “normal” EF.
The average value of H2FPEF score detected in our study population at hospital admission (5.1±1.9) was compatible with an HFpEF diagnostic probability of >80%. Moreover, our study population showed an elevated burden of comorbidity and frailty, as assessed by CCI and AGILE scores, respectively. Both CCI and AGILE scores were significantly higher in the “supra-normal” EF group than in the “normal” EF one.
On physical examination, blood pressure values and heart rate were normal; lower extremity edema was observed in only 19.5% of HFpEF patients; a body temperature ≥37.5° was found in 35.5% of cases. CXR revealed pulmonary congestion and pneumonia in 34% and 24% of HFpEF patients, respectively. Compared to the “normal” EF group, the “supra-normal” EF one showed significantly lower systolic and diastolic blood pressure values and significantly higher heart rate, compatible with hypovolemia. Accordingly, fever and pneumonia were much more commonly observed among HFpEF patients with “supra-normal” EF, while radiographic signs of pulmonary congestion were much more frequently diagnosed in HFpEF patients with EF between 50% and 64%.
On blood tests, the whole group of HFpEF patients was diagnosed with mild anemia and moderate CKD, with a moderate increase in serum levels of fasting glucose, uric acid, CRP and NT-proBNP, a mild increase in serum HS troponin and finally a moderate reduction in serum HDL cholesterol. Compared to HFpEF patients with “normal” EF, those with “supra-normal” EF showed a greater impairment in renal function, as expressed by serum creatinine and eGFR value, significantly higher levels of serum TSH, CRP and white blood cells, and a significantly lower partial pressure of oxygen in the arterial blood (PaO2).
3.2. Transthoracic Echocardiography Findings
Concerning conventional TTE parameters, the whole group of HFpEF patients was found with normal biventricular cavity sizes and normal biventricular systolic function, as assessed by LVEF and TAPSE respectively; a first degree of diastolic dysfunction was the most common LV filling pattern observed among HFpEF patients, being detected in 46% of patients; LVFPs, as assessed by the average E/e’ ratio, were in the so-called “grey zone” between 8 and 13, whereas LA size was moderately increased. TTE showed moderate-to-severe mitral regurgitation and tricuspid regurgitation in approximately one-third of HFpEF patients, while aortic valvulopathies were less commonly detected. Analysis of pulmonary hemodynamics revealed a moderate increase in sPAP and a concomitant impairment in TAPSE/sPAP ratio, indicative of RV/PA uncoupling. In comparison to the “normal” EF group, the “supra-normal” EF one was found with significantly smaller biventricular cavity sizes, significantly greater RWT, higher LVEF and lower LVFP, thus suggesting a hypovolemic status. In addition, a systolic intraventricular (IV) pressure gradient ≥15 mmHg, obtained by continuous-wave Doppler, and generated by LV hypercontractility, was detected in approximately two-third of patients with “supra-normal” EF. With regards to pulmonary hemodynamics, a concomitant impairment in TAPSE/sPAP ratio was significantly more enhanced among HFpEF patients with “supra-normal” EF than in those with “normal” EF. On the other hand, HFpEF patients with “normal” EF were more commonly diagnosed with larger cardiac chamber cavity sizes, higher LVFP and increased prevalence of hemodynamically relevant mitral regurgitation, thus indicating congestive status (Table 2).
3.3. HFpEF Characteristics and Hospitalization Data
A detailed analysis of HF characteristics and hospitalization parameters recorded in the whole population of HFpEF patients and in the two EF groups is reported in Table 3.
At hospital admission, 50% of HFpEF patients were in NYHA Class III and the remaining 50% of total were in NYHA Class IV. Approximately two-third of HFpEF patients with “supra-normal” EF (60.4% of total) were in NYHA Class IV, whereas 60.6% of those with “normal” EF were in NYHA Class III.
Hypertensive cardiomyopathy was the most common cause of HF in the whole study group (being detected in 76% of cases), followed by acute/chronic VHD and acute/chronic pulmonary hypertension, both detected in approximately half of patients. Hypertensive cardiomyopathy was the prevalent etiology of HFpEF with “supra-normal” EF, while acute/chronic VHD and to a lesser extent acute/chronic CAD were the most frequent HF causes in patients with “normal” EF.
HFpEF patients with “supra-normal” EF were much commonly hospitalized for an infectious disease of pulmonary (more than 50% of cases) or non-pulmonary origin (approximately 25% of cases). A large number of non-cardiac diseases, not rarely concomitant, such as severe anemia, severe CKD, gastro-intestinal disorders, cancers, electrolyte disorders and neurological disorders, represented the main reasons for hospitalizations among the “supra-normal” EF group. Conversely, the “normal” EF group was more frequently hospitalized due to congestive HF, with lower prevalence of relevant comorbidities.
At hospital discharge, more than half of HFpEF patients were prescribed with beta blockers, particularly those with “supra-normal” EF, less than half of total with loop diuretics, especially those with “normal” EF, whereas the remaining cardioprotective drugs were less frequently prescribed in both groups of patients.
Finally, the average length of hospital stay was 11.7 ± 5.5 days, with no statistically significant differences between the two groups of HFpEF patients.
3.4. Survival Analysis
Mean follow-up period was 3.6 ± 0.3 yrs. During follow-up, 79 patients died and 73 were re-hospitalized. The great majority of deaths (91.1% of total) were recorded among HFpEF patients with “supra-normal” EF, whereas only 8.9% of total were detected among HFpEF patients with “normal” EF. A temporal analysis revealed that “in-hospital” deaths were much more frequently recorded in the “supra-normal” group than in the “normal” one. Moreover, the deaths occurred approximately three months earlier in the patients with EF ≥65% than in those with EF between 50 and 64%. Concerning the secondary endpoint, it occurred in 63.8% of HFpEF patients with “supra-normal” EF and 36.2% of HFpEF patients with “normal” EF. The increased rates of all-cause mortality and re-hospitalization for all causes, observed among the HFpEF patients with “supra-normal” EF during follow-up period, were primarily related to non-cardiovascular causes (mostly infectious diseases).
On univariate Cox regression analysis (Table 4), the following variables were significantly correlated with the primary endpoint “all-cause mortality”: age, female sex, eGFR, AGILE score, LVEF, TAPSE/sPAP ratio and infectious disease.
On multivariate Cox regression analysis, age (HR 1.09, 95% CI 1.03-1.16, p = 0.002), LVEF (HR 1.08, 95% CI 1.03-1.14, p = 0.004), TAPSE/sPAP ratio (HR 0.14, 95% CI 0.03-0.61, p = 0.009) and infectious disease (HR 7.23, 95% CI 2.41-21.6, p < 0.001) maintained statistical significance. The ROC curve analysis highlighted that age ≥85 yrs (AUC = 0.82; 95% CI 0.76-0.88), LVEF ≥65% (AUC = 0.92; 95% CI 0.88-0.96) and TAPSE/sPAP ratio ≤0.55 mm/mmHg (AUC = 0.93; 95% CI 0.89-0.97) were the cut-off values with the highest sensitivity and specificity for predicting “all-cause mortality” in the whole study group.
The Kaplan–Meier survival curves drawn for comparing the rates of “all-cause mortality” in HFpEF patients categorized according to LVEF (50 to 64 and ≥65%, respectively) are illustrated in Figure 1.
On multivariate Cox regression analysis performed for identifying the independent predictors of the composite of “all-cause mortality or re-hospitalizations for all causes”, only LVEF (HR 1.04, 95% CI 1.01-1.07, p = 0.02) was independently associated with the secondary endpoint (Table 5).
LVEF ≥65% (AUC = 0.78; 95% CI 0.72-0.85) showed 64% sensitivity and 99% specificity for predicting the composite of “all-cause mortality or re-hospitalizations for all causes”.
The Kaplan–Meier survival curves drawn for comparing the rates of the composite “all-cause mortality or re-hospitalizations for all causes” in HFpEF patients categorized according to LVEF (50 to 64 and ≥65%, respectively) are depicted in Figure 2.
3.5. Measurement Variability
A detailed intra- and inter-observer variability analysis of LVEF assessment was conducted in a group of 15 randomly selected HFpEF patients. Intra- and inter-observer agreement between the raters, expressed as ICCs, was 0.92 (95% CI 0.77-0.97) and 0.81 (95% CI 0.51-0.93), respectively.
4. Discussion
The present study identified two opposite phenotypes of elderly HFpEF patients: 1) those with “normal” EF (between 50 and 64%), characterized by the increased prevalence of radiographic and echocardiographic congestive signs; 2) those with “supra-normal” EF (≥65%), who were older, predominantly females, with high comorbidity burden and severe frailty status, commonly hospitalized for infectious diseases and frequently found with clinical and echocardiographic signs of reduced preload due to dehydration and hypovolemia. The “supra-normal” EF phenotype showed a ten-fold higher mortality rate and a two-fold higher prevalence of the composite of “all-cause mortality or re-hospitalizations for all causes” than the “normal” EF one, over a mid-term follow-up. Age, EF and infectious disorder were linearly correlated with “all-cause mortality” in the whole study group, whereas TAPSE/sPAP ratio showed a strong inverse correlation with the primary endpoint. Among HFpEF patients, those aged ≥85 yrs, hospitalized for an infectious disorder and diagnosed with “supra-normal” EF (≥65%) and TAPSE/sPAP ratio ≤0.55 mm/mmHg on TTE examination at hospital admission, had the worst prognosis. On the other hand, HFpEF patients with EF 50 to 64% hospitalized due to congestive HF, aged <85 yrs, without infection and without RV/PA uncoupling, showed a less complicated clinical course and a more favorable outcome.
During the last two decades, a small number of studies have evaluated the prognostic role and the clinical implications of a “supra-normal” EF (≥65%) in different study populations. Stewart S et al. [22] found a greater risk of mortality at higher EF levels among women undergoing routine echocardiography for suspected or established cardiovascular disease, over a median follow-up of 5.6 years. Saab et al. [23], collecting data from 5.127 elderly female patients (aged >65 years) with acute coronary syndromes enrolled in the Global Registry of Acute Coronary Events (GRACE) registry, found that an EF >65% was associated with worse survival than an EF of 55–65%. Wehner et al. [12], in a large and heterogeneous clinical cohort of 200000 patients (mean age 63.8 yrs) referred for echocardiography, demontrated a U-shaped relationship between EF and mortality, with patients with EF ≥70% showing a similar adjusted mortality rate as patients with an EF of 35–40%, over a median of 4-yrs follow-up. The Authors observed an increase in mortality for EF ≥65% across all age groups and both sexes. A U-shaped relationship between EF and mortality have also been reported for both chronic [6,7] and acute [8,9] HF patients. Curtis JP et al. [6], examining 7.788 stable HF patients in sinus rhythm, showed that higher EF were associated with a linear decrease in mortality up to an LVEF of 45% and increases above 45% were not associated with further reductions in mortality. Ohte et al. [9] found that a higher EF was independently related to poor prognosis in decompensated HFpEF patients and that patients with EF ≥58% had smaller end-diastolic and end-systolic dimensions, greater LA volume indexed and higher LVFPs, in comparison to those with an EF of 40–58%. Similar findings were reported by Rosch et al. [7] in two groups of HFpEF patients (a “normal” group with EF 50-60% and a “supra-normal” group with EF >60%; mean age 72 yrs) who underwent cardiac magnetic resonance imaging and invasive pressure-volume loop analyses. During afterload increase by isometric handgrip exercise, compared to the “normal” group (EF 50 to 60%), the “supra-normal” group (EF >60%) who had smaller ventricles, showed an exaggerated elevation of LVFP (expression of higher diastolic stiffness), a significant increase in end-systolic elastance (expression of hypercontractile state) and a marked decrease in stroke volume (due to lower preload reserve). HFpEF patients with EF >60% were also found with higher effective arterial elastance.
The above-mentioned studies attributed the genesis of HFsnEF to a number of pathophysiological mechanisms, such as abnormal LV systolic stiffening, small LV cavity size, increased arterial elastance and severe diastolic dysfunction [24]. These factors may synergycally affect LV filling, with secondary reduction of stroke volume and cardiac output. The apparent paradox of rising EF in the face of a falling stroke volume was primarily ascribed to the overall reduction in LV cavity volumes [25].
Consistent with the studies conducted on both chronic [6,7] and acute [8,9] HF patients, our findings confirmed that a “supra-normal” EF was a negative prognostic factor over a mid-term follow-up period. Differently from these studies that evaluated larger population of middle-aged HF patients, the present retrospective analysis was conducted on a cohort of elderly HFpEF patients with a consistent number of oldest-old individuals (aged ≥85 yrs). The “supra-normal EF” was more commonly detected in the context of an infectious disease related to pulmonary or more rarely to non-pulmonary infections. The infective process associated with elevated body temperatures and fluid loss was probably responsible for dehydration, hypovolemia, reduction of preload, thus causing a hypercontractile response. In addition, dehydration determined an increase in sympathetic activity, as previously shown [26]. The frequent detection of an IV pressure gradient, expression of the instantaneous ejection intraventricular pressure difference between the LV basis and apex, that reached its peak early during end-systole [27], confirmed the hyperdynamic LV systolic function. The hypovolemic status secondary to dehydration was associated to increased serum levels of NT-proBNP due to the concomitant presence of renal impairment in HFpEF patients with “supra-normal” EF. Finally, the RV/PA uncoupling highlighted by TTE in these patients was likely related to acute or persistent hypoxia in the setting of a respiratory distress syndrome and/or infectious disorder. In our findings, a TAPSE/sPAP ratio ≤0.55 mm/mmHg was independently associated to an increased risk of all-cause mortality in the whole cohort of HFpEF patients. This parameter represents a simple echocardiographic index of RV systolic function, “matched” to an index of RV afterload [20]. During the last few years, several studies have demonstrated that a reduced TAPSE/sPAP ratio is a strong predictor of both mortality and recurrent hospitalizations in HFpEF patients [28,29,30,31]. Accordingly, our results were in alignment with the literature data.
Differently from other studies [9], in our population we did not observe greater LA dimensions in “supra-normal” EF patients than in “normal” EF ones. This could be unexpected, being LA dilatation strongly correlated with hypertensive and kidney disease, but it could be related to the markedly hypovolemic status of the “supra-normal” EF group or to the fact that our echocardiographic data were not indexed to body surface area (BSA). Additionally, as recently proposed by Popovic et al. [32], despite elevated LVFP, HF patients with EF ≥65% may have a form of cardiac contracture, influencing both left ventricle and left atrium.
With regards to HFpEF patients with EF 50 to 64% included in the present study, our results would suggest that these patients have a number of clinical characteristics similar to those of HFmrEF patients, such as the less advanced age, the more frequent history of CAD and the reduced burden of comorbidity/frailty, as previously reported by our study group [33]. In light of these evidence, they could represent a category of HF patients who have recovered from previous HFmrEF, thus confirming that HFpEF patients are an heterogenous and dynamic group of patients, rather than a unique HF subtype.
Concerning medical treatment of the HFpEF patients included in the present study, majority of patients were treated with loop diuretics and beta blockers, whereas other cardioprotective drugs, such as angiotensin-converting enzyme inhibitors (ACEIs), angiotensin receptor blockers (ARBs) and statins, were less commonly used. The undertreatment with ACEIs/ARBs in HFpEF patients was likely related to the lack of benefit of these drugs in HF patients with EF ≥65%, as indicated by literature data [34,35]. Separate analysis of the two groups of HFpEF patients revealed that loop diuretics were much more frequently administered to the “normal” EF group, whereas beta blockers to the “supra-normal” EF one. This medical choice was probably conditioned by the congestive status or the hypovolemic/hyperdynamic status respectively, observed in the two distinct groups of HFpEF patients.
As already underlined [36,37] and in light of our findings, EF-based classification of HF could be misleading, as it it does not consider the pathophysiological mechanism and specific aetiology underlying HF. Moreover, this classification is based on a parameter derived from a geometrical assumption, obtained by the modified Simpson's rule, which is limited by sub-optimal reproducibility [38]. In addition, EF is a load-dependent measure, that is strongly influenced by the patient’s haemodynamic state. With this regards, a patient with hypertrophic cardiomyopathy and concomitant hypovolemia may show a “supra-normal” EF; in this case, given the underlying severe diastolic dysfunction, despite an EF ≥65%, this patient has a low cardiac output, and his prognosis is worsened by the occurrence of a renal impairment and respiratory or non-respiratory infections. As a consequence, HFpEF patients with higher EF may have an unfavourable clinical course, similarly to HFrEF patients, with increased mortality and hospitalisation.
A number of limitations of the present study should be aknowledged. Firstly, it was a retrospective monocentric study, that evaluated a limited number of hospitalized HFpEF patients. However, due to the great number of major adverse clinical outcomes detected over a mid-term follow-up, we were able to perform an accurate survival analysis in both groups of HFpEF patients. Secondly, to quantify the patient’s frailty, we used the AGILE score, a rapid and effective tool for screening multidimensional frailty more accessible to internal medicine physicians and cardiologists, rather than the Multidimensional Prognostic Index (MPI), which is the gold standard for the assessment of elderly patients [39]. Third, systolic function was assessed by determining EF at hospital admission only, without measuring LV global longitudinal strain (GLS) by strain echocardiographic imaging and without collecting echocardiographic data at the time of discharge. Therefore, HFpEF diagnosis was only based on a single time-point EF measurement. Moreover, stroke volume and cardiac output were not calculated in our cohort of HFpEF patients; these parameters would have provided more information on the cardiac performance and haemodynamic status of HFpEF patients with different LVEF levels. In addition, cases of cardiac amyloidosis were not investigated in the present study, even if it is likely that, among HFpEF patients with hypertrophic cardiomyopathy, a fair number of patients could be affected by senile systemic amyloidosis. Finally, BSA could not be precisely assessed in our study group, due to the poor global conditions of the majority of them, bedridden and frequently uncooperative. For this reason, echocardiographic parameters were not indexed to BSA.
5. Conclusions
Eldelry HFpEF patients aged ≥70 yrs with “supra-normal” EF (≥65%) have a worse outcome than those with “normal” EF (50 to 64%) over a medium-term follow-up.
“Supra-normal” EF could be a surrogate indicator of hypovolemia, with important worse prognostic implications in frail elderly HFpEF patients.
A reclassification of HFpEF patients based on recognition of HF with “normal” (between 50 and 64%) or “supra-normal” (≥65%) EF is needed, for a better prognostic risk stratification of these patients.
Author Contributions
Conceptualization, A.S. and C.L.; methodology, A.S., C.L. and V.S..; software, A.S..; validation, A.B., M.L., S.H..; formal analysis, A.S.; investigation, A.S., C.L. and V.S.; resources, A.B. and S.H.; data curation, A.S., C.L., V.S. and G.L.N.; writing—original draft preparation, A.S.; writing—review and editing, C.L., V.S. and G.L.N.; visualization, M-L. and S.H.; supervision, M.L. and S.H.; project administration, S.H.; funding acquisition, A.S. and A.B. All authors have read and agreed to the published version of the manuscript.
Funding
This research was funded by the Italian Ministry of Health, Ricerca Corrente IRCCS MultiMedica.
Institutional Review Board Statement
The study was conducted in accordance with the Declaration of Helsinki and approved by the Ethics Committee IRCCS MultiMedica (Committee’s reference number 464.2021), date of approval 21 January 2021.
Informed Consent Statement
Patient consent was waived due to the retrospective nature of the study.
Data Availability Statement
Data extracted from included studies will be publicly available on Zenodo (https://zenodo.org).
Acknowledgments
The authors wish to thank Monica Fumagalli for her graphical support.
Conflicts of Interest
The authors declare no conflicts of interest.
References
- van Riet, E.E.; Hoes, A.W.; Wagenaar, K.P.; Limburg, A.; Landman, M.A.; Rutten, F.H. Epidemiology of heart failure: the prevalence of heart failure and ventricular dysfunction in older adults over time. A systematic review. Eur. J. Hear. Fail. 2016, 18, 242–252. [Google Scholar] [CrossRef] [PubMed]
- A McDonagh, T.; Metra, M.; Adamo, M.; Gardner, R.S.; Baumbach, A.; Böhm, M.; Burri, H.; Butler, J.; Čelutkienė, J.; Chioncel, O.; et al. 2021 ESC Guidelines for the diagnosis and treatment of acute and chronic heart failure. Eur. Hear. J. 2021, 42, 3599–3726. [Google Scholar] [CrossRef] [PubMed]
- Teramoto, K.; Teng, T.-H.K.; Chandramouli, C.; Tromp, J.; Sakata, Y.; Lam, C.S. Epidemiology and Clinical Features of Heart Failure with Preserved Ejection Fraction. Card. Fail. Rev. 2022, 8, e27. [Google Scholar] [CrossRef]
- Ono, R.; Falcão, L.M. Supra-Normal Left Ventricular Function. Am. J. Cardiol. 2023, 207, 84–92. [Google Scholar] [CrossRef]
- Horiuchi, Y.; Asami, M.; Ide, T.; Yahagi, K.; Komiyama, K.; Yuzawa, H.; Tanaka, J.; Aoki, J.; Matsushima, S.; Tohyama, T.; et al. Prevalence, characteristics and cardiovascular and non-cardiovascular outcomes in patients with heart failure with supra-normal ejection fraction: Insight from the JROADHF study. Eur. J. Hear. Fail. 2023, 25, 989–998. [Google Scholar] [CrossRef] [PubMed]
- Curtis, J.P.; Sokol, S.I.; Wang, Y.; Rathore, S.S.; Ko, D.T.; Jadbabaie, F.; Portnay, E.L.; Marshalko, S.J.; Radford, M.J.; Krumholz, H.M. The association of left ventricular ejection fraction, mortality, and cause of death in stable outpatients with heart failure. J. Am. Coll. Cardiol. 2003, 42, 736–742. [Google Scholar] [CrossRef] [PubMed]
- Rosch, S.; Kresoja, K.-P.; Besler, C.; Fengler, K.; Schöber, A.R.; von Roeder, M.; Lücke, C.; Gutberlet, M.; Klingel, K.; Thiele, H.; et al. Characteristics of Heart Failure With Preserved Ejection Fraction Across the Range of Left Ventricular Ejection Fraction. Circulation 2022, 146, 506–518. [Google Scholar] [CrossRef] [PubMed]
- Toma, M.; Ezekowitz, J.A.; Bakal, J.A.; O'Connor, C.M.; Hernandez, A.F.; Sardar, M.R.; Zolty, R.; Massie, B.M.; Swedberg, K.; Armstrong, P.W.; et al. The relationship between left ventricular ejection fraction and mortality in patients with acute heart failure: insights from the ASCEND-HF Trial. Eur. J. Hear. Fail. 2013, 16, 334–341. [Google Scholar] [CrossRef]
- Ohte, N.; Kikuchi, S.; Iwahashi, N.; Kinugasa, Y.; Dohi, K.; Takase, H.; Masai, K.; Inoue, K.; Okumura, T.; Hachiya, K.; et al. Unfavourable outcomes in patients with heart failure with higher preserved left ventricular ejection fraction. Eur. Hear. J. - Cardiovasc. Imaging 2022, 24, 293–300. [Google Scholar] [CrossRef] [PubMed]
- Gavina, C.; Carvalho, D.S.; Valente, F.; Bernardo, F.; Dinis-Oliveira, R.J.; Santos-Araújo, C.; Taveira-Gomes, T. 20 Years of Real-World Data to Estimate the Prevalence of Heart Failure and Its Subtypes in an Unselected Population of Integrated Care Units. J. Cardiovasc. Dev. Dis. 2022, 9, 149. [Google Scholar] [CrossRef] [PubMed]
- Sonaglioni, A.; Lonati, C.; Tescaro, L.; Nicolosi, G.L.; Proietti, M.; Lombardo, M.; Harari, S. Prevalence and clinical outcome of main echocardiographic and hemodynamic heart failure phenotypes in a population of hospitalized patients 70 years old and older. Aging Clin. Exp. Res. 2022, 34, 1081–1094. [Google Scholar] [CrossRef] [PubMed]
- Wehner, G.J.; Jing, L.; Haggerty, C.M.; Suever, J.D.; Leader, J.B.; Hartzel, D.N.; Kirchner, H.L.; Manus, J.N.A.; James, N.; Ayar, Z.; et al. Routinely reported ejection fraction and mortality in clinical practice: where does the nadir of risk lie? Eur. Heart J. 2020, 41, 1249–1257. [Google Scholar] [CrossRef]
- Levey, A.S.; Stevens, L.A.; Schmid, C.H.; Zhang, Y.L.; Castro, A.F. 3rd; Feldman, H.I.; Kusek, J.W.; Eggers, P.; Van Lente, F.; Greene, T.; et al. A new equation to estimate glomerular filtration rate. Ann. Intern. Med. 2009, 150, 604–12. [Google Scholar] [CrossRef] [PubMed]
- Reddy, Y.N.; Carter, R.E.; Obokata, M.; Redfield, M.M.; Borlaug, B.A. A Simple, Evidence-Based Approach to Help Guide Diagnosis of Heart Failure With Preserved Ejection Fraction. Circulation 2018, 138, 861–870. [Google Scholar] [CrossRef] [PubMed]
- Charlson, M.E.; Pompei, P.; Ales, K.L.; MacKenzie, C.R. A new method of classifying prognostic comorbidity in longitudinal studies: Development and validation. J. Chronic Dis. 1987, 40, 373–383. [Google Scholar] [CrossRef]
- Liguori, I.; Russo, G.; Bulli, G.; Curcio, F.; Flocco, V.; Galizia, G.; Della-Morte, D.; Gargiulo, G.; Testa, G.; Cacciatore, F.; et al. Validation of "(fr)AGILE": a quick tool to identify multidimensional frailty in the elderly. BMC Geriatr. 2020, 20, 1–10. [Google Scholar] [CrossRef] [PubMed]
- Lang, R.M.; Badano, L.P.; Mor-Avi, V.; Afilalo, J.; Armstrong, A.; Ernande, L.; Flachskampf, F.A.; Foster, E.; Goldstein, S.A.; Kuznetsova, T.; et al. Recommendations for Cardiac Chamber Quantification by Echocardiography in Adults: An Update from the American Society of Echocardiography and the European Association of Cardiovascular Imaging. Eur. Heart J. Cardiovasc. Imaging 2015, 16, 233–271. [Google Scholar] [CrossRef] [PubMed]
- Nagueh, S.F.; Smiseth, O.A.; Appleton, C.P.; Byrd, B.F. 3rd; Dokainish, H.; Edvardsen, T.; Flachskampf, F.A.; Gillebert, T.C.; Klein, A.L.; Lancellotti, P.; et al. Recommendations for the Evaluation of Left Ventricular Diastolic Function by Echocardiography: An Update from the American Society of Echocardiography and the European Association of Cardiovascular Imaging. J. Am. Soc. Echocardiogr. 2016, 29, 277–314. [Google Scholar] [CrossRef] [PubMed]
- Humbert, M.; Kovacs, G.; Hoeper, M.M.; Badagliacca, R.; Berger, R.M.F.; Brida, M.; Carlsen, J.; Coats, A.J.S.; Escribano-Subias, P.; Ferrari, P.; et al. 2022 ESC/ERS Guidelines for the diagnosis and treatment of pulmonary hypertension. Eur. Heart J. 2022, 43, 3618–3731. [Google Scholar] [CrossRef] [PubMed]
- Tello, K.; Wan, J.; Dalmer, A.; Vanderpool, R.; Ghofrani, H.A.; Naeije, R.; Roller, F.; Mohajerani, E.; Seeger, W.; Herberg, U.; et al. Validation of the Tricuspid Annular Plane Systolic Excursion/Systolic Pulmonary Artery Pressure Ratio for the Assessment of Right Ventricular-Arterial Coupling in Severe Pulmonary Hypertension. Circ. Cardiovasc. Imaging 2019, 12, e009047. [Google Scholar] [CrossRef]
- Nishimura, R.A.; Otto, C.M.; Bonow, R.O.; Carabello, B.A.; Erwin, J.P. 3rd; Fleisher, L.A.; Jneid, H.; Mack, M.J.; McLeod, C.J.; O'Gara, P.T.; et al. 2017 AHA/ACC Focused Update of the 2014 AHA/ACC Guideline for the Management of Patients With Valvular Heart Disease: A Report of the American College of Cardiology/American Heart Association Task Force on Clinical Practice Guidelines. Circulation. 2017, 135, e1159–e1195. [Google Scholar] [CrossRef] [PubMed]
- Stewart, S.; Playford, D.; Scalia, G.M.; Currie, P.; Celermajer, D.S.; Prior, D.; Codde, J.; Strange, G. ; on behalf of the NEDA Investigators Ejection fraction and mortality: a nationwide register-based cohort study of 499 153 women and men. Eur. J. Hear. Fail. 2020, 23, 406–416. [Google Scholar] [CrossRef]
- Saab, F.A.; Steg, P.G.; Avezum, A.; López-Sendón, J.; Anderson, F.A.; Huang, W.; Eagle, K.A. Can an elderly woman's heart be too strong? Increased mortality with high versus normal ejection fraction after an acute coronary syndrome. The Global Registry of Acute Coronary Events. Am. Heart J. 2010, 160, 849–54. [Google Scholar] [CrossRef] [PubMed]
- Kawaguchi, M.; Hay, I.; Fetics, B.; Kass, D.A. Combined ventricular systolic and arterial stiffening in patients with heart failure and preserved ejection fraction: implications for systolic and diastolic reserve limitations. Circulation. 2003, 107, 714–20. [Google Scholar] [CrossRef] [PubMed]
- Cheng, S.; Fernandes, V.R.; Bluemke, D.A.; McClelland, R.L.; Kronmal, R.A.; Lima, J.A. Age-related left ventricular remodeling and associated risk for cardiovascular outcomes: the Multi-Ethnic Study of Atherosclerosis. Circ. Cardiovasc. Imaging. 2009, 2, 191–8. [Google Scholar] [CrossRef]
- González-Alonso, J.; Mora-Rodríguez, R.; Coyle, E.F.; Arvidsson, P.M.; Töger, J.; Carlsson, M.; Steding-Ehrenborg, K.; Pedrizzetti, G.; Heiberg, E.; Arheden, H.; et al. Supine exercise restores arterial blood pressure and skin blood flow despite dehydration and hyperthermia. Am. J. Physiol. Circ. Physiol. 1999, 277, H576–H583. [Google Scholar] [CrossRef]
- Yotti, R.; Bermejo, J.; Desco, M.M.; Antoranz, J.C.; Rojo-Álvarez, J.L.; Cortina, C.; Allué, C.; Rodríguez-Abella, H.; Moreno, M.; García-Fernández, M.A. Doppler-Derived Ejection Intraventricular Pressure Gradients Provide a Reliable Assessment of Left Ventricular Systolic Chamber Function. Circulation 2005, 112, 1771–1779. [Google Scholar] [CrossRef] [PubMed]
- Guazzi, M.; Dixon, D.; Labate, V.; Beussink-Nelson, L.; Bandera, F.; Cuttica, M.J.; Shah, S.J. RV Contractile Function and its Coupling to Pulmonary Circulation in Heart Failure With Preserved Ejection Fraction: Stratification of Clinical Phenotypes and Outcomes. JACC Cardiovasc. Imaging. 2017, 10, 1211–1221. [Google Scholar] [CrossRef]
- Gorter, T.M.; van Veldhuisen, D.J.; A Voors, A.; Hummel, Y.M.; Lam, C.S.; Berger, R.M.; van Melle, J.P.; Hoendermis, E.S. Right ventricular-vascular coupling in heart failure with preserved ejection fraction and pre- vs. post-capillary pulmonary hypertension. Eur. Hear. J. - Cardiovasc. Imaging 2017, 19, 425–432. [Google Scholar] [CrossRef] [PubMed]
- Santas, E.; Palau, P.; Guazzi, M.; de la Espriella, R.; Miñana, G.; Sanchis, J.; Bayes-Genís, A.; Lupón, J.; Chorro, F.J.; Núñez, J. Usefulness of Right Ventricular to Pulmonary Circulation Coupling as an Indicator of Risk for Recurrent Admissions in Heart Failure With Preserved Ejection Fraction. Am. J. Cardiol. 2019, 124, 567–572. [Google Scholar] [CrossRef] [PubMed]
- Inciardi, R.M.; Abanda, M.; Shah, A.M.; Cikes, M.; Claggett, B.; Skali, H.; Vaduganathan, M.; Prasad, N.; Litwin, S.; Merkely, B.; et al. Right Ventricular Function and Pulmonary Coupling in Patients With Heart Failure and Preserved Ejection Fraction. Circ. 2023, 82, 489–499. [Google Scholar] [CrossRef] [PubMed]
- Popovic, D.; Alogna, A.; Omar, M.; Sorimachi, H.; Omote, K.; Reddy, Y.N.; Redfield, M.M.; Burkhoff, D.; Borlaug, B.A. Ventricular stiffening and chamber contracture in heart failure with higher ejection fraction. Eur. J. Hear. Fail. 2023, 25, 657–668. [Google Scholar] [CrossRef] [PubMed]
- Sonaglioni, A.; Lonati, C.; Behring, M.T.; Nicolosi, G.L.; Lombardo, M.; Harari, S. Ejection fraction at hospital admission stratifies mortality risk in HFmrEF patients aged ≥ 70 years: a retrospective analysis from a tertiary university institution. Aging Clin. Exp. Res. 2023, 35, 1679–1693. [Google Scholar] [CrossRef]
- Dewan, P.; Jackson, A.; Lam, C.S.; Pfeffer, M.A.; Zannad, F.; Pitt, B.; Solomon, S.D.; McMurray, J.J. Interactions between left ventricular ejection fraction, sex and effect of neurohumoral modulators in heart failure. Eur. J. Hear. Fail. 2020, 22, 898–901. [Google Scholar] [CrossRef]
- Packer, M. A reclassification of heart failure based on recognition of heart failure with normal to supernormal ejection fraction, a clinically common form of cardiac contracture, with distinctive pathophysiological and therapeutic features. Eur. J. Hear. Fail. 2023, 25, 669–672. [Google Scholar] [CrossRef] [PubMed]
- Fedele, F.; Mancone, M.; Adamo, F.; Severino, P. Heart Failure With Preserved, Mid-Range, and Reduced Ejection Fraction: The Misleading Definition of the New Guidelines. Cardiol. Rev. 2017, 25, 4–5. [Google Scholar] [CrossRef] [PubMed]
- Severino, P.; Maestrini, V.; Mariani, M.V.; Birtolo, L.I.; Scarpati, R.; Mancone, M.; Fedele, F. Structural and myocardial dysfunction in heart failure beyond ejection fraction. Hear. Fail. Rev. 2019, 25, 9–17. [Google Scholar] [CrossRef] [PubMed]
- Sonaglioni, A.; Nicolosi, G.L.; Granato, A.; Bonanomi, A.; Rigamonti, E.; Lombardo, M. Influence of chest wall conformation on reproducibility of main echocardiographic indices of left ventricular systolic function. Minerva Cardioangiol. 2024, 72, 111–124. [Google Scholar] [CrossRef]
- Pilotto, A.; Ferrucci, L.; Franceschi, M.; D'Ambrosio, L.P.; Scarcelli, C.; Cascavilla, L.; Paris, F.; Placentino, G.; Seripa, D.; Dallapiccola, B.; et al. Development and Validation of a Multidimensional Prognostic Index for One-Year Mortality from Comprehensive Geriatric Assessment in Hospitalized Older Patients. Rejuvenation Res. 2008, 11, 151–161. [Google Scholar] [CrossRef] [PubMed]
Figure 1.
Kaplan-Meier survival curves drawn to compare the rates of “all-cause mortality” in HFpEF patients, categorized according to LVEF (50 to 64% and ≥65%, respectively). HpEF, heart failure with preserved ejection fraction; LVEF, left ventricular ejection fraction.
Figure 1.
Kaplan-Meier survival curves drawn to compare the rates of “all-cause mortality” in HFpEF patients, categorized according to LVEF (50 to 64% and ≥65%, respectively). HpEF, heart failure with preserved ejection fraction; LVEF, left ventricular ejection fraction.
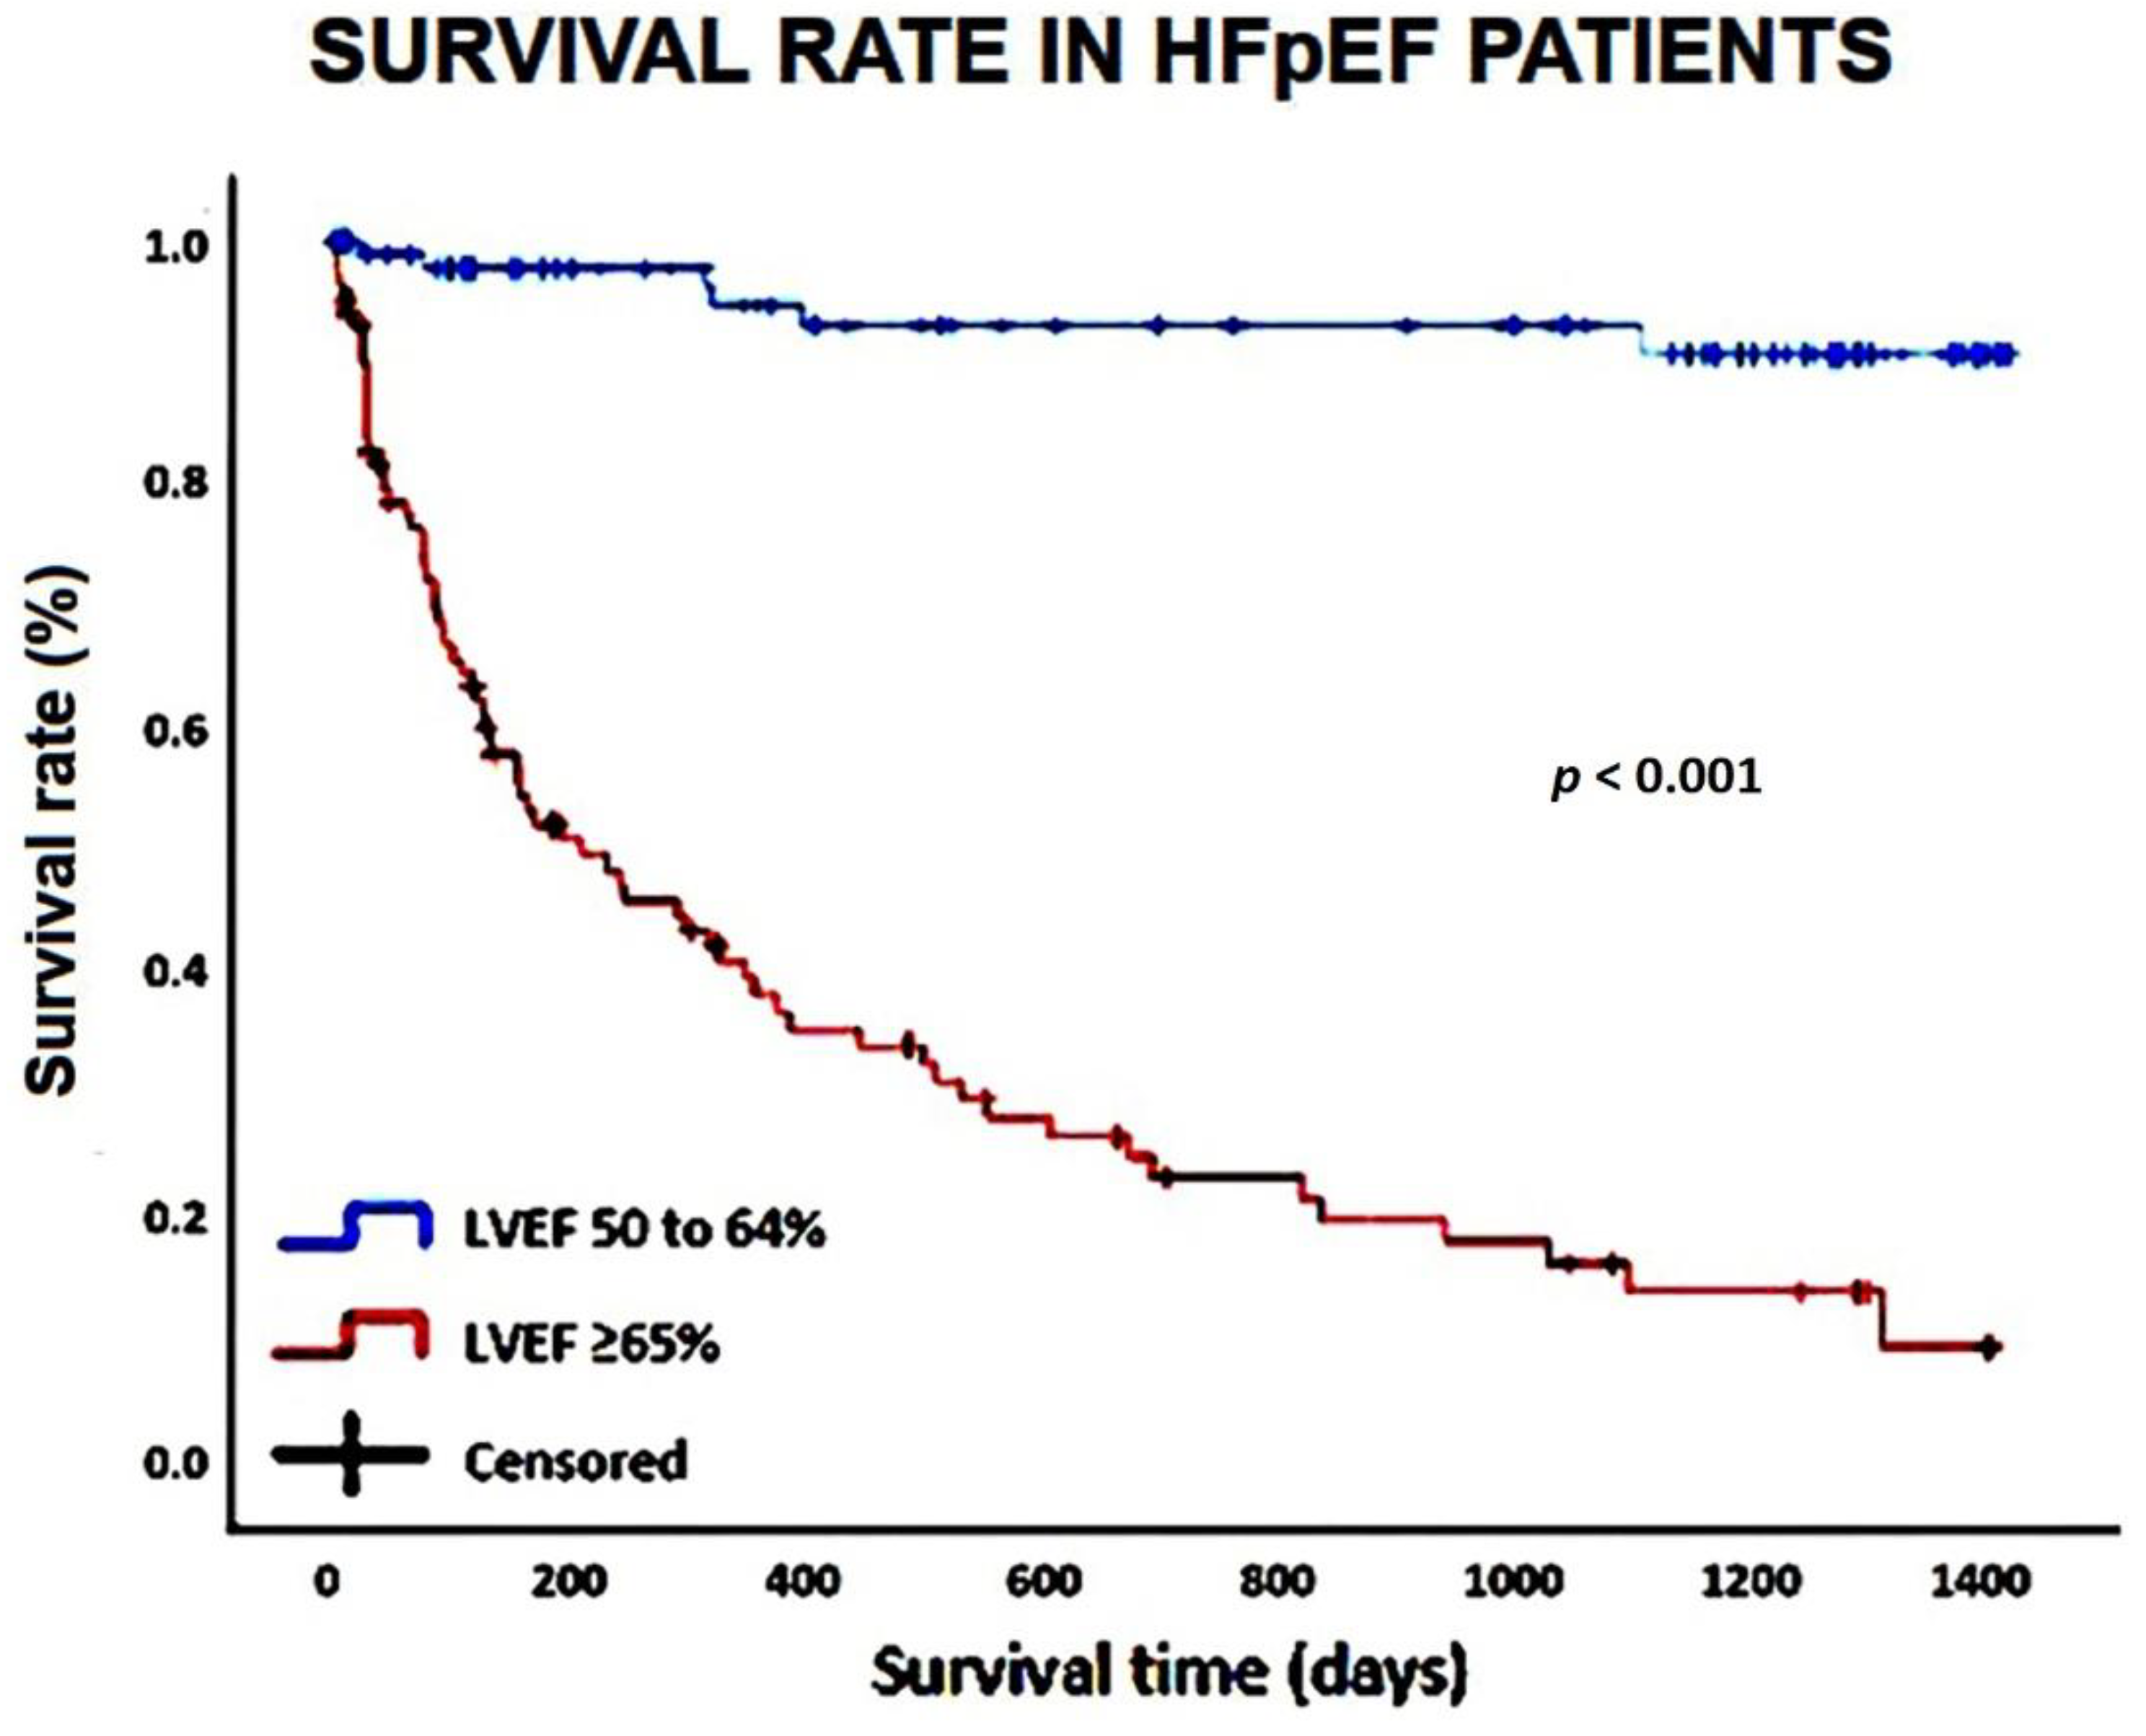
Figure 2.
Kaplan-Meier survival curves drawn to compare the rates of the composite of “all-cause mortality or reospitalization for all causes” in HFpEF patients, categorized according to LVEF (50 to 64% and ≥65%, respectively). HFpEF, heart failure with preserved ejection fraction; LVEF, left ventricular ejection fraction.
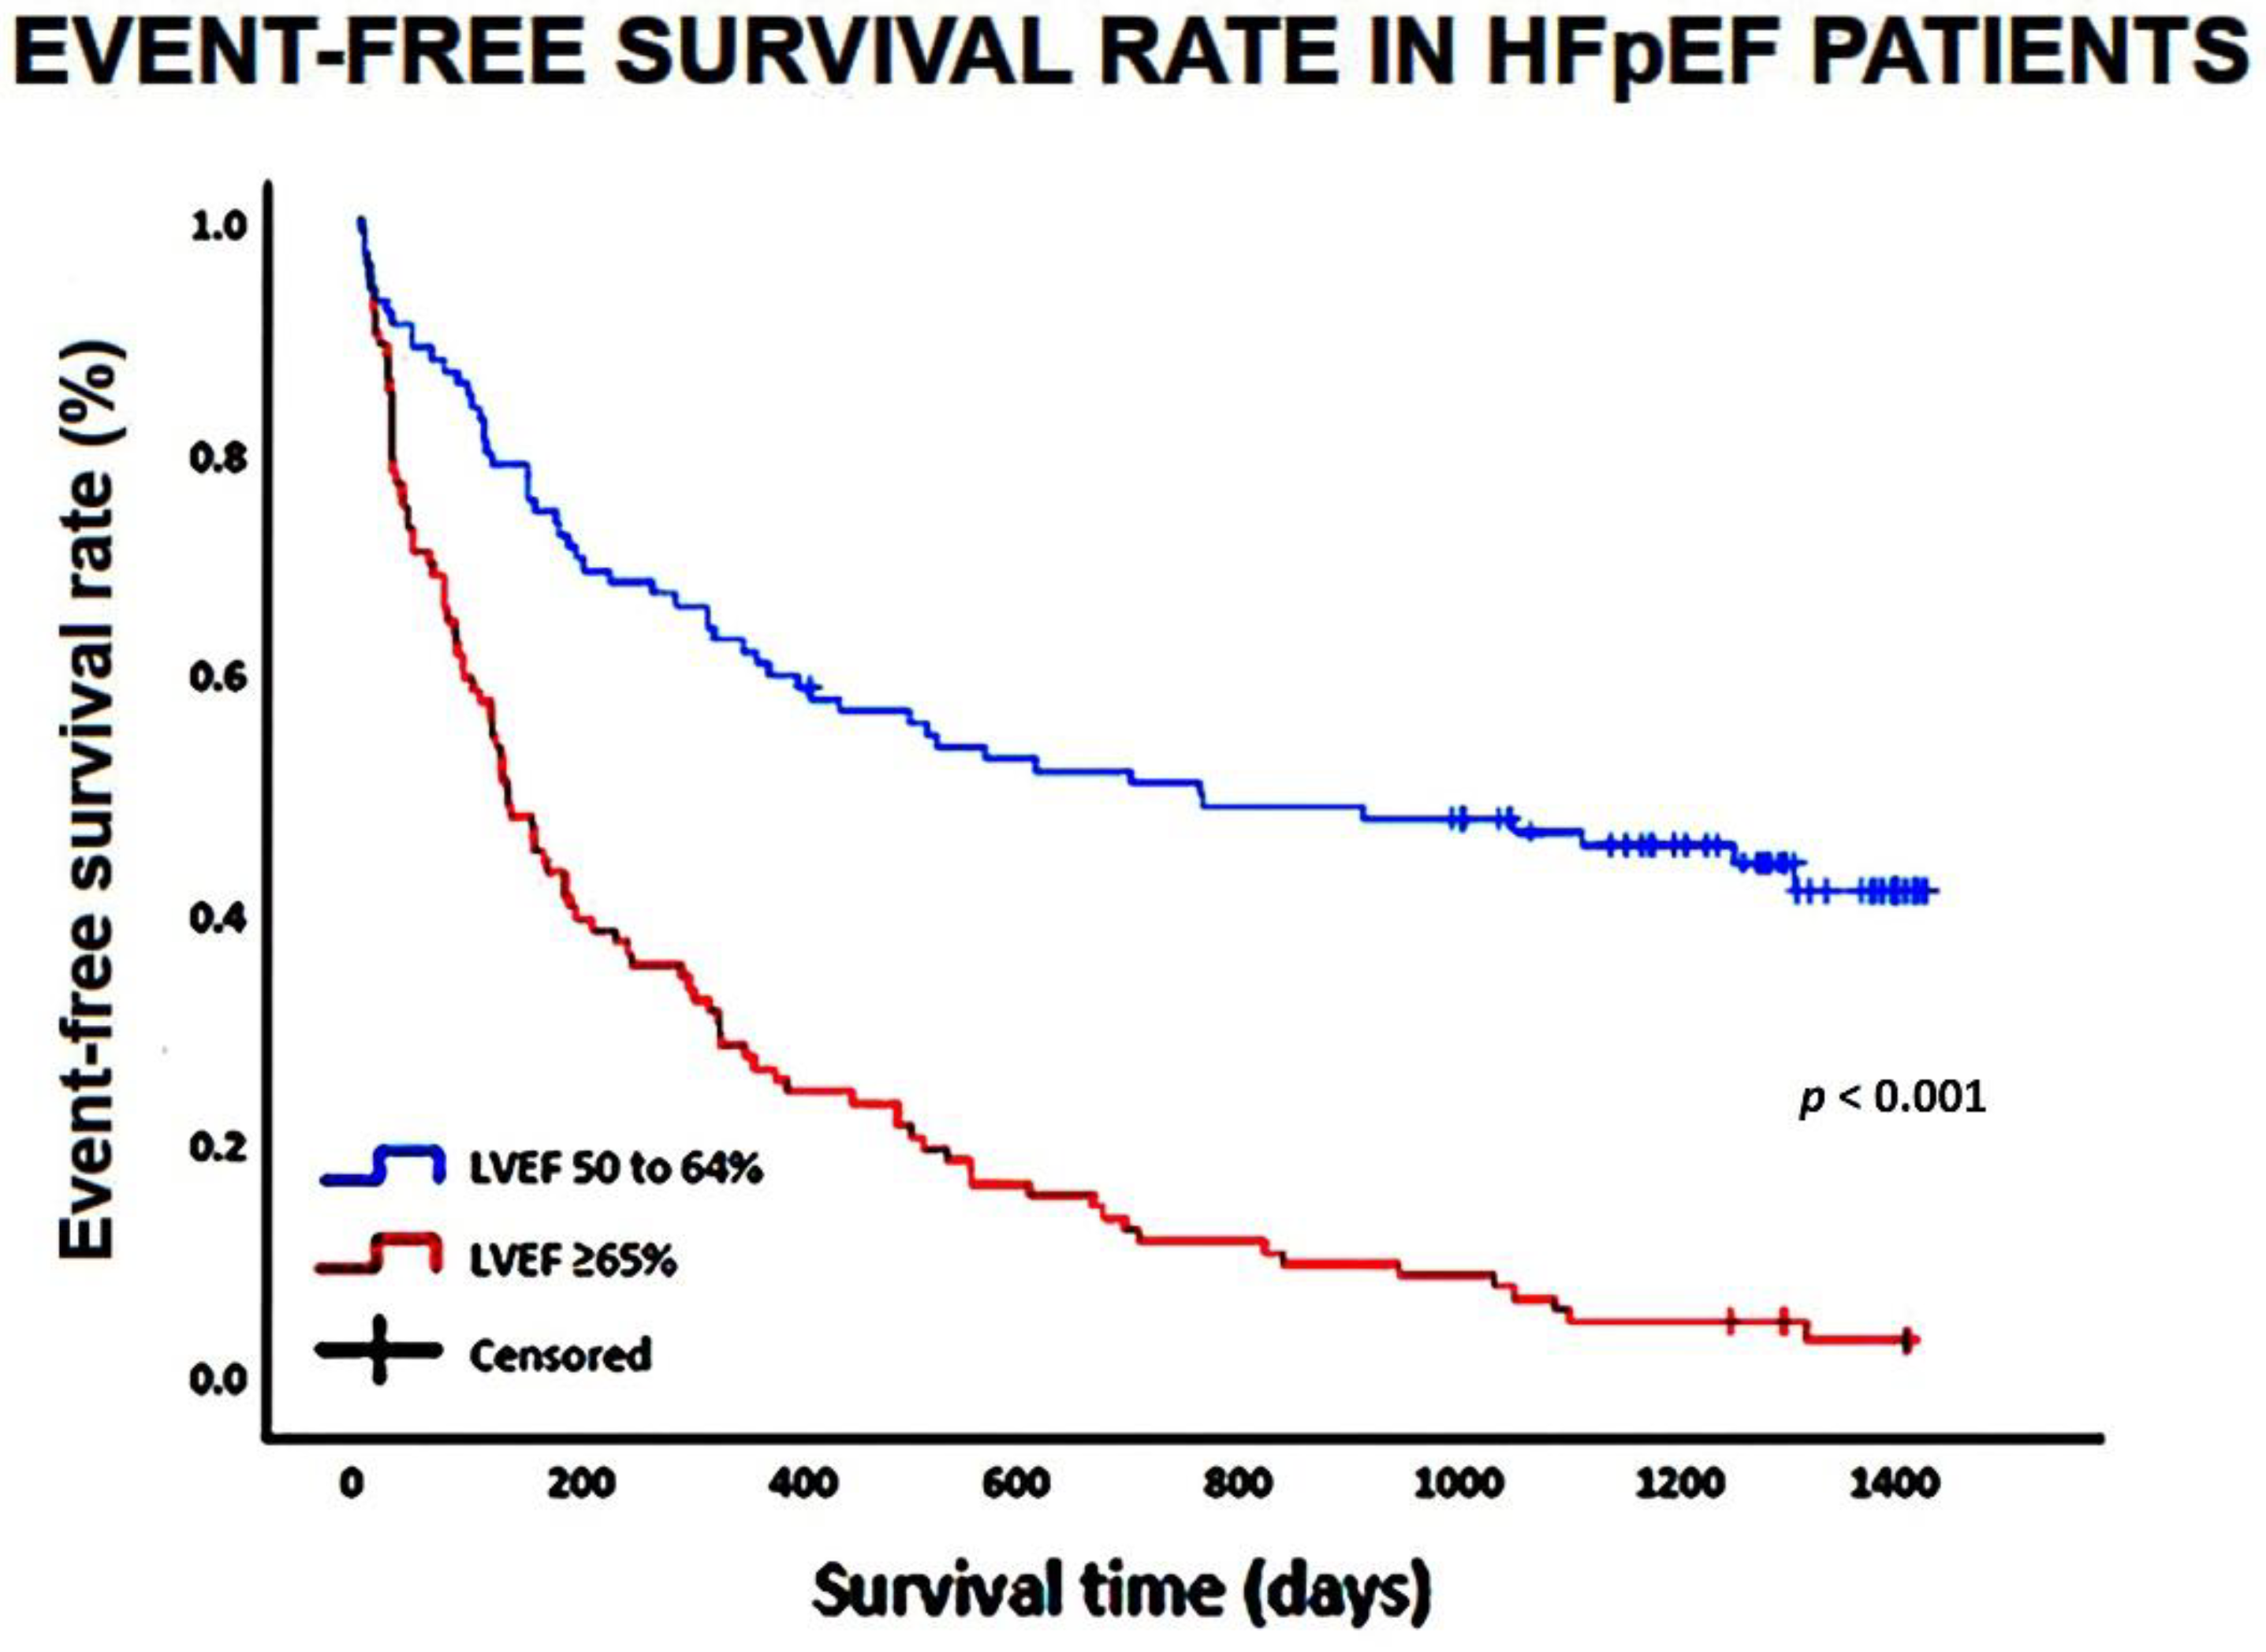

Table 1.
Baseline clinical characteristics of the whole HFpEF study population and of the two EF groups. Data are expressed as mean ± SD or as number (percentage). Significant p-values are in bold. AF, atrial fibrillation; CAD, coronary artery disease; CKD, chronic kidney disease; COPD, chronic obstructive pulmonary disease; CRP, C-reactive protein; DBP, diastolic blood pressure; eGFR, estimated glomerular filtration rate; EF, ejection fraction; Hb, hemoglobin; HFpEF, heart failure with preserved ejection fraction; HR, heart rate; HS, high-sensitive; LBBB, left bundle branch block; LDL, low-density lipoprotein; NT-proBNP, N-terminal pro-brain natriuretic peptide; OSAS, obstructive sleep apnea syndrome; PaO2, partial pressure of oxygen in the arterial blood; PaCO2, partial pressure of carbon dioxide in the arterial blood; SBP, systolic blood pressure; TSH, thyroid stimulating hormone; WBCs, white blood cells.
| Baseline clinical parameters | All patients (n = 200) |
“Normal” EF (50-64%) (n = 99) |
“Supra-normal” EF (≥65%) (n = 101) |
p-Value |
|---|---|---|---|---|
| Demographics | ||||
| Age (yrs) | 86.4 ± 6.6 | 84.9 ± 6.8 | 87.7 ± 6.1 | 0.002 |
| Age 70-84 yrs (n, %) | 86 (43.0) | 55 (55.5) | 34 (33.7) | <0.001 |
| Age ≥85 yrs (n, %) | 114 (57.0) | 44 (44.5) | 70 (66.3) | <0.001 |
| Female sex (n, %) | 140 (70.0) | 64 (64.6) | 76 (75.2) | 0.10 |
| Male sex (n, %) | 60 (30.0) | 35 (35.4) | 25 (24.8) | 0.10 |
| Cardiovascular risk factors and comorbidities | ||||
| Hypertension (n, %) | 152 (76.0) | 62 (62.6) | 90 (89.1) | <0.001 |
| Smoking (n, %) | 32 (16.0) | 19 (19.2) | 13 (12.9) | 0.22 |
| Type 2 diabetes mellitus (n, %) | 57 (28.5) | 26 (26.3) | 31 (30.7) | 0.49 |
| Dyslipidemia (n, %) | 99 (49.5) | 54 (54.5) | 45 (45.4) | 0.16 |
| Anaemia (Hb <12 F or 13 g/dl M) (n, %) | 124 (62.0) | 58 (58.6) | 66 (66.6) | 0.32 |
| CKD (eGFR <60 ml/min/m2) (n, %) | 119 (59.5) | 57 (57.6) | 79 (78.2) | 0.002 |
| COPD (n, %) | 43 (21.5) | 23 (23.2) | 20 (19.8) | 0.55 |
| OSAS (n, %) | 9 (4.5) | 6 (6.1) | 3 (2.9) | 0.29 |
| Hypothyroidism (n, %) | 37 (18.5) | 12 (12.1) | 25 (24.7) | 0.02 |
| History of CAD (n, %) | 41 (20.5) | 27 (27.3) | 14 (13.9) | 0.02 |
| Previous stroke (n, %) | 37 (18.5) | 18 (18.2) | 19 (18.8) | 0.91 |
| Peripheral arteriopathy (n, %) | 48 (24.0) | 20 (20.2) | 28 (27.7) | 0.21 |
| Cognitive impairment (n, %) | 72 (36.0) | 35 (35.3) | 37 (36.6) | 0.85 |
| Clinical prognostic scores | ||||
| H2FPEF score | 5.1 ± 1.9 | 5.0 ± 1.9 | 5.2 ± 2.0 | 0.47 |
| Charlson comorbidity index | 8.2 ± 2.1 | 7.8 ± 1.9 | 8.6 ± 2.2 | 0.006 |
| AGILE score | 6.4 ± 0.5 | 6.1 ± 0.4 | 6.6 ± 0.5 | <0.001 |
| Physical examination | ||||
| Dyspnea (n, %) | 94 (47.0) | 49 (49.5) | 45 (45.4) | 0.48 |
| Leg swelling (n, %) | 39 (19.5) | 16 (16.2) | 23 (22.7) | 0.24 |
| SBP (mmHg) | 130.0 ± 29.0 | 134.0 ± 24.9 | 125.1 ± 32.7 | 0.03 |
| DBP (mmHg) | 69.0 ± 14.4 | 71.8 ± 13.8 | 66.1 ± 14.8 | 0.005 |
| Body temperature ≥37.5° (n, %) | 71 (35.5) | 15 (15.1) | 56 (55.4) | <0.001 |
| Chest X-ray | ||||
| Normal pattern (n, %) | 84 (42.0) | 41 (41.4) | 43 (42.6) | 0.98 |
| Congestion (n, %) | 68 (34.0) | 50 (50.5) | 18 (17.8) | <0.001 |
| Pneumonia (n, %) | 48 (24.0) | 8 (8.1) | 40 (39.6) | <0.001 |
| ECG parameters | ||||
| AF (n, %) | 59 (29.5) | 32 (32.3) | 27 (26.7) | 0.39 |
| HR (bpm) | 78.5 ± 17.1 | 73.0 ± 14.2 | 84.0 ± 19.6 | <0.001 |
| LBBB (n, %) | 10 (5.0) | 5 (5.1) | 5 (4.9) | 0.97 |
| Biochemical parameters | ||||
| Serum hemoglobin (g/dl) | 10.9 ± 2.3 | 11.1 ± 2.4 | 10.7 ± 2.3 | 0.23 |
| Serum WBCs (× 109/L) | 12.5 ± 7.5 | 11.3 ± 6.3 | 13.6 ± 6.9 | 0.01 |
| PaO2 (mmHg) | 80.5 ± 35.8 | 88.9 ± 44.0 | 71.8 ± 19.7 | <0.001 |
| PaCO2 (mmHg) | 37.4 ± 10.8 | 36.1 ± 7.3 | 39.0 ± 13.7 | 0.07 |
| Serum glucose (mg/dl) | 139.9 ± 106.2 | 135.9 ± 88.3 | 144.0 ± 121.8 | 0.59 |
| Serum creatinine (mg/dl) | 1.71 ± 1.40 | 1.49 ± 1.39 | 1.93 ± 1.38 | 0.02 |
| eGFR (ml/min/m2) | 46.0 ± 26.2 | 52.3 ± 26.6 | 39.9 ± 24.5 | <0.001 |
| Serum sodium (mEq/l) | 139.1 ± 7.9 | 139.4 ± 6.8 | 138.8 ± 8.9 | 0.59 |
| Serum potassium (mEq/l) | 4.1 ± 0.7 | 4.1 ± 0.6 | 4.2 ± 0.8 | 0.32 |
| Serum uric acid (mg/dl) | 7.9 ± 7.5 | 7.3 ± 3.3 | 8.5 ± 10.1 | 0.26 |
| Serum HDL cholesterol (mg/dl) | 38.4 ± 14.1 | 39.0 ± 12.7 | 37.8 ± 15.5 | 0.55 |
| Serum LDL cholesterol (mg/dl) | 82.1 ± 34.4 | 83.0 ± 33.8 | 81.2 ± 35.0 | 0.72 |
| Serum TSH (uU/mL) | 1.95 ± 2.76 | 1.49 ± 1.53 | 2.41 ± 3.53 | 0.02 |
| Serum CRP (mg/dl) | 7.6 ± 8.1 | 5.3 ± 8.2 | 9.8 ± 8.0 | <0.001 |
| Serum NT-proBNP (pg/ml) | 3267 ± 4674 | 3070 ± 4442 | 3583 ± 5016 | 0.44 |
| Serum HS troponin (ng/ml) | 123 ± 257 | 100 ± 200 | 147 ± 304 | 0.19 |
Table 2.
Conventional echoDoppler parameters obtained at hospital admission in the whole HFpEF study population and in the two EF groups. Data are expressed as mean ± SD or as number (percentage). Significant p-values are in bold. A-P, antero-posterior; AR, aortic regurgitation; AS, aortic stenosis; EF, ejection fraction; HpEF, heart failure with preserved ejection fraction; IVC, inferior vena cava; IV, intraventricular; IVS, interventricular septum; LA, left atrial; LAV, left atrial volume; LVEDD, left ventricular end-diastolic diameter; LVEDV, left ventricular end-diastolic volume; LVESV, left ventricular end-systolic volume; MR, mitral regurgitation; PW, posterior wall; RVIT, right ventricular inflow tract; RWT, relative wall thickness; sPAP, systolic pulmonary artery pressure; TAPSE, tricuspid annular plane systolic excursion; TR, tricuspid regurgitation; TRV, tricuspid regurgitation velocity. *Measured only in patients in sinus rhythm; ** Measured in all patients.
| EchoDoppler parameters | All patients (n = 200) |
“Normal” EF (50-64%) (n = 99) |
“Supra-normal” EF (≥65%) (n = 101) |
p-Value |
|---|---|---|---|---|
| IVS (mm) | 13.7 ± 2.4 | 13.3 ± 2.4 | 14.1 ± 2.3 | 0.01 |
| PW (mm) | 10.4 ± 1.2 | 10.2 ± 1.1 | 10.6 ± 1.2 | 0.01 |
| LVEDD (mm) | 43.3 ± 5.9 | 44.2 ± 5.5 | 42.5 ± 6.2 | 0.04 |
| RWT | 0.49 ± 0.08 | 0.47 ± 0.07 | 0.51 ± 0.08 | <0.001 |
| LVEDV (ml) | 62.8 ± 21.2 | 65.7 ± 21.5 | 57.4 ± 20.8 | 0.006 |
| LVESV (ml) | 22.9 ± 9.5 | 28.0 ± 9.7 | 17.9 ± 7.0 | <0.001 |
| EF (%) | 63.5 ± 6.8 | 57.4 ± 3.4 | 68.9 ± 3.9 | <0.001 |
| E/A ratio* | 0.91 ± 0.44 | 1.05 ± 0.48 | 0.76 ± 0.40 | <0.001 |
| E/average e’ ratio** | 14.6 ± 6.2 | 17.4 ± 5.5 | 11.8 ± 5.5 | <0.001 |
| Systolic IV pressure gradient ≥15 mmHg (n, %) | 64 (23.0) | 6 (6.1) | 58 (57.4) | <0.001 |
| LA A-P diameter (mm) | 46.0 ± 9.5 | 45.9 ± 10.4 | 46.0 ± 8.6 | 0.94 |
| LA longitudinal diameter (mm) | 57.1 ± 12.1 | 56.7 ± 12.3 | 57.5 ± 12.0 | 0.64 |
| LAV (ml) | 83.3 ± 32.5 | 82.8 ± 32.8 | 83.7 ± 32.4 | 0.84 |
| RVIT (mm) | 30.7 ± 7.0 | 32.0 ± 7.4 | 29.5 ± 6.3 | 0.01 |
| Moderate-to-severe MR (n, %) | 63 (31.5) | 45 (45.4) | 18 (17.8) | <0.001 |
| Moderate-to-severe AR (n, %) | 20 (10.0) | 12 (12.1) | 8 (7.9) | 0.32 |
| Moderate-to-severe AS (n, %) | 25 (12.5) | 10 (10.1) | 15 (14.8) | 0.31 |
| Moderate-to-severe TR (n, %) | 64 (32.0) | 32 (32.3) | 32 (31.7) | 0.92 |
| TRV (m/s) | 3.03 ± 0.58 | 3.06 ± 0.57 | 3.01 ± 0.59 | 0.54 |
| IVC (mm) | 19.9 ± 7.4 | 20.0 ± 7.2 | 19.9 ± 7.6 | 0.92 |
| TAPSE (mm) | 24.3 ± 4.4 | 26.4 ± 4.7 | 22.2 ± 4.1 | <0.001 |
| sPAP (mmHg) | 41.8 ± 17.5 | 42.5 ± 18.7 | 41.1 ± 16.3 | 0.57 |
| TAPSE/sPAP ratio (mm/mmHg) | 0.58 ± 0.26 | 0.62 ± 0.21 | 0.54 ± 0.25 | 0.01 |
| Aortic root (mm) | 34.1 ± 4.1 | 34.0 ± 4.0 | 34.1 ± 4.2 | 0.86 |
| Ascending aorta (mm) | 35.4 ± 4.6 | 35.6 ± 4.2 | 35.1 ± 4.9 | 0.44 |
Table 3.
Relevant HFpEF characteristics and hospitalization data in the whole study population and in the two EF groups. Data are expressed as mean ± SD or as number (percentage). Significant p-values are in bold. ACEIs, angiotensin-converting enzyme inhibitors; ARBs, angiotensin II receptor blockers; BB, beta blockers; CAD, coronary artery disease; CCB, calcium-channel blockers; CKD, chronic kidney disease; eGFR, estimated glomerular filtration rate; EF, ejection fraction; Hb, hemoglobin; HpEF, heart failure with preserved ejection fraction; NYHA, New York Heart Association; PE, pulmonary embolism; VHD, valvular heart disease.
| HF characteristics and hospitalization parameters | All patients (n = 200) |
“Normal” EF (50-64%) (n = 99) |
“Supra-normal” EF (≥65%) (n = 101) |
p-Value |
|---|---|---|---|---|
| NYHA functional class | ||||
| Class III (n, %) | 100 (50.0) | 60 (60.6) | 40 (39.6) | 0.003 |
| Class IV (n, %) | 100 (50.0) | 39 (39.4) | 61 (60.4) | 0.003 |
| Etiology of HF | ||||
| Acute/chronic CAD (n, %) | 50 (25.0) | 36 (36.4) | 14 (13.9) | <0.001 |
| Acute/chronic VHD (n, %) | 108 (54.0) | 67 (67.7) | 41 (40.6) | <0.001 |
| Hypertensive cardiomyopathy (n, %) | 152 (76.0) | 62 (62.6) | 90 (89.1) | <0.001 |
| Acute/chronic pulmonary hypertension (n, %) | 95 (47.5) | 45 (45.5) | 50 (49.5) | 0.57 |
| Reasons for hospitalizations | ||||
| Congestive heart failure (n, %) | 73 (36.5) | 55 (55.5) | 18 (17.8) | <0.001 |
| Pneumonia/bronchitis/respiratory failure/PE (n, %) | 70 (35.0) | 15 (15.1) | 55 (54.5) | <0.001 |
| Infections (urinary tract, intestine, endocarditis) (n, %) | 35 (17.5) | 10 (10.1) | 25 (24.7) | 0.006 |
| Gastro-intestinal disorders (n, %) | 35 (17.5) | 11 (11.1) | 24 (23.8) | 0.02 |
| Severe anaemia (Hb <8 g/dl) (n, %) | 29 (14.5) | 9 (9.1) | 20 (19.8) | 0.03 |
| Severe CKD (eGFR <15 ml/min/m2) (n, %) | 29 (14.5) | 9 (9.1) | 20 (19.8) | 0.03 |
| Cancers (n, %) | 29 (14.5) | 9 (9.1) | 20 (19.8) | 0.03 |
| Hyponatriemia (n, %) | 43 (21.5) | 15 (15.1) | 28 (27.7) | 0.03 |
| Hypernatriemia (n, %) | 31 (15.5) | 10 (10.1) | 21 (20.8) | 0.04 |
| Neurological disorders (n, %) | 24 (12.0) | 6 (6.1) | 18 (17.8) | 0.01 |
| ≥2 reasons for hospitalizations (n %) | 83 (41.5) | 25 (25.2) | 58 (57.4) | <0.001 |
| Discharge therapy | ||||
| Antiplatelets (n, %) | 74 (37.0) | 35 (35.3) | 39 (38.6) | 0.63 |
| Anticoagulants (n, %) | 69 (34.5) | 36 (36.4) | 33 (32.7) | 0.58 |
| ACEIs/ARBs (n, %) | 65 (32.5) | 38 (38.4) | 28 (27.7) | 0.11 |
| CCB (n, %) | 51 (25.5) | 26 (26.3) | 25 (24.7) | 0.81 |
| BB (n, %) | 115 (57.5) | 46 (46.5) | 69 (68.3) | 0.002 |
| Digoxin (n, %) | 42 (21.0) | 18 (18.2) | 24 (23.8) | 0.33 |
| Loop diuretics (n, %) | 88 (44.0) | 64 (64.6) | 24 (23.8) | <0.001 |
| Aldosterone antagonists (n, %) | 73 (36.5) | 38 (38.4) | 35 (34.6) | 0.58 |
| Statins (n, %) | 62 (31.0) | 32 (32.3) | 30 (29.7) | 0.69 |
| Oral hypoglicemyc agents (n, %) | 20 (10.0) | 13 (13.1) | 7 (6.9) | 0.14 |
| Insulin (n, %) | 25 (12.5) | 9 (9.1) | 16 (15.8) | 0.15 |
| Length of hospital stay (days) | 11.7 ± 5.5 | 11.4 ± 5.8 | 12.0 ± 5.2 | 0.44 |
Table 4.
Univariate and multivariate Cox regression analysis performed to identify the variables independently associated with “all-cause mortality” at 3.6-yrs follow-up in the whole study population. Significant p-values are in bold. eGFR, estimated glomerular filtration rate; LVEF, left ventricular ejection fraction; sPAP, systolic pulmonary artery pressure; TAPSE, tricuspid annular plane systolic excursion.
| UNIVARIATE COX REGRESSION ANALYSIS | MULTIVARIATE COX REGRESSION ANALYSIS | |||||
|---|---|---|---|---|---|---|
| VARIABLES | HR | 95% CI | p-Value | HR | 95% CI | p-Value |
| Age (yrs) | 1.18 | 1.13-1.23 | <0.001 | 1.09 | 1.03-1.16 | 0.002 |
| Female sex | 0.21 | 0.13-0.34 | <0.001 | 0.71 | 0.41-1.23 | 0.22 |
| eGFR (ml/min/m2) | 0.98 | 0.97-0.99 | <0.001 | 0.99 | 0.98-1.01 | 0.85 |
| H2FPEF score | 1.06 | 0.95-1.19 | 0.28 | |||
| AGILE score | 1.68 | 1.07-2.63 | 0.02 | 1.07 | 0.66-1.73 | 0.79 |
| LVEF (%) | 1.19 | 1.15-123 | <0.001 | 1.08 | 1.03-1.14 | 0.004 |
| E/average e’ | 1.01 | 0.97-1.04 | 0.74 | |||
| TAPSE/sPAP ratio (mm/mmHg) | 0.01 | 0.00-0.02 | <0.001 | 0.14 | 0.03-0.61 | 0.009 |
| Infectious disease | 39.7 | 16.9-93.5 | <0.001 | 7.23 | 2.41-21.6 | <0.001 |
Table 5.
Univariate and multivariate Cox regression analysis performed to identify the variables independently associated with the composite of “all-cause mortality or re-hospitalization for all causes” at 3.6-yrs follow-up in the whole study population. Significant p-values are in bold. AF, atrial fibrillation; eGFR, estimated glomerular filtration rate; LVEF, left ventricular ejection fraction; RWT, relative wall thickness; sPAP, systolic pulmonary artery pressure; TAPSE, tricuspid annular plane systolic excursion.
| UNIVARIATE COX REGRESSION ANALYSIS | MULTIVARIATE COX REGRESSION ANALYSIS | |||||
|---|---|---|---|---|---|---|
| VARIABLES | HR | 95% CI | p-Value | HR | 95% CI | p-Value |
| Age (yrs) | 1.03 | 1.00-1.05 | 0.04 | 1.01 | 0.98-1.04 | 0.42 |
| Female sex | 0.82 | 0.59-1.15 | 0.25 | |||
| eGFR (ml/min/m2) | 0.99 | 0.98-1.00 | 0.003 | 0.99 | 0.98-1.00 | 0.27 |
| AF | 0.90 | 0.63-1.29 | 0.56 | |||
| Heart rate (bpm) | 1.00 | 0.99-1.01 | 0.65 | |||
| H2FPEF score | 1.02 | 0.94-1.10 | 0.66 | |||
| AGILE score | 1.40 | 1.01-1.94 | 0.04 | 1.22 | 0.87-1.71 | 0.24 |
| RWT | 1.15 | 0.85-1.56 | 0.36 | |||
| LVEF (%) | 1.07 | 1.05-1.10 | <0.001 | 1.04 | 1.01-1.07 | 0.02 |
| E/average e’ | 1.01 | 0.98-1.03 | 0.53 | |||
| TAPSE/sPAP ratio (mm/mmHg) | 0.22 | 0.12-0.42 | <0.001 | 0.56 | 0.25-1.26 | 0.16 |
| Infectious disease | 2.82 | 2.03-3.92 | <0.001 | 1.51 | 0.89-2.56 | 0.12 |
| Diuretics | 1.16 | 0.81-1.64 | 0.41 | |||
| Length of hospital stay (days) | 0.98 | 0.95-1.01 | 0.31 | |||
Disclaimer/Publisher’s Note: The statements, opinions and data contained in all publications are solely those of the individual author(s) and contributor(s) and not of MDPI and/or the editor(s). MDPI and/or the editor(s) disclaim responsibility for any injury to people or property resulting from any ideas, methods, instructions or products referred to in the content. |
© 2024 by the authors. Licensee MDPI, Basel, Switzerland. This article is an open access article distributed under the terms and conditions of the Creative Commons Attribution (CC BY) license (http://creativecommons.org/licenses/by/4.0/).
Copyright: This open access article is published under a Creative Commons CC BY 4.0 license, which permit the free download, distribution, and reuse, provided that the author and preprint are cited in any reuse.


