
Submitted:
26 December 2024
Posted:
27 December 2024
You are already at the latest version
Abstract
This study aimed to investigate the levels of emotional, restrained, and external eating behaviors (EBs) among adults, categorize them, and analyze their energy and nutrient intake. A self-reported survey was administered to 522 Korean adults aged 19–64 years to evaluate their emotional, re-strained, and external EBs. They were categorized into five types: Non-specific (NS), Emotional (Emo), Restrained (Res), External (Ext), and Combined(Com) EB types. Subsequently, energy intake, intake ratios and levels, and vitamin and mineral intakes were compared after adjusting for sex and age. The Ext type exhibited a higher energy intake than the Res type. Notably, both the Ext and Com types had higher proportions of excessive energy intake, while the NS and Res types displayed higher proportions of insufficient energy intake. The Emo type yielded a high ratio of lipid intake, while the Com type exhibited high ratios of both lipid and protein intakes. Furthermore, the Res type demonstrated lower vitamin E, niacin, and potassium intakes than the other types. Since energy and certain nutrient intakes varied according to EB type, further research on EB may provide an approach to nutritional issues.
Keywords:
eating behavior
; energy intake
; nutrient intake
; adult
; nutrition
1. Introduction
Eating behavior (EB) in humans extends beyond the mere consumption of food for sustenance; it is influenced by various social, economic, cultural, and emotional factors. This complex and essential behavior significantly impacts both physical and mental health [1]. The factors influencing EB can be categorized into three forms: emotional, external, and restrained EBs, depending on the context wherein an individual consumes food. First, emotional EB view food consumption as a means of alleviating or coping with negative emotions. Second, external EB is characterized by food intake that is influenced by external stimuli, such as the appearance, taste, and aroma of food; the eating environment; and the presence of others, often disregarding internal signals like hunger. Finally, restrained EB refers to the conscious effort to regulate food intake based on weight or body shape.
EB can offer psychological stability, sensory satisfaction, and fulfillment of social needs when maintained at an appropriate level. However, when certain EBs become excessive, they potentially lead to health issues, including nutritional imbalances, which are influenced by these characteristics. Previous studies have indicated that emotional and external EBs are linked to binge eating, obesity, eating addiction, and metabolic syndrome [3,4,5]. Additionally, studies focusing on female college students, middle-aged women, and young adults have revealed that individuals with elevated stress and depression levels, along with poor emotional regulation skills, are more likely to engage in emotional eating [6,7,8]. Research has demonstrated that individuals who exhibit a high propensity for emotional eating tend to favor energy-dense foods rich in sugar and fat in their quest for immediate emotional relief or stimulation [9]. Similarly, those who practice external eating reportedly consume more food than necessary, even in the absence of hunger, thereby contributing to obesity [3]. Notwithstanding, while it seems desirable for individuals practicing restrained eating to regulate their food intake considering their body shape and weight, excessive moderation can lead to fixation on appearance and biases regarding weight, potentially eliciting eating disorders, such as anorexia nervosa and bulimia [10]. Additionally, college students who engage in restrained eating tend to experience greater dissatisfaction with their bodies and less dietary diversity [11].
Previous studies have suggested that health issues may arise depending on the degree of individual EBs among specific population groups, such as women and college students [3,4,5,6,7,8,9,10,11]. However, since humans are influenced by multiple variables when selecting what to eat [1], the types and amounts of food consumed are expected to vary depending on the factors exerting a greater impact in a given environment, that is, which EB characteristics are the strongest. In other words, the quantity of energy consumed and nutritional quality are anticipated to vary with the type of EB. However, considerably few studies have analyzed the differences in energy and nutrient intakes based on a comprehensive concept of EB in the general population [3].
This study aimed to assess the degree of three EBs among Korean adults, categorize them, and compare the differences in energy and nutrient intakes. Ultimately, we sought to provide information revealing potential risks associated with adults EB types in terms of nutritional and health issues. Furthermore, by identifying individual EB types, we endeavored to uncover nutritional challenges that potentially form the basis for psychiatric eating disorders, obesity, and metabolic syndrome as well as assist in formulating strategies for health improvement based on diverse EB type.
2. Materials and Methods
2.1. Participants
This study’s participants were Korean adults aged 19–64 years. Participants were recruited nationwide through online promotions from June to November 2023, and only those who voluntarily agreed to participate were included in the online self-reported survey. As illustrated in Figure 1, a total of 1,359 individuals participated in the survey; however, four individuals did not satisfy the age criteria, and 703 who did not complete the Food Intake Frequency Questionnaire (FFQ) were excluded. Additionally, the energy intake of 652 participants was calculated, and 130 individuals who < 500 or > 5,000 kcal per day were excluded. Finally, data from 522 participants (140 men and 382 women) were analyzed.
2.2. Survey Contents
The survey included questions on sex, age, EB, and food intake to estimate energy and nutrient intakes.
2.2.1. EB
The Dutch Eating Behavior Questionnaire (DEBQ) was utilized to examine the participants' EBs. It was developed by Van Strien et al. in 1986 [2] and translated into Korean by Kim et al. in 1996 [12]. The DEBQ is an interval scale comprising 32 questions, with responses ranging from 1 (strongly disagree) to 5 (strongly agree). It encompasses three distinct concepts. First, the questionnaire includes 10 items (nos. 1–10) that assess restrained EB, focusing on the control of food quantity and type, as well as meal timing, in relation to body weight and shape. Second, 13 items (nos. 11–23) evaluate emotional EB, specifically measuring the desire to eat when feeling depressed, nervous, anxious, or disappointed. Finally, nine items (nos. 24–32) address external EB by determining whether the taste or aroma of food, dining environment, or sight of others eating influences the urge to eat. To verify the validity of the DEBQ, exploratory factor analysis was conducted. One item (no. 1) with a commonality index < 0.5 and six items (nos. 4, 12, 23, 28, 30, and 32) exhibiting a factor loading value < 0.4 were excluded from the analysis. Following factor reduction, the Cronbach alpha values for the three EBs ranged from 0.855 to 0.957.
To classify EB types using three distinct EB scores, each score was divided into quartiles. Participants in the top 25% were defined as exhibiting restrained (Res), emotional (Emo), or external (Ext) EB types. When two EBs fell within the top 25%, classification was determined by comparing their similarities via cluster analysis. Consequently, if a participant exhibited both emotional and restrained EBs, they were classified as Emo. If a participant displayed both restrained and external EBs, they were classified as Res. In cases where both emotional and external EBs were present, the participant was classified as Ext. Finally, participants in whom all three EBs fell in the top 25% were designated as combined (Com), while those with none of the EBs in the top 25% were considered to exhibit non-specific (NS) EB type.
2.2.2. Energy and Nutrient Intakes
A semi-quantitative food frequency questionnaire designed for the Korean population by Kim et al. in 2018 [13], with certain modifications, was employed to assess the participants’ energy and nutrient intakes. The questionnaire included the following 74 food items: grains and starches (11 items); meat, poultry, and eggs (10 items); fish and shellfish (12 items); beans and tofu (4 items); kimchi (3 items); fruits (14 items); milk and dairy products (4 items); fats and sugars (2 items); bakery items and nuts (4 items); tea and beverages (5 items); and alcoholic beverages (5 items). The investigation focused on the average single-time intake amount and annual intake frequency of each food item. The average serving size was classified into three categories: “0.5 times, 1 time, and 1.5 times,” based on the standard serving sizes recommended by prior research [13] and the Computer Aided Nutritional Analysis Program 5.0 (CAN-Pro 5.0, The Korean Nutrition Society, Seoul, Korea). Additionally, food consumption frequency was categorized as “almost never eaten,” “about once a month,” “2–3 times a month,” “1–3 times a week,” “4–6 times a week,” “about once a day,” and “more than twice a day.” Energy and nutrient intakes were calculated from the food intake data using CAN-Pro 5.0.
2.3. Statistical Analysis
Differences in EB scores based on the participants’ sex and age were analyzed using Student’s t-test and analysis of variance. Distribution differences in EB types according to sex and age as well as the energy intake status associated with these EB types were examined using Pearson’s chi-squared test. Furthermore, analysis of covariance was employed to evaluate energy intake according to EB type while controlling for sex and age. Additionally, the energy intake ratio and nutrient intake were assessed after adjusting for sex, age, and energy intake. A significance level of p < .05 was established for all statistical analyses, which were conducted using IBM SPSS Statistics (version 25.0; IBM Corp., Armonk, NY, USA).
3. Results
3.1. Sex- and Age-Related Differences in EB Among Korean Adults
3.1.1. Sex- and Age-Related Differences in EB Scores Among Korean Adults
The participants’ EB scores were compared by sex and age (Table 1), revealing significant differences in EB scores attributable to both sex and age. Female participants exhibited notably higher emotional, restrained, and external EB scores than male participants. In terms of age, individuals in their 40s yielded higher emotional EB scores than those in their 50s and 60s as well as higher restrained EB scores than those in their 30s. Furthermore, participants in their 30s and 40s recorded higher external EB scores than those in their 50s or above.
3.1.2. Sex- and Age-Related Differences in the Distribution of EB Types Among Korean Adults
The distribution of EB types according to participant sex and age is presented in Table 2. The NS type emerged as the most prevalent EB type among the participants, accounting for 249 individuals (47.7%). This was followed by the Emo and Ext types, each comprising 90 individuals (17.2%); the Res type with 65 individuals (12.5%); and the Com type with 28 individuals (5.4%). Furthermore, the distribution of EB types significantly varied with sex. Male participants exhibited a higher proportion of the NS type, whereas female participants demonstrated a greater prevalence of the Res, Ext, and Com EB types.
3.2. Difference in Energy Intake by EB Type Among Korean Adults
The participants’ energy intake was evaluated according to EB type (Figure 2). The average daily energy intake for all participants was 2,630.84 ± 1084.46 kcal. When analyzed by EB type, the energy intake was as follows: 2,546.47 ± 1,102.18, 2,659.65 ± 1,098.70, 2,415.77 ± 1,022.61, 3,003.01 ± 1,009.91, and 2,591.67 ± 1,035.58 kcal for the NS, Emo, Res, Ext, and Com type, respectively. After adjusting for sex and age, the differences in energy intake among the EB types were found to be statistically significant, with Ext type participants exhibiting a higher energy intake than Res type participants.
3.3. Distribution of Energy Intake Levels by EB Type Among Korean Adults
The distribution of energy intake levels by EB types is presented in Table 3. Participants were classified as having a “sufficient” energy intake when their consumption ranged from 75% to 125% of the estimated energy requirement (EER), as defined by the 2020 Korean Dietary Reference Intakes, stratified by sex and age. An intake < 75% of the EER was classified as “deficient,” while that > 125% of the EER was classified as “excessive.” Among the 522 participants analyzed, 177 (33.9%), 82 (15.7%), and 263 (50.4%) were classified as sufficient, deficient, and excessive energy consumers, respectively. The differences in energy intake levels across the various EB types were found to be statistically significant. Notably, the NS and Res types exhibited a higher prevalence of energy deficiency, while the Ext and Com types demonstrated a greater incidence of excessive energy intake relative to the average value.
3.4. Energy Intake Ratio by EB Type Among Korean Adults
The variations in energy intake ratio by EB types are presented in Table 4. The carbohydrate, lipid, and protein proportions of the total energy intake among participants were 59.77 ± 10.42%, 24.44 ± 8.46%, and 14.52 ± 2.88%, respectively. These values fall within the acceptable macronutrient distribution range of carbohydrates, lipids, and proteins, that is 55–65%, 15–30%, and 7–20%, respectively. Furthermore, a significant difference in energy intake ratios was observed across the EB types after controlling for the participants' sex, age, and total energy intake. Specifically, the carbohydrate proportion was higher in the NS and Ext types than in the Com type. Conversely, the lipid proportion was higher in the Emo and Com types relative to the NS type. Finally, the protein proportion was greater in the Com type than in the Ext type.
3.5. Differences in Nutrient Intake by EB Type of Korean Adults
The differences in major nutrient intake by EB type are presented in Table 5. After adjusting for sex, age, and total energy intake, significant differences in nutrient intake (carbohydrates, lipids, vitamin E, niacin, potassium, and copper) were observed across EB types. Specifically, carbohydrate intake was evidently higher in the Ext type than in all other types, while lipid intake was also higher in the Ext type than in the NS type. Furthermore, vitamin E intake was lower in the NS and Res types than in the Ext and Com types. Additionally, niacin intake was lower in the Res type than in the Com type, and potassium intake was lower in both the NS and Res types than in the Com type. However, the post-hoc analysis indicated that copper intake did not exhibit any statistically significant differences.
4. Discussion
This study elucidates the disparities in energy and nutrient intakes among Korean adults, contingent upon their EB types. Initially, the analysis revealed variations in the distribution of EB scores and types in relation to sex and age. Therefore, total energy intake was assessed after adjusting for sex and age. The findings indicated that Ext type individuals consumed more energy than those with Res type. Furthermore, the proportion of people with excessive energy intake among Ext and Com types was notably higher than the average value. Conversely, a proportion of people with deficient energy intake among NS and Res types was higher than the average value. The Ext type is characterized by the selection of food and eating patterns that are influenced by external stimuli, rather than internal physiological signals, such as hunger or satiety. This behavior is posited to contribute to overeating, binge eating, and a lack of control over food intake, resulting in excessive energy consumption. Previous research has indicated that women exhibit higher levels of stress and neuroticism than men, alongside elevated rates of emotional and external eating. Additionally, women's EBs have been found to strongly correlate with specific personality traits [14]. Moreover, a study involving twins and their families suggested that symptoms of depression and anxiety significantly impact emotional and external eating, with these behaviors being associated with genetic factors. In contrast, restrained eating were evidently influenced by environmental factors [15]. This study partially corroborates earlier findings regarding the sex-related differences in EBs. Considering that both genetic and environmental factors apparently play a role in shaping EBs, the results suggest the potential of leveraging an understanding of EB types as a strategic intervention for promoting appropriate energy intake.
The analysis revealed significant variations in the energy intake ratio based on EB type. Specifically, the proportion of carbohydrates to total energy intake was found to be greater among NS type individuals than among their Com type counterparts. Conversely, the proportion of lipids was higher in both the Emo and Com types than in the NS type. Additionally, the protein proportion was elevated in the Com type relative to that in the Ext type. Considering the carbohydrate-centric dietary pattern prevalent among Koreans, the Emo type was observed to exhibit a higher lipid intake than other EB types, while the Com type demonstrated higher intakes of both lipids and proteins. These findings remind that individuals with emotional eating tendencies tend to favor energy-dense foods that provide immediate emotional gratification [9]. Furthermore, the Com type, characterized by elevated levels of emotional, restrained, and external EBs, displayed excessive energy intake, with higher proportions of lipid and protein consumption compared with other types. These results imply that the Com type consumed a lot of food, especially foods rich in protein and lipids, such as meat, fish, oils, and/or nuts. Comparison of energy intake by EB type revealed a possible nutritional problem in the Com type, which encompasses all three tendencies. Excessive energy intake was revealed the most challenges among the Com type than other single types. In light of these findings, we advocate for the development of a new definition of and further research into the Com type.
Nutrient consumption varies with individual EB type, with a particular emphasis on major nutrients, such as carbohydrate, lipid, vitamin E, niacin, and potassium. Notably, carbohydrate intake was significantly higher in the Ext type than in all other types, while lipid intake was also higher in the Ext type than in the NS type. This highlights the necessity for increased awareness regarding the risks associated with excessive energy intake, including overeating and binge eating, particularly within the Ext type. Given that the Ext type is more prevalent among women and individuals in their 20s and 30s, paying attention to and conducting further research on the eating environments and external factors influencing EBs in these demographic groups are imperative.
The consumption of vitamins, specifically vitamin E and niacin, varied with EB type. Notably, vitamin E intake was significantly lower in the Res and NS types than in the Ext and Com types. Overall, vitamin E intake was deemed adequate across all EB types, surpassing the recommended intake level of 12 mg for Korean adults aged 19–64 years. Vitamin E is recognized among the most effective antioxidants in the human body—found in sources such as vegetable oils, leafy greens, nuts, and dairy products—and serves a crucial role in antioxidant activity, blood metabolism, and skin health [16]. Therefore, individuals with lower intake levels, such as Res and NS EB types, may need to be more cautious to avoid vitamin E deficiency.
Niacin intake was lower in the Res type than the Com type. In particular, niacin consumption in the Res type was either inadequate or only marginally higher than the recommended intake for Korean adults, which is 16 mg for men and 14 mg for women. This situation necessitates caution to prevent potential deficiency. Symptoms associated with niacin deficiency, commonly known as pellagra, include dermatitis, weakness, diarrhea, sleep disturbances, and psychiatric disorders [17]. Furthermore, low niacin intake also increases the risk of ocular disease such as glaucoma [18,19]. Dietary sources of niacin include fish, meat, grains, beans, and nuts. Identifying the specific foods predominantly avoided by weight- and body shape-sensitive Res type individuals and addressing dietary practices that may impede the intake of vitamin E and niacin would be necessary.
Potassium intake was significantly lower in NS and Res type individuals than in the Com type. Potassium intake among NS and Res types was evidently below the adequate intake level established for Korean adults (3,500 mg). Potassium is a critical nutrient that plays an essential role in various cellular functions, including maintaining fluid balance and osmotic pressure. A deficiency in dietary potassium, often owing to the inadequate consumption of foods such as fruits, vegetables, grains, dairy products, and meats, might contribute to hypertension and cardiovascular issues [20]. Therefore, individuals with restrained eating or less interest must recognize the importance of maintaining the nutritional balance via alterations to meal composition rather than merely restricting their diet.
The findings of this research provide a basis for considering the characteristic of EBs in nutrition and eating-related health problems. However, it is important to note that the survey conducted in this study neither examined the nutritional supplements and functional foods nor screen for special populations, such as pregnant or breastfeeding women, who may require additional nutrient supplementation. Therefore, further research be needed to compliment these limitations and expected to reveal the association between EB and nutritional problems.
5. Conclusions
This study analyzed the differences in energy and nutrient intakes among Korean adults based on their EB. Considering that the distribution of EB scores and types varied with sex and age, adjustments were implemented. The findings reveal that energy intake is significantly higher in Ext type than Res type. Furthermore, Ext and Com types exhibit a greater tendency to exceed the recommended energy intake, whereas NS and Res types are more prone to energy deficiency. Additionally, the consumption of carbohydrate, lipids, vitamin E, niacin, and potassium varied according to EB type. Ext type is associated with a higher risk of overeating on carbohydrate and lipids, while Res type is associated with potential deficiencies in vitamin E, niacin, and potassium. This study’s findings are meaningful in that they provide quantitative data on energy and nutrient intakes according to EB type; thus they are anticipated to offer novel insights into the relationship between nutritional issues and the EB.
Funding
This research received no external funding
Institutional Review Board Statement
The study was conducted in accordance with the Declaration of Helsinki, and approved by the Institutional Review Board of *** (IRB No. 1040198-230522-HR-061-02 and date of approval: 13, June, 2023).
Informed Consent Statement
Informed consent was obtained from all participants involved in the study.
Data Availability Statement
The data that support the findings of this study are not publicly available due to the data containing information that could compromise participant privacy but are available from the corresponding author on reasonable request.
Conflicts of Interest
The authors declare no conflicts of interest.
References
- Eertmans, A.; Baeyens, F.; Van den Bergh, O. Food likes and their relative importance in human eating behavior: review and preliminary suggestions for health promotion. Health Educ Res, 2001, 16, 443-456. [CrossRef]
- Van Strien, T.; Frijters, J. E.; Bergers, G. P.; Defares, P. B. The Dutch Eating Behavior Questionnaire (DEBQ) for assessment of restrained, emotional, and external eating behavior. Intern J Eat Disord, 1986, 5, 295–315. [CrossRef]
- French, S. A.; Epstein, L. H.; Jeffery, R. W.; Blundell, J. E.; Wardle, J. Eating behavior dimensions. Associations with energy intake and body weight. A review. Appetite, 2012, 59, 541-549. [CrossRef]
- Lee, J.; Hyun, M. H. Research Trends in the Diagnostic Classification of Food Addiction and Future Tasks. Korean J Stress Res, 2022, 30, 187-195. [CrossRef]
- Song, Y. M.; Lee, K. Eating behavior and metabolic syndrome over time. Eat Weight Disord, 2020, 25, 545–552. [CrossRef]
- Yoon, J. M.; Shim, E. J. The Moderating Role of Difficulties in Emotion Regulation in the Relationship between Negative Affect and Binge Eating in Emotional Eaters. Korean J Health Psychol, 2019, 24, 45-68. [CrossRef]
- Sanlier, N.; Navruz Varli, S.; Macit, M. S.; Mortas, H.; Tatar, T. Evaluation of disordered eating tendencies in young adults. Eat Weight Disord, 2017, 22, 623–631. [CrossRef]
- Oh, J.; Kim, S. The relationship between psychological distress, depressive symptoms, emotional eating behaviors and the health-related quality of life of middle-aged korean females: a serial mediation model. BMC Nurs, 2023, 22. [CrossRef]
- Fuente González, C. E.; Chávez-Servín, J. L.; de la Torre-Carbot, K.; Ronquillo González, D.; Aguilera Barreiro, M. D. L. Á.; Ojeda Navarro, L. R. Relationship between Emotional Eating, Consumption of Hyperpalatable Energy-Dense Foods, and Indicators of Nutritional Status: A Systematic Review. J Obesity, 2022, 1, 4243868. [CrossRef]
- Watson, P.; Le Pelley, M. E. A meta-analysis of the relationship between eating restraint, impaired cognitive control and cognitive bias to food in non-clinical samples. Clinic Psychol Rev, 2021, 89, 102082. [CrossRef]
- Yong, C.; Liu, H.; Yang, Q.; Luo, J.; Ouyang, Y.; Sun, M.; Xi, Y.; Xiang, C.; Lin, Q. The relationship between restrained eating, body image, and dietary intake among university students in china: a cross-sectional study. Nutrients, 2021, 13, 990. [CrossRef]
- Kim, H. J.; Lee, I. S.; Kim, J. H. A study of the reliability and validity of the Korean version of the Eating Behavior Questionnaire. Korean J Clin Psychol, 1996, 15, 141-150.
- Kim, S.; Lee, J. S.; Hong, K. H.; Yeom, H. S.; Nam, Y. S.; Kim, J. Y.; Park, Y. K. Development and relative validity of semi-quantitative food frequency questionnaire for Korean adults. J Nutr Health, 2018, 51, 103-119. [CrossRef]
- Ohara, K.; Mase, T.; Kouda, K.; Miyawaki, C.; Momoi, K.; Fujitani, T.; ... Nakamura, H. Association of anthropometric status, perceived stress, and personality traits with eating behavior in university students. Eat Weight Disord, 2019, 24, 521-531. [CrossRef]
- Song, Y. M.; Lee, K.; Sung, J. Genetic and environmental relationships between eating behavior and symptoms of anxiety and depression. Eat Weight Disord, 2019, 24, 887-895. [CrossRef]
- Higgins, M.R.; Izadi, A.; Kaviani, M. Antioxidants and Exercise Performance: With a Focus on Vitamin E and C Supplementation. Int. J. Environ. Res. Public Health 2020, 17, 8452. [CrossRef]
- Ibrahim, M.; Khan, S.; Pathak, S.; Mazhar, M.; Singh, H. Vitamin B-Complex and its Relationship with the Health of Vegetarian People. Natr Resour Human Health, 2023, 3, 342-354. [CrossRef]
- Taechameekietichai, T.; Chansangpetch, S.; Peerawaranun, P.; Lin, S.C. Association between Daily Niacin Intake and Glaucoma: National Health and Nutrition Examination Survey. Nutrients 2021, 13, 4263. [CrossRef]
- Jung, K.I.; Kim, Y.C.; Park, C.K. Dietary Niacin and Open-Angle Glaucoma: The Korean National Health and Nutrition Examination Survey. Nutrients 2018, 10, 387. [CrossRef]
- McLean, R. M.; Wang, N. X. Potassium. Adv Food Nutr Res, 2021, 96, 89-121. [CrossRef]
Figure 1.
Inclusion process of the research participants.
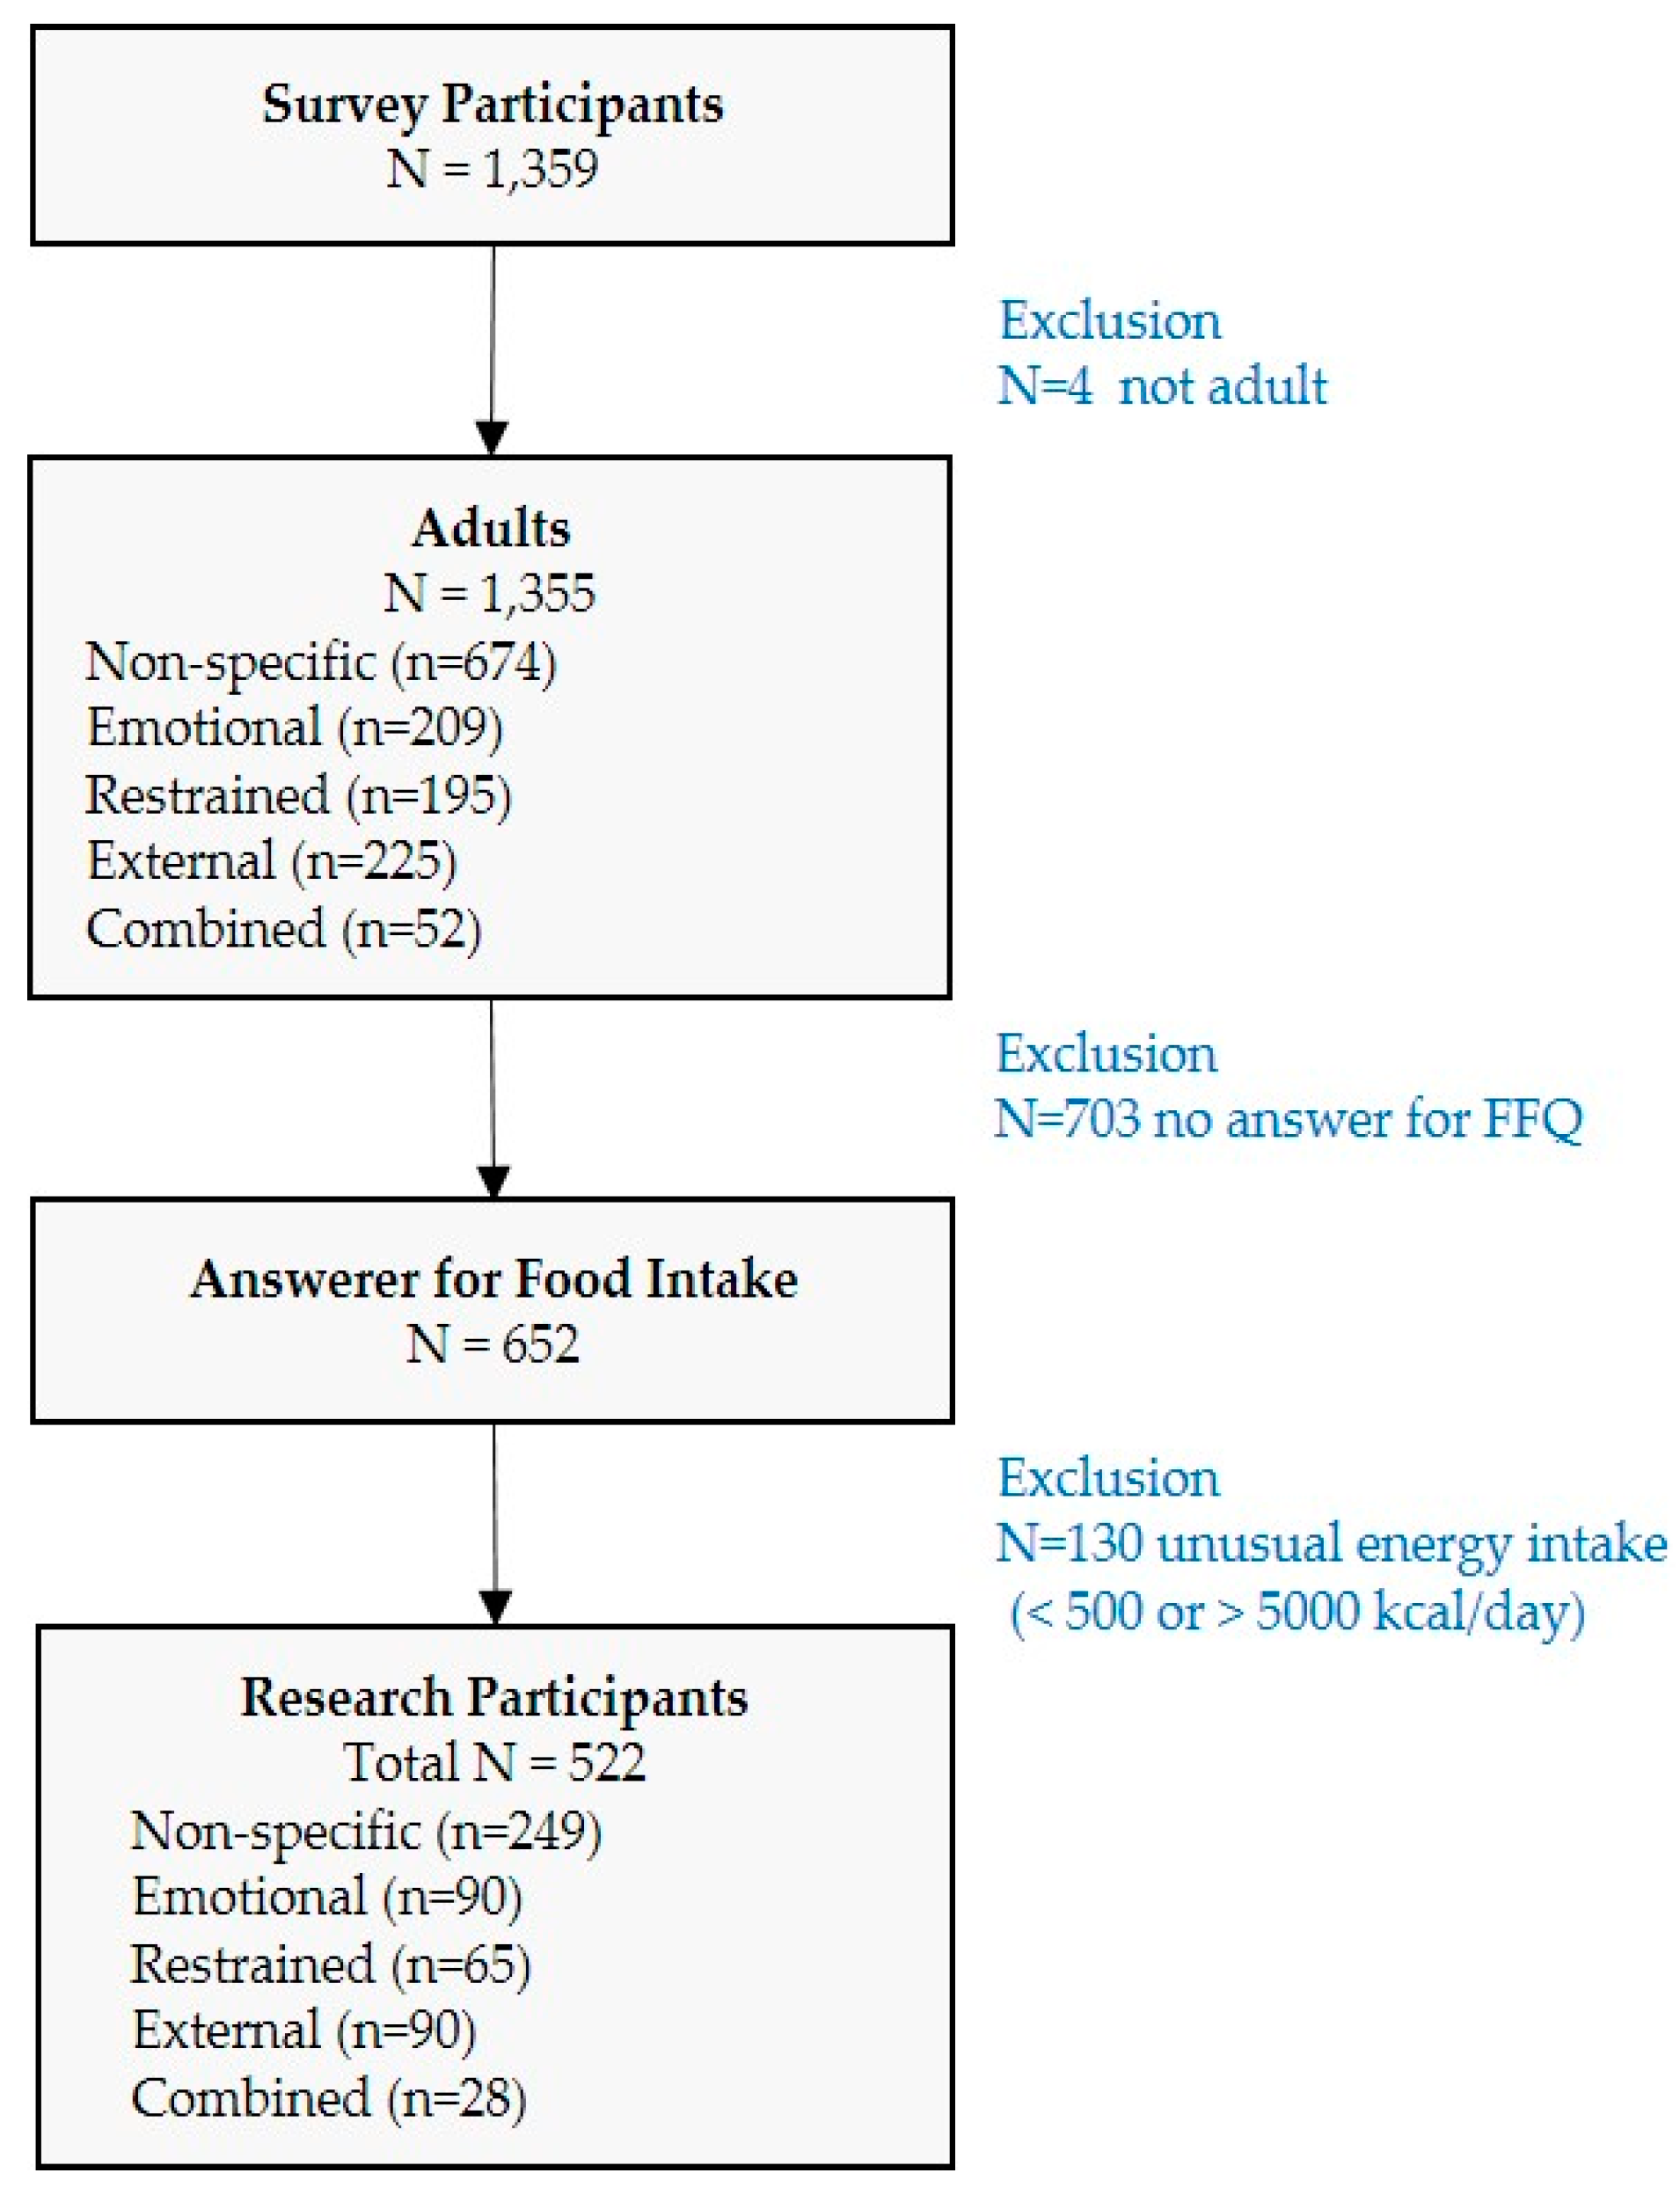
Figure 2.
Difference in energy intake by EB type of Korean adults. The data were presented as the mean ± standard deviation. An analysis of covariance (ANCOVA) was conducted, adjusting for sex and age, followed by Scheffé’s post-hoc test, which indicated a significant difference in the order of means (a < b).
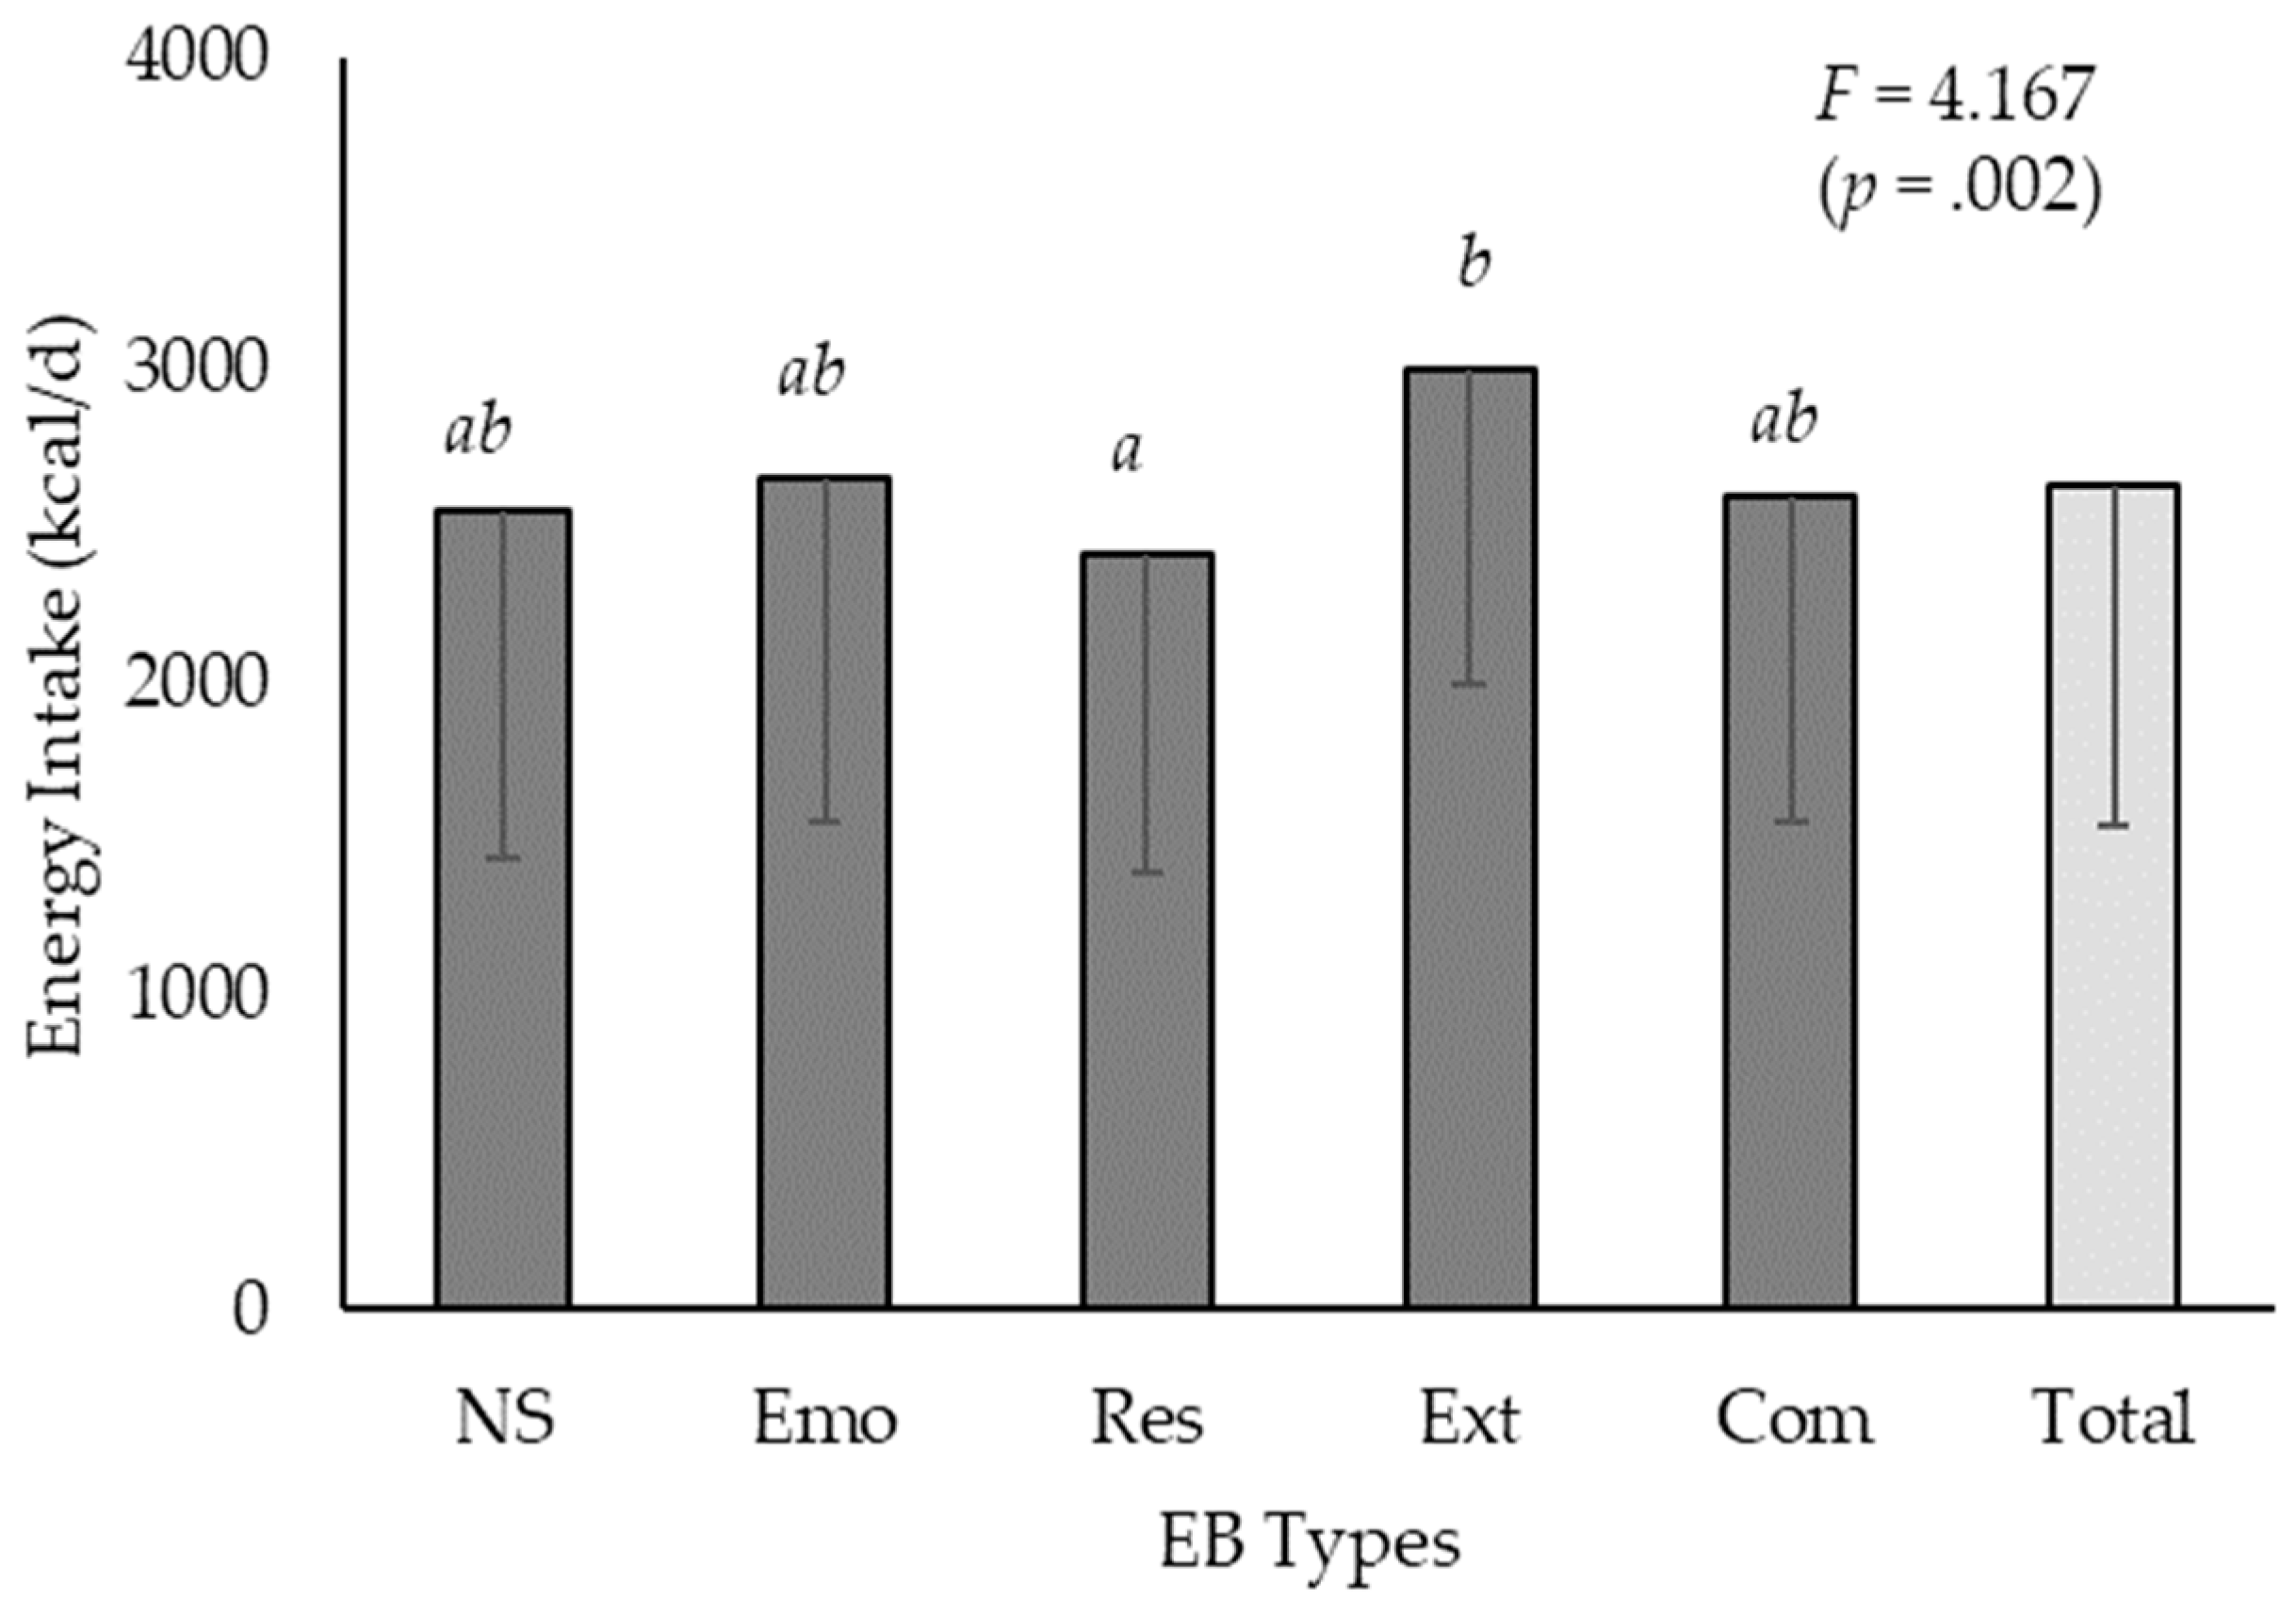

Table 1.
Sex- and Age-Related Differences in EB Scores among Korean Adults.
| Variable | EB Score | |||
|---|---|---|---|---|
| Emotional | Restrained | External | ||
| Total | 25.36 ± 11.89 1) | 22.14 ± 8.46 | 19.24 ± 5.06 | |
| Sex | Male | 22.04 ± 11.18 | 20.09 ± 7.85 | 17.54 ± 5.19 |
| Female | 26.58 ± 11.92 | 22.90 ± 8.56 | 19.87 ± 4.86 | |
| t2)(p) | -3.924 (.000) | -3.400 (.001) | -4.748 (.000) | |
| Age | 19-29 | 26.33 ± 12.42ab | 21.85 ± 8.80ab | 19.44 ± 4.95ab |
| 30’s | 25.09 ± 11.67ab | 21.05 ± 8.40a | 19.64 ± 4.99b | |
| 40’s | 27.01 ± 11.57b | 24.63 ± 7.67b | 19.63 ± 4.80b | |
| 50-64 | 22.09 ± 11.07a | 21.71 ± 8.31ab | 17.76 ± 5.46a | |
| F3)(p) | 3.423 (.017) | 4.063 (.007) | 3.267 (.021) | |
* EB, eating behavior. 1) The data were presented as the mean ± standard deviation. 2) Student t-test 3) ANOVA, Scheffe’s post-hoc test, which indicated a significant difference in the order of means (a < b).
Table 2.
Sex- and Age-Related Differences in Distribution of EB Types among Korean Adults.
| Variable | EB Type | ||||||
|---|---|---|---|---|---|---|---|
| Total | NS | Emo | Res | Ext | Com | ||
| Total | 522 (100) 1) | 249 (47.7) | 90 (17.2) | 65 (12.5) | 90 (17.2) | 28 (5.4) | |
| Sex | Male | 140 (100) | 83 (59.3) | 24 (17.1) | 13 (9.3) | 16 (11.4) | 4 (2.9) |
| Female | 382 (100) | 166 (43.5) | 66 (17.3) | 52 (13.6) | 74 (19.4) | 24 (6.3) | |
| χ2 2)(p) | 12.914 (.012) | ||||||
| Age | 19-29 | 174 (100) | 80 (46.0) | 30 (17.2) | 19 (19.0) | 33 (19.0) | 12 (6.9) |
| 30’s | 153 (100) | 75 (49.0) | 23 (15.0) | 16 (10.5) | 33 (21.6) | 6 (3.9) | |
| 40’s | 104 (100) | 42 (40.4) | 24 (23.1) | 18 (17.3) | 13 (12.5) | 7 (6.7) | |
| 50-64 | 91 (100) | 52 (57.1) | 13 (14.3) | 12 (13.2) | 11 (12.1) | 3 (3.3) | |
| χ2(p) | 15.968 (.193) | ||||||
* EB, eating behavior; NS, non-specific; Emo, emotional; Res, restrained; Ext, external; Com, combined. 1) The data were presented as a number (percentage). 2) Chi-Squared test.
Table 3.
Distribution of Energy Intake Levels by EB Type among Korean Adults.
| EB type | Total | Energy Intake Level | χ2 2) (p) | ||
|---|---|---|---|---|---|
| Deficient | Sufficient1) | Excessive | |||
| Total | 522 (100) 3) | 82 (15.7) | 177 (33.9) | 263 (50.4) | 15.686 (.047) |
| NS | 249 (100) | 47 (18.9) | 87 (34.9) | 115 (46.2) | |
| Emo | 90 (100) | 12 (13.3) | 35 (38.9) | 43 (47.8) | |
| Res | 65 (100) | 11 (16.9) | 25 (38.5) | 29 (44.6) | |
| Ext | 90 (100) | 8 (8.9) | 21 (23.3) | 61 (67.8) | |
| Com | 28 (100) | 4 (14.3) | 9 (32.1) | 15 (53.6) | |
* EB, eating behavior; NS, non-specific; Emo, emotional; Res, restrained; Ext, external; Com, combined. 1) Data was classified as “Sufficient” when it met 75% to 125% of the estimated energy requirements based on sex and age. It was categorized as “Deficient” if it fell below this range, and as “Excessive” if it exceeded this threshold. 2) Chi-Squared Test 3) The data were presented as a number (percentage).
Table 4.
Differences in Energy Intake Ratio by EB Type among Korean Adults.
| EB Type | Energy Intake Ratio | ||
|---|---|---|---|
| Carbohydrate | Lipid | Protein | |
| Total | 59.77 ± 10.42 1) | 24.44 ± 8.46 | 14.52 ± 2.88 |
| NS | 61.08 ± 10.52c | 23.14 ± 8.54a | 14.34 ± 2.97ab |
| Emo | 56.96 ± 11.21ab | 26.81 ± 8.87b | 14.91 ± 3.07ab |
| Res | 58.48 ± 10.74abc | 25.39 ± 8.64ab | 15.15 ± 2.87ab |
| Ext | 60.86 ± 8.33bc | 24.13 ± 6.92ab | 13.90 ± 2.29a |
| Com | 56.56 ± 10.13a | 27.08 ± 8.52b | 15.45 ± 2.55b |
| F2) (p) | 4.048 (.003) | 4.387 (.002) | 3.023 (.018) |
* EB, eating behavior; NS, non-specific; Emo, emotional; Res, restrained; Ext, external; Com, combined. 1) The data were presented as the mean ± standard deviation. 2) The analysis employed ANCOVA, adjusting for sex, age, and total energy intake, followed by Duncan's post-hoc test, which indicated a significant difference in the order of means (a < b < c).
Table 5.
Table 5. Differences in Nutrient Intakes by EB Type of Korean Adults.
| Nutrients | Total | EB Types | F1)(p) | |||||
|---|---|---|---|---|---|---|---|---|
| NS | Emo | Res | Ext | Com | ||||
| Energy | Carbohydrate | 393.1 ± 176.4 2) | 388.4 ± 179.7a | 378.9 ± 179.3a | 354.7 ± 169.3a | 455.3 ± 161.9b | 369.1 ± 60.0a | 2.887 (.022) |
| Lipid | 71.6 ± 40.6 | 65.7 ± 39.9a | 79.0 ± 43.8ab | 68.2 ± 38.0ab | 81.2 ± 38.7b | 77.1 ± 40.0ab | 3.063 (.016) | |
| Protein | 94.9 ± 43.7 | 91.0 ± 44.9 | 98.8 ± 47.2 | 89.8 ± 37.9 | 104.5 ± 40.4 | 99.0 ± 40.5 | 2.227 (.065) | |
| Vitamin | A | 727.0 ± 615.6 | 701.8 ± 602.6 | 741.6 ± 584.9 | 688.0 ± 493.0 | 803.3 ± 773.4 | 749.7 ± 21.9 | .123 (.974) |
| D | 4.4 ± 3.4 | 4.3 ± 3.8 | 4.6 ± 3.3 | 4.0 ± 2.4 | 4.6 ± 2.9 | 4.3 ± 3.1 | .385 (.819) | |
| E | 19.2 ± 9.9 | 18.0 ± 9.9a | 20.2 ± 9.9ab | 17.6 ± 7.6a | 21.4 ± 9.9b | 22.4 ± 12.3b | 2.804 (.025) | |
| K | 173.9 ± 167.1 | 169.1 ± 146.1 | 170.7 ± 159.5 | 158.2 ± 133.5 | 198.1 ± 241.6 | 186.4 ± 145.6 | .160 (.958) | |
| C | 111.9 ± 110.5 | 107.3 ± 110.3 | 119.3 ± 125.0 | 109.5 ± 93.0 | 110.6 ± 99.0 | 139.7 ± 135.4 | 1.291 (.272) | |
| Thiamine | 2.5 ± 1.2 | 2.4 ± 1.2 | 2.6 ± 1.2 | 2.4 ± 1.1 | 2.8 ± 1.2 | 2.6 ± 1.0 | .875 (.478) | |
| Riboflavin | 2.1 ± 1.0 | 2.0 ± 1.1 | 2.2 ± 1.0 | 2.0 ± 1.0 | 2.3 ± 1.0 | 2.2 ± 0.9 | 1.389 (.236) | |
| B6 | 2.8 ± 2.2 | 2.8 ± 2.4 | 3.0 ± 2.2 | 2.5 ± 1.3 | 2.9 ± 2.0 | 2.9 ± 2.1 | 1.169 (.324) | |
| Niacin | 16.4 ± 7.9 | 16.0 ± 8.1ab | 16.8 ± 8.9ab | 14.8 ± 6.0a | 17.5 ± 6.8ab | 18.3 ± 9.0b | 2.997 (.018) | |
| Folic acid | 502.3 ± 230.2 | 482.3 ± 233.0 | 491.7 ± 229.6 | 483.2 ± 201.1 | 566.7 ± 221.3 | 552.5 ± 266.6 | 1.733 (.141) | |
| Mineral | Ca | 513.2 ± 290.3 | 488.9 ± 289.2 | 499.5 ± 267.5 | 508.0 ± 269.9 | 592.6 ± 337.1 | 530.2 ± 217.0 | .669 (.614) |
| P | 1398.5 ± 620.7 | 1344.8 ± 644.7 | 1419.7 ± 634.4 | 1354.8 ± 552.6 | 1539.4 ± 592.6 | 1457.4 ± 552.9 | 1.736 (.141) | |
| Mg | 99.1 ± 60.1 | 95.1 ± 60.1 | 102.1 ± 66.8 | 99.3 ± 54.8 | 102.6 ± 56.0 | 113.5 ± 62.5 | 1.917 (.106) | |
| Na | 3375.2 ± 1886.5 | 3170.3 ± 1853.3 | 3643.9 ± 2195.7 | 3052.4 ± 1450.1 | 3820.7 ± 1902.9 | 3650.9 ± 1639.9 | 1.897 (.110) | |
| K | 3078.5 ± 1495.6 | 2921.2 ± 1491.8a | 3156.0 ± 1634.2ab | 3010.2 ± 1231.7a | 3354.7 ± 1431.5ab | 3498.0 ± 1695.2b | 2.682 (.031) | |
| Fe | 17.7 ± 8.8 | 17.24 ± 8.9 | 18.0 ± 9.8 | 16.6 ± 7.1 | 19.3 ± 9.0 | 18.7 ± 7.9 | 1.015 (.399) | |
| Zn | 13.3 ± 6.3 | 13.1 ± 6.5 | 13.6 ± 7.1 | 12.2 ± 5.1 | 14.6 ± 5.8 | 13.3 ± 6.2 | 1.048 (.382) | |
| Cu | 725.6 ± 409.0 | 693.1 ± 412.4 | 780.7 ± 483.3 | 705.5 ± 345.1 | 743.8 ± 343.5 | 826.3 ± 438.4 | 2.516 (.041) | |
| Mn | 2.6 ± 1.8 | 2.5 ± 1.9 | 2.6 ± 1.9 | 2.6 ± 1.6 | 2.6 ± 1.7 | 2.7 ± 1.5 | 1.146 (.334) | |
| I | 77.2 ± 49.3 | 72.9 ± 51.3 | 76.1 ± 41.9 | 79.7 ± 53.5 | 88.8 ± 47.2 | 76.2 ± 47.1 | .871 (.481) | |
| Se | 82.4 ± 46.6 | 77.1 ± 47.6 | 89.3 ± 53.0 | 78.3 ± 38.4 | 90.1 ± 39.2 | 92.9 ± 49.2 | 2.305 (.057) | |
* EB, eating behavior; NS, non-specific; Emo, emotional; Res, restrained; Ext, external; Com, combined. The units of measurement utilized for various nutrients are as follows: grams (g) for carbohydrates, lipids, and proteins; micrograms of Retinol Activity Equivalent (㎍RAE) for Vitamin A; micrograms (㎍) for Vitamins D and K, folic acid, copper (Cu), iodine (I), and selenium (Se); and milligrams (mg) for thiamine, riboflavin, Vitamin B6, niacin, calcium (Ca), phosphorus (P), magnesium (Mg), sodium (Na), potassium (K), iron (Fe), zinc (Zn), and manganese (Mn). 1) The analysis employed ANCOVA, adjusting for sex, age, and total energy intake, followed by a Duncan post-hoc test (a < b). 2) The data were presented as the mean ± standard deviation.
Disclaimer/Publisher’s Note: The statements, opinions and data contained in all publications are solely those of the individual author(s) and contributor(s) and not of MDPI and/or the editor(s). MDPI and/or the editor(s) disclaim responsibility for any injury to people or property resulting from any ideas, methods, instructions or products referred to in the content. |
© 2024 by the authors. Licensee MDPI, Basel, Switzerland. This article is an open access article distributed under the terms and conditions of the Creative Commons Attribution (CC BY) license (http://creativecommons.org/licenses/by/4.0/).
Copyright: This open access article is published under a Creative Commons CC BY 4.0 license, which permit the free download, distribution, and reuse, provided that the author and preprint are cited in any reuse.


