
Submitted:
04 May 2023
Posted:
05 May 2023
You are already at the latest version
Abstract
Appetitive traits have been associated with eating behaviors and weight in youth. However, the relationships among adults have received less attention. In this study, we measured appetitive traits among 520 female college students from a University in eastern Chinese using the Chinese translated Adults Eating Behavior Questionnaire (C-AEBQ) and found that two food approach traits (food enjoyment and emotional over-eating) were positively while two food avoidance traits (slowness in eating and satiety responsiveness) were negatively associated with BMI. Individual trait was differentially associated with eating behaviors. Specifically, a positive correlation was found between food responsiveness and higher frequency of selecting delivery food, spicy food, and sugared beverage; conversely, satiety responsiveness was associated with higher frequency of skipping meals. Using latent profile analysis, participants were classified into four appetitive patterns: food approacher, food approacher with emotional under-eating, food avoider, and food avoider with emotional over-eating. Food avoiders had significant lower BMI and higher proportion of underweight than other three patterns. Compared to food approacher, food avoiders had higher frequency of skipping breakfast, and food avoiders with emotional over-eating had higher frequency of skipping both breakfast and lunch. No significant differences were observed in food choice and dieting behavior among four appetitive patterns. The findings suggested a correlation between an individual’s appetitive pattern and eating behaviors among female college students, those with food avoidance patterns are more likely to have irregular meals, which may contribute to their low BMI. The findings provide valuable insights for female college students to cultivate a healthy eating behavior and sustain a healthy body weight.
Keywords:
female college student
; appetitive traits
; BMI
; food choice
; meal regularity
; latent profile analysis
1. Introduction
Unhealthy diet has been recognized as one of major modifiable lifestyle risk factors for non-communicable diseases, which are responsible for more than 70% global deaths. Dietary or nutrient intake is the comprehensive consequence of multiple factors related to eating behaviors, including food choice, food preference, eating frequency and eating occasions [1]. Understanding the driving factors of eating behaviors will help to improve dietary quality, prevent unhealthy dietary intake and nutrition-related adverse health outcomes [2].
Appetitive traits, which are typically categorized as food approach traits related to the onset of eating and food avoidance traits related to the termination of eating, represent a collection of innate inherited predispositions in response to external food cues and internal satiety signals [3,4]. Emerging in early life, appetitive traits are the result of a convergence of genetic factors, parental feeding styles and temperament [5,6,7]. According to the behavioral susceptibility model of obesity, appetitive traits interact with environmental factors to influence eating behaviors, including food choice, food intake patterns, energy and nutrients intake, ultimately affecting body weight and nutritional status; individuals who have high responsiveness to food cue and low satiety responsiveness are susceptible to be overeating and excessive weight gain at the current obesogenic environment [8,9].
Appetitive traits at young ages are usually measured using the Child Eating Behavior Questionnaire (CEBQ) and the Baby Eating Behavior Questionnaire (BEBQ). Studies indicated that have shown that over childhood, appetitive traits tend to remain relatively stable throughout childhood, with a tendency towards an increase in food approach traits and a decrease in food avoidance traits as age progresses [3,5]. For the purpose of longitudinal tracking and cross-life stage comparison, the Adult Eating Behavior Questionnaire (AEBQ) was recently developed based on based on CEBQ/BEBQ to assess appetitive traits in adults [10]. The AEBQ also comprises four food approach traits (hunger, food responsiveness, emotional overeating and enjoyment of food) and four food avoidance traits (satiety responsiveness, food fussiness, emotional under-eating and slowness in eating) [10]. Similar to the CEBQ and the BEBQ, the food approach and food avoidance traits the AEBQ exhibited a significant correlation with body mass index (BMI) [10,11,12,13].
There have been studies investigating the relationship between appetitive traits and eating behaviors. For example, enjoyment of food was found to have a positive correlation to vegetable preference in children aged 3-4 years [14] and fruit and vegetable consumption in young adults [15], while food fussiness exhibited a negative associated with fruit intake in both children [14] and young adults [15]. In addition to food preference, a recent study has demonstrated that appetitive traits were related to dietary patterns, specifically, enjoyment of food was positively linked to a healthy dietary pattern and a protein rich-pattern but negatively related to an unhealthy beverage-rich dietary pattern; conversely, food fussiness was negatively associated with the healthy pattern but positively correlated with the less healthy beverage-rich pattern and high-energy pattern [15]. Furthermore, appetitive traits were also reported to be related to eating habits, as a study showing that higher food responsiveness was lined to higher eating frequency; while lower satiety responsiveness was associated with less food intake in young children [16].
University or college students are in the transition period from adolescence to adulthood. At this stage, they start to live independently and assume greater responsibility for their daily habits, including dietary choice. However, the specific food environment on campus, characterized with relatively less food options, an abundance of take-out food choice, as well as frequent eating-out opportunities, increases the risk of developing unhealthy eating behaviors [17], which might lead to over-eating [18] and excess weight gain [19,20]. At the same time, female students might be at higher risk of developing unhealthy dieting behavior and even eating disorders [21], due to the sociocultural pressure for women to maintain thinness, which can lead to body dissatisfaction and body image anxiety [22,23,24]. Given that appetitive traits are related to multiple aspects of eating behaviors, investigating their interrelationships in this specific population would facilitate the promotion of healthy dietary habits and the prevention of adverse health outcomes in the later life.
In this study we investigated the association between appetitive traits and eating behaviors among female students from a university in eastern China; using the latent profile analysis (LPA) method, we further identified four appetitive patterns based on their appetitive traits, and compared differences in eating behaviors across these patterns. We hypothesized that appetitive traits were linked to eating behaviors including food choice, eating habits and dieting behavior in this group of samples; moreover, individuals with distinct appetitive patterns may exhibit divergent eating behaviors.
2. Materials and Methods
The cross-sectional study was approved by the ethics committee of Hangzhou Normal University and was conducted in early 2022.
2.1. Participants and recruitment
Female students who were enrolled as full-time undergraduate/graduate students at the public university in eastern China and were willing to participant the survey were eligible for recruitment. Participants were recruited through convenient sampling from January to February 2022 and provided written informed consent. Paper questionnaires were distributed and filled by participants with the guidance of investigators.
2.2. Data collection
2.2.1. Appetitive traits
Appetitive traits were measured using the Chinese version of the Adult Eating Behavior Questionnaire (AEBQ) [13]. The AEBQ was a self-rating scale containing 35 questions measuring four food approach traits (hunger, food responsiveness, emotional over-eating, and enjoyment of food) and four food avoidance traits (satiety responsiveness, emotional under-eating, food fussiness, and slowness in eating) [10]. The Chinese version of AEBQ has been validated and been shown to be a sound measure of appetitive traits in Chinese young adults [13].
2.2.2. BMI and eating behaviors
The body mass index (BMI) was calculated according to self-reported height and weight. Participants were categorized as underweight, normal weight and overweight/obesity if their BMI was less than 18.5 kg/m2, between 18.5 kg/m2 and 24 kg/m2, and higher than 24 kg/m2 respectively, according the criterion for Chinese population [25]. Participants’ eating behaviors, including the intake frequencies of fruits, dairy products, sugared beverages, spicy food, spicy snacks and delivered food, frequencies of skipping meals, and whether they had dieting experience in the past six months were collected. For frequency, less than or equal to once a week was defined as rare, 2-3 times a week as occasional, and more than 3 times a week as often.
2.3. Data analysis
2.3.1. The latent profile analysis
To identify the classes with similar appetitive characteristics, the latent profile analysis (LPA) [26] was performed based on scores of eight appetitive traits using the Mplus 8.3 software with the robust Maximum Likelihood Estimator (MLR). Analyses were performed with one to five cluster models that were run until the best-fitting number of profiles was found. Model fit statistics are based on model fit indices including the Akaike information criterion (AIC), Bayesian information criterion (BIC), sample-size-adjusted Bayesian information criterion (aBIC), Lo–Mendell–Rubin (LMR) likelihood ratio test, bootstrapped likelihood ratio test (BLRT), and entropy value. Lower values on AIC, BIC, and aBIC suggested a better model fit, and significant p-values (< 0.05) for the LMR and BLRT indicated a better model fit for the k profile model than the k-1 profile model. The entropy value (ranging between 0 and 1) was used to measure the precision of classification and a higher score indicated greater accuracy. The final model selection was based on goodness of model fit indices, parsimony, and the interpretability of the model. After identifying the number of profiles, participants were assigned to a profile based on their highest likelihood.
2.3.2. Statistical analysis
Descriptive statistics and test for difference were conducted with IBM SPSS 23.0 software. Pearson correlation was used to correlate appetitive traits and BMI. Spearman correlation was used to test the associations between appetitive traits and eating behaviors. Chi-square test or analysis of variance with post hoc test were used to test the differences among appetitive patterns clustered by LPA. Logistic regression was used to analyze the relationship between different appetitive patterns and eating behaviors. The statistical significance was p < 0.05.
3. Results
3.1. Descriptive statistics
A total of 520 female college students were recruited in the study. Table 1 shows the demographic characteristics, eating behaviors and mean scores of eight appetitive traits of the participants. The mean age of the participants was 21.21.7 years (range from 18-29 years), and 89.04% were undergraduate students. The BMIs ranged from 14.0 kg/m2 to 29.4 kg/m2, with 27.1% of participants being underweight and 7.3% being overweight or obese. There was a high proportion of participants liking spicy food (31.54% for often eating a spicy meal and 17.88% for spicy snacks) and a substantial high proportion regularly eating delivered food (30.58%); on the contrast, only 11.73% and 13.08% of participants regularly consumed fruits and dairy, two classes of food regarded as healthy. 21.35% of participants had dieting experience in the past six months.
3.2. Correlation of appetitive traits with BMI
Among eight appetitive traits, enjoyment of food scored highest (4.37±0.70), while scores of other traits ranged from 2.46 (food fussiness) to 3.08 (food responsiveness) (Table 2). Positive inter-correlations existed among four food approach traits (enjoyment of food, emotional over-eating, food responsiveness and hunger); for food avoidance traits, only satiety responsiveness was significantly related to other three traits (food fussiness, emotional under-eating and slowness in eating); significant negative correlations were found between most of food approach and food-avoidance traits except for slowness in eating (Table 2).
BMI was positively associated with two food approach traits, food enjoyment (r = 0.16, p < 0.01) and emotional overeating (r = 0.11, p = 0.01), and negatively associated with two food avoidance traits, slowness in eating (r = -0.20, p < 0.01) and satiety responsiveness (r = -0.24, p < 0.01). No significant association were found between BMI and other appetitive traits, including hunger, food responsiveness, emotional under-eating or food fussiness (Table 2).
3.3. Correlation of appetitive traits with eating behaviors
Table 3 showed the Spearman correlation between appetitive traits and eating behaviors. Among food approach traits, food responsiveness was positively associated with higher intake frequency of delivered food (r = 0.16, p < 0.01), spicy meal (r = 0.24, p < 0.01) and snacks (r = 0.24, p < 0.01) and sugared beverages (r = 0.11, p = 0.01), enjoyment of food was positively related to spicy meal (r = 0.14, p < 0.01) while emotional overeating was positively related to spicy snacks (r = 0.09, p = 0.04), and hunger was associated with higher frequency of spicy food (meal: r = 0.11, p = 0.01; snacks: r = 0.12, p = 0.01) intake. Among food avoidance traits, food fussiness was associated with higher intake frequency of fruits (r = 0.13, p < 0.01) and dairy products (r = 0.09, p = 0.05), emotional under-eating was positively related to the intake frequency of dairy products (r = 0.10, p = 0.03), and satiety responsiveness was positively correlated with more intake of sugared beverages (r = 0.10, p = 0.02). For meal regularity, higher frequency of skipping breakfast and lunch was positively related to satiety responsiveness (r = 0.12, p = 0.01 for breakfast and r = 0.15, p < 0.01 for lunch), and negatively related to enjoyment of food (r = -0.12, p = 0.01 for breakfast and r = -0.20, p < 0.01 for lunch); while frequency of skipping dinner was only significantly associated with satiety responsiveness (r = 0.11, p = 0.02). Emotional over-eating was the only appetitive trait shown to correlated to dieting behavior (r = 0.10, p = 0.02).
3.4. LPA of appetitive traits
3.4.1. Selection of best-fit model
Indices of model fit were shown in Table 4. The values of AIC, BIC and aBIC all decreased as the number of clusters increased from 1 to 5. Entropy reached its maximum when five clusters were fit in the model, but in this model the LMR was not significant (p = 0.545). According to the comprehensive judgment of all fitting indicators, the four-cluster model provided the most optimal model-to-data fit to the sample data. Individual cases were then assigned to latent profile groups using standard-modal classification.
3.4.2. Characteristics of the latent patterns
Clusters identified by LPA were labeled as four different appetitive patterns, which were food approacher (cluster 1), food approacher with emotional under-eating (cluster 2), food avoider (cluster 4) and food avoider with emotional over-eating (cluster 3), respectively. Figure 1 showed the differences in average scores of eight traits between each cluster and the full sample. For the pattern of food approacher (n=137; 26.4%), the mean scores of all four food approach traits were higher than the average scores of those traits in full sample, and the mean scores of all four food avoidance traits were lower than those in full sample. For the pattern of food approacher with emotional under-eating (n=102; 21.2%), except that the mean score of emotional overeating was lower and the mean score of emotional undereating was higher than the mean scores in full sample, other characteristics were similar with those of food approacher. For the pattern of food avoider (n=167; 30.3%), the mean scores of all four food avoidance traits were higher than the average scores of those traits in full sample, and the mean scores of all four food approach traits were lower than those in full sample. For the pattern of food avoidance with emotional over-eating (n=114; 22.2%), except that the mean score of emotional undereating was lower and the mean score of emotional overeating was higher than the scores in full sample, other characteristics were similar with those of food avoider. Table 5 shows the comparison in scores of eight appetitive traits among participants in different patterns. Except for slowness in eating (p = 0.10), the average scores of other appetitive traits were significantly different among patterns (p < 0.01).
3.5. Comparison of BMI among different pattern of appetitive traits
As shown in Table 6, no significant difference in BMI was found among food approachers, food approachers with emotional under-eating and food avoiders with emotional over-eating, while food avoiders had significantly lower BMI as compared with other three patterns (p < 0.01). The proportion of underweight in food avoiders were higher and the proportion of overweight/obese were lower than those in other patterns (p = 0.02).
3.6. Comparison of eating behaviors among different pattern of appetitive traits
No statistical significance in the intake frequency of fruits, dairy products, beverages, cold food, spicy food or take-out food, as well as the frequency of skipping dinner were found among four appetitive patterns (data no shown); However, there were significant differences in the frequency of skipping breakfast and lunch as well as the dieting behavior in the past six months among four appetitive patterns (Table 7).
Logistic regression analysis was carried out to examine the association between appetitive patterns and the behaviors of skipping meals (Table 8). After adjustment for BMI, food avoiders had 88% higher frequency of occasionally or often skipping breakfast, as compared with food approachers (OR = 1.88, 95% CI: 1.19 - 2.97; p = 0.01). Similarly, food avoiders with emotional over-eating has higher frequency of occasionally or often skipping breakfast (OR = 1.90, 95% CI: 1.14 - 3.15; p = 0.01) and lunch (OR = 3.11, 95% CI: 1.06 - 9.10; p = 0.04) when compared with food approachers.
As for dieting behavior, logistic regression showed that BMI was positively correlated with recent dieting behavior (OR = 1.19, 95% CI: 1.09 - 1.30; p = 0.01), and food avoiders had lower risk of performing dieting as compared with food approachers (OR = 0.52, 95%CI: 0.29 - 0.91; p = 0.02). However, after adjusting for BMI, the difference in dieting behavior was no longer significant between tow patterns (OR = 0.61, 95%CI: 0.34 - 1.10; p = 0.10) (Table 9).
4. Discussion
Appetitive traits have shown to be associated with BMI and affect eating behaviors, such as food choice and food intake pattern in young children in numerous studies [8,9]; however, only a few studies have investigated the association between appetitive traits and BMI in adults and it remains unknown how these traits affect individual’s eating behavior. In this study we demonstrated that among female college students enjoyment of food and emotional over-eating, two traits of food approach were positively, while slowness in eating and satiety responsiveness, two food avoidance traits were negatively associated with BMIs. We further showed that individual trait was differentially associated with eating behaviors. Specifically, food approach traits such as food responsiveness and hunger were more strongly related to food choice, while food avoidance traits, particularly satiety responsiveness, were more closely related to meal regularity. When categorizing participants into different patterns based on eight appetitive traits using the LPA method, we observed that those with different patterns differed in BMIs and varied in their meal regularity. however, appetitive pattern might not be a factor affecting individual’s dieting behavior, which was largely related to individual’s BMI.
The adult eating behavior questionnaire (AEBQ) was initially developed by Hunot et al. to assess appetitive traits among British adults, in which it was shown that, except for hunger and fussy eating, food approach traits were positively and food avoidance traits were negatively correlated with BMI [10]. The validation of the Chinese version of AEBQ was conducted by He et al. [13], who reported that while food approach traits were not significantly associated with BMI, food avoidance traits such as satiety responsiveness, fussy eating and slowness in eating exhibited a negative correlation with BMI among a sample of Chinese college students [13]. In this study we discovered a positive correlation between enjoyment of food and emotional over-eating with BMI and a negative correlation between slowness in eating and satiety response with BMI in female college students at a university located in eastern China. All three studies consistently showed a negative correlation between two food avoidance traits, namely slowness in eating and satiety responsiveness, and BMI, but the association between food approach traits and BMI was not entirely consistent. Difference in age and gender composition may be important factors accounting for the discrepancies observed across the three studies. Our study was limited to female students, whereas He’s study included both male and female students [13], and Hunot's study had a wider age range and both genders represented (67% were over 30 years old) [10]. In addition, the correlation between appetitive traits and BMI may also be influenced by BMI distributions. The majority of participants in this study were normal weight or underweight, with only 7.3% were classified as overweight or obese; in contrast, over 45% of Hunot's study population were categorized as overweight or obese [10].
Appetitive traits have been associated with eating behaviors in children. However, the relationship between appetitive traits, which despite the relative stability, might change with age, and eating behaviors in adults remains largely unknown. In this study, we focused on several food types that are considered healthy (i.e. fruits and dairy products) or unhealthy (i.e. sugared beverage), as well as some foods that are frequently consumed by college students. In generally, food approaching traits showed more closely relative to food choice than food avoidance traits in female college students. For particular food types, we observed a negative association between fruit intake and food fussiness, which was in consistence with previous finding in children [14,27] and young adults [15]. We also found that higher consumption of spicy food (including spicy meal and snack) was generally associated with higher scores of food approaching traits. There has been controversial regarding the impact of spicy food on dietary intake and body weight [28], however, several studies in Chinese population have indicated a positive correlation between spicy food consumption and the risk of obesity [29,30,31,32]. Spicy cuisine has gained increasing popularity in in China in recent years, our results suggest individuals with higher food approaching traits may be at a higher risk of gaining excessive weight in this particular food environment. Meanwhile, we also showed that sugared beverage intake was positively related to food responsiveness and satiety responsiveness, intake of dairy products was negatively related to enjoyment of food but positively related to food fussiness, while the consumption of delivered food, which also very popular on university campus, was positively related with food responsiveness. All these findings warrant further investigation considering the influence of and dietary culture and specific population.
The LPA is an individual-centered analytical method that takes into account both group heterogeneity and individual differences. Using the LPA, subjects can be divided into different homogenous subgroups based on the combination of multiple individual characteristics [26]. The method has been widely used in studies related to dietary intake and eating behavior [33,34]. In this study, female college students were assigned into four subgroups: food approachers, food avoiders, food approachers with emotional under-eating, and food avoiders with emotional over-eating based on their appetitive patterns identified by the LPA. These subgroups respectively reflected two clusters of individuals who were highly responsive to food cues and easy to start eating (food approachers) and highly responsive to satiety signals and easy to stop eating (food avoiders) and the two clusters of individuals whose eating behaviors were susceptible to be affected by emotion. By the same method, Coakley et al. divided American college students into four subgroups, namely moderate eaters, food approach and avoiders, food approachers and food avoiders based on their appetitive traits measured using the AEBQ [34]. The difference in appetitive patterns classified by the LPA in these two studies might be attributed to the different distribution of gender, age and BMI. In our study, emotional eating is an important factor for cluster classification, underscoring the pivotal role of emotion in shaping female college students' eating behavior, which has been suggested by previous studies [35,36]. Emotional eating is a form of disordered eating behavior, characterized by the consumption of excessive or insufficient amounts of food in response to negative emotions such as depression, anxiety, anger, and stress [37], and has been found to be associated with BMI and weight gain during 2-year or even 20-year follow-up [38].
When comparing the difference in BMI across appetitive patterns, it was shown that food avoiders had significant lower BMI than food approachers, food approachers with emotional under-eating, and food avoiders with emotional over-eating, while there was no difference among the later three patterns. At the same time, the results also indicated that the proportion of overweight/obesity was lower and that of underweight was higher in food avoiders. Compared with the other three patterns, food avoiders had the lowest scores on food approach traits and the highest scores on food avoidance traits such as food fussiness and satiety responsiveness, suggesting that this group had a low food cue response to initiate eating behavior and a high satiety responsiveness to stop eating, which might result in less energy intake and a lower BMI. Interestingly, although food avoiders with emotional over-eating also had higher scores on satiety responsiveness, their BMIs did not differ from those with food approach traits, which might be explained by the emotional over-eating, a risk factor for weight gain and an important impeder for losing weight in female [39].
Although studies have related individual appetitive traits to eating behaviors, none have investigated the comprehensive impact of these traits on an individual’s eating behaviors. In this study, we found that individuals with different appetitive patterns did not differ in frequency of specific food consumption. However, female college students with food avoidance patterns (food avoiders and food avoiders with emotional over-eating) were shown to have higher risk of skipping breakfast or lunch than those with food approach patterns, while no difference in risk of skipping dinner was found among four appetitive patterns. In addition, adjustment for BMI did not modulate the association between appetitive patterns and meal regularity. These results suggested that the appetitive pattern characterized with high satiety responsiveness might be a decisive factor for individual’s meal skipping and thereby lower BMI, while individual’s BMI might not be a factor relating to individual’s meal regularity. On the contrary, appetitive pattern might not related to individual’s dieting behavior, as indicated by the negative association between food avoiders and dieting behaviors became insignificant after adjusting for BMI, a risk factor for dieting behavior.
To the best of our knowledge, this study is the first to report the relationship between appetitive pattern and eating behaviors. However, this study is subject to certain limitations. Firstly, the study sample was limited to women from a single university with generally low BMI levels, which restricts the generalizability of the findings to other populations. Secondly, the questionnaire design limitation prevented further analysis of varying intake levels of specific food, nutrients and energy among participants with different appetitive patterns. Furthermore, bias of BMI might exist since the value was calculated based on self-reported height and weight. Finally, the nature of cross-sectional design can only infer the correlation between appetitive pattern and BMI, the dynamic effects of appetitive pattern on BMI or weight change during the college years, which have more significant impact on health, cannot be caught in this study. Nevertheless, the findings do offer significant insights that warrant further exploration.
5. Conclusions
In summary, the results of this study suggest a correlation between an individual’s appetitive pattern and eating behaviors in female college students. Specifically, female students with food avoidance traits are more likely to have irregular meals, which may contribute to their low BMI. The findings provide valuable insights for female college students to cultivate a healthy eating behavior and sustain a healthy body weight.
Author Contributions
Conceptualization, J.L. and F.L.; methodology, Y.C. and S.H.; investigation, J.L., L.W. and A.T.; data curation, J.L., A.T and Y.D.; writing—original draft preparation, J.L.; writing—review and editing, X.Y., X.X., X.F. and F.L. All authors have read and agreed to the published version of the manuscript.
Funding
This research received no external funding.
Institutional Review Board Statement
The study was conducted in accordance with the Declaration of Helsinki, and approved by the ethics committee of Hangzhou Normal University School of Public Health in January 2022 (protocol code 2022008).
Informed Consent Statement
Informed consent was obtained from all subjects involved in the study.
Conflicts of Interest
The authors declare no conflict of interest.
References
- Marijn Stok, F.; Renner, B.; Allan, J.; Boeing, H.; Ensenauer, R.; Issanchou, S.; Kiesswetter, E.; Lien, N.; Mazzocchi, M.; Monsivais, P. , et al. Dietary Behavior: An Interdisciplinary Conceptual Analysis and Taxonomy. Front Psychol 2018, 9, 1689. [Google Scholar] [CrossRef]
- Liu, K.; Daviglus, M.L.; Loria, C.M.; Colangelo, L.A.; Spring, B.; Moller, A.C.; Lloyd-Jones, D.M. Healthy lifestyle through young adulthood and the presence of low cardiovascular disease risk profile in middle age: the Coronary Artery Risk Development in (Young) Adults (CARDIA) study. Circulation 2012, 125, 996–1004. [Google Scholar] [CrossRef]
- Ashcroft, J.; Semmler, C.; Carnell, S.; van Jaarsveld, C.H.; Wardle, J. Continuity and stability of eating behaviour traits in children. Eur J Clin Nutr 2008, 62, 985–990. [Google Scholar] [CrossRef]
- Carnell, S.; Wardle, J. Appetitive traits and child obesity: measurement, origins and implications for intervention. Proc Nutr Soc 2008, 67, 343–355. [Google Scholar] [CrossRef]
- Llewellyn, C.H.; van Jaarsveld, C.H.; Johnson, L.; Carnell, S.; Wardle, J. Nature and nurture in infant appetite: analysis of the Gemini twin birth cohort. Am J Clin Nutr 2010, 91, 1172–1179. [Google Scholar] [CrossRef]
- Scaglioni, S.; Arrizza, C.; Vecchi, F.; Tedeschi, S. Determinants of children's eating behavior. Am J Clin Nutr 2011, 94, 2006S–2011S. [Google Scholar] [CrossRef]
- Maillet, M.A.; Grouzet, F.M.E. Understanding changes in eating behavior during the transition to university from a self-determination theory perspective: a systematic review. J Am Coll Health 2021, 1-18. [CrossRef]
- Carnell, S.; Benson, L.; Pryor, K.; Driggin, E. Appetitive traits from infancy to adolescence: using behavioral and neural measures to investigate obesity risk. Physiol Behav 2013, 121, 79–88. [Google Scholar] [CrossRef]
- Llewellyn, C.; Wardle, J. Behavioral susceptibility to obesity: Gene-environment interplay in the development of weight. Physiol Behav 2015, 152, 494–501. [Google Scholar] [CrossRef]
- Hunot, C.; Fildes, A.; Croker, H.; Llewellyn, C.H.; Wardle, J.; Beeken, R.J. Appetitive traits and relationships with BMI in adults: Development of the Adult Eating Behaviour Questionnaire. Appetite 2016, 105, 356–363. [Google Scholar] [CrossRef]
- Mallan, K.M.; Fildes, A.; de la Piedad Garcia, X.; Drzezdzon, J.; Sampson, M.; Llewellyn, C. Appetitive traits associated with higher and lower body mass index: evaluating the validity of the adult eating behaviour questionnaire in an Australian sample. Int J Behav Nutr Phys Act 2017, 14, 130. [Google Scholar] [CrossRef]
- Cohen, T.R.; Kakinami, L.; Plourde, H.; Hunot-Alexander, C.; Beeken, R.J. Concurrent Validity of the Adult Eating Behavior Questionnaire in a Canadian Sample. Front Psychol 2021, 12, 779041. [Google Scholar] [CrossRef]
- He, J.; Sun, S.; Zickgraf, H.F.; Ellis, J.M.; Fan, X. Assessing Appetitive Traits Among Chinese Young Adults Using the Adult Eating Behavior Questionnaire: Factor Structure, Gender Invariance and Latent Mean Differences, and Associations With BMI. Assessment 2021, 28, 877–889. [Google Scholar] [CrossRef]
- Fildes, A.; Mallan, K.M.; Cooke, L.; van Jaarsveld, C.H.; Llewellyn, C.H.; Fisher, A.; Daniels, L. The relationship between appetite and food preferences in British and Australian children. Int J Behav Nutr Phys Act 2015, 12, 116. [Google Scholar] [CrossRef]
- Dubois, L.; Bedard, B.; Goulet, D.; Prud'homme, D.; Tremblay, R.E.; Boivin, M. Eating behaviors, dietary patterns and weight status in emerging adulthood and longitudinal associations with eating behaviors in early childhood. Int J Behav Nutr Phys Act 2022, 19, 139. [Google Scholar] [CrossRef]
- Syrad, H.; Johnson, L.; Wardle, J.; Llewellyn, C.H. Appetitive traits and food intake patterns in early life. Am J Clin Nutr 2016, 103, 231–235. [Google Scholar] [CrossRef]
- Gonzales, R.; Laurent, J.S.; Johnson, R.K. Relationship Between Meal Plan, Dietary Intake, Body Mass Index, and Appetitive Responsiveness in College Students. J Pediatr Health Care 2017, 31, 320–326. [Google Scholar] [CrossRef]
- Imamura, F.; Micha, R.; Khatibzadeh, S.; Fahimi, S.; Shi, P.; Powles, J.; Mozaffarian, D.; Global Burden of Diseases, N.; Chronic Diseases Expert, G. Dietary quality among men and women in 187 countries in 1990 and 2010: a systematic assessment. Lancet Glob Health 2015, 3, e132–142. [Google Scholar] [CrossRef]
- Lacaille, L.J.; Dauner, K.N.; Krambeer, R.J.; Pedersen, J. Psychosocial and environmental determinants of eating behaviors, physical activity, and weight change among college students: a qualitative analysis. J Am Coll Health 2011, 59, 531–538. [Google Scholar] [CrossRef]
- Gropper, S.S.; Simmons, K.P.; Connell, L.J.; Ulrich, P.V. Changes in body weight, composition, and shape: a 4-year study of college students. Appl Physiol Nutr Metab 2012, 37, 1118–1123. [Google Scholar] [CrossRef]
- Yan, J.; Su, H.; Li, C. Effect of body dissatisfaction on binge eating behavior of Chinese university students: A moderated mediation model. Front Psychol 2022, 13, 995301. [Google Scholar] [CrossRef]
- Wang, K.; Liang, R.; Ma, Z.L.; Chen, J.; Cheung, E.F.C.; Roalf, D.R.; Gur, R.C.; Chan, R.C.K. Body image attitude among Chinese college students. Psych J 2018, 7, 31–40. [Google Scholar] [CrossRef]
- Han, W.; Zheng, Z.; Zhang, N. Three Mediating Pathways of Anxiety and Security in the Relationship between Coping Style and Disordered Eating Behaviors among Chinese Female College Students. Neural Plast 2021, 2021, 7506754. [Google Scholar] [CrossRef]
- Hao, M.; Fang, Y.; Yan, W.; Gu, J.; Hao, Y.; Wu, C. Relationship between body dissatisfaction, insufficient physical activity, and disordered eating behaviors among university students in southern China. BMC Public Health 2022, 22, 2054. [Google Scholar] [CrossRef]
- Zhou, B.F. Effect of body mass index on all-cause mortality and incidence of cardiovascular diseases--report for meta-analysis of prospective studies open optimal cut-off points of body mass index in Chinese adults. Biomed Environ Sci 2002, 15, 245–252. [Google Scholar]
- Spurk, D.; Hirschi, A.; Wang, M.; Valero, D.; Kauffeld, S. Latent profile analysis: A review and "how to" guide of its application within vocational behavior research. J Vocat Behav 2020, 120. [Google Scholar]
- Rodenburg, G.; Kremers, S.P.; Oenema, A.; van de Mheen, D. Associations of children's appetitive traits with weight and dietary behaviours in the context of general parenting. PLoS One 2012, 7, e50642. [Google Scholar] [CrossRef]
- Siebert, E.; Lee, S.Y.; Prescott, M.P. Chili pepper preference development and its impact on dietary intake: A narrative review. Front Nutr 2022, 9, 1039207. [Google Scholar] [CrossRef]
- Yang, X.; Tang, W.; Mao, D.; Liu, X.; Qian, W.; Dai, Y.; Chen, L.; Ding, X. Spicy food consumption is associated with abdominal obesity among Chinese Han population aged 30-79 years in the Sichuan Basin: a population-based cross-sectional study. BMC Public Health 2022, 22, 1881. [Google Scholar] [CrossRef]
- Yang, K.; Li, Y.; Xue, Y.; Wang, L.; Liu, X.; Tu, R.; Dong, X.; Mao, Z.; Li, W.; Wang, C. Association of the frequency of spicy food intake and the risk of abdominal obesity in rural Chinese adults: a cross-sectional study. BMJ Open 2019, 9, e028736. [Google Scholar] [CrossRef]
- Sun, D.; Lv, J.; Chen, W.; Li, S.; Guo, Y.; Bian, Z.; Yu, C.; Zhou, H.; Tan, Y.; Chen, J. , et al. Spicy food consumption is associated with adiposity measures among half a million Chinese people: the China Kadoorie Biobank study. BMC Public Health 2014, 14, 1293. [Google Scholar] [CrossRef]
- Yang, K.; Li, Y.; Mao, Z.; Liu, X.; Zhang, H.; Liu, R.; Xue, Y.; Tu, R.; Liu, X.; Zhang, X. , et al. Relationship between spicy flavor, spicy food intake frequency, and general obesity in a rural adult Chinese population: The RuralDiab study. Nutr Metab Cardiovasc Dis 2018, 28, 252–261. [Google Scholar] [CrossRef]
- Bishop, N.J.; Zuniga, K.E.; Ramirez, C.M. Latent profile analysis of dietary intake in a community-dwelling sample of older Americans. Public Health Nutr 2020, 23, 243–253. [Google Scholar] [CrossRef]
- Coakley, K.E.; Lardier, D.T.; Le, H.; Wilks, A. Food approach and avoidance appetitive traits in university students: A latent profile analysis. Appetite 2022, 168, 105667. [Google Scholar] [CrossRef]
- Peneau, S.; Menard, E.; Mejean, C.; Bellisle, F.; Hercberg, S. Sex and dieting modify the association between emotional eating and weight status. Am J Clin Nutr 2013, 97, 1307–1313. [Google Scholar] [CrossRef]
- Sutton, C.A.; L'Insalata, A.M.; Fazzino, T.L. Reward sensitivity, eating behavior, and obesity-related outcomes: A systematic review. Physiol Behav 2022, 252, 113843. [Google Scholar] [CrossRef]
- Gonzalez, C.E.F.; Chavez-Servin, J.L.; de la Torre-carbot, K.; Gonzalez, D.R.; Barreiro, M.d.l.A.A.; Navarro, L.R.O. Relationship between Emotional Eating, Consumption of Hyperpalatable Energy-Dense Foods, and Indicators of Nutritional Status: A Systematic Review. Journal of Obesity 2022, 2022. [Google Scholar] [CrossRef]
- Benard, M.; Bellisle, F.; Etile, F.; Reach, G.; Kesse-Guyot, E.; Hercberg, S.; Peneau, S. Impulsivity and consideration of future consequences as moderators of the association between emotional eating and body weight status. Int J Behav Nutr Phys Act 2018, 15, 84. [Google Scholar] [CrossRef]
- Ayyildiz, F.; Akbulut, G.; Karacil Ermumcu, M.S.; Acar Tek, N. Emotional and intuitive eating: an emerging approach to eating behaviours related to obesity. J Nutr Sci 2023, 12, e19. [Google Scholar] [CrossRef]
Figure 1.
The comparison of average scores of eight traits between each cluster identified by LPA and the full sample.
Figure 1.
The comparison of average scores of eight traits between each cluster identified by LPA and the full sample.
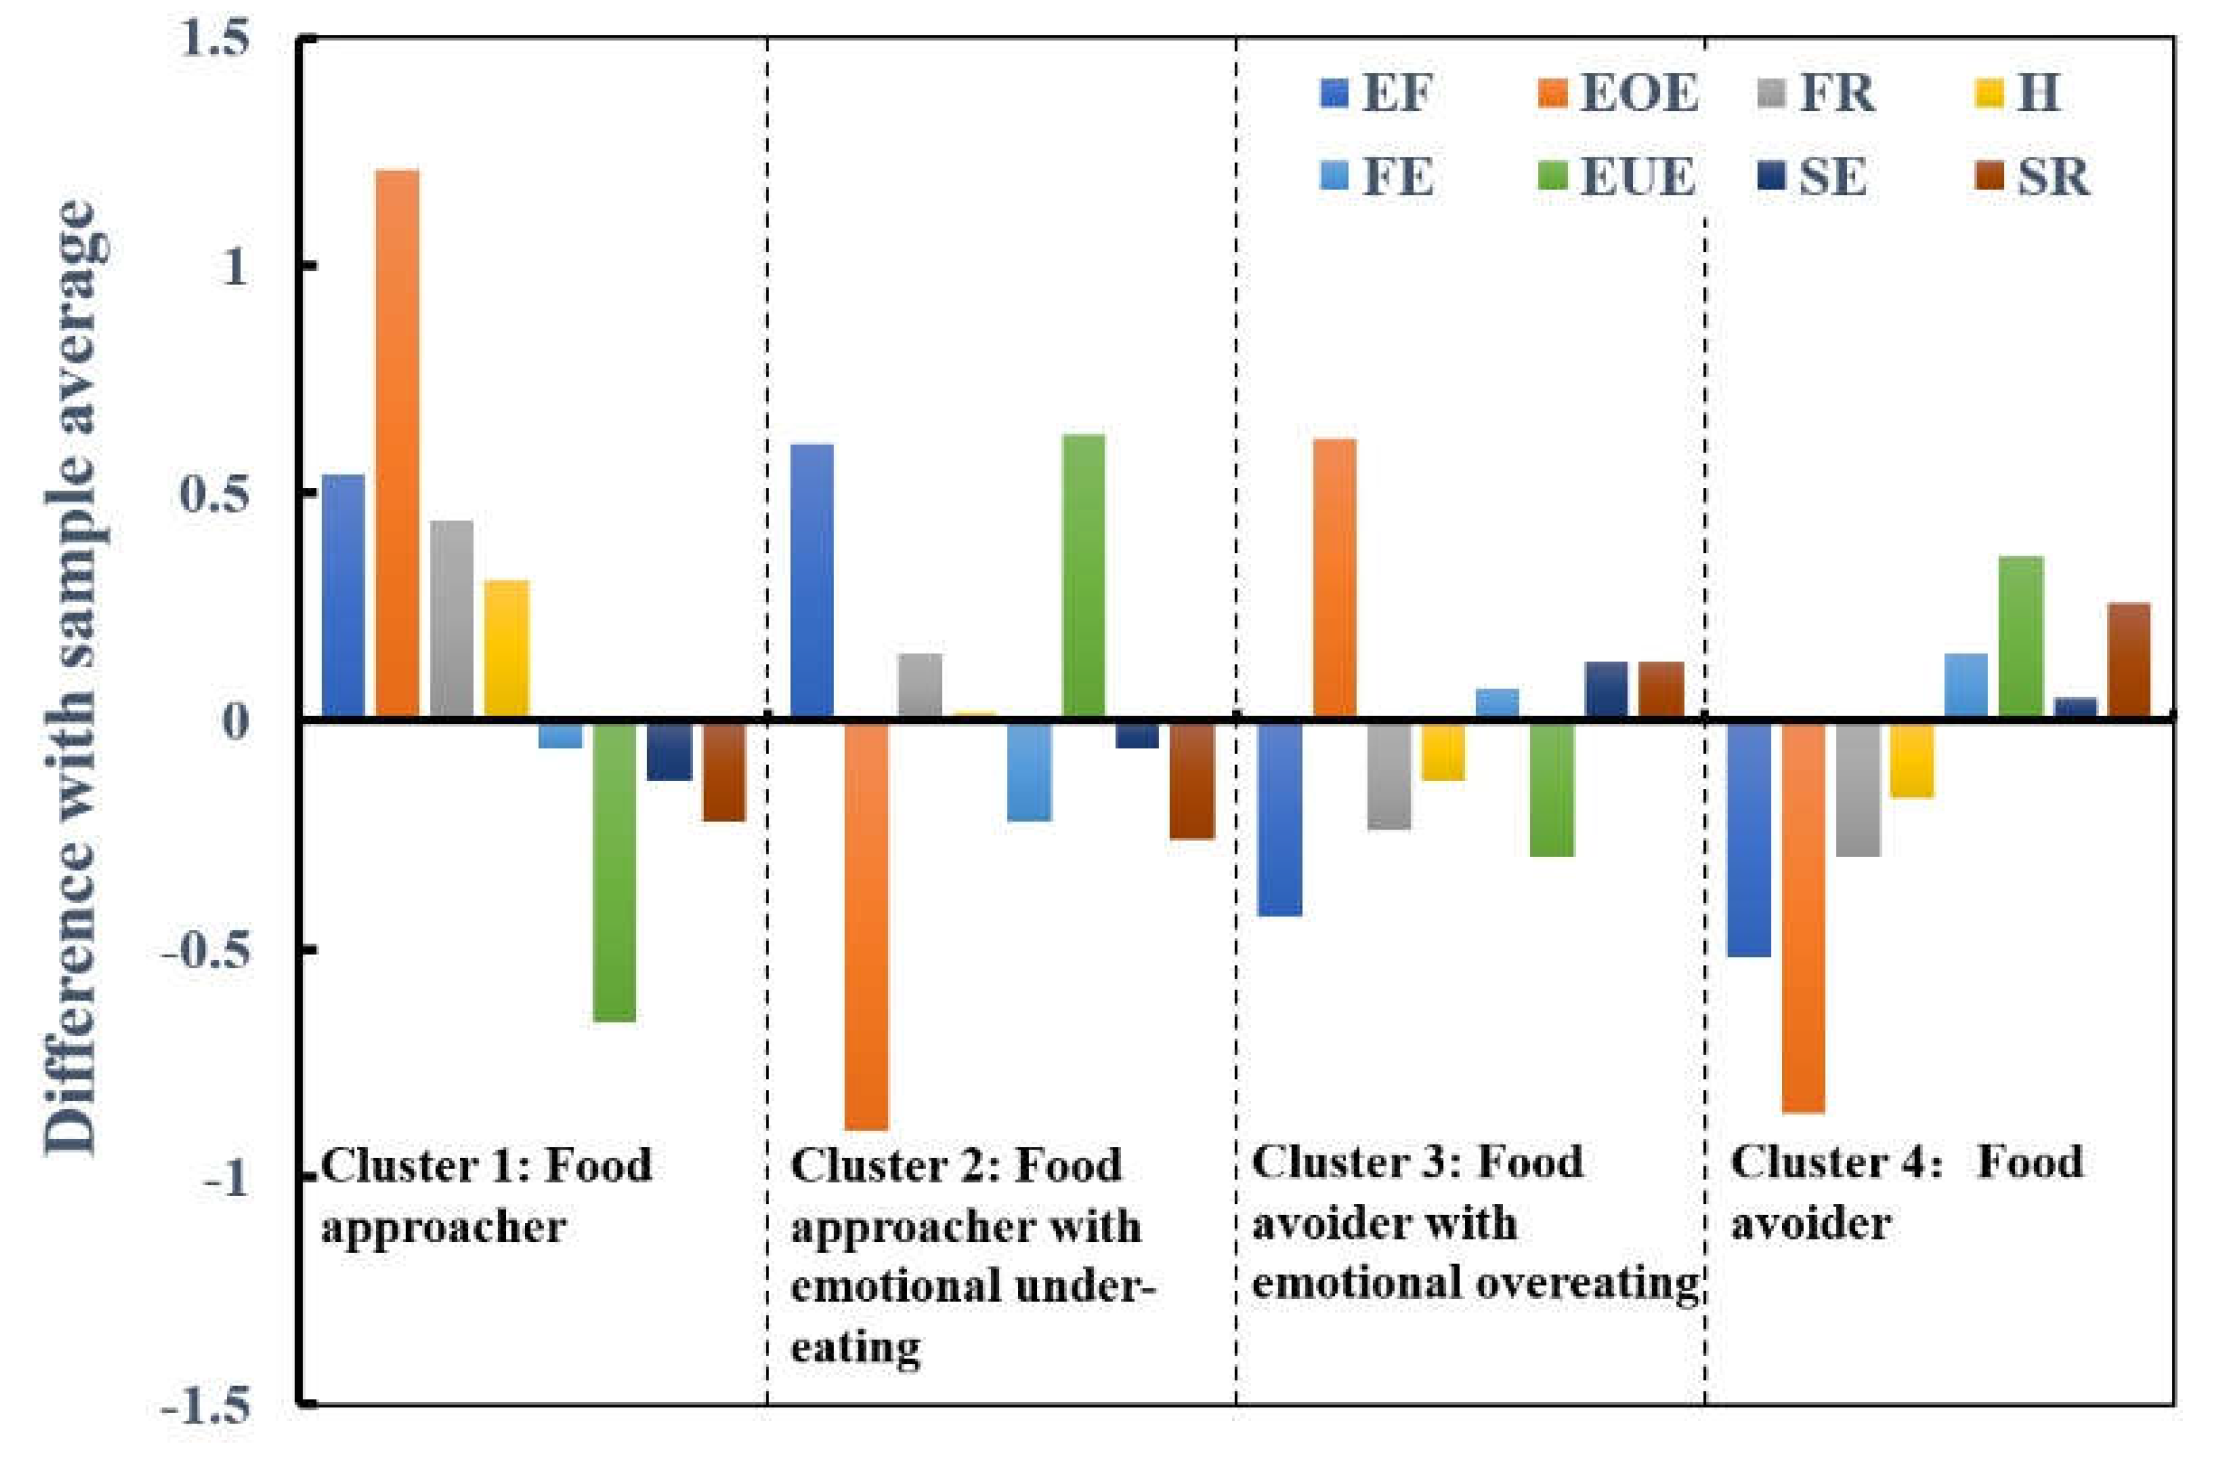

Table 1.
Demographic characteristics, eating behaviors and appetitive traits scores of participants (n=520). 1
Table 1.
Demographic characteristics, eating behaviors and appetitive traits scores of participants (n=520). 1
| Variables | Value | Variables | Value | ||
|---|---|---|---|---|---|
| Age, yrs | 21.21±1.68 | Fruit intake | Rare | 227 (43.65) | |
| BMI, kg/m2 | 20.11±2.39 | Occasional | 232 (44.62) | ||
| Weight Status | Underweight | 141 (27.12) | Often | 61 (11.73) | |
| normal weight | 341 (65.58) | Dairy intake | Rare | 254 (48.85) | |
| overweight and obesity | 38 (7.31) | Occassional | 198 (38.08) | ||
| Eating behaviors | Often | 68 (13.08) | |||
| Eating delivered food | Rare | 148 (28.46) | Skipping breakfast | Rare | 224 (43.08) |
| Occasional | 213 (40.96) | Occassional | 184 (35.38) | ||
| Often | 159 (30.58) | Often | 112 (21.54) | ||
| Eating a spicy meal | Rare | 124 (23.85) | Skipping lunch | Rare | 486 (93.46) |
| Occasional | 232 (44.62) | Occassional | 34 (6.54) | ||
| Often | 164 (31.54) | Often | 0 (.00) | ||
| Eating spicy snacks | Rare | 248 (47.69) | Skipping dinner | Rare | 409 (78.65) |
| Occasional | 179 (34.42) | Occassional | 82 (15.77) | ||
| Often | 93 (17.88) | Often | 29 (5.58) | ||
| Sugared beverage intake | Rare | 202 (38.85) | On diet in past six month | No | 409 (78.65) |
| Occasional | 225 (43.27) | Yes | 111 (21.35) | ||
| Often | 93 (17.88) |
1 Data were expressed as mean±standard deviation or count (%); underweight, BMI < 18.5 kg/m2; normal weight, 18.5 kg/m2 ≤ BMI < 24 kg/m2; overweight and obesity, BMI ≥ 24 kg/m2; rare, ≤ 1 time/week; occasional, 2 – 3 times/week; Often, > 3 times/week.
Table 2.
Description and inter-correlations among appetitive traits and BMI (n=520).1.
| C-AEBQ scales | Value | Correlation Coefficient (r) | ||||||||
|---|---|---|---|---|---|---|---|---|---|---|
| EF | EOE | FR | H | FF | EUE | SE | SR | BMI | ||
| EF | 4.37±0.70 | 1 | 0.16# | |||||||
| EOE | 2.74±1.10 | 0.24# | 1 | 0.11# | ||||||
| FR | 3.08±0.73 | 0.41# | 0.30# | 1 | 0.01 | |||||
| H | 2.57±0.74 | 0.21# | 0.25# | 0.51# | 1 | -0.05 | ||||
| FF | 2.46±0.71 | -0.23# | 0.02 | -0.12# | 0.08 | 1 | -0.07 | |||
| EUE | 3.05±1.04 | -0.10* | -0.57# | -0.03 | 0.02 | -0.037 | 1 | -0.06 | ||
| SE | 2.56±0.90 | -0.05 | 0.03 | 0.05 | 0.128# | -0.04 | 0.07 | 1 | -0.20# | |
| SR | 2.82±0.80 | -0.17# | -0.09* | -0.03 | -0.029 | 0.10* | 0.12# | 0.31# | 1 | -0.24# |
1 Data were expressed as mean±standard deviation. EF, enjoyment of food; EOE; emotional overeating; FR, food responsiveness; H, hunger; FF, food fussiness; EUE, emotional under-eating; SE, slowness in eating; SR, satiety responsiveness. & p < 0.05; # p < 0.01
Table 3.
The Spearman correlation between eating behaviors and appetitive traits of 520 female university students (r) (n=520).1.
Table 3.
The Spearman correlation between eating behaviors and appetitive traits of 520 female university students (r) (n=520).1.
| Appetitive traits | Intake frequency of | Frequency of skipping | on diet | |||||||
|---|---|---|---|---|---|---|---|---|---|---|
| delivered food | spicy meal | spicy snacks | Sugared beverages | fruits | Dairy products | breakfast | lunch | dinner | ||
| EF | 0.08 | 0.14# | 0.04 | 0.03 | 0 | -0.09* | -0.12# | -0.20# | -0.06 | 0.03 |
| EOE | 0.06 | 0.04 | 0.09* | 0.06 | -0.06 | -0.03 | -0.09 | -0.02 | 0.05 | 0.10* |
| FR | 0.16# | 0.24# | 0.24# | 0.11* | -0.02 | -0.07 | -0.01 | -0.05 | -0.01 | 0.03 |
| H | 0.01 | 0.11* | 0.12* | 0.06 | 0.04 | 0.04 | -0.13# | -0.03 | -0.08 | 0.02 |
| FE | 0.02 | -0.02 | -0.01 | -0.03 | 0.13# | 0.09* | 0.02 | 0.11* | -0.01 | 0.01 |
| EUE | -0.02 | 0.07 | 0.03 | 0 | 0.01 | 0.10* | 0.06 | 0.06 | -0.02 | -0.03 |
| SE | 0.07 | 0.03 | 0.01 | 0.03 | -0.04 | -0.06 | 0.02 | 0.08 | -0.03 | -0.05 |
| SR | 0.07 | 0.03 | 0.07 | 0.10* | -0.07 | 0.07 | 0.12* | 0.15# | 0.11* | -0.08 |
1 EF, enjoyment of food; EOE; emotional overeating; FR, food responsiveness; H, hunger; FF, food fussiness; EUE, emotional under-eating; SE, slowness in eating; SR, satiety responsiveness. * p < 0.05; # p < 0.01.
Table 4.
Fit indices and class proportions for 1-5 clusters of appetitive traits analyzed by LPA.1.
| Clusters | AIC | BIC | aBIC | Entropy | LMRT p value | BLRT p value |
Mixing ratio |
|---|---|---|---|---|---|---|---|
| 1 | 12390.272 | 12458.333 | 12407.546 | - | - | - | - |
| 2 | 12010.789 | 12117.135 | 12037.779 | 0.848 | 0.000 | 0.000 | 51.7%/48.3% |
| 3 | 11901.253 | 12045.883 | 11937.960 | 0.820 | 0.000 | 0.000 | 24.5%/50.5%/25.1% |
| 4 | 11649.905 | 11832.819 | 11696.328 | 0.916 | 0.000 | 0.000 | 21.2%/22.2%/30.3%/26.4 |
| 5 | 11554.569 | 11775.768 | 11610.709 | 0.963 | 0.545 | 0.000 | 18.9%/17.8%/12.05/29.7%/21.6% |
1 AIC, the Aikake Information Criterion; BIC, the Bayesian Information Criterion; aBIC, sample-size-adjusted Bayesian information criterion; LMRT, Lo–Mendell–Rubin likelihood ratio test, BLRT, bootstrapped likelihood ratio test.
Table 5.
Comparisons of appetitive traits among four profiles identified by LPA1.
| Food approacher(n=137) | Food approacher with emotional under-eating (n=102) |
Food avoider with emotional overeating (n=114) |
Food Avoider (n=167) |
p | |
|---|---|---|---|---|---|
| EF | 4.91±0.20a | 4.98±0.11a | 3.94±0.44b | 3.85±0.71b | <0.01 |
| EOE | 3.95±0.79a | 1.84±0.55c | 3.36±0.50b | 1.88±0.47c | <0.01 |
| FR | 3.52±0.69a | 3.23±0.72b | 2.84±0.59b | 2.78±0.65b | <0.01 |
| H | 2.88±0.81a | 2.59±0.81b | 2.44±0.59b | 2.40±0.66b | <0.01 |
| FE | 2.40±0.68ab | 2.24±0.75b | 2.53±0.58a | 2.61±0.74a | <0.01 |
| EUE | 2.39±0.99c | 3.68±1.02a | 2.75±0.65b | 3.41±0.95a | <0.01 |
| SE | 2.43±0.97 | 2.50±0.94 | 2.69±0.74 | 2.61±0.89 | 0.10 |
| SR | 2.60±0.77b | 2.56±0.80b | 2.95±0.76a | 3.08±0.77a | <0.01 |
1 EF, enjoyment of food; EOE; emotional overeating; FR, food responsiveness; H, hunger; FF, food fussiness; EUE, emotional under-eating; SE, slowness in eating; SR, satiety responsiveness. For the same row, values among groups with different superscript were significantly different, p<0.05, one-way ANOVA.
Table 6.
Comparisons of BMI among four appetitive patterns.
| Food approacher (n=137) |
Food approacher with emotional under-eating (n=102) |
Food avoider with emotional overeating (n=114) |
Food Avoider (n=167) |
p | |
|---|---|---|---|---|---|
| BMI, kg/m2 | 20.5±2.6a | 20.5±2.5a | 20.2±2.3a | 19.5±2.2b | <0.01* |
| Weight status, n ( %) | |||||
| Underweight | 34(24.8) | 20(19.6) | 27(23.7) | 60(35.9) | 0.02# |
| Normal weight | 89(65.0) | 74(72.5) | 77(67.5) | 101(60.5) | |
| Overweight or obese | 14(10.2) | 8(7.8) | 10(8.8) | 6(3.4) |
* For the same row, values among groups with different superscript were significantly different, p<0.05, one-way ANOVA; # p < 0.05, χ2 test.
Table 7.
Comparison of eating behaviors among four appetitive patterns.1.
| Eating behavior | n | Food approacher | Food approacher with emotional under-eating | Food avoider with emotional overeating | Food Avoider | p |
|---|---|---|---|---|---|---|
| Skipping breakfast | ||||||
| Rare | 224 | 72 (52.6) | 48 (47.1) | 42 (36.8) | 62 (37.1) | 0.05* |
| Occasional | 184 | 37 (27.0) | 38 (37.3) | 43 (37.7) | 66 (39.5) | |
| Often | 112 | 28 (20.4) | 16 (15.7) | 29 (25.4) | 39 (23.4) | |
| Skipping lunch | ||||||
| Rare | 486 | 132 (96.4) | 100 (98.0) | 102 (89.5) | 152 (91.0) | 0.01* |
| Occasional | 34 | 5 (3.6) | 2 (2.0) | 12 (10.5) | 15 (9.0) | |
| Skipping dinner | ||||||
| Rare | 409 | 108 (78.8) | 85 (83.3) | 81 (71.1) | 135 (80.8) | 0.08 |
| Occasional | 82 | 20 (14.6) | 9 (8.8) | 27 (23.7) | 26 (15.6) | |
| Often | 29 | 9 (6.6) | 8 (7.8) | 6 (5.3) | 6 (3.6) | |
| Dieting behavior | ||||||
| No | 409 | 101 (73.7) | 84 (82.4) | 83 (72.8) | 141 (84.4) | 0.04* |
| Yes | 111 | 36 (26.3) | 18 (17.6) | 31 (27.2) | 26 (15.6) | |
1 Rare: ≤ 1 time/week, occasional: 2 – 3 times/week, Often: > 3 times/week. * p < 0.05, χ2 test.
Table 8.
BMI-adjusted Odd ratio (OR) and 95% confidential interval (CI) of skipping meals among different appetitive patters (OR, 95%CI; p).
Table 8.
BMI-adjusted Odd ratio (OR) and 95% confidential interval (CI) of skipping meals among different appetitive patters (OR, 95%CI; p).
| Appetitive pattern | Skipping breakfast | Skipping lunch | Skipping dinner |
|---|---|---|---|
| Food approacher | 1.00 | 1.00 | 1.00 |
| Food approacher with emotional under-eating | 1.25, 0.75 - 2.08; 0.40 | 0.53, 0.10 - 2.78; 0.45 | 0.74, 0.38 - 1.45; 0.38 |
| Food avoider with emotional overeating | 1.90, 1.14 - 3.15; 0.01 | 3.11, 1.06 - 9.10; 0.04 | 1.52, 0.85 - 2.70; 0.16 |
| Food avoider | 1.88, 1.19 - 2.97; 0.01 | 2.61, 0.92 - 7.36; 0.07 | 0.88, 0.50 - 1.55; 0.66 |
Table 9.
Odd ratio (OR) and 95% confidential interval (CI) of dieting behavior among different appetitive patters (OR, 95%CI; p).
Table 9.
Odd ratio (OR) and 95% confidential interval (CI) of dieting behavior among different appetitive patters (OR, 95%CI; p).
| Appetitive pattern | Unadjusted | BMI-adjusted |
|---|---|---|
| Food approacher | 1.00 | 1.00 |
| Food approacher with emotional under-eating | 0.60, 0.32 - 1.14; 0.12 | 0.60, 0.31 - 1.14; 0.12 |
| Food avoider with emotional overeating | 1.05, 0.60 - 1.84; 0.87 | 1.13, 0.64 - 2.00; 0.68 |
| Food avoider | 0.52, 0.29 - 0.91; 0.02 | 0.61, 0.34 - 1.10; 0.10 |
Disclaimer/Publisher’s Note: The statements, opinions and data contained in all publications are solely those of the individual author(s) and contributor(s) and not of MDPI and/or the editor(s). MDPI and/or the editor(s) disclaim responsibility for any injury to people or property resulting from any ideas, methods, instructions or products referred to in the content. |
© 2023 by the authors. Licensee MDPI, Basel, Switzerland. This article is an open access article distributed under the terms and conditions of the Creative Commons Attribution (CC BY) license (http://creativecommons.org/licenses/by/4.0/).
Copyright: This open access article is published under a Creative Commons CC BY 4.0 license, which permit the free download, distribution, and reuse, provided that the author and preprint are cited in any reuse.


