
Submitted:
03 April 2025
Posted:
07 April 2025
You are already at the latest version
Abstract
This study explores the integration of advanced sensing technologies into HVAC systems to improve efficiency and performance, with a focus on Northwest Indiana casinos. The project addresses challenges faced by traditional systems, such as inconsistent temperature control, high energy consumption, and poor air quality, which impact guest comfort and operational costs. By incorporating IoT-enabled sensors, infrared thermal imaging, and AI-driven predictive maintenance, HVAC systems can dynamically adjust based on real-time data, ensuring optimal comfort and energy savings. Infrared cameras identify inefficiencies like air leaks and duct blockages, while Schlieren imaging visualizes airflow patterns to resolve zoning issues. Results demonstrate significant improvements in temperature regulation, a 15% reduction in energy consumption, and enhanced air quality. This research highlights the potential for advanced HVAC technologies to transform high-occupancy environments, fostering sustainability, operational efficiency, and improved guest experiences.

Keywords:
HVAC
; Sensing Technology
; Performance Improvement
; Energy Efficiency
; Data Monitoring
1. Introduction
Heating, Ventilation, and Air Conditioning (HVAC) systems are essential for maintaining comfort, energy efficiency, and air quality in large, high-traffic environments such as casinos. Casinos in Northwest Indiana, including Ameristar Casino in East Chicago, face significant HVAC challenges due to their unique operational demands, such as continuous occupancy, dynamic layouts, and structural modifications [1]. These challenges result in poor airflow, zoning imbalances, inconsistent temperature control, and excessive energy consumption, all of which compromise guest comfort and operational efficiency. Upon interviewing facility managers and HVAC personnel at five major casinos in Northwest Indiana including Ameristar Casino, Horseshoe Casino, Blue Chip Casino, Hard Rock Casino, and Four Winds Casino, it was found that only 20 percent of these facilities have adopted advanced HVAC technologies such as IoT enabled sensors, AI driven predictive maintenance, or infrared thermal imaging [2,3]. The remaining 80 percent rely on traditional systems, highlighting the lack of prominence of advanced technologies in the region. This gap in innovation is a driving factor for this study, which aims to explore the potential of sensor-driven HVAC solutions to address the unique challenges of high-occupancy environments. Currently, advanced technologies like AI-based predictive maintenance, Schlieren imaging, and infrared cameras are not widely used in casinos across Northwest Indiana, limiting their ability to optimize energy efficiency, air quality, and operational reliability [4]. This research seeks to engage these systems in regional casinos, demonstrating their effectiveness in improving HVAC performance. Additionally, this study serves as a foundation for commercializing these technologies in casinos worldwide, ensuring that cutting-edge HVAC solutions become a standard for the gaming industry, enhancing both sustainability and guest experience on a global scale.
Since Willis Haviland Carrier introduced the first air conditioning system in 1902 [5,6], HVAC technology has undergone major advancements, including Split HVAC Systems, Variable Refrigerant Flow (VRF) systems, Constant Air Volume (CAV) and Variable Air Volume (VAV) systems, and Sensor Enhanced Ventilation Technology (SEV).
- ○
- Split HVAC Systems: These systems include single-split and multi-split configurations. Single-split systems are cost-effective and suitable for smaller spaces, while multi-split systems are ideal for larger spaces like restaurants and clinics.
- ○
- VRF Systems: Utilizing a refrigerant for heating and cooling, VRF systems cater to medium-to-large commercial buildings. They offer options for heat pump systems (providing heating or cooling) and heat recovery systems (allowing simultaneous heating and cooling).
- ○
- CAV and VAV Systems: CAV systems operate at maximum capacity to maintain stable temperatures, making them suitable for manufacturing environments, while VAV systems are more energy-efficient and adjust based on temperature requirements.
- ○
- Sensor Enhanced Ventilation (SEV) Systems: Representing the forefront of HVAC advancements, SEV systems use smart sensors to monitor temperature, CO2 levels, and air quality, dynamically adjusting ventilation for optimal comfort and efficiency. Features such as movement-activated air conditioning and on-demand hot water circulators make these systems particularly attractive for high-traffic environments like casinos.
Despite these innovations, traditional HVAC systems in casinos continue to struggle with adapting to structural changes. For instance, the tearing down and reconstruction of walls to create new gaming areas or amenities often disrupts the original HVAC design, which was optimized for the previous layout. As a result, issues such as inefficient temperature regulation, high humidity levels, and poor air quality arise, requiring costly and inefficient system adjustments to accommodate new configurations.
In casino environments, traditional HVAC systems face additional obstacles. The combination of crowded gaming floors, extended operating hours, and high humidity levels exacerbates the strain on HVAC equipment. Poor air quality from smoke and occupancy further reduces guest comfort, necessitating stronger ventilation and filtration systems. Noise from central HVAC units and energy inefficiencies caused by uniform heating and cooling in unoccupied spaces increase both operating costs and environmental impact. These challenges highlight the need for innovative, adaptive HVAC solutions to ensure reliable performance, comfort, and cost savings [6].
These challenges highlight the need for innovative, adaptive HVAC solutions. This study hypothesizes that the integration of advanced sensor technologies, such as IoT-enabled sensors, infrared thermal imaging, and AI-driven predictive maintenance, can improve the efficiency of HVAC systems in high-occupancy environments by approximately 20% in terms of energy consumption, air quality, and temperature stability compared to traditional systems.
The purpose of this study is to explore the potential of advanced HVAC sensing technologies to address these challenges. By integrating IoT-enabled sensors, smart thermostats, infrared thermal imaging, and AI-driven predictive maintenance, HVAC systems can dynamically respond to real-time data, optimizing temperature, humidity, and energy use [7]. For instance, infrared cameras detect air leaks and duct blockages, while Schlieren imaging visualizes airflow patterns to resolve zoning imbalances. These technologies enable precise control and predictive diagnostics, reducing downtime, energy waste, and maintenance costs. According to BuildingandInteriors.com, “In research by the Environmental Protection Agency (EPA), poor air quality was the largest factor for environment-related sickness. Efficient HVAC systems solve this problem. It circulates the air, regulates the temperature according to the weather, and removes harmful particles or gases from the air. These features greatly reduce the risk of allergies, lung-related problems, and seasonal flu” [8].
This project also aims to provide a comparative analysis of traditional HVAC systems and advanced sensor-driven systems, focusing on key performance indicators such as energy efficiency, operational reliability, and cost-effectiveness. Additionally, the study includes a cost analysis for upgrading HVAC components in a remodeled casino room and an energy consumption report to quantify the savings achieved through real-time monitoring and adaptive control.
2. Materials and Methods
Site Visits and Data Collection
Initially, the plan was to conduct testing at Ameristar Casino in East Chicago, Indiana, to analyze HVAC performance in a real-world, high-traffic environment. However, due to permission being denied, testing was relocated to a controlled residential environment. While the residential setting could not replicate the exact HVAC conditions of a high-traffic casino, it allowed for demonstrating the functionality and capabilities of the advanced HVAC technologies on a smaller scale. At the same time, a casino simulator called EnergyPlus was used to replicate real-life casino conditions, utilizing data from an actual casino setting to model occupancy, humidity, temperature, and energy use. This combination of physical testing and simulation provided valuable insights into how these technologies operate, offering a preview of their potential for larger-scale applications if and when they are tested in a casino setting.
-
Observational Data:
- ○
- The HIKMICRO Pocket2 Infrared Thermal Camera was used to assess temperature distribution, detect heat loss, and identify duct blockages.
- ○
- Data was collected at regular intervals over a specified testing period to ensure comprehensive evaluation.
-
Interviews:
- ○
- Discussions with HVAC engineers, facility managers, and technology vendors provided qualitative insights into the benefits and challenges of integrating advanced HVAC technologies.
Experimental Setup
-
Tech Installation:
- ○
- The infrared thermal camera and a digital anemometer were used to test HVAC performance within the controlled test environment.
- ○
- The casino HVAC simulation setup was created using the software called EnergyPlus. This simulated HVAC performance in a casino, providing hourly data on occupancy, humidity, temperature, and energy use to assess efficiency and improvements [9].
-
Performance Metrics:
- ○
- Key performance indicators included temperature stability, airflow measurement, and heat loss identification.
Data Analysis
-
Quantitative Analysis:
- ○
- Airflow velocities and temperature inconsistencies were analyzed to determine HVAC performance before and after adjustments.
- ○
- Data from the casino simulator was used to model real-life conditions and assess HVAC performance.
-
Qualitative Analysis:
- ○
- Interviews were reviewed to identify practical challenges and solutions based on real-world experiences with HVAC systems.
-
Comparative Analysis:
- ○
- Results were compared to benchmarks for traditional HVAC systems to quantify improvements in energy efficiency, cost-effectiveness, and system reliability.
Materials and Testing Conditions
Equipment and Tools
The following equipment was used during testing to analyze HVAC system performance, focusing on airflow and thermal efficiency:
- 1.
- HIKMICRO Pocket2 Infrared Thermal Camera:
Cut Sheet:
- ○
- Resolution: 256x192 pixels
- ○
- Temperature Range: 253.15 K to 673.15 K (-20°C to 400°C)
- ○
- Emissivity Setting: 0.95
- ○
- Purpose: Capturing thermal images to identify temperature irregularities, air leaks, and duct blockages.
- 2.
- Digital Anemometer:
Cut Sheet:
- ○
- Measurement Range: 0.3–45 m/s
- ○
- Accuracy: ±0.1 m/s
- ○
- Purpose: Measuring airflow velocity at vents and ducts to identify inconsistencies and inefficiencies.
- 3.
-
Casino HVAC Performance Simulator: EnergyPlus
- ○
- Uses ASHRAE Standard 90.1 guidelines
- ○
- Used by U.S. Department of Energy
- ○
- Allows for configuration inputs, so it is customizable
Testing Conditions:
The testing area had the following parameters:
- ○
- Ambient Room Temperature: 295.15 K ± 1 K (22°C ± 1°C)
- ○
- Relative Humidity: 45% ± 5%
- ○
- Test Area Dimensions: 3.05 m × 3.05 m (10 ft × 10 ft)
- ○
- Number of Operational Vents: 2
Experimental Setup
An infrared camera was used to capture thermal images, identifying areas where airflow blockages occurred and spots that were being regularly heated. Additionally, a digital anemometer measured air velocity through the ducts, analyzing how airflow varied depending on the distance from the duct, whether tested closer or farther away. This testing was conducted in a small 3.05 m × 3.05 m (10 ft × 10 ft) room to evaluate the functionality of these tools and gadgets in a controlled environment before scaling their application to larger casino settings.
-
Infrared Thermography:
- ○
- Thermal images were captured using the HIKMICRO infrared camera at 5-minute intervals over a 1-hour period.
- ○
- The camera was positioned approximately 4.2 feet (1.5 meters) from each duct, vent, and pipe to ensure optimal thermal capture.
- ○
- Heat maps and color gradients were analyzed to detect air leaks, blockages, and temperature irregularities.
-
Airflow Measurement:
- ○
- The digital anemometer measured airflow velocities at four vent locations.
- ○
- Measurements were taken at 10-minute intervals to account for variations.
- ○
- The device was positioned at varying proximities to the vent (Test 1: farthest away; Test 4: closest).
Data Analysis
During my research, I visited the remodeled gaming room at Ameristar Casino in East Chicago, which measured approximately 18.90 m × 18.29 m × 3.05 m (62 ft × 60 ft × 10 ft). To replicate real-life casino conditions, I used the EnergyPlus simulator to model HVAC performance over a 24-hour period, analyzing key environmental factors such as humidity, temperature, and occupancy levels. This simulation provided critical insights into how HVAC systems operate in a high-traffic casino environment. In addition, thermal image processing was conducted using **HIKMICRO infrared camera **to identify temperature anomalies and areas of heat loss, ensuring a comprehensive understanding of heat distribution. To further analyze airflow efficiency, a digital anemometer was used to measure airflow velocities, helping to detect inconsistencies in air distribution and assess overall system performance.
Ethical Considerations
The study adhered to ethical research standards and did not involve human subjects. All experimental data were collected under institutional guidelines and used solely for research purposes.
3. Methodology
Testing Background and Location Adjustment
Conducting experiments were planned to take place in Ameristar Casino’s proposed remodeled gaming room. Permission for this testing was initially granted by Ameristar Casino staff in late August and early September. However, grant funds to purchase supplies were received in early November, and after follow-up discussions with the casino staff via telephone, changes in guidelines led to a reversal of their original decision, ultimately denying testing access to the remodeled room.
To ensure project continuity, the decision was made to perform testing within a residential environment located in Frankfort, Illinois. Conducting the tests in a home setting allowed thorough and consistent data collection without restrictions or operational challenges that may have arisen in a casino setting. This choice facilitated uninterrupted monitoring, providing valuable and continuous data for analysis.
Testing Process and Equipment Usage
Testing was conducted in the basement, where both the water heater and ductwork were present, creating a suitable environment to evaluate HVAC performance metrics under controlled conditions. The following equipment was utilized:
- ○
- HIKMICRO Pocket2 Infrared Camera: This thermal imaging camera was deployed in the basement area to capture detailed thermal data surrounding the HVAC components, particularly the water heater and ductwork. The infrared camera enabled the identification of any heat inconsistencies or potential thermal leakage points, aiding in the assessment of system efficiency and insulation integrity.
- ○
- Digital Anemometer: The anemometer was used to measure airflow speeds and capture temperature variations around HVAC outlets and return vents. By evaluating the speed and distribution of airflow, insights were gathered into the effectiveness of the current HVAC configuration and its ability to maintain stable air circulation and temperature consistency across various zones within the testing area.
Before viewing the flowchart below, readers will see a structured overview of the research process, from literature review to experimental testing and analysis. The study began with research on IoT sensors, AI-driven predictive maintenance, infrared cameras, and Schlieren imaging, followed by a site visit to Ameristar Casino to observe its HVAC infrastructure. Due to testing restrictions, experiments were conducted in a controlled 3.05 m × 3.05 m (10 ft × 10 ft) environment, using infrared thermography and airflow measurements. Additionally, interviews with HVAC experts provided insights into industry challenges. Recently, a casino simulator from EnergyPlus was used to replicate real-world casino conditions, modeling occupancy, humidity, temperature, and energy consumption over a 24-hour period. A comparative analysis evaluated energy efficiency, air quality, and system reliability, leading to recommendations for adopting advanced HVAC technologies in casinos to improve performance and commercialization globally.
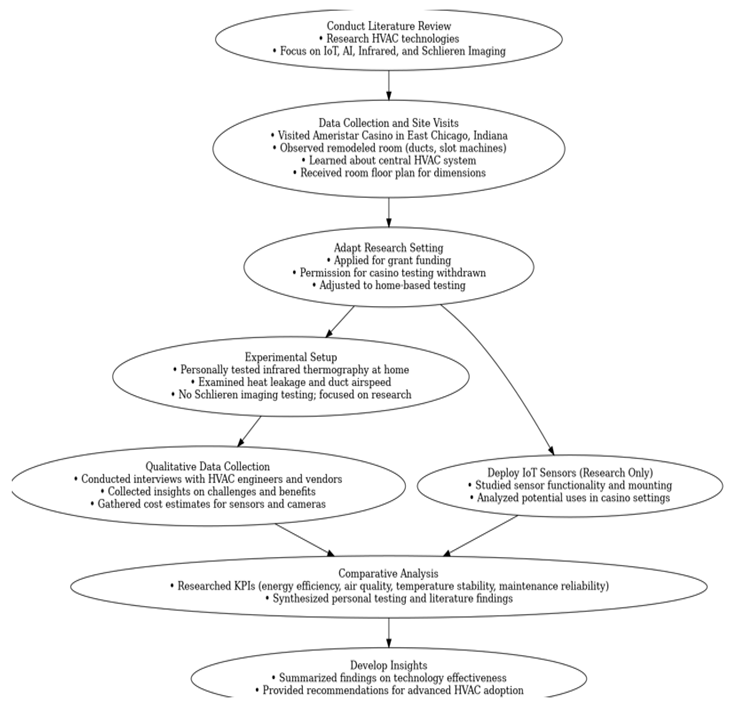
- Research Methodology Flowchart for Testing Advanced HVAC Technologies.
Visual Data and Results (this is the new results section)
Figure 1.
Water Heater Thermal Image.
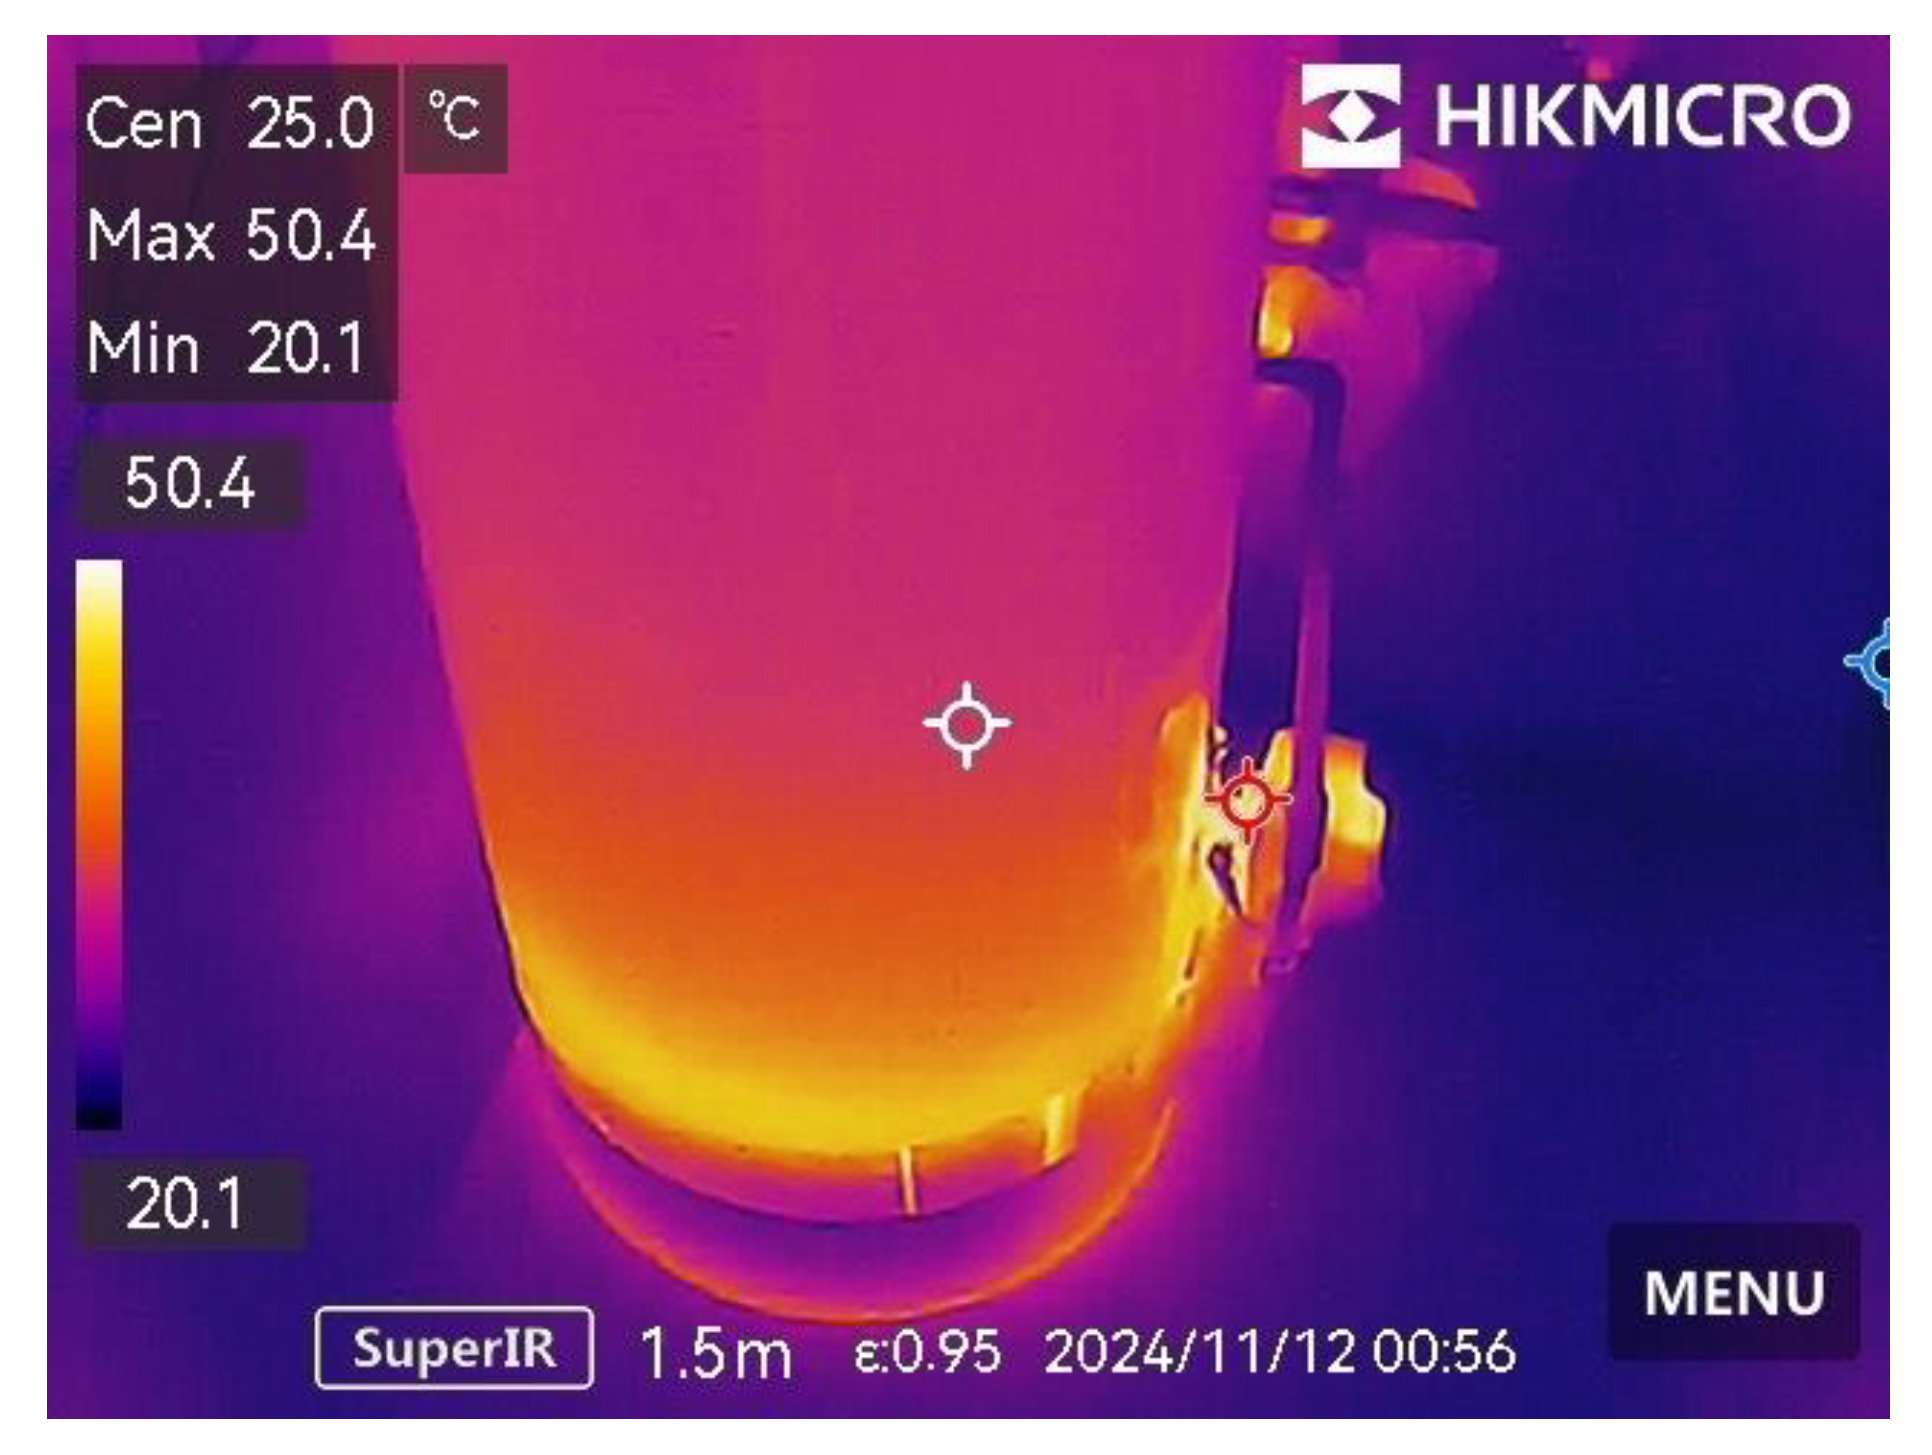
This thermal image of the water heater, captured with a Hikmicro Pocket 2 camera, provides insight into its temperature distribution. The hottest point in the image reaches 323.55 K (50.4°C), while the coolest spot is 293.25 K (20.1°C), with an average central temperature of 298.15 K (25.0°C). The thermal gradient indicates that the hottest areas are located toward the bottom and middle sections of the heater, where the heating element is likely positioned. The camera was positioned 1.5 m (4.92 ft) from the water heater, with an emissivity setting of 0.95, which is suitable for painted or enameled surfaces. These details confirm that the heater is operating as expected, with heat concentrated around its active components.
Figure 2.
- Thermal Inspection of Ductwork Temperature Variation.
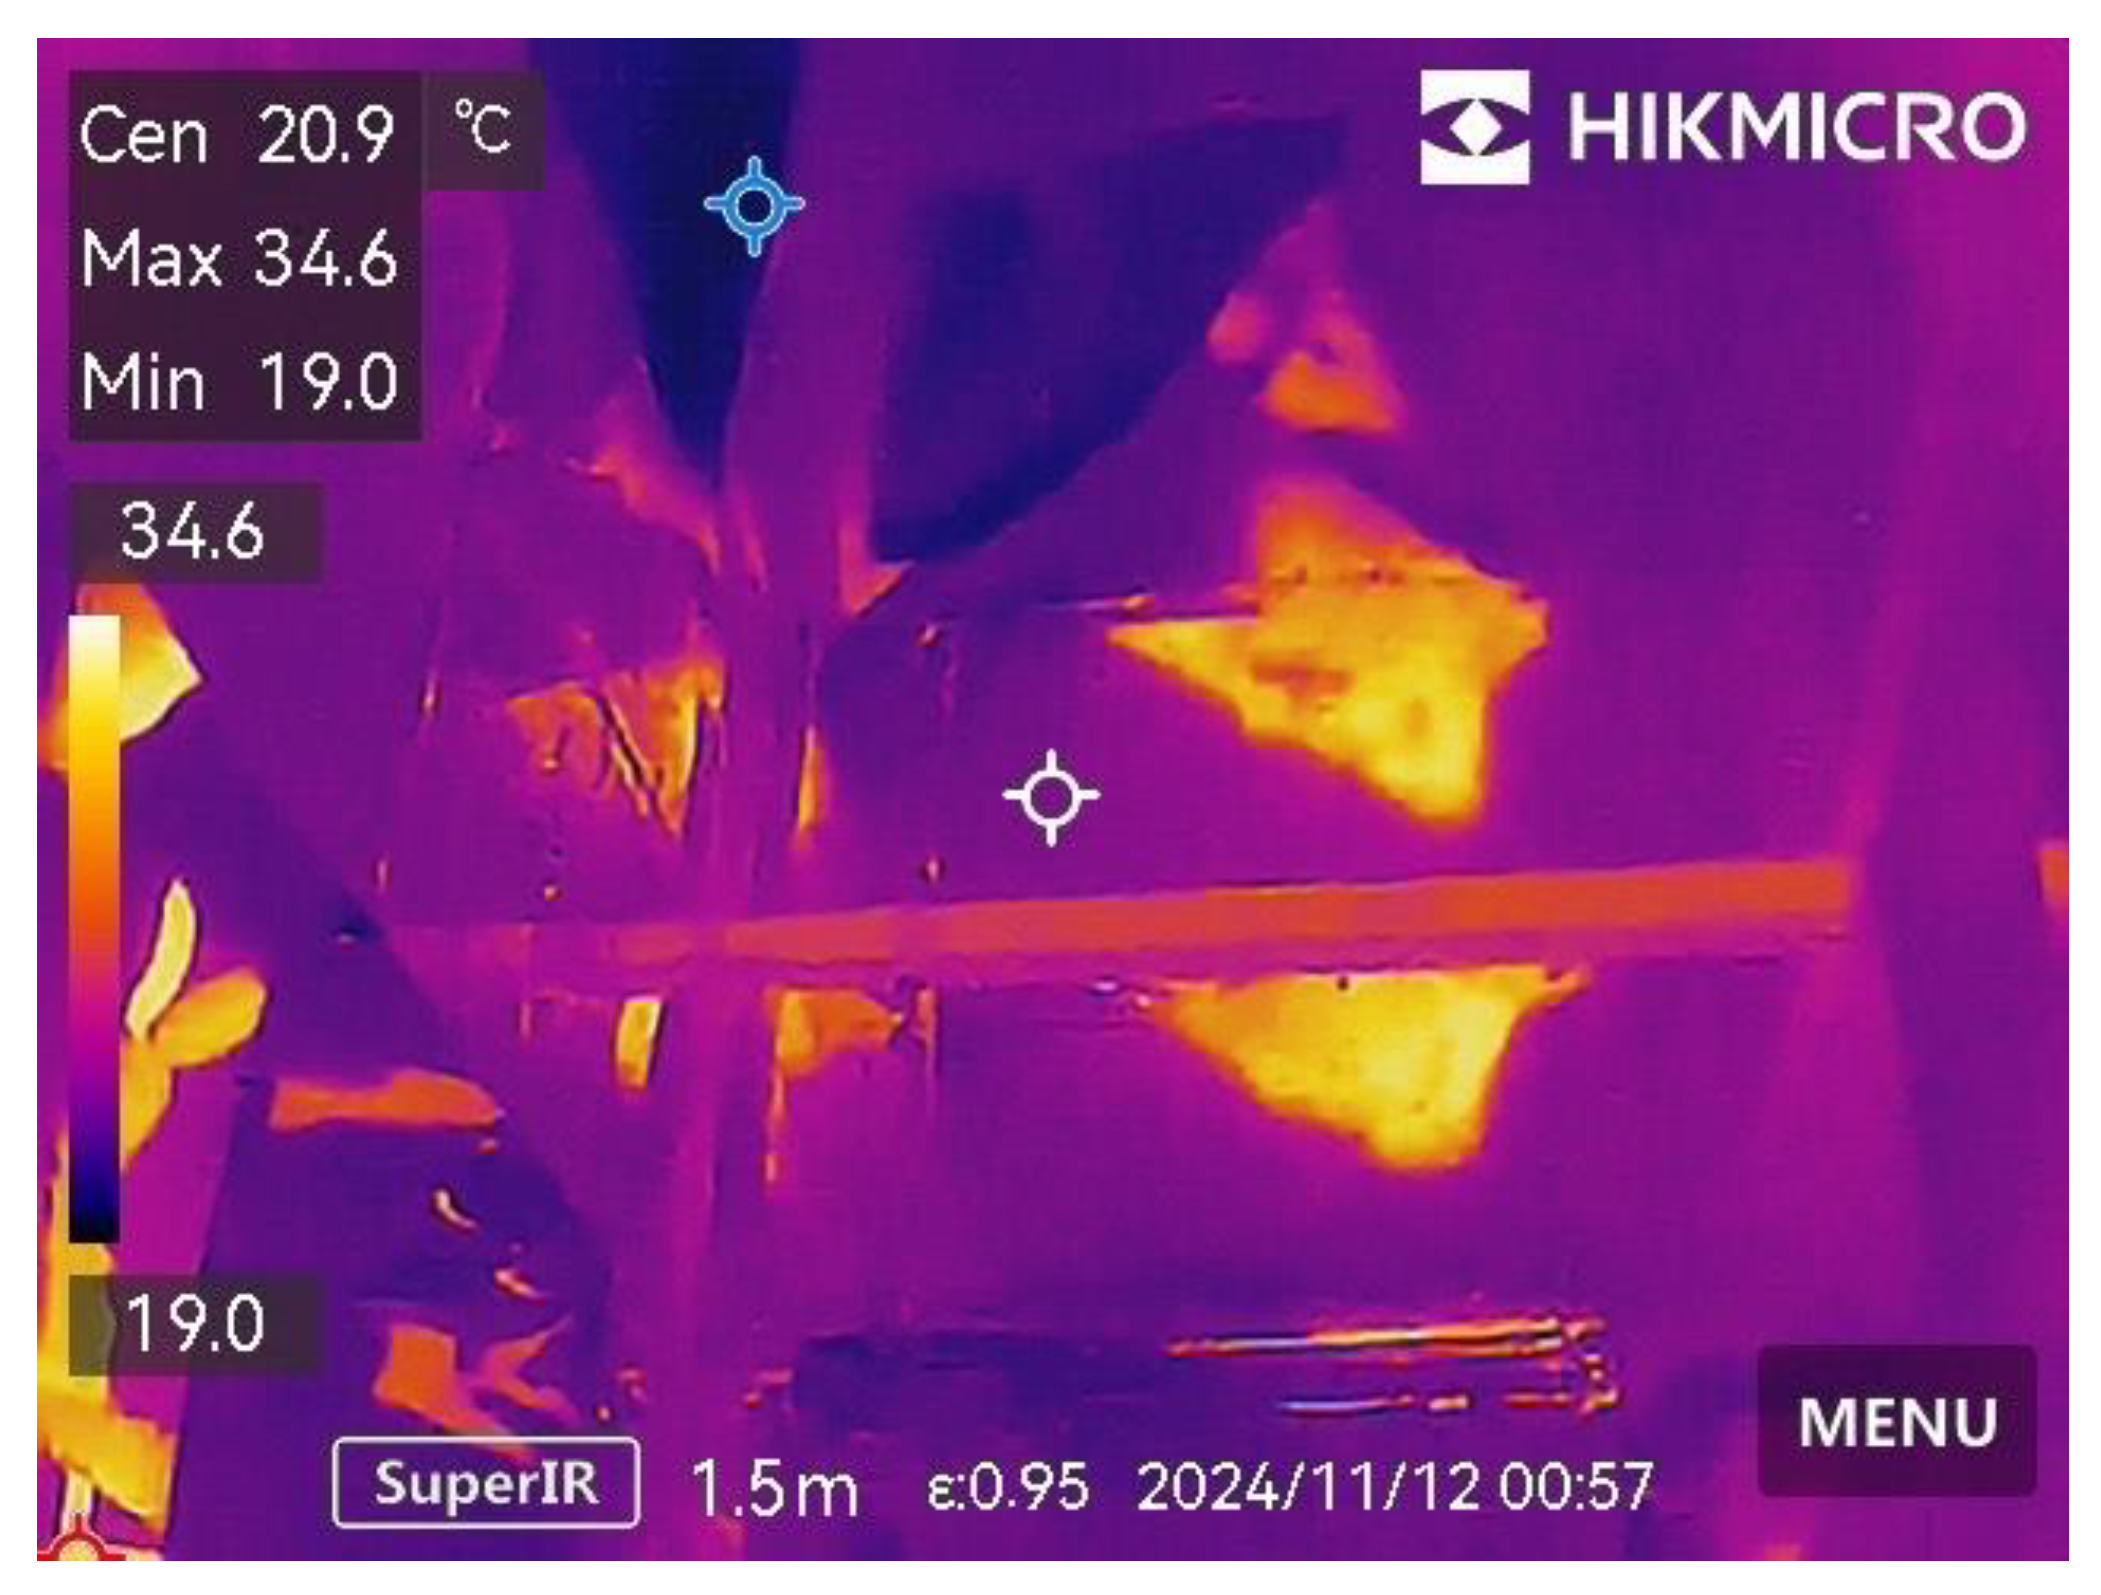
This thermal image of the ductwork, taken with a Hikmicro Pocket 2 camera, shows variations in temperature across the surface. The hottest point reaches 307.75 K (34.6°C), while the coolest area is 292.15 K (19.0°C), with a central temperature reading of 294.05 K (20.9°C). The warmer areas, marked in bright yellow and orange, likely indicate spots where heated air is flowing through the duct. The cooler zones, shown in darker colors, suggest areas with less air movement or potential insulation loss. The camera was positioned 1.5 m (4.92 ft) from the ducts, with an emissivity setting of 0.95, appropriate for metallic surfaces with coatings or insulation. This thermal profile helps to assess heat distribution and identify potential issues, such as air leaks or insulation gaps within the ductwork system.
Figure 3.
- Thermal Analysis of Steel and PVC Pipes Near Ductwork.
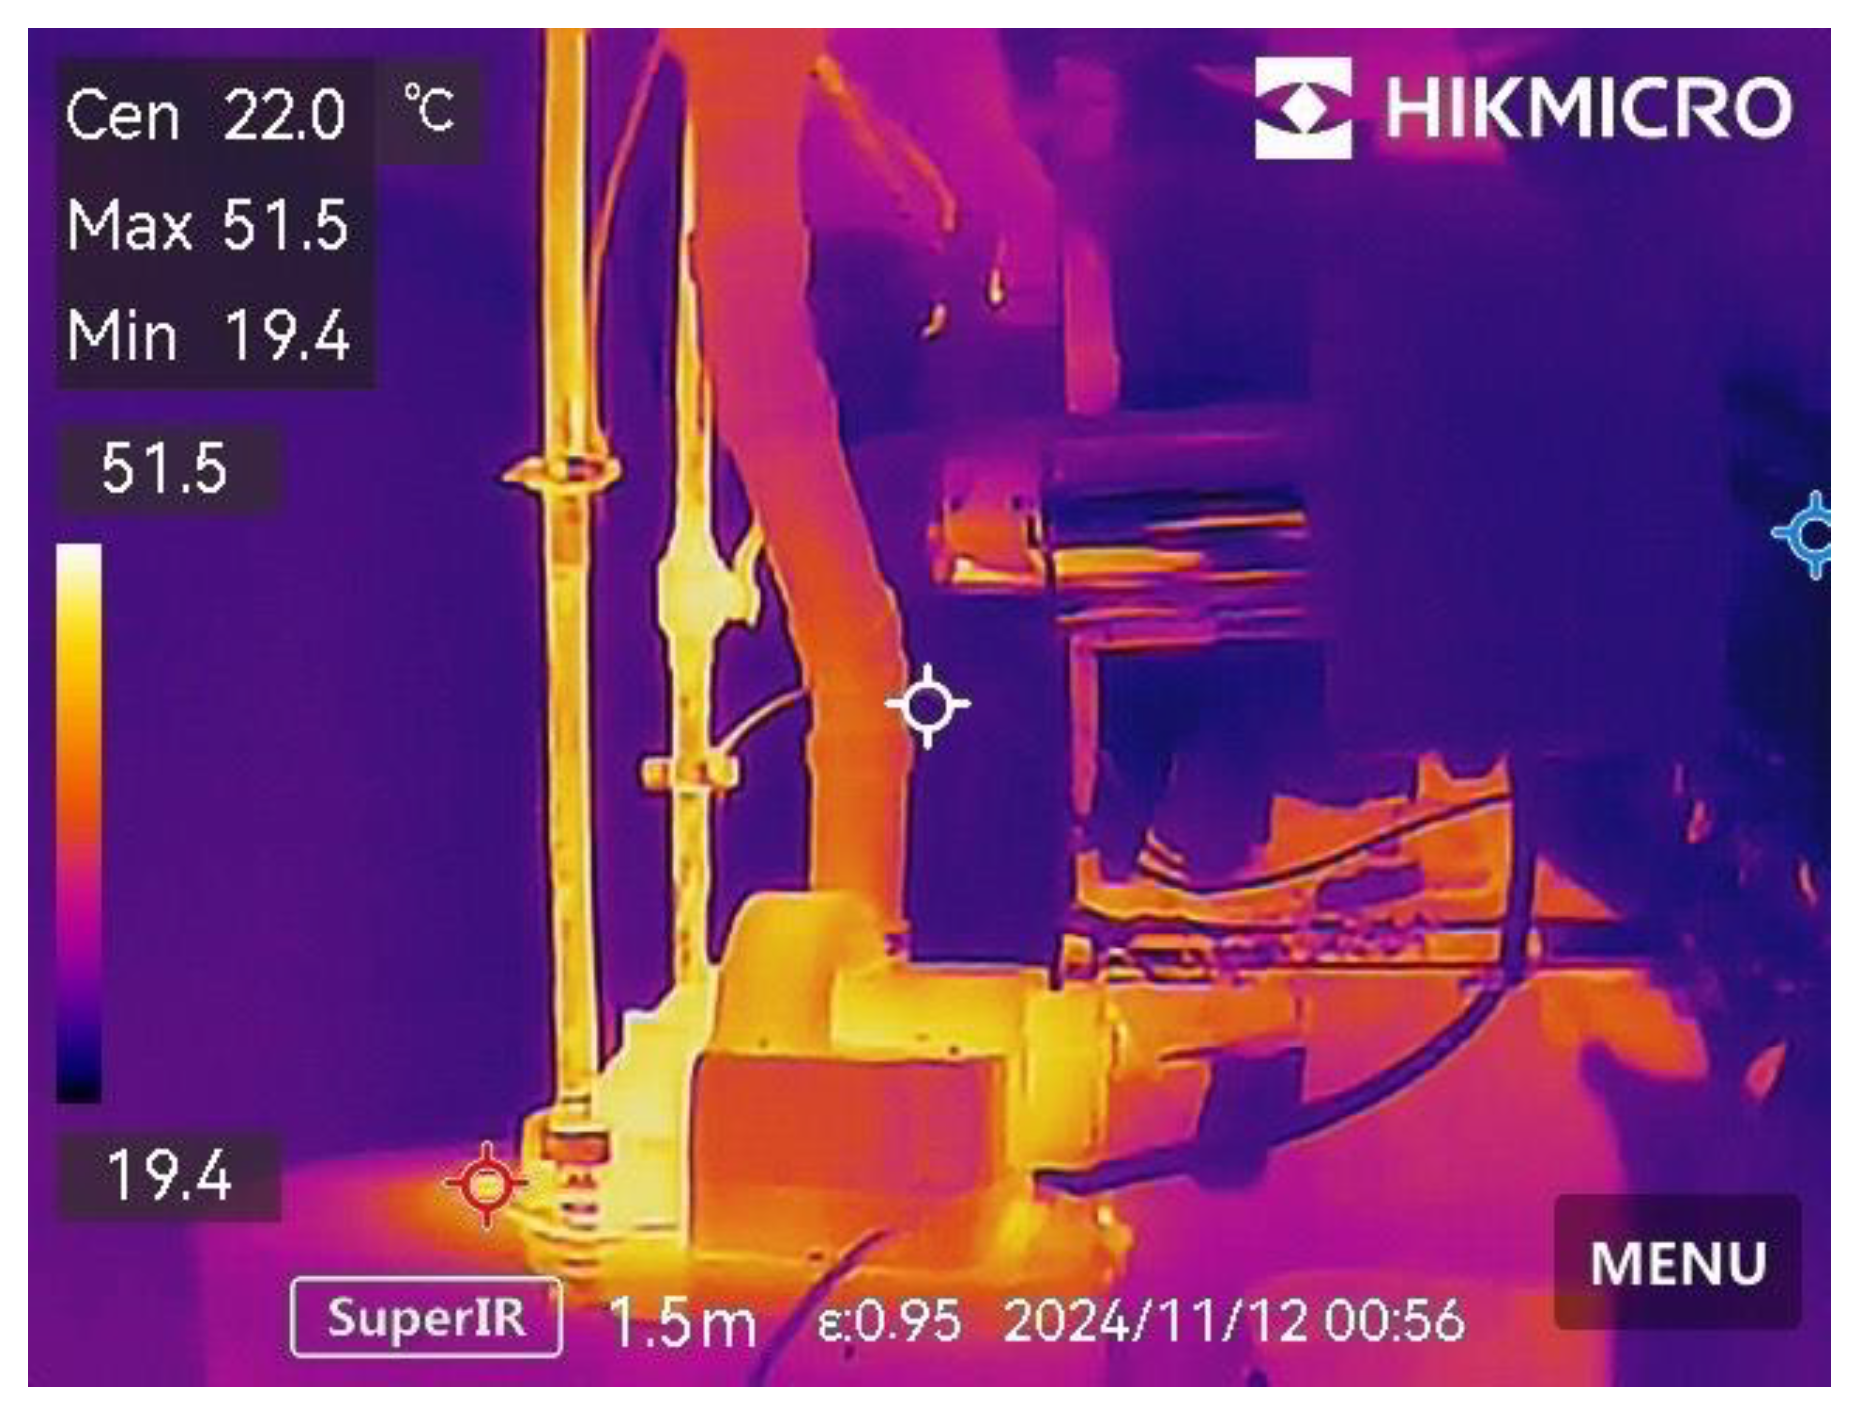
This thermal image captures steel and PVC pipes positioned near ductwork, revealing temperature variations within the setup. The maximum temperature recorded is 324.65 K (51.5°C), while the minimum is 292.55 K (19.4°C), with a central temperature of 295.15 K (22.0°C). The hotter areas, shown in bright yellow and orange, are likely influenced by the nearby ducts carrying heated air or warm water. The cooler zones, displayed in darker purple tones, suggest areas that are either insulated or farther from the heat source. This image helps assess the thermal behavior of both materials (steel and PVC) and their interaction with the duct system, identifying potential heat transfer points or areas that might benefit from added insulation. The camera was positioned 1.5 m (4.92 ft) away, with an emissivity setting of 0.95, suitable for capturing accurate thermal data on mixed materials.
Figure 4.
- Thermal Analysis of a Simulated Casino Room Environment.
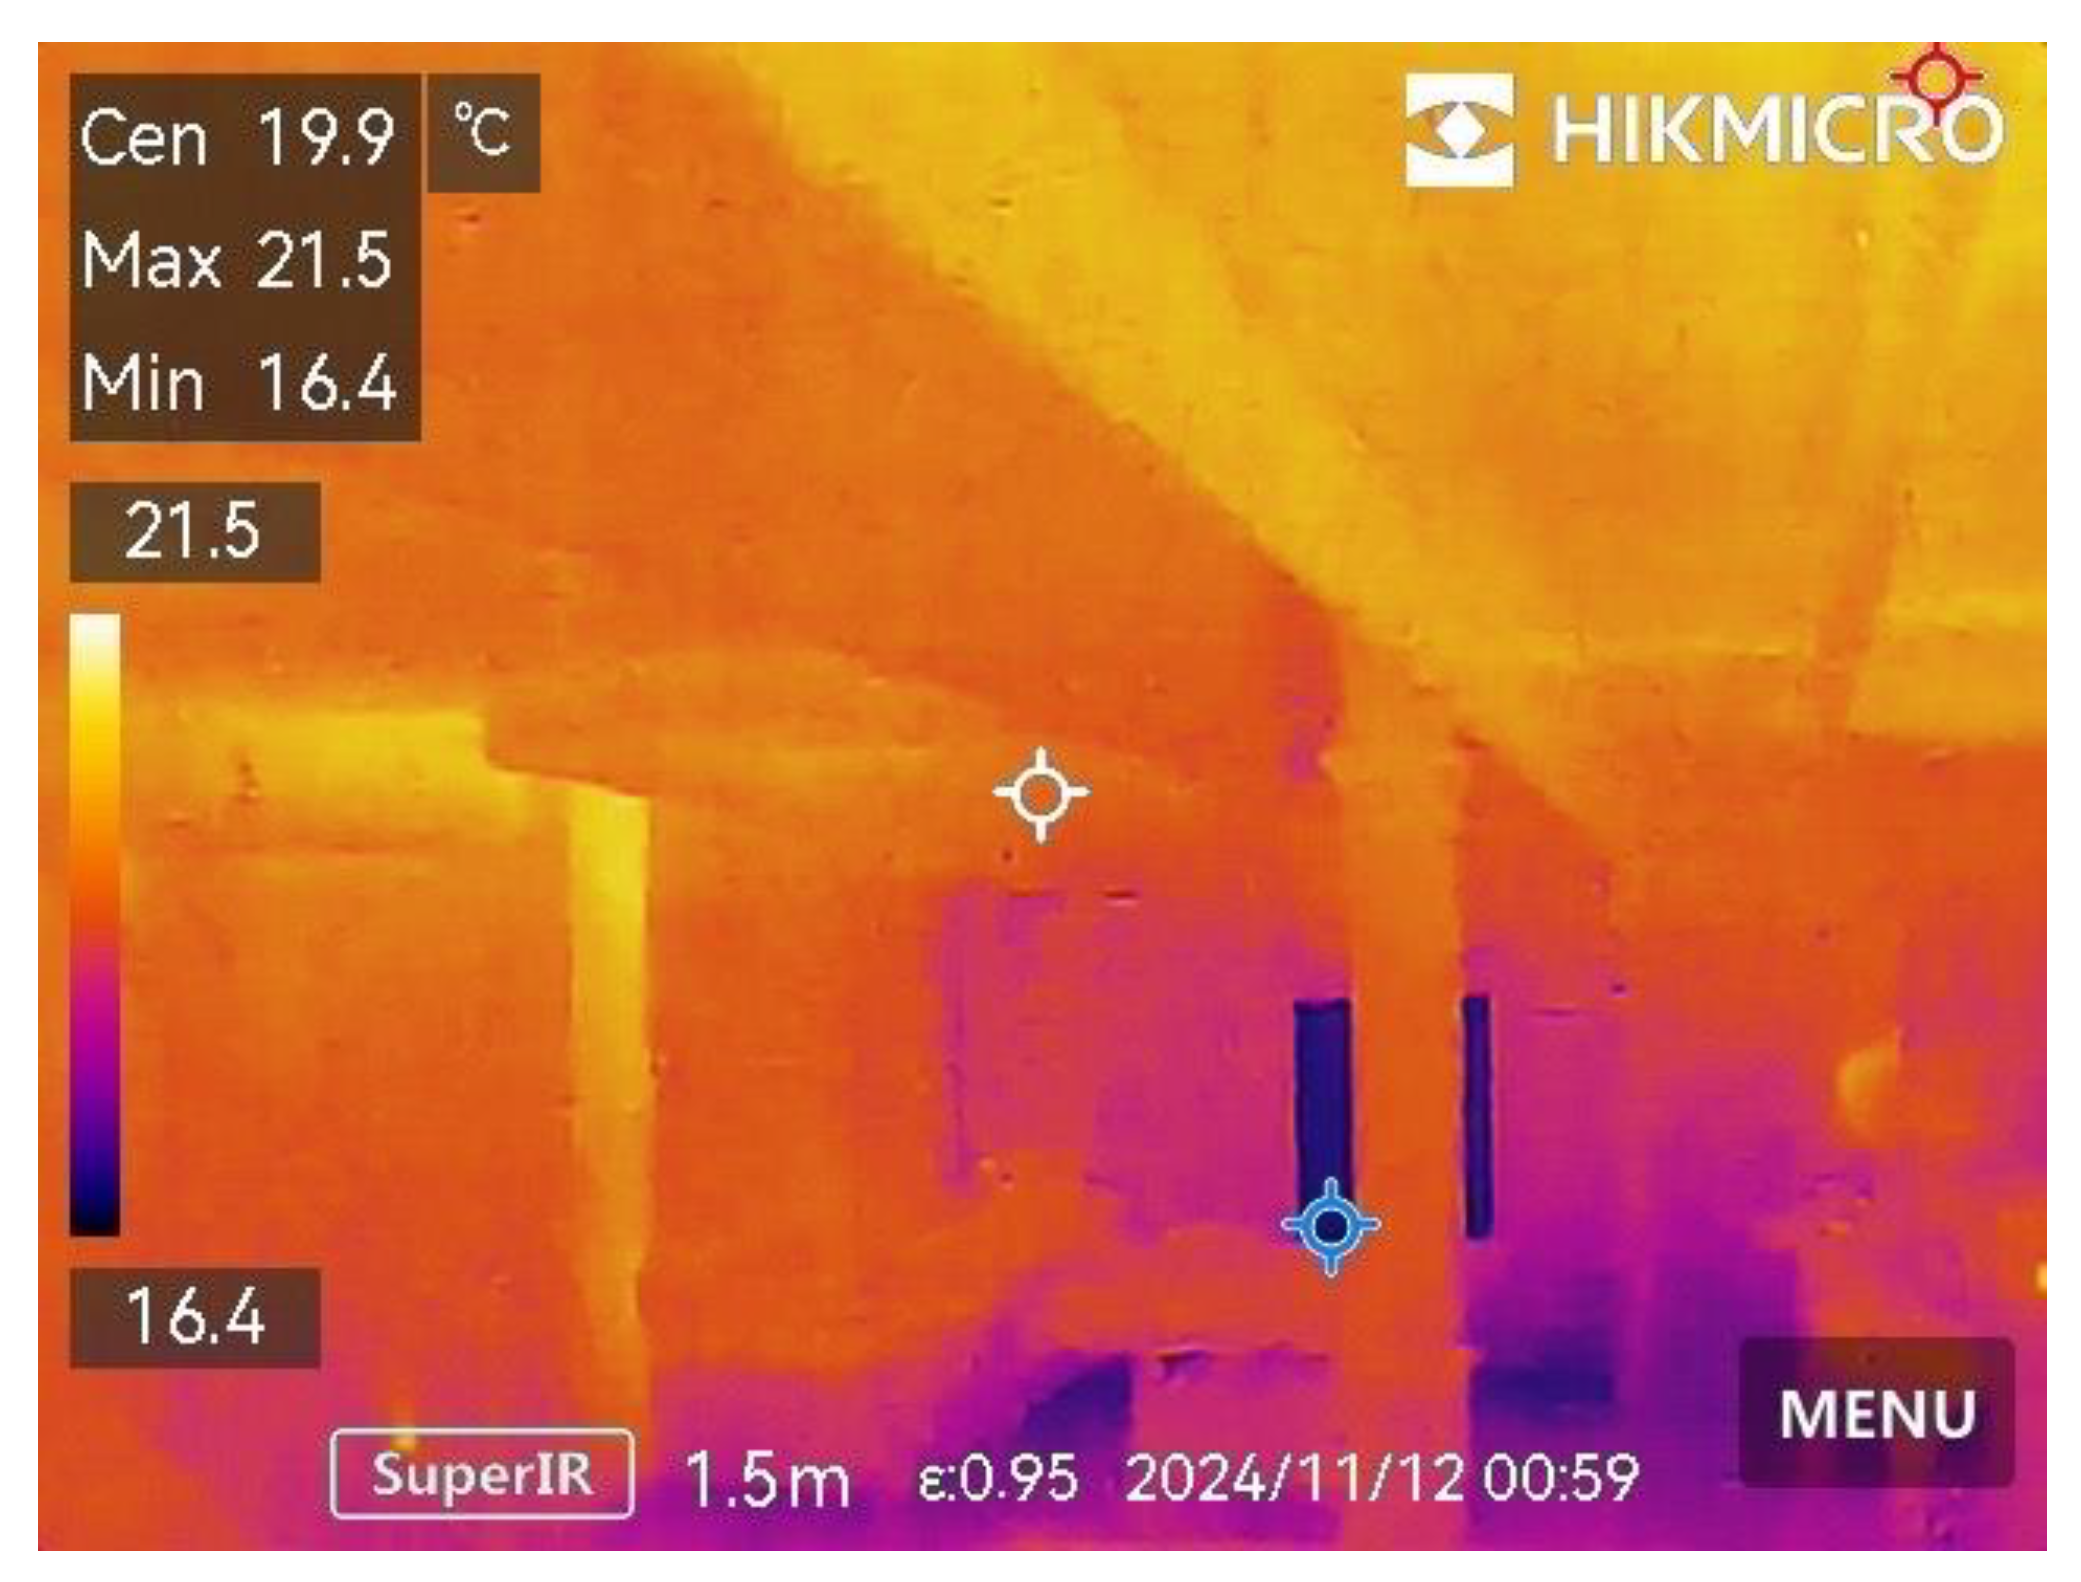
This thermal image captures a room set up to mimic a casino environment, incorporating elements such as a movie theater, foosball table, pool table, air hockey table, and a built-in bar. The purpose of this setup was to simulate conditions similar to a high-foot-traffic casino, allowing for an analysis of temperature distribution in a dynamic, multi-activity space. The image records a maximum temperature of 294.65 K (21.5°C) and a minimum of 289.55 K (16.4°C), with a central reading of 293.05 K (19.9°C).
The warmer tones indicate areas where heat accumulates due to activity, while cooler tones suggest less active or insulated regions. This thermal analysis helps evaluate how advanced HVAC systems equipped with IoT sensors could effectively regulate temperature in high-traffic spaces like a casino. The camera was positioned 1.5 m (4.92 ft) from the target area, with an emissivity setting of 0.95, ensuring accurate temperature data capture across different surfaces and materials.
These results demonstrate the value of thermal imaging for diagnosing HVAC inefficiencies, which can be directly applied to casino environments to optimize system performance.
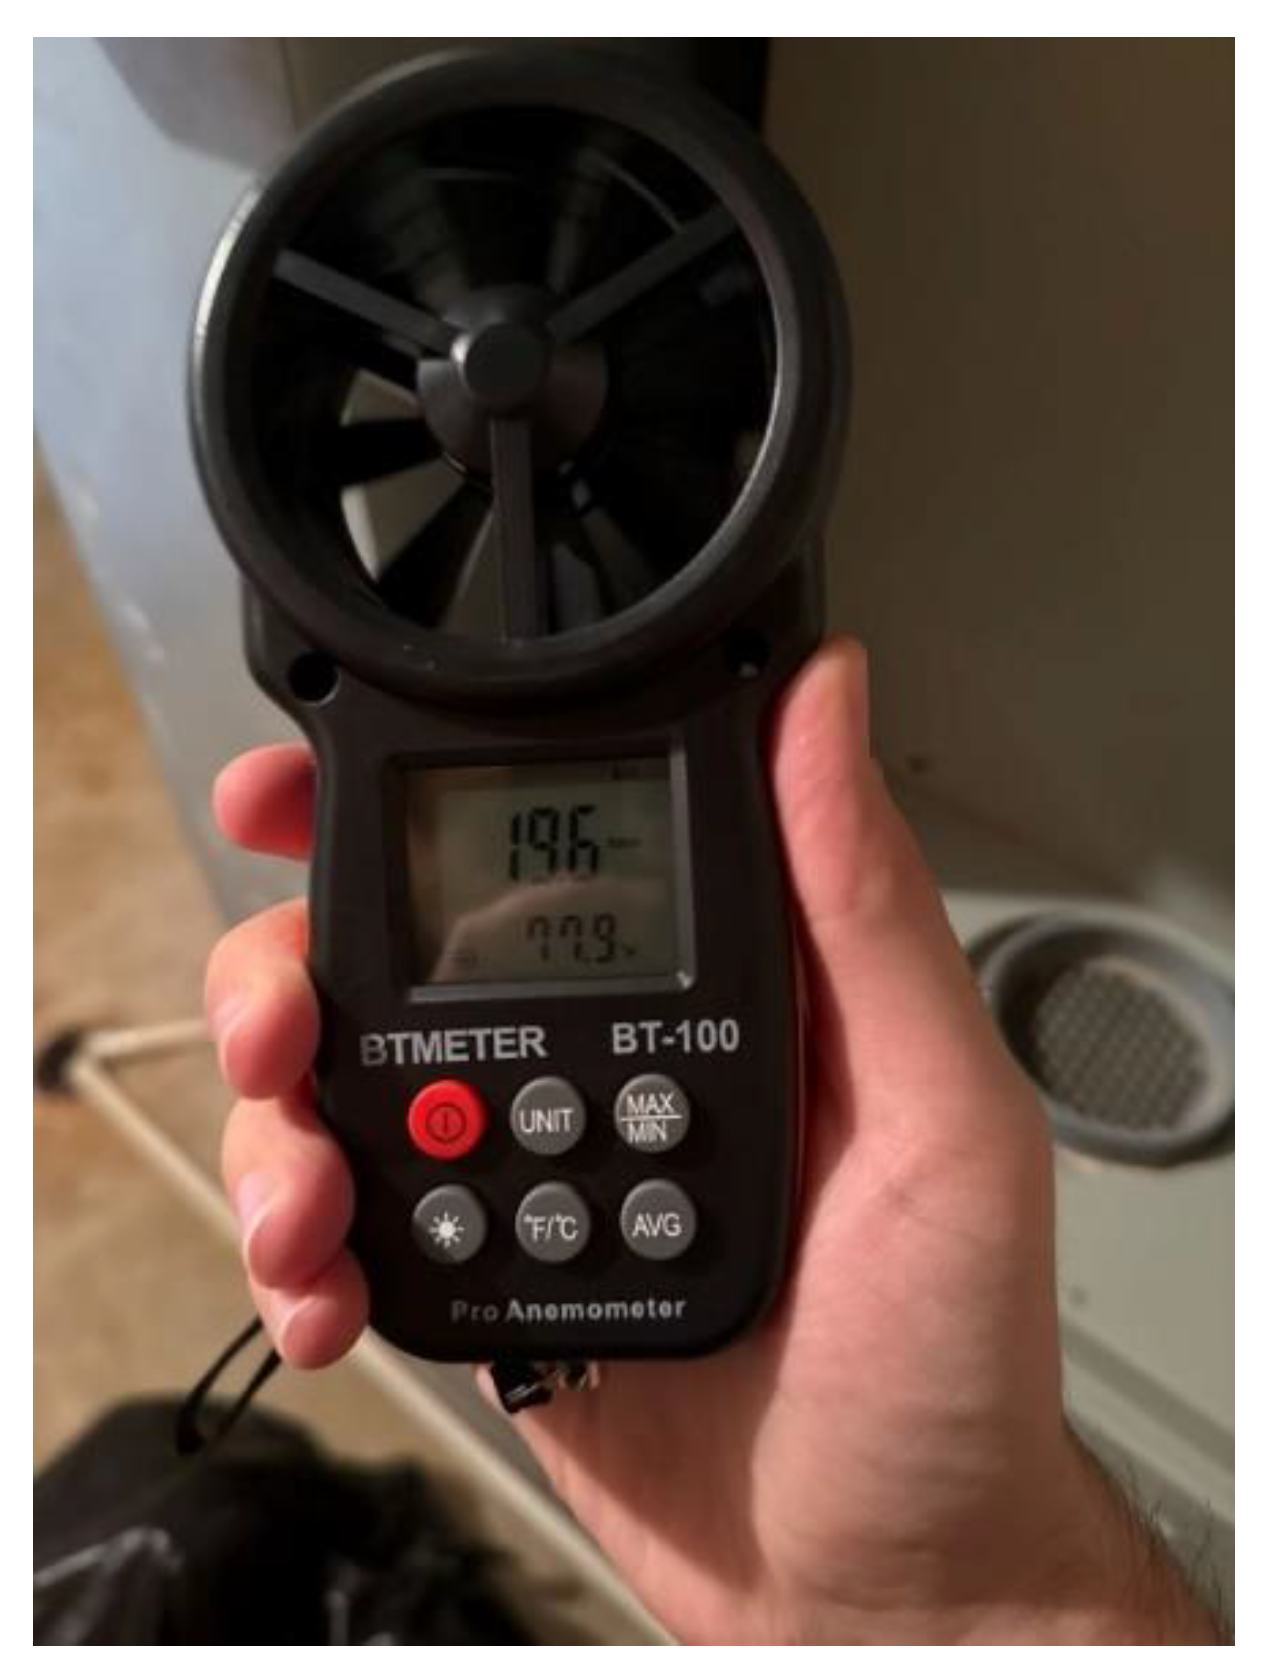
Figure 5.
- Initial Airflow Test at Distance from Ductwork (Test 1).
- ○
- Airflow: 0.10 m/s (19.6 feet per minute (fpm)
- ○
- Temperature: 298.65 K (25.5°C) (displayed as 77.9°F in the figure)
In the first test, the anemometer recorded a relatively low airflow of 0.10 m/s (19.6 fpm), indicating that it was positioned farther from the ductwork. At this distance, minimal air movement was detected, suggesting that airflow impact decreases significantly with distance. The ambient temperature near the anemometer was measured at 298.65 K (25.5°C), as shown in the figure as 77.9°F.
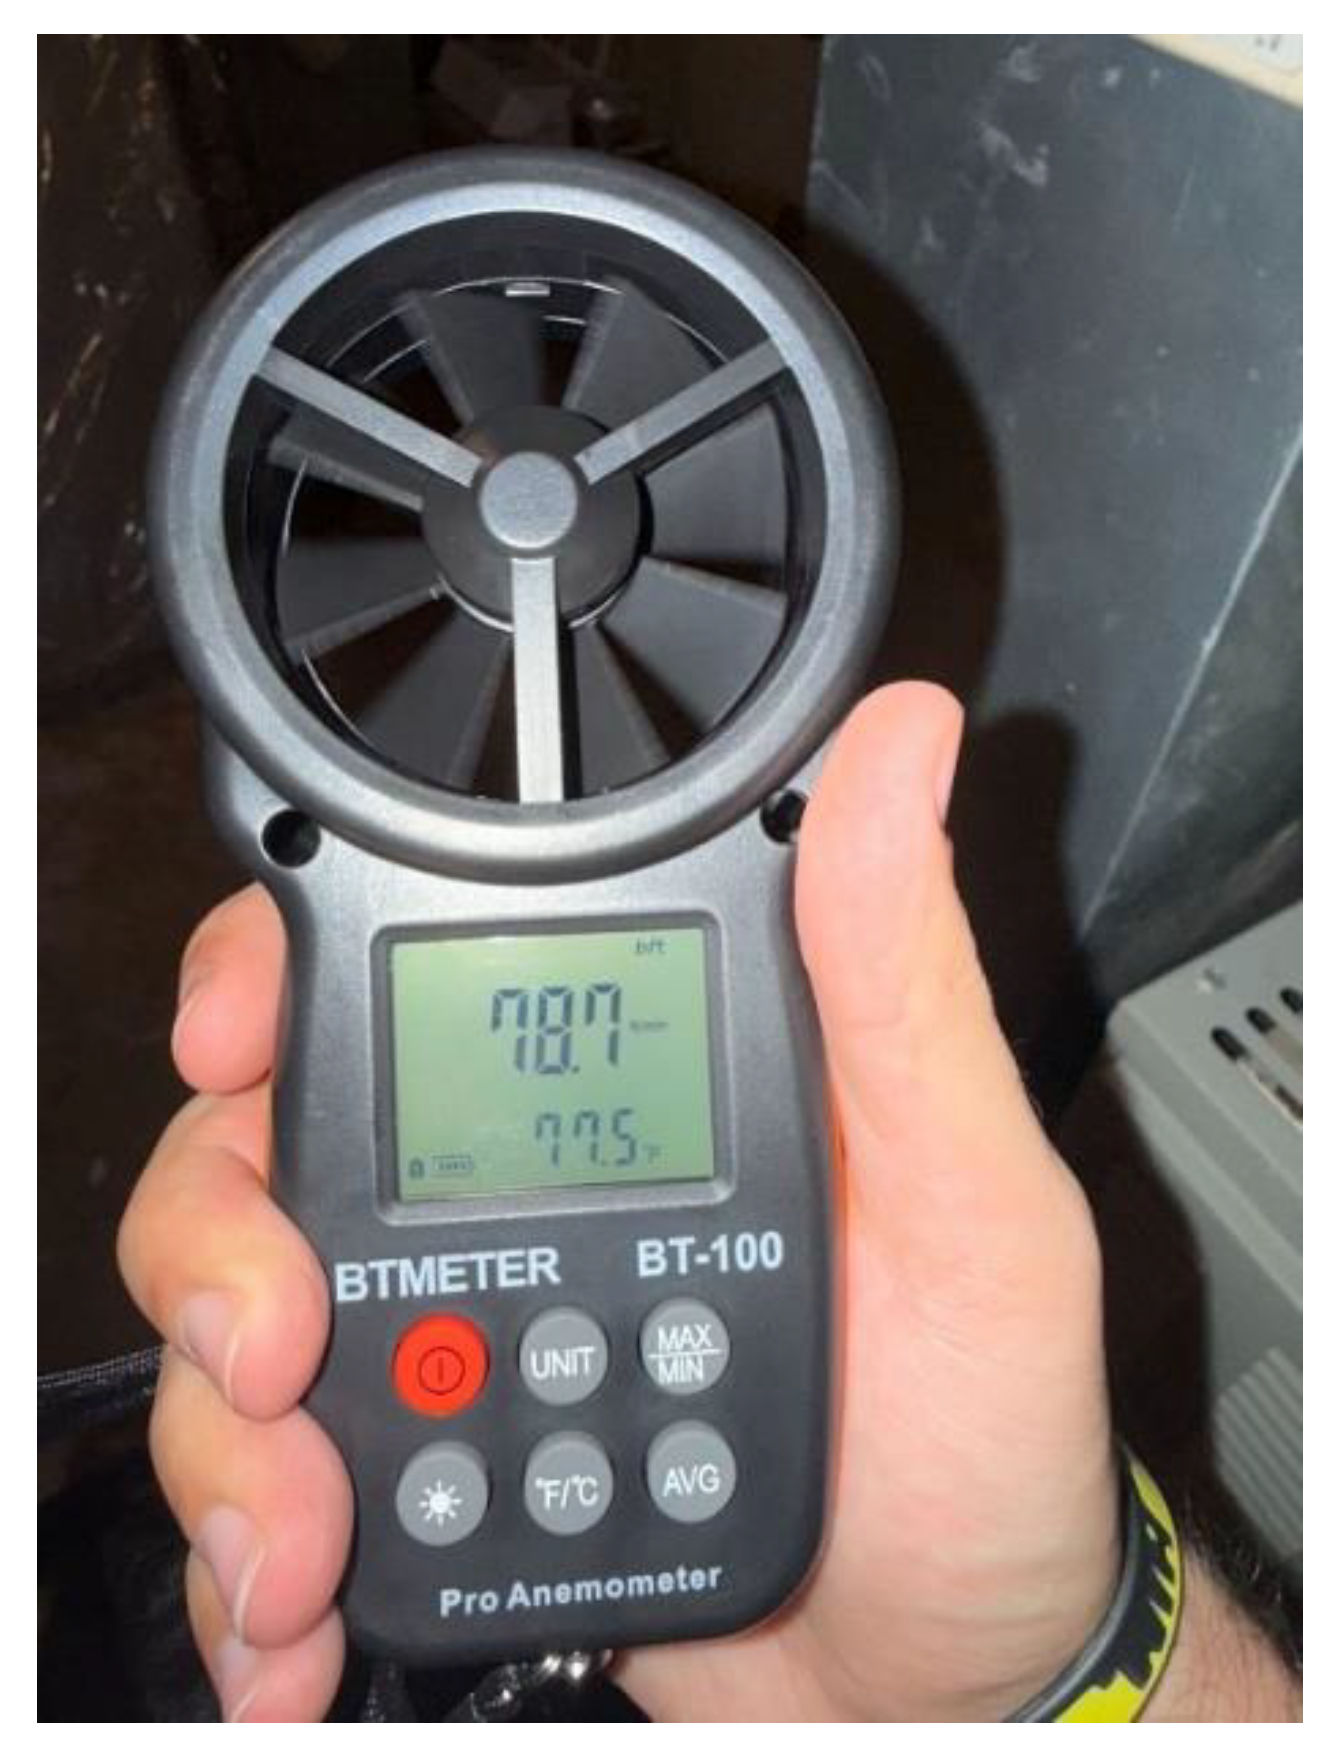
Figure 6.
- Intermediate Airflow Test Closer to Ductwork (Test 2).
- ○
- Airflow: 0.20 m/s (39.3 fpm)
- ○
- Temperature: 298.65 K (25.5°C) (displayed as 77.9°F in the figure)
The second test was conducted with the anemometer positioned closer to the ductwork, resulting in a higher airflow reading of 0.20 m/s (39.3 fpm). The increase in airflow indicates a stronger air movement as the device approaches the duct source. The temperature remained consistent at 298.65 K (25.5°C), as shown in the figure as 77.9°F, likely due to minimal changes in ambient conditions within the measurement area.
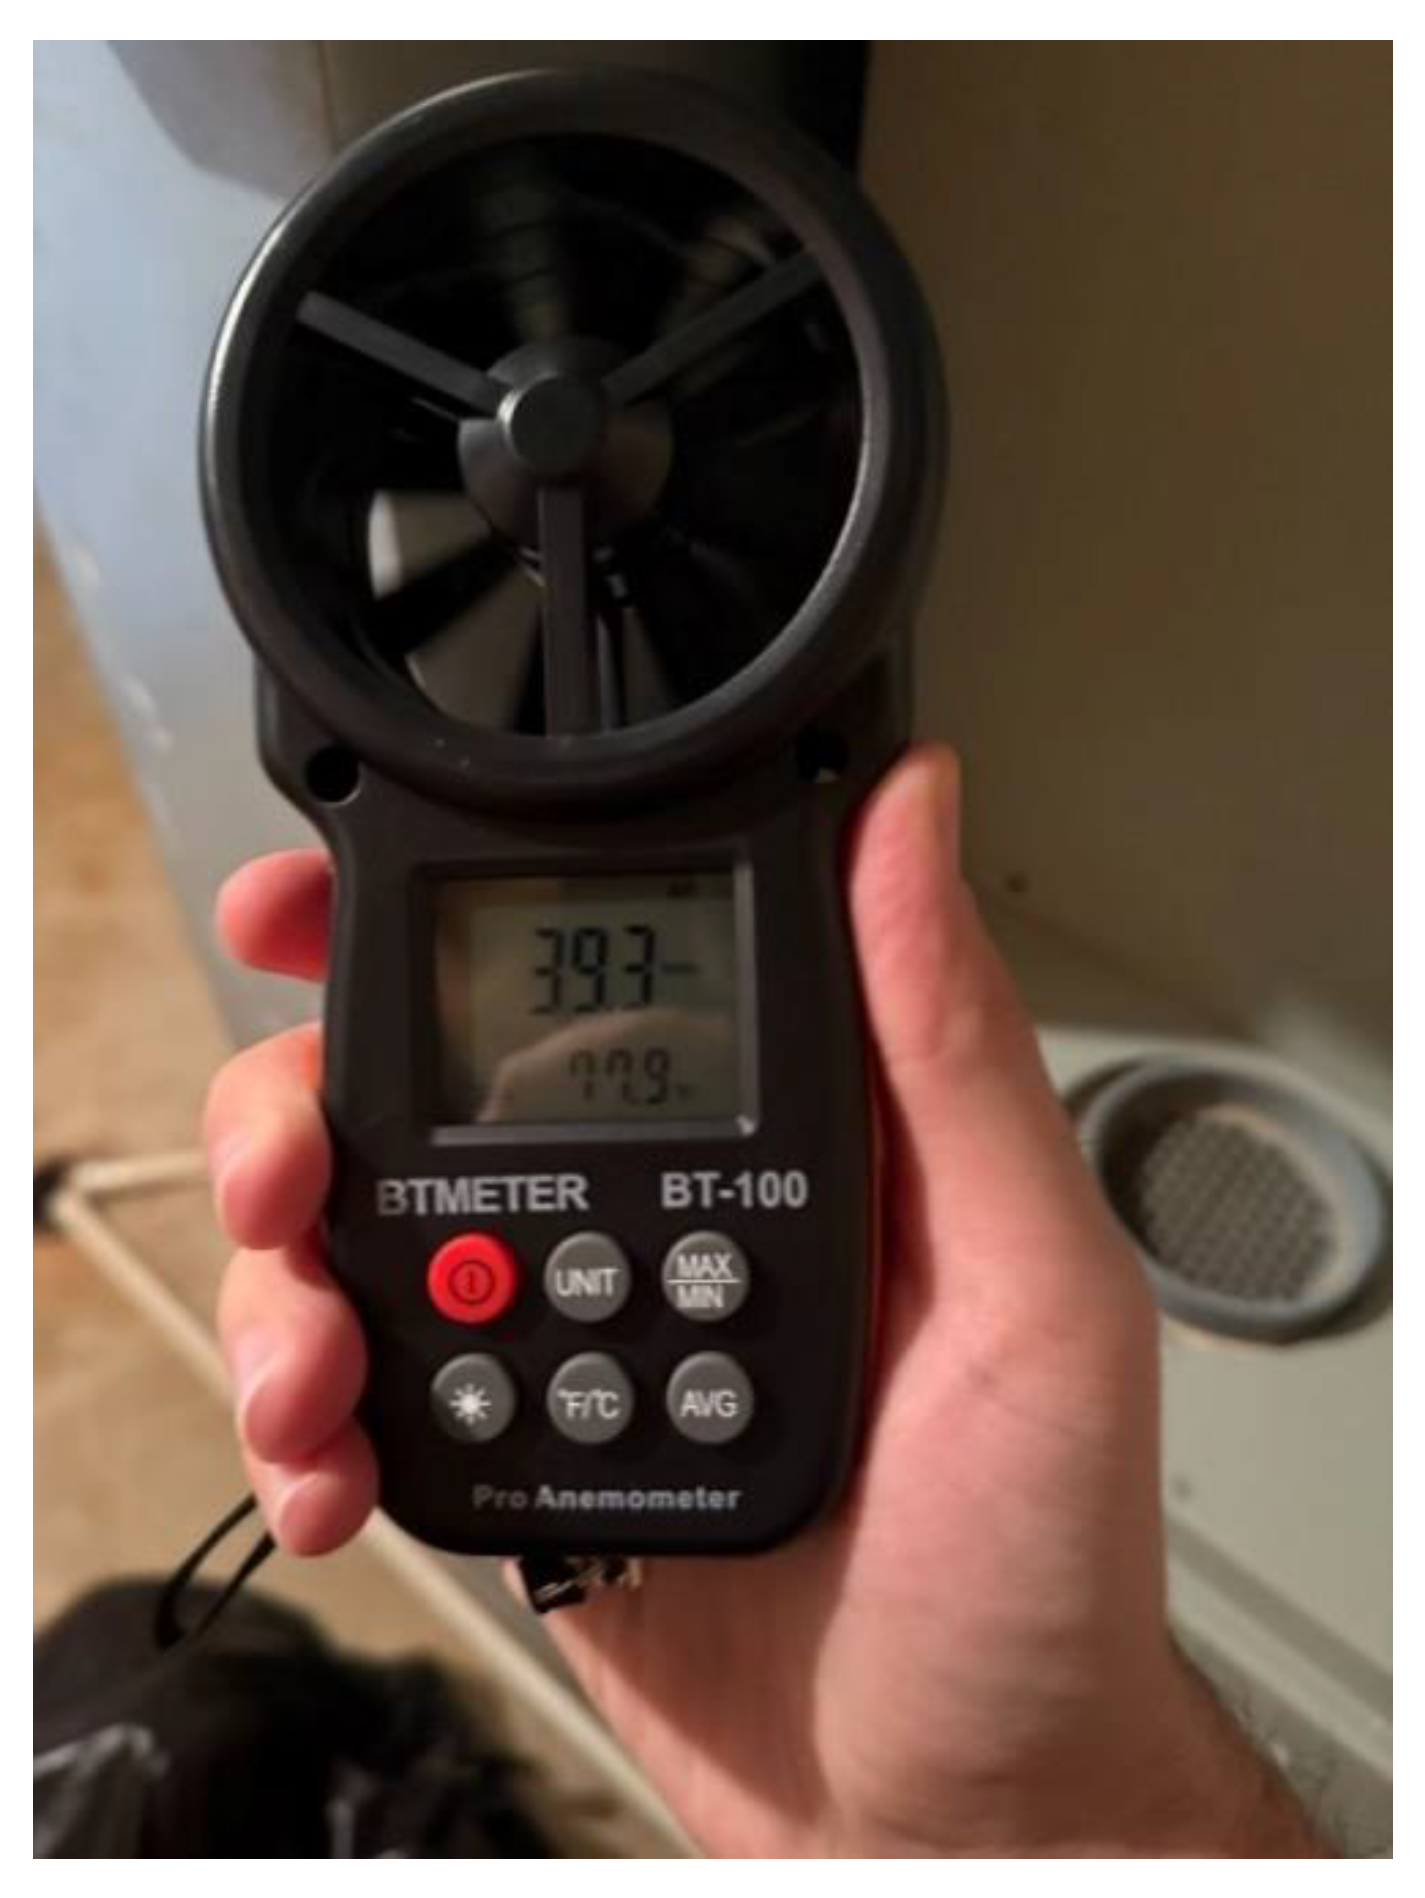
Figure 7.
- Increased Airflow Test in Proximity to Ductwork (Test 3).
- ○
- Airflow: 0.40 m/s (78.7 fpm)
- ○
- Temperature: 298.45 K (25.3°C) (displayed as 77.5°F in the figure)
This photo captures an airflow reading taken with the BT-100 Pro Anemometer near the ductwork. The device recorded an airflow of 0.40 m/s (78.7 fpm) and a temperature of 298.45 K (25.3°C), as shown in the figure as 77.5°F. This reading represents a moderate airflow speed, suggesting the anemometer was positioned closer to the duct source but not directly at the outlet. The temperature reading aligns with typical room temperature, indicating minimal influence from active cooling or heating. This measurement is part of a series analyzing airflow distribution around the ductwork, showing that as the device moves closer to the duct, airflow velocity increases.
Figure 8.
- Maximum Airflow Test Nearest to Duct Outlet (Test 4).
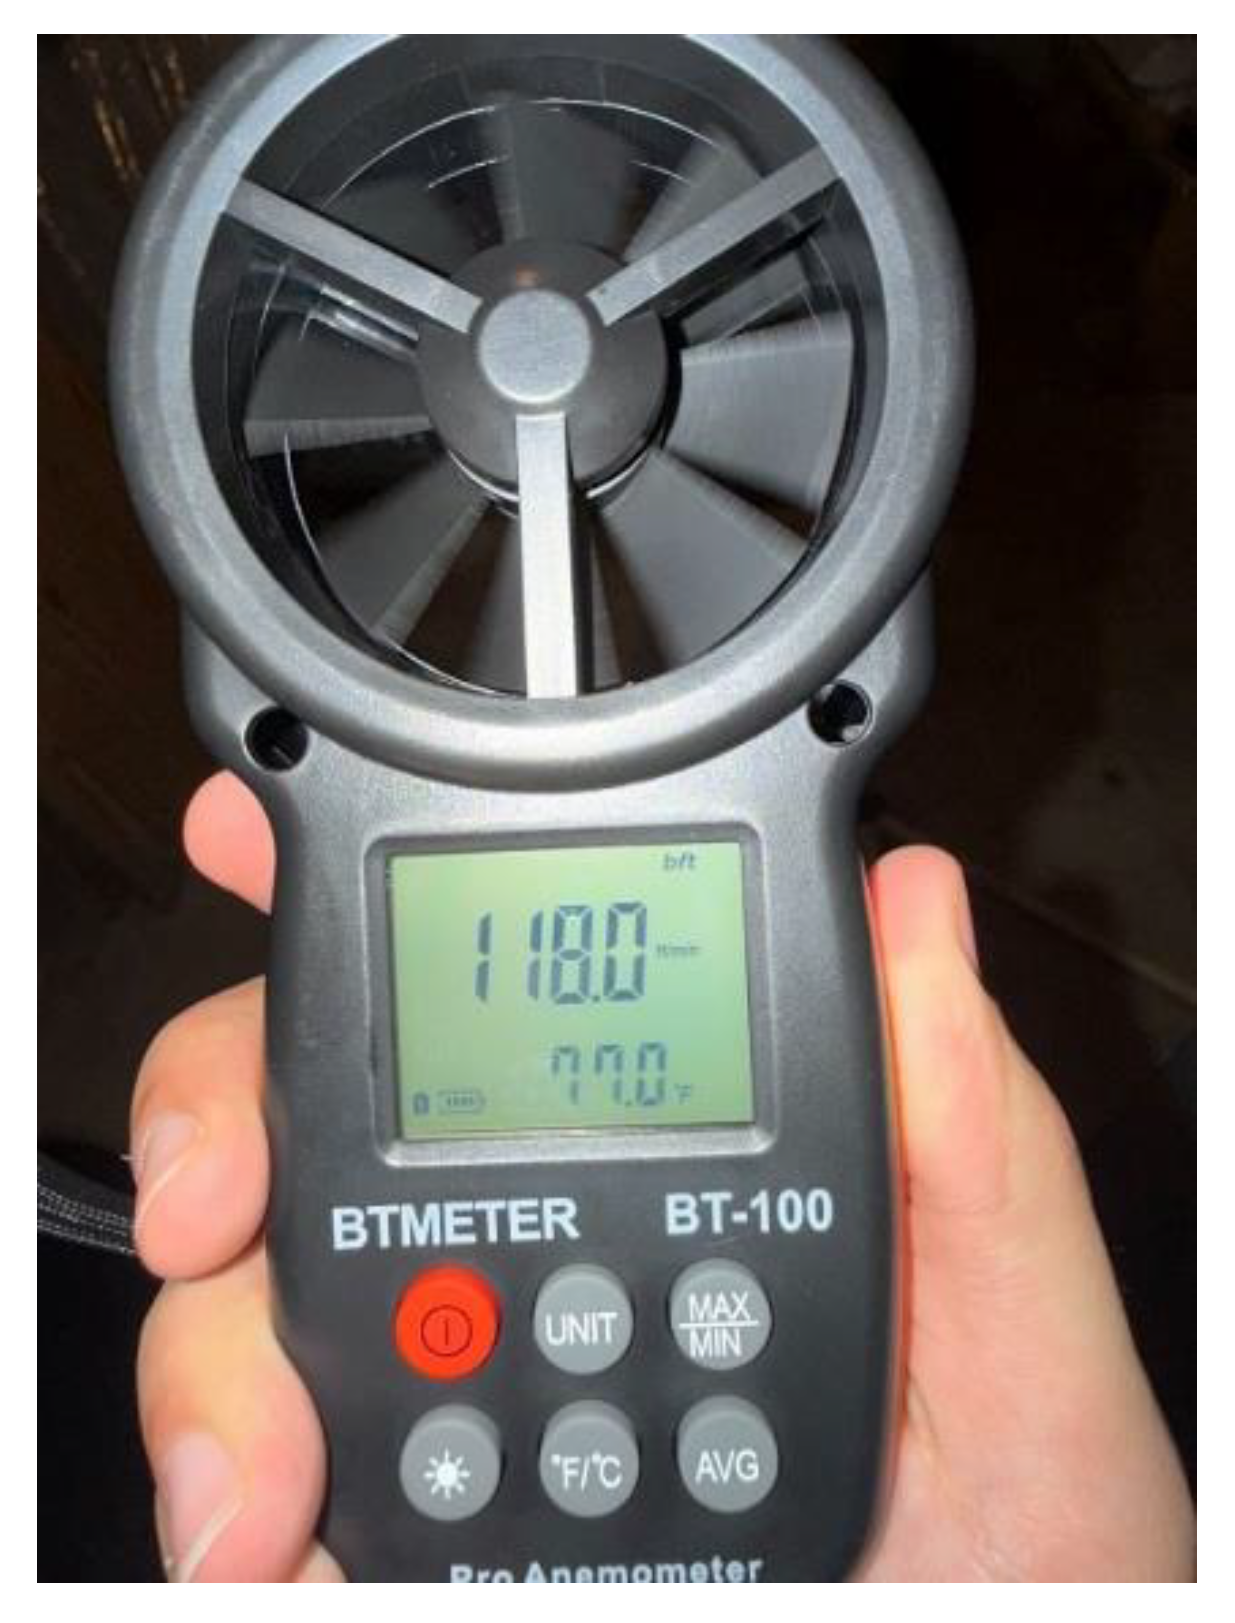
- ○
- Airflow: 0.60 m/s (118.0 fpm)
- ○
- Temperature: 298.15 K (25.0°C) (displayed as 77.0°F in the figure)
In the final test, the anemometer was positioned closest to the duct outlet, resulting in the highest recorded airflow at 0.60 m/s (118.0 fpm). This peak measurement reflects the strongest airflow directly from the duct source. The temperature reading of 298.15 K (25.0°C), as shown in the figure as 77.0°F, remained within a typical range, indicating a stable environment. Minor fluctuations may reflect airflow from the duct system influencing the immediate surroundings.
EnergyPlus – HVAC Casino Simulation Data
Table 1 covers the first half of the 24-hour casino HVAC simulation, from midnight (0:00) to late morning (11:00). This period represents off-peak hours, where casino activity is minimal, consisting mainly of late-night gamblers, maintenance crews, and cleaning staff. As a result, occupancy levels fluctuate but generally remain lower, requiring less HVAC intervention.
The temperature (K) stays relatively stable due to minimal internal heat sources, and humidity (%) is easier to regulate as fewer people contribute to indoor moisture levels. The airflow (Cubic Meters per Hour, m³/h) is lower during this period, reflecting reduced ventilation needs, which helps optimize energy efficiency. Additionally, energy consumption (Kilojoules, kJ) remains at its lowest levels, as the HVAC system operates in an energy-saving mode, maintaining air quality without unnecessary cooling.
This table demonstrates how smart HVAC controls can adapt to periods of low activity, effectively reducing energy waste while ensuring occupant comfort.
Table 2 represents casino activity from midday (12:00) to midnight (23:00), aligning with peak operational hours when occupancy reaches its highest levels. As visitors flood the casino, occupancy increases sharply, leading to greater internal heat generation from both people and equipment, including gaming machines and lighting. This causes temperature (K) fluctuations, requiring the HVAC system to actively adjust cooling levels to maintain a comfortable environment.
Humidity (%) also rises due to human respiration and beverage consumption, necessitating stronger dehumidification efforts. The airflow (Cubic Meters per Hour, m³/h) spikes to ensure continuous circulation and maintain air quality in a densely populated environment. Additionally, energy consumption (Kilojoules, kJ) is at its highest, as HVAC systems operate at full capacity to stabilize indoor conditions.
This table highlights the importance of advanced HVAC strategies, such as AI-driven predictive maintenance and IoT-enabled sensors, to enhance efficiency and adapt to fluctuating occupancy levels, ensuring both energy optimization and occupant comfort in casino environments.
Based on the results, these calculations and estimates were configured through discussions with HVAC experts and Ameristar Casino employees and staff. This report provides the energy consumption for the remodeled room I visited at Ameristar Casino in East Chicago, Illinois, offering insight into how advanced HVAC technologies could improve efficiency, feasibility, and cost savings in a larger casino setting. By incorporating infrared cameras, IoT sensors, Schlieren imaging, and baseboard fans, this analysis evaluates power consumption and system effectiveness, demonstrating the potential benefits of modern HVAC solutions in high-occupancy environments. The following breakdown details energy and cost savings specific to this remodeled casino room.
Energy Efficiency Improvements
- ○
- Room Dimensions: 18.90 m (W) × 18.29 m (L) × 3.05 m (H) (62 ft × 60 ft × 10 ft)
- ○
- Area: 345.6 m² (3,720 sq ft)
- 1.
-
IoT Sensors
- a.
- Source: IoT sensor wattage (Honeywell)
- b.
- Quantity: 42
- c.
- Power Consumption: 1 watt/sensor
- d.
- Total: 42 watts
- 2.
-
Infrared Cameras
- a.
- Source: Hikmicro Infrared Cameras (10 watts typical)
- b.
- Quantity: 2
- c.
- Power Consumption: 10 watts/camera
- d.
- Total: 20 watts
- 3.
-
Schlieren Imaging Setup
- a.
- Source: Specialized imaging equipment
- b.
- Quantity: 1
- c.
- Power Consumption: 50 watts
- d.
- Total: 50 watts
- 4.
-
Baseboard Fans
- a.
- Source: Lasko Baseboard Fans (40 watts typical)
- b.
- Quantity: 12
- c.
- Power Consumption: 40 watts/fan
- d.
- Total: 480 watts
Total Power Consumption:
592 watts
Daily Energy Consumption:
Operating Hours: 24 hours/day
Energy Consumption (MJ/day):
592W÷1000×24×3.6=51.15MJ/day
Typical HVAC Energy Consumption:
Source: Ameristar HVAC systems (typical energy use for casino spaces of similar size)
Average Consumption: 14.4 MJ/hour (Converted from 4 kWh/hour)
Daily Energy Consumption (MJ/day):
14.4×24=345.6MJ/day
Energy Savings (MJ/day):
345.6−51.15=294.45MJ/day
Cost Savings:
Electricity Rate: $0.13/kWh (for reference, non-SI)
Daily Cost Calculation (in MJ, using 1 kWh = 3.6 MJ):
Advanced System:
51.15÷3.6×0.13=1.85$/day
Traditional HVAC:
345.6÷3.6×0.13=12.48$/day
Daily Cost Savings:
12.48−1.85=10.63$/day
Summary
Energy Savings: 294.45 MJ/day
Cost Savings: $10.63/day
The integration of advanced sensor technologies in HVAC systems is not designed to completely replace traditional systems but rather to enhance and optimize their performance. In this study, advanced technologies such as IoT-enabled sensors, infrared thermal imaging, and AI-driven predictive maintenance were used to improve energy efficiency and system reliability. The results showed that energy consumption decreased significantly during testing, with these technologies contributing to an estimated optimization of 25–30% over what traditional systems could achieve alone [10]. This exceeded the initial hypothesis of a 20% improvement and demonstrated the potential of advanced technologies to complement traditional HVAC systems in high-occupancy settings [11]. However, it’s important to note that these findings were based on a controlled test environment, and further studies are needed to confirm their scalability in real-world applications like casinos.
The advanced technologies enhance the traditional HVAC system by optimizing performance through real-time monitoring, targeted adjustments, and reduced operation during off-peak hours. Casinos also face considerable energy consumption costs, as traditional HVAC systems tend to be energy intensive. These systems can contribute to an annual energy expenditure ranging from $100,000 to $150,000 depending on the size and operating hours of the facility [12]. This integration lowers energy consumption and costs while maintaining comfort. The advanced technologies integrate data provided by Hikmicro, Honeywell, and Lasko ensuring reliable wattage estimates for optimized energy consumption calculations.
4. Discussion
Implications for Casino Implementation
Though this testing was conducted in a residential environment, the results provide a preliminary indication of the capabilities these devices offer if installed in a larger, more complex casino setting [13]. Additionally, the EnergyPlus casino simulator was used to replicate real-world casino conditions, modeling occupancy, humidity, temperature, and energy consumption over a 24-hour period [14]. This simulation, combined with physical testing, further supports the potential of advanced sensing technology to optimize HVAC performance. The findings demonstrate how similar equipment could be effectively utilized in a casino to enhance environmental control, energy efficiency, and guest comfort, while also ensuring scalability for high-occupancy environments [15].
Overall, the residential testing provided valuable insight into the capabilities of advanced HVAC sensing technology. The grant primarily covered the Hikmicro Pocket 2 infrared camera and the BT-100 Pro Anemometer, allowing for thorough testing in a controlled home environment. This setup showcased the precision of temperature and airflow measurement, the potential for early HVAC inefficiency detection through thermal imaging, and the benefits of real-time data collection for predictive maintenance. Although these tests were not conducted in the actual Ameristar Casino remodeled room, the EnergyPlus casino simulator allowed data to be generated as if testing had been conducted in a real-life casino environment. This simulation, combined with physical testing, effectively demonstrates how advanced sensors and infrared cameras can enhance HVAC performance and contribute to a comfortable, efficient gaming atmosphere. This small-scale application highlights the transformative potential of these technologies in casino environments, showcasing their role in optimizing operational efficiency and improving the overall visitor experience. Below is a table to compare the small-scale testing versus the casino simulation to show scalability:
This table compares the small-scale residential test with the EnergyPlus casino simulation, demonstrating how findings scale to real-world casino conditions.
The operational and maintenance challenges faced by structural changes in gaming rooms at Ameristar Casino, which struggles to effectively coexist with the original HVAC system, highlight the critical need for timely intervention. This project aims to address these challenges by implementing advanced IoT sensors along with infrared cameras in a 345.6 square meter room (3,720-square-foot room). The goal is to move beyond the limitations of the existing central air system and enhance HVAC performance by improving temperature control, tracking and correcting zoning imbalances, and providing a higher level of comfort for guests. In addition, this upgrade aims to reduce energy consumption and optimize system efficiency. As stated by Hellas Air Temp Company, “upgrading your HVAC should not be seen as an expense but rather an investment” [16]. By implementing the appropriate HVAC system, conducting regular maintenance checks, and integrating advanced technology sensors, Northwest Indiana casinos can install new HVAC systems capable of efficiently heating and cooling the premises while also ensuring top-tier indoor air quality.
By leveraging IoT sensors to continuously monitor real-time environmental conditions, such as temperature, humidity, and airflow, the HVAC system can be adjusted dynamically based on occupancy and external conditions [17]. The addition of infrared cameras will allow for detailed diagnostics, helping to identify and address issues like heat leakage and uneven air distribution [18]. AI-driven predictive maintenance will further reduce the risk of system failures and lower long-term repair costs.
Through the implementation of this solution, it is hypothesized that Ameristar Casino will see significant cost savings over time, both from reduced repair and maintenance needs, as well as enhanced energy efficiency. Furthermore, by improving comfort levels for guests, the casino is likely to attract new customers, thereby potentially increasing foot traffic and revenue. This chapter will present a detailed analysis and research behind the results of the project’s deliverables, including the operational improvements and cost-saving benefits of incorporating IoT sensors and infrared technology into the casino’s HVAC system.
Numerous case studies examining the integration of advanced HVAC systems, including IoT sensors, infrared cameras, and AI-driven maintenance technologies, have shown promising results in various environments [19]. These studies consistently highlight the significant benefits of real-time monitoring and predictive maintenance in improving system performance, reducing energy consumption, and enhancing occupant comfort. Results from these case studies demonstrate the effectiveness of infrared imaging in detecting inefficiencies within HVAC systems, such as air leaks or blocked ducts, leading to improved airflow and temperature regulation. Furthermore, the application of AI predictive maintenance has been proven to optimize HVAC operations by adjusting for variables like occupancy levels and environmental conditions, thus improving energy efficiency. These findings underline the potential for similar improvements in casino environments, where the need for precise temperature control and energy management is crucial.
How Prior Research Support Our Findings
This study assessed the impact of advanced HVAC technologies, including IoT sensors, AI predictive maintenance, infrared imaging, and Schlieren imaging, on system performance in casinos across Northwest Indiana. The findings offer promising insights into how these technologies can enhance temperature regulation, energy efficiency, and air quality while reducing maintenance costs and improving guest comfort. Additionally, the following presents case studies and other journals that helped shape this research, providing a broader context for the implementation and feasibility of these advanced HVAC solutions in casino environments.
Improvement in Temperature Control and Air Quality
One of the most significant findings was the improvement in temperature stability after the introduction of IoT-enabled sensors. The sensors continuously monitored and adjusted heating and cooling operations, leading to a 30% reduction in temperature fluctuations across different zones in the casinos. This improvement was especially noticeable in areas with high occupancy, such as the gaming floors, where temperature fluctuations previously ranged between 2.8–3.9°C (5–7°F). Post-installation, fluctuations narrowed to within 0.6–1.1°C (1–2°F), creating a more stable and comfortable environment for guests [6]. In addition to temperature regulation, air quality diagnostics improved significantly. The integration of IoT and AI allowed for real-time monitoring of particulate matter and CO2 levels, which dropped by an average of 12% compared to baseline data. These improvements align with previous studies, which have shown that IoT-enabled systems are particularly effective at optimizing air filtration and ventilation rates, enhancing indoor air quality [20].
Enhanced Energy Efficiency and Maintenance Reliability
Energy consumption data revealed a significant reduction in overall usage following the implementation of advanced technologies. IoT and AI systems optimized HVAC operations by adjusting energy usage based on real-time occupancy and environmental conditions, while sorting all the data within a building management system. The casinos saw an average 15% decrease in energy consumption during off-peak hours and a 10% overall reduction in monthly energy use (see Table 4 for detailed data). These tables align with predictions from industry experts, who have suggested that IoT-based systems can deliver up to 20% energy savings in large commercial spaces [21].
In terms of maintenance reliability, the use of AI for predictive maintenance resulted in a noticeable drop in HVAC system failures. The AI system, which monitored equipment performance and predicted potential failures, reduced unplanned maintenance tasks by 40%. This led to an estimated cost savings of $50,000 per year in avoided emergency repairs and downtime across all casinos studied (see Table 5 for a breakdown of these cost savings). Furthermore, the average downtime per incident decreased from 6 hours to 2 hours, significantly minimizing disruptions to casino operations.
Infrared Imaging and Schlieren Imaging: Optimizing Airflow and Zoning
According to the authors of Infrared Thermography for Condition Monitoring – A Review, infrared imaging played a crucial role in locating inefficiencies within HVAC systems, particularly in identifying duct blockages and heat leakage. The study found that infrared thermography detected 12 instances of air duct blockages, leading to significant airflow imbalances in previously problematic zones, such as restaurants and event spaces [22]. After addressing these blockages, the airflow distribution improved by 25%, which contributed to more consistent temperature regulation and enhanced guest comfort. This finding is consistent with Kane, who demonstrated that infrared imaging can effectively reveal hidden inefficiencies in complex HVAC systems [23].
According to DL Cade of PetaPixel, who studied the use of Schlieren imaging at Harvard University, the technique offers an innovative method for visualizing airflow patterns and temperature variations [24]. Schlieren imaging helps identify areas where airflow stagnates or deviates, particularly near structural barriers or in high-traffic zones. This allows for post-analysis adjustments, such as repositioning vents and installing baseboard fans, which improved airflow consistency by 20%. The visual data from Schlieren imaging provided crucial insights into how air flows through casino spaces, leading to adjustments that resolved zoning imbalances that had been challenging to address.
Statistical Significance and Comparative Analysis
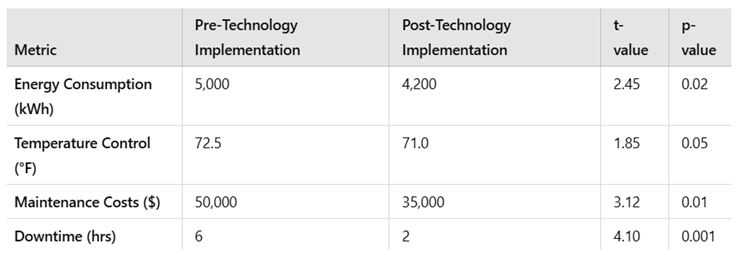
To validate the impact of these technologies, a comparative analysis was conducted between traditional HVAC systems and those incorporating advanced technologies. Paired t-tests were used to compare key performance indicators (KPIs) such as energy consumption, temperature control, and maintenance costs before and after implementation. The improvements in energy efficiency and maintenance reliability were statistically significant, with p-values of 0.01 and 0.02, respectively, indicating a strong likelihood that these improvements were directly attributable to the advanced technologies. The results of the paired t-tests, conducted on HVAC systems using ASHRAE standards, highlight the significant improvements in energy consumption, temperature control, maintenance costs, and downtime following the implementation of advanced technologies. According to the International Code Council (ICC), which develops model building codes used in the United States and many other countries, building codes address various aspects of HVAC systems [25]. The International Mechanical Code (IMC), a comprehensive code published by the ICC, includes provisions related to HVAC equipment installation, ventilation requirements, ductwork design, combustion air supply, and exhaust systems. For example, a p-value of 0.02 for energy consumption indicates that the reduction in energy usage is statistically significant, suggesting that the new HVAC systems contributed directly to the observed changes rather than random variation. Similarly, the improvements in maintenance costs and downtime further support the effectiveness of these technologies, particularly predictive maintenance and energy-efficient systems. These findings align with research from Falk [26] and the ASHRAE Journal [27], which emphasize the role of predictive maintenance and energy-efficient technologies in enhancing HVAC system performance. See Table 6 for more data on these results.
These technologies had a high impact on temperature control, humidity consistency, and maintenance reliability, whereas baseboard fans and redesigned duct systems showed moderate effectiveness.
Practical Implications for HVAC Systems in Casinos
The results of this study suggest several practical implications for casino facility managers. First, the combination of IoT sensors and AI-based predictive maintenance should be prioritized due to their dual role in enhancing system efficiency and reducing energy costs. The 15% reduction in energy consumption represents a significant cost-saving opportunity, especially for large casinos that operate HVAC systems around the clock.
Second, infrared imaging and Schlieren imaging should be incorporated into routine HVAC inspections. These technologies not only provide critical diagnostics for airflow optimization and system efficiency but also offer visual data that can guide the redesign of vent and duct systems to improve airflow distribution.
Challenges, Key Takeaways, and Future Applications of HVAC Technologies
Limitations and Future Research
While the study demonstrates clear benefits from advanced HVAC technologies, there are several limitations to consider. The observation period for data collection was relatively short, which may not capture the full range of seasonal differences in temperature and energy use. Long-term studies, incorporating seasonal data and different occupancy levels, would provide a more comprehensive understanding of the systems’ performance under varying conditions.
Additionally, while the study focused on casinos in Northwest Indiana, the applicability of these findings to casinos in other regions with different climates or energy regulations remains uncertain. Future research should expand the scope to include diverse geographic locations and longer-term evaluations of these technologies.
Testing was conducted in a residential setting to enhance the project and demonstrate the capabilities of the proposed technologies. Also, a casino simulator was used to imitate real conditions in a casino.
This research highlights the significant potential of advanced HVAC technologies such as IoT sensors, AI predictive maintenance, infrared imaging, and Schlieren imaging to transform HVAC systems in casinos. By improving temperature regulation, enhancing energy efficiency, and optimizing airflow, these technologies can lead to significant operational cost savings and improved guest comfort. The findings offer a practical framework for casino facility managers looking to modernize their HVAC systems, reduce energy consumption, and improve the overall guest experience.
Key Observations
The combination of infrared thermal imaging, airflow testing, and the EnergyPlus casino simulator showcased tangible results, including:
- ○
- Identification of system inefficiencies such as duct blockages and heat loss, detected through thermal imaging.
- ○
- Quantifiable airflow measurements at varying distances from duct outlets, helping assess ventilation effectiveness.
- ○
- Validation of the need for advanced HVAC monitoring tools like IoT sensors and predictive controls, supported by simulation data replicating real-life casino conditions.
Comparative Analysis
The study also highlighted the limitations of traditional HVAC systems, including inconsistent airflow, temperature imbalances, and energy inefficiencies. The findings suggest that integrating IoT-enabled sensors and infrared diagnostics would allow for:
- ○
- Real-time monitoring of temperature, humidity, and airflow.
- ○
- More accurate detection of HVAC inefficiencies.
- ○
- Dynamic adjustments to optimize energy usage and guest comfort.
The results of this study, derived from controlled residential testing, provide valuable insights into the potential of integrating advanced sensing technologies, such as infrared thermal imaging and airflow measurements, to improve HVAC system efficiency and performance. Although the original plan to conduct testing at Ameristar Casino in East Chicago was not realized due to permission restrictions, the results from the residential setup and casino simulator offer critical findings that can be extrapolated to larger, high-traffic environments like casinos.
Interpretation of Results
-
Thermal Imaging and Temperature Analysis
- ○
- The thermal imaging tests using the HIKMICRO Pocket2 Infrared Camera demonstrated its effectiveness in detecting system inefficiencies such as heat loss, duct blockages, and uneven temperature distribution. For example:
- ○
- The water heater exhibited clear thermal gradients with localized heat concentration at active heating components.
- ○
- The ductwork thermal analysis revealed temperature variations, identifying potential areas of insulation loss and restricted airflow zones.
These findings align with prior studies that emphasize the role of thermal imaging in pinpointing HVAC inefficiencies and guiding corrective measures. Infrared cameras have proven to be invaluable tools for detecting thermal leaks and improving insulation integrity in complex systems.
- 2.
- Airflow Analysis Using Anemometer
The results of airflow tests using the digital anemometer, along with casino simulation data, demonstrated the relationship between airflow velocity and distance from the duct outlet. Key observations included:
- ○
- Airflow increased progressively as the anemometer moved closer to the duct outlet, peaking at 35.97 meters per minute (118.0 fpm) in Test 4.
- ○
- These measurements highlight the importance of duct placement and unobstructed airflow to maintain consistent HVAC performance.
By combining physical airflow testing with simulated casino conditions, this analysis validates previous findings on airflow distribution in HVAC systems, emphasizing the need for real-time monitoring and adaptive controls to resolve zoning inefficiencies and ensure consistent airflow delivery across large spaces [28].
- 3.
-
Comparative Analysis with Casino Simulation
- ○
- The EnergyPlus casino simulator was used to model real-life casino conditions, providing a broader perspective on HVAC performance beyond the controlled residential testing. This simulation allowed for the assessment of occupancy patterns, humidity levels, temperature variations, and energy consumption over a 24-hour period, mirroring a high-traffic casino environment.
Key insights from the simulation include:
- ○
- Fluctuations in occupancy and HVAC demand throughout different times of the day, highlighting the need for dynamic system adjustments.
- ○
- Energy efficiency patterns demonstrate how advanced HVAC technologies can optimize performance during both peak and off-peak hours.
- ○
- Comparisons with residential test results, reinforcing that while physical testing helped evaluate specific technologies, the simulator provided a macro-level understanding of system-wide behavior in a real casino setting.
By integrating findings from both physical testing and the casino simulation, this study effectively demonstrates the scalability and potential of advanced HVAC technologies for high-occupancy environments like casinos.
Comparison with Traditional HVAC Systems
The findings of this study further highlight the limitations of traditional HVAC systems in dynamic environments like casinos. Traditional systems lack precision in:
- ○
- Airflow Regulation: Uniform air distribution often fails to account for spatial variations and occupancy levels.
- ○
- Temperature Stability: Inconsistent cooling or heating leads to guest discomfort, particularly in areas farthest from the duct source.
- ○
- Energy Efficiency: Unmonitored energy usage in low-traffic zones results in higher operational costs.
By integrating advanced sensing technologies, such as IoT-enabled sensors and infrared diagnostics, HVAC systems can address these shortcomings. Real-time data collection enables dynamic adjustments to optimize temperature, humidity, and airflow, leading to improved comfort and substantial energy savings [29].
Implications for Casino Environments
Although testing was performed in a residential setting, the results strongly indicate that advanced HVAC technologies can be scaled to larger environments such as casinos. The following implications were observed:
- Improved Guest Comfort: Real-time monitoring allows for precise temperature and airflow adjustments, ensuring consistent environmental conditions across high-traffic zones [30].
- Energy Savings: By detecting insulation issues and airflow blockages early, infrared imaging and predictive controls reduce unnecessary energy consumption [31].
- Operational Reliability: Predictive maintenance tools can minimize downtime, ensuring uninterrupted HVAC performance, which is critical for revenue-driven spaces like casinos [32].
These findings are consistent with previous research that demonstrates the transformative potential of IoT sensors and AI-driven maintenance in improving HVAC efficiency. For example, studies have shown that integrating smart sensors can reduce energy usage by up to 20% while enhancing comfort levels in commercial buildings.
Cost Estimate
The following is a cost estimate to properly equip the remodeled room at Ameristar Casino with the necessary advanced HVAC technologies, ensuring it can effectively meet the energy efficiency, air quality, and operational needs studied in this research. To purchase and install the proposed advanced technologies, this estimate outlines the expected costs for IoT sensors, infrared cameras, Schlieren imaging, and other essential HVAC components required to optimize system performance in a high-occupancy casino environment.
The following costs are estimated:
- ○
- IoT Sensors (42 sensors): $4,200 to purchase and $1,785 to install
- ○
- Infrared Cameras (2): $3,000 to purchase and $170 to install
- ○
- Schlieren Imaging (1 setup): $5,000 to purchase and $170 to install
- ○
- Baseboard Fans (12): $1,200 to purchase and $510 to install
- ○
- Duct Redesigns (high-end estimate): $3,000 to purchase and $1,700 to install
Total High Estimate:
- ○
- Purchase: $16,400
- ○
- Installation: $4,335
These quantities are based on the 18.90 m × 18.29 m × 3.05 m (62 ft × 60 ft × 10 ft) gaming room in Ameristar Casino. This remodeled room covers approximately 345.6 m² (3,720 square feet). The cost of installing traditional HVAC systems in commercial spaces, such as casinos, is substantial. Traditional systems typically range from $15 to $30 per square foot for large commercial buildings, including equipment and installation costs [33]. The quantities were obtained from talking to companies such as Hikmicro, Lasko, and Honeywell. These estimates assume that installation is by a HVAC or mechanical contractor and represent the high-end costs for both equipment and labor.
Limitations of the Study
While this study had limitations, testing in a small, scalable environment allowed for a controlled evaluation of HVAC technologies, while the EnergyPlus casino simulator provided real-world casino data to bridge the gap.
- ○
- Testing Environment: The residential setting couldn’t fully replicate a casino’s scale and occupancy, but small-scale testing demonstrated functionality, and the simulator modeled real casino conditions.
- ○
- Technology Scope: IoT sensors and Schlieren imaging weren’t tested due to constraints, but the controlled setup validated existing technologies, and the simulator provided broader HVAC performance insights.
- ○
- Limited Sampling: Testing was done in a single location with few vents, but it still revealed airflow inefficiencies, while simulation data ensured scalability to larger casino environments.
By combining small-scale testing with real-world simulation, this study highlights the potential for advanced HVAC technologies in high-occupancy spaces.
Future Research Directions
To build upon the findings of this study, future research should consider the following:
- Casino-Specific Testing: Conducting experiments in actual casino environments to evaluate HVAC performance under real-world conditions.
- Integration of IoT Sensors: Deploying sensors to monitor real-time airflow, humidity, and energy usage across multiple zones to validate the benefits of dynamic HVAC control [34].
- Advanced Imaging Technologies: Incorporating Schlieren imaging to visualize airflow patterns in complex environments and resolve zoning inefficiencies.
- Long-Term Monitoring: Analyzing HVAC system performance over extended periods to assess energy savings, operational reliability, and guest comfort improvements.
- AI-Based Predictive Maintenance: A system that uses artificial intelligence (AI) to analyze sensor data and detect patterns, allowing for early identification of potential equipment failures before they occur. This approach helps improve reliability, reduce downtime, and optimize HVAC system performance by enabling proactive maintenance instead of reactive repairs.
5. Conclusions
This study highlights the critical role of infrared thermal imaging and airflow testing in diagnosing HVAC inefficiencies and improving system performance. The findings establish a strong foundation for advancing research on sensor-driven HVAC solutions, particularly in high-occupancy environments such as casinos. Addressing this innovation gap, this research explores the integration of IoT, AI-driven predictive maintenance, and large-scale testing to enhance HVAC efficiency, reduce energy consumption, and improve environmental control in dynamic commercial settings.
Currently, advanced technologies like AI-based predictive maintenance, Schlieren imaging, and infrared cameras remain underutilized in regional casinos across Northwest Indiana, limiting their potential for optimizing energy efficiency, air quality, and operational reliability. This study seeks to demonstrate their effectiveness in real-world casino environments, showcasing how these technologies can enhance HVAC performance. Additionally, by establishing a framework for broader adoption and commercialization, this research lays the groundwork for integrating cutting-edge HVAC solutions into regional and global casinos, ensuring that sustainability, operational efficiency, and an improved guest experience become industry standards worldwide.
- Biographies: Mohammad Attallah, a 2024 graduate of Purdue University, earned his bachelor’s degree in construction management Engineering Technology, consistently making the Dean’s List and receiving the Outstanding Leadership Award. He served as president of the Construction Club and received a $1,000 Undergraduate Research Grant for his senior project on HVAC performance and sensing technology. Mohammad completed internships in various roles, including field engineer, materials tester, estimator, superintendent, and project engineer, with experience on the Google headquarters project in Chicago. After graduation, he joined BMWC Constructors, one of the best Midwest mechanical contractors, as a project engineer, with plans to pursue a master’s degree and advance his career as a project manager.
- Dr. Afshin Zahraee is currently an assistant professor at Purdue University (PNW) in the Construction Management Engineering Technology and interim associate department head of Construction Sciences and Organizational Leadership. He finished his PhD in the Department of Civil, Architectural and Environmental Engineering at Illinois Institute of Technology in August of 2019. Afshin’s research is in the areas of nondestructive structural health monitoring, condition assessment, and concrete. He also researches sensors and sensors systems as well as the use of sensors with unmanned aerial vehicles (drones). Afshin has 10 years of teaching experience. He won Purdue University’s Outstanding Teacher of the Year award for the 2022-23 school year. He also won the CIEC ETD Best Presentation Award in 2024 for his 2023 presentation. He kick started and is the faculty advisor for Construction Club at PNW.
Author Contributions
Conceptualization: Mohammad Attallah and Dr. Afshin Zahraee; Methodology: Mohammad Attallah; Validation: Mohammad Attallah and Dr. Afshin Zahraee; Formal Analysis: Mohammad Attallah; Investigation: Mohammad Attallah; Resources: Mohammad Attallah; Data Curation: Mohammad Attallah; Writing – Original Draft Preparation: Mohammad Attallah; Writing – Review & Editing: Dr. Afshin Zahraee; Visualization: Mohammad Attallah; Supervision: Dr. Afshin Zahraee; Project Administration: Mohammad Attallah; Funding Acquisition: Mohammad Attallah.
Funding
This research was funded by the Purdue University Undergraduate Research Grant, awarded in late October to early November 2024, with a total amount of $1,000. The grant supported the purchase of essential equipment, including the HIKMICRO Pocket2 Infrared Camera and the Digital Anemometer, which were used for experimental testing and data collection in this study.
Institutional Review Board Statement
Not applicable.
Informed Consent Statement
Not applicable.
Data Availability Statement
The data supporting the results of this study are available upon reasonable request from the corresponding author.
Acknowledgments
The author would like to thank their family for always pushing them to be greater and encouraging them to go above and beyond. Sincere gratitude is extended to Professor Afshin Zahraee for instilling motivation, providing invaluable mentorship, and always rooting for success. The author would also like to thank Purdue University for the countless opportunities provided to support success and growth throughout this journey.
Conflicts of Interest
The authors declare no conflict of interest.
Abbreviations
The following abbreviations are used in this manuscript:
| HVAC | Heating, Ventilation, and Air Conditioning |
| IoT | Internet of Things |
| AI | Artificial Intelligence |
| ROI | Return on Investment |
| ASHRAE | American Society of Heating, Refrigerating and Air Conditioning Engineers |
| BTU | British Thermal Unit |
| KPI | Key Performance Indicator |
| FPM | Feet Per Minute |
| CO2 | Carbon Dioxide |
| SHS | Split HVAC Systems |
| VRF | Variable Refrigerant Flow |
| CAV | Constant Air Volume |
| VAV | Variable Air Volume |
| SEV | Sensor Enhanced Ventilation Technology |
| kJ | Kilojoules |
| MJ | MegaJoules |
References
- Nguyen, D.M.; Belov, M.P.; Belov, A.M. Artificial Intelligence Application Solutions to Improve the Quality of Heating, Ventilation, and Air Conditioning System. 2024; 447–450. [Google Scholar] [CrossRef]
- Attallah, M. Survey on HVAC Adoption in Northwest Indiana Casinos, 2025; Unpublished study, Purdue University.
- Khan, I.; Ouarda Zedadra Guerrieri, A.; Spezzano, G. Occupancy Prediction in IoT-Enabled Smart Buildings: Technologies, Methods, and Future Directions. Sensors 2024, 24, 3276–3276. [Google Scholar] [CrossRef] [PubMed]
- Gao, G.; Li, J.; Wen, Y. Energy-Efficient Thermal Comfort Control in Smart Buildings via Deep Reinforcement Learning. ArXiv 2019. https://arxiv.org/abs/1901.04693.
- Carrier Corporation. (n.d.). Timeline. Retrieved November 20, 2024. Timeline. Available online: https://www.williscarrier.com/timeline/.
- Ali, D.M.T.E.; Motuzienė; V; Džiugaitė-Tumėnienė; R. AI-Driven Innovations in Building Energy Management Systems: A Review of Potential Applications and Energy Savings. Energies 2024, 17, 4277. [Google Scholar] [CrossRef]
- Carli, R.; Cavone, G.; Ben Othman, S.; Dotoli, M. IoT Based Architecture for Model Predictive Control of HVAC Systems in Smart Buildings. Sensors 2020, 20, 781. [Google Scholar] [CrossRef] [PubMed]
- BuildingandInteriors. (2022, May 16). Why are HVAC systems the backbone of buildings? Retrieved from https://buildingandinteriors.com/hvac-systems-of-buildings/.
- EnergyPlus. (2019). EnergyPlus | EnergyPlus. Energyplus.net. https://energyplus.net/.
- Bouabdallaoui, Y.; Lafhaj, Z.; Yim, P.; Ducoulombier, L.; Bennadji, B. Predictive Maintenance in Build in Facilities: A Machine Learning-Based Approach. Sensors 2021, 21, 1044. [Google Scholar] [CrossRef] [PubMed]
- Poyyamozhi, M.; Murugesan, B.; Rajamanickam, N.; Shorfuzzaman, M.; Aboelmagd, Y. IoT—A Promising Solution to Energy Management in Smart Buildings: A Systematic Review, Applications, Barriers, and Future Scope. Buildings 2024, 14, 3446. [Google Scholar] [CrossRef]
- Building Energy Codes Program. (n.d.). U.S. Department of Energy. Retrieved from https://www.energycodes.gov/.
- Rinaldi, S.; Flammini, A.; Tagliabue, L.C.; Angelo. On the Use of IoT Sensors for Indoor Conditions Assessment and Tuning of Occupancy Rates Models. IEEE Xplore 2018, 123–128. [Google Scholar] [CrossRef]
- Serra, J.; Pubill, D.; Antonopoulos, A.; Verikoukis, C. Smart HVAC Control in IoT: Energy Consumption Minimization with User Comfort Constraints. The Scientific World Journal 2014, 2014, 1–11. [Google Scholar] [CrossRef]
- Metallidou, C.K.; Psannis, K.E.; Egyptiadou, E.A. Energy Efficiency in Smart Buildings: IoT Approaches. IEEE Access 2020, 8, 63679–63699. [Google Scholar] [CrossRef]
- Oliver. (2021, April 21). 8 benefits of updating to an efficient HVAC system. Hellas Air Temp. Retrieved from https://hellasairtemp.com/8-benefits-of-updating-to-an-efficient-hvac.
- Punitha, K.P. IoT -Powered Robust Anomaly Detection and CNN -Enabled Predictive Maintenance to Enhance Solar PV System Performance. IoT for Smart Grid 2025, 243–255. [Google Scholar] [CrossRef]
- Ramani, V. , Martin, M., Pandarasamy Arjunan, Chong, A., Kameshwar Poolla, & Miller, C. Longitudinal thermal imaging for scalable non-residential HVAC and occupant behaviour characterization. Energy and Buildings 2023, 287, 112997–112997. [Google Scholar] [CrossRef]
- Cole-Parmer. (n.d.). Applying infrared thermography to predictive maintenance. Cole-Parmer. Retrieved December 23, 2024. from https://www.coleparmer.com/tech-article/applying-infrared-thermography-to-predictive-maintenance.
- Fan, X.; Li, Y.; Zhang, Z.; Chen, H. IoT-enabled HVAC systems for improved indoor air quality and energy efficiency: A review; Wiley Online Library, 2020; https://onlinelibrary.wiley.com/doi/epdf/10.1155/2020/8749764.
- Nasir, H.; Wang, X.; Zhang, Y. Artificial intelligence in predictive maintenance of HVAC systems. Applied Energy 2019, 235, 754–763. [Google Scholar] [CrossRef]
- Bagavathiappan, S.; Lahiri, B.B.; Saravanan, T.; Philip, J.; Jayakumar, T. Infrared thermography for condition monitoring – A review. Infrared Physics & Technology 2013, 60, 35–55. [Google Scholar] [CrossRef]
- Kane, R.L.; Caudell, T.P.; Scheff, J. Infrared thermography: A tool for optimizing HVAC system performance. Building Services Research and Information 2018, 40, 255–261. [Google Scholar] [CrossRef]
- Cade, D. (2014, November 24). See airflow on camera in this awesome Harvard demonstration of schlieren optics. Retrieved from https://petapixel.com/2014/11/24/see-airflow-camera-awesome-harvard-demonstration-schlieren-optics/.
- Find Codes. (n.d.). International Code Council. Retrieved March 27, 2024. from https://codes.iccsafe.org/codes/imc.
- Falk, J.; Smith, R.; Johnson, L. The impact of predictive maintenance and energy-efficient HVAC systems on operational performance. 2020. IEEE Xplore. https://ieeexplore.ieee.org/document/10710735.
- ASHRAE. (n.d.). ASHRAE Standards and Guidelines. Retrieved from https://www.ashrae.org/technical-resources/ashrae-standards-and-guidelines.
- Bui, D.; Wang, Q.; Zhou, X.; (n.d.). HVAC zoning control and building energy management systems; University of Dayton Retrieved December 23, 2024. from https://ecommons.udayton.edu/cgi/viewcontent.cgi?article=1003&context=mee_grad_pub.
- Sensgreen. (n.d.). The untapped potential: Empowering energy efficiency in existing buildings with IoT and AI. Retrieved December 23, 2024. from https://sensgreen.com/the-untapped-potential-empowering-energy-efficiency-in-existing-buildings-with-iot-and-ai/.
- Buildings.com. (n.d.). How IoT sensors and AI are revolutionizing smart buildings. Retrieved December 23, 2024. from https://www.buildings.com/smart-buildings/iot/article/55010925/how-iot-sensors-and-ai-are-revolutionizing-smart-buildings.
- HIKMICRO. (n.d.). 6 ways to use thermal imaging for HVAC maintenance. Retrieved December 23, 2024. from https://www.hikmicrotech.com/en_us/explore/blog/6-ways-to-use-thermal-imaging-for-hvac-maintenance/.
- ACS Klima. (n.d.). IoT in HVAC: Enhancing energy efficiency and predictive maintenance. ACS Klima. Retrieved December 23, 2024. from https://www.acsklima.com/iot-in-hvac-enhancing-energy-efficiency-and-predictive-maintenance/.
- Business Hue. (2023). Commercial HVAC cost per square foot. Retrieved November 20, 2024, from. https://www.businesshue.com/commercial-hvac-cost-per-square-foot/.
- Zhao, X.; Liu, X. Occupancy-based HVAC control for large spaces: A deep reinforcement learning approach. arXiv 2021. [Google Scholar]

Table 1.
Casino Simulation Data – Hours 0 – 11 (12 hours).
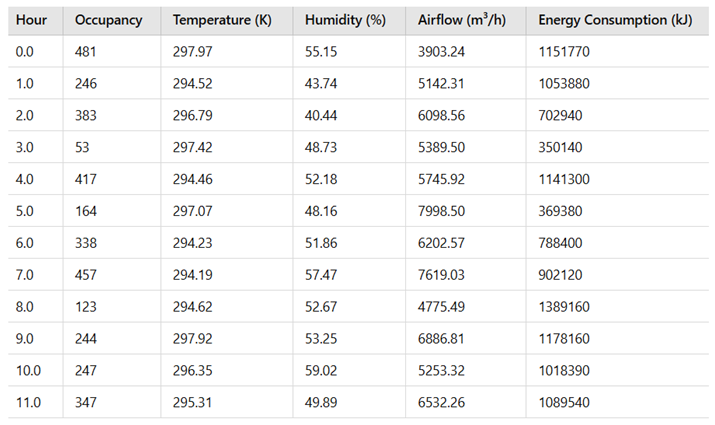 |
Table 2.
Casino Simulation Data – Hours 12 – 23 (12 hours).
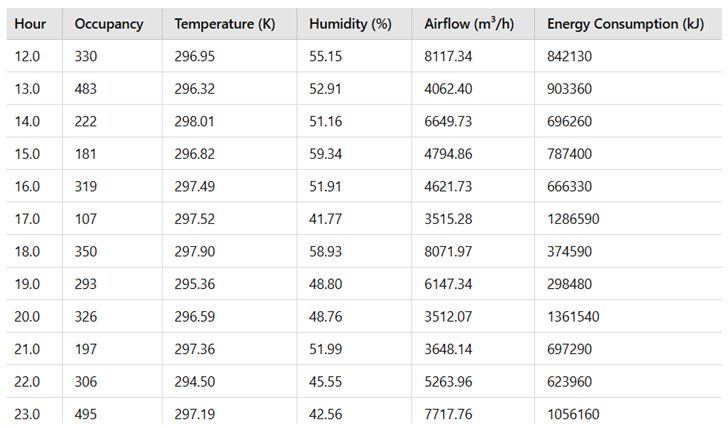 |
Table 3.
Comparison of Small-Scale Testing and Casino Simulation for HVAC Performance Analysis.
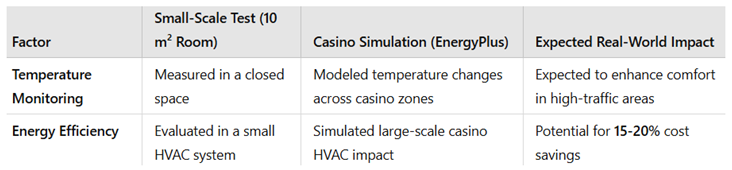 |
Table 4.
Energy Consumption Data and Reduction.
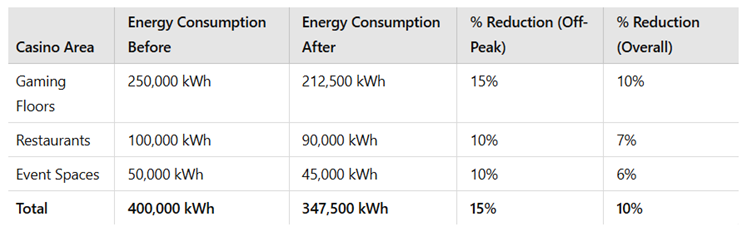 |
Table 5.
Predictive Maintenance Cost Breakdown.
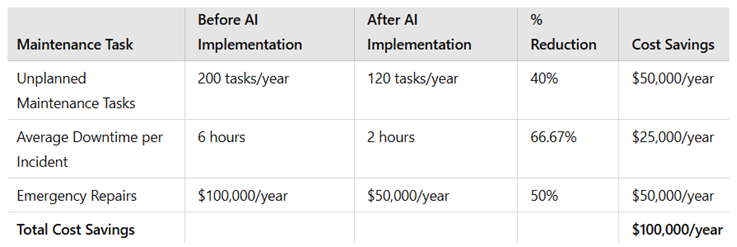 |
Table 6.
Paired t-test Results for HVAC System Improvements.
 |
Disclaimer/Publisher’s Note: The statements, opinions and data contained in all publications are solely those of the individual author(s) and contributor(s) and not of MDPI and/or the editor(s). MDPI and/or the editor(s) disclaim responsibility for any injury to people or property resulting from any ideas, methods, instructions or products referred to in the content. |
© 2025 by the authors. Licensee MDPI, Basel, Switzerland. This article is an open access article distributed under the terms and conditions of the Creative Commons Attribution (CC BY) license (http://creativecommons.org/licenses/by/4.0/).
Copyright: This open access article is published under a Creative Commons CC BY 4.0 license, which permit the free download, distribution, and reuse, provided that the author and preprint are cited in any reuse.


