
Submitted:
24 December 2024
Posted:
25 December 2024
You are already at the latest version
Abstract
Background: Metabolic-associated steatotic liver disease (MASLD) represents the most common chronic hepatopathy worldwide and an independent risk factor for cardiovascular disease and mortality, particularly when liver fibrosis occurs. Epigenetic alterations, as DNA methylation, may influence MASLD susceptibility and progression; yet mechanisms underlying this process are limited. This study aimed to investigate active DNA demethylation in MASLD, alongside the methylation and mRNA levels of inflammation- and fibrosis-related candidate genes. Methods: Global demethylation intermediates (5-hydroxymethylcytosine[5hmC], 5-formylcytosine[5fC]) were quantified in peripheral blood mononuclear cells (PBMCs) from 89 individuals with/without MASLD using ELISA. Site-specific DNA methylation of SOCS3, SREBF1 and TXNIP was analyzed by mass spectrometry-based bisulfite sequencing; mRNA expression was assessed via rt-PCR. Results: Individuals with MASLD and moderate-to-high fibrosis risk (estimated by Fibrosis NASH Index, FNI) progressively exhibited greater global 5hmC and 5fC levels. FNI inversely correlated with methylation levels of SOCS3 gene promoter, and linearly with SOCS3, TXNIP, IL-6 and MCP-1 mRNA expression. Conclusions: Elevated fibrosis risk in MASLD is associated with active global DNA demethylation, as well as differential methylation and expression patterns of genes which are key regulators of inflammation and fibrosis. These epigenetic alterations may potentially contribute to fibrogenesis and represent novel biomarkers for MASLD progression toward fibrosis.
Keywords:
Epigenetics
; methylation
; demethylation
; non-alcoholic fatty liver disease
; metabolic-associated fatty liver disease
; NASH
; liver fibrosis
; Fibrosis NASH Index
; FNI
1. Introduction
Metabolic dysfunction-associated steatotic liver disease (MASLD) is the most common chronic liver disease worldwide, affecting over 32% of adults globally and is a critical hepatic component of metabolic dysfunction, closely related to conditions such as obesity, type 2 diabetes mellitus (T2DM), hypertension, and dyslipidemia [1,2]. Indeed, the nomenclature MASLD has been recently adopted to emphasize the strong metabolic basis of hepatic steatosis, replacing the older term non-alcoholic fatty liver disease (NAFLD) [3]. MASLD represents an independent risk factor for overall mortality and cardiovascular disease, and is associated with T2DM onset and detrimental outcomes, chronic kidney disease, liver-specific outcomes like fibrosis and hepatocellular carcinoma [4]. Liver fibrosis, in particular, emerges as the principal determinant of morbidity and mortality in MASLD, with advanced fibrosis strongly associated with liver-related and cardio-metabolic complications [5,6]. Yet mechanisms driving MASLD progression towards fibrosis remain not completely understood [6]. In this context, identifying individuals at higher risk for fibrosis progression is a major clinical goal, as timely intervention can modify the natural progression of the disease and improve its outcomes., necessitating further research to optimize patient stratification and management strategies.
DNA methylation changes play a pivotal role in the pathogenesis and progression of metabolic diseases, serving as a critical interface between genetic predispositions and environmental influences [7]. Recent studies have emphasized the role of DNA methylation in the development and progression of MASLD [8].
The methylation process involves the enzymatic addition of a methyl group predominantly to cytosine residues followed by guanine, forming CpG dinucleotides in DNA and resulting in the formation of 5-methylcytosine (5mC). This modification, which is essential for regulating gene expression, is reversible through passive and active demethylation mechanisms. Passive demethylation primarily occurs during DNA replication, leading to a dilution of methylation signals. In contrast, active demethylation involves the enzymatic oxidation of 5mC into intermediates, including 5-hydroxymethylcytosine (5hmC), 5-formylcytosine (5fC), and 5-carboxycytosine (5caC).
Aberrant DNA methylation patterns are implicated in key aspects of metabolic diseases. In MASLD, differential DNA methylation profiles have been strongly associated with liver fibrosis severity [9]. Similarly, in T2DM, methylation changes have been linked to critical processes such as insulin resistance, systemic inflammation, and oxidative stress [9].
The precise mechanisms driving these methylation alterations remain unclear. Emerging evidence highlights the active demethylation pathway as a significant contributor to metabolic disease progression, including diabetes. Specifically, studies in animal models and preliminary experimental findings in humans suggest that active demethylation intermediates, such as 5hmC and 5fC, may serve as biomarkers of disease states and play a functional role in mediating disease-related epigenetic changes [11,12,13]. Conversely, mechanisms behind epigenetic modifications and differential methylation pattern in MASLD are not fully elucidated yet, and data on their association with liver fibrosis are limited. Thus, we hypothesize that changes in methylation profiles in MASLD may be primarily driven by active demethylation processes.
This study aimed to investigate the active DNA demethylation process in relation to MASLD and MASLD-associated fibrosis risk by analyzing global levels of the demethylation intermediates 5hmC and 5fC. Moreover, we explored the methylation profiles of candidate genes implicated in inflammation and fibrogenesis.
2. Results
Among 89 study participants, 63% (56/89) had clinical diagnosis of MASLD according to the Hepatic Steatosis Index (HSI > 36) calculation. These individuals had greater prevalence of T2DM and worse metabolic profile than those without MASLD, whereas age and sex distribution were comparable between sub-groups. Clinical characteristics of the study population according to the MASLD presence are reported in Table 1.
When dividing the study cohort in relation to the liver fibrosis risk, as estimated by FNI , we found that 44% participants (39/89) were at moderate-to-high risk of hepatic fibrosis.
In subjects at moderate-to-high fibrosis risk the prevalence of male sex (74% vs 50%, p= 0.02) and T2DM (95% vs 38%, p<0.001) were significantly higher than in those in the low-FNI group. Study participants at progressively higher risk of liver fibrosis had significantly increased BMI, FBG, blood transaminases and lipids. In line with these findings, the prevalence of T2DM was also progressively higher, up to 100% among individuals with the greatest fibrosis risk (FNI ≥ 0.33). Clinical characteristics of the study population according to liver fibrosis classes are reported in Table 2.
2.1. Global Demethylation
In our population, the presence of MASLD was associated with higher levels of the global demethylation intermediate 5hmC compared to non-MALSD (mean ± SD 5hmC: 0.076 ± 0.04 vs. 0.048 ± 0.04, p = 0.011; Figure 1).
Differential demethylation pattern was even more pronounced when analyzing the sample in relation to fibrosis risk. Indeed, individuals at higher risk of liver fibrosis exhibited significantly higher levels of global DNA active demethylation intermediates compared to those at lower risk, as indicated by significantly greater global levels of both 5hmC (mean ± SD 5hmC in low risk: 0.048 ± 0.02, moderate risk: 0.051 ± 0.02, high risk: 0.10 ± 0.03, p= 0.003) and 5fC (mean ± SD 5hmC in low risk: 0.005 ± 0.007, moderate risk: 0.003 ± 0.002, high risk: 0.010 ± 0.004, p= 0.007; Figure 2).
At the bivariate analysis, the FNI, considered as a continuous variable, linearly correlated with both 5hmC and 5fC (r= 0.65, p<0.001; r= 0.43, p= 0.016, respectively).
Conversely, no association was found between the global methylation profile, as indicated by 5-methylcytosine (5mC) levels, and either the presence of MASLD (mean ± SD 5mC MASLD: 0.71 ± 0.24, non-MASLD: 0.59 ± 0.22, p = 0.13) or fibrosis classes (mean ± SD 5mC in low risk: 0.53 ± 0.22, moderate risk: 0.80 ± 0.32, high risk: 0.69 ± 0.22, p = 0.10).
2.1. Gene-Specific Methylation and Associated mRNA Expression Levels
Then, we specifically explored the methylation levels of candidate genes involved in inflammatory processes and fibrogenesis, such as SOCS3, SREBF1, and TXNIP. Individuals at moderate-to-high fibrosis risk had significantly lower methylation levels at specific CpG sites within the SOCS3 gene promoter compared to patients at low fibrosis risk (CpG8: 0.060 ± 0.02 vs. 0.083 ± 0.037, p= 0.02; CpG13: 0.015 ± 0.02 vs. 0.037 ± 0.03, p= 0.01; CpG15.16: 0.54 ± 0.09 vs. 0.62 ± 0.1, p= 0.03; CpG17.18: 0.55 ± 0.12 vs. 0.63 ± 0.09, p = 0.03).
In line with these findings, the FNI inversely correlated with the methylation level of CpG sites in the SOCS3 promoter (CpG5: r= -0.62, p= 0.032; CpG6: r= -0.35, p= 0.04; CpG13: r = -0.35, p = 0.04; CpG20: r = -0.35, p = 0.04; CpG28: r= -0.26, p= 0.04; CpG17.18: r= -0.25, p= 0.049). Accordingly, a positive association was found between FNI and the mRNA expression levels of SOCS3 gene in PBMC (r = 0.37, p = 0.017).
The mRNA expression of IL-6 and MCP-1 genes, that are entangled in pathways associated with SOCS3 activation, was progressively higher in PBMC from individuals with more elevated estimated fibrosis risk (Figure 3); FNI linearly correlated with their mRNA expression levels (IL-6: r= 0.47, p= 0.004; and MCP1: r= 0.48, p= 0.002).
Finally, the FNI was associated with TXNIP mRNA expression (r= 0.51, p= 0.002) and with the methylation levels of the SREBF gene at site CpG1 (r= -0.26, p= 0.04) and CpG4 (r= 0.34, p= 0.005).
3. Discussion
In this study, we examined the active DNA demethylation processes in relation to MASLD and associated liver fibrosis, revealing a significant increase in demethylation intermediates in individuals with MASLD. Additionally, in these patients, global levels of 5hmC and 5fC were positively correlated with the risk of liver fibrosis in a dose-dependent manner. Recent studies have reported distinct DNA methylation patterns in MASLD, reflecting specific molecular pathways underlying the condition [8]. Specifically, differential DNA methylation profiles in MASLD involve key pathways related to insulin signaling, fibrosis, and metabolic dysfunction. Hypermethylation of genes associated with insulin signaling, focal adhesion, and extracellular matrix remodeling has been observed. These findings align with the primary pathogenic factor of MASLD—insulin resistance—which in turn triggers processes leading from hepatic steatosis to NASH and fibrosis development [14].
Hypomethylation, however, appears to be the predominant alteration in MASLD [15,16,17,18], affecting specific genes and repetitive sequences with implications for tissue repair, energy metabolism, and carcinogenesis in the liver. In animal models, the deprivation of methyl group donors or impairment of their metabolism can induce hepatic steatosis, while their supplementation can protect against the disease [19,20]. More recently, in animal and cellular models of hepatic steatosis, the disease was shown to be associated with genomic remodeling of 5hmC marks in a discrete set of functionally relevant genes, with implications for lipid metabolism, fibrosis initiation, and progression [21,22,23]. Notably, there is an overlap between methylation changes associated with MASLD observed in the liver and those identified in the blood, both reflecting increased inflammation [16]. This suggests that analyzing blood methylation changes may serve as a non-invasive marker of the disease.
Building on these premises, this study is the first to investigate the association between global markers of active DNA demethylation, site-specific gene demethylation, and liver fibrosis risk in MASLD within a clinical context. Our data indicate a strong association between an increased risk of fibrosis, as measured by the NASH fibrosis index (FNI), and elevated global levels of 5-hydroxymethylcytosine (5hmC) and 5-formylcytosine (5fC). These global markers of active demethylation were significantly correlated with higher FNI scores, which reflect a higher risk of fibrosis. These findings suggest that active demethylation processes may represent a key mechanism in MASLD progression, particularly in patients at higher risk of developing fibrosis. This observation aligns with previous studies showing that lower methylation levels are associated with higher degrees of liver inflammation, disease progression, and greater histological severity in NAFLD [24].
Interestingly, no association was found between global DNA methylation, indicated by 5-methylcytosine (5mC) levels, and the presence of MASLD or fibrosis. This result suggests that site-specific active demethylation, rather than global demethylation, may contribute to MASLD progression. Indeed, while 5hmC is narrowly distributed across the genome, predominantly in genes and regulatory regions, most of the 5mC signal is localized in repetitive DNA regions. Consequently, a localized reduction in 5mC due to 5hmC formation does not necessarily result in a global decrease in 5mC.
A more detailed analysis of specific genes involved in inflammation and fibrogenesis revealed key insights into the molecular mechanisms driving MASLD progression. We focused on SOCS3, SREBF1, and TXNIP, genes known to be implicated in inflammatory pathways and liver fibrosis [25,26,27,28]. We found that individuals at moderate-to-high risk of liver fibrosis exhibited significantly lower methylation levels at specific CpG sites within the SOCS3 promoter compared to those at low risk of fibrosis. This suggests that reduced methylation at these sites may lead to the overexpression of SOCS3, which is involved in regulating inflammation and fibrosis [25,26]. Moreover, the inverse correlation between FNI and methylation at several CpG sites within the SOCS3 promoter (e.g., CpG5: r = -0.62, p = 0.032) supports the notion that hypomethylation of SOCS3 is associated with higher fibrosis risk. In agreement with this, we also observed a positive association between FNI and the mRNA expression levels of SOCS3 (r = 0.37, p = 0.017). This finding highlights the potential role of SOCS3 as a molecular mediator of fibrogenesis in MASLD and suggests that its hypomethylation could be an important epigenetic alteration driving disease progression. Indeed, recent observations suggest that the SOCS3-JAK-STAT3 signaling pathway, activated by cytokines, plays a significant role in MASLD by promoting lipid accumulation and the infiltration of neutrophils and macrophages into the liver, increasing inflammation [29].
Additionally, mRNA expression levels of IL-6 and MCP-1, regulated by SOCS3, were progressively higher in individuals with greater fibrosis risk. This is in line with the evidence of the central of inflammatory pathways in liver fibrosis progression in MASLD and suggests that epigenetic changes affecting SOCS3 could impact the expression of cytokines primarily involved in inflammation and fibrogenesis, such as IL-6 and MCP-1.
Finally, our results indicate that mRNA expression of TXNIP, a gene involved in oxidative stress and inflammation, was positively correlated with fibrosis risk, underscoring the role of oxidative stress in liver damage. Supporting this, Guo et al. [30] reported an association between elevated circulating TXNIP levels and fatty liver in patients with newly diagnosed T2DM, suggesting that TXNIP activation my contribute to metabolic liver disease development and progression through oxidative stress pathways.
Thus, the overall study results provide new insights into the epigenetic hallmarks in MASLD, and show specific differential demethylation pattern in relation to liver fibrosis. Although our study has a cross-sectional design, which does not allow to establish a causal nexus between epigenetic changes and MASLD development/progression, it is plausible to hypothesize that the epigenetic modulation of genes involved in inflammation and fibrogenesis might at least in part contribute to the progression of liver damage once MASLD is established. The existence of a dose dependent relationship between the fibrosis degree and both global active demethylation and site specific methylation levels of candidate genes, along with the mRNA expression of pro-inflammatory cytokines, reinforces the hypothesis of a mechanistic involvement of epigenetic processes in MASLD onset and progression in the course of metabolic disorders. Furthermore, these correlation suggest a potential role of differential methylation patterns in disease’s screening and follow-up in MASLD, serving therefore as novel biomarkers in populations at high risk. Further studies are warranted in a longitudinal setting and across diverse populations, particularly those with more advanced liver disease and histologically confirmed liver fibrosis.
In conclusion, our study demonstrates for the first time the presence of differential global active DNA demethylation in MASLD, paralleled by changes in methylation and mRNA expression pattern of candidate genes associated with inflammation and fibrogenesis. These findings add knowledge on potential mechanistic processes behind fibrosis development and poor clinical outcomes in MASLD, which could be potentially addressed in a multi-targeted approach to MASLD treatment. Furthermore, identifying individuals at higher risk of disease progression could enhance risk stratification, enabling earlier intervention strategies aimed at modifying the course of the disease, finally improving clinical outcomes in MASLD.
4. Materials and Methods
4.1. Study Population
For this cross-sectional investigation, we recruited 89 individuals (male/female sex: 32/57; mean ± SD age: 62.3 ± 10.5 years, mean ± SD body mass index (BMI) 28.5 ± 3.6 kg/m²) attending the Diabetes and Endocrinology outpatient clinic at Sapienza University, Rome, Italy, for metabolic evaluations and/or diabetes management. The inclusion/exclusion criteria for this study were: male or female sex, age between 20 and 65 years; no history of excessive alcohol consumption (defined as daily alcohol intake exceeding 30 grams for men and 20 grams for women); negative results for hepatitis B surface antigen and hepatitis C virus antibody; no history of cirrhosis or other liver diseases (such as hemochromatosis, autoimmune hepatitis, or Wilson’s disease); no current treatment with medications known to induce liver steatosis (e.g., corticosteroids, estrogens, methotrexate, tetracycline, calcium channel blockers, or amiodarone). All study participants underwent medical history collection and clinical evaluations. Individuals without a confirmed diagnosis of T2DM underwent a standard oral glucose tolerance test (OGTT). Anthropometric measurements included weight and height, recorded with light clothing and without shoes, to calculate BMI (kg/m²). Waist circumference (in centimeters) was measured at the midpoint between the 12th rib and the iliac crest. Systemic systolic (SBP, mmHg) and diastolic (DBP, mmHg) blood pressure were measured after a 5-minute rest period, with three readings taken and the average of the second and third used in the analysis. Fasting blood samples were collected from all participants after an overnight fast of at least 8 hours. The following biochemical parameters were measured: fasting blood glucose (FBG, mg/dL), glycated hemoglobin (HbA1c, %), aspartate aminotransferase (AST, IU/L), alanine aminotransferase (ALT, IU/L), gamma-glutamyl transferase (GGT, IU/L), total bilirubin (mg/dL), direct bilirubin (mg/dL), total cholesterol (mg/dL), high-density lipoprotein cholesterol (HDL, mg/dL), low-density lipoprotein cholesterol (LDL, mg/dL), triglycerides (mg/dL), and uric acid (mg/dL). The presence of ongoing chronic treatments was recorded.
The presence of MASLD was diagnosed by clinical criteria [3] and then calculating the Hepatic Steatosis Index (HSI), according to the following formula: HSI = 8 *AST/ALT + BMI + (+2 if female) + (+2 if diabetes is present) [31]. The risk of liver fibrosis was estimated by calculating the Fibrotic NASH Index (FNI), a recently validated non-invasive scoring system used to assess the risk of advanced liver fibrosis in patients at high risk of Nonalcoholic Steatohepatitis (NASH), and which includes AST, HDL cholesterol, and HbA1c [32].
4.2. Extraction of Total DNA and Quantification of Global 5mC, 5hmC, and 5fC Levels
Total DNA was extracted from PBMCs using the DNeasy Blood and Tissue Kit (Qiagen) in accordance with the manufacturer’s guidelines. The purified DNA was utilized to measure the global levels of 5mC, 5hmC, and 5fC using specific quantification kits: MethylFlash Methylated DNA Quantification Kit (Epigentek) for 5mC, MethylFlash Hydroxymethylated DNA Quantification Kit (Epigentek) for 5hmC, and MethylFlash 5-Formylcytosine DNA Quantification Kit (Epigentek) for 5fC. Chemiluminescent signals were detected using a Victor X light plate reader (Perkin Elmer Inc.). The levels of each cytosine modification were calculated based on a standard curve generated using the DNA standard provided with the respective kits. All samples were analyzed in duplicate, and positive control DNA, also supplied by the kit manufacturer, was included on each plate to ensure inter-run consistency.
4.3. DNA Methylation Analysis of SREBF1, SOCS3, and TXNIP Gene Regions Using the EpiTYPER Assay
The methylation status of specific regions within the SREBF1, SOCS3, and TXNIP genes was assessed using the EpiTYPER assay (Sequenom), which evaluates the methylation ratios at targeted CpG sites or clusters, known as CpG units. The genomic locations of these regions (based on the GRCh37/hg19 genome assembly) are depicted in Fig 4a and Additional File 1: Figures S1A and S1B. DNA from PBMCs (500 ng) was subjected to bisulfite conversion using the EZ-96 DNA Methylation Kit (Zymo Research) with slight protocol modifications: the CT buffer incubation involved 21 cycles of 15 minutes at 55 °C and 30 seconds at 95 °C, and bisulfite-treated DNA was eluted with 100 μL of nuclease-free water.
PCR amplification of the bisulfite-converted DNA was performed using primers specific to the target regions, designed via the EpiDesigner online tool. The following primer sequences were used:
SREBF1: Forward primer (FP) aggaagagagAGGAGGTATAGATTTTGGGTTATGG; Reverse primer (RP) cagtaatacgactcactatagggagaaggctATAAAAAACTCCCTCTTCCAAAAAA
SOCS3: FP aggaagagagGTTTGTTATATTTTGTAGGGAGAGGG; RP cagtaatacgactcactatagggagaaggctACCCAATCTAAAACCAAAAACCTAC
TXNIP: FP aggaagagagAATAGTTTTTGTAATGGAGTGTGGG; RP cagtaatacgactcactatagggagaaggctAAAACAATTACTACTACTTTAAAAACCAAA
Amplicons were processed following the standard EpiTYPER protocol. Each sample was analyzed in duplicate within the experimental setup.
4.4. Statistical Analysis and Sample Size Calculation
All the statistical analyses were conducted using SPSS software, version 27.0. Continuous data are presented as mean ± standard deviation (SD), while categorical data are shown as percentages in both manuscript and tables. Variables with skewed distributions were log-transformed before performing the analyses. To compare mean values between two independent groups, Student’s t-test was used for continuous variables with normal distribution, the Mann–Whitney U test for non-normally distributed variables, and the χ² test for categorical data, as applicable. Comparisons between more than two groups were obtained by ANOVA test. Correlations between variables were evaluated using either Pearson’s or Spearman’s correlation coefficient, according to data distribution. Two-tailed p-value of less than 0.05 was considered statistically significant, with a confidence interval of 95%.
At the bulk of our knowledge, this is the first study which investigated demethylation intermediates in human PBMCs in relation to the presence of MASLD. For this reason, to evaluate the robustness of our findings, we performed a post-hoc sample size calculation starting from mean 5hmC difference reported between patients with and without MASLD. Thus, we obtained that n= 24 individuals per group were sufficient to obtained results statistically significant with power=90% and alpha error= 0.05 [33]. The final power of this study was 99.2%, with alpha error= 0.05.
Author Contributions
Conceptualization, IB, MZ, AR and MGC; methodology, FS, MGB, KK, FAC, SD; validation, IB, MZ, AR and MGC; formal analysis, IB, MZ, FS, KK and MGB; investigation, MGC, AR, MGB; resources, MGC, AR; data curation, IB, FAC, SD, GP, AO; writing—original draft preparation, IB, MZ; writing—review and editing, MGC, AR, MGB; supervision, MGC, IB, AR, MZ; funding acquisition, MGC, AR, IB. All authors have read and agreed to the published version of the manuscript.
Funding
This research was funded by a Sapienza University of Rome “Ateneo 2023” grant to I.B., M.G.C and A.R.
Informed Consent Statement
Informed consent was obtained from all subjects involved in the study.
Data Availability Statement
The data presented in this study are available from the corresponding author upon request. The data are not publicly available due to privacy restrictions and lack of specific patient consent.
Conflicts of Interest
The authors declare no conflict of interest. The funder had no role in the design of the study; in the collection, analyses, or interpretation of data; in the writing of the manuscript; or in the decision to publish the results.
References
- Teng, M.L.; Ng, C.H.; Huang, D.Q.; Chan, K.E.; Tan, D.J.; Lim, W.H.; Yang, J.D.; Tan, E.; Muthiah, M.D. Global incidence and prevalence of nonalcoholic fatty liver disease. Clin. Mol. Hepatol. 2023, 29, S32–S42. [CrossRef]
- Samuel, V.T.; Shulman, G.I. Nonalcoholic fatty liver disease as a nexus of metabolic and hepatic diseases. Cell Metab. 2018, 27, 22–41. [CrossRef]
- Rinella, M.E.; Lazarus, J.V.; Ratziu, V.; Francque, S.M.; Sanyal, A.J.; Kanwal, F.; Romero, D.; Abdelmalek, M.F.; Anstee, Q.M.; Arab, J.P.; et al. A multisociety Delphi consensus statement on new fatty liver disease nomenclature. J. Hepatol. 2023, 79, 1542–1556. [CrossRef]
- Younossi ZM, Golabi P, de Avila L, et al. The global epidemiology of NAFLD and NASH in patients with type 2 diabetes: A systematic review and meta-analysis. Journal of Hepatology. 2019;71(4):793-801. [CrossRef]
- Roca-Fernandez A, et al. Liver disease activity in metabolic dysfunction-associated steatotic liver disease predicts cardiovascular outcomes. Gut (BMJ). 2023.
- Zhou F, Zhou J, Wang W, et al. Unexpected rapid progression of fibrosis in patients with metabolic associated fatty liver disease (MAFLD). Hepatology. 2020;72(3):819-830. [CrossRef]
- Ling C, Rönn T. Epigenetics in Human Obesity and Type 2 Diabetes. Cell Metab. 2019 May 7;29(5):1028-1044. Epub 2019 Apr 11. PMID: 30982733; PMCID: PMC6509280. [CrossRef]
- Stols-Gonçalves D, Meijnikman AS, Tristão LS, Santos CLD, Denswil NP, Verheij J, Bernardo WM, Nieuwdorp M. Metabolic Dysfunction-Associated Steatotic Liver Disease and Alcohol-Associated Liver Disease: Liver DNA Methylation Analysis-A Systematic Review. Cells. 2024 Nov 16;13(22):1893. PMID: 39594641; PMCID: PMC11592595. [CrossRef]
- Wang H, Liu Z, Fan H, Guo C, Zhang X, Li Y, Zhao S, Dai L, Zhao M, Zhang T. Association between advanced fibrosis and epigenetic age acceleration among individuals with MASLD. J Gastroenterol. 2024 Nov 20. Epub ahead of print. PMID: 39565370. [CrossRef]
- Nadiger N, Veed JK, Chinya Nataraj P, Mukhopadhyay A. DNA methylation and type 2 diabetes: a systematic review. Clin Epigenetics. 2024 May 16;16(1):67. PMID: 38755631; PMCID: PMC11100087. [CrossRef]
- Yang Y, Zeng C, Yang K, Xu S, Zhang Z, Cai Q, He C, Zhang W, Liu SM. Genome-wide Analysis Reflects Novel 5-Hydroxymethylcytosines Implicated in Diabetic Nephropathy and the Biomarker Potential. Extracell Vesicles Circ Nucl Acids. 2022;3(1):49-60. Epub 2022 Mar 24. PMID: 35342902; PMCID: PMC8950161. [CrossRef]
- Zampieri M, Bacalini MG, Barchetta I, Scalea S, Cimini FA, Bertoccini L, Tagliatesta S, De Matteis G, Zardo G, Cavallo MG, Reale A. Increased PARylation impacts the DNA methylation process in type 2 diabetes mellitus. Clin Epigenetics. 2021 May 17;13(1):114. PMID: 34001206; PMCID: PMC8130175. [CrossRef]
- Dhliwayo N, Sarras MP Jr, Luczkowski E, Mason SM, Intine RV. Parp inhibition prevents ten-eleven translocase enzyme activation and hyperglycemia-induced DNA demethylation. Diabetes. 2014 Sep;63(9):3069-76. Epub 2014 Apr 10. PMID: 24722243; PMCID: PMC4141369. [CrossRef]
- Buzzetti, E.; Pinzani, M.; Tsochatzis, E.A. The multiple-hit pathogenesis of non-alcoholic fatty liver disease (NAFLD). Metabolism 2016, 65, 1038–1048. [CrossRef]
- Cabre, N.; Luciano-Mateo, F.; Chapski, D.J.; Baiges-Gaya, G.; Fernandez-Arroyo, S.; Hernandez-Aguilera, A.; Castane, H.; Rodriguez-Tomas, E.; Paris, M.; Sabench, F.; et al. Laparoscopic Sleeve Gastrectomy in Patients with Severe Obesity Restores Adaptive Responses Leading to Nonalcoholic Steatohepatitis. Int. J. Mol. Sci. 2022, 23, 7830. [CrossRef]
- Johnson, N.D.; Wu, X.; Still, C.D.; Chu, X.; Petrick, A.T.; Gerhard, G.S.; Conneely, K.N.; DiStefano, J.K. Differential DNA Methylation and Changing Cell-Type Proportions as Fibrotic Stage Progresses in NAFLD. Clin. Epigenetics 2021, 13, 152. [CrossRef]
- de Mello, V.D.; Matte, A.; Perfilyev, A.; Mannisto, V.; Ronn, T.; Nilsson, E.; Kakela, P.; Ling, C.; Pihlajamaki, J. Human Liver Epigenetic Alterations in Non-Alcoholic Steatohepatitis Are Related to Insulin Action. Epigenetics 2017, 12, 287–295. [CrossRef]
- Murphy, S.K.; Yang, H.; Moylan, C.A.; Pang, H.; Dellinger, A.; Abdelmalek, M.F.; Garrett, M.E.; Ashley-Koch, A.; Suzuki, A.; Tillmann, H.L.; et al. Relationship Between Methylome and Transcriptome in Patients with Nonalcoholic Fatty Liver Disease. Gastroenterology 2013, 145, 1076–1087. [CrossRef]
- Kulinski, A.; Vance, D.E.; Vance, J.E. A Choline-Deficient Diet in Mice Inhibits Neither the CDP-Choline Pathway for Phosphatidylcholine Synthesis in Hepatocytes Nor Apolipoprotein B Secretion. J. Biol. Chem. 2004, 279, 23916–23924. [CrossRef]
- Mato, J.M.; Martínez-Chantar, M.L.; Lu, S.C. S-Adenosylmethionine Metabolism and Liver Disease. Ann. Hepatol. 2013, 12, 183–189.
- Page, A.; Paoli, P.; Moran Salvador, E.; White, S.; French, J.; Mann, J. Hepatic Stellate Cell Transdifferentiation Involves Genome-Wide Remodeling of the DNA Methylation Landscape. J. Hepatol. 2016, 64, 661–673. [CrossRef]
- Lyall, M.J.; Cartier, J.; Thomson, J.P.; Cameron, K.; Meseguer-Ripolles, J.; O'Duibhir, E.; Szkolnicka, D.; Villarin, B.L.; Wang, Y.; Blanco, G.R.; Dunn, W.B.; Meehan, R.R.; Hay, D.C.; Drake, A.J. Modelling Non-Alcoholic Fatty Liver Disease in Human Hepatocyte-Like Cells. Philos. Trans. R. Soc. Lond. B Biol. Sci. 2018, 373, 20170362. [CrossRef]
- Lyall, M.J.; Thomson, J.P.; Cartier, J.; Ottaviano, R.; Kendall, T.J.; Meehan, R.R.; Drake, A.J. Non-Alcoholic Fatty Liver Disease (NAFLD) Is Associated with Dynamic Changes in DNA Hydroxymethylation. Epigenetics 2020, 15, 61–71. [CrossRef]
- Lai, Z.; Chen, J.; Ding, C.; Wong, K.; Chen, X.; Pu, L.; Huang, Q.; Chen, X.; Cheng, Z.; Liu, Y.; Tan, X.; Zhu, H.; Wang, L. Association of Hepatic Global DNA Methylation and Serum One-Carbon Metabolites with Histological Severity in Patients with NAFLD. Obesity (Silver Spring) 2020, 28, 197–205. [CrossRef]
- Carow, B.; Rottenberg, M.E. SOCS3, a Major Regulator of Infection and Inflammation. Front. Immunol. 2014, 5, 58. [CrossRef]
- Ogata, H.; Chinen, T.; Yoshida, T.; Kinjyo, I.; Takaesu, G.; Shiraishi, H.; Iida, M.; Kobayashi, T.; Yoshimura, A. Loss of SOCS3 in the Liver Promotes Fibrosis by Enhancing STAT3-Mediated TGF-β1 Production. Oncogene 2006, 25, 2520–2530. [CrossRef]
- Nguyen, T.T.P.; Kim, D.Y.; Im, S.S.; Jeon, T.I. Impairment of ULK1 Sulfhydration-Mediated Lipophagy by SREBF1/SREBP-1c in Hepatic Steatosis. Autophagy 2021, 17, 4489–4490. [CrossRef]
- Mohamed, I.N.; Li, L.; Ismael, S.; Ishrat, T.; El-Remessy, A.B. Thioredoxin Interacting Protein, a Key Molecular Switch Between Oxidative Stress and Sterile Inflammation in Cellular Response. World J. Diabetes 2021, 12, 1979–1999. [CrossRef]
- Zhang, Y.; Zhou, X.; Liu, P.; Chen, X.; Zhang, J.; Zhang, H.; Li, S.; Chen, Y.; Song, X.; Wang, J.; Zeng, H.; Zhang, X.; Tang, C.; Yu, C.; Li, Y.; Xu, C. GCSF Deficiency Attenuates Nonalcoholic Fatty Liver Disease through Regulating GCSFR-SOCS3-JAK-STAT3 Pathway and Immune Cells Infiltration. Am. J. Physiol. Gastrointest. Liver Physiol. 2021, 320, G531–G542. [CrossRef]
- Guo, Y.; Chen, J.; Liu, N.; Liu, Z.; Shi, B.; Sun, H. Association of Circulating TXNIP Levels with Fatty Liver in Newly Diagnosed Type 2 Diabetes Mellitus. Diabetes Metab. Syndr. Obes. 2022, 15, 225–233. [CrossRef]
- Lee, J.H.; Kim, D.; Kim, H.J.; Lee, C.H.; Yang, J.I.; Kim, W.; et al. Hepatic Steatosis Index: A Simple Screening Tool Reflecting Nonalcoholic Fatty Liver Disease. Dig. Liver Dis. 2010, 42, 503–508. [CrossRef]
- Tavaglione F, Jamialahmadi O, De Vincentis A, Qadri S, Mowlaei ME, Mancina RM, Ciociola E, Carotti S, Perrone G, Bruni V, Gallo IF, Tuccinardi D, Bianco C, Prati D, Manfrini S, Pozzilli P, Picardi A, Caricato M, Yki-Järvinen H, Valenti L, Vespasiani-Gentilucci U, Romeo S. Development and Validation of a Score for Fibrotic Nonalcoholic Steatohepatitis. Clin Gastroenterol Hepatol. 2023 Jun;21(6):1523-1532.e1. Epub 2022 Apr 11. PMID: 35421583. [CrossRef]
- Rosner B. Fundamentals of Biostatistics. 7th ed. Boston, MA: Brooks/Cole; 2011.
Figure 1.
Median (95% C.I.) levels of the demethylation intermediate 5-hydroxymethylcytosine (5hmC) according to the presence of MASLD, identified by Hepatis Steatosis Index (HSI > 36 for MASLD). Student’s T-test applied.
Figure 1.
Median (95% C.I.) levels of the demethylation intermediate 5-hydroxymethylcytosine (5hmC) according to the presence of MASLD, identified by Hepatis Steatosis Index (HSI > 36 for MASLD). Student’s T-test applied.
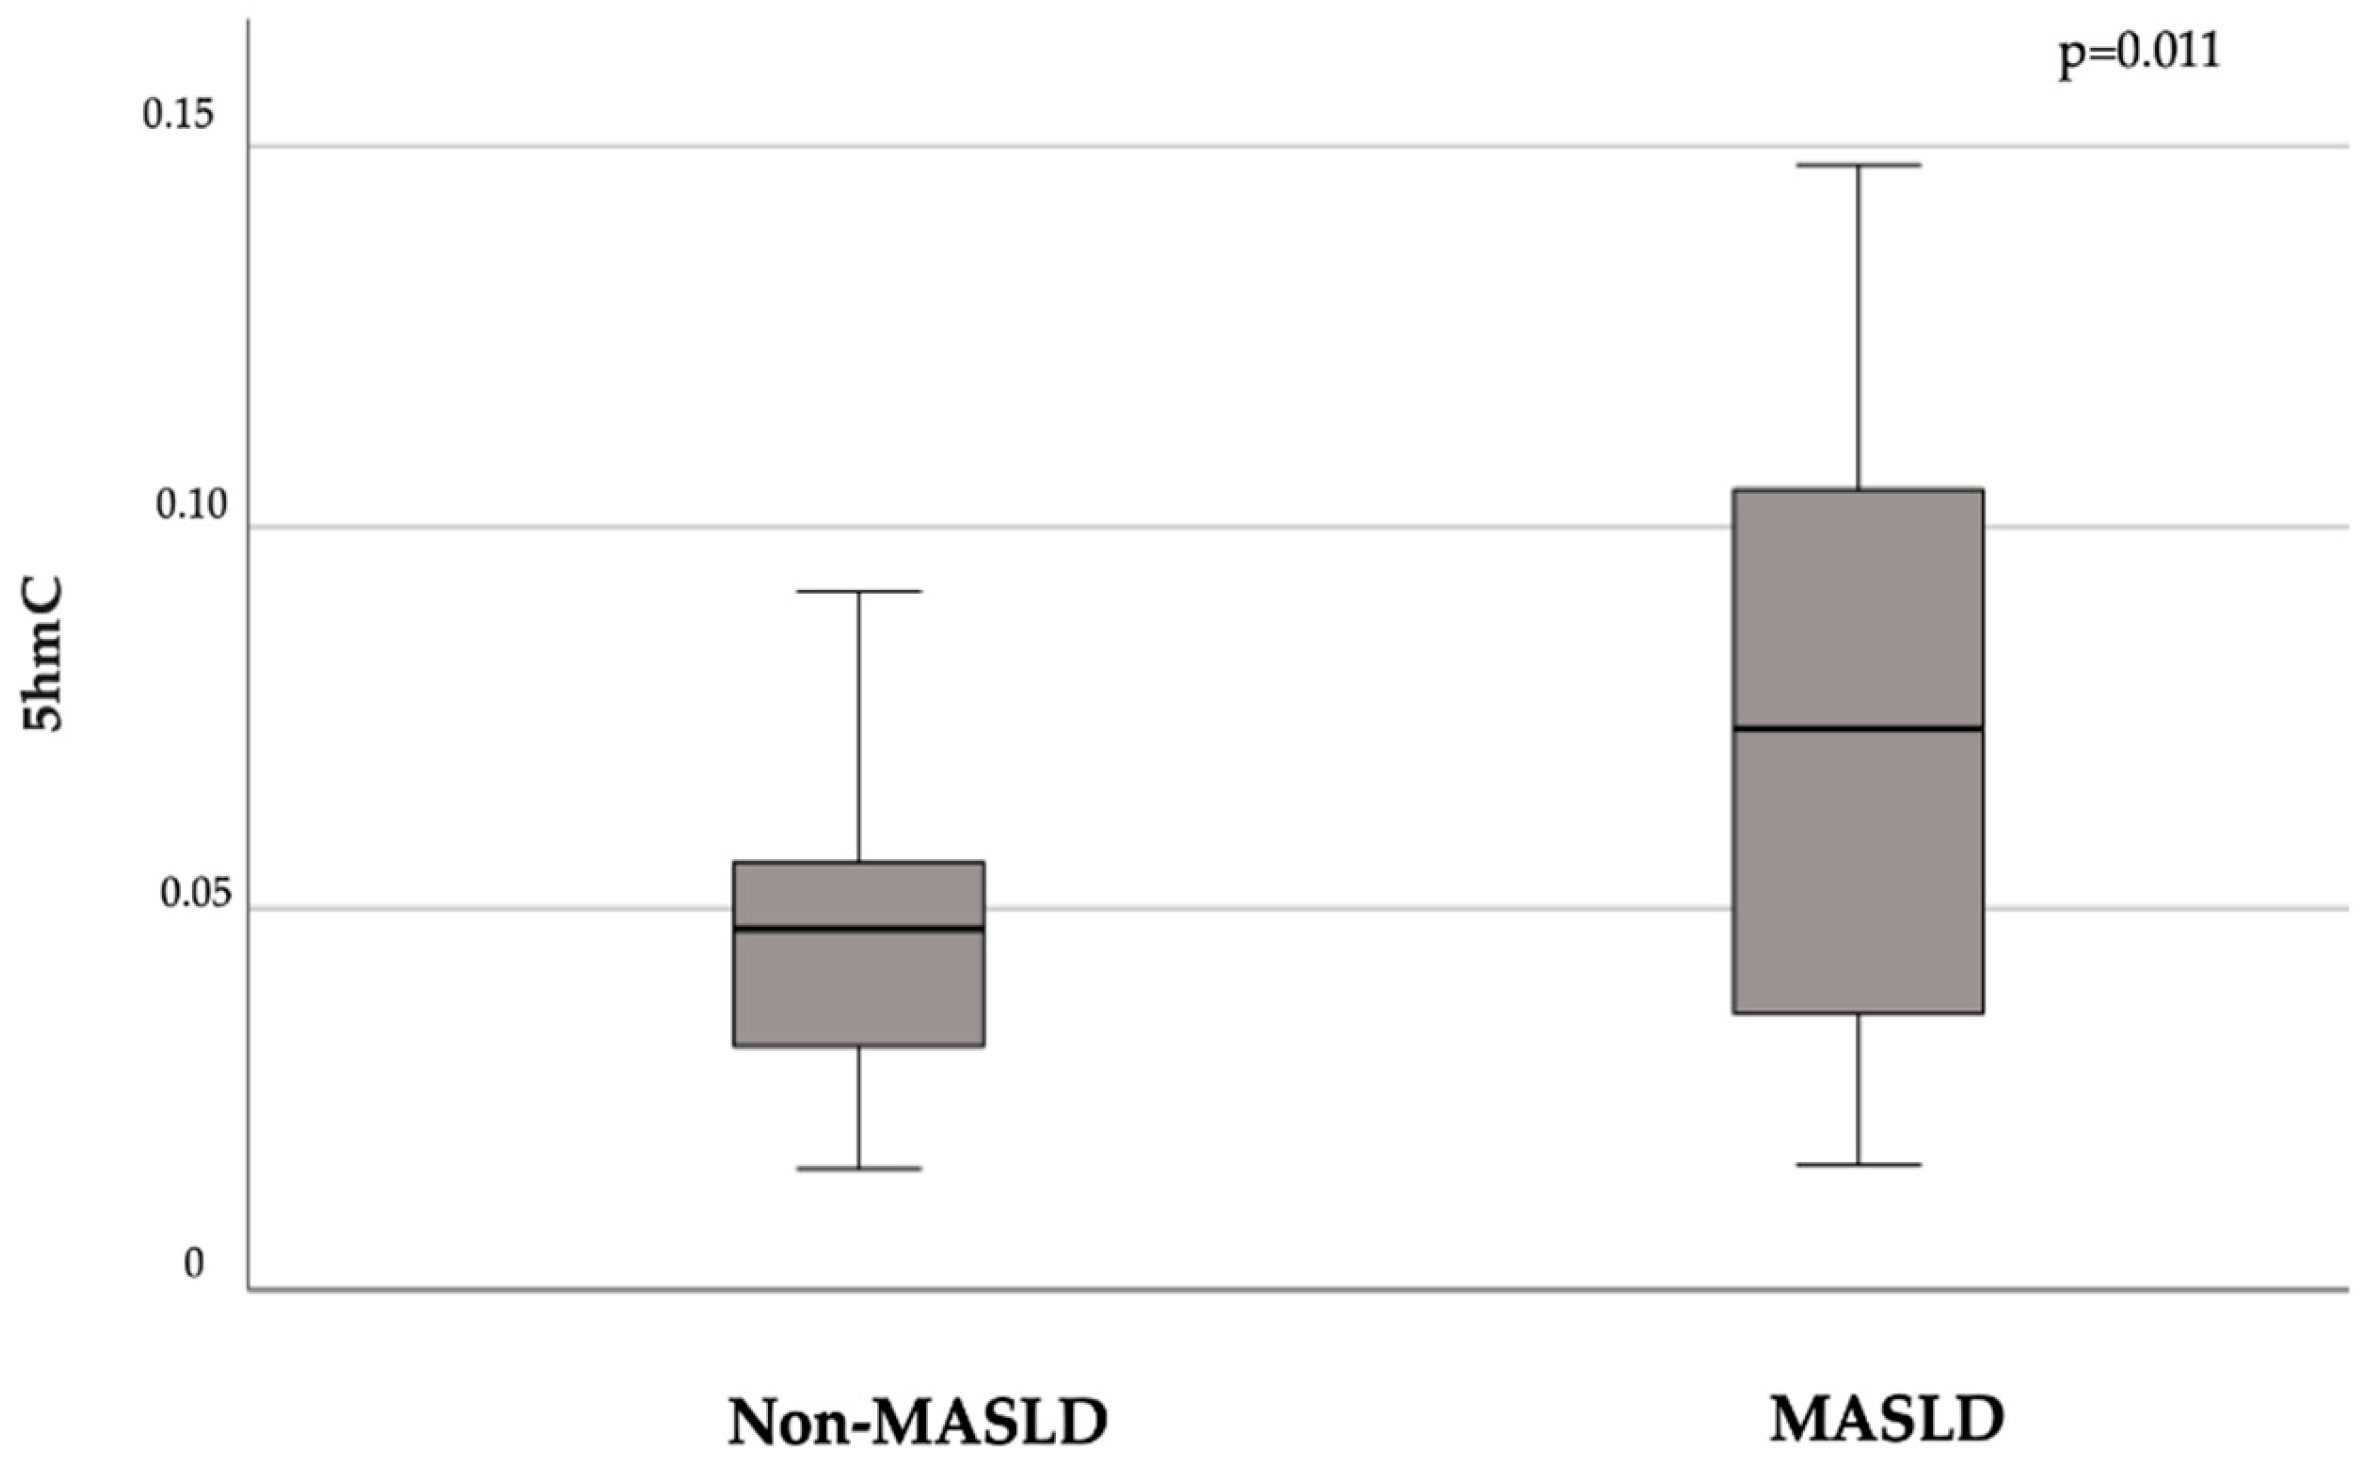
Figure 2.
Median (95% C.I.) levels of the demethylation intermediates 5-hydroxymethylcytosine (5hmC) and 5-formylcytosine (5fC) according to the fibrosis risk, considered low: FNI < 0.10, moderate: FNI between 0.10 and 0.33, or high: FNI ≥ 0.33). Independent samples Kruskal-Wallis’ test applied.
Figure 2.
Median (95% C.I.) levels of the demethylation intermediates 5-hydroxymethylcytosine (5hmC) and 5-formylcytosine (5fC) according to the fibrosis risk, considered low: FNI < 0.10, moderate: FNI between 0.10 and 0.33, or high: FNI ≥ 0.33). Independent samples Kruskal-Wallis’ test applied.
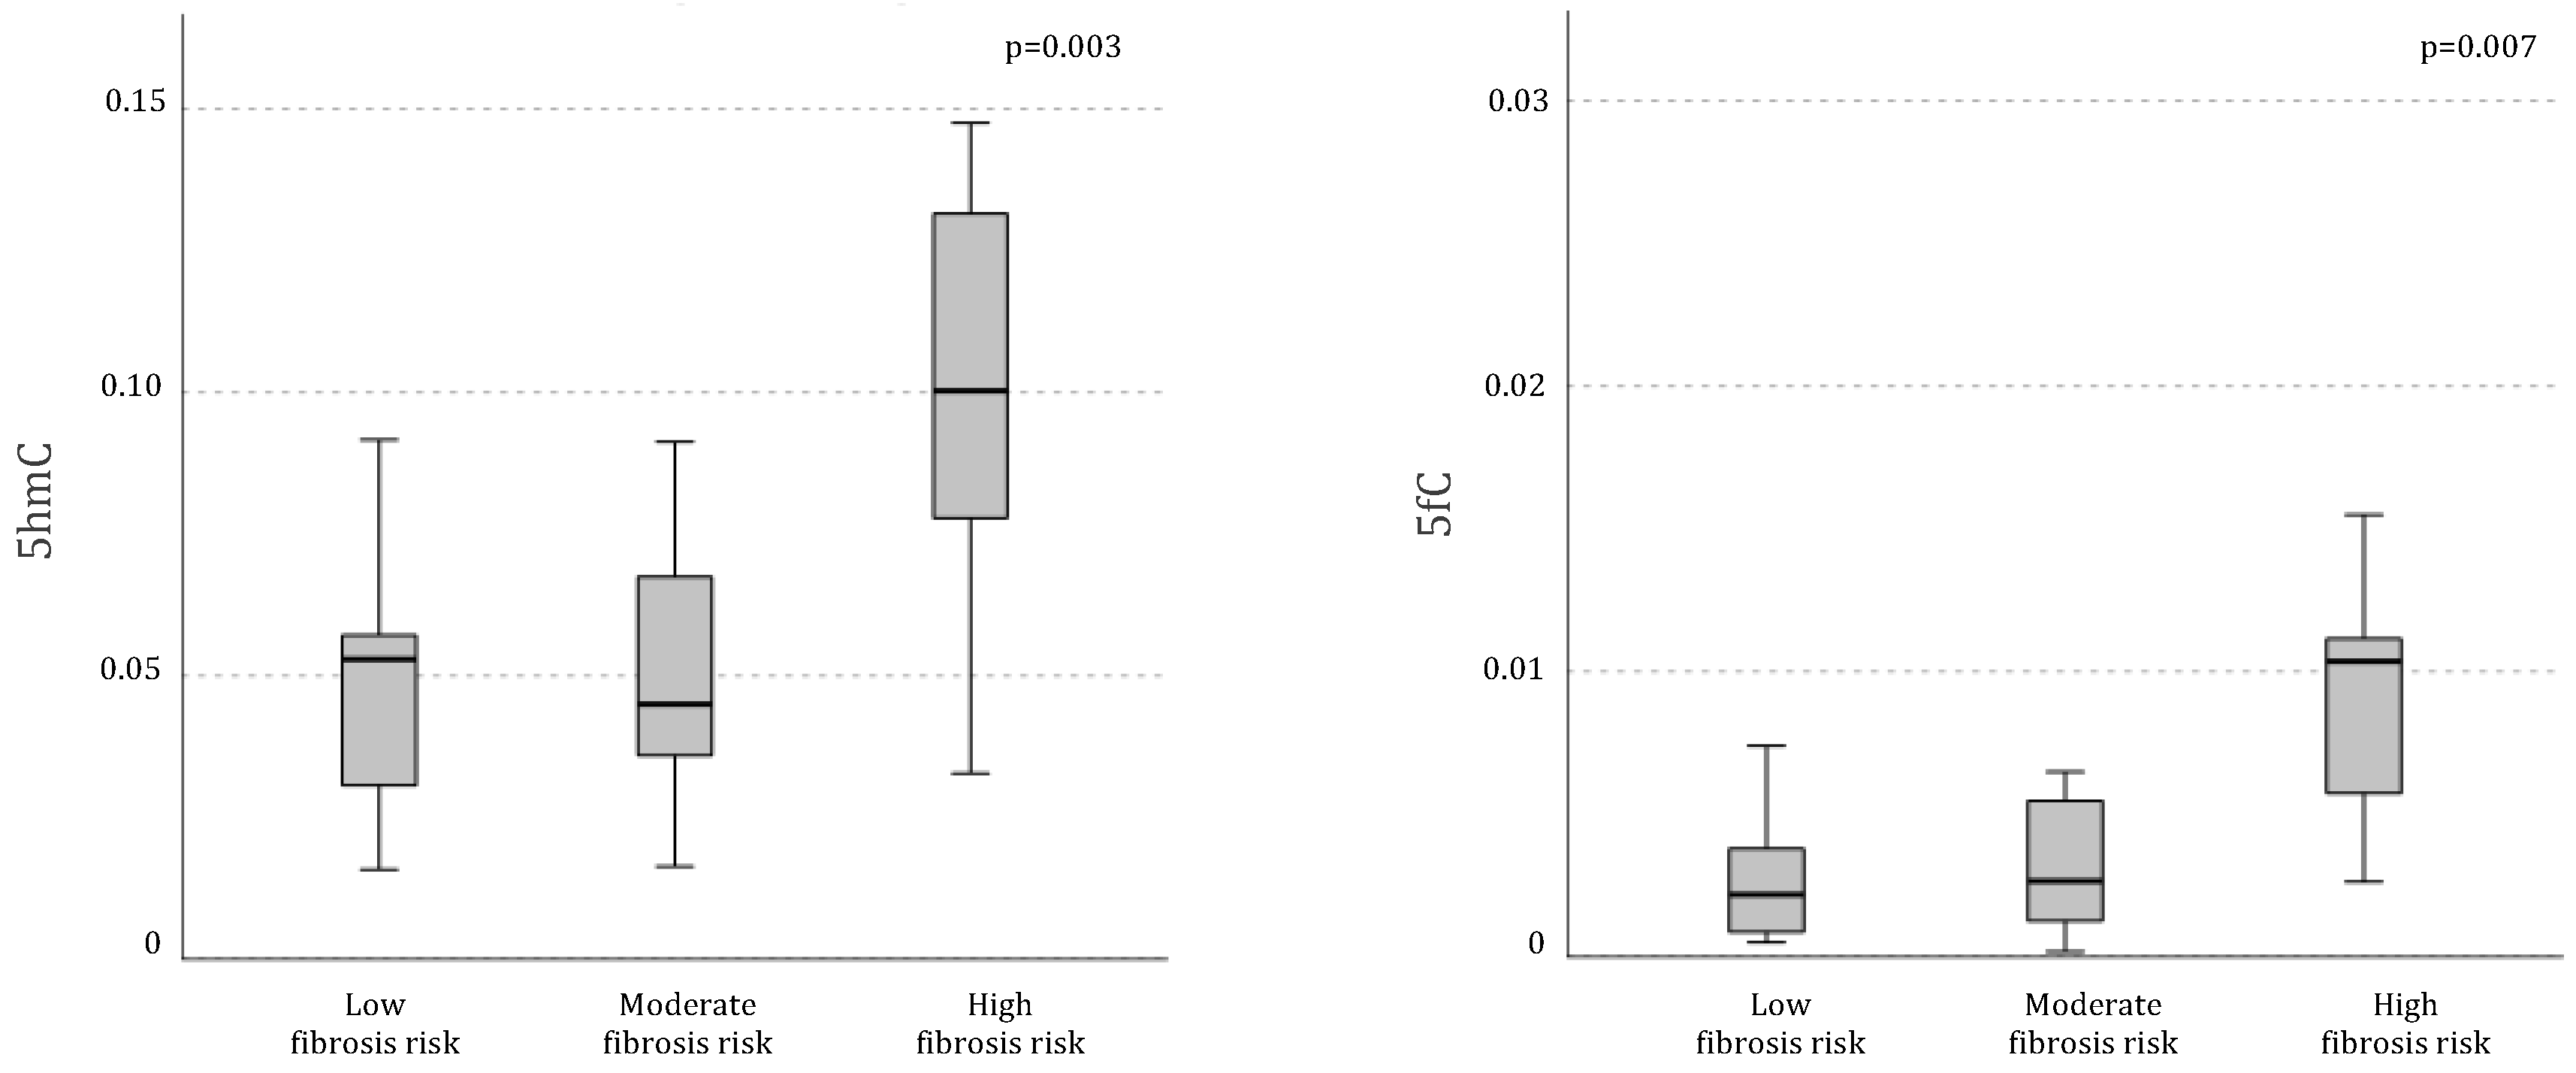
Figure 3.
Median (95% C.I.) levels of the IL-6 and MCP-1 mRNA levels in PBMC of individuals at different estimated risk of liver fibrosis (low: FNI < 0.10, moderate: FNI between 0.10 and 0.33, or high: FNI ≥ 0.33). Independent samples Kruskal-Wallis’ test applied.
Figure 3.
Median (95% C.I.) levels of the IL-6 and MCP-1 mRNA levels in PBMC of individuals at different estimated risk of liver fibrosis (low: FNI < 0.10, moderate: FNI between 0.10 and 0.33, or high: FNI ≥ 0.33). Independent samples Kruskal-Wallis’ test applied.
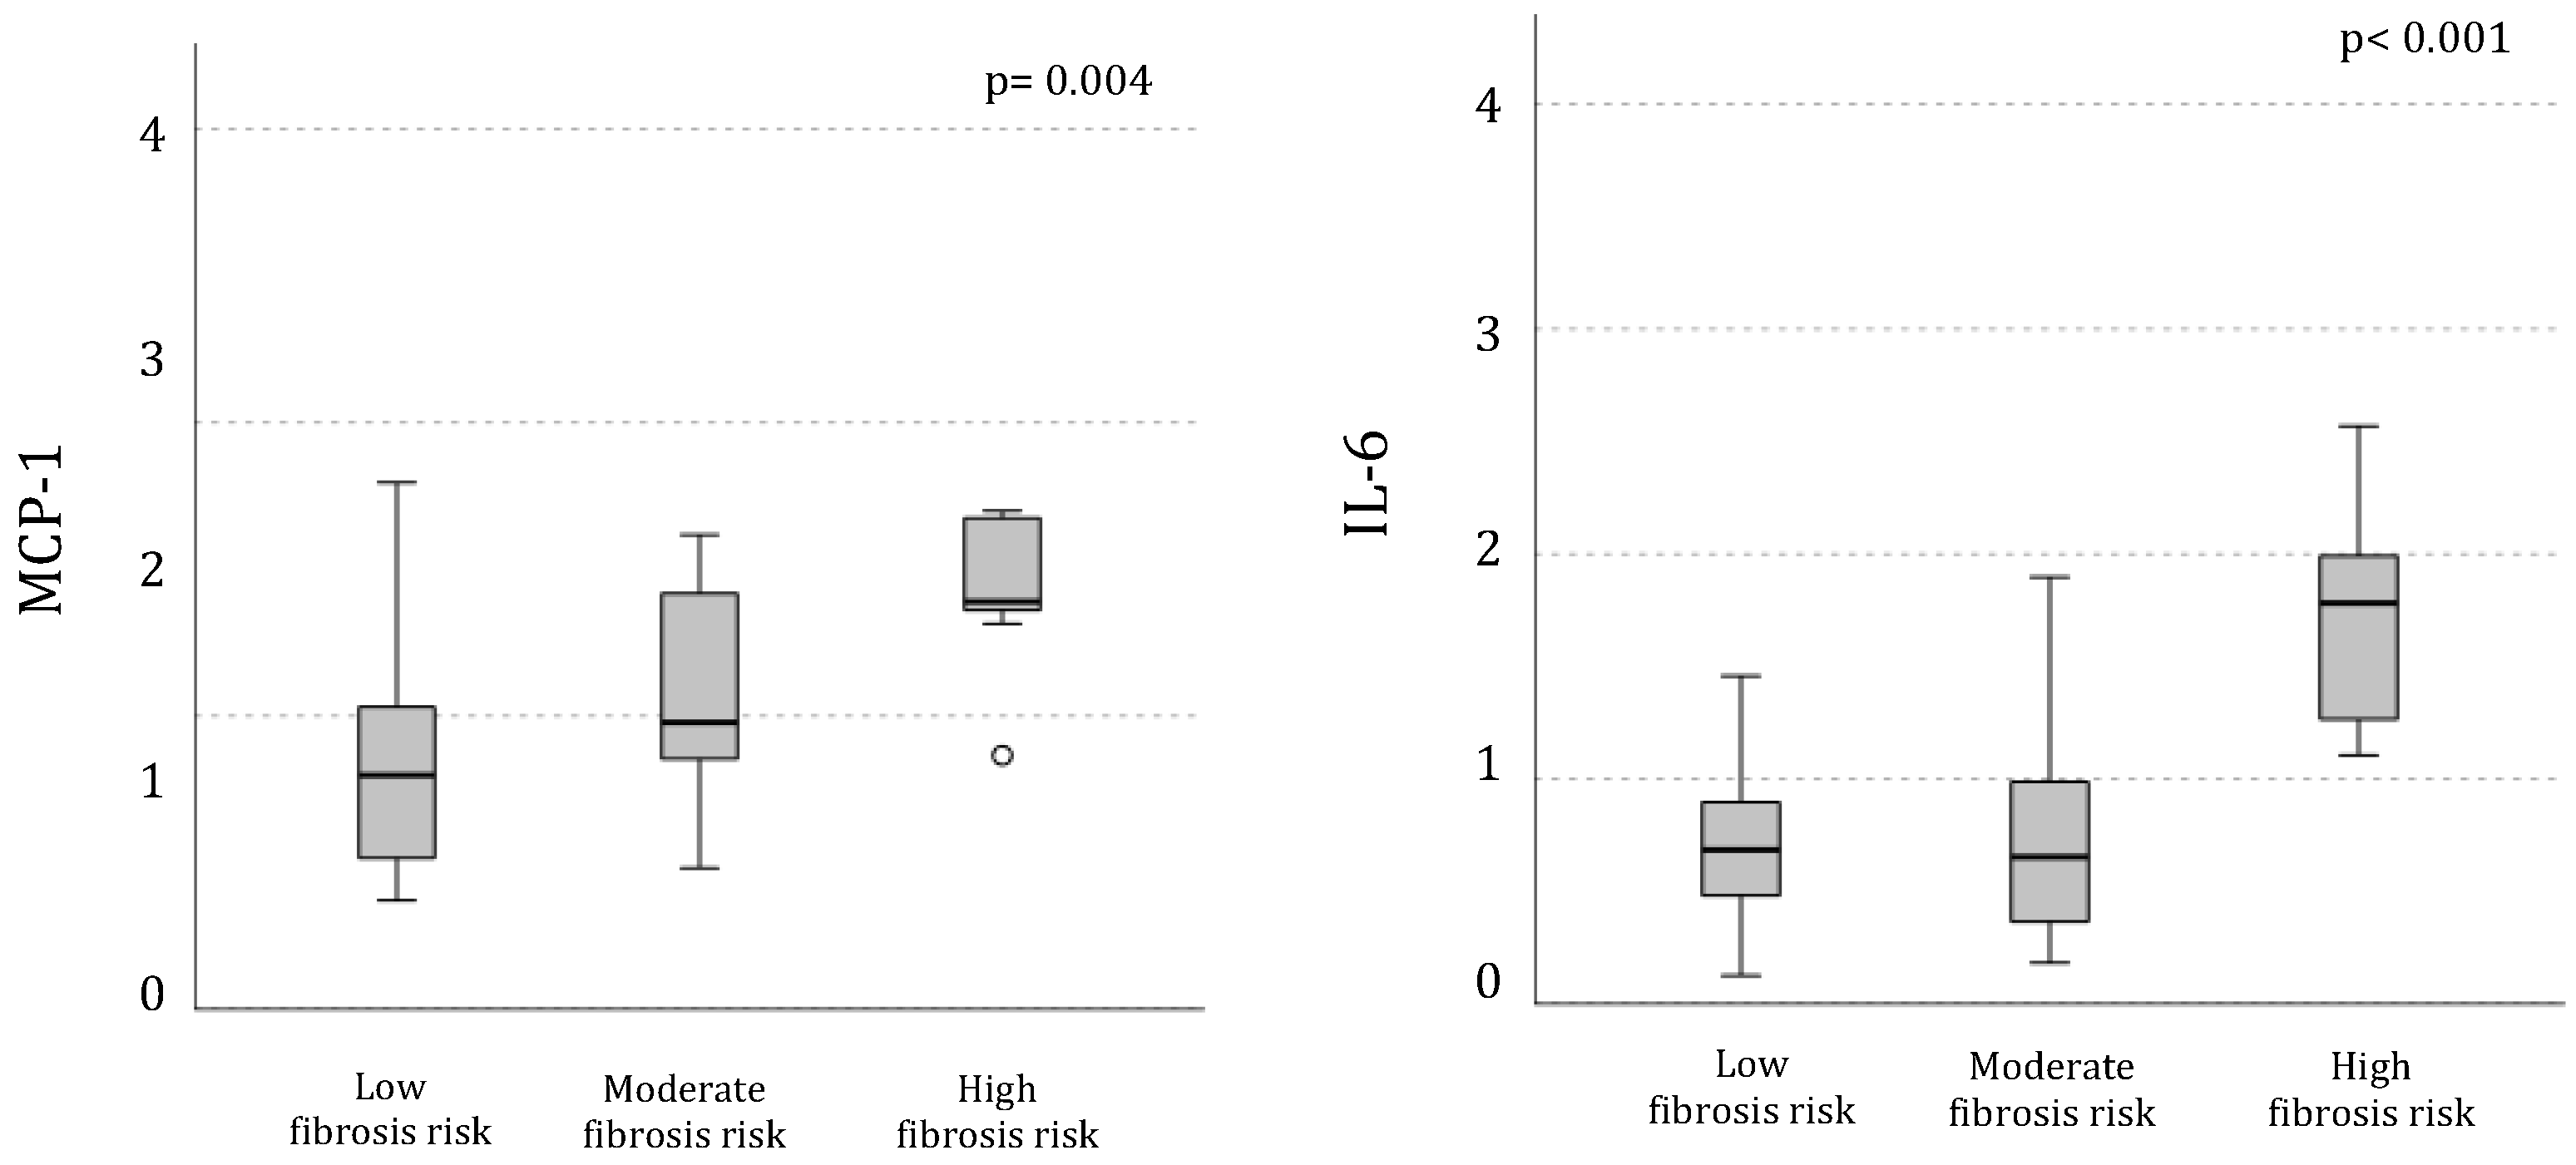

Table 1.
Characteristics of study participants in relation to the presence of MALSD, diagnosed by the hepatic Steatosis Index (HSI). * Mann-Whitney non-parametric test applied.
Table 1.
Characteristics of study participants in relation to the presence of MALSD, diagnosed by the hepatic Steatosis Index (HSI). * Mann-Whitney non-parametric test applied.
| MASLD (HSI >36) n= 56 |
Non MASLD (HSI <36) n= 33 |
p-Value Student’s T-test |
|
|---|---|---|---|
| Age (years) | 62.92 ± 10.95 | 61.30 ± 9.73 | 0.49 |
| Sex (M%) | 30% | 46% | 0.16* |
| BMI (Kg/m²) | 31.28 ± 4.30 | 23.91 ± 1.75 | <0.001 |
| Waist circumference (cm) | 111.63 ± 10.50 | 94.80 ± 5.89 | 0.003 |
| Systolic Blood Pressure (mmHg) | 136.96 ± 19.56 | 129.07 ± 12.94 | 0.04 |
| Diastolic Blood Pressure (mmHg) | 82.33 ± 9.81 | 78.89 ± 8.92 | 0.13 |
| FBG (mg/dl) | 131.08 ± 47.04 | 107.43 ± 38.27 | 0.02 |
| HbA1c (%) | 7.12 ± 1.62 | 6.26 ± 1.57 | 0.02 |
| AST (IU/L) | 21.40 ± 8.70 | 19.17 ± 5.22 | 0.15 |
| ALT (IU/L) | 25.22 ± 12.99 | 15.80 ± 5.14 | <0.001 |
| GGT (IU/L) | 27.55 ± 21.39 | 17.30 ± 8.57 | 0.019 |
| Total bilirubin (mg/dl) | 0.59 ± 0.26 | 0.59 ± 0.29 | 0.97 |
| Direct bilirubin (mg/dl) | 0.21 ± 0.07 | 0.25 ± 0.11 | 0.19 |
| Total cholesterol (mg/dl) | 192.19 ± 42.34 | 200.36 ± 36.81 | 0.41 |
| HDL (mg/dl) | 47.71 ± 15.61 | 62.40 ± 11.66 | <0.001 |
| LDL (mg/dl) | 107.77 ± 41.89 | 102.44 ± 46.92 | 0.61 |
| Triglycerides (mg/dl) | 169.12 ± 87.62 | 112.69 ± 54.62 | 0.004 |
| Uric acid (mg/dl) | 7.63 ± 10.29 | 4.63 ± 0.12 | 0.21 |
| T2DM diagnosis (%) | 70% | 37% | 0.004* |
| Lipid lowering treatments (%) | 21% | 14% | 0.44* |
| HSI | 43.61 ± 5.75 | 33.07 ± 1.88 | <0.001 |
| FNI | 0.23 ± 0.22 | 0.07 ± 0.07 | <0.001 |
Abbreviations: ALT - Alanine Aminotransferase; AST - Aspartate Aminotransferase; BMI - Body Mass Index; FBG - Fasting Blood Glucose; FNI – Fibrotic NASH Index; GGT - Gamma-Glutamyl Transferase; HDL - High-Density Lipoprotein; HbA1c - Hemoglobin A1c; HSI - Hepatic Steatosis Index; LDL - Low-Density Lipoprotein.
Table 2.
Characteristics of the study population according to the estimated risk of liver fibrosis calculated by Fibrotic NASH Index (FNI; low risk: FNI < 0.10; moderate risk: FNI ≥ 0.10 < 0.33; high risk: FNI ≥ 0.33). * Kruskal Wallis non-parametric test applied.
Table 2.
Characteristics of the study population according to the estimated risk of liver fibrosis calculated by Fibrotic NASH Index (FNI; low risk: FNI < 0.10; moderate risk: FNI ≥ 0.10 < 0.33; high risk: FNI ≥ 0.33). * Kruskal Wallis non-parametric test applied.
| Low Fibrosis Risk (FNI < 0.10) n= 50 |
Moderate Fibrosis Risk (FNI ≥ 0.10 < 0.33) n= 27 |
High Fibrosis Risk (FNI ≥ 0.33) n= 12 |
p-Value ANOVA |
|
|---|---|---|---|---|
| Age (years) | 60 ± 9.9 | 64.9 ± 10.5 | 62.6 ± 12 | 0.13 |
| Sex (M%) | 25/25 | 22/5 | 7/5 | 0.027* |
| BMI (Kg/m2) | 26.6 ±4.2 | 28.7 ± 4.8 | 33.7 ± 5.1 | <0.001 |
| Waist circumference /cm) | 99.8 ±16.4 | 105.4 ± 11.4 | 113 ± 10.5 | 0.26 |
| Systolic Blood Pressure (mmHg) | 132 ± 15.7 | 137.6 ± 20.4 | 137.1 ± 19.4 | 0.42 |
| Diastolic Blood Pressure (mmHg) | 80.9 ± 9.4 | 81.1 ± 10.2 | 80.9 ± 10.2 | 0.99 |
| FBG (mg/dl) | 102.9 ± 34 | 137.6 ± 38.5 | 160.3 ± 11.6 | <0.001 |
| HbA1c (%) | 7.1 ± 9.3 | 7.2 ± 1.2 | 9.3 ± 1.4 | 0.60 |
| AST (IU/L) | 18.1 ±5.3 | 20.2 ± 5.3 | 27.8 ± 12.2 | <0.001 |
| ALT (IU/L) | 18.4 ± 8.8 | 21 ± 8.9 | 34.8 ± 15.8 | <0.001 |
| GGT (IU/L) | 17.4 ± 6.3 | 26.8 ± 15.5 | 47.3 ± 34.3 | <0.001 |
| Total bilirubin (mg/dl) | 0.50 ± 0.2 | 0.6 ± 0.3 | 0.64 ± 0.26 | 0.30 |
| Direct bilirubin (mg/dl) | 0.20 ± 0.08 | 0.2 ± 0.1 | 0.23 ± 0.08 | 0.58 |
| Total cholesterol (mg/dl) | 204.6 ± 35.8 | 182 ± 38.4 | 176 ± 49.2 | 0.02 |
| HDL (mg/dl) | 61.3 ± 13.9 | 43.4 ± 7.7 | 44 ± 12.3 | <0.001 |
| LDL (mg/dl) | 120.6 ± 29.8 | 107.4 ± 38.7 | 97.2 ± 42.2 | 0.09 |
| Triglycerides (mg/dl) | 123.7 ± 62.4 | 168 ± 90.2 | 181 ± 83.5 | 0.018 |
| Uric acid (mg/dl) | 5.5 ± 1.3 | 8.3 ± 11.9 | 4.9 ± 1.5 | 0.56 |
| T2DM diagnosis (%) | 38% | 93% | 100% | <0.001* |
| Lipid lowering treatments (%) | 12% | 22% | 25% | 0.44 |
| FNI | 0.04 ± 0.02 | 0.18 ± 0.06 | 0.52 ± 0.17 | <0.001* |
Abbreviations: ALT - Alanine Aminotransferase; AST - Aspartate Aminotransferase; BMI - Body Mass Index; FBG - Fasting Blood Glucose; FNI – Fibrotic NASH Index; GGT - Gamma-Glutamyl Transferase; HDL - High-Density Lipoprotein; HbA1c - Hemoglobin A1c; HSI - Hepatic Steatosis Index; LDL - Low-Density Lipoprotein.
Disclaimer/Publisher’s Note: The statements, opinions and data contained in all publications are solely those of the individual author(s) and contributor(s) and not of MDPI and/or the editor(s). MDPI and/or the editor(s) disclaim responsibility for any injury to people or property resulting from any ideas, methods, instructions or products referred to in the content. |
© 2024 by the authors. Licensee MDPI, Basel, Switzerland. This article is an open access article distributed under the terms and conditions of the Creative Commons Attribution (CC BY) license (http://creativecommons.org/licenses/by/4.0/).
Copyright: This open access article is published under a Creative Commons CC BY 4.0 license, which permit the free download, distribution, and reuse, provided that the author and preprint are cited in any reuse.


