
Submitted:
23 May 2025
Posted:
26 May 2025
You are already at the latest version
Abstract
Increasing evidence reveals that immune cells significantly contribute to metabolic dysfunction-associated steatotic liver disease (MASLD) progression. The patatin-like phospholipase domain-containing protein 3 (PNPLA3) I148M variant has been linked to hepatic inflammation and fibrosis; however, its role in immune cell infiltration and activation within the liver remains unclear. Seventy patients with MASLD were prospectively enrolled. Genomic DNA was extracted from buccal swabs or liver biopsy samples, followed by single nucleotide polymorphism genotyping to determine the rs738409 SNP genotype at codon 148 of PNPLA3. Immunohistochemistry was conducted using CD3 and CD68 antibodies to quantify T cell and macrophage infiltration, respectively. Total RNA extracted from biopsy specimens was used for quantitative reverse transcription polymerase chain reaction to assess the expression of specific markers associated with immune cell activation. Among the 70 patients with MASLD, 34 had the GG genotype, whereas 21 and 15 had the GC and CC genotypes, respectively. The GG genotype group showed a higher proportion of advanced fibrosis (F3 or F4) than the GC+CC group (P = 0.051). GG genotype carriers exhibited significantly higher CD3+ and CD68+ cell counts in the periportal region than the GC/CC carriers (P < 0.05). The transcriptomic analysis revealed elevated expression of markers associated with chronic antigen stimulation and immune cell activation (CD8A, GZMB, CCL2, and TIMP1) in GG carriers compared with those of GC and CC (P < 0.05). Furthermore, correlations among various markers, including inflammatory, steatosis-associated, and fibrosis-associated markers, exhibited consistent positive correlations. Our findings revealed that the PNPLA3 I148M variant and increased immune cell infiltration and activation were significantly correlated within the MASLD liver. Further studies are needed to elucidate the mechanistic links between this genetic variant and liver inflammation.
Keywords:
PNPLA3
; metabolic dysfunction-associated steatotic liver disease
; liver fibrosis
; immune cell
1. Introduction
Metabolic dysfunction-associated steatotic liver disease (MASLD) is the pathological accumulation of lipids in the liver along with metabolic comorbidities, such as obesity, diabetes, hypertension, and hypertriglyceridemia [1]. It is widely believed that MASLD progresses to advanced liver disease and severe liver-related outcomes, including hepatocellular carcinoma (HCC) and decompensated cirrhosis, thus posing a substantial clinical and socioeconomic burden [2,3]. A central mechanistic driver of MASLD progression is insulin resistance, which promotes de novo lipogenesis and causes lipid overload and subsequent hepatocellular injury [4]. Since higher grades of fibrosis or the presence of steatohepatitis are prognostic factors for unfavorable outcomes in MASLD cases, various therapeutic approaches have been proposed to restrain MASLD progression, such as resmetirom, which was recently approved as the first drug for MASLD [5-7]. Nevertheless, considering that MASLD presentation and pathobiology can be considerably heterogeneous, additional therapeutics that target diverse molecular pathways are urgently needed [8].
Growing evidence reveals that genetic factors are pivotal for MASLD pathogenesis. Among the numerous implicated loci, the I148M variant in the patatin-like phospholipase domain-containing protein 3 (PNPLA3) gene is uniquely associated with hepatic steatosis [9,10]. Individuals that are homozygous for the GG allele exhibit a higher risk of fibrosis progression, liver-related events, and HCC [11-13]. Mechanistically, the I148M substitution impairs the enzymatic lipase activity of PNPLA3, diminishes triglyceride mobilization, and promotes excessive lipid droplet accumulation in hepatocytes, which are key processes driving MASLD development and progression [14,15]. Recently, Vilar-Gomez et al. demonstrated that portal inflammation accounts for a substantial proportion of the indirect influence of PNPLA3 on fibrosis severity, indicating a possible role of PNPLA3 on immune cell-related meachnisms [16]. However, the precise mechanisms by which PNPLA3 facilitates MASLD progression have not been completely characterized, particularly regarding the immunological and inflammatory pathways it influences and the role of immune cell-mediated processes, which are not yet fully understood.
Additionally, in MASLD progression, immune cells including T cells and macrophages serve as central regulators of immune-mediated mechanisms. Enriched within the periportal region, these immune cells are actively engaged in inflammatory responses [17,18]. Under lipotoxic conditions, proinflammatory T cell subsets become activated, secreting cytokines such as interferon-γ, interleukin-2, and tissue necrotic factor-α, and β, thereby fostering a proinflammatory milieu [17,19]. Oxidative stress has also been implicated in CD8⁺ T cell accumulation, further exacerbating liver inflammation and injury [20]. Macrophages, encompassing resident Kupffer cells and monocyte-derived macrophages, are likewise key players in chronic liver disease and MASLD pathogenesis [21-23]. Chronic inflammatory cascades in metabolic disorders are predominantly driven by these hepatic macrophage populations, while translocated lipopolysaccharide from the gut aggravates liver injury by activating macrophages and other intrahepatic immune cells [24,25]. Although direct evidence linking PNPLA3 status to immune cell infiltration remains limited, a potential pathophysiological connection can be inferred from the central role of immune cells in MASLD pathobiology.
Based on these considerations, we sought to determine whether the PNPLA3 I148M variant influences immune cell infiltration within the periportal region of MASLD livers. We also aimed to evaluate the expression level of immune-related genes in relation to PNPLA3 I148M genetic variants, thereby providing mechanistic insights into how PNPLA3 might shape immune cell-driven immunopathology and contribute to MASLD progression.
2. Materials and Methods
2.1. Patients
We conducted a prospective study, in which patients with MASLD at two affiliated university hospitals in Korea were consecutively enrolled between June and December 2024. MASLD was defined as the presence of steatosis along with at least one of the recognized cardiometabolic risk factors, following the current consensus criteria [26]. All enrolled patients underwent PNPLA3 genotyping, and each provided a liver biopsy sample for histological assessment and immunohistochemical staining of CD3 and CD68. This study was approved by the Institutional Review Board of the Catholic University of Korea (approval number: XC24TIDI0025) and was conducted in accordance with the Declaration of Helsinki. Informed consent was obtained from all participants before enrollment.
2.2. Genomic Data Collection and Single Nucleotide Polymorphism Genotyping
Genomic DNA was extracted from the buccal swabs, whole blood, or tissue samples using the XENOPURE™ gDNA Purification Kit (XENOHELIX, Incheon, Republic of Korea). Single nucleotide polymorphism genotyping was performed using the XENO-SNP assay kit (XENOHELIX, Incheon, Republic of Korea). Approximately, 10 ng of genomic DNA was amplified in a 20 μL reaction volume, following the manufacturer's protocol, using a 96-well plate format. Amplifications for all assays were conducted using the CFX Connect Real-Time Polymerase Chain Reaction (PCR) Detection System.
2.3. Immunohistochemistry Analysis
First, a liver sample was obtained via core-needle liver biopsy. The liver biopsy sample was fixed in 10% formalin for 24 h before embedding paraffin. Hematoxylin and eosin staining, Masson’s trichrome staining, and immunohistochemistry were conducted following previously established methods [27]. Anti-CD3 (Abcam, Cambridge, UK) and anti-CD68 (clone: KP1; Dako, Carpinteria, CA, USA) antibodies were used for incubation. The cells were quantified by evaluating three distinct periportal regions per liver sample. In each region, positive cells were manually counted under a light microscope at 400× magnification. The cell counts were normalized to a standard unit area of 20,000 µm² to account for the variability of tissue size. Specifically, the number of CD3⁺ and CD68⁺ cells was recorded within each defined area, and the values obtained from the three regions were averaged to determine the representative cell density for each sample.
2.4. Exploration of Gene Expression Profiles
To measure mRNA expression, cDNA synthesis and TaqMan reverse transcription-quantitative polymerase chain reaction analyses were performed following previously established protocols [27]. mRNA levels of target genes were quantified using the TaqMan gene expression assay (Applied Biosystems, Foster City, CA, USA). The assay IDs for each gene are provided in Supplementary Table 1. The quantitative real-time reverse transcription PCR (qRT-PCR) was performed on a LightCycler 480 II system (Roche Diagnostics) using the LightCycler 480 Probes Master Reaction Mix (Roche).
2.5. Clinical and Histological Data Collection
Anthropometric measurements, including body weight and height, were measured for each patient. Laboratory data including lipid profile, total bilirubin, alanine aminotransferase, and aspartate aminotransferase, were also obtained for the analysis. Fibrosis-4 Index score was calculated using the laboratory findings [28]. Furthermore, histologic findings from liver biopsy samples that were used to determine the NAFLD Activity Score (NAS) and fibrosis stage were evaluated by expert pathologists, following the guidelines established by the Non-Alcoholic Steatohepatitis Clinical Research Network [29,30]. In addition, patients who underwent vibration-controlled transient elastography when they were enrolled had their liver stiffness measurement and controlled attenuation parameter values recorded.
2.6. Statistical Analysis
Two-tailed, unpaired Student’s t-tests or Mann–Whitney tests were used to compare continuous variables between two groups, with results expressed as mean ± standard deviation. For three or more group comparisons, analysis of variance was performed. Categorical variables were analyzed using either the chi-square or Fisher’s exact tests, depending on sample size. Additionally, linear regression analysis was conducted to identify correlations between markers related to immune activation, fibrosis, and steatosis, and these relationships were quantified using Pearson’s correlation coefficients. Statistical significance was set at p < 0.05. All statistical analyses were performed using the R statistical software (version 4.0.3; R Foundation Inc., Vienna, Austria; http://cran.r-project.org, accessed on January 3, 2025).
3. Results
3.1. Baseline Characteristics
Overall, 70 patients with MASLD were included in the analysis. Of these, 34 had the GG genotype, whereas 36 carried the GC or CC genotype (21 GC, 15 CC) (Table 1). Anthropometric measurements and medical histories did not significantly differ between the GG and GC+CC groups. Similarly, laboratory findings did not significantly differ, except for serum albumin levels, which were lower in the GG group than in the GC+CC group (p = 0.020). controlled attenuation parameter and controlled attenuation parameter values were also compared between the two groups. Both were higher in the GG group than in the GC+CC group; nevertheless, they did not statistically significantly differ (p = 0.228 and p = 0.115, respectively).
3.2. MASLD Severity According to the PNPLA3 I148M Genetic Variant
MASLD severity, as determined by the NAS and fibrosis stage, was compared between the GG and GC+CC genotype groups (Figure 1). Figure 1A shows a representative histological image corresponding to each fibrosis stage. Sixteen of the 70 patients had a NAS ≥ 5, and their proportions did not significantly differ between the two genotype groups (p = 0.678). Furthermore, none of the individual components of the NAS, including steatosis degree, ballooning degeneration, and lobular activity, varied significantly with the PNPLA3 genotype (Figure 1B). In contrast, the distribution of fibrosis stages significantly differed between the groups (p = 0.025). The GG genotype group showed a higher proportion of patients with advanced fibrosis (F3: 17.6%, F4: 26.5%) than that of the GC+CC group (F3: 19.4%, F4: 2.8%) (Figure 1C).
3.3. Differential Immune Cell Infiltration in MASLD Liver
Immune cell infiltration was evaluated in MASLD liver biopsy samples through immunohistochemical staining for CD3 and CD68, and results were compared according to the fibrosis stage, PNPLA3 genotype, and NAS (Figure 2). Figure 2A shows a representative immunohistochemical staining of CD3 and CD68 based on the PNPLA3 genotype. The fibrosis stage analyses (Figure 2B) showed that both CD3+ and CD68+ cell counts were highest in F4, with statistically significant differences observed across fibrosis stages (p < 0.001 for both). Notably, the GG genotype group exhibited a significantly higher CD3+ cell count than that of the GC+CC group (39.6 ± 18.2 vs. 25.7 ± 13.2; p < 0.001) (Figure 2C). Similarly, the CD68+ cell count was elevated in the GG group (36.9 ± 14.4) compared with the GC+CC group (27.5 ± 10.2; p = 0.002). When stratified by NAS (Figure 2D), patients with a NAS of 5–8 had higher CD3+ and CD68+ cell counts than those with a NAS of 0–4, although these differences were not statistically significant (p = 0.074 and 0.580 for CD3 and CD68, respectively).
3.4. Association Between PNPLA3 I148M Genetic Variant and Immune-Related Gene Expression
To examine the association between chronic antigen stimulation, immune cells, and the GG genotype, we analyzed the expression of various immune-related genes in liver biopsy samples from 36 patients with MASLD using qRT-PCR (Supplementary Table 2). The GG genotype group showed significantly higher expression of T cell activation-related genes, including CD8A and GZMB, compared with the GC+CC group (p < 0.05). Additionally, genes associated with T cell exhaustion and CD8+ clonal expansion, such as CXCR6, PDCD1, TIGIT, TOX, KLRG1, and CD160, showed a trend toward increased expression in the GG group. However, these expressions were not statistically significant (Figure 3A). The inflammation-related gene CCL2 was significantly upregulated in the GG group (p < 0.05), with IFNγ, TNFα, and IL1β displaying a similar upward trend (Figure 3B). Fibrosis-related genes, including TIMP1 (p < 0.05) and PPARγ, also showed higher expression in the GG group than in the GC+CC group, and the trend observed was also comparable (Figure 3C).
3.5. Correlation Between Immune-Related Markers and MASLD Severity
Correlation between markers, including inflammatory, steatosis-associated, and fibrosis-associated markers, were assessed (Figure 4). Both CD3+ and CD68+ cell counts showed positive correlations with fibrosis stage (CD3: r = 0.56, p < 0.001; CD68: r = 0.63, p < 0.001), controlled attenuation parameter (CD3: r = 0.55, p < 0.001; CD68: r = 0.50, p < 0.001), and fibrosis-4 Index score (CD3: r = 0.55, p < 0.001; CD68: r = 0.50, p < 0.001). In addition, mRNA levels of T cell activation–related genes, such as CD8A, CXCR6, GZMB, and PDCD1, were positively correlated with CD3+ cell counts, fibrosis stage, and controlled attenuation parameter. Finally, TIMP1 and CCL2, recognized as key mediators of fibrosis and inflammation, displayed strong and significant correlations with CD3+ cell counts, fibrosis stage, and NAS, reflecting consistent trends across these diverse markers.
3.6. Sensitivity Analysis in MASLD with Early Fibrosis (F0–2)
To further clarify the association between the PNPLA3 genotype and immune cell infiltration, we performed a sensitivity analysis for patients with fibrosis stages F0–2 (Supplementary Figure 1). In this subgroup, CD3+ cell counts remained significantly higher in the GG genotype group than in GC+CC (31.6 vs. 24.3; p = 0.043). Furthermore, regarding CD68+ cell counts, the GG genotype again showed higher cell counts than the GC+CC genotype did, although the difference was not statistically significant (29.4 vs. 25.3, p = 0.126).
4. Discussion
In this study, we comprehensively investigated the PNPLA3 I148M genetic variant and its association with immune cell populations and activation in MASLD. Our findings revealed that the GG genotype is associated with higher periportal infiltration of CD3+ and CD68+ cells than the GC+CC genotype. Furthermore, the GG group exhibited elevated expression of CD8A, GZMB, CCL2, and TIMP1, indicating a clear correlation between the PNPLA3 genotype and immune cell–associated gene expression. To the best of our knowledge, this study is the first to report an association between PNPLA3 genotype and immune cell infiltration in MASLD, suggesting a potential role for immune cells as mediators of disease progression in individuals carrying the GG variant.
The role of PNPLA3 in MASLD progression is well established across diverse ethnic and age groups [31]. Specifically, the GG genotype increases the risk of fibrosis progression. This finding aligned with our results, which showed that the GG group showed a higher proportion of advanced fibrosis than the GC+CC group [16]. Recent reports further suggest that patients with the GG genotype may benefit less from certain pharmacological interventions, prompting ongoing trials of agents that modulate PNPLA3 transcription, some of which have shown promising results in Phase I studies [32,33]. The PNPLA3 gene encodes an enzyme essential for lipid droplet remodeling in hepatocytes, and its I148M variant has long been recognized as a pivotal risk factor for MASLD. Beyond its role in lipid regulation, emerging evidence shows that PNPLA3 also affects immune-mediated pathways, such as IL-6/STAT signaling, which contributes to the progression to more advanced stages of MASLD [34]. Furthermore, Villar-Gomez et al. demonstrated that a substantial portion of the mechanistic pathway in GG-mediated MASLD progression may be driven by portal inflammation, consistent with our findings that an association exists between the PNPLA3 GG genotype and periportal T cell infiltration [32].
Diffuse lobular infiltration by lymphocytes, a histological feature of metabolic dysfunction-associated steatohepatitis (MASH), is also a critical component of periportal infiltration [35,36]. In patients with MASH, immune cells form localized aggregates that correlate positively with lobular inflammation and fibrosis stages [37]. Furthermore, hepatocyte injury can occur via various pathways, among which the activity of CD8+ cytotoxic T lymphocytes plays a pivotal role [17]. The progression of MASLD and MASH in both humans and mice is accompanied by an increase in activated intrahepatic CD8+ cytotoxic T lymphocytes [35,38-40], which exacerbate hepatic inflammation and damage [41-43]. In addition to intrahepatic CD8+ T cells, activated CD8+ T cells from the gut have strong tendencies to migrate to the liver, further aggravating hepatic injury [44]. In the liver, CD8+ T cells with distinctive phenotype—combining tissue-resident properties, effector characteristics (granzyme), and exhaustion markers (PD1)—have been observed to accumulate [45]. Recently, studies have reported that CD8+ T cells accumulating in the livers of humans and mice with MASH express high levels of Tigit, Tox, and Pd1, which are associated with chronic exhaustion induced by persistent stimulation at the protein and transcriptional levels [46,47]. These findings reveal that intrahepatic T cell accumulation during MASH is more likely caused by antigen-driven T cell activation and clonal expansion rather than cytokine-mediated activation and accumulation [46]. Notably, the clonal expansion of T cells in the liver is observed at approximately week 13 after initiating a high-fat, high-cholesterol diet—coinciding with the onset of fibrosis—suggesting that this process is likely associated with the later stages of the disease progression [46].
Our study findings showed that the GG group exhibited an increased periportal infiltration of CD3+ and CD68+ cells, alongside elevated expression levels of CD8A and GZMB, establishing a clear association between immune cell infiltration and PNPLA3 genotype variation. Additionally, genes associated with CD8+ T cell characteristics, such as tissue residency, effector functions, and exhaustion, had a tendency to show higher expression levels in the GG group than in the GC+CC group. Moreover, inflammatory and fibrosis-related genes, including CCL2 and TIMP1, were significantly upregulated in the GG group. Strong correlations were observed among inflammatory, steatosis-associated, and fibrosis-associated markers. Collectively, these findings provide the first evidence that the PNPLA3 genetic variant drives excessive lipid accumulation in hepatocytes, exacerbates periportal inflammation, and contributes to fibrosis progression by interacting with immune cells.
This study has some limitations. First, the relatively small sample size may limit the generalizability of the findings. Increasing the sample size in future studies would improve the accuracy and reliability of the results and better represent the broader population. In the same context, the ethnic homogeneity of the study population may further limit the generalizability of our findings. Hence, future research that includes participants from diverse ethnic backgrounds is essential. Second, direct confirmation of phenotypes associated with tissue residency, effector functions, and exhaustion in CD8+ T cells and other immune cell subsets, rather than liver tissue alone, is necessary to more clearly elucidate the relationship between PNPLA3 genetic variants and immune cells.
5. Conclusions
In conclusion, our findings provided novel evidence that the PNPLA3 I148M GG genotype is associated with heightened immune cell infiltration and activation in MASLD, providing more insights into advanced stages of fibrosis and disease progression. By linking this genetic variant to specific immune cell-associated immune mechanisms, our findings reveal that immune cell-driven inflammation is a potential mediator of PNPLA3-associated MASLD progression. These results underscore the importance of stratifying patients by PNPLA3 genotype in both clinical management and future therapeutic interventions, including those aimed at modulating immune cell-mediated pathways to mitigate fibrosis progression in MASLD. Further studies, including T cell receptor sequencing, in vitro co-culture experiments tailored to PNPLA3 genotypes, and investigations using knock-in mouse models, are required to elucidate the mechanistic link between PNPLA3 genetic variants and immune cell-mediated processes.
Supplementary Materials
The following supporting information can be downloaded at: Preprints.org, Figure S1: Sensitivity analysis of correlation between PNPLA3 genotype and CD3+ cells and/or CD68+ cells in patients with fibrosis stage 0–2; Table S1: TaqMan® Gene Expression Assays IDs used in this study; Table S2: Demographic and Clinical Characteristics of 36 Samples Analyzed by Real-Time PCR.
Author Contributions
Study concept and design: Pil Soo Sung and Si Hyun Bae. Data collection: Jaejun Lee, Jung Hoon Cha, Hyun Yang, Pil Soo Sung, and Si Hyun Bae. Data analysis and interpretation: Jaejun Lee, Jung Hoon Cha, Mi Young Byun, Seok keun Cho, Jin Sung Park, Hyuk Wan Ko, Seong Wook Yang, Pil Soo Sung, and Si Hyun Bae. Manuscript writing: Jaejun Lee, Jung Hoon Cha, and Pil Soo Sung. Conceptualization, methodology, and supervision: Pil Soo Sung and Si Hyun Bae. Final approval of the version to be published: all authors.
Funding
This work was supported by the Bio & Medical Technology Development Program of the National Research Foundation (NRF) funded by the Korean government (MSIT) (RS-2024-00438542 to S.H.B). Additional support was provided in part by the NRF grant funded by the Korean government (MSIT) (RS-2023-00208767 to S.H.B) and (RS-2024-00337298 to P.S.S).
Institutional Review Board Statement
This study was approved by the Institutional Review Board of the Catholic University of Korea (approval number: XC24TIDI0025). Informed consent was obtained from all participants prior to the study enrolment.
Informed Consent Statement
Informed consent was obtained from all participants prior to the study enrolment.
Data Availability Statement
The original contributions presented in the study are included in the article/supplemental material. Further inquiries can be directed at the corresponding author.
Conflicts of Interest
The authors declare no conflicts of interest.
Abbreviations
CC, wild-type genotype for PNPLA3 I148M variant; GG, homozygous genotype for PNPLA3 I148M variant; GC, heterozygous genotype for PNPLA3 I148M variant; MASLD, metabolic dysfunction-associated steatotic liver disease; NAS, NAFLD activity score; NAFLD, non-alcoholic fatty liver disease; PNPLA3, patatin-like phospholipase domain-containing protein 3.
References
- EASL-EASD-EASO Clinical Practice Guidelines on the Management of Metabolic Dysfunction-Associated Steatotic Liver Disease (MASLD). Obes Facts 2024, 17, 374–444. [CrossRef] [PubMed]
- Kim, D.Y. Changing etiology and epidemiology of hepatocellular carcinoma: Asia and worldwide. J Liver Cancer 2024, 24, 62–70. [Google Scholar] [CrossRef] [PubMed]
- Han, J.W.; Sohn, W.; Choi, G.H.; Jang, J.W.; Seo, G.H.; Kim, B.H.; Choi, J.Y. Evolving trends in treatment patterns for hepatocellular carcinoma in Korea from 2008 to 2022: a nationwide population-based study. J Liver Cancer 2024, 24, 274–285. [Google Scholar] [CrossRef] [PubMed]
- Esler, W.P.; Cohen, D.E. Pharmacologic inhibition of lipogenesis for the treatment of NAFLD. J Hepatol 2024, 80, 362–377. [Google Scholar] [CrossRef]
- Iwaki, M.; Fujii, H.; Hayashi, H.; Toyoda, H.; Oeda, S.; Hyogo, H.; Kawanaka, M.; Morishita, A.; Munekage, K.; Kawata, K.; et al. Prognosis of biopsy-confirmed metabolic dysfunction- associated steatotic liver disease: A sub-analysis of the CLIONE study. Clin Mol Hepatol 2024, 30, 225–234. [Google Scholar] [CrossRef]
- Harrison, S.A.; Bedossa, P.; Guy, C.D.; Schattenberg, J.M.; Loomba, R.; Taub, R.; Labriola, D.; Moussa, S.E.; Neff, G.W.; Rinella, M.E.; et al. A Phase 3, Randomized, Controlled Trial of Resmetirom in NASH with Liver Fibrosis. N Engl J Med 2024, 390, 497–509. [Google Scholar] [CrossRef]
- An, J.; Sohn, J.H. Pharmacological advances in the treatment of nonalcoholic fatty liver diseases : focused on global results of randomized controlled trials. Clin Mol Hepatol 2023, 29, S268–s275. [Google Scholar] [CrossRef]
- Puengel, T.; Tacke, F. Pharmacotherapeutic options for metabolic dysfunction-associated steatotic liver disease: where are we today? Expert Opin Pharmacother 2024, 25, 1249–1263. [Google Scholar] [CrossRef]
- Johnson, S.M.; Bao, H.; McMahon, C.E.; Chen, Y.; Burr, S.D.; Anderson, A.M.; Madeyski-Bengtson, K.; Lindén, D.; Han, X.; Liu, J. PNPLA3 is a triglyceride lipase that mobilizes polyunsaturated fatty acids to facilitate hepatic secretion of large-sized very low-density lipoprotein. Nat Commun 2024, 15, 4847–s41467. [Google Scholar] [CrossRef]
- Valenti, L.; Al-Serri, A.; Daly, A.K.; Galmozzi, E.; Rametta, R.; Dongiovanni, P.; Nobili, V.; Mozzi, E.; Roviaro, G.; Vanni, E.; et al. Homozygosity for the patatin-like phospholipase-3/adiponutrin I148M polymorphism influences liver fibrosis in patients with nonalcoholic fatty liver disease. Hepatology 2010, 51, 1209–1217. [Google Scholar] [CrossRef]
- Liu, Y.L.; Patman, G.L.; Leathart, J.B.; Piguet, A.C.; Burt, A.D.; Dufour, J.F.; Day, C.P.; Daly, A.K.; Reeves, H.L.; Anstee, Q.M. Carriage of the PNPLA3 rs738409 C >G polymorphism confers an increased risk of non-alcoholic fatty liver disease associated hepatocellular carcinoma. J Hepatol 2014, 61, 75–81. [Google Scholar] [CrossRef] [PubMed]
- Rosso, C.; Caviglia, G.P.; Birolo, G.; Armandi, A.; Pennisi, G.; Pelusi, S.; Younes, R.; Liguori, A.; Perez-Diaz-Del-Campo, N.; Nicolosi, A.; et al. Impact of PNPLA3 rs738409 Polymorphism on the Development of Liver-Related Events in Patients With Nonalcoholic Fatty Liver Disease. Clin Gastroenterol Hepatol 2023, 21, 3314–3321.e3313. [Google Scholar] [CrossRef] [PubMed]
- Petta, S.; Armandi, A.; Bugianesi, E. Impact of PNPLA3 I148M on Clinical Outcomes in Patients With MASLD. Liver Int 2024. [Google Scholar] [CrossRef]
- Sookoian, S.; Pirola, C.J. Genetics in non-alcoholic fatty liver disease: The role of risk alleles through the lens of immune response. Clin Mol Hepatol 2023, 29, S184–s195. [Google Scholar] [CrossRef] [PubMed]
- BasuRay, S.; Smagris, E.; Cohen, J.C.; Hobbs, H.H. The PNPLA3 variant associated with fatty liver disease (I148M) accumulates on lipid droplets by evading ubiquitylation. Hepatology 2017, 66, 1111–1124. [Google Scholar] [CrossRef]
- Vilar-Gomez, E.; Pirola, C.J.; Sookoian, S.; Wilson, L.A.; Liang, T.; Chalasani, N. PNPLA3 rs738409 and risk of fibrosis in NAFLD: Exploring mediation pathways through intermediate histological features. Hepatology 2022, 76, 1482–1494. [Google Scholar] [CrossRef]
- Li, Z.; Wang, S.; Xu, Q.; Su, X.; Wang, Y.; Wang, L.; Zhang, Y. The double roles of T cell-mediated immune response in the progression of MASLD. Biomed Pharmacother 2024, 173, 116333. [Google Scholar] [CrossRef]
- Huby, T.; Gautier, E.L. Immune cell-mediated features of non-alcoholic steatohepatitis. Nat Rev Immunol 2022, 22, 429–443. [Google Scholar] [CrossRef]
- Mao, T.; Yang, R.; Luo, Y.; He, K. Crucial role of T cells in NAFLD-related disease: A review and prospect. Front Endocrinol (Lausanne) 2022, 13, 1051076. [Google Scholar] [CrossRef]
- Seth, R.K.; Das, S.; Kumar, A.; Chanda, A.; Kadiiska, M.B.; Michelotti, G.; Manautou, J.; Diehl, A.M.; Chatterjee, S. CYP2E1-dependent and leptin-mediated hepatic CD57 expression on CD8+ T cells aid progression of environment-linked nonalcoholic steatohepatitis. Toxicol Appl Pharmacol 2014, 274, 42–54. [Google Scholar] [CrossRef]
- Kazankov, K.; Jørgensen, S.M.D.; Thomsen, K.L.; Møller, H.J.; Vilstrup, H.; George, J.; Schuppan, D.; Grønbæk, H. The role of macrophages in nonalcoholic fatty liver disease and nonalcoholic steatohepatitis. Nat Rev Gastroenterol Hepatol 2019, 16, 145–159. [Google Scholar] [CrossRef] [PubMed]
- Sung, P.S. Crosstalk between tumor-associated macrophages and neighboring cells in hepatocellular carcinoma. Clin Mol Hepatol 2022, 28, 333–350. [Google Scholar] [CrossRef]
- Sung, P.S.; Park, D.J.; Roh, P.R.; Mun, K.D.; Cho, S.W.; Lee, G.W.; Jung, E.S.; Lee, S.H.; Jang, J.W.; Bae, S.H.; et al. Intrahepatic inflammatory IgA(+)PD-L1(high) monocytes in hepatocellular carcinoma development and immunotherapy. J Immunother Cancer 2022, 10. [Google Scholar] [CrossRef] [PubMed]
- Carpino, G.; Del Ben, M.; Pastori, D.; Carnevale, R.; Baratta, F.; Overi, D.; Francis, H.; Cardinale, V.; Onori, P.; Safarikia, S.; et al. Increased Liver Localization of Lipopolysaccharides in Human and Experimental NAFLD. Hepatology 2020, 72, 470–485. [Google Scholar] [CrossRef]
- Krenkel, O.; Tacke, F. Liver macrophages in tissue homeostasis and disease. Nat Rev Immunol 2017, 17, 306–321. [Google Scholar] [CrossRef]
- EASL-EASD-EASO Clinical Practice Guidelines on the management of metabolic dysfunction-associated steatotic liver disease (MASLD). J Hepatol 2024, 81, 492–542. [CrossRef]
- Cha, J.H.; Park, N.R.; Cho, S.W.; Nam, H.; Yang, H.; Jung, E.S.; Jang, J.W.; Choi, J.Y.; Yoon, S.K.; Sung, P.S.; et al. Chitinase 1: a novel therapeutic target in metabolic dysfunction-associated steatohepatitis. Front Immunol 2024, 15, 1444100. [Google Scholar] [CrossRef] [PubMed]
- Sterling, R.K.; Lissen, E.; Clumeck, N.; Sola, R.; Correa, M.C.; Montaner, J.; M, S.S.; Torriani, F.J.; Dieterich, D.T.; Thomas, D.L.; et al. Development of a simple noninvasive index to predict significant fibrosis in patients with HIV/HCV coinfection. Hepatology 2006, 43, 1317–1325. [Google Scholar] [CrossRef]
- Brunt, E.M.; Kleiner, D.E.; Wilson, L.A.; Belt, P.; Neuschwander-Tetri, B.A. Nonalcoholic fatty liver disease (NAFLD) activity score and the histopathologic diagnosis in NAFLD: distinct clinicopathologic meanings. Hepatology 2011, 53, 810–820. [Google Scholar] [CrossRef]
- Kleiner, D.E.; Brunt, E.M.; Van Natta, M.; Behling, C.; Contos, M.J.; Cummings, O.W.; Ferrell, L.D.; Liu, Y.C.; Torbenson, M.S.; Unalp-Arida, A.; et al. Design and validation of a histological scoring system for nonalcoholic fatty liver disease. Hepatology 2005, 41, 1313–1321. [Google Scholar] [CrossRef]
- Xu, R.; Tao, A.; Zhang, S.; Deng, Y.; Chen, G. Association between patatin-like phospholipase domain containing 3 gene (PNPLA3) polymorphisms and nonalcoholic fatty liver disease: a HuGE review and meta-analysis. Sci Rep 2015, 5, 9284. [Google Scholar] [CrossRef] [PubMed]
- Armisen, J.; Rauschecker, M.; Sarv, J.; Liljeblad, M.; Wernevik, L.; Niazi, M.; Knöchel, J.; Eklund, O.; Sandell, T.; Sherwood, J.; et al. AZD2693, a PNPLA3 antisense oligonucleotide, for the treatment of MASH in 148M homozygous participants: two randomized phase I trials. J Hepatol 2025. [Google Scholar] [CrossRef]
- Boeckmans, J.; Gatzios, A.; Schattenberg, J.M.; Koek, G.H.; Rodrigues, R.M.; Vanhaecke, T. PNPLA3 I148M and response to treatment for hepatic steatosis: A systematic review. Liver Int 2023, 43, 975–988. [Google Scholar] [CrossRef] [PubMed]
- Park, J.; Zhao, Y.; Zhang, F.; Zhang, S.; Kwong, A.C.; Zhang, Y.; Hoffmann, H.H.; Bushweller, L.; Wu, X.; Ashbrook, A.W.; et al. IL-6/STAT3 axis dictates the PNPLA3-mediated susceptibility to non-alcoholic fatty liver disease. J Hepatol 2023, 78, 45–56. [Google Scholar] [CrossRef] [PubMed]
- Sutti, S.; Albano, E. Adaptive immunity: an emerging player in the progression of NAFLD. Nat Rev Gastroenterol Hepatol 2020, 17, 81–92. [Google Scholar] [CrossRef]
- Yeh, M.M.; Brunt, E.M. Pathological features of fatty liver disease. Gastroenterology 2014, 147, 754–764. [Google Scholar] [CrossRef]
- Bruzzì, S.; Sutti, S.; Giudici, G.; Burlone, M.E.; Ramavath, N.N.; Toscani, A.; Bozzola, C.; Schneider, P.; Morello, E.; Parola, M.; et al. B2-Lymphocyte responses to oxidative stress-derived antigens contribute to the evolution of nonalcoholic fatty liver disease (NAFLD). Free Radic Biol Med 2018, 124, 249–259. [Google Scholar] [CrossRef]
- Grohmann, M.; Wiede, F.; Dodd, G.T.; Gurzov, E.N.; Ooi, G.J.; Butt, T.; Rasmiena, A.A.; Kaur, S.; Gulati, T.; Goh, P.K.; et al. Obesity Drives STAT-1-Dependent NASH and STAT-3-Dependent HCC. Cell 2018, 175, 1289–1306.e1220. [Google Scholar] [CrossRef]
- Ghazarian, M.; Revelo, X.S.; Nøhr, M.K.; Luck, H.; Zeng, K.; Lei, H.; Tsai, S.; Schroer, S.A.; Park, Y.J.; Chng, M.H.Y.; et al. Type I Interferon Responses Drive Intrahepatic T cells to Promote Metabolic Syndrome. Sci Immunol 2017, 2. [Google Scholar] [CrossRef]
- Sutti, S.; Jindal, A.; Locatelli, I.; Vacchiano, M.; Gigliotti, L.; Bozzola, C.; Albano, E. Adaptive immune responses triggered by oxidative stress contribute to hepatic inflammation in NASH. Hepatology 2014, 59, 886–897. [Google Scholar] [CrossRef]
- Breuer, D.A.; Pacheco, M.C.; Washington, M.K.; Montgomery, S.A.; Hasty, A.H.; Kennedy, A.J. CD8(+) T cells regulate liver injury in obesity-related nonalcoholic fatty liver disease. Am J Physiol Gastrointest Liver Physiol 2020, 318, G211–g224. [Google Scholar] [CrossRef] [PubMed]
- Bhattacharjee, J.; Kirby, M.; Softic, S.; Miles, L.; Salazar-Gonzalez, R.M.; Shivakumar, P.; Kohli, R. Hepatic Natural Killer T-cell and CD8+ T-cell Signatures in Mice with Nonalcoholic Steatohepatitis. Hepatol Commun 2017, 1, 299–310. [Google Scholar] [CrossRef] [PubMed]
- Wolf, M.J.; Adili, A.; Piotrowitz, K.; Abdullah, Z.; Boege, Y.; Stemmer, K.; Ringelhan, M.; Simonavicius, N.; Egger, M.; Wohlleber, D.; et al. Metabolic activation of intrahepatic CD8+ T cells and NKT cells causes nonalcoholic steatohepatitis and liver cancer via cross-talk with hepatocytes. Cancer Cell 2014, 26, 549–564. [Google Scholar] [CrossRef] [PubMed]
- Eickmeier, I.; Seidel, D.; Grün, J.R.; Derkow, K.; Lehnardt, S.; Kühl, A.A.; Hamann, A.; Schott, E. Influence of CD8 T cell priming in liver and gut on the enterohepatic circulation. J Hepatol 2014, 60, 1143–1150. [Google Scholar] [CrossRef]
- Dudek, M.; Pfister, D.; Donakonda, S.; Filpe, P.; Schneider, A.; Laschinger, M.; Hartmann, D.; Hüser, N.; Meiser, P.; Bayerl, F.; et al. Auto-aggressive CXCR6(+) CD8 T cells cause liver immune pathology in NASH. Nature 2021, 592, 444–449. [Google Scholar] [CrossRef]
- Burtis, A.E.C.; DeNicola, D.M.C.; Ferguson, M.E.; Santos, R.G.; Pinilla, C.; Kriss, M.S.; Orlicky, D.J.; Tamburini, B.A.J.; Gillen, A.E.; Burchill, M.A. Ag-driven CD8 + T cell clonal expansion is a prominent feature of MASH in humans and mice. Hepatology 2025, 81, 591–608. [Google Scholar] [CrossRef]
- Sekine, T.; Perez-Potti, A.; Nguyen, S.; Gorin, J.B.; Wu, V.H.; Gostick, E.; Llewellyn-Lacey, S.; Hammer, Q.; Falck-Jones, S.; Vangeti, S.; et al. TOX is expressed by exhausted and polyfunctional human effector memory CD8(+) T cells. Sci Immunol 2020, 5. [Google Scholar] [CrossRef]
Figure 1.
Distribution of the non-alcoholic fatty liver disease activity score and fibrosis stage according to the PNPLA3 genotype. (A) Liver biopsies stained with hematoxylin and eosin and Masson’s trichrome (scale bar: 100 µm, 400×) (B) non-alcoholic fatty liver disease (NAFLD) activity score. (C) Fibrosis stage. Figure B displays, from left to right, the distributions of the NAFLD activity score, steatosis grade, ballooning degeneration severity, and lobular activity score according to PNPLA3 genotype.
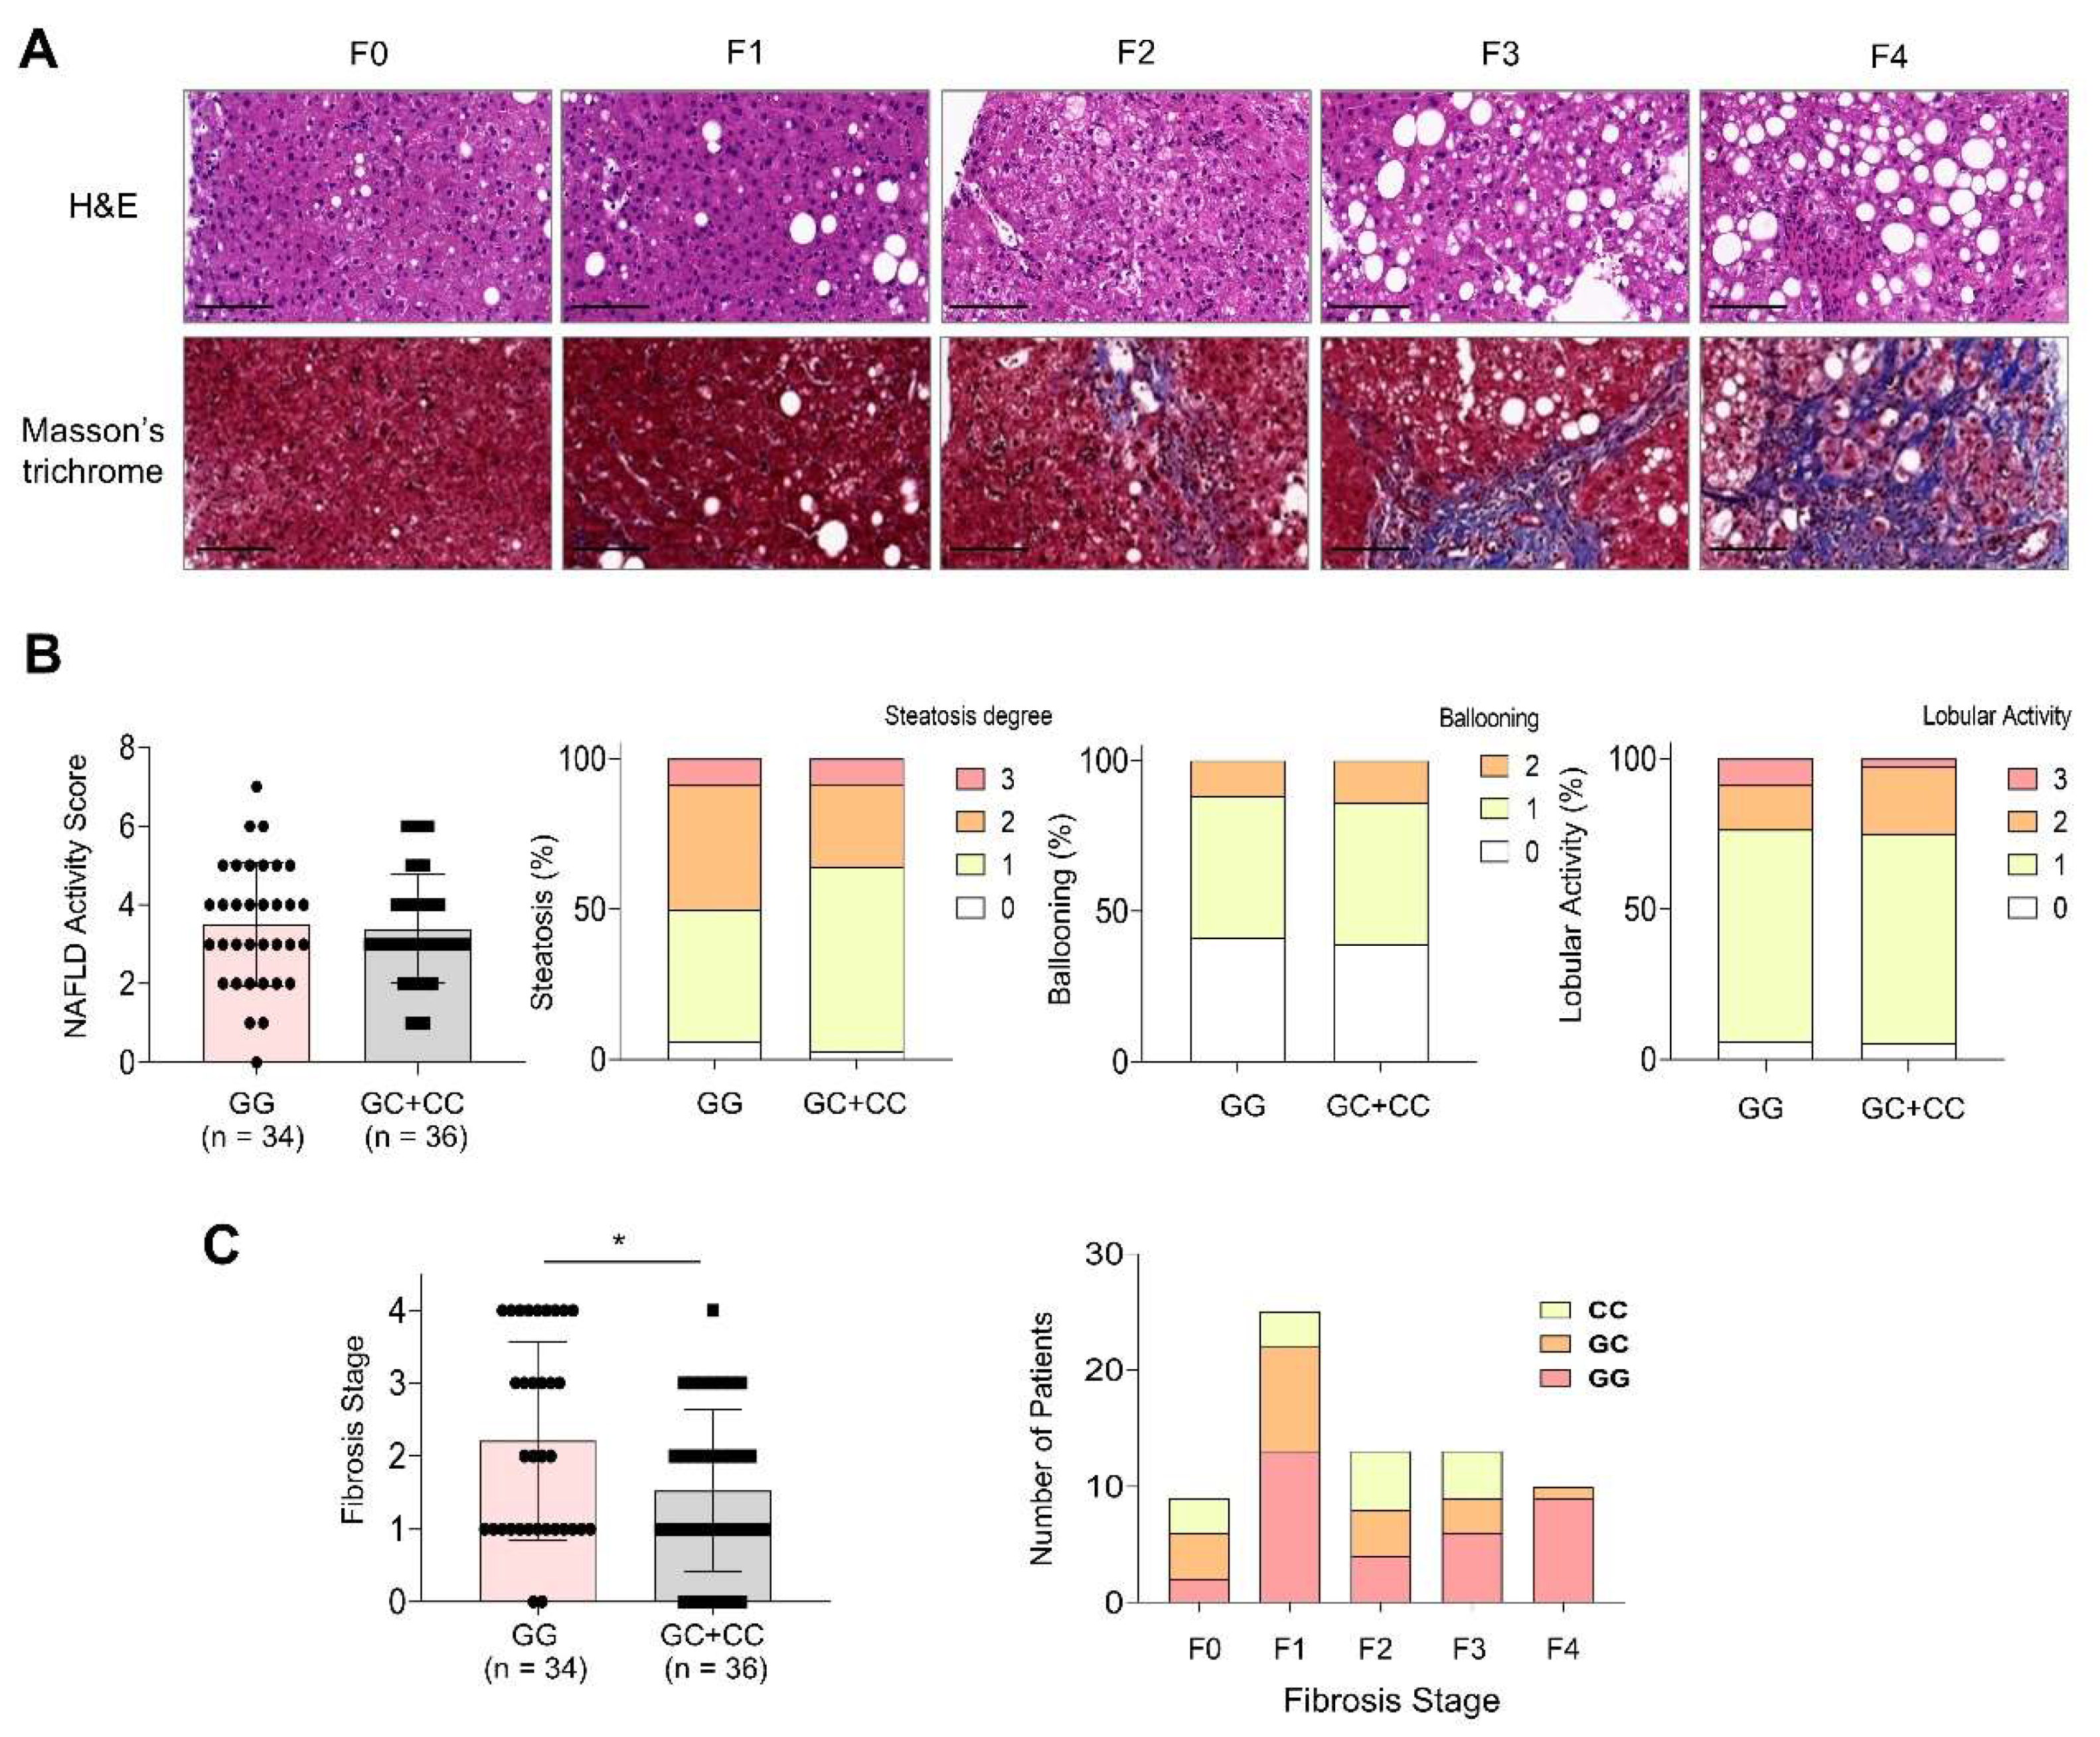
Figure 2.
Differential Infiltration of CD3+ and CD68+ cells in metabolic dysfunction-associated steatotic liver disease livers. (A) Representative immunohistochemical staining of CD3 and CD68 according to the patatin-like phospholipase domain-containing protein 3 (PNPLA3) genotype (scale bar: 100 µm, 400×). (B–D) Quantitative comparisons of CD3+ and CD68+ cell infiltration in metabolic dysfunction-associated steatotic liver disease livers according to (B) fibrosis stage, (C) PNPLA3 genotype, and (D) non-alcoholic fatty liver disease activity score. Statistical significance is indicated by *p < 0.05, **p < 0.01, and ***p < 0.001.
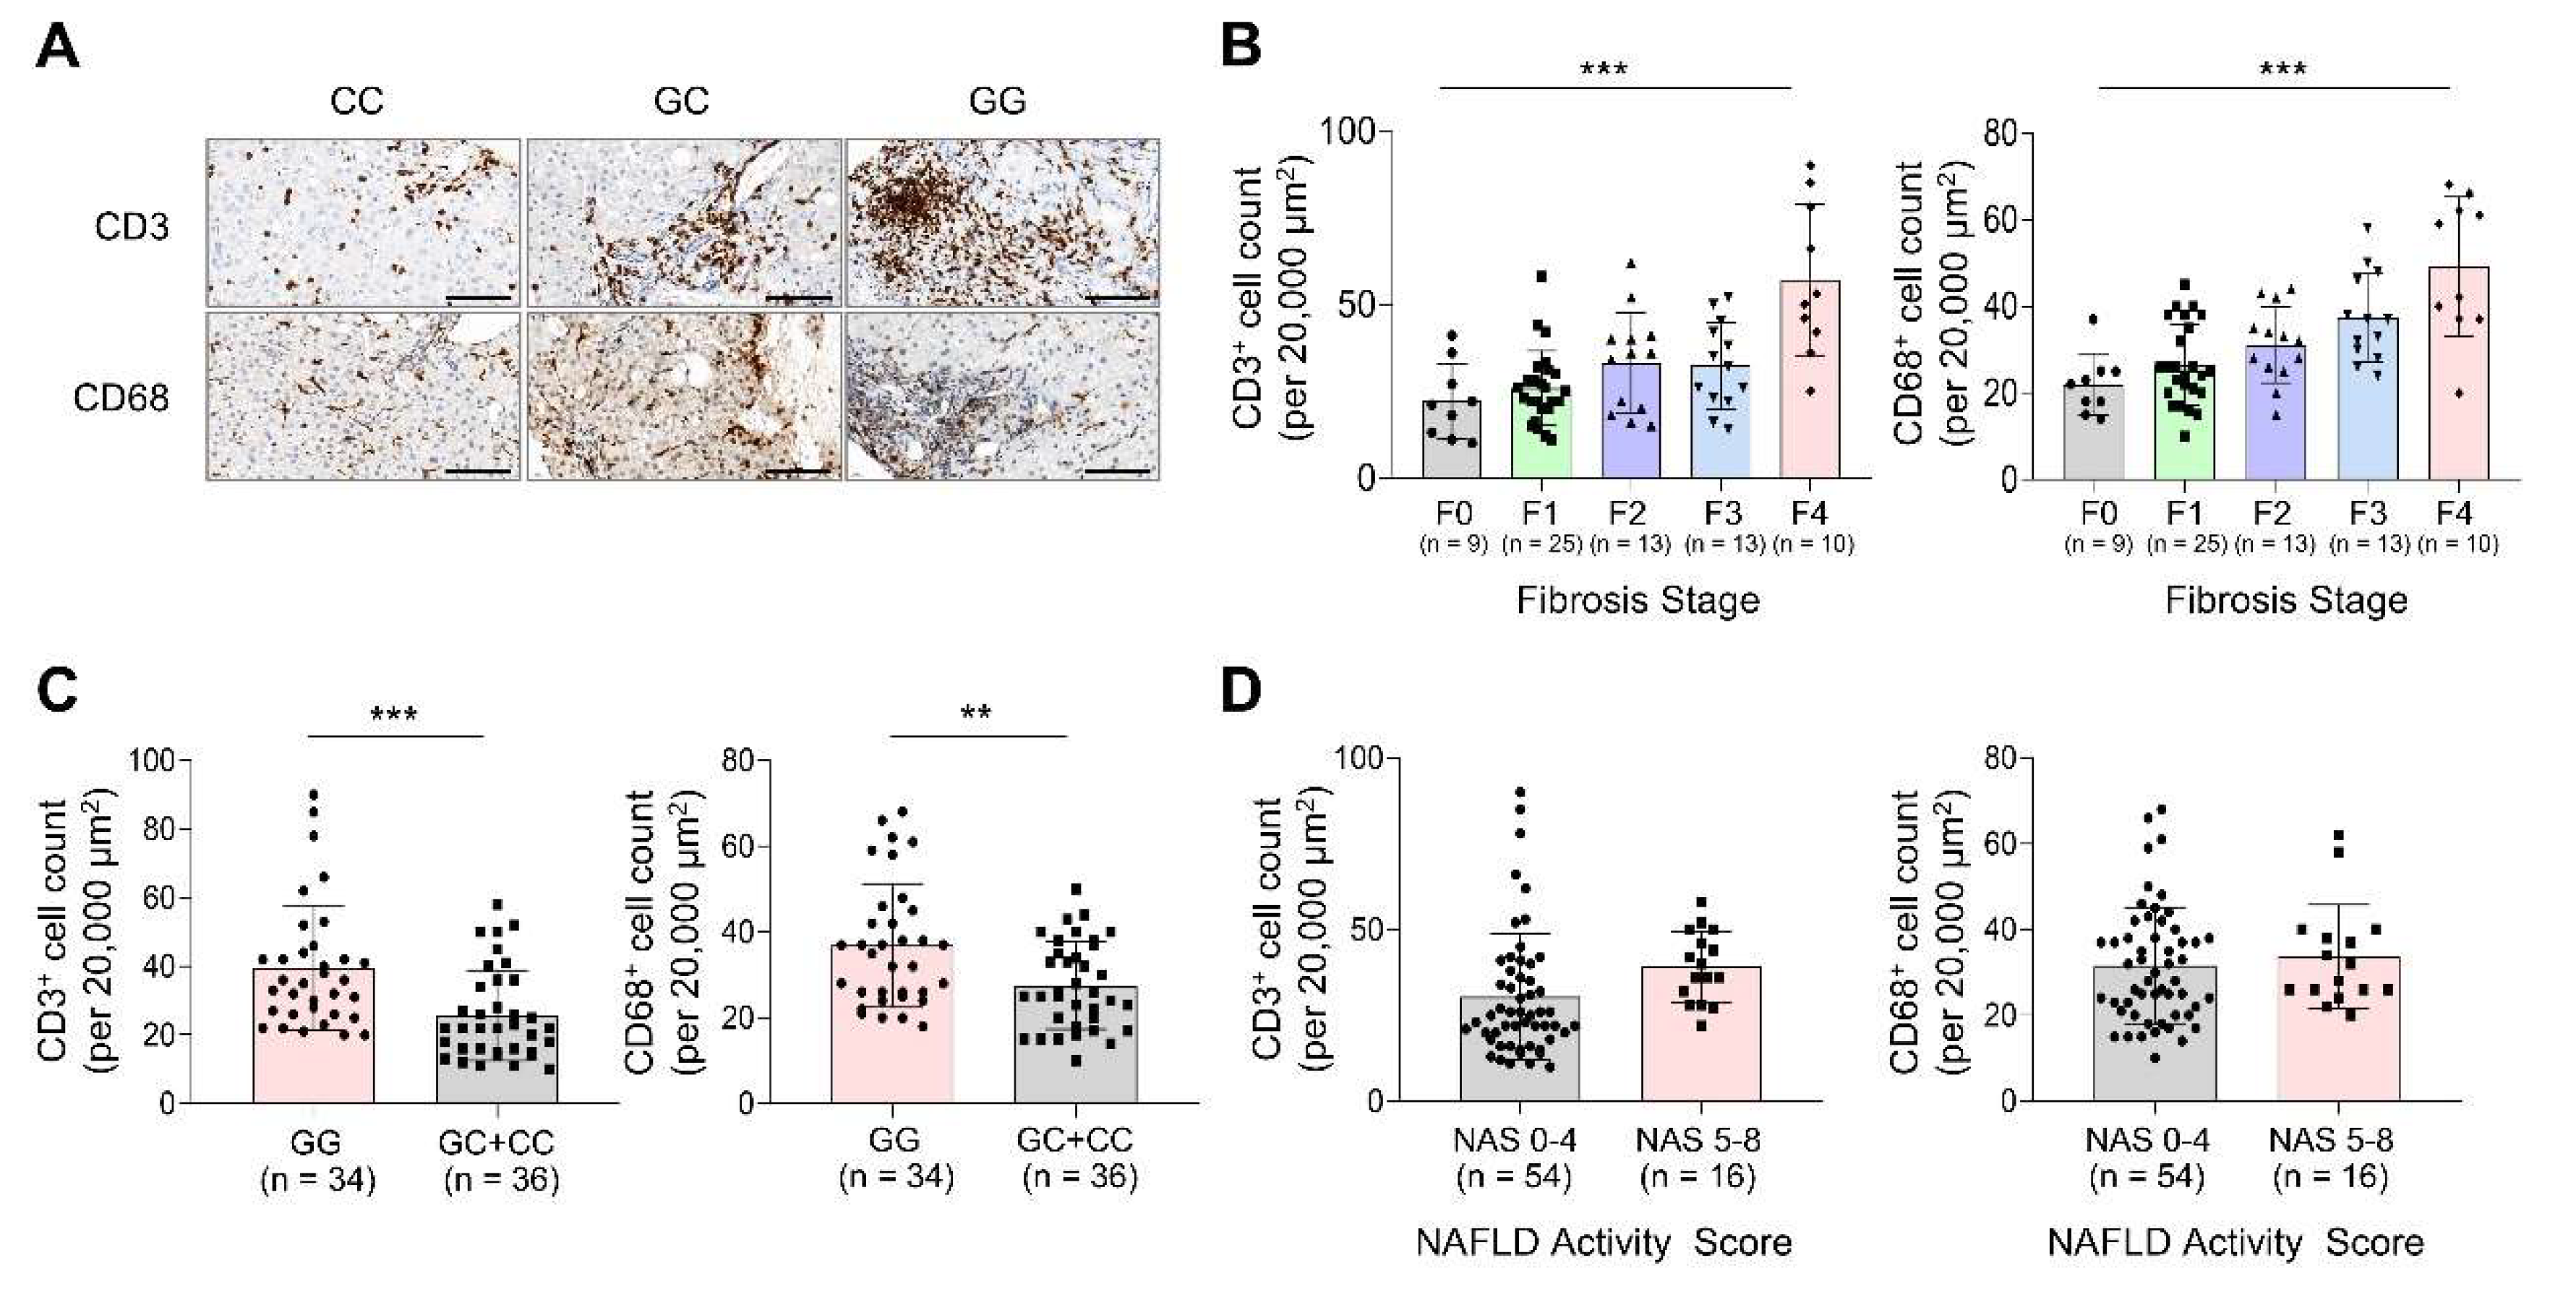
Figure 3.
Reverse transcription quantitative polymerase chain reaction-based gene expression analysis in liver biopsies. Hepatic mRNA levels of genes related to (A) T cell activation, (B) inflammation, and (C) fibrosis. Two-tailed unpaired independent t-test; data are presented as the mean ± SD. *p < 0.05.
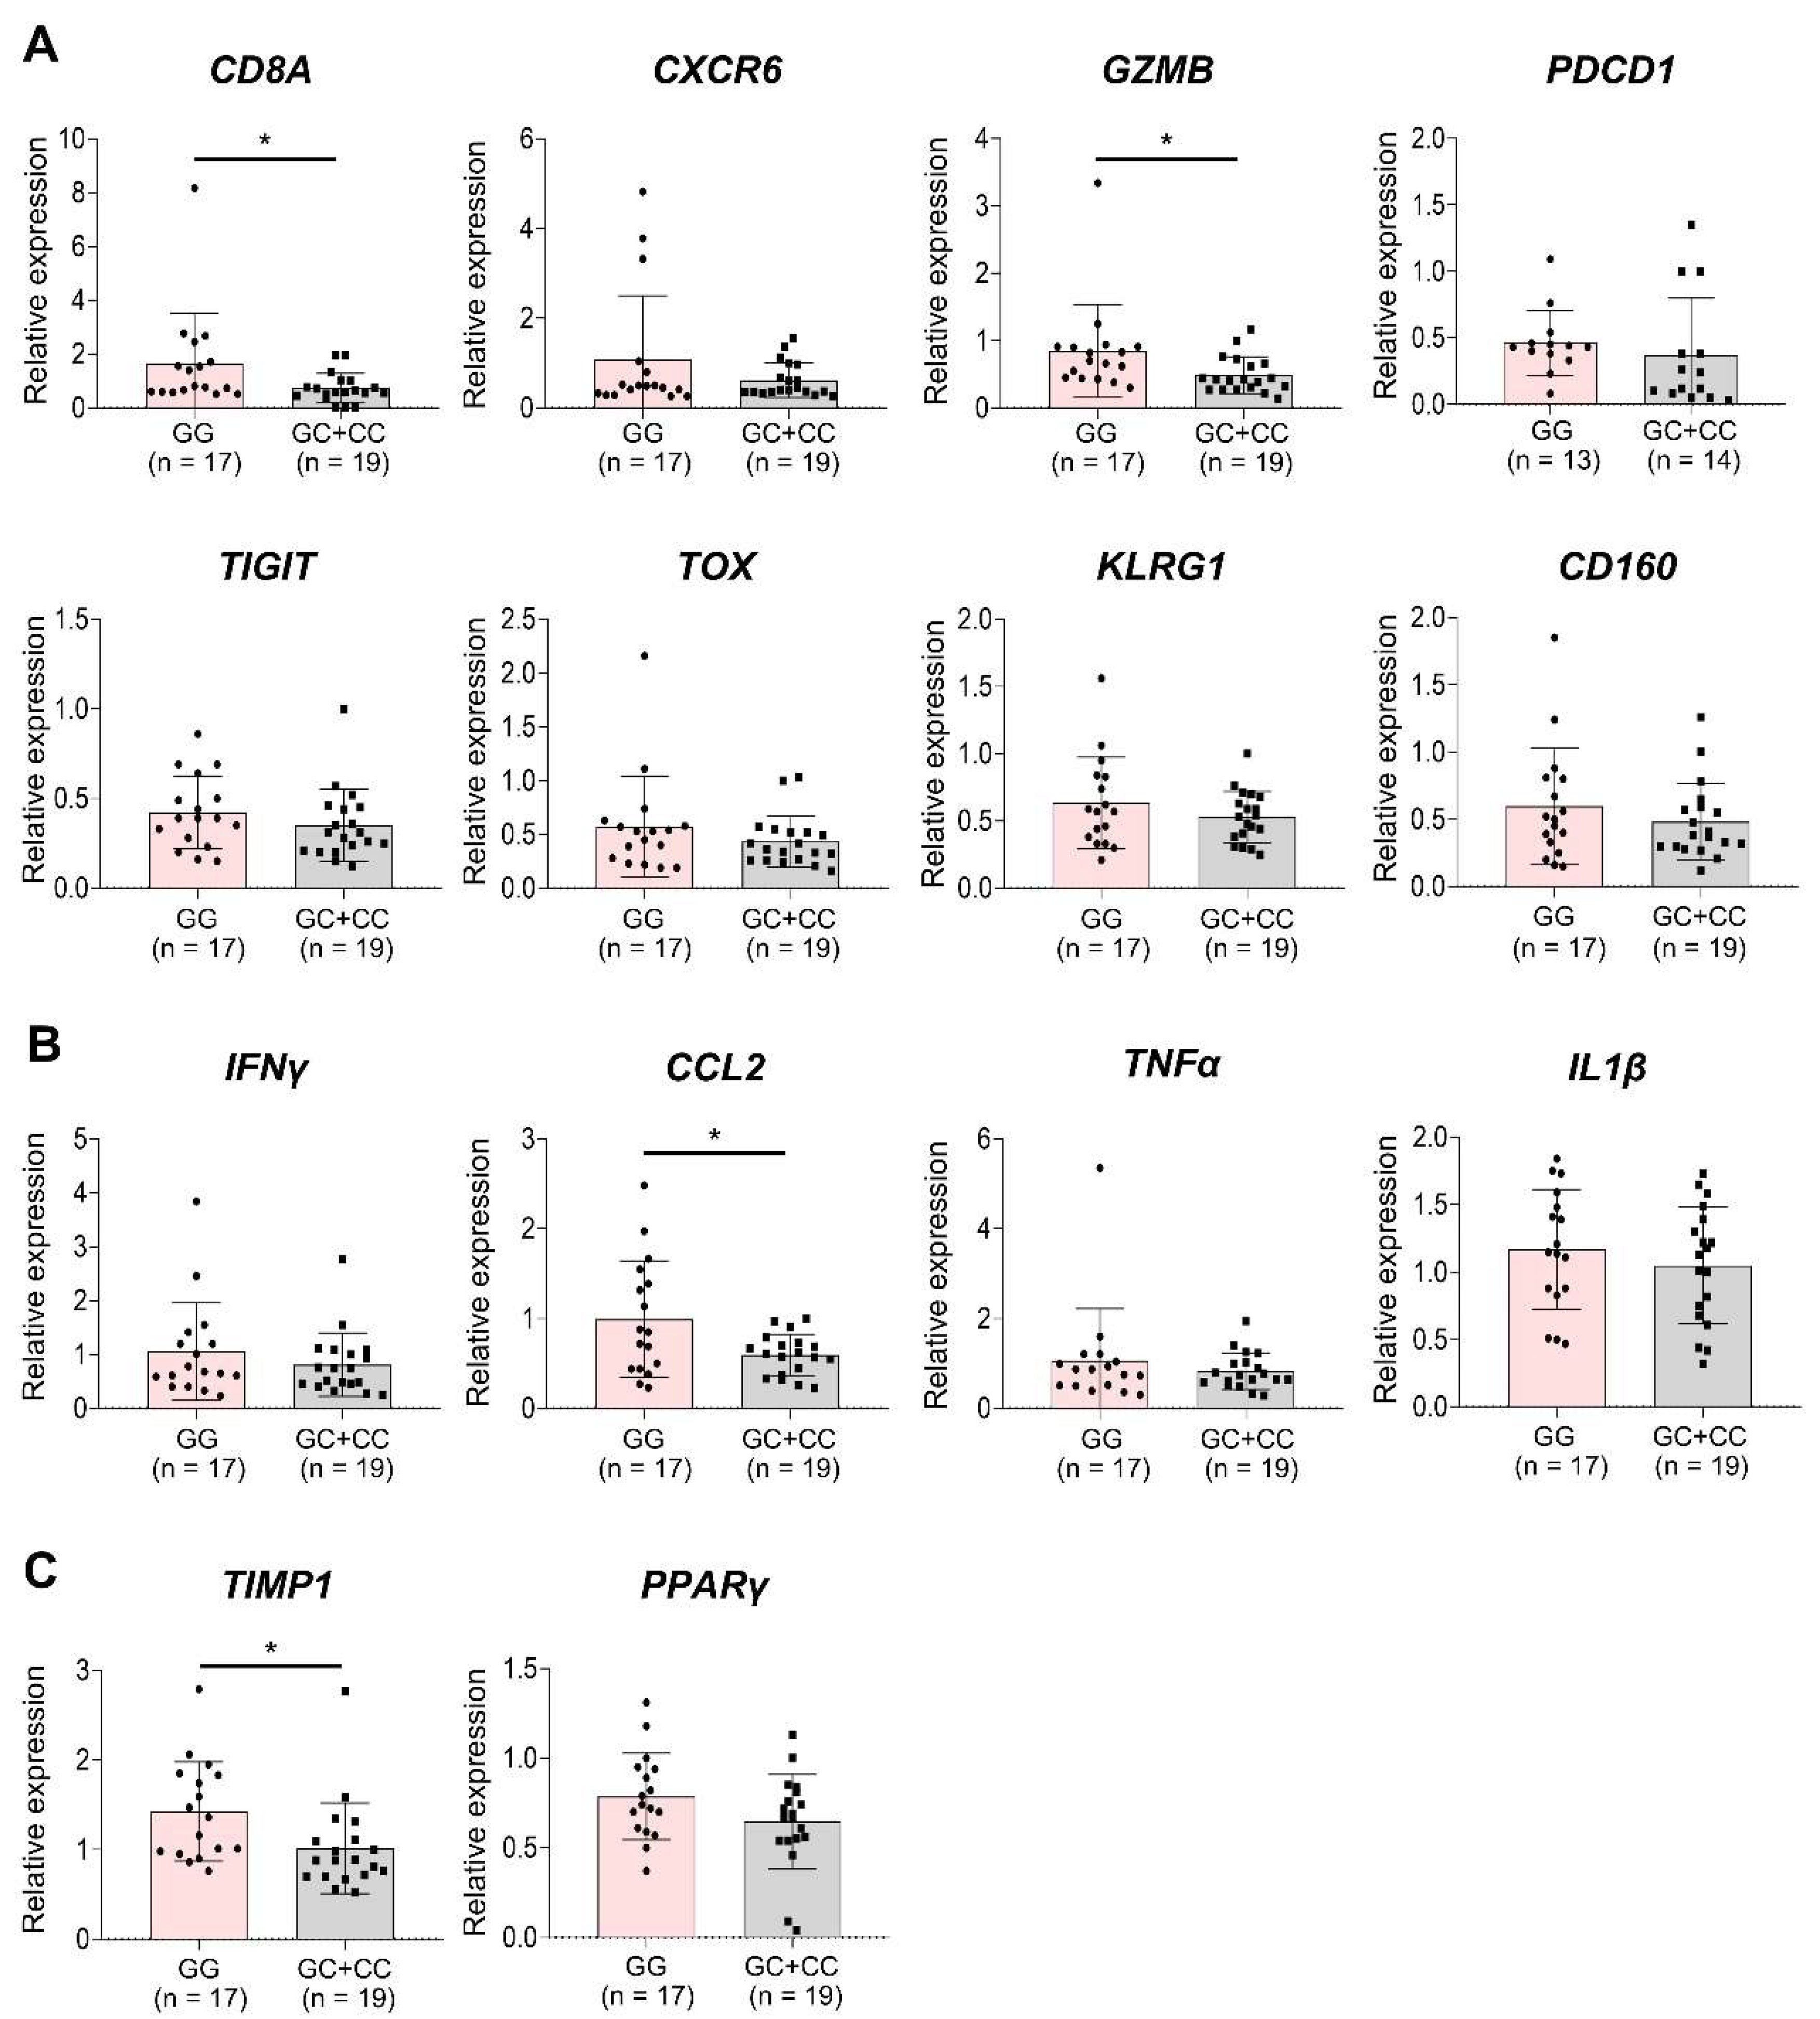
Figure 4.
Correlation matrix of variables associated with liver inflammation or fibrosis. Numbers indicate. the r value between two variables. *p < 0.05, **p < 0.01, and ***p < 0.001.
Figure 4.
Correlation matrix of variables associated with liver inflammation or fibrosis. Numbers indicate. the r value between two variables. *p < 0.05, **p < 0.01, and ***p < 0.001.
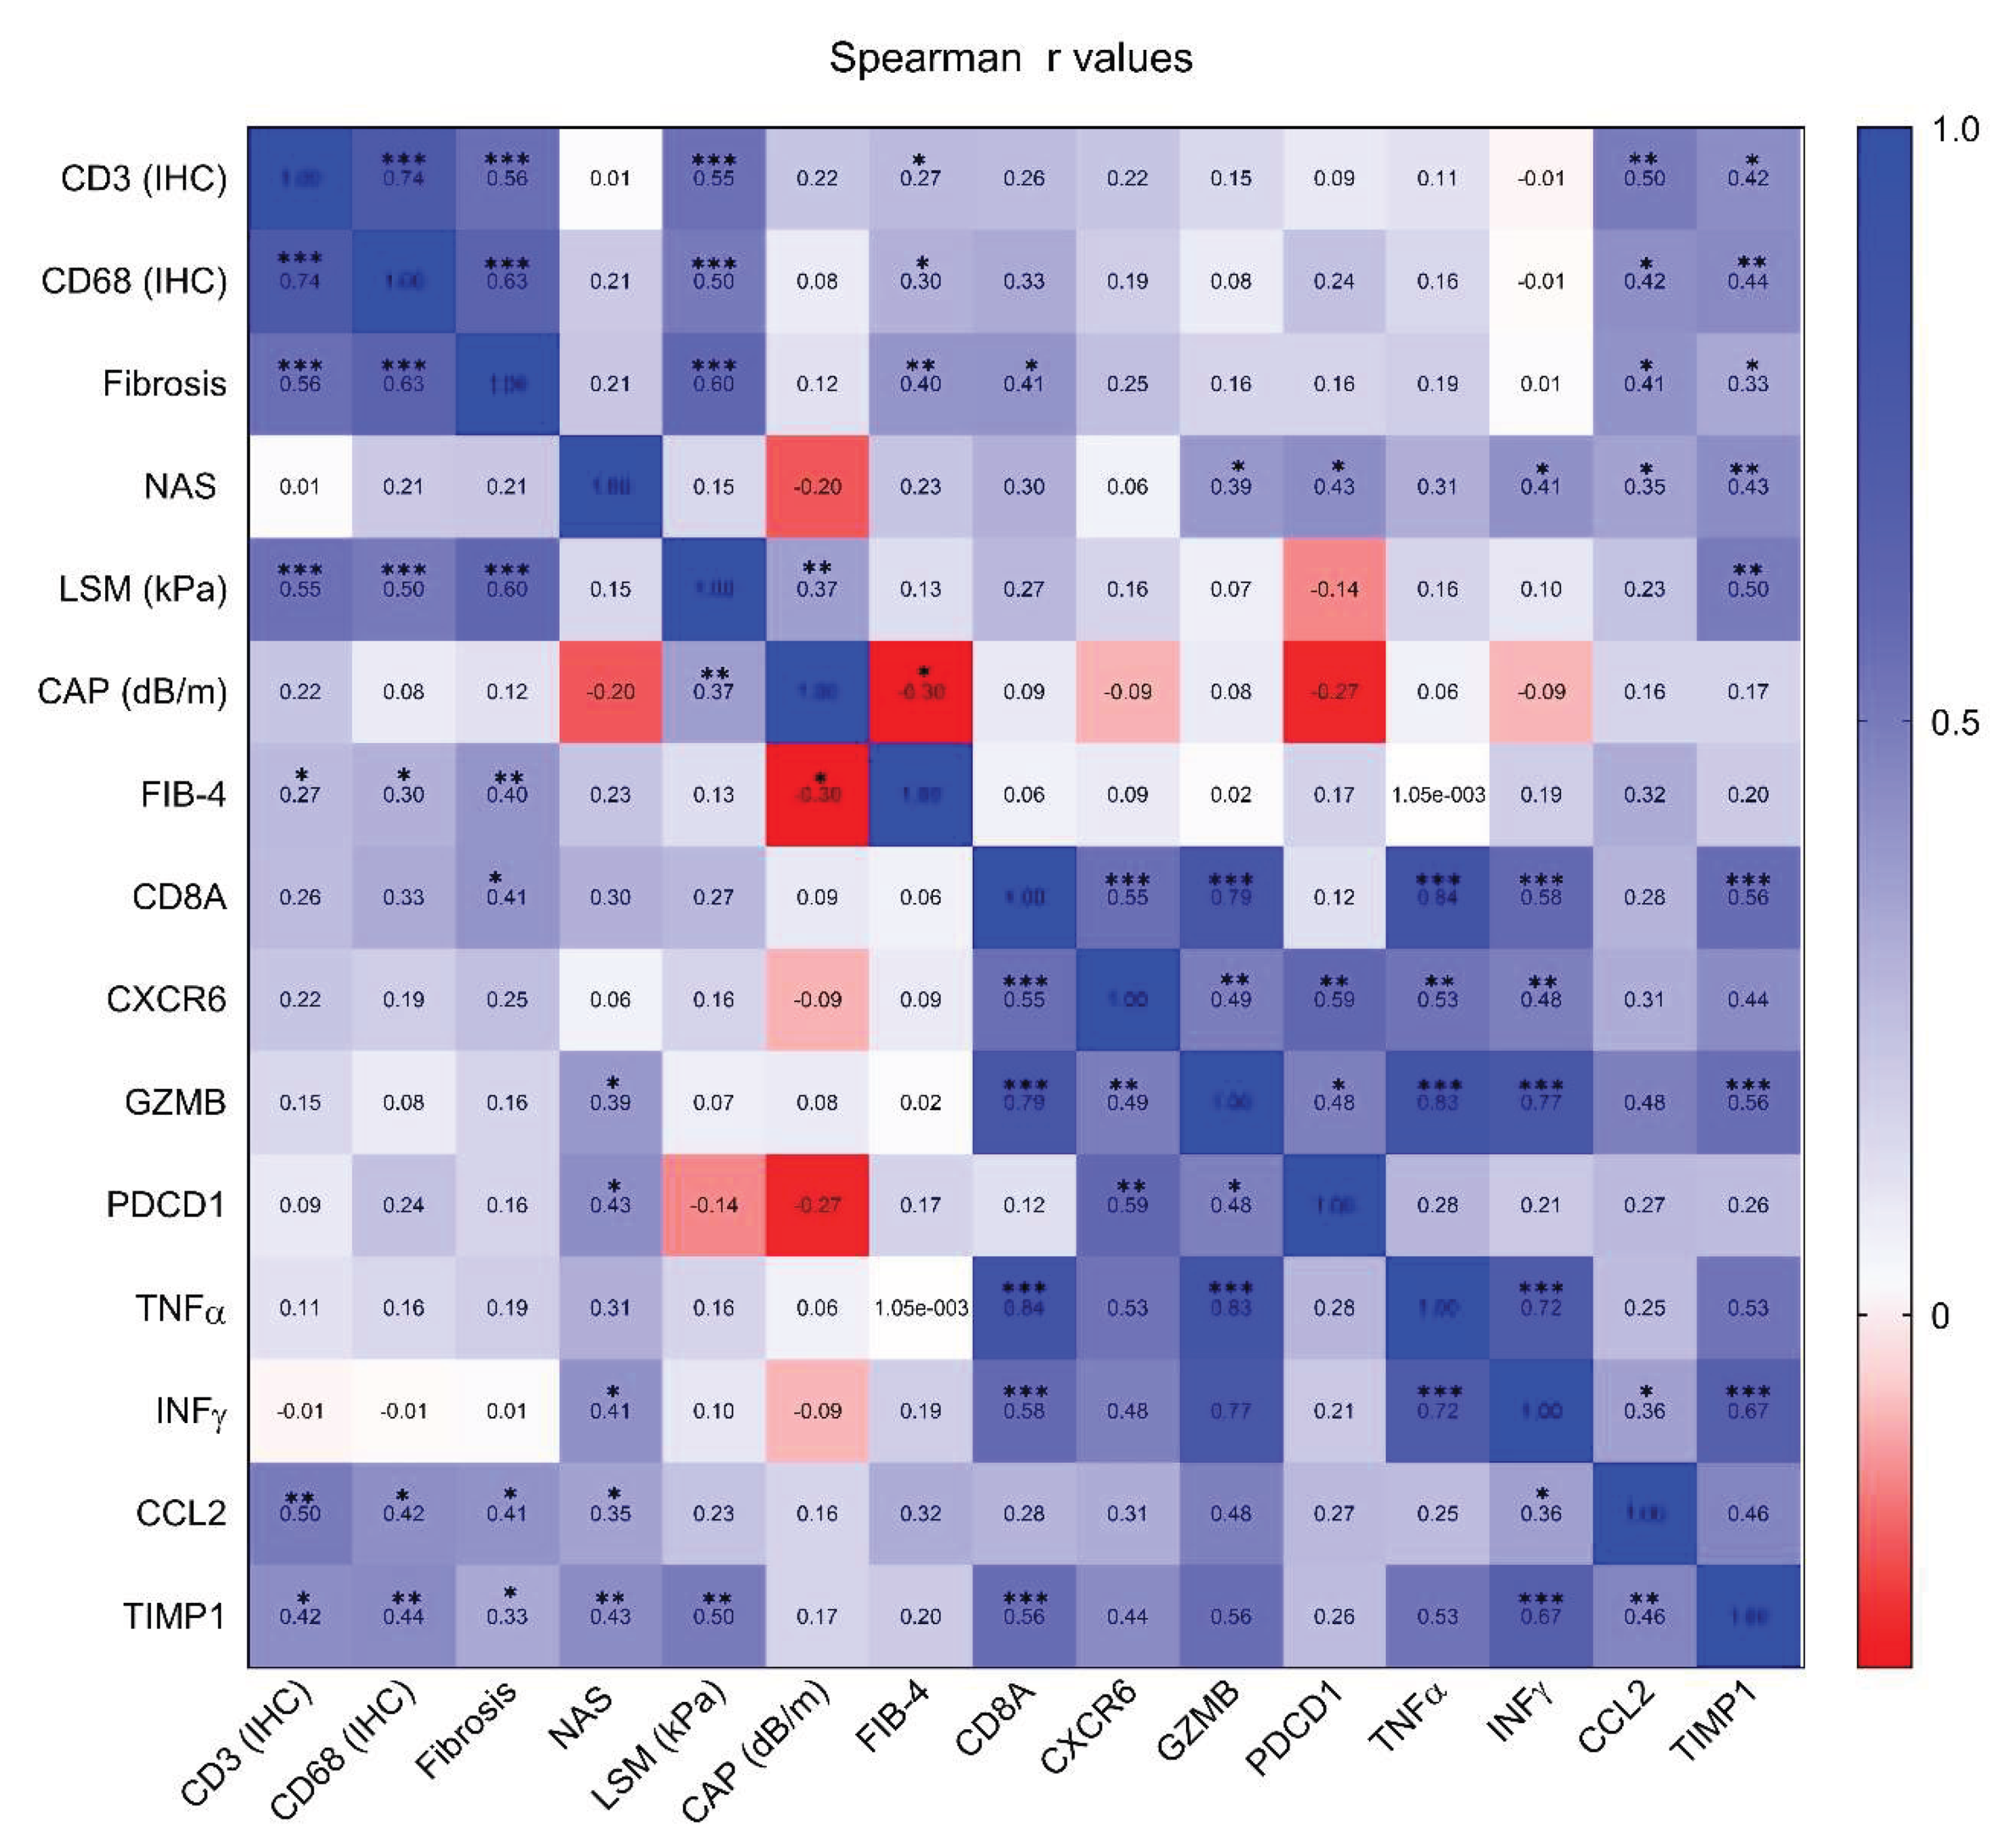

Table 1.
Demographic and Clinical Characteristics.
| Total (n = 70) |
PNPLA3 GG (n = 34) |
PNPLA3 GC+CC (n = 36) |
P | |
|---|---|---|---|---|
| Male sex | 36 (51.4) | 15 (44.1) | 21 (58.3) | 0.342 |
| Age | 51.3±17.4 | 53.4±15.1 | 49.3±19.2 | 0.323 |
| BMI (Kg/m2) | 28.3±6.0 | 28.0±6.5 | 28.5±5.5 | 0.743 |
| HTN | 28 (40.0) | 16 (47.1) | 12 (33.3) | 0.354 |
| DM | 31 (44.3) | 16 (47.1) | 15 (41.7) | 0.831 |
| WBC (109/L) | 7.3±2.4 | 6.6±2.2 | 7.9±2.4 | 0.025 |
| Hb (g/dL) | 14.2±1.9 | 13.9±1.9 | 14.4±2.0 | 0.372 |
| PLT (103/µL) | 236.2±80.7 | 219.4±80.7 | 252.1±78.6 | 0.090 |
| PT (INR) | 1.1±0.1 | 1.1±0.1 | 1.0±0.1 | 0.055 |
| Albumin (g/dL) | 4.4±0.4 | 4.3±0.4 | 4.5±0.4 | 0.020 |
| TB (mg/dL) | 0.8±0.5 | 0.9±0.6 | 0.8±0.4 | 0.310 |
| AST (IU/L) | 65.1±38.6 | 64.3±41.3 | 65.9±36.4 | 0.864 |
| ALT (IU/L) | 105.0±155.9 | 82.0±73.6 | 126.8±204.5 | 0.232 |
| GGT (U/L) | 93.4±93.2 | 85.4±69.3 | 101.0±111.8 | 0.486 |
| Triglycerides (mg/dL) | 161.3±117.8 | 140.0±71.3 | 182.0±148.2 | 0.140 |
| Total Cholesterol (mg/dL) | 186.7±43.3 | 178.4±38.7 | 194.8±46.5 | 0.116 |
| LDL-C (mg/dL) | 110.9±38.0 | 106.7±36.9 | 115.1±39.1 | 0.364 |
| HDL-C (mg/dL) | 47.1±11.4 | 47.2±11.6 | 47.0±11.3 | 0.932 |
| NAS ≥ 5 | 16 (22.9) | 9 (26.5) | 7 (19.4) | 0.678 |
| Fibrosis stage | 0.025 | |||
| F0 | 9 (12.9) | 2 (5.9) | 7 (19.4) | |
| F1 | 25 (35.7) | 13 (38.2) | 12 (33.3) | |
| F2 | 13 (18.6) | 4 (11.8) | 9 (25.0) | |
| F3 | 13 (18.6) | 6 (17.6) | 7 (19.4) | |
| F4 | 10 (14.3) | 9 (26.5) | 1 (2.8) | |
| CAP (dB/m) | 299.5±37.6 | 306.3±38.6 | 294.1±36.4 | 0.228 |
| LSM (kPa) | 11.2±6.4 | 12.7±7.8 | 10.0±4.9 | 0.115 |
Data are presented as n (%) or mean ± SD. Abbreviations: ALT, alanine aminotransferase; AST, aspartate aminotransferase; BMI, body mass index; CAP, controlled attenuation parameter; DM, diabetes mellitus, GGT, gamma-glutamyl transpeptidase; Hb, hemoglobin; HDL-C, high-density lipoprotein cholesterol; HTN, hypertension; INR, international normalized ratio; LDL-C, low-density lipoprotein cholesterol; LSM, liver stiffness measurement; PLT, platelet; PT, prothrombin time; TB, total bilirubin; WBC, white blood cell.
Disclaimer/Publisher’s Note: The statements, opinions and data contained in all publications are solely those of the individual author(s) and contributor(s) and not of MDPI and/or the editor(s). MDPI and/or the editor(s) disclaim responsibility for any injury to people or property resulting from any ideas, methods, instructions or products referred to in the content. |
© 2025 by the authors. Licensee MDPI, Basel, Switzerland. This article is an open access article distributed under the terms and conditions of the Creative Commons Attribution (CC BY) license (http://creativecommons.org/licenses/by/4.0/).
Copyright: This open access article is published under a Creative Commons CC BY 4.0 license, which permit the free download, distribution, and reuse, provided that the author and preprint are cited in any reuse.


