
Submitted:
24 December 2024
Posted:
25 December 2024
You are already at the latest version
Abstract
Anaerobic digestion (AD) offers a promising pathway for converting animal waste into biogas, improving waste management practices and generating renewable energy. However, the lignocellulosic structure of animal manure, particularly in dairy and cattle manure, hinders digestion efficiency and limits biogas yield. This study investigates the application of ball milling as a pretreatment strategy to enhance the anaerobic digestion of dairy manure. By reducing particle size and disrupting lignocellulosic structures, ball milling increases the bioavailability of organic matter, thus promoting microbial conversion and boosting biogas production. Experimental results reveal that 1-hour ball mill pretreatment increases biogas and biomethane production by 20% compared to untreated manure, achieving the same yield as digestion with 0.5% activated carbon addition. Furthermore, microbial community analysis indicates that anaerobic microbes remain largely unaffected by ball milling pretreatment, unlike the changes observed with activated carbon addition. These findings suggest that ball milling is a practical, adaptable, and scalable pretreatment method to enhance the anaerobic digestion efficiency of dairy manure. It offers a sustainable solution for improved manure management and biogas production.
Keywords:
Ball milling pretreatment
; Dairy manure
; Anaerobic digestion
; Biogas production
; Microbial communities
1. Introduction
Approximately 53% of methane emissions from manure were attributed to dairy manure, according to the U.S. Environmental Protection Agency (USEPA) [1]. By 2023, the U.S. dairy herd, consisting of approximately 9.4 million cows, was estimated to produce 225 million gallons of manure daily, amounting to roughly 82 billion gallons annually. It is worth noting that small- and medium-sized dairy operations (less than 1,000 cows) comprised approximately 45% of all national dairy operations [2]. Anaerobic digestion (AD) of agricultural residues, such as manure, is a reliable and environmentally friendly method for biogas production, contributing to a carbon-neutral energy supply [3]. In addition to generating renewable energy, AD reduces emissions from manure storage, including odor, NH3, N2O and CH4 emissions [4]. Manure management, especially by AD treatment, is one of the primary contributions to environmental impacts, particularly through greenhouse gas emissions (GHG) and nutrient contamination of water resources [5]. Compared to other types of waste, dairy manure has lower bioavailability due to its high content of undigested fibers and other inorganic compounds from the cow’s digestive system [6]. This poses efficiency challenges for AD of dairy manure, as it often results in lower biogas production.
The lignocellulosic composition of untreated dairy manure consists of 14.2-32.3% cellulose, 12.2-24.4% hemicellulose, and 6.1-14.4% lignin [7], with these three biopolymers tightly bound within the lignocellulosic complex [8]. Pretreatments prior to anaerobic digestion are commonly employed to decrease the recalcitrance of the lignocellulosic structure in manure. Briefly, pretreatment aims to free the lignin fraction through breaking the covalent bonds between cellulose and hemicellulose, as well as to convert crystalline cellulose into more accessible cellulose [9]. Currently, different physical, thermal, chemical, thermochemical, and biological pretreatments are being used for anaerobic digestion of untreated and/or treated manure [10]. These studies have reported methane yield improvements ranging from 10% to 180% [10,11,12,13,14,15]. However, the use of corrosive chemicals, the demand for high-quality thermal energy, and then requirement for high-temperature conditions limit the practicality of these methods for on-farm applications, especially for small and medium-sized operations. Developing a feasible pretreatment method for dairy manure, with low costs and simple operation, remains a critical area of investigation.
Ball milling is a frequently used pretreatment technique for reducing the biomass particle size, with a final particle size of 0.2-2 mm [16]. Some of the major advantages offered by this process are (1) reduction in cellulose crystallinity, (2) improvement in the available surface, (3) reduction in the extent of cellulose polymerization, and (4) improvement in the mass transfer due to particle size reduction [17]. In this study, a one-pot ball mill pretreatment is applied to dairy manure to evaluate its effects on biogas production and microbial communities during anaerobic digestion. For comparison, activated carbon, a common additive in anaerobic digestion, is also utilized.
2. Materials and Methods
2.1. Feedstock-Dairy Manure and Activated Carbon
Dairy manure was collected from the Dairy Cattle Teaching and Research Center at Michigan State University (MSU). The cows were fed a total mixed ration (TRM) consisting of forages (primarily alfalfa haylage and corn silage, with some baled alfalfa hay), and grains (high moisture shelled corn, dry shelled corn and soybean meal). A single batch of manure was collected in July 2023 for this study. A portion of the collected manure was used for ball mill treatment tests, while the remainder was stored at -20 ℃ for later use as a substrate. The fresh collected dairy manure was immediately analyzed for its total solids (TS) and volatile solids (VS) content (%), C/N ratios, total nitrogen (TN), ammonia nitrogen (NH3-N), chemical oxygen demand (COD), and soluble COD (SCOD) (Table 1). Activated carbon (100 mesh size) was purchased from Aldrich Chem, Co., and dried at 105 ℃ for 24 hours prior to use. The activated carbon has a surface area of up to 1,056 m2/g TS (Table 1)
2.2. One-Pot Ball Mill Pretreatment
The pretreatment of fresh dairy manure was carried out in a bench-scale 2 L stirred one-pot ball mill reactor (JM-2L, Tianchuang Powder Tech Co., Ltd., Changsha, China). The ball-to-biomass ratio was set at 3:1. The diameter of agate balls was 4mm. For each batch, 600g of raw dairy manure was mixed with 60 g of deionized (DI) water (10% by weight) and stirred thoroughly with the balls for 1 hour at 300 rpm. Approximately 20% of the vessel volume was left unfilled to allow for adequate movement of the milling balls. After treatment, the processed dairy manure was adjusted to a TS of 5% using DI water, to match the TS level of the raw manure used as feedstock for the semi-continuous anaerobic digestion process. No enzyme or pH adjustment buffers used during the pretreatment.
2.3. Semi-Continuous Anaerobic Digestion of Dairy Manure
The semi-continuous anaerobic digestion was conducted in 750 mL reactors (Wheaton bottles) with a headspace of 250 mL, and a 500 mL effective volume. The initial anaerobic inoculum was obtained from the South Campus Anaerobic Digester (SCAD) at MSU. The key characteristics of the SCAD inoculum were as follows: pH of 7.98±0.04, TS of 3.33±0.02%, VS of 2.35±0.01%, COD of 37,480±3,762 mg/L, SCOD of 8,375±2,086 mg/L, TN of 2,750±183 mg/L, and NH3-N of 1,114±285 mg/L. The reactors were fed in an anaerobic chamber, following a hydraulic retention time (HRT) of 20 days, and operated for a total of four HRTs. Each reactor received 50 mL of either raw dairy manure (RM) or ball mill-treated manure (TM) every other day, with or without the addition of 0.25 g of activated carbon (AC) (0.5%, weight-to-volume). The experimental design is outlined in Table 2. The RM-Ctrl group served as the “pure control”, while RM-AC, and TM represented the AC-added only and ball mill-treated only groups, respectively. TM-AC was the group treated with both AC addition and ball milling. All experimental reactors were conducted in duplicate. The reactors were maintained at 35 ℃ with continuous mixing (130 rpm) using incubation shakers (Innova 2000, New Brunswick Scientific, Edison, NJ). Daily biogas production was measured by water displacement, and biogas samples were periodically collected for gas composition analysis. Feeding and sampling were performed in an anaerobic chamber purged with nitrogen gas (Simplicity 888 automatic, PLAS Lab, Lansing, MI).
2.4. Physical and Chemical Analysis
TS and VS were analyzed following standard APHA methods [18]. TN and NH3-N were determined using Hach test kits (HACH, Loveland, CO), approved by the U.S. Environmental Protection Agency (USEPA). COD concentrations were not measured in the reactors containing PCMs due to significant interference with the measurements. However, the SCOD was determined by centrifuging the samples at 6,000 rpm for 10 minutes, after which the supernatant was used for testing. Methane (CH4), hydrogen sulfide (H2S), and carbon dioxide (CO2) concentrations in the biogas were measured using gas chromatography (SRI 8610C, SRI Instruments, Torrance, CA) equipped with a thermal conductivity detector (TCD). The analyses were conducted with both the column and detector temperature set at 150 ℃. Elemental analysis (C, N, and S) of the feedstocks was conducted by Atlantic Micro Labs (Norcross, GA). The surface area of activated carbon was measured using the Brunauer-Emmett-Teller isotherm technique using a surface analyzer (Gemini V, Micromeritics Instrument Crop. Norcross, GA).
2.5. Microbial Community Analysis
Digestate samples were collected from semi-continuous AD reactors for microbial community analysis. Genomic DNA was extracted from the samples using the PowerLyzer PowerSoil DNA Isolation Kit (MO BIO Laboratories Inc., Carlsbad, CA). Polymerase chain reactions (PCRs) were performed to amplify the DNA using universal primers: the forward primer Pro 341 F (5′-CCTACGGGNBGCASCAG-3′) and the reverse primer Pro 805 R (3′-GACTACNVGGGTATCTAATCC-5′), targeting the 16S rRNA gene in the V3-V4 region (341-806) [19]. A 25 µL reaction solution containing 12.5 µL of GoTaq Green Master Mix (Promega, Madison, WI), 0.5 µL of forward primer, 0.5 µL of reverse primer, 1µL of extracted DNA, and 10.5 µL of DNase- and RNase-free water was used for PCR. The amplification was carried out in an Eppendorf Mastercycler Pro Thermal Cycler (Eppendorf AG, Hamburg, Germany), starting with an initial denaturing step at 96 ℃ for 2 minutes, followed by 30 cycles of touchdown steps: denaturing at 95 ℃ for 20 seconds, annealing at 52 ℃ for 30 seconds, and elongation at 72 ℃ for 60 seconds, with a final extension at 72 ℃ for 10 minutes. PCR products were normalized to a concentration of 5-10 ng/mL [20].
DNA samples were sequenced on an Illumina MiSeq flow cell (v2) using a 500-cycle reagent kit (2 × 250 bp paired-end reads) at the Genomics Research Technology Support Facility at MSU. Base calling was performed using Illumina Real-Time Analysis (RTA) v1.18.54, and the output was de-multiplexed and converted to FASTQ format using Illumina Bcl2fastq v1.8.4. The resulting Fastq files were analyzed using Qiime2, a microbiome bioinformatics platform, to generate taxonomic and phylogenetic data for statistical analysis. Sequence quality control and feature table construction were performed using the Deblur method. Taxonomic analysis was conducted using a pre-trained classifier clustered at 99% sequence similarity based on the Greengenes reference database (Greengenes 13_8 99% OTUs) [20].
2.6. Statistical Analysis
The statistical analysis was performed using R (Version 4.3.1). The R packages Vegan, phyloseq, MASS, and ggplot2 were utilized to analyze the taxonomic and phylogenetic data (taxonomy and gene frequency) from Qiime2. These analyses estimated the diversity index (Shannon’s H), community evenness (Pielou’s J), and rarefaction curves for individual samples. Sampling coverage (C) was calculated using Good’s method. Beta diversity (β) analysis was conducted, which included both abundance analysis and the generation of abundance plots.
3. Results
3.1. Performance of Semi-Continuous AD of Dairy Manure
3.1.1. Biogas Production and Methane Percentages
The daily and cumulative biogas production, along with the measured methane content in the biogas for the four reactors throughout the entire AD process, are shown in Figure 1. The cumulative biogas production for the RM-Ctrl group (raw manure only) was 21,858 mL. In comparison, the RM-AC group produced 26,647 mL, representing a 21.91% increase. The TM and TM-AC groups achieved cumulative biogas productions of 26,911 mL and 26,356 mL, reflecting increases of 23.12% and 20.58%, respectively. (Figure 1b). The RM-Ctrl group produced significantly less biogas than the other three groups (p<0.001), while no significant differences were observed among the remaining three groups. The overall methane content in the biogas across all four HRTs did not differ significantly among the groups (Figure 1c). Specifically, the average methane contents during the second HRT (day25, 30, and 40 data) were 60.44%, 58.11%, 62.59%, and 61.12% for the RM-Ctrl, RM-AC, TM, and TM-AC groups, respectively. These values showed significant differences between groups (p<0.001) according to ANOVA analysis (data not shown). The ball mill-treated group (TM) achieved an average methane content of 60.08%, which was significantly higher than that AC-added only group (RM-AC) at 58.19% (p<0.001). These results indicate that ball mill treatment has different influences on biogas and methane production from activated carbon addition. The ball milling treatment can enhance methane production, while activated carbon can improve biogas production.
3.1.2. Biochemical Characteristics of Digestates
The main biochemical characteristics, including pH, VS, SCOD, TN, and NH3-N for the digestate at each HRT (days 20, 40, 60, and 80) across the four groups are summarized in Table 3. The average pH values were 7.53, 7.54, 7.52, and 7.49 for the RM-Ctrl, RM-AC, TM, and TM-AC groups, respectively, with no significant differences observed between the groups. The VS results followed a similar trend, starting at 2.33% for RM-Ctrl, 2.36% for RM-AC, 2.35% for TM, and 2.36% for TM-AC at the beginning of AD (day 2) (data not shown). By the end of the third HRT (day 60), VS had decreased to 1.71%, 2.29%, and 2.14% for RM-Ctrl, RM-AC, and TM, respectively, while it increased to 2.56% for the TM-AC group. VS value increased across all four groups by the final HRT (day 80) (Table 3). Significant differences in VS data were observed between all group pairs, except for RM-AC and TM, which showed no significant difference (p=0.72). SCOD followed a similar trend to VS. In the RM-Ctrl group, the SCOD of the digestate remained stable, increasing slightly from 4,935 mg/L (day 2) to 5,075 mg/L (day 60). In contrast, SCOD decreased from 4,878 to 3,755 mg/L, 4,830 to 4,755 mg/L, and 4,870 to 3,883 mg/L for the RM-AC, TM, and TM-AC groups, respectively, over the same period (day 2 to day 60). However, by the final HRT (day 80), SCOD increased to 7,725, 6,425, 6,400, and 6,325 mg/L for the RM-Ctrl, RM-AC, TM, and TM-AC groups, respectively (Table 3). The RM-AC group had a significantly lower SCOD compared to RM-Ctrl (p<0.01), and the TM-AC group also showed a significantly lower SCOD than TM (p<0.05). No significant differences were observed between RM-Ctrl and TM groups, or between RM-AC and TM-AC groups. The concentrations of TN, and NH3-N in the digestate were measured to assess nitrogen transformation during the AD process, and the results are summarized in Table 3. At the beginning of digestion (day2), the TN concentrations were 2,703, 2,600, 2,448, and 2,405 mg/L for the RM-Ctrl, RM-AC, TM, and TM-AC groups, respectively (data not shown). The ball mill-treated groups (TM, and TM-AC) exhibited lower TN concentrations compared to the groups using raw manure. By the end of digestion (day 80), TN concentrations had decreased to 1,578, 1,890, 1,638, and 1,458 mg/L for the RM-Ctrl, RM-AC, TM, and TM-AC groups, respectively, corresponding to reduction rates of 41.63%, 27.31%, 33.09%, and 39.40%. NH3-N accumulation was observed only during the first HRT for all groups, with concentrations increasing from 883, 895, 903, and 893 mg/L (day 2) to 1,120, 1,103, 1,250, 1,198 mg/L (day 20) for the RM-Ctrl, RM-AC, TM, and TM-AC groups, respectively (Table 3). NH3-N levels then remained stable (1,000–1,110 mg/L) in the raw manure groups (RM-Ctrl and RM-AC), while decreased in the ball mill-treated groups (TM and TM-AC). Consequently, the NH3-N concentrations in the ball mill-treated manure groups were significantly lower than those in the raw manure groups (p<0.05).
3.2. Microbial Communities Analysis
3.2.1. The Amplicon Sequencing Results
Amplicon sequencing results showed that 16S rRNA gene sequences in each sample ranged from 24,509 to 181,024 reads (Figure 2a). The number of sequenced microbial species stabilized after sampling 20,000 sequences for all samples (data not shown). Good’s coverage (C) was above 99% for all samples (Figure 2c), indicating a high species sampling coverage within the microbial communities. The number observed taxonomy ranged from 71 to 168 (Figure 2b) with average values of 119, 130, 105, and 106 for the RM-Ctrl, RM-AC, TM, and TM-AC groups, respectively. Groups with activated carbon-addition showed a higher number of observed OTUs compared to their corresponding control groups for both raw and treated manure. Meanwhile, the two ball mill-treated manure groups (TM and TM-AC) had lower observed OTUs compared to the raw manure groups (RM-Ctrl and RM-AC) (Figure 2b). However, these differences were not statistically significant (p>0.05).
3.2.2. Microbial Diversity
The microbial diversity between groups was investigated using the Shannon, Simpson, and Chao1 indices. The Shannon index (H) is applied to assess the richness of community, while the Simpson index (D) emphasizes the abundance of dominant species. The average Shannon index of the microbial communities was 3.314, 3.418, 3.218, and 3.338 for the RM-Ctrl, RM-AC, TM, and TM-AC groups, respectively. Statistical differences were not observed between most groups, except for the TM-AC group, which showed a significantly higher Shannon index compared to the TM group (p<0.05) (Figure 3a). The average Simpson index values for the RM-Ctrl, RM-AC, TM, and TM-AC groups were 0.934, 0.939, 0.920, and 0.928, respectively. Both the TM and TM-AC groups had significantly lower Simpson index values compared to their respective RM-Ctrl and RM-AC groups (p<0.05) (Figure 3b). Overall, the ball mill-treated manure groups exhibited significantly lower Simpson index values compared to the corresponding raw manure groups, regardless of whether activated carbon was added. The lower Simpson index suggests that ball mill pretreatment shifts the AD microbial community toward less diverse but potentially more efficient populations specialized in utilizing the pretreated manure. The Chao1 index, a richness-focused metric that estimates the total number of species, had average values of 64.75, 69.13, 62.38, and 66.75 for the RM-Ctrl, RM-AC, TM, and TM-AC groups, respectively, with no significant differences observed between groups (Figure 3c). Principal component analysis (PCA) was conducted to assess beta diversity and visualize differences in microbial community composition among the four groups (Figure 3d). The first principal component (PC1) explained 48.41% of the total variance, while the second principal component (PC2) accounted for 21.6%, with both components together capturing 70.01% of the variation in microbial community structure. The PCA plot reveals a clear separation between the raw manure groups (RM-Ctrl, RM-AC) and the ball mill-treated groups (TM, TM-AC), suggesting that ball mill treatment led to shifts in microbial composition (Figure 3d).
3.2.3. Microbial Abundance
The relative abundance of microbial communities across the four groups at the domain, phylum, and genus levels is presented in Figure 4. The average archaea abundance was 30.36%, 29.15%, 33.06%, and 32.01%, with corresponding bacteria abundances of 69.64%, 70.85%, 66.94%, and 67.99% for the RM-Ctrl, RM-AC, TM, and TM-AC groups, respectively (Figure 4a). The ball mill-treated manure groups exhibited a higher abundance of archaea compared to the raw manure groups, with the TM group showing the highest archaea abundance at 33.06%. However, there were no significant differences in either bacterial or archaea abundance between groups, indicating that ball mill pretreatment does not substantially alter the anaerobic microbial community composition. Firmicutes (25.95-37.74%), and Bacteroidetes (14.75-22.85%) were the most abundant bacterial phyla in all samples, which accounted for over 75% of the total bacterial 16 S rRNA gene sequences (Figure 4b). The Phyla Chloroflexi (3.80-7.04%) and Cloacimonadota (0.60-9.73%) were much less abundance in the AD reactors than the two bacterial Phyla Firmicutes and Bacteroidetes. Among archaea, Halobacterota (18.09-28.13%) and Euryarchaeota (3.54-9.81%) were the most abundant phyla, together representing more than 99% of the total archaeal 16 S rRNA gene sequences. The average Halobacterota phylum abundance was 22.35%, 21.90%, 27.25%, and 26.12% for the RM-Ctrl, RM-AC, TM, and TM-AC groups, respectively (Figure 4b). The TM group showed a significantly higher abundance of Halobacterota compared to the two raw manure groups (RM-Ctrl and RM-AC) (p<0.05). The addition of activated carbon did not affect the abundance of this phylum, as no significant differences were observed between the RM-Ctrl and RM-AC groups or between the TM and TM-AC groups.
Methanosaeta (14.08-23.50%) was the dominant archaeal genus within the Halobacterota phylum across all samples, with relative abundance of 17.27%, 16.95%, 21.64%, and 20.66% for the RM-Ctrl, RM-AC, TM, and TM-AC groups, respectively (Figure 4c). Ball milling pretreatment significantly increased the abundance of the Methanosaeta genus in the AD reactor (p<0.05), highlighting its primary role in acetolactic methanogenesis [21]. In contrast, the Methanobrevibacter genus showed significantly lower relative abundance in the TM (2.28%) and TM-AC (2.23%) groups compared to RM-Ctrl (4.55%) (p<0.05). The Methanobrevibacter genus belongs to the Euryarchaeota phylum, is commonly found in anaerobic environment, and plays a key role in hydrogenotrophic methanogenesis [22]. As previously mentioned, overall archaeal abundance did not differ significantly between groups, which might explain the stable methane content observed across all groups (Figure 1c). Additionally, 20.60-23.73% of the detected genera were classified as “unknown”, and 4.86-9.05% as “uncultured” across all samples, underscoring the complexity of the AD microbial community (Figure 4c).
4. Discussion
The 1-hour ball milling pretreatment (TM group) increased biogas production by 23.12%, surpassing the 21.92% enhancement achieved by the 0.5% activated carbon addition in the RM-AC group. The use of activated carbon to enhance the anaerobic digestion process and boost biogas production has been widely documented [23,24,25]. However, to our knowledge, this is the first report demonstrated that a one-pot, rapid ball milling pretreatment can achieve over a 20% increase in biogas production from dairy manure. Higher biogas production was observed during the initial phase of the AD process (first HRT) for the TM (7,458 mL) and TM-AC (7,558 mL) groups, compared to the RM-Ctrl group, which produced only 5,463 mL of biogas during the same period. Furthermore, the proportion of biogas produced during the first two HRTs relative to the total biogas production was 52.15%, 51.34%, 55.50%, and 56.63% for the RM-Ctrl, RM-AC, TM, and TM-AC groups, respectively. These results suggest that ball milling pretreatment accelerates carbon conversion, thereby enhancing biogas production. As discussed above, the complex lignocellulosic structure in dairy manure, derived from undigested plant materials, hinders the anaerobic digestion process and limits biogas production. The scanning electron microscope (SEM) results showed that the fibrous structure in the raw dairy manure was intact and enclosed (Figure 5a). However, after 1 hour of ball milling treatment, this structure was disrupted, displaying a porous and dispersed morphology (Figure 5b). Ball milling pretreatment reduces the particle size of manure and disrupts the lignocellulosic structure, thereby increasing the bioavailability of organic matter.
The TM group exhibited the highest average methane content and archaea abundance (Figs. 1c and 4a) among the four groups. These two parameters were positively correlated (r=0.65) in the Spearman correlation heatmap (Figure 6). However, no statistically significant differences were observed for either methane content or archaea abundance across the four groups. Although ball milling of dairy manure as a physical pretreatment method did not significantly impact the overall anaerobic microbial communities, some dynamic changes were noted in the abundance of specific phyla. As detailed in section 3.2.3, the TM group showed a significantly higher (p<0.05) abundance of the dominant archaeal phylum, Halobacterota (27.25%), compared to groups RM-Ctrl (22.35%), and RM-AC (21.90%). Similarly, the abundance of the dominant archaeal genus, Methanosaeta, within the Halobacterota phylum, also significantly increased (p<0.05) in the TM group compared to the raw manure groups. It was reported that Methanosaeta species are classical acetolactic methanogens that can convert acetate to methane [26,27]. Recent studies have shown that Methanosaeta species are also electro-active methanogens that can accept electrons from syntrophic partners through biological electrical connections (i.e., DIET) for the reduction of carbon dioxide to methane [28]. The electron transfer speed via DIET is 106 faster than that via interspecies hydrogen transfer (e.g., H2/format transfer), thus allowing faster substrate conversion [29]. However, no clear correlation was found between methane content and Methanosaeta abundance (r=-0.13, Figure 6) in this study, suggesting that methanogenesis is a complex process influenced by various methanogenic microorganisms. In contrast, the abundance of Methanobrevibacter, an archaeal genus within the Euryarchaeota phylum, showed a positive relationship with methane content (r= 0.51, Figure 6). The ball mill-treated manure groups (TM, TM-AC) showed a significantly lower abundance of this genus compared to the RM-Ctrl group. Additionally, the abundance of the Firmicutes phylum, which was the most dominant bacterial phylum across all samples, showed a significant positive correlation with methane content (r= 0.7, Figure 6). However, no significant differences were observed among the groups for the average Firmicutes phylum abundance, which were 35.68%, 33.13%, 32.84%, and 31.34% for the RM-Ctrl, RM-AC, TM, and TM-AC groups, respectively (Figure 4b). In summary, ball milling pretreatment of dairy manure does not negatively impact the anaerobic digestion microbial communities, particularly the methanogenic microorganisms. The Spearman correlation analysis also indicated that NH3-N concentration had a positive relationship with the abundances of both Firmicutes phylum (r= 0.77), and the Methanobrevibacter genus (r=0.67) (Figure 6). The RM-Ctrl group showed a higher abundance of both the Firmicutes phylum and Methanobrevibacter genus compared to the other three groups, which may explain the relatively higher NH3-N levels observed in this group, as discussed in section 3.1.2.
5. Conclusions
This study demonstrated that one-pot ball milling pretreatment can enhance the anaerobic digestion of dairy manure, achieving a 20% increase in biogas production. A 1-hour ball milling process effectively reduces the particle size of manure and disrupts its structure, thereby increasing the bioavailability of organic matter. Although the TM group showed significant effects on the Methanosaeta genus, and several other bacterial groups, which influence nitrogen metabolism of the microbial communities for ammonia production. Further studies are needed to explore this impact. These findings suggest that ball milling pretreatment can be a practical, adaptable, and scalable method to enhance the anaerobic digestion efficiency of dairy manure.
Author Contributions
Conceptualization, M.X. and W.L.; methodology, M.X., S.U.D., Y.L.; investigation, M.X..; data curation, M.X.; writing—original draft preparation, M.X.; writing—review and editing, S.U.D., Y.L., W.L.; visualization, M.X.; supervision, W.L.; project administration, W.L.; funding acquisition, W.L. All authors have read and agreed to the published version of the manuscript.
Funding
This research was supported by MSU AgBioResearch through faculty salary.
Data Availability Statement
The dataset used in this study is not publicly available. Researchers with requests should contact the corresponding author. We will provide support and additional information within reasonable boundaries.
Acknowledgments
The authors thank Michigan AgBioResearch for funding this work through faculty salaries. The authors also thank the Research Technology Supporting Facility (RTSF) of Michigan State University for their support on gene sequencing.
Conflicts of Interest
The authors declare no conflicts of interest.
Abbreviations
The following abbreviations are used in this manuscript:
| AD | Anaerobic digestion |
| GHG | Greenhouse gas |
| SCAD | South campus anaerobic digester |
| PCRs | Polymerase chain reactions |
| PCA | Principal component analysis |
| HRT | Hydraulic retention time |
| SEM | Scanning electron microscope |
References
- U.S. EPA. Inventory of U.S Greenhouse Gas Emissions and Sinks. EPA 430-R-21-005. Environmental Protection Agency 2021.
- Njuki, E. Economic Research Service Economic Research Report Number 305 Sources, Trends, and Drivers of U. S. Dairy Productivity and Efficiency. 2022.
- Scarlat N, Dallemand JF, Fahl F. Biogas: Developments and perspectives in Europe. Renew Energy 2018;129. [CrossRef]
- Clemens J, Trimborn M, Weiland P, Amon B. Mitigation of greenhouse gas emissions by anaerobic digestion of cattle slurry. Agric Ecosyst Environ, vol. 112, 2006. [CrossRef]
- Glover CJ, McDonnell A, Rollins KS, Hiibel SR, Cornejo PK. Assessing the environmental impact of resource recovery from dairy manure. J Environ Manage 2023;330. [CrossRef]
- 2015-17 Biennium Technology Research and Extension Related to Anaerobic Digestion of Dairy Manure. n.d.
- Chen S, Liao W, C L, Wen Z, Kincaid RL, Harrison JH, et al. Value-Added Chemicals from Animal Manure. Pacific Northwest National Laboratory 2003;PNNL-14495.
- Isikgor FH, Becer CR. Lignocellulosic biomass: a sustainable platform for the production of bio-based chemicals and polymers. Polym Chem 2015;6. [CrossRef]
- Gao J, Chen L, Yuan K, Huang H, Yan Z. Ionic liquid pretreatment to enhance the anaerobic digestion of lignocellulosic biomass. Bioresour Technol 2013;150. [CrossRef]
- Usman Khan M, Kiaer Ahring B. Improving the biogas yield of manure: Effect of pretreatment on anaerobic digestion of the recalcitrant fraction of manure. Bioresour Technol 2021;321. [CrossRef]
- Jurado E, Skiadas I V., Gavala HN. Enhanced methane productivity from manure fibers by aqueous ammonia soaking pretreatment. Appl Energy 2013;109. [CrossRef]
- Bruni E, Jensen AP, Angelidaki I. Steam treatment of digested biofibers for increasing biogas production. Bioresour Technol 2010;101. [CrossRef]
- Tsapekos P, Kougias PG, Frison A, Raga R, Angelidaki I. Improving methane production from digested manure biofibers by mechanical and thermal alkaline pretreatment. Bioresour Technol 2016;216. [CrossRef]
- Biswas R, Ahring BK, Uellendahl H. Improving biogas yields using an innovative concept for conversion of the fiber fraction of manure. Water Science and Technology 2012;66. [CrossRef]
- Angelidaki I, Ahring BK. Methods for increasing the biogas potential from the recalcitrant organic matter contained in manure. Water Science and Technology 2000;41. [CrossRef]
- Veluchamy C, Kalamdhad AS, Gilroyed BH. Advanced Pretreatment Strategies for Bioenergy Production from Biomass and Biowaste. Handbook of Environmental Materials Management, 2019. [CrossRef]
- Mankar AR, Pandey A, Modak A, Pant KK. Pretreatment of lignocellulosic biomass: A review on recent advances. Bioresour Technol 2021;334. [CrossRef]
- APHA. Standard Methods for the Examination of Water and Wastewater. Standard Methods 2005. ISBN 9780875532356.
- Takahashi S, Tomita J, Nishioka K, Hisada T, Nishijima M. Development of a prokaryotic universal primer for simultaneous analysis of Bacteria and Archaea using next-generation sequencing. PLoS One 2014;9. [CrossRef]
- Xu M, Uludag-Demirer S, Fang D, Zhou L, Liu Y, Liao W, et al. Effects of pyrogenic carbonaceous materials on anaerobic digestion of a nitrogen rich organic waste-Swine manure. Energy & Fuels 2021;35.
- Chen R, Roos MM, Zhong Y, Marsh T, Roman MB, Hernandez Ascencio W, et al. Responses of anaerobic microorganisms to different culture conditions and corresponding effects on biogas production and solid digestate quality. Biomass Bioenergy 2016;85. [CrossRef]
- Tao N, Xu M, Wu X, Pi Z, Yu C, Fang D, et al. Supplementation of Schwertmannite improves methane production and heavy metal stabilization during anaerobic swine manure treatment. Fuel 2021;299. [CrossRef]
- Capson-Tojo G, Moscoviz R, Ruiz D, Santa-Catalina G, Trably E, Rouez M, et al. Addition of granular activated carbon and trace elements to favor volatile fatty acid consumption during anaerobic digestion of food waste. Bioresour Technol 2018;260. [CrossRef]
- Zhang L, Zhang J, Loh KC. Activated carbon enhanced anaerobic digestion of food waste – Laboratory-scale and Pilot-scale operation. Waste Management 2018;75. [CrossRef]
- Cuetos MJ, Martinez EJ, Moreno R, Gonzalez R, Otero M, Gomez X. Enhancing anaerobic digestion of poultry blood using activated carbon Enhancing anaerobic digestion of poultry blood. J Adv Res 2017;8. [CrossRef]
- Smith KS, Ingram-Smith C. Methanosaeta, the forgotten methanogen? Trends Microbiol 2007;15. [CrossRef]
- Yue ZB, Ma D, Wang J, Tan J, Peng SC, Chen TH. Goethite promoted anaerobic digestion of algal biomass in continuous stirring-tank reactors. Fuel 2015;159. [CrossRef]
- Rotaru AE, Shrestha PM, Liu F, Shrestha M, Shrestha D, Embree M, et al. A new model for electron flow during anaerobic digestion: Direct interspecies electron transfer to Methanosaeta for the reduction of carbon dioxide to methane. Energy Environ Sci 2014;7. [CrossRef]
- Lovley, DR. Syntrophy Goes Electric: Direct Interspecies Electron Transfer. Annu Rev Microbiol 2017;71. [CrossRef]
Figure 1.
Biogas and methane content (a) daily biogas production over 80 days, (b) cumulative biogas production for the four groups, and (c) methane content (%) in the biogas.
Figure 1.
Biogas and methane content (a) daily biogas production over 80 days, (b) cumulative biogas production for the four groups, and (c) methane content (%) in the biogas.
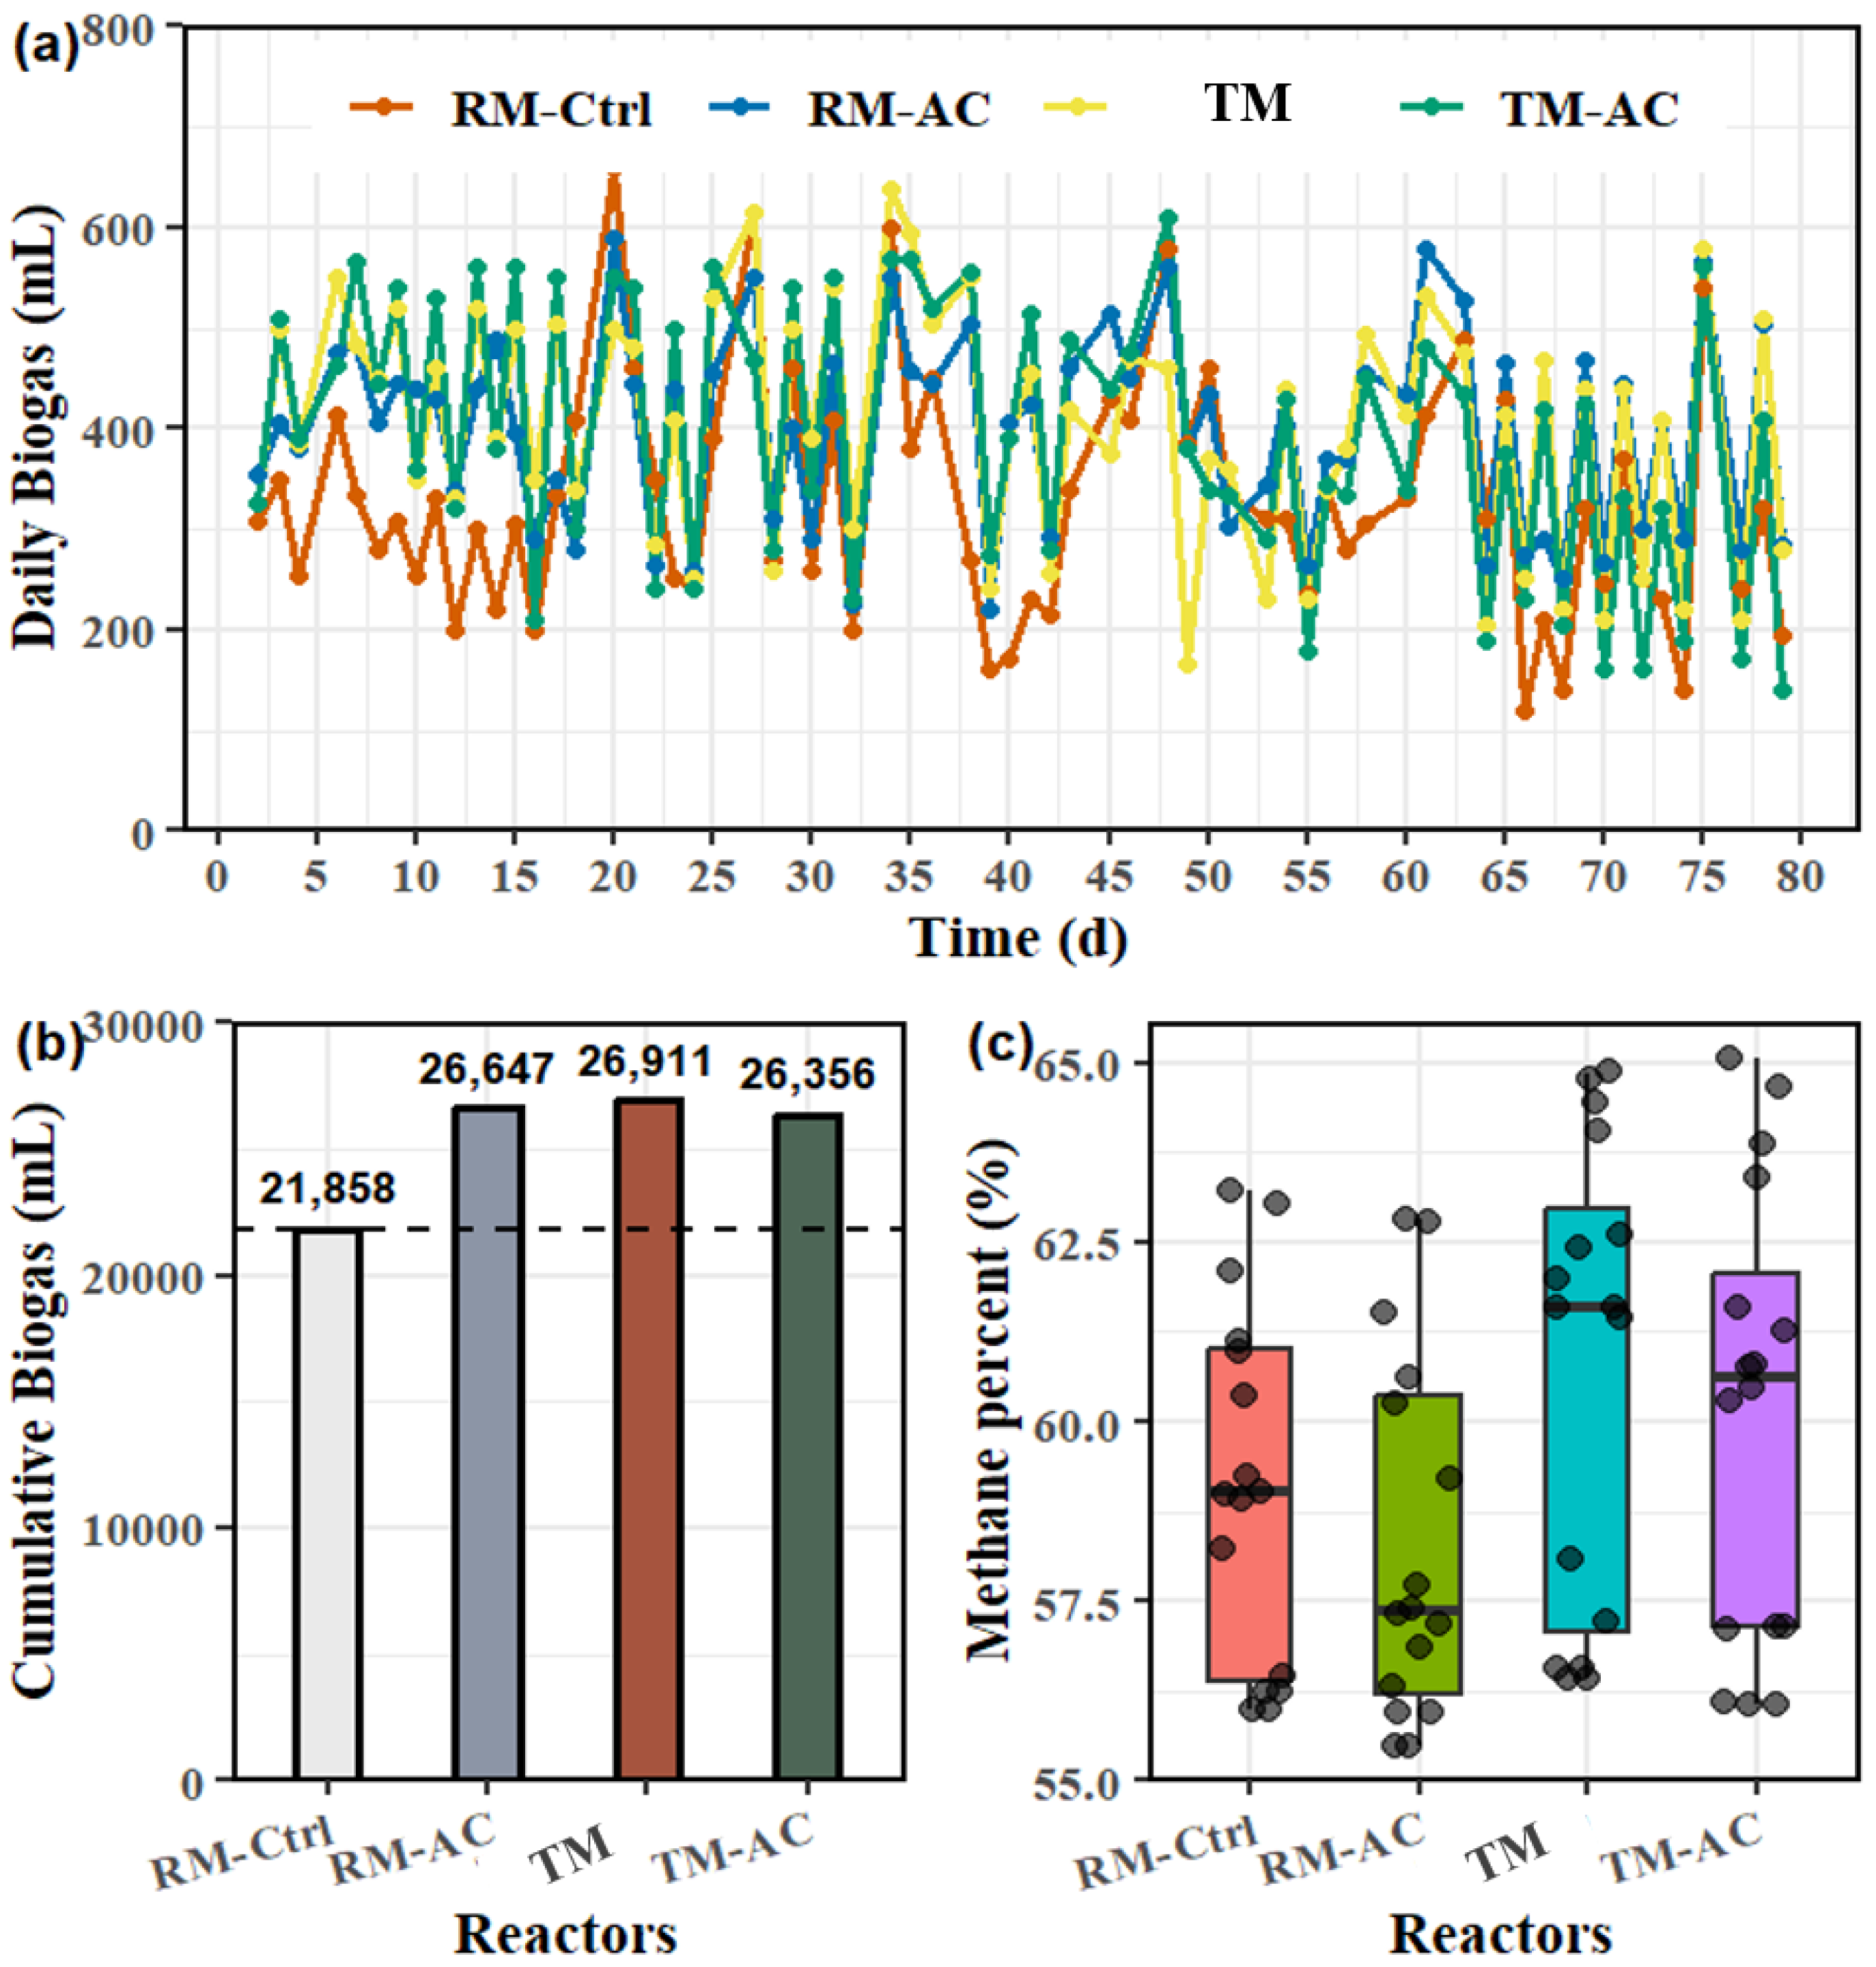
Figure 2.
Amplicon sequencing results for the four groups: (a) Sequence reading counts, (b) Observed OTUs, and (c) Good’s coverage for the samples. Data are from samples collected on days 20, 40, 60, and 80.
Figure 2.
Amplicon sequencing results for the four groups: (a) Sequence reading counts, (b) Observed OTUs, and (c) Good’s coverage for the samples. Data are from samples collected on days 20, 40, 60, and 80.
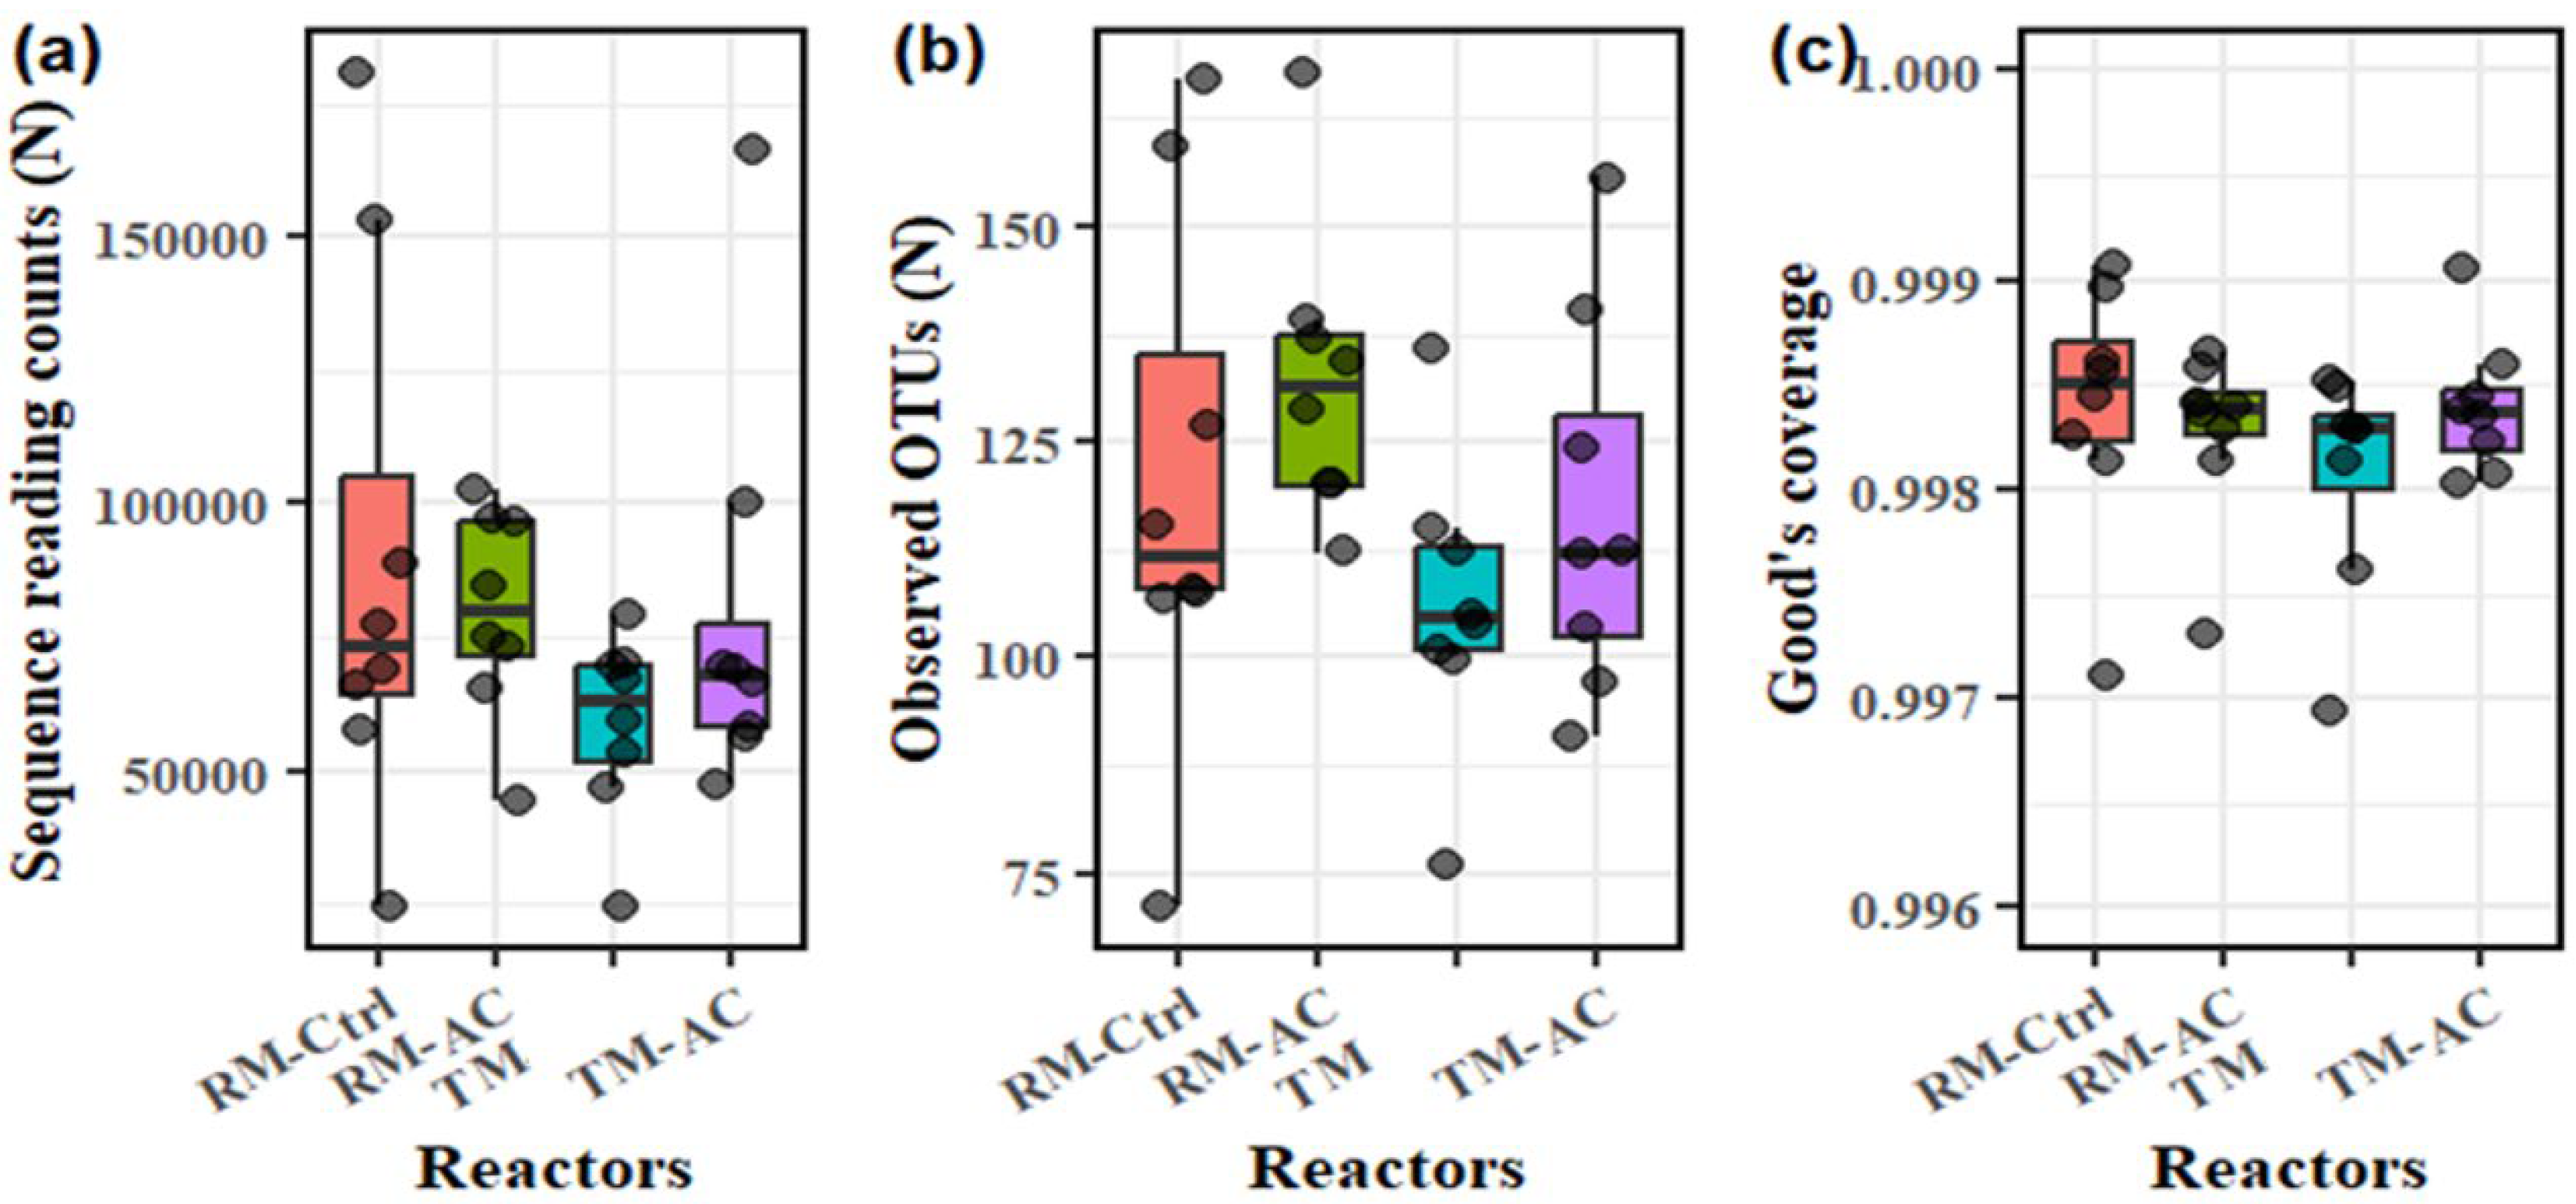
Figure 3.
Alpha diversity and principal component analysis (PCA) of microbial communities across four groups, based on the first 100 OTUs. (a) Shannon (H) index, (b) Simpson (D) index, (c) Chao1 index, and (d) PCA of microbial community composition. Statistical significance is indicated by * (p<0.05), and “ns” denotes no significant difference.
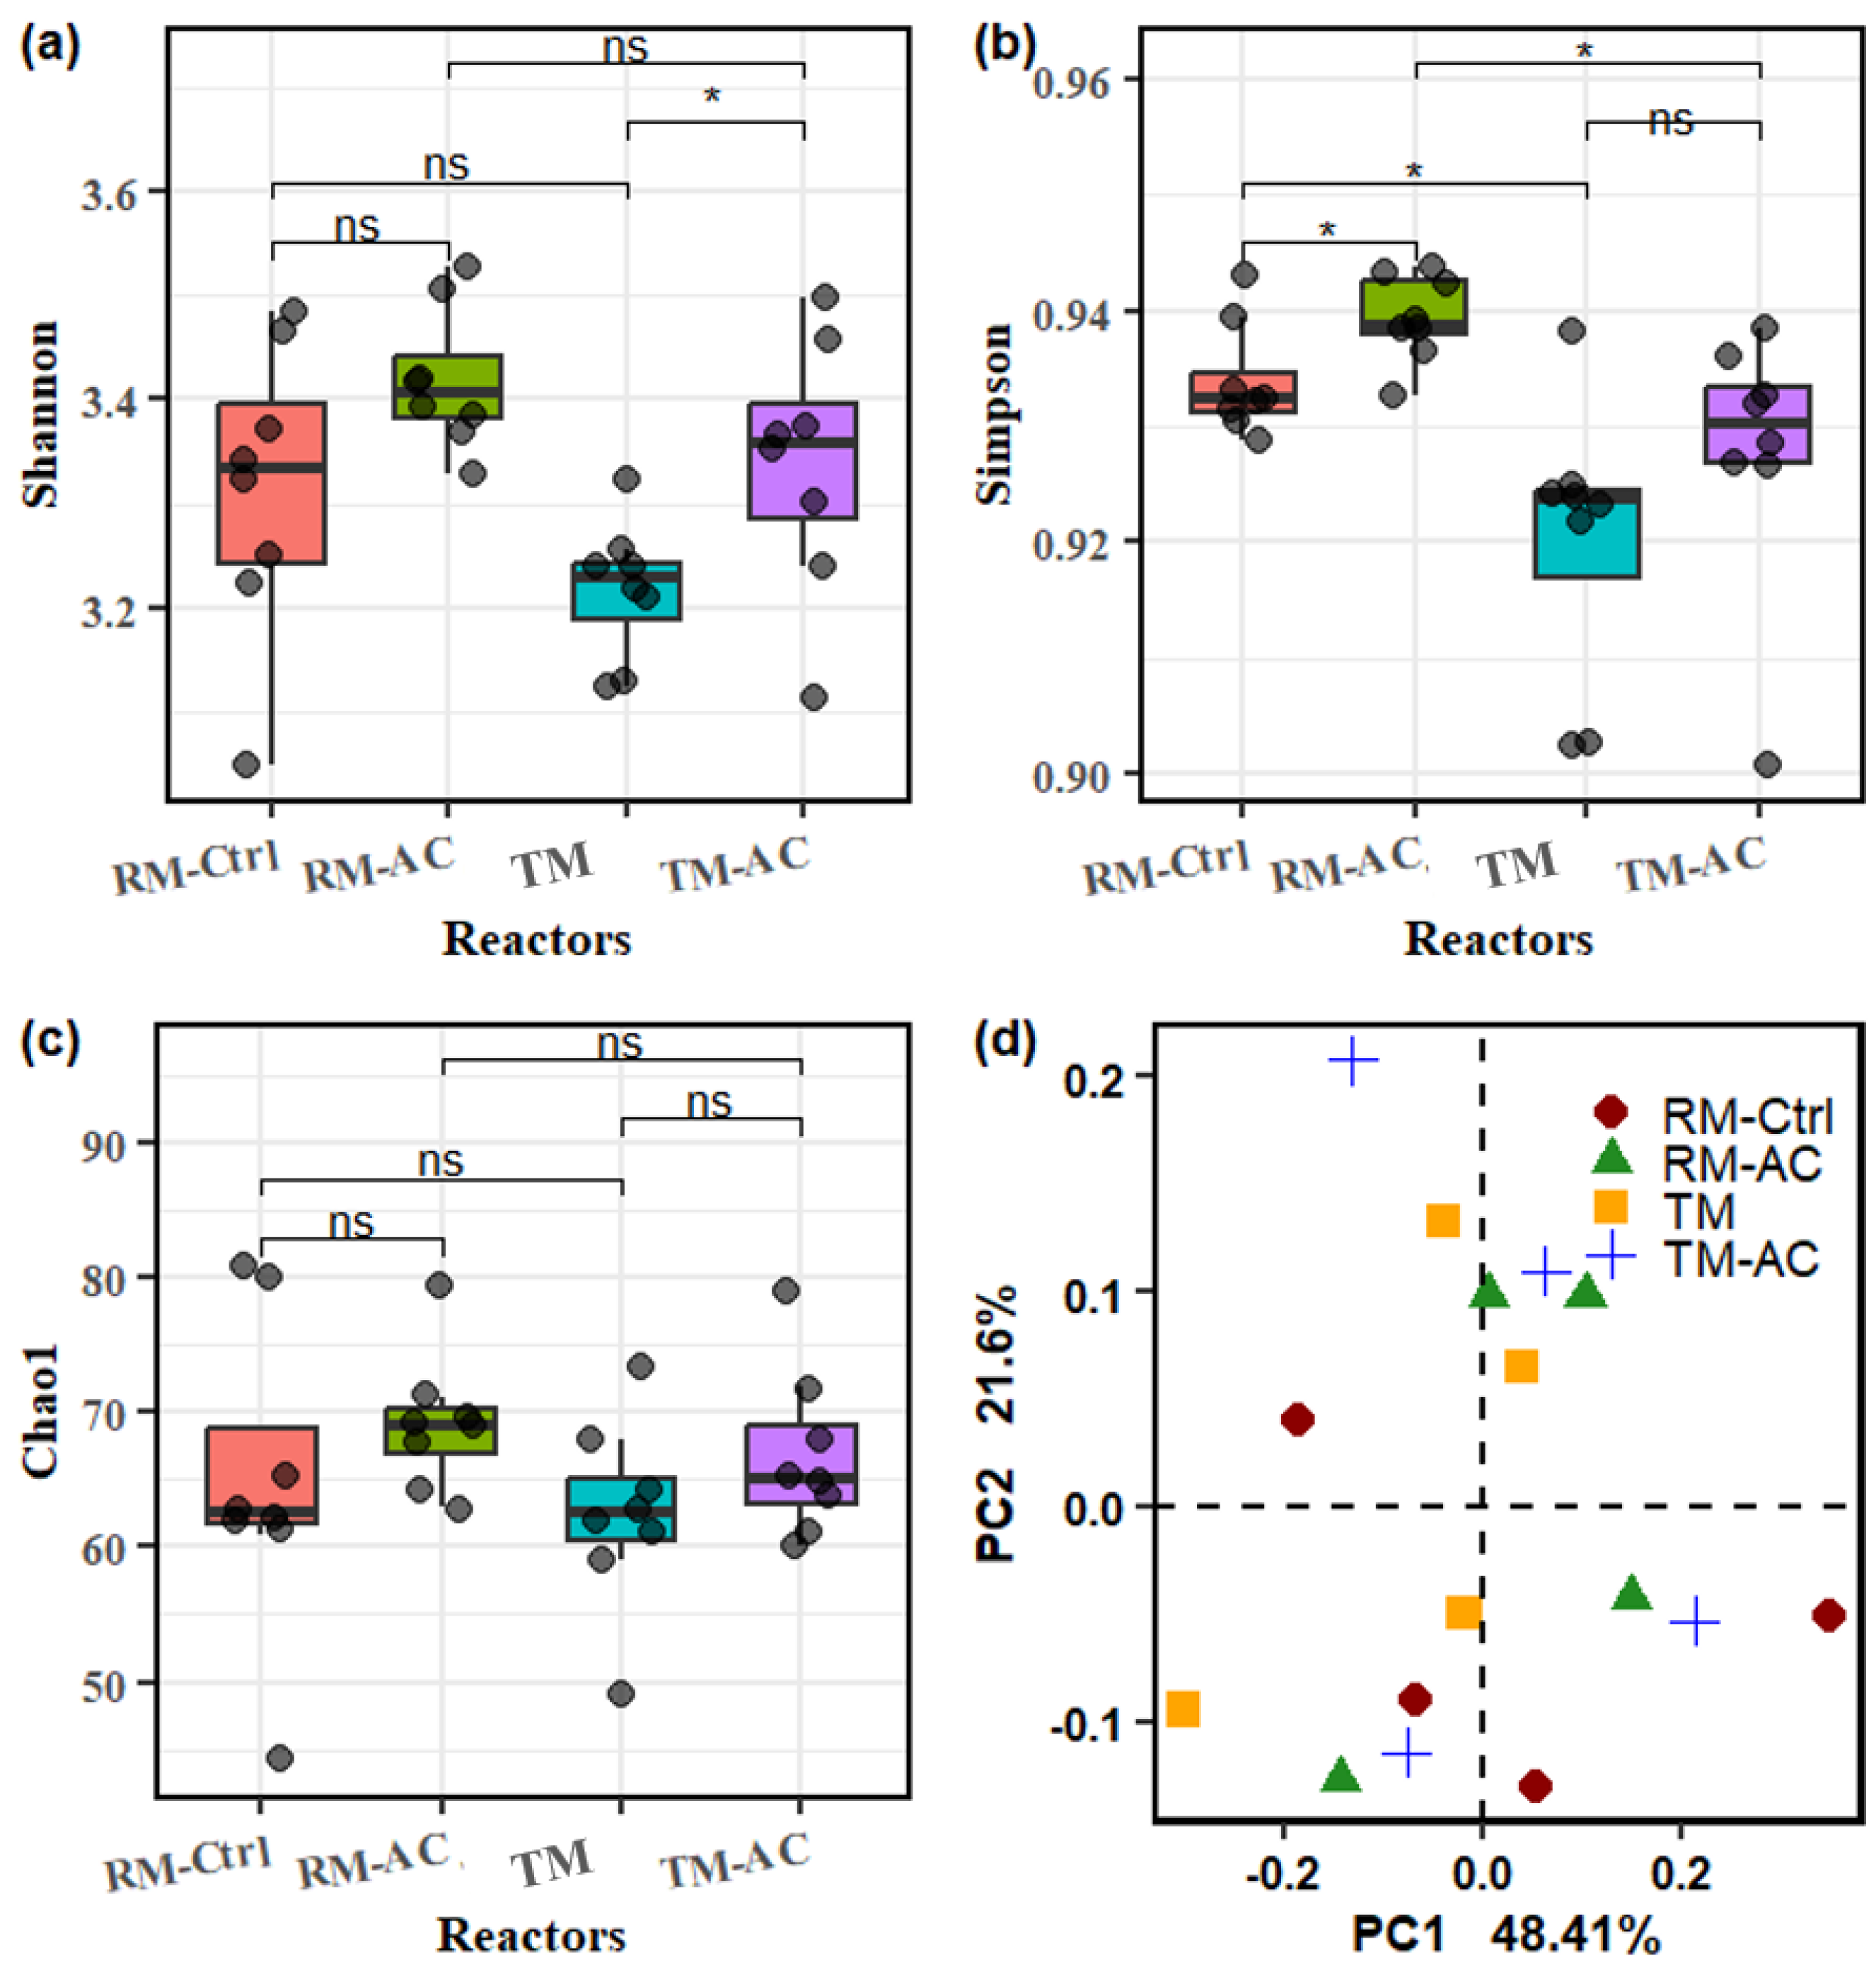
Figure 4.
Relative abundance of microbial communities across four groups at Domain (a), Phylum (b), and Genus (c) levels. Data represents the average across the four HRTs (days 20, 40, 60, and 80).
Figure 4.
Relative abundance of microbial communities across four groups at Domain (a), Phylum (b), and Genus (c) levels. Data represents the average across the four HRTs (days 20, 40, 60, and 80).
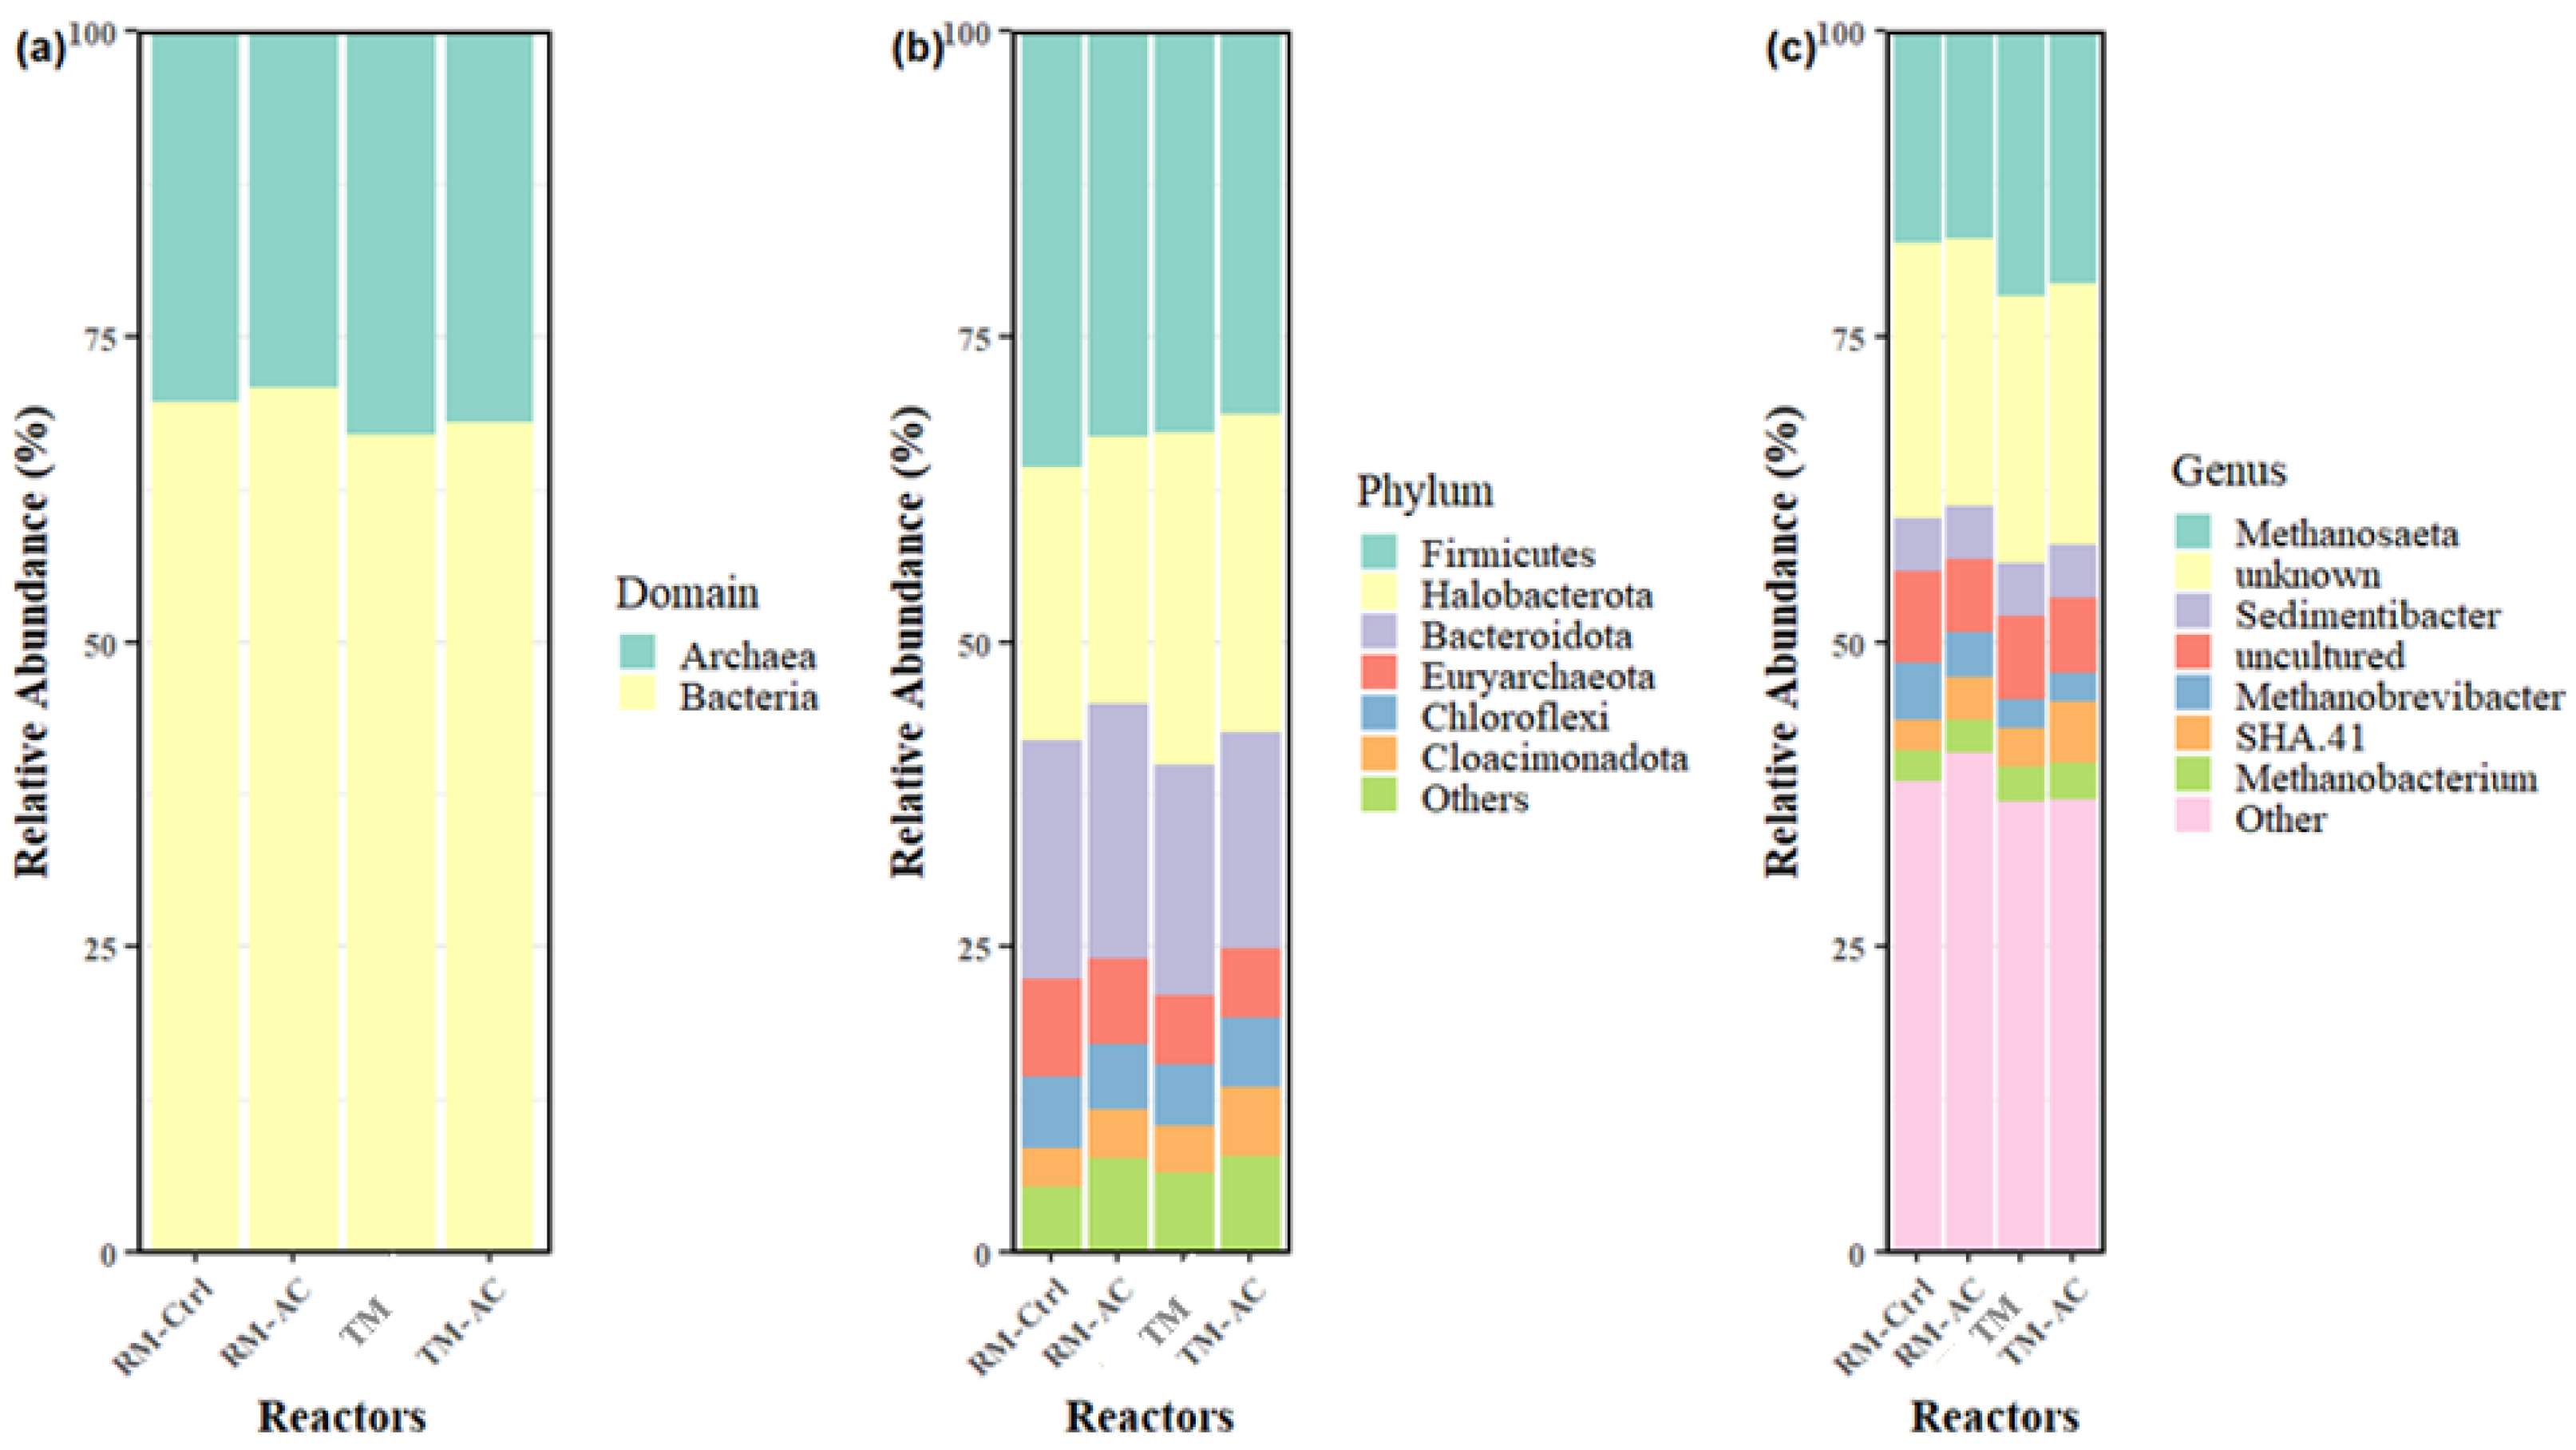
Figure 5.
Scanning electron microscopy (SEM) images of raw dairy manure (a), and 1 hour ball mill treated manure (b) used in this study. (Magnification: ×300, scale bar = 50 µm).
Figure 5.
Scanning electron microscopy (SEM) images of raw dairy manure (a), and 1 hour ball mill treated manure (b) used in this study. (Magnification: ×300, scale bar = 50 µm).
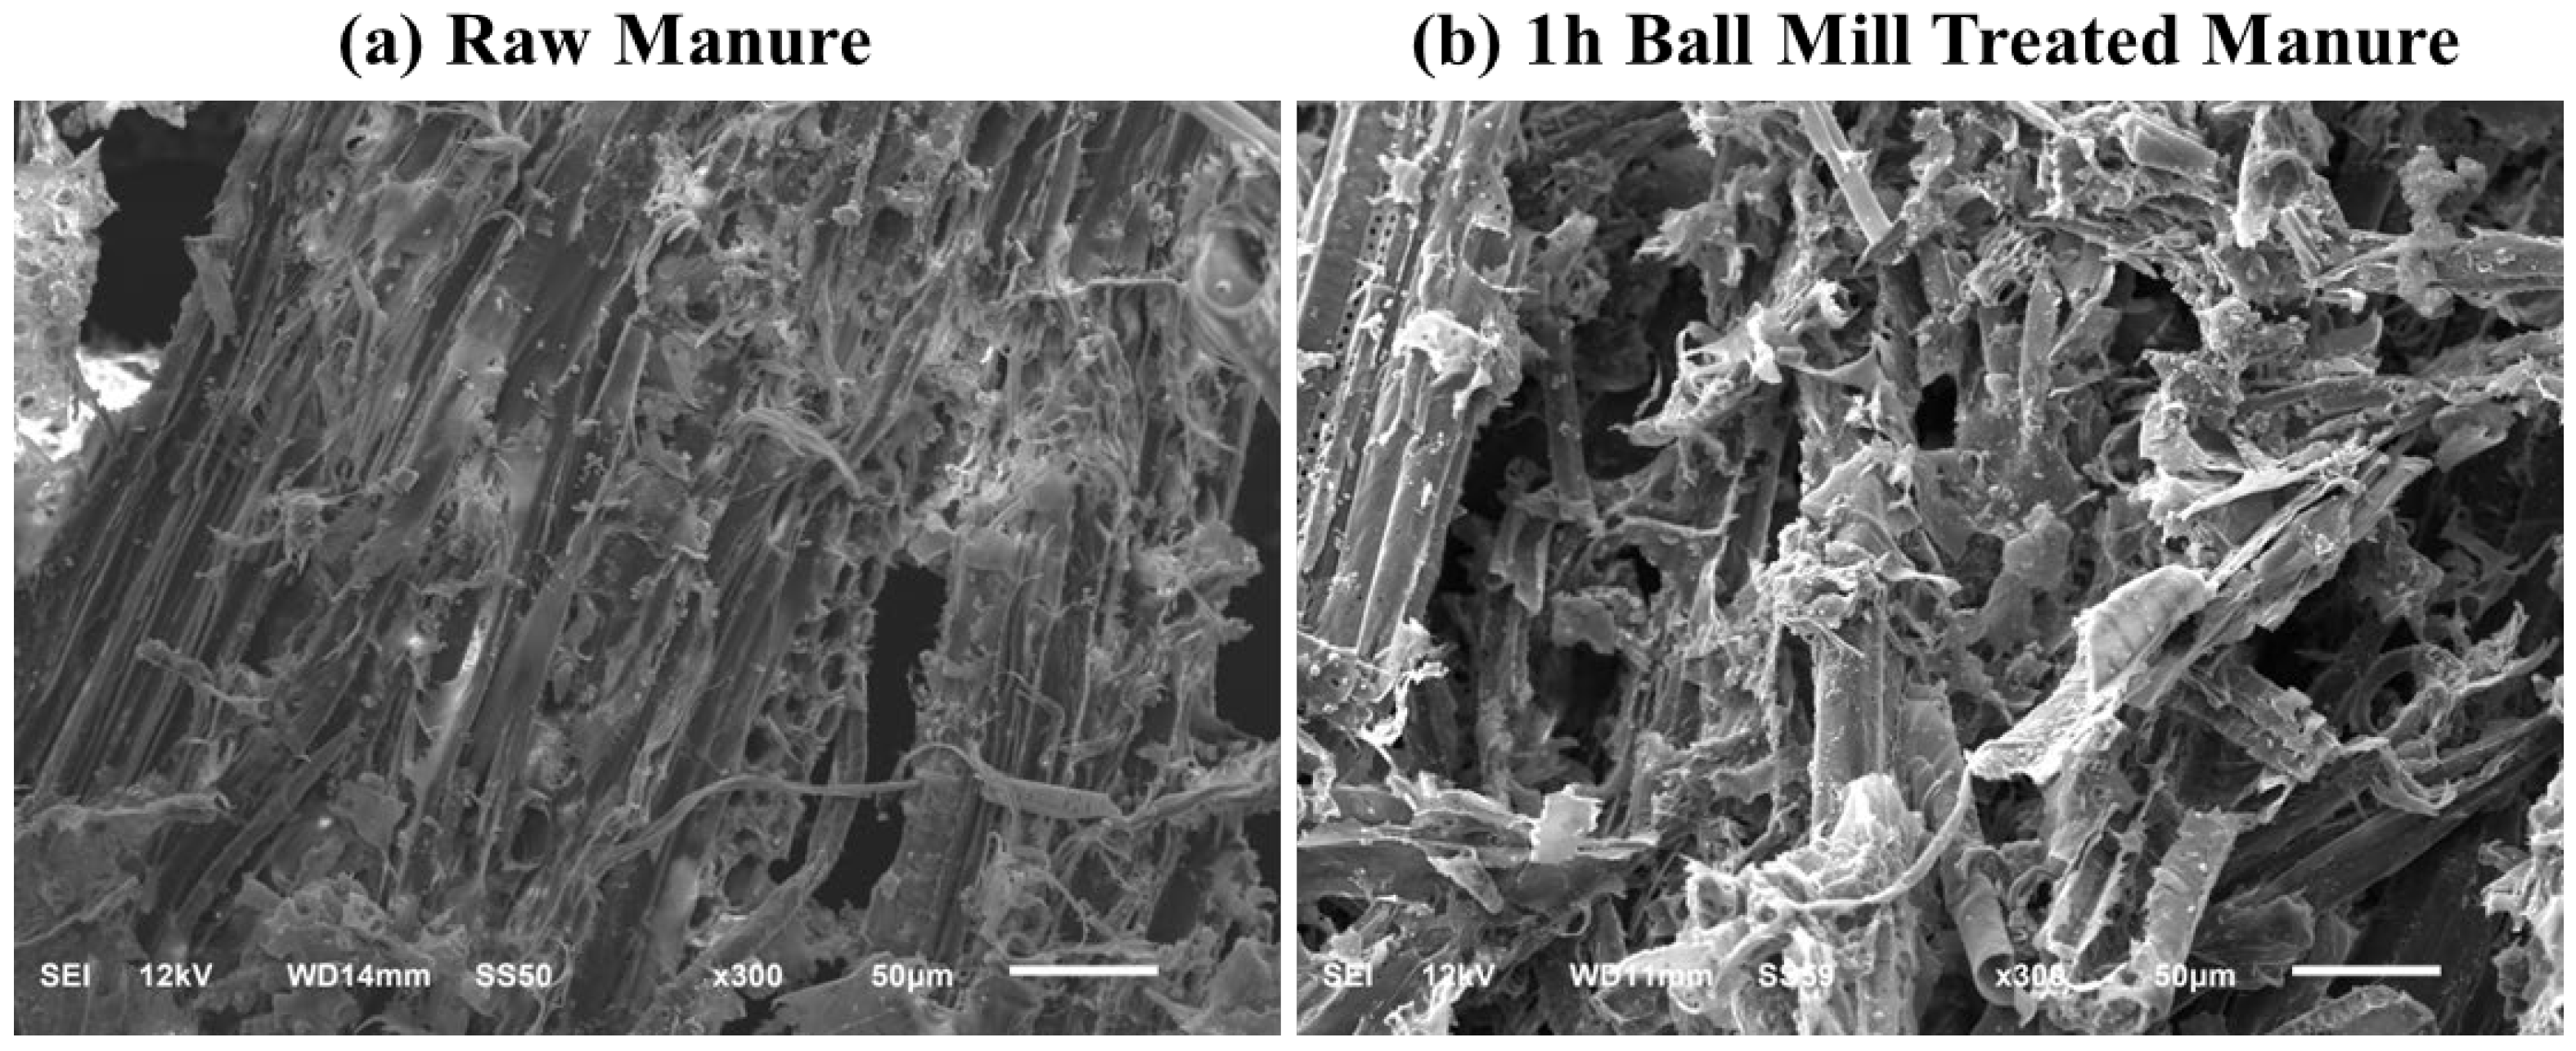
Figure 6.
Spearman correlation heatmap between key biochemical parameters and microbial community abundances. The color gradient reflects the strength and direction of correlations, with darker shades indicating stronger positive or negative relationships.
Figure 6.
Spearman correlation heatmap between key biochemical parameters and microbial community abundances. The color gradient reflects the strength and direction of correlations, with darker shades indicating stronger positive or negative relationships.
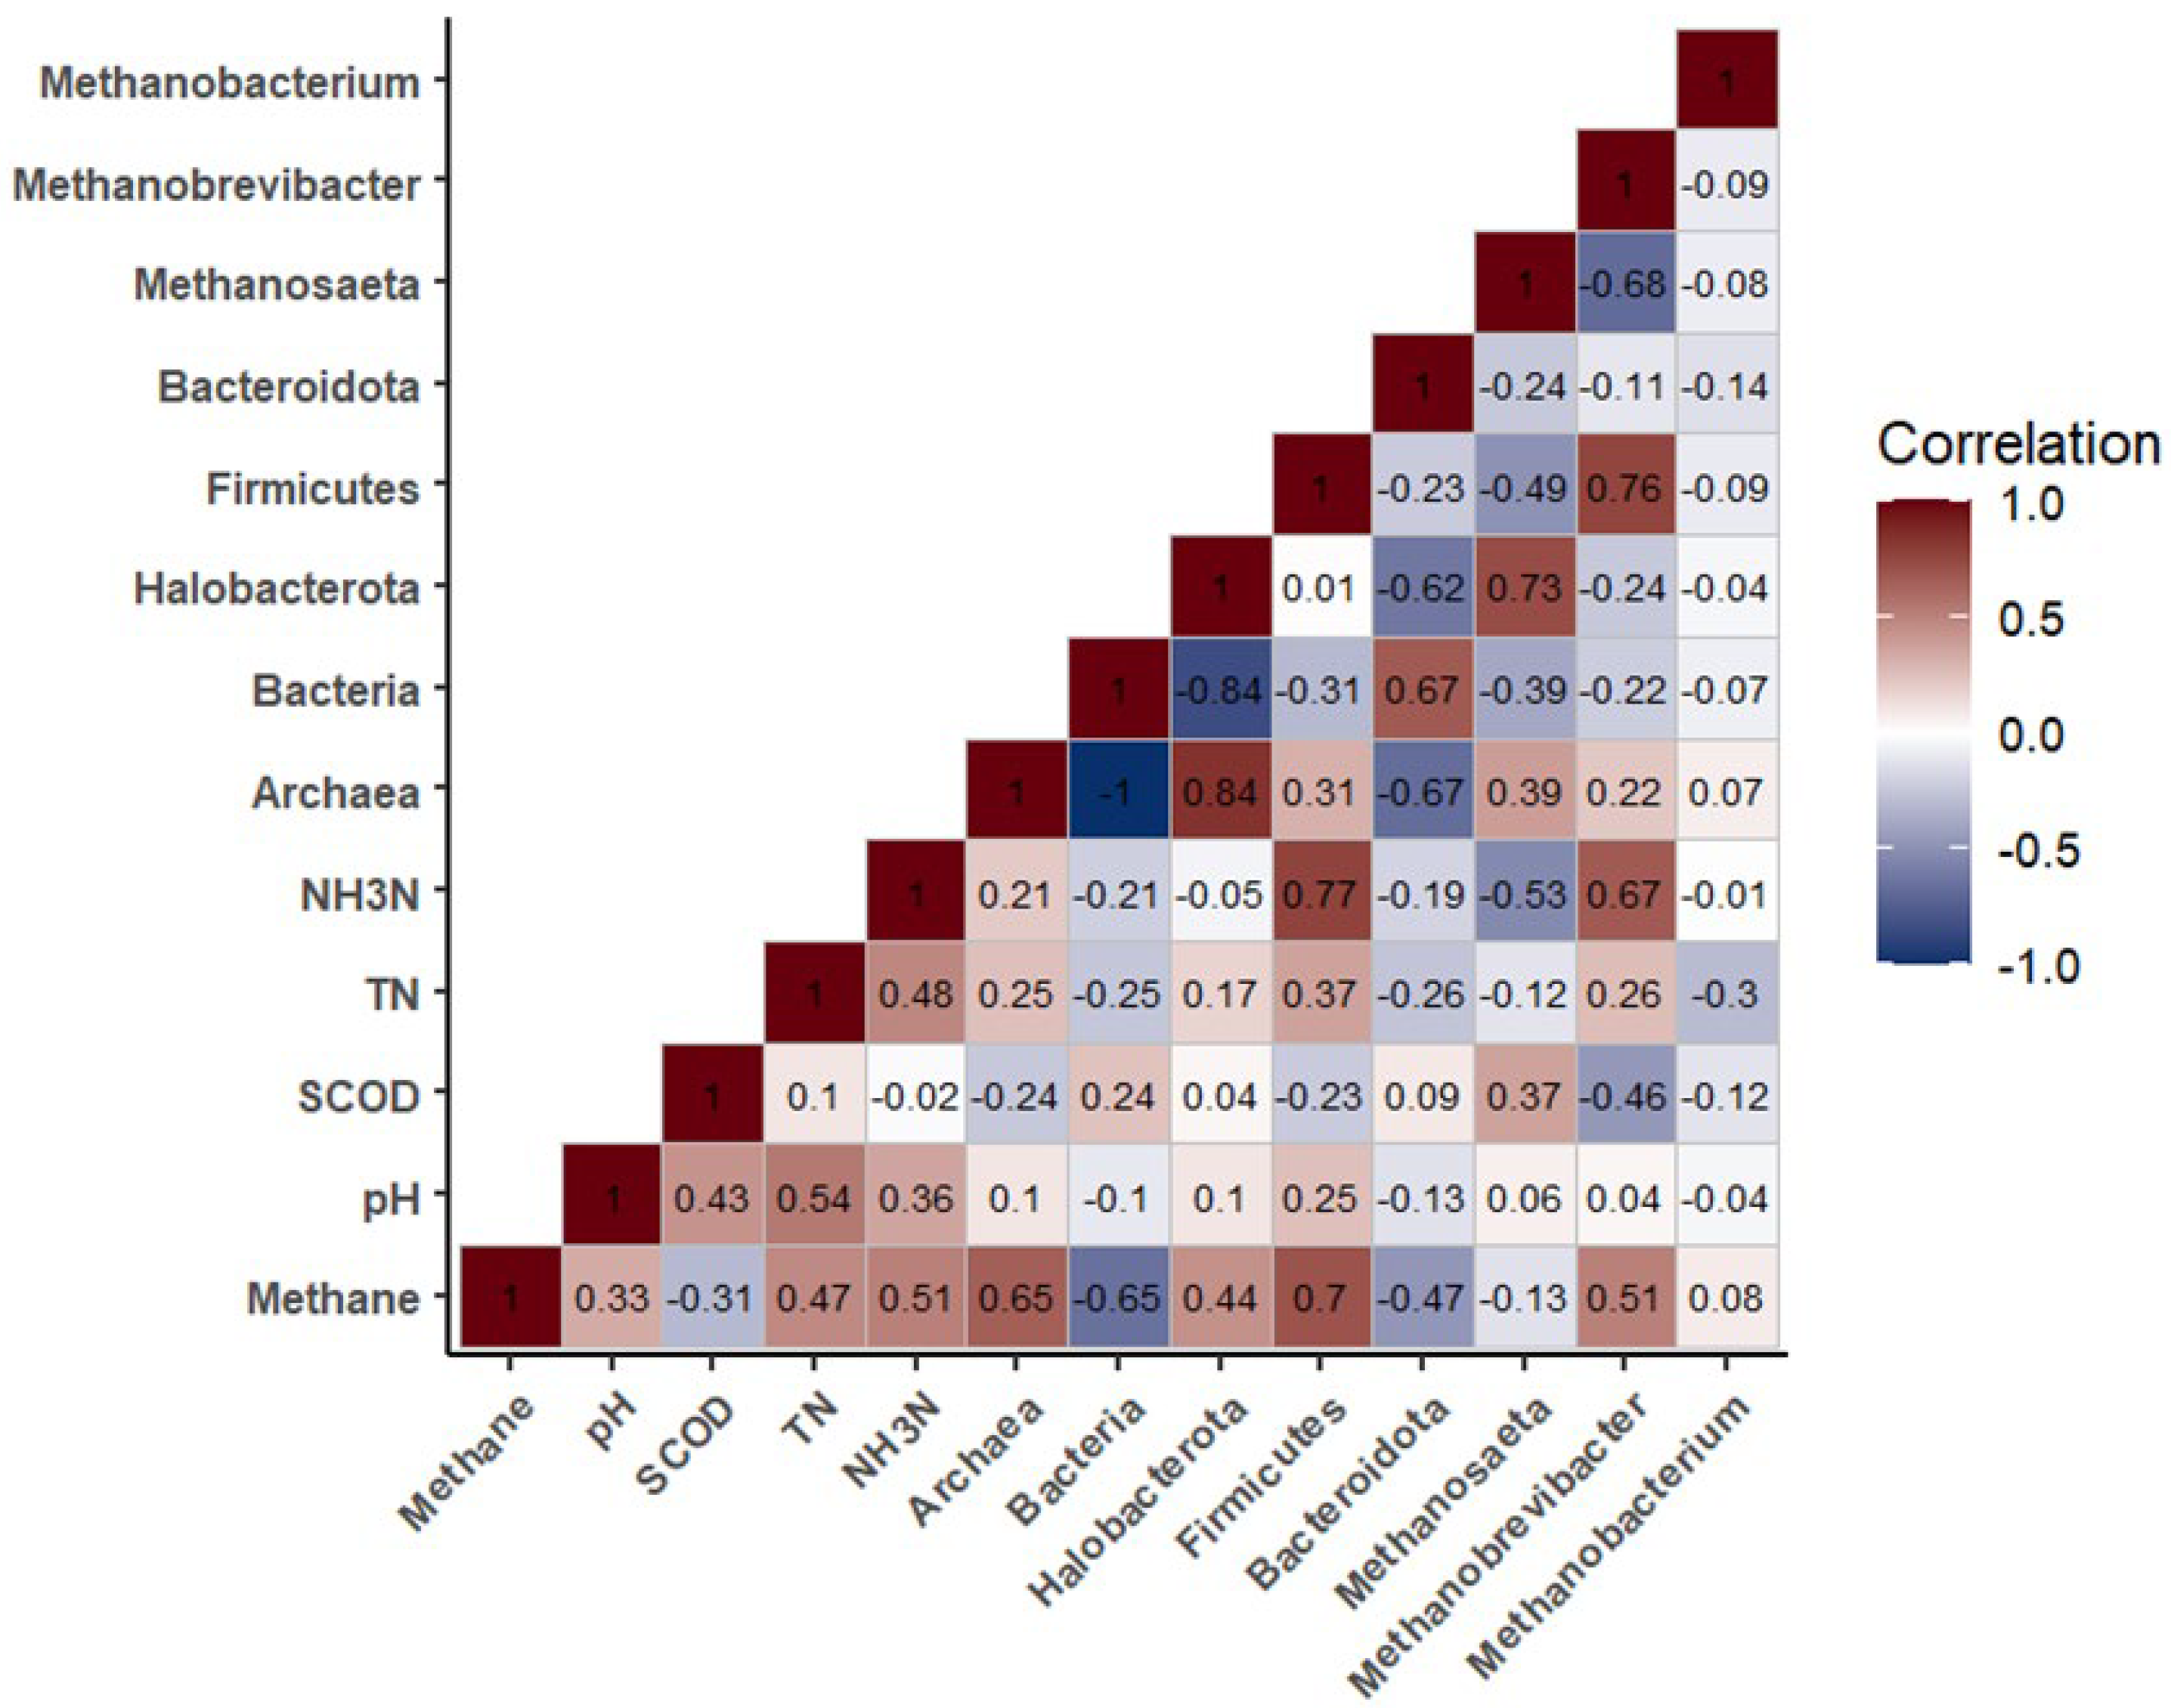

Table 1.
Characteristics of raw dairy manure and activated carbon a, b.
| Parameter | Dairy manure | Activated carbon |
|---|---|---|
| Carbon (%TS) | 44.31 | 75.55±0.05 |
| Nitrogen (%TS) | 2.66 | 0.44±0.05 |
| Sulfur (%TS) | ND | 0.15±0.00 |
| Surface area (m2/g TS) | ND | 1,056±17.57 |
| C/N | 16.66 | ND |
| pH | 7.99±0.91 | ND |
| TS (%) | 13.45±0.22 | 97.52±0.55 |
| VS (% TS) | 11.92±0.19 | 92.9±0.06 |
| TN (mg/L) | 4,360±520 | ND |
| NH3-N (mg/L) | 732±23 | ND |
| COD (g/L) | 114.98±21.20 | ND |
a: Values are expressed in mean and standard deviation; b: ND: not determined.
Table 2.
Experimental design of semi-continuous anaerobic digestion.
| Reactors | RM-Ctrl | RM-AC | TM | TM-AC |
|---|---|---|---|---|
| Anaerobic inoculum (mL) | 500 | 500 | 500 | 500 |
| Raw dairy manure (mL/every other day) |
50 | 50 | 0 | 0 |
| Ball mill-treated manure (mL/every other day) |
0 | 0 | 50 | 50 |
| Activated carbon (g/every other day) |
0 | 0.25 | 0 | 0.25 |
Table 3.
Biochemical characteristics changes during the anaerobic digestion process for the four groups.
Table 3.
Biochemical characteristics changes during the anaerobic digestion process for the four groups.
| Groups | HRTs | pH | VS (%) | SCOD (mg/L) | TN (mg/L) | NH3-N (mg/L) |
|---|---|---|---|---|---|---|
| RM-Ctrl | HRT-1 | 7.49 | 1.98±0.04 | 5,750 | 2,690 | 1,120 |
| HRT-2 | 7.44 | 1.91±0.05 | 5,450 | 1,643 | 945 | |
| HRT-3 | 7.63 | 1.71±0.46 | 5,075 | 2,763 | 1,010 | |
| HRT-4 | 7.54 | 2.23±0.29 | 7,725 | 1,578 | 1,103 | |
| RM-AC | HRT-1 | 7.52 | 2.32±0.02 | 5,053 | 2,690 | 1,103 |
| HRT-2 | 7.47 | 2.31±0.19 | 4,455 | 1,705 | 900 | |
| HRT-3 | 7.69 | 2.29±0.03 | 3,755 | 2,653 | 928 | |
| HRT-4 | 7.49 | 2.39±0.26 | 6,425 | 1,890 | 978 | |
| TM | HRT-1 | 7.60 | 2.32±0.02 | 6,500 | 2,323 | 1,250 |
| HRT-2 | 7.55 | 2.40±0.06 | 6,275 | 1,930 | 755 | |
| HRT-3 | 7.60 | 2.14±0.18 | 4,755 | 1,823 | 753 | |
| HRT-4 | 7.33 | 2.37±0.04 | 6,400 | 1,638 | 585 | |
| TM-AC | HRT-1 | 7.61 | 2.53±0.08 | 5,750 | 2,185 | 1,198 |
| HRT-2 | 7.53 | 2.82±0.02 | 5,675 | 1,703 | 768 | |
| HRT-3 | 7.56 | 2.56±0.05 | 3,883 | 2,060 | 705 | |
| HRT-4 | 7.24 | 2.77±0.34 | 6,325 | 1,458 | 613 |
Disclaimer/Publisher’s Note: The statements, opinions and data contained in all publications are solely those of the individual author(s) and contributor(s) and not of MDPI and/or the editor(s). MDPI and/or the editor(s) disclaim responsibility for any injury to people or property resulting from any ideas, methods, instructions or products referred to in the content. |
© 2024 by the authors. Licensee MDPI, Basel, Switzerland. This article is an open access article distributed under the terms and conditions of the Creative Commons Attribution (CC BY) license (http://creativecommons.org/licenses/by/4.0/).
Copyright: This open access article is published under a Creative Commons CC BY 4.0 license, which permit the free download, distribution, and reuse, provided that the author and preprint are cited in any reuse.


