
Submitted:
24 December 2024
Posted:
25 December 2024
You are already at the latest version
Abstract
Public transport is an integral part of sustainable urban development when its use is promoted by setting bus priority routes (BPRs). BPRs provide clear mobility benefits, but raise pedestrian safety concerns. In this study, observations were conducted at signalized intersections with two types of BPRs, a centre-lane and a curbside, aiming to characterize pedestrian crossing behaviors, with a particular focus on red-light crossings. We found that at intersections with centre-lane BPRs, 30% of pedestrians crossed at least one crosswalk on red, while at another type, 11% crossed on red. Multivariate analyses showed that the risk of crossing on red was substantially higher at intersections with centre-lane vs. curbside BPRs; it was also higher among pedestrians crossing to/from the bus stop, males and young people but lower under the presence of other waiting pedestrians. Furthermore, among pedestrians crossing on red at centre-lane BPRs, over 10% did not check the traffic before crossing and another 10% checked the traffic in the wrong direction, thus further increasing the risk. At centre-lane BPRs, infrastructure solutions are needed to reduce pedestrian intention to cross on red. Additionally, education and awareness programs for pedestrians should be promoted to emphasize the heightened risk of red-light crossing at intersections with BPRs.
Keywords:
bus priority routes
; safety
; pedestrian behaviors
; observations
; red-light crossing
1. Introduction
In light of the growing problem of congestion in urban areas, a policy promoting the use of public transportation is encouraged around the world [1,2,3]. In Europe, public transport is considered as an integral part of sustainable urban development aiming to promote active travel modes, walking and cycling [4]; in the USA, transit-oriented development is supported aiming to attain more resilient, healthier and all-inclusive cities [5]. In Israel, public transport development has become an official priority in the past decade, initially, due to congestion on the road network, particularly at the entrances to major cities, and more recently, following the need for sustainable development of urban areas [6,7].
Public transport promotion policy is reflected, particularly, in the allocation of transport infrastructure for bus priority routes (BPRs). The latter includes bus lanes or routes dedicated to an exclusive or priority run of buses, on selected or all hours of the day, to provide undisturbed flow for bus traffic [8]. BPRs are commonly established on arterial streets in cities and suburban areas, while the ultimate form of such systems is known as bus rapid transit (BRT) [9,10]. Over the past decades, bus priority systems have been rapidly developing in the world and, especially, in South- and North-American countries, Asia and Australia [11,12,13]. Similarly, in Israel, in recent years, re-development of urban streets to include BPRs has being implemented. For example, in the Haifa metropolitan area, a BRT system was introduced, covering about forty kilometers of bus priority streets and routes [14]. In the city of Tel-Aviv, there are tens of kilometers of BPRs, with various bus operators. Currently, as part of the development of public transport services in the country [6], a nation-wide program called “Rapid to the city” is conducted, including planning and implementation of hundreds of kilometers of BPRs in various cities.
Previous research showed that bus priority systems and establishing BPRs offer evident mobility benefits, e.g. in terms of savings in bus travel time, increasing commercial bus speeds in peak hours and enhancing the capacity of existing transport infrastructure [15,16]. In a more general sense, alleviating congestion in cities is expected by encouraging a shift from private cars' use to public transportation, with consequent positive impacts of reducing emissions, enhancing economic opportunities, better accessibility and increasing active travel [13,17].
Concerning the safety impacts of bus priority systems and BPRs, the situation is more complicated. In general, evaluations conducted in the USA and European countries showed safety advantages of using public transportation [17,18,19]: when considering the extent of casualties and fatalities per passenger-kilometer, it is evident that traveling on buses is safer than using a private car. In Israel as well, under various occupancy assumptions, it was estimated that the risk of being killed or severely injured in buses is significantly lower than that in a private car; for instance, with an occupancy of forty passengers on a bus and four in a private car, the risk of severe injury in a car is four times higher than in a bus [20]. Furthermore, comparative evaluations of North-American cities demonstrated a direct link between the higher use of public transport in the city and the lower number of fatalities in road accidents per urban resident [17,21]. Therefore, in the long-term, the improvement in bus systems and the growth in their use are expected to contribute to a decrease in road traffic injury, in cities.
However, the short-term safety impacts of BPRs can be mixed, as introducing BPRs requires essential infrastructure changes in road layouts, which are typically more complex than traditional urban settings [13,22,23]. Indeed, previous research reported various safety effects of BPRs' introduction. For example, the operation of BRT systems in several South-American cities and India led to substantial reductions both in injury and fatal accidents [15]. Similarly, the implementation of bus priority lanes in Melbourne, Australia, brought a reduction in total accidents [24,25]. At the same time, U.S. studies showed higher accident rates following the implementation of dedicated bus lanes [26], while a recent evaluation of a BRT system in New Mexico revealed a significant decrease in accident frequencies [27]. In Israel, an assessment of safety implications of a BRT system in Haifa and evaluations in other cities showed that BPR operations were associated with upward trends in accident occurrences, relative to previous periods and having controlled for changes on comparison-group roads [14,28].
Moreover, BPR safety impacts may depend on their design and engineering characteristics [12,14,15]. The main forms of BPR configurations, common in international practice and in Israel, are centre-lane bus routes and curbside bus lanes [9,12], see examples in Figure 1. In the centre-lane route, the bus lane is a left lane on each carriageway, near the median, while a curbside bus lane is located adjacent to the sidewalk. In this context, again, mixed research findings can be found in the literature, without a clear indication which form is safer.
For example, the study [22] developed accident models for vehicle and pedestrian accidents in BPR systems in several South-American cities, and showed that both centre-lane and curbside configurations were safer compared to another (counter-flow) form. Repeated analyses of accident changes following the introduction of such systems in South-America and India demonstrated a positive impact on road safety of centre-lane BPRs [15]. Concerning the safety impacts of the curbside BPRs, in Mexico, a significant increase in both vehicle and pedestrian accidents was found in one city and insignificant changes in another [15]. In New York, a significant increase in total accidents, vehicle collisions, and pedestrian accidents, on road sections, was reported [29], while in Hong Kong, the safety impacts of curbside bus lanes were not statistically significant [30]. In contrast, in Australia, where lower accident rates were found on road sections with BPRs, the latter were mainly in the form of curbside bus lanes [24,25].
Furthermore, previous research indicated consistently that the weak points of BPR operation lie in pedestrian safety [13,15,22]. For example, the study [15] reported that over half of the fatalities on BPR routes in South America were pedestrians. It was argued [22] that BPR systems are located on main traffic arterials and attract large pedestrian volumes (as more users of public transport), thus increasing pedestrian exposure and injury risk. In addition, a significant share of pedestrian injuries occurred while crossing the street on their way to bus stops [22]. Similarly, the study [31] found an increase in accidents in the vicinity of stops along BRT corridors in Bogota, which was apparently related to the higher flows of pedestrians. Additionally, U.S. studies reported increases in pedestrian accidents on streets with BPR corridors [27,29].
In Israel, signalized intersections with BPRs were found to be associated with a higher risk of pedestrian accidents compared to similar intersections but without BPRs [23]. In general, increasing trends in pedestrian accidents at intersections, following the BPRs' introduction, were consistently observed in evaluation studies in Israel [14,28]. This, despite the fact that traffic settings in BPR corridors, in the country, were designed following the best practice international recommendations, e.g. distinguishing BPRs by yellow road markings; segregation of centre-lane routes by a curb or fencing, and a red-color aggregate; signalizing all junctions along the bus corridors; placing bus stops adjacent to junctions, etc. [8,9,10,12].
In local practice, a particular concern was raised regarding centre-lane BPRs due to the structure of pedestrian crossings at signalized intersections, which may surprise and confuse pedestrians [23]. A central BPR creates three traffic routes to be crossed by pedestrians, instead of the usual two, thus requiring a change in the rules of pedestrian behavior while crossing the road – the so-called "three-route effect" (Figure 2). Pedestrians need to look left when crossing the first (vehicle) route and look left again when crossing the BPR, instead of looking right as they are used to do at intersections without BPRs. To continue crossing, pedestrians are expected to then look right (within the BPR) and again right in the third route (for general traffic). In other words, the three-route crossing structure contradicts traditional road-crossing habits, potentially triggering a response to look in the wrong direction, thereby increasing accident risk. For example, a pedestrian crossing the bus route on a red light, based on habit, may look in the opposite direction and fail to notice the approaching bus. Indeed, fatal pedestrian accidents occurred in one Israeli city at intersections with centre-lane BPRs that were related to this phenomenon, and a Ministerial committee was initiated to investigate the safety of this BPR type [32]. In addition, occasional observations of pedestrian behaviors at signalized intersections with centre-lane BPRs, which were conducted in the processes of safety auditing, pointed to the presence of the phenomenon: some pedestrians who crossed the BPR checked bus traffic in the wrong direction (e.g., [33]). However, an examination of previous literature revealed that pedestrian behaviors on streets with bus corridors and, particularly, when crossing signalized intersections with BPRs, were not explicitly examined in the past.
In summary, public transport use in urban areas is associated with potential mobility, safety, and environmental benefits, while current safety concerns of BPRs are mainly related to pedestrian injury. The latter stems from increasing pedestrian exposure and the characteristics of BPR systems which may impact road user behaviors in the way increasing accident risks. Previous research on BPR safety was not extensive and mostly included accident data analyses with evaluating general safety effects of such systems. Given the continuous development of BPRs in Israel, it was important to provide road designers and decision-makers with empirical findings regarding pedestrian behaviors on streets with BPRs, an area where research data were scarce. Therefore, an observational study was initiated to examine pedestrian behaviors at intersections with BPRs while focusing on the two types, which are most common in Israel, i.e. a centre-lane and a curbside BPR. The study aimed to characterize pedestrian behaviors when crossing at urban intersections with BPRs, particularly red-light crossings, and to compare behaviors between the two types of BPRs.
The remainder of the paper is structured as follows. Section 2 provides an overview of factors that affect pedestrian crossing behaviors at signalized intersections. Section 3 describes the study research model, with methods applied for observational data collection and analyses. Section 4 presents the study results. Section 5 provides a discussion on the study findings. Section 6 suggests the main conclusions with implications for planning BPRs.
2. Previous Research on Factors Affecting Pedestrian Behaviors at Signalized Intersections
A significant share of pedestrian accidents is associated with human errors in the interaction between road users and the road environment and/or non-compliance with traffic rules [34,35]. Among the risk factors associated with pedestrian injury at signalized intersections, the literature indicates non-compliance with red-lights by crossing pedestrians, ignoring vehicular movement during crossing, insufficient length of green light for completing the crossing by pedestrians, etc. [15,26,36,37,38].
Additional risk factors are related to pedestrian characteristics, such as age and gender. For example, elderly pedestrians experience difficulties in distinguishing approaching vehicles, assessing vehicle speeds, and crossing intersections in a timely manner due to ageing changes in their mental and motoric abilities [39,40,41]. Conversely, cognitive immaturity and a lack of necessary skills for safe crossing contribute to child and adolescent pedestrian injury [42,43,44]. Research suggests that elderly pedestrians delay longer before crossing signalized crosswalks, and tend to comply more with traffic laws compared to younger pedestrians [45,46]. Regarding crossing patterns of children, observations at urban intersections in Israel showed that risk-taking behaviors are higher among adolescents aged 14-17 compared to younger age groups: they cross more on red, without checking traffic and while distracted [44,47].
Concerning pedestrian gender, research indicated consistently that male pedestrians are more likely to cross on red and tend to higher risk-taking compared to females [45,48,49]. Similar findings were received in observational surveys conducted in Israel [50]. Furthermore, the use of mobile phones while walking, especially for talking, reading, and writing messages, leads to a decrease in environmental awareness and a diversion of attention from the road [51,52].
Regarding crossing on a red-light, observational surveys conducted in several countries showed that a non-negligible share of pedestrians do not comply with traffic lights [38,53,54]. A national observational survey in Israel found that 30% of pedestrians crossed signalized intersections on a red-light, and over 10% of those did so without checking whether the traffic conditions allowed for a safe crossing [50].
Moreover, research literature indicates that a pedestrian's decision to cross on red is influenced, among other things, by infrastructure and environmental factors such as the duration of the red-light, the length of the pedestrian crossing, the clearance time between green lights, the location of bus stops at intersections, surrounding land uses, etc. For example, it was shown that the longer the waiting time, the higher the probability of a pedestrian to cross on red [12,55,56]. The study [57] found that signalized crosswalks with a refuge island were associated with a higher frequency of red-light violations compared to crosswalks without refuges. Some pedestrians may perceive such crosswalks as less dangerous, leading them to be less hesitant to cross on red. A divided road may impose on the pedestrian an additional wait for second green, potentially encouraging red-light violations, especially if they are in a hurry to catch a bus [23].
The presence and behavior of other pedestrians also play a role in the individual's decision to cross on red. Research showed that as the number of pedestrians waiting on the sidewalk increases, the probability of crossing on red decreases [38,49,56]. On the other hand, the tendency for social conformity increases the chance of a pedestrian crossing on red if other pedestrians do so [46,58]. The study [59] analyzed separately the behavior of the first pedestrian and of those who followed, and found that the former had a strong influence on the decision of others to cross on red.
Finally, the destination of crossing may influence the compliance with traffic lights. For example, a study that examined pedestrian behavior in two cities in Poland found that pedestrians rushing to "catch" the tram were more likely to cross on red than others [58]. However, when traffic lights were coordinated with public transportation, better pedestrian compliance with traffic lights was observed.
3. Materials and Methods
3.1. The Study Framework
Previous literature indicated that unsafe pedestrian behaviors and especially crossing on red are among the main causes of pedestrian accidents at signalized intersections, in general, and at sites with BPRs, in particular. At the same time, empirical data are lacking regarding the extent of red-light crossings at intersections with BPRs. Thus, this research aimed to examine the extent of unsafe pedestrian behaviors at urban intersections with BPRs, with a focus on crossing on red, while accounting for factors, which may influence the non-compliance with traffic lights (see Section 2). In addition, the study considered other pedestrian behaviors, which may increase accident risk at BPR sites, e.g. non-checking traffic before crossing or checking the wrong direction [23,32], and non-contextual behaviors such as using distraction devices during crossing [51,52].
Furthermore, as the compliance to red-lights by pedestrians may characterize the safety level of an intersection [34,36,60,61], the study intended to compare pedestrian behaviors at two types of BPR intersections, i.e. with a centre-lane (CL) bus route and a curb-side (CS) bus-lane. Such examination was supposed to contribute to understanding the safety level of various BPR settings and to assist in identifying factors that increase the risk.
The data on pedestrian behaviors were collected by means of field observations at the two types of BPR sites, which were selected in cities with operating BPRs. The requirements of the study sites were defined as follows: it should be a signalized intersection, located on a dual-carriageway road with a built median, and two general vehicle lanes in each travel direction; the street should be with a bi-directional BPR, moderate to high activity of crossing pedestrians and a speed limit of 50 km/h. Such traffic settings are typical for streets with BPRs in Israel in the past decades, following the design guidelines [62,63]. A full list of intersections with BPRs throughout the country in urban areas in Israel was received from another study conducted for the Ministry of Transport, and then reduced to exclude sites, which did not satisfy the predefined requirements.
Furthermore, field surveys were conducted and consultations with traffic engineers from municipalities and the National Road Safety Authority, to exclude intersections with specific (site-sensitive) layouts. The final list of intersections, for the study observations, included ten sites, five of each type, CL and CS, located in seven cities; the cities represented a combination of large-sized Israeli cities (e.g., Tel-Aviv, Jerusalem, Rishon Lezion) and medium-sized (e.g., Ram Gan, Bat Yam, Bnei Brak, Kiriat Motzkin). The sites are situated on arterial and collector streets, with mostly mixed land uses in the street environment and in the proximity of commercial centers or other points of pedestrian attraction, in the cities. Figure 1 provides examples of intersections of both types which were included in the study observations.
The research model of the study was formulated based on the literature review (see Section 2) to comprise potential explanators for red-light crossing behavior, such as:
- pedestrian characteristics – age group and gender;
- crossing characteristics – direction of crossing, destination of crossing (to or from the bus stop, or from one side to another side of the intersection), time (hour);
- intersection characteristics – type of BPR (CL or CS), bus stops' location (on one side or both sides of the intersection), traffic levels (number of crossing pedestrians, number of buses in the BPR, per hour), duration of red light;
- situational variables - presence of other pedestrians (yes, no), presence of a bus at the bus stop (yes, no), use of distracting devices by pedestrian – a mobile-phone, earphones (yes, no).
Among pedestrians who crossed on red additional behaviors were considered such as: stopping before crossing (yes, no), checking traffic before crossing (yes, no), looking in the correct direction of approaching traffic (yes, no), which reflect keeping safety rules when violating the red-light. Particularly, at intersections with CL BPRs, looking in the wrong traffic direction may indicate the presence of the "three-route effect" (see Section 1). As to the age groups of pedestrians, a subdivision on major age groups of children (below 18), adults (ages 18-64) and elderly (65+) was applied, in line with previous observational studies of pedestrians [37,38,50,61].
As introduced in Section 1, in the case of a CL BPR, at the intersection, the crosswalk is divided into three routes separated by raised islands (see Figure 2). To cross from one side of the intersection to the other, a pedestrian needs to pass three crosswalks, including the first vehicle route, the BPR, and the second vehicle route. In the case of a CS BPR, the bus lane is the far-right in the direction of traffic, adjacent to the sidewalk; at the intersection, the crosswalk is divided into two parts by a raised median, similar to a common intersection on a divided urban street.
In the case of a CL bus route, the bus stops are located within the BPR. According to the guidelines [63], two types of bus stop location are possible: "on one side" of the intersection, where the stops are positioned facing each other, meaning that one stop is located before the intersection, in the direction of travel, and the second after the intersection; or "on both sides" of the intersection, where the stops are located before the intersection in both directions of travel. For both cases of bus stop locations, in the study, five types of crossing destination were defined, which are: 1) crossing from the sidewalk to a distant stop (includes two crosswalks); 2) crossing from the sidewalk to a nearby stop (one crosswalk); 3) crossing from a distant stop to the sidewalk (two crosswalks); 4) crossing from a nearby stop to the sidewalk (one crosswalk); and 5) crossing to another side of the intersection (three crosswalks). Figure 3 illustrates the definition of crossing destinations in the case of bus stops on one side of the intersection, for one crossing direction. Similar definitions were applied for the opposite crossing direction and for the case of bus stops on both sides of the intersection. In the case of a CS PTR, the bus stops are located on sidewalks and, hence, any crossing of the intersection is "from side to side".
3.2. Data Collection and Analyses
The study observations were conducted on weekdays, between the hours of 8am-2pm at the CL sites and 8am-1pm at the CS sites. At each site, two observers were placed, where one recorded pedestrian crossing behaviors, another collected data on pedestrian and bus traffic, at the intersection, and the duration of traffic light cycles. The observers worked according to a predefined protocol with a balanced sample of pedestrians by direction of crossing and crossing destination (at the CL BPR sites), and systematic counting over the hours. The data were recorded using a tablet or a smartphone.
More specifically, the first observer at the beginning of the shift was positioned on one side of the intersection and monitored pedestrians crossing towards him from the opposite direction. Every hour, the observer switched the observation side at the intersection (the crossing directions at each site were predefined by the research team). The observer surveyed, with his gaze, the behavior of the first pedestrian who arrived at the crosswalk and followed him/her visually until he/she reached the destination. Upon completing the data on the first pedestrian, the observer surveyed the behavior of the next pedestrian who arrived at the crosswalk, and so on. The observer recorded details on pedestrian's age and gender, crossing on red in the different crosswalks, checking traffic conditions before crossing, use of distractions, and about the crossing characteristics - direction, destination, presence of other pedestrians, presence of buses at the bus stops, in accordance with in the study research model. At intersections with CL BPR, the observers were instructed to sample pedestrians based on the starting point of the crossing - from the sidewalk or from the bus stop, at predefined time intervals, each hour.
The second observer conducted pedestrian and bus counts twice per hour, for four minutes each time, using a counter. Pedestrian counts were performed in both crossing directions, in all parts of the crosswalk at the intersection; the bus numbers were counted in the BPR, in both travel directions. Measurements of traffic lights' timings (in seconds) were taken twice per hour after completing traffic counts, using a stopwatch; the observer was instructed to start the stopwatch at the beginning of green until the signal turned red, continue and measure the time until the next green. Then, red-light durations were estimated in each part of the crosswalk at the intersection.
To consolidate the observation method and duration, pilot observations were conducted at two sites, one of each type included in the study. The pilot showed that in five hours of a busy morning - early afternoon traffic it was possible to collect data on over 100 observed pedestrians, per site. The observers were thoroughly trained by the study team in accordance with the observation protocol. The study observations took place in April 2019.
The main behavior indicators estimated in the study were the percent of pedestrians who crossed on red among those who arrived at the crosswalk on red, in each part of the crosswalk at the intersection and in accordance with the crossing destination. Among those crossing on red, additional behavior indicators were estimated: the percent of pedestrians who did not stop before crossing, crossed without checking the traffic or checked the wrong traffic direction. In addition, the rates of pedestrians using distracting devices during the crossing were produced.
The data analyses included several steps. For each type of sites (according to BPR), first, a summary of pedestrian behavior indicators was produced and the influence on red-light crossing of various characteristics was examined, using a Pearson’s chi-square test for a categorical feature and a t-test for a continuous one [64]. The difference was judged as significant with p<0.05. Second, a multivariate binary logistic regression model was fitted to the probability of crossing on red [65], to identify the most affecting factors. For each type of BPR sites, logistic regression models were adjusted for various crossing situations, for example, crossing on red in the first crosswalk (a vehicle route) or in at least one crosswalk of the intersection, while among potential explanatory variables the characteristics collected during the observations were attempted. Furthermore, a logistic regression model for the probability of crossing on red was fitted while considering both types of sites together, to examine the impact of the BPR type. In addition, summary values were produced for additional behavior indicators of pedestrians who crossed on red, to explore the existence of "three route-effect" at CL BPR sites.
The logistic regression models were fitted using a stepwise method. The process of the model development lasted as long as a variable adding was associated with a significant difference in the -2Log Likelihood parameter. Adequacy of fit for a model is assessed by the significance of the Omnibus chi-square test of the model coefficients [66]; in addition, "pseudo R2" indices (e.g. Nagelkerke R2) and the percentage of correct predictions are estimated, where higher values of such parameters indicate a better fit. Furthermore, a McFadden pseudo R2 index was evaluated to reflect the model improvement due to the inclusion of explanatory variables versus the initial model with intercept only (the null-model) [66]. Using the models, adjusted odds ratios, with 95% Wald confidence intervals, were estimated to show the impacts of the explanatory variables’ values on the probability of crossing on red. The variables with a significant impact (p<0.05) were counted for the interpretation of results. The regression models were developed using the SPSS software.
4. Results
Table 1 provides descriptive statistics of the study observations. Overall, data on 1,122 crossing pedestrians were recorded, of which 592 were at intersections with CL BPRs and 530 at intersections with CS BPRs. Most pedestrians observed at both types of sites were adults (86% and 83%); the percent of child pedestrians (below 18) was similar at both types of sites (8% and 6%, p=0.195), while the share of elderly pedestrians was higher at sites with CS BPRs (11% vs. 6%, p<0.01). Interestingly, at both types of sites, more female than male pedestrians were observed (58%-59%). According to the mean hourly estimates, the numbers of crossing pedestrians were higher at the CL BPR sites, while higher bus volumes were observed at the CS BPR sites.
4.1. Pedestrian Behaviors at Intersections with Centre-Lane BPRs
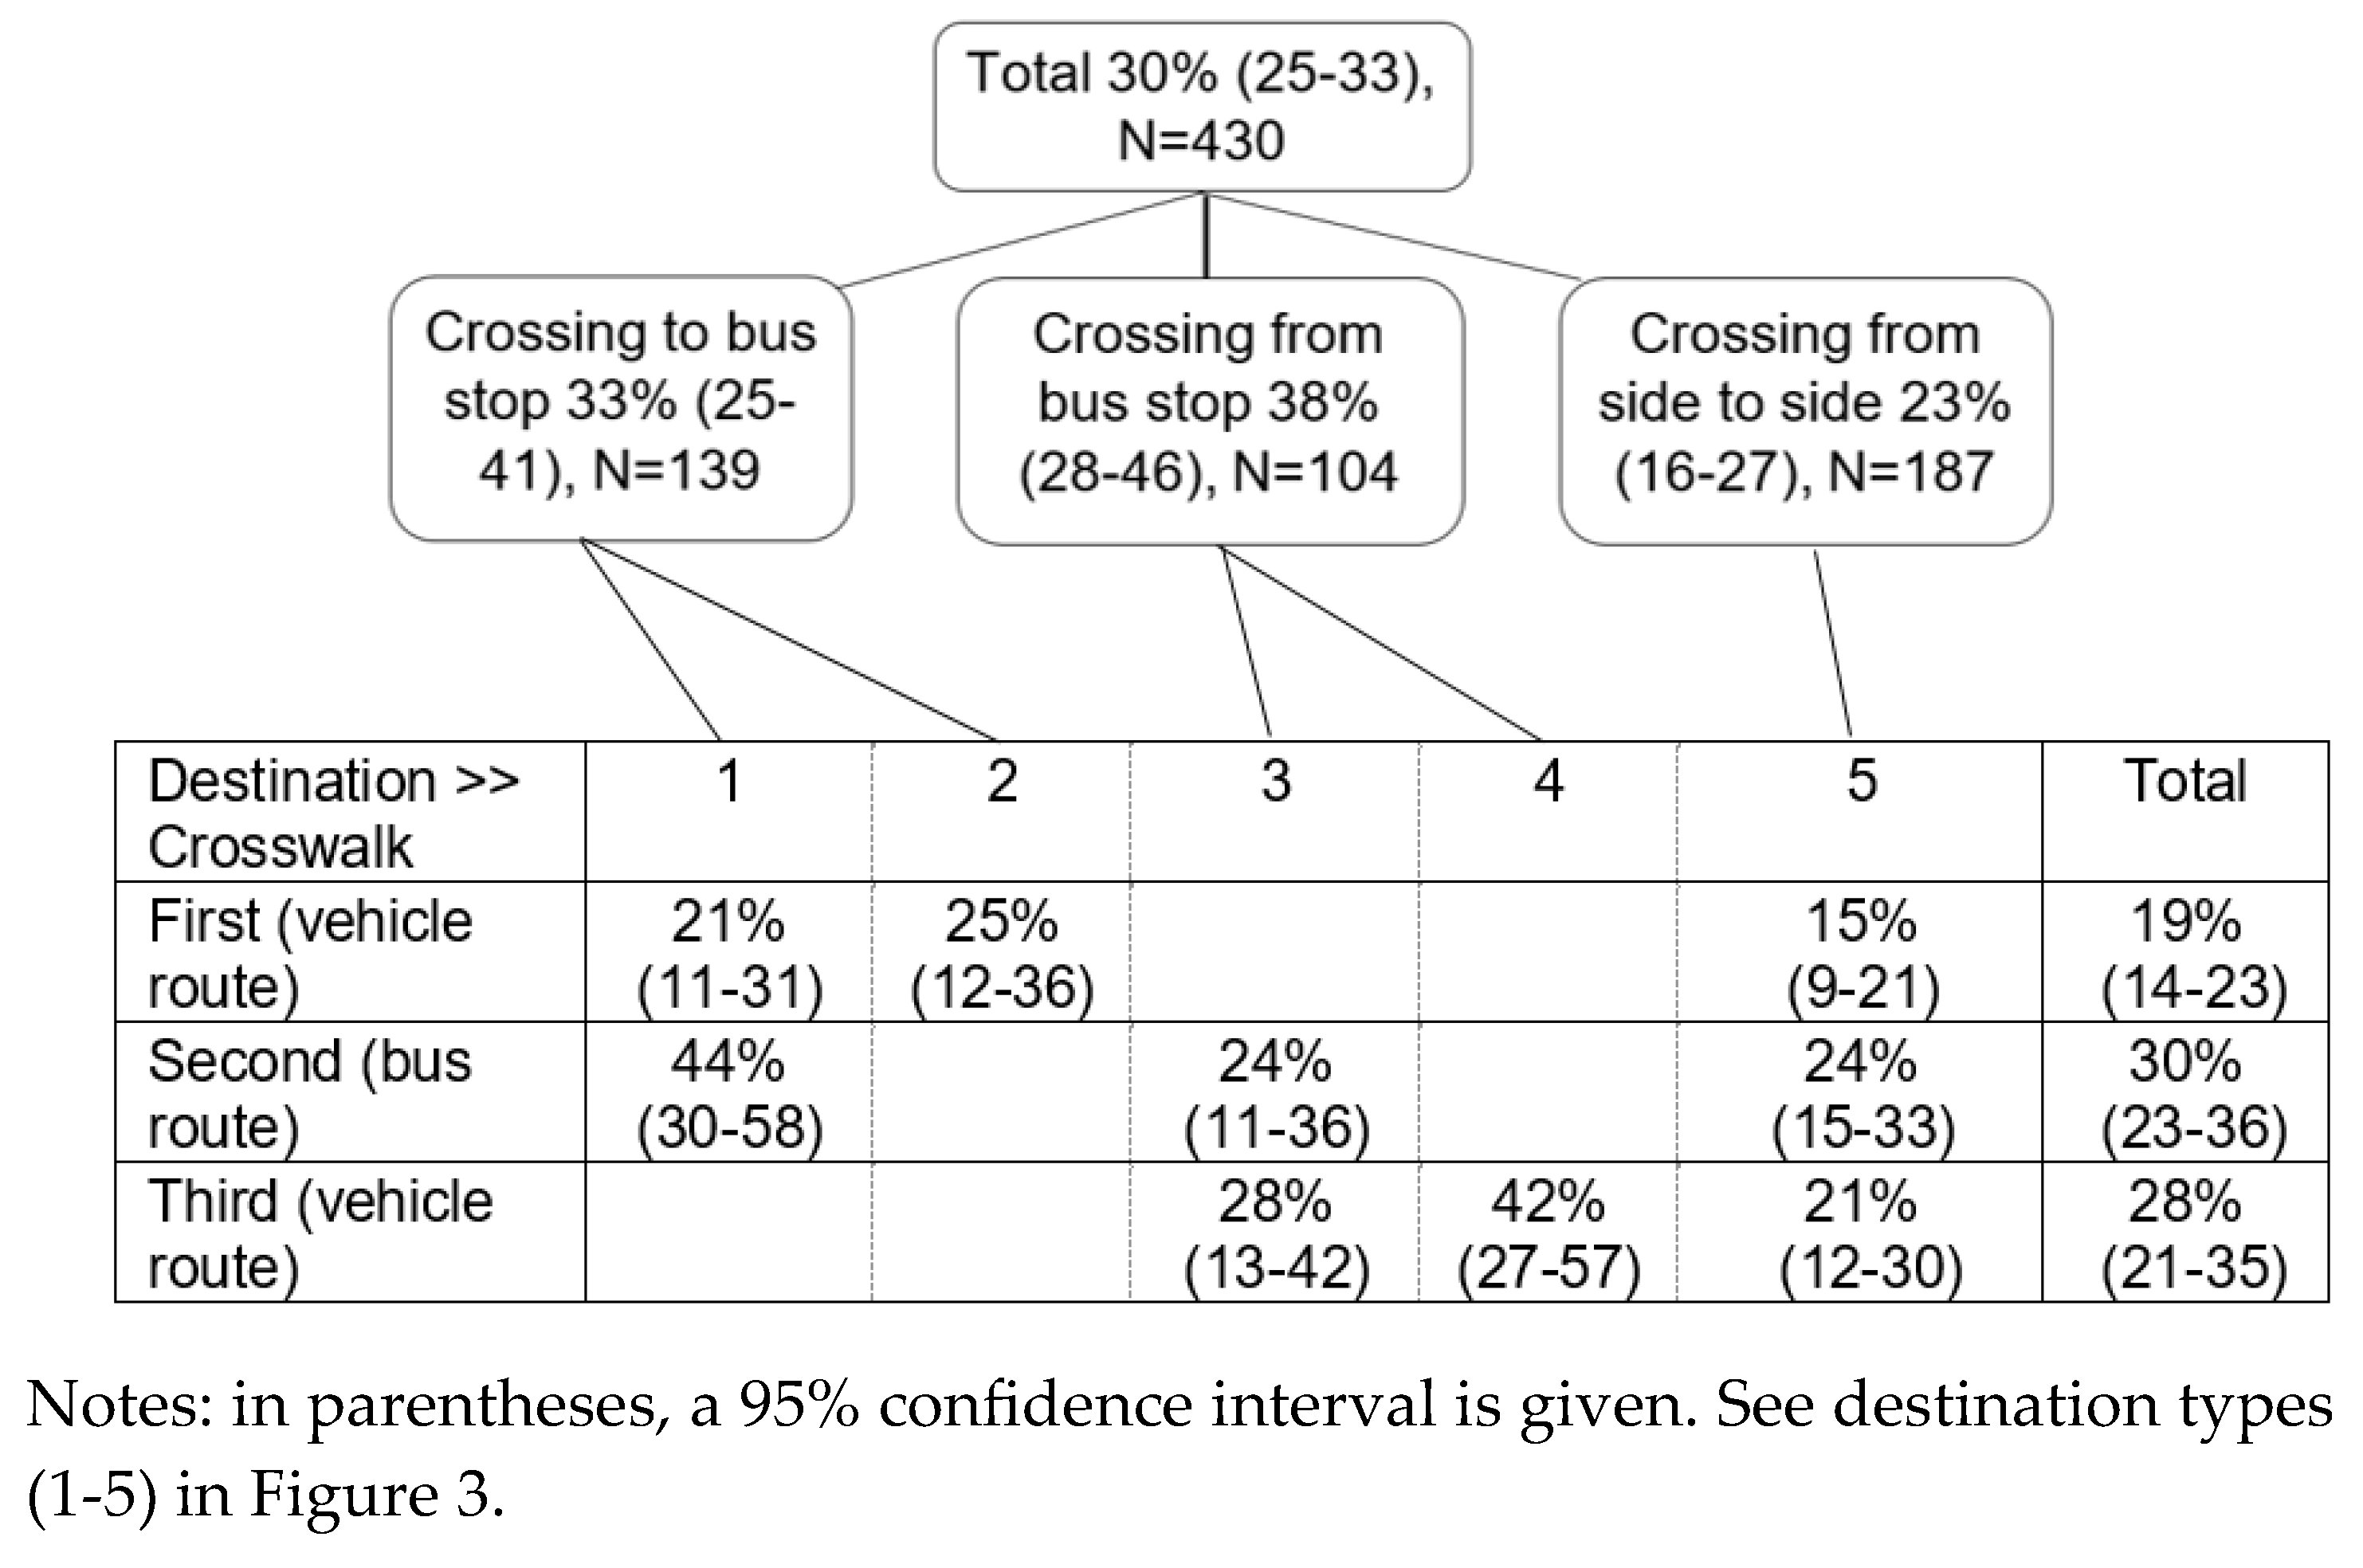
Figure 4 presents an overview of rates of pedestrians crossing on red at the intersections with CL BPRs, in accordance with crossing destination and the crosswalk part at the intersection. It shows that:
- Overall, 30% of the pedestrians observed crossed on red, at least in one crosswalk, with a higher rate among pedestrians crossing to or from a bus stop compared to those who crossed to another side of the intersection: 33% and 38% vs. 23% (χ2[2]=8.51, p<0.05).
- In the first crosswalk (a vehicle route), 19% of pedestrians crossed on red, and this rate was higher among those who crossed to a bus stop related to crossings to the other side of the intersection (difference not significant).
- In the middle crosswalk (a bus route), 30% of pedestrians crossed on red light, and this behavior was more common among pedestrians who went to the bus stop compared to other crossing situations: 44% vs. 24% (χ2[2]=7.17, p<0.05).
- In the third crosswalk (a vehicle route), 28% of pedestrians crossed on red, while this behavior was more frequent among pedestrians who crossed only one crosswalk on their way from the bus stop compared to those who crossed two crosswalks on their way from the bus stop or crossed to the other side of the intersection: 42%, 28% and 21%, respectively (χ2[2]=6.25, p<0.05).
Figure 4.
Rates of pedestrian crossings on red, at intersections with CL BPRs.
Concerning pedestrian age and gender effects, it was found that male pedestrians crossed on red more frequently compared to females: in at least one crosswalk at the intersection, 38% vs. 24% (χ2[1]=9.69, p<0.01); when crossing the BPR, 44% vs. 20% (χ2[1]=12.14, p<0.001). Elderly pedestrians crossed on red less frequently compared to younger ones: for example, crossing on red in at least one crosswalk of the intersection was observed among 6% elderly pedestrians vs. 31% and 32% among adults and children age groups (χ2[2]=9.01, p<0.05).
Further univariate analyses indicated that in the first crosswalk (for all crossing destinations) the red-light crossing rate was lower when other people were waiting while the observed pedestrian arrived compared to the cases when the observed pedestrian was alone: 19% vs. 31% (χ2[1]=5.30, p<0.001). The rate of pedestrians crossing on red in the first crosswalk was not affected by the presence of bus at the bus stop (p=0.21) or by the duration of red-light (t(351)=1.04, not significant).
The rate of red-light crossings in at least one crosswalk of the intersection was higher in hours 9am and 10am in the morning and 1pm in the afternoon, and lower in other hours of observations (χ2[5]=13.78, p<0.05). A similar trend was observed in the percent of pedestrians crossing on red in the BPR crosswalk (χ2[5]=10.86, p<0.05).
Concerning the impact of the bus stop locations (on one side or both sides of the intersection) the results were mixed: the rate of crossings on red in the first crosswalk was higher in the case of "one side" bus stops' location vs. "both sides", i.e. 28% vs. 16% (χ2[1]=7.56, p<0.01). However, the impact of this feature was insignificant when the rate of red crossings in at least one crosswalk of the intersection and on the BPR crosswalk, was examined.
The extent of using distracting devices during the crossing was as follows:
- Overall, about 35% of pedestrians crossed at CL BPR intersections while distracted - using earphones and/or a mobile phone. As expected, the frequency of usage was very low among elderly pedestrians compared to other age groups: 3% vs. about a third (χ2[2]=31.90, p<0.001).
- This behavior was more common among pedestrians who crossed to the other side of the intersection compared to those crossing to or from a bus stop: 43% vs. 16% (χ2[1]=6.55, p<0.05).
Furthermore, multivariate logistic regression models were adjusted to the probability of crossing on red at CL BPR sites, in three situations: (a) in the first crosswalk, (b) in the BPR crosswalk, and (c) in at least one crosswalk of the intersection (Table 2). The models showed that the probability of crossing on red was higher among male pedestrians and those crossing to a bus stop related to pedestrians crossing to the other side of intersection (in models b and c). In addition, the probability was higher among pedestrians crossing from the bus stop related to those crossing to the other side of intersection (in models a and c). Moreover, in the model for the first crosswalk, the probability was higher at sites with bus stop location on one side of the intersection vs. both sides (close to significant, p<0.1) and for later hours of observations. Conversely, the probability was lower under the presence of other pedestrians waiting for the green light (in models a and c) and for using distractive devices by pedestrians (in model b, close to significant, p<0.1). For other characteristics examined such as direction of crossing and bus presence at the bus stop, insignificant impacts were found in all the models. To note, pedestrian age groups were not considered in these models due to small samples of young and elderly pedestrians in the data subsets, while the addition of red-light duration and the site (specific locations) did not improve the model fits.
4.2. Pedestrian Behaviors at Intersections with Curbside BPRs
The univariate analyses of pedestrian behaviors when crossing the intersections with CS BPRs indicated that:
- Overall, 11% of pedestrians crossed on red in at least one crosswalk of the intersection (95% confidence interval, CI: 3%-8%); on average, 6% crossed on red in the first crosswalk (CI: 8%-15%) and 12% on the second crosswalk (CI: 8%-13%).
- Similar to the behaviors observed at the CL BPR sites, the rate of crossing on red was higher when the pedestrian was alone related to the cases when other pedestrians were waiting on the sidewalk: 19% vs. 3% (χ2[1]=21.77, p<0.001). The rate of pedestrians crossing on red in the first crosswalk was not affected by the duration of the red light (t(352)=-0.85, not significant), bus presence at the bus stop or bus stop location.
- The rate of red-light crossings in at least one crosswalk of the intersection was higher in hours 8am and 10am related to other hours of observations (χ2[5]=11.22, p<0.05).
- Overall, about a quarter of pedestrians crossed the CS BPR sites while using distracting devices. Similar to findings at the CL sites, the frequency of using distracting devices was lower among elderly pedestrians compared to other age groups: 3% vs. 25% (χ2[2]=13.67, p<0.01).
Further, multivariate logistic regression models were fitted to the probability of crossing on red at CS BPR sites, in two situations: (a) in the first crosswalk and (b) in at least one crosswalk of the intersection (Table 3). The models showed that, in both cases, the probability was lower when other pedestrians were present on the sidewalk. In addition, in model b, a higher probability was found for male pedestrians. Regarding other characteristics examined such as pedestrian age group, using distractive devices, direction of crossing and hour, insignificant impacts were found, in both models. Other site characteristics, e.g. bus stops' location, duration of red-light and the site (as a specific location), were not included in the final models, due to a negligible contribution to the model fit.
4.3. A Combined Model for Both Types of Sites
Following a separate examination of two types of sites, a combined logistic regression model was developed for the probability of crossing on red while considering both types of sites together. The model was fitted for crossing on red in the first crosswalk - a vehicle route, which was present in both types of intersections with BPRs. This model aimed to examine the impact of the BPR type, having controlled for other pedestrian and site characteristics. The model was adjusted in two steps: initially, it included the characteristics, which were available for both types of sites, such as pedestrian's age and gender, use of distractive devices, direction of crossing, presence of other pedestrians, red-light's duration and hour; on the second step, the BPR type was added to the model.
The combined model showed (Table 4) that at the intersections with CL BPRs, the probability of crossing on red was substantially higher compared to the CS BPR type. The BPR type had the strongest impact on red-crossing behavior related to other explanatory variables, while its addition improved the model's fit (McFadden pseudo R2 increased from 0.09 to 0.12). Besides, the combined model indicated that young and adult pedestrians crossed more on red then elderly pedestrians and that, overall, in later morning hours a higher risk of crossing on red is expected. Conversely, presence of other waiting pedestrians has a mitigating effect on the probability of crossing on red. For pedestrian gender, using distracting devices, direction of crossing and duration of red-lights no significant impact was found.
4.4. Other Pedestrian Behaviors When Crossing on Red at Intersections with BPRs
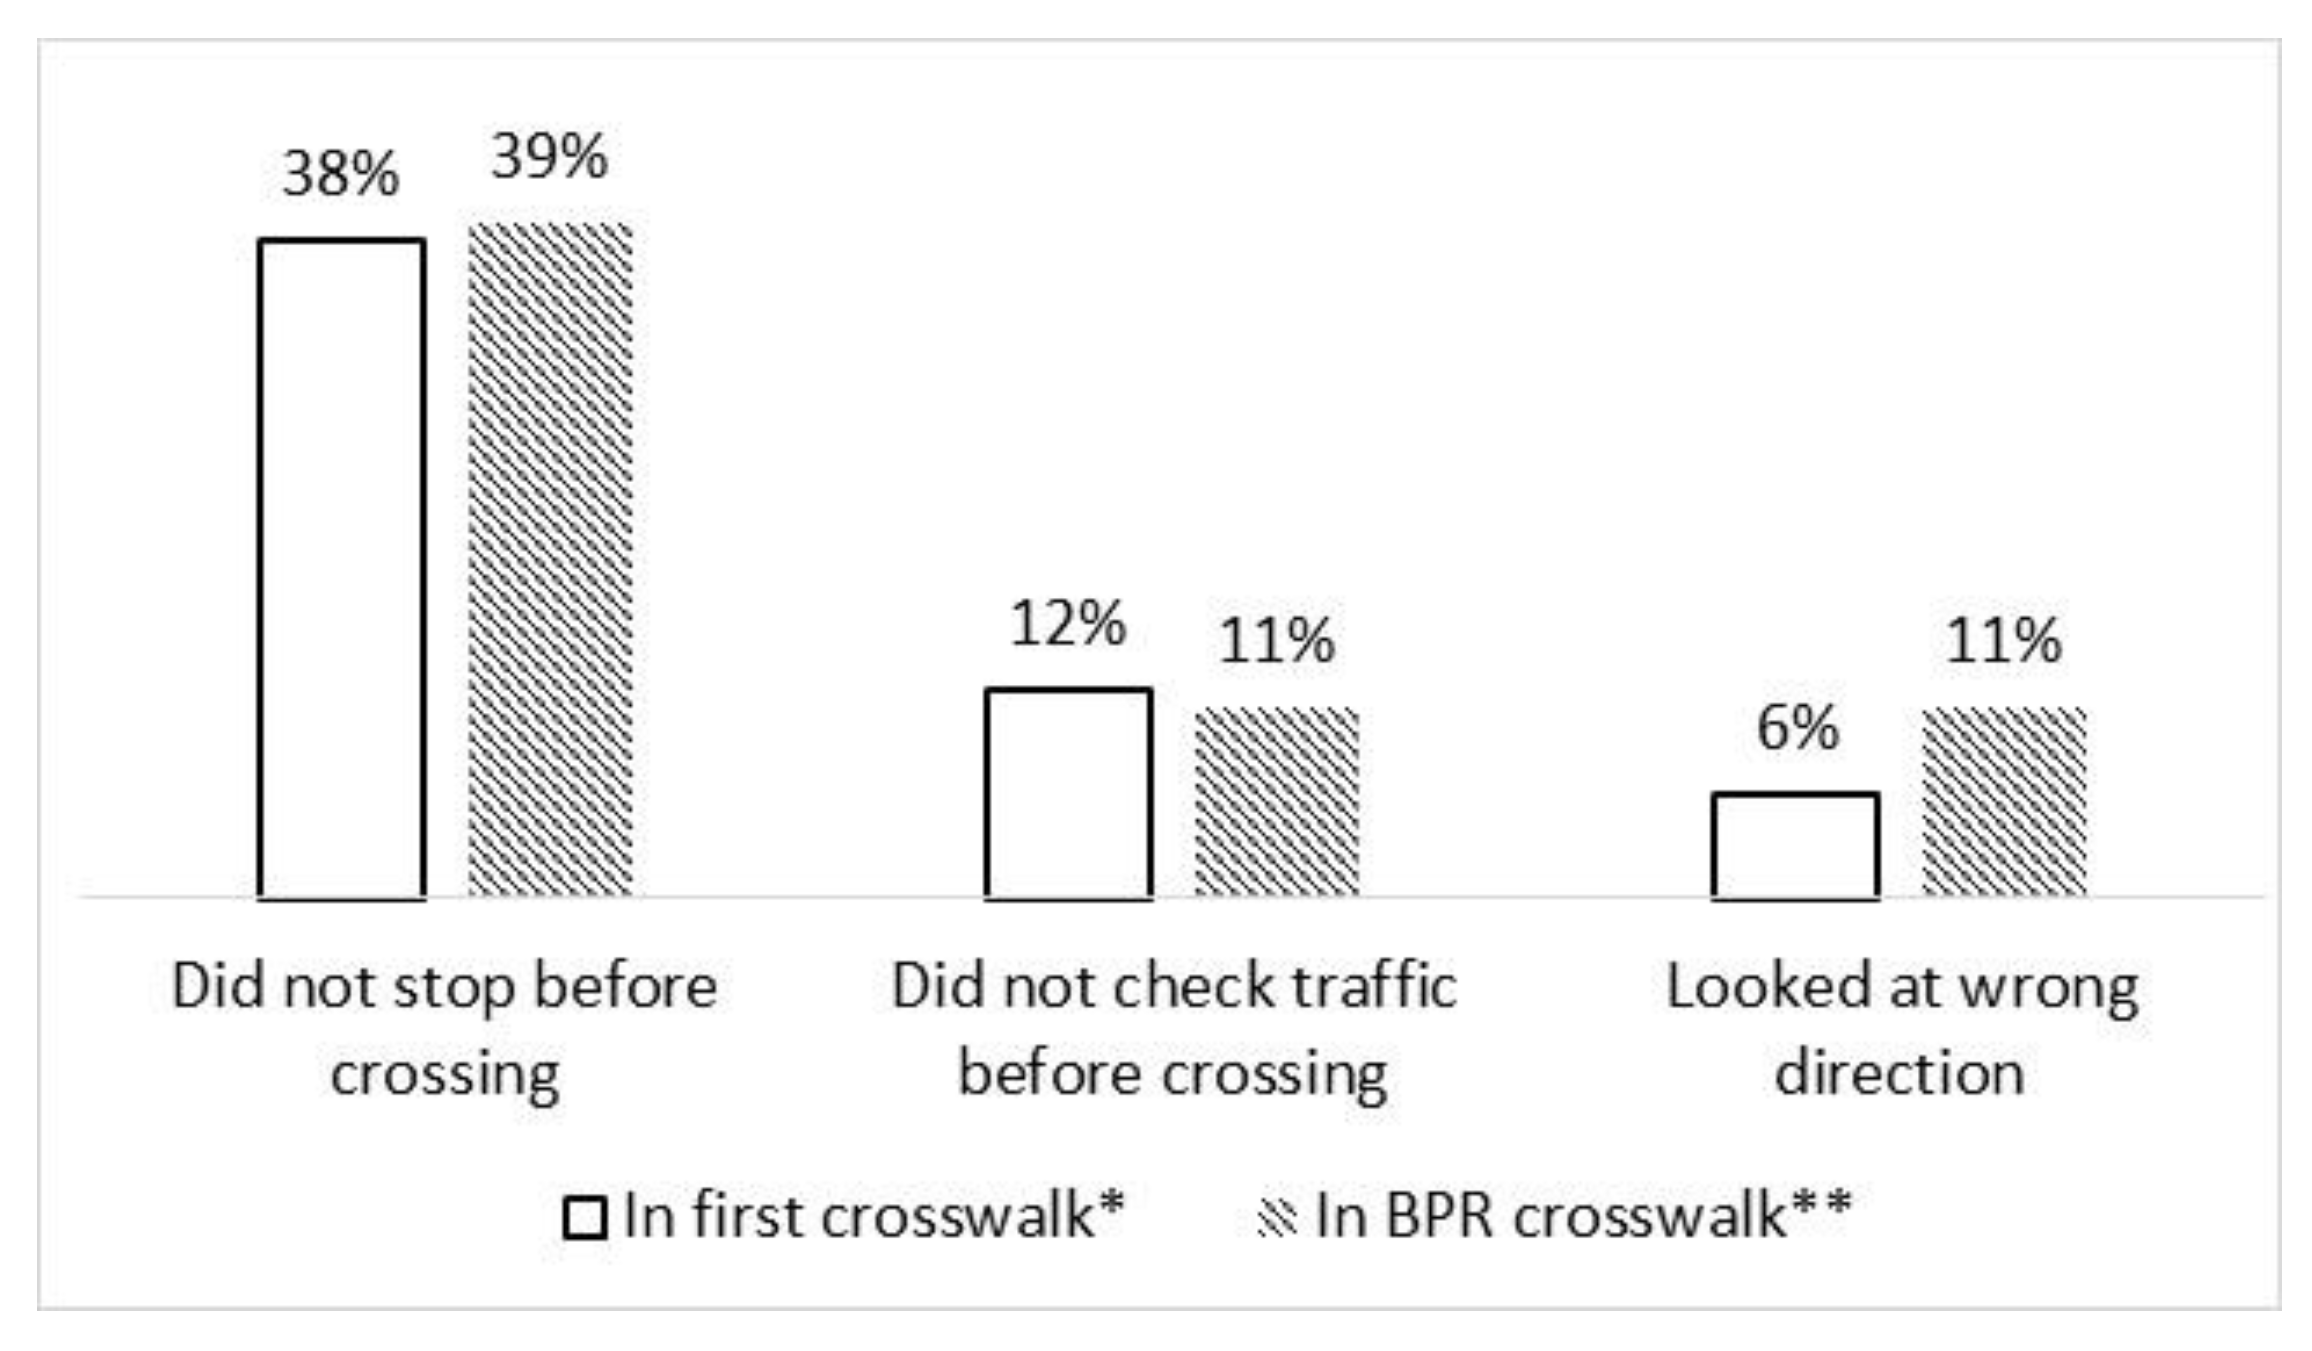
As explained in Section 3, for pedestrians who crossed on red, additional behaviors were recorded, regarding following safety rules, e.g. stopping before crossing, checking vehicle traffic before crossing and looking in the correct direction of approaching traffic. At sites with CL BPRs, particular attention was given to looking in the wrong direction that might characterize the existence of "three-route effect".
Figure 5 illustrates the rates of unsafe behaviors observed among pedestrians, who crossed on red in the first crosswalk and in the BPR crosswalk, at intersections with CL BPRs. One can see that the rates of pedestrians who did not stop and did not check traffic before crossing were similar in both cases: 38%-39% and 11%-12%, respectively, while the rate of pedestrians who looked in the wrong direction tends to be higher at the bus route: 11% vs. 6%; yet, the differences between the two crosswalks were not statistically significant.
Furthermore, the observations showed that at intersections with CS BPRs, among pedestrians who crossed on red in the first crosswalk, 30% did not check traffic before crossing and 5% looked in the wrong direction, while in the second crosswalk such rates were 26% and 6%, respectively (see Table 1). A comparison revealed that in both behaviors the differences between the two types of sites (CL vs. CS) were not statistically significant (at 0.05 level). (To note, the number of pedestrians who looked in the wrong direction at the CS BPR sites was very small, three cases in total).
Figure 5.
Additional unsafe behaviors among pedestrians who crossed on red at intersections with CL BPRs (*N=79, **N=56).
Figure 5.
Additional unsafe behaviors among pedestrians who crossed on red at intersections with CL BPRs (*N=79, **N=56).
A detailed examination of cases at the CL BPR sites indicated that the behaviors of not checking traffic and looking in the wrong direction, when crossing on red, were observed mainly among pedestrians, who crossed to/from the bus stop, and did not appear among pedestrians, who crossed from one to another sidewalk of the intersection. This difference was significant both in the first crosswalk (χ2[2]=7.00, p<0.05) and in the BPR crosswalk (χ2[2]=9.88, p<0.05).
The "three-route effect" manifests in checking the wrong direction of bus/vehicle traffic, and is mainly expected on the second crosswalk, e.g. when a pedestrian crosses a bus route after crossing the vehicle route or when they cross the vehicle route after crossing the BPR. Figure 6 provides an overview of cases observed at the CL BPR sites when pedestrian crossed on red and used at least two consecutive crosswalks; the cases are subdivided according to crossing part, destination and checking vehicle traffic by pedestrians. In total, 12 pedestrians were observed who checked traffic in the wrong direction (10%), which mostly occurred in two scenarios: when crossing the bus route on the way to the bus stop and when crossing a vehicle route on the way from the bus stop. In addition, in 15 cases (13%) pedestrians did not check traffic conditions, which occurred during crossings to or from the bus stop. In contrast, both types of pedestrian errors were not observed among pedestrians who crossed "from side to side" of the intersection.
5. Discussion
In this study, observations of pedestrian behaviors at signalized intersections with bus priority routes were performed aiming to characterize pedestrian red-light crossings and to compare, in this context, between the two common types of BPRs, a centre-lane and a curbside lane. Previous research indicated that pedestrian injury is one of current safety concerns of BPR operation [13,14,15,22,28], while unsafe pedestrian behaviors and particularly crossing on red appear among the main causes of pedestrian accidents at signalized intersections [12,34,35,38]. Moreover, previous research of BPR corridors provided mixed findings concerning accident changes associated with various BPR configurations, while behavior research on the topic is scarce. Thus, the current study aspired to reduce this gap, by conducting observations of pedestrian behaviors at typical intersections with BPRs. Furthermore, the study considered a wide range of factors, which may influence the non-compliance with traffic lights by pedestrians based on the literature [12,36,38,41,45,49], including pedestrian characteristics, crossing conditions and the characteristics of infrastructure settings and traffic at the sites observed. Pedestrian behaviors in the study were analyzed in relation to the intersection structure and crossing destination aiming to contribute to insights into traffic arrangements.
The study found that non-compliance with traffic lights is a common phenomenon at intersections with centre-lane BPRs, where, on average, 30% of pedestrians crossed on red in one or more of the intersection crosswalks. At intersections with curbside BPRs, the pedestrian non-compliance with red-lights was lower, of 11%, on average. To compare, the national observational survey of pedestrian behaviors in Israel revealed [50] that 30% of pedestrians crossed on red at signalized intersections. Therefore, the prevalence of red crossings at intersections with CL BPRs was similar to the national average, while intersections with CS BPRs were associated with a lower risk of crossing on red.
Concerning the factors affecting pedestrian compliance with traffic lights, the study findings indicated that, similar to previous research [45,46,48,49], male pedestrians crossed on red more often than females, elderly pedestrians were more obeying to red lights, while young pedestrians tend to cross on red more frequently than other age groups. In addition, in line with other studies [38,56], it was observed that presence of other pedestrians increased the level of compliance with the red lights, and this effect was consistent and significant at both types of BPR sites and across various study models.
Similar to earlier research [23,56,58], the study found that the level of pedestrian compliance with red-lights is affected by road infrastructure settings. Regarding the impacts of bus stops' location at the intersection (on one or both sides) and the duration of the red-light, this study did not yield significant findings that can be related to the limitations of data collected. The strongest finding of this research was that, having controlled for other explanatory variables, the probability of crossing on red was substantially higher at the intersections with CL BPRs compared to the CS BPR type. Yet, it should be noted that the combined model examined the probability of red crossing in the first crosswalk, which represents a vehicle route with two lanes, in the CL BPR sites, and includes two general traffic lanes and a bus lane, in the CS BPR sites. This means that, in the latter case, there was a longer crossing distance, which might have an enduring effect on pedestrians' tendency to cross on red. At the same time, detailed findings on red crossings at the intersections with CL BPRs showed a higher intention to cross on red on the second and third parts of crosswalks (a bus route and second vehicle route) that supports the higher risk associated with CL BPRs.
Additional explanations of a higher frequency of red-light crossings at CL BPR intersections may be related to a higher presence of refuge islands in the crosswalk settings [57], whereas such crosswalks may be perceived as less dangerous by pedestrians thus leading them to be less hesitant to cross on red, or the need for an additional wait for second (and third) green that may potentially encourage red-light violations [23]. In general, red-light durations were longer at the CL BPR than at the CS BPR intersections in the study, that might increase the probability of a pedestrian to cross on red [12,55,56], yet, a direct impact of this feature was not found in the study.
The study showed that at intersections with CL BPRs, non-compliance with red-lights was more prominent among pedestrians crossing to or from the bus stop relative to those who crossed to another side of the intersection, thus supporting the expectation that crossing destination influences the compliance with traffic lights, in line with findings in [58].
Concerning the effects of using distractive devices by crossing pedestrians, direction of crossing, bus presence at the bus stop and hour of observation, mostly insignificant impacts were found in the study analyses, yet, some models indicated that in later morning hours a higher risk of crossing on red can be expected.
Recent research literature drew attention to the increasing use of mobile phones by pedestrians [51,52], that leads to a decrease in environmental awareness and may stimulate a violation of traffic rules. The current study findings showed that 35% pedestrians at the CL BPR sites and 25% at the CS BPR sites crossed a road while being distracted (used a mobile phone and/or earphones). While the general rate of use is substantial, the study found that, as expected, the frequency of using distracting devices was lower among elderly pedestrians compared to other age groups, at both types of sites. At the CL BPR sites, this behavior was more common among pedestrians who crossed to the other side of the intersection compared to those crossing to or from a bus stop. However, it was not associated with a significant change in the probability of crossing on red, actually indicating a decreasing trend.
Among pedestrians who crossed on red at the intersections with CL BPRs, about 40% did not stop before crossing, and over 10% did not check the traffic before crossing. The latter rate was comparable with findings of the national observational survey of pedestrian behaviors at signalized intersections [50]. At the intersections with CS BPRs, among pedestrians crossing on red, the observed rates of not checking the traffic were higher but the differences related to the CL BPR sites were not statistically significant due to small data samples (of red crossings).
Regarding the "three-route-effect" at intersections with CL BPRs, which may increase accident risk due to looking at a wrong traffic direction by pedestrians who cross on red [23,32], the study provided an empirical estimate that it appeared in 10% of cases (when pedestrians crossed on red at the CL BPR sites). However, pedestrian errors in checking the direction of traffic were mainly observed in situations where pedestrians crossed to or from the bus stops, and not when crossing the entire road width from sidewalk to sidewalk. This finding suggests that the occurrence of such errors may also be influenced by other factors not measured in the study, such as being in a hurry to reach the bus stop on time, pedestrian's familiarity with the intersection, etc. In addition, in this behavior, a statistically significant difference between the two types of BPRs (CL vs. CS) was not ascertained, hence, the presence of the "three-route-effect" at intersections with CL BPRs still needs to be proven. Evidently, further research is needed to understand this behavior more comprehensively.
In summary, the study demonstrated that signalized intersections with CL BPRs impose increased safety risks, as pedestrian non-compliance with red lights at such sites was significantly higher compared to intersections with CS BPRs. At the same time, while comparing the safety performance of two types of BPRs one cannot ignore the findings of previous studies which analyzed accident data and found that, under certain conditions, centre-lane BPRs were associated with lower accident rates compared to other BPR forms [12,15,28]. Furthermore, current global and local knowledge summaries on BPR design promote the use of both types of BPRs [9,10,12,13,63].
The study limitations lie in the relatively small samples of pedestrians crossing on red that were collected in observations, which restricted the ability to ascertain the effects of some factors examined in the study. The explanatory power of multivariate models fitted in the study was relatively low, indicating the possibility that other factors rather than those measured in the study might affect the behavior considered. The data collection in the study was performed by trained observers that enabled a coverage of characteristics related to pedestrian behaviors and crossing conditions, across various parts of the observation sites. Conversely, this method is constrained by the hours of data collection and the extent of details that can be documented at a given time. The study examined a predefined list of variables that, based on previous research, were expected to affect pedestrian behaviors at signalized intersections. Among other potentially influential variables that were not measured in this study can be mentioned: general vehicle traffic volumes, bus arrival times, pedestrian waiting times, environmental characteristics of intersections, etc. Further research is needed to explore the effects of additional factors on risky pedestrian behaviors at signalized intersections with BPRs.
6. Conclusions
In light of the growing development of bus priority routes in urban areas and associated safety concerns, in this study, pedestrian crossing behaviors were examined at intersections with two common types of BPRs, in Israel. The study found that centre-lane BPR intersections are characterized by a higher safety risk, in terms of non-compliance with red lights by pedestrians, relative to intersections with curbside BPRs. Furthermore, the tendency to cross on red was higher among pedestrians crossing to or from the bus stop, males and young pedestrians but lower under the presence of other waiting pedestrians. Among pedestrians who crossed on red at intersections with centre-lane BPRs, non-negligible shares did not stop before crossing, did not check the traffic and checked the traffic in the wrong direction, thus, further increasing the risk. Overall, the observational study provided useful insights regarding the human factor's involvement in creating safety risks at BPR sites that may assist road designers and decision-makers in future planning of BPRs.
Practical implications of this study may involve considering infrastructure solutions that might reduce the intention to cross on red, thereby improving pedestrian safety at intersections with CL BPRs. Such solutions may include, for example, implementing a green wave for crossing pedestrians and reducing waiting times, or improving the intersection design by arranging crosswalks consisting of two parts instead of three by removing one of the refuge islands. However, each solution should undergo an evaluation of impacts on pedestrian behaviors and the safety performance of intersections with BPRs. In addition, recognizing a rapid extension of BPRs in the country, education and awareness programs for pedestrians should be promoted to emphasize the heightened risk of crossing on red at intersections with bus priority routes.
Author Contributions
Conceptualization, V.G. and A.S.; literature survey, A.S. and V.G.; methodology, A.S. and V.G.; software, A.S.; validation, A.S. and V.G.; formal analysis, A.S.; writing—original draft preparation, V.G.; writing—review and editing, V.G. and A.S.; visualization, V.G.; project administration, A.S. All authors have read and agreed to the published version of the manuscript.
Funding
This study was commissioned by the National Road Safety Authority (NRSA) of Israel.
Institutional Review Board Statement
not applicable.
Informed Consent Statement
not applicable.
Data Availability Statement
The database prepared in this study can be provided upon request.
Acknowledgments
The authors thank Maria Cohen-Etgar, former chief engineer of the NRSA, for her insightful contribution during the planning phase of this study, and Alexander Troitsky, from the NRSA research division, for his great assistance in the preparation of the study observations.
Conflicts of Interest
The authors declare no conflicts of interest. The funders had no role in the design of the study; in the collection, analyses, or interpretation of data; in the writing of the manuscript; or in the decision to publish the results.
References
- Organisation for Economic Co-operation and Development (OECD), 2007. Managing urban traffic congestion. Organisation for Economic Co-operation and Development, European Conference of Ministers of Transport.
- UITP, 2017. Statistics brief, urban public transport in the 21st century. The International Association of Public Transport (UITP).
- Paganelli, F., 2020. Urban Mobility and Transportation. In: Filho, W.L., Azul, A.M., Brandli, L. et al., Sustainable cities and communities. Encyclopedia of the UN Sustainable Development Goals. Springer International Publishing, 887-899.
- Rupprecht Consult, 2019. Guidelines for developing and implementing a Sustainable Urban Mobility Plan, 2nd ed.; Forschung, B.G., ed.; Cologne, Germany: Rupprecht Consult.
- Smart Growth America, 2023. Accessed on November 10, 2023. https://smartgrowthamerica.org/what-is-smart-growth/.
- Ministry of Transport (MOT), 2012. Strategic program for public transport development. Ministry of Transport, Israel.
- Planning Administration, 2020. Basic principles for public transportation' and sustainable traffic' biased planning - criteria for submitting plans to planning institutions. Planning Administration, Jerusalem, Israel. https://www.gov.il/he/departments/general/planning_public_transp_sustainable_mov.
- Transit Cooperative Research Program (TCRP), 2007. Bus rapid transit practitioner's guide. TCRP report 118, Transit Cooperative Research Program, Washington, D.C.
- Institute for Transportation & Development Policy (ITDP), 2007. Bus rapid transit planning guide. Institute for Transportation & Development Policy, New York, USA.
- Panera, M., Shin, H., Zerkin, A., Zimmerman, S., 2012. Peer-to-peer information exchange on bus rapid transit and bus priority practices. FTA report 009, Federal Transit Administration, US Department of Transportation.
- Levinson, H., Zimmerman, S., Clinger, J., Rutherford, S., Smith, R. L., Cracknell, J., Soberman, R., 2003. Bus Rapid Transit: case studies in Bus Rapid Transit. TCRP Report 90, Volume I. Transportation Research Board of the National Academies, Washington, D.C.
- Duduta, N., Adriazola-Steli, K., Wass, C., Hidlago, D., Lindau L.-A., John, V.-S., 2014. Traffic safety on bus priority systems. Recommendations for integrating safety into the planning, design and operation of major bus routes. World Resources Institute, Washington, DC.
- National Academies of Sciences, Engineering, and Medicine (NASEM), 2023. Pedestrian and Bicycle Safety in Bus Rapid Transit and High-Priority Bus Corridors. Washington, DC: The National Academies Press. [CrossRef]
- Gitelman, V., Carmel, R., Korchatov, A., 2018. Assessing safety implications of bus priority systems: a case-study of a new BRT system in the Haifa metropolitan area. In: Advances in transport policy and planning. Preparing for the new era of transport policies: learning from experience, Vol. 1, 63-91.
- Duduta, N., Adriazola, C., Hidalgo, D., Lindau, L. A., Jaffe, R., 2015. Traffic safety in surface public transport systems: a synthesis of research. Public Transport 7(2), 121-137. [CrossRef]
- Ingvardson, J. B., & Nielsen, O. A., 2018. Effects of new bus and rail rapid transit systems – an international review. Transport Reviews 38(1), 96-116. [CrossRef]
- Litman, T., 2022. A new traffic safety paradigm. Victoria Transport Policy Institute. https://www.vtpi.org/ntsp.pdf.
- European Commission (EC), 2016. Traffic safety facts on heavy goods vehicles and buses. European Commission, Directorate General for Transport.
- Temurhan, M., Stipdonk, H., 2019. Coaches and road safety in Europe. An indication based on available data 2007-2016. Report R-2019-11. SWOV Institute of Road Safety Research, the Netherlands.
- National Road Safety Authority (NRSA), 2016. The relationship between public transport use and road safety: the situation in Israel and solutions for improving the safety of vulnerable road users. National Road Safety Authority, Jerusalem, Israel.
- Stimpson, J.P., Wilson, F.A., Araz, O.M. and Pagan J.A., 2014. Share of mass transit miles traveled and reduced motor vehicle fatalities in major cities of the United States. Journal of Urban Health 91(6), 1136-1143. [CrossRef]
- Duduta, N., Adrizola, C., Hidalgo, D., Lindau, L. A., Jaffe, R., 2012. Understanding road safety impact of high-performance Bus Rapid Transit and busway design features. Transportation Research Record 2317, 8-14. [CrossRef]
- Gitelman, V., Carmel, R., Doveh, E., Hakkert, S., 2017. Exploring safety impacts of pedestrian crossing configurations at signalized junctions on urban roads with public transport routes. International Journal of Injury Control and Safety Promotion 25(1), 31-40. [CrossRef]
- Goh, K.C.K., Currie, G., Sarvi, M., Logan, D., 2013. Investigating the road safety impacts of bus rapid transit priority measures. Transportation Research Record 2352, 41-49. [CrossRef]
- Goh, K.C.K., Currie, G., Sarvi, M., Logan, D., 2014. Bus accident analysis of routes with/without bus priority. Accident Analysis & Prevention 65, 18-27. [CrossRef]
- Elvik, R., Hoya, A., Vaa, T., Sorensen, M., 2009. The handbook of road safety measures, 2nd ed. Emerald.
- Bia, E. M., and Ferenchak, N. N., 2022. Impact of Bus Rapid Transit construction and infrastructure on traffic safety: a case study from Albuquerque, New Mexico. Transportation Research Record 2676 (9), 110–119. [CrossRef]
- Gitelman, V., Korchatov, A., Elias, W., 2020. An examination of the safety impacts of bus priority routes in major Israeli cities. Sustainability 2020(12), 8617;. [CrossRef]
- Chen, L., Chen, C., Ewing, R., McKnight, C.E., Srinivasan, R., Roe, M., 2013. Safety countermeasures and crash reduction in New York City – Experience and lessons learned. Accident Analysis and Prevention, 50, 312-322. [CrossRef]
- Tse, L. Y, Hung, W. T., Sumalee, A., 2014. Bus lane safety implications: a case study in Hong Kong. Transportmetrica A: Transport Science, 10(2), 140–159. [CrossRef]
- Bocarejo, J. P., Velasquez, J. M., Diaz, C. A., Tafur, L. E., 2012. Impact of BRT systems on road safety: lessons from Bogota. Transportation Research Record 2317, 1-7.
- Ministry of Transport (MOT), 2013. Safety of bus routes. Recommendations of a commission assigned by the general manager of the Ministry of Transport, Jerusalem, Israel.
- Yefe Nof, 2013. Safety audits of bus priority routes in the BRT system of the Haifa metropolitan area: findings from field surveys, pre-opening stage. Summary report submitted to the Yefe Nof Co., Haifa, Israel.
- Martin, A., 2006. Factors influencing pedestrian safety: a literature review. TRL limited.
- Smiley, A., 2015. Human factors in traffic safety. Lawyers & Judges Publishing Company, Inc., Tucson, Arizona.
- Mead, J., Zegeer, C., and Bushell, M., 2014. Evaluation of pedestrian-related roadway measures: a summary of available research. Report DTFH61-11-H-00024. Federal Highway Administration, Washington, DC.
- Koh, P.P., Wong, Y.D., Chandrasekar, P., 2014. Safety evaluation of pedestrian behaviour and violations at signalized pedestrian crossings. Safety Science 70, 143–152. [CrossRef]
- Dommes, A., Granié, M. A., Cloutier, M. S., Coquelet, C., & Huguenin-Richard, F., 2015. Red light violations by adult pedestrians and other safety-related behaviors at signalized crosswalks. Accident Analysis & Prevention 80, 67-75. . [CrossRef]
- Dewar R., & Olson P., 2007. Human Factors in Traffic Safety, second ed. Lawyers and Judges Publishing Co., Tucson, Arizona.
- Liu, Y. C., & Tung, Y. C., 2014. Risk analysis of pedestrians’ road-crossing decisions: Effects of age, time gap, time of day, and vehicle speed. Safety Science 63, 77-82. [CrossRef]
- Shinar, D., 2017. Traffic safety and human behavior. Emerald Publishing Limited.
- Schwebel, D. C., Davis, A. L., and O’Neal, E. E., 2012. Child pedestrian injury: A review of behavioral risks and preventive strategies. American Journal of Lifestyle Medicine 6(4), 292-302. [CrossRef]
- Meir, A., Oron-Gilad, T., and Parmet, Y., 2015. Are child-pedestrians able to identify hazardous traffic situations? Measuring their abilities in a virtual reality environment. Safety Science 80, 33-40. [CrossRef]
- Gitelman, V., Levi, S., Carmel, R., Korchatov, A., Hakkert, S., 2019. Exploring patterns of child pedestrian behaviors at urban intersections. Accident Analysis and Prevention 122, 36-47. [CrossRef]
- Guo, H., Gao, Z., Yang, X., & Jiang, X., 2011. Modeling pedestrian violation behavior at signalized crosswalks in China: A hazards-based duration approach. Traffic Injury Prevention, 12(1), 96-103. . [CrossRef]
- Ren, G., Zhou, Z., Wang, W., Zhang, Y., & Wang, W., 2011. Crossing behaviors of pedestrians at signalized intersections: observational study and survey in China. Transportation Research Record 2264, 65-73. . [CrossRef]
- Levi, S., Gitelman, V., Prihed, I., and Laor, Y., 2015. Study of travel patterns and safety of child pedestrians in municipalities. Beterem - Safe Kids Israel.
- Hamed, M. M., 2001. Analysis of pedestrians’ behavior at pedestrian crossings. Safety Science 38(1), 63-82. . [CrossRef]
- Rosenbloom, T., 2009. Crossing at a red light: Behaviour of individuals and groups. Transportation Research Part F: Traffic Psychology and Behaviour 12, 389-394. . [CrossRef]
- Sharon, A., 2019. Pedestrian behaviors at crosswalks: national observational survey 2018. National Road Safety Authority, Jerusalem, Israel.
- Nasar, J., Hecht, P., & Wener, R., 2008. Mobile telephones, distracted attention, and pedestrian safety. Accident Analysis and Prevention 40, 69–75. [CrossRef]
- Lin, M. I. B., & Huang, Y. P., 2017. The impact of walking while using a smartphone on pedestrians’ awareness of roadside events. Accident Analysis & Prevention 101, 87-96. . [CrossRef]
- Luukkanen, L., 2003. Safety management system and transport safety performance indicators in Finland. Liikenneturva - Central Organization for Traffic Safety in Finland.
- Liikenneturva, 2021. Liikennekäyttäytymisen seuranta.
- Van Houten, R., Ellis, R., & Kim, J. L., 2007. Effects of various minimum green times on percentage of pedestrians waiting for midblock “walk” signal. Transportation Research Record 2002, 78-83. . [CrossRef]
- Brosseau, M., Zangenehpour, S., Saunier, N., & Miranda-Moreno, L., 2013. The impact of waiting time and other factors on dangerous pedestrian crossings and violations at signalized intersections: A case study in Montreal. Transportation Research Part F: Traffic Psychology and Behaviour 21, 159-172. . [CrossRef]
- De Lavalette, B. C., Tijus, C., Poitrenaud, S., Leproux, C., Bergeron, J., & Thouez, J. P., 2009. Pedestrian crossing decision-making: A situational and behavioral approach. Safety Science 47, 1248-1253. . [CrossRef]
- Kruszyna, M., & Rychlewski, J., 2013. Influence of approaching tram on behaviour of pedestrians in signalised crosswalks in Poland. Accident Analysis & Prevention, 55, 185-191.. [CrossRef]
- Pelé, M., Deneubourg, J. L., & Sueur, C., 2019. Decision-making processes underlying pedestrian behaviors at signalized crossing: Part 1. The first to step off the kerb. Safety 5(4), 79. . [CrossRef]
- Van Houten, R., Retting, R., Farmer, C., & Van Houten, J., 2000. Field evaluation of a leading pedestrian interval signal phase at three urban intersections. Transportation Research Record 1734 (1), 86-92.
- Gitelman V., Carmel R. and Pesahov F., 2020. Evaluating impacts of a leading pedestrian signal on pedestrian crossing conditions at signalized urban intersections: a field study. Frontiers in Sustainable Cities 2:45. [CrossRef]
- Ministry of Transport (MOT), 1998. Guidelines for designing public transport lanes. Transport planning department, Ministry of Transport, Jerusalem, Israel.
- Ministry of Transport (MOT), 2018. Guidelines for designing Bus Rapid Transport (BRT) lanes. Transport planning department, Ministry of Transport, Jerusalem, Israel.
- Jekel, J. F., Katz, D. L., Elmore, J. G., and Wild, D., 2007. Epidemiology, biostatistics and preventive medicine. Elsevier Health Sciences.
- Fleiss, J. L., Levin, B., & Paik, M. C., 2013. Statistical methods for rates and proportions, third ed. John Wiley & Sons.
- Smith, T. J., & McKenna, C. M., 2013. A comparison of logistic regression pseudo R2 indices. Multiple Linear Regression Viewpoints 39(2), 17-26..
Figure 1.
Examples of intersections with bus priority routes: (a) centre-lane bus route, (b) curbside bus lane. (Yellow narrows indicate the directions of bus traffic).
Figure 1.
Examples of intersections with bus priority routes: (a) centre-lane bus route, (b) curbside bus lane. (Yellow narrows indicate the directions of bus traffic).
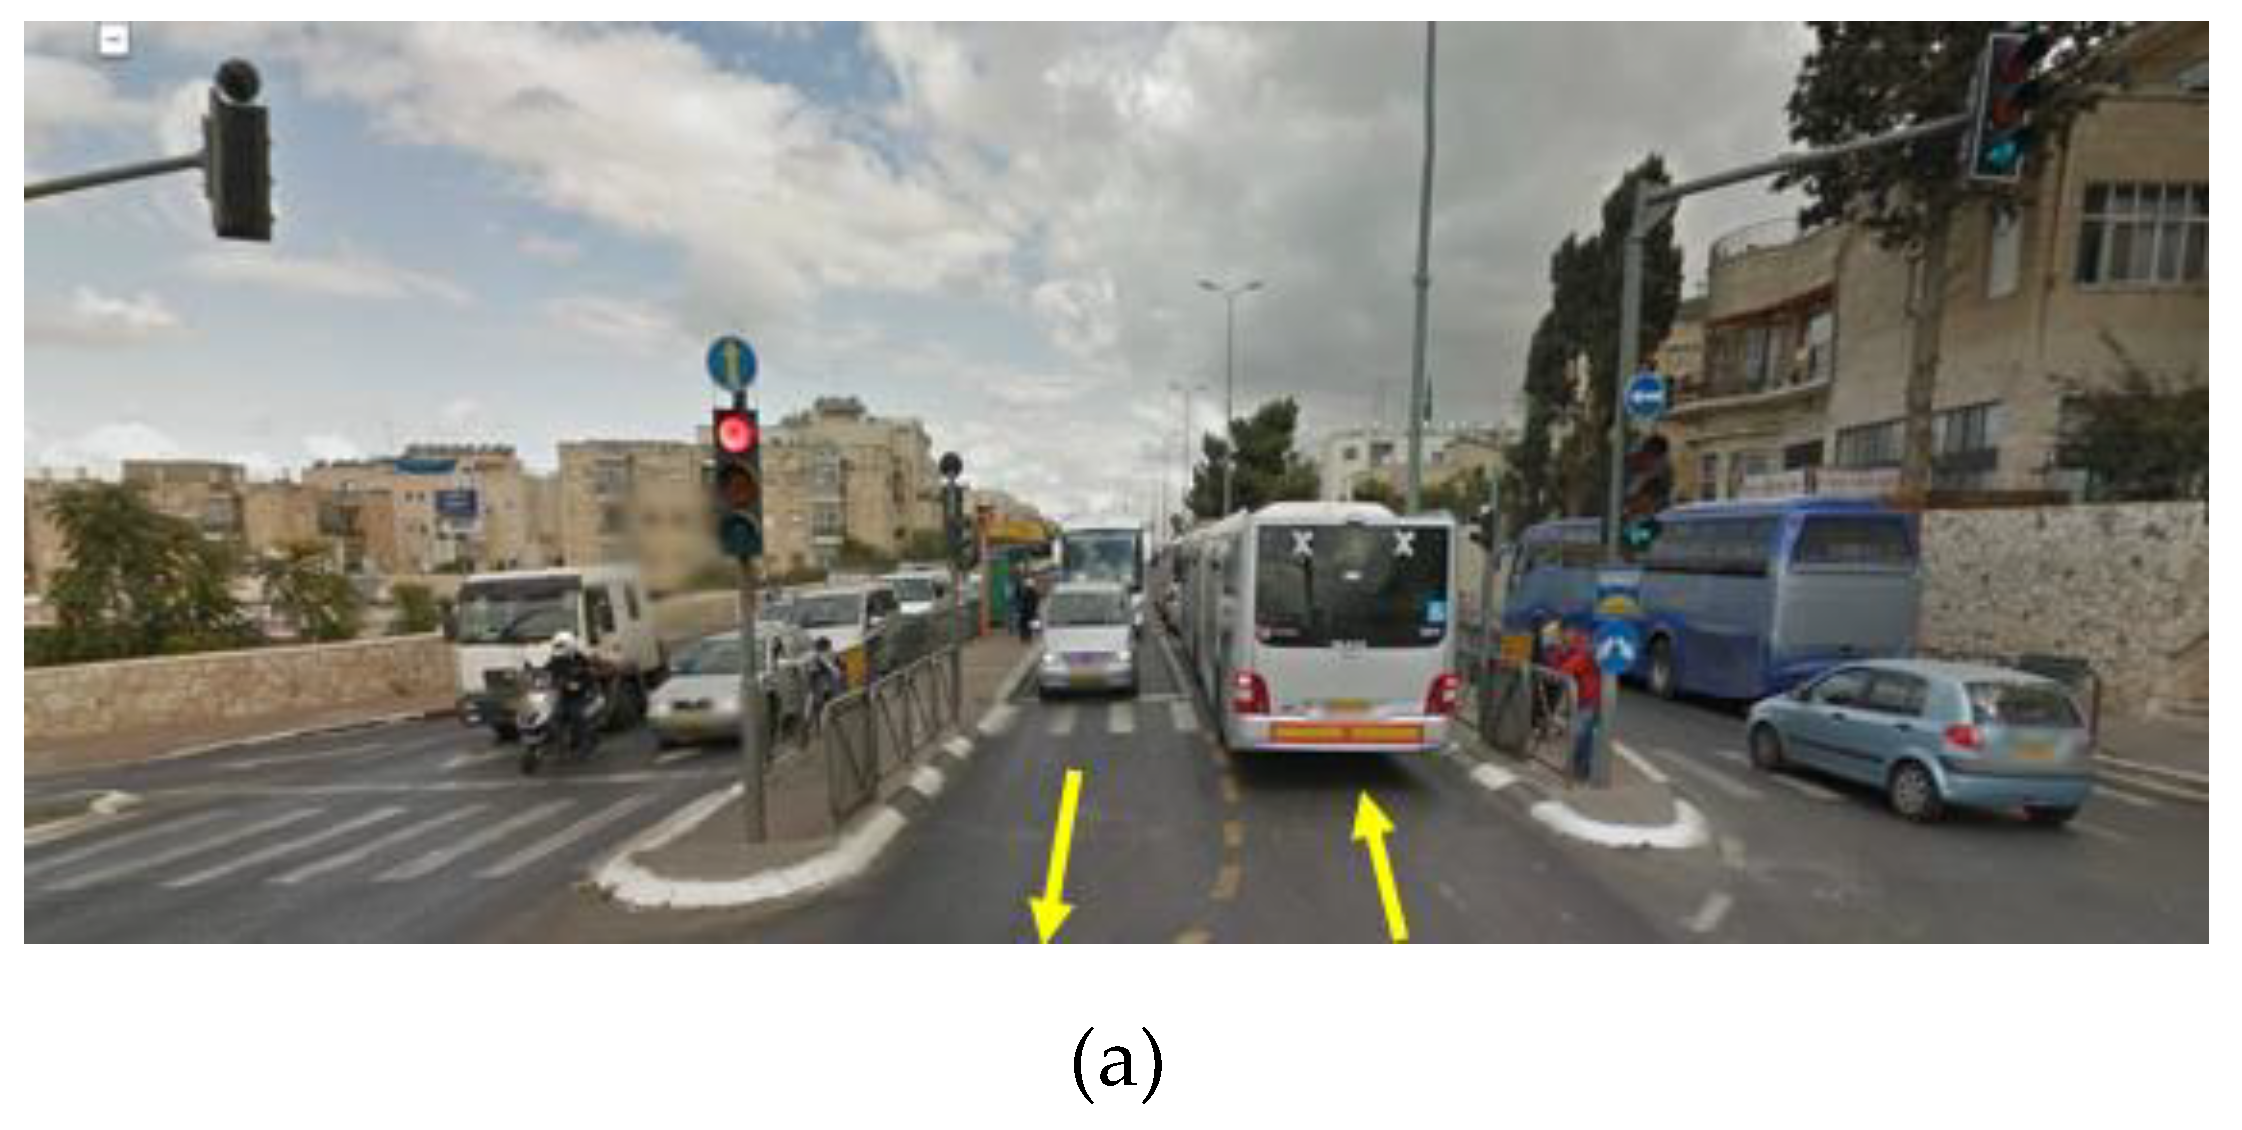
Figure 2.
Illustration of the "three-route effect" when crossing intersection with a CL BPR.
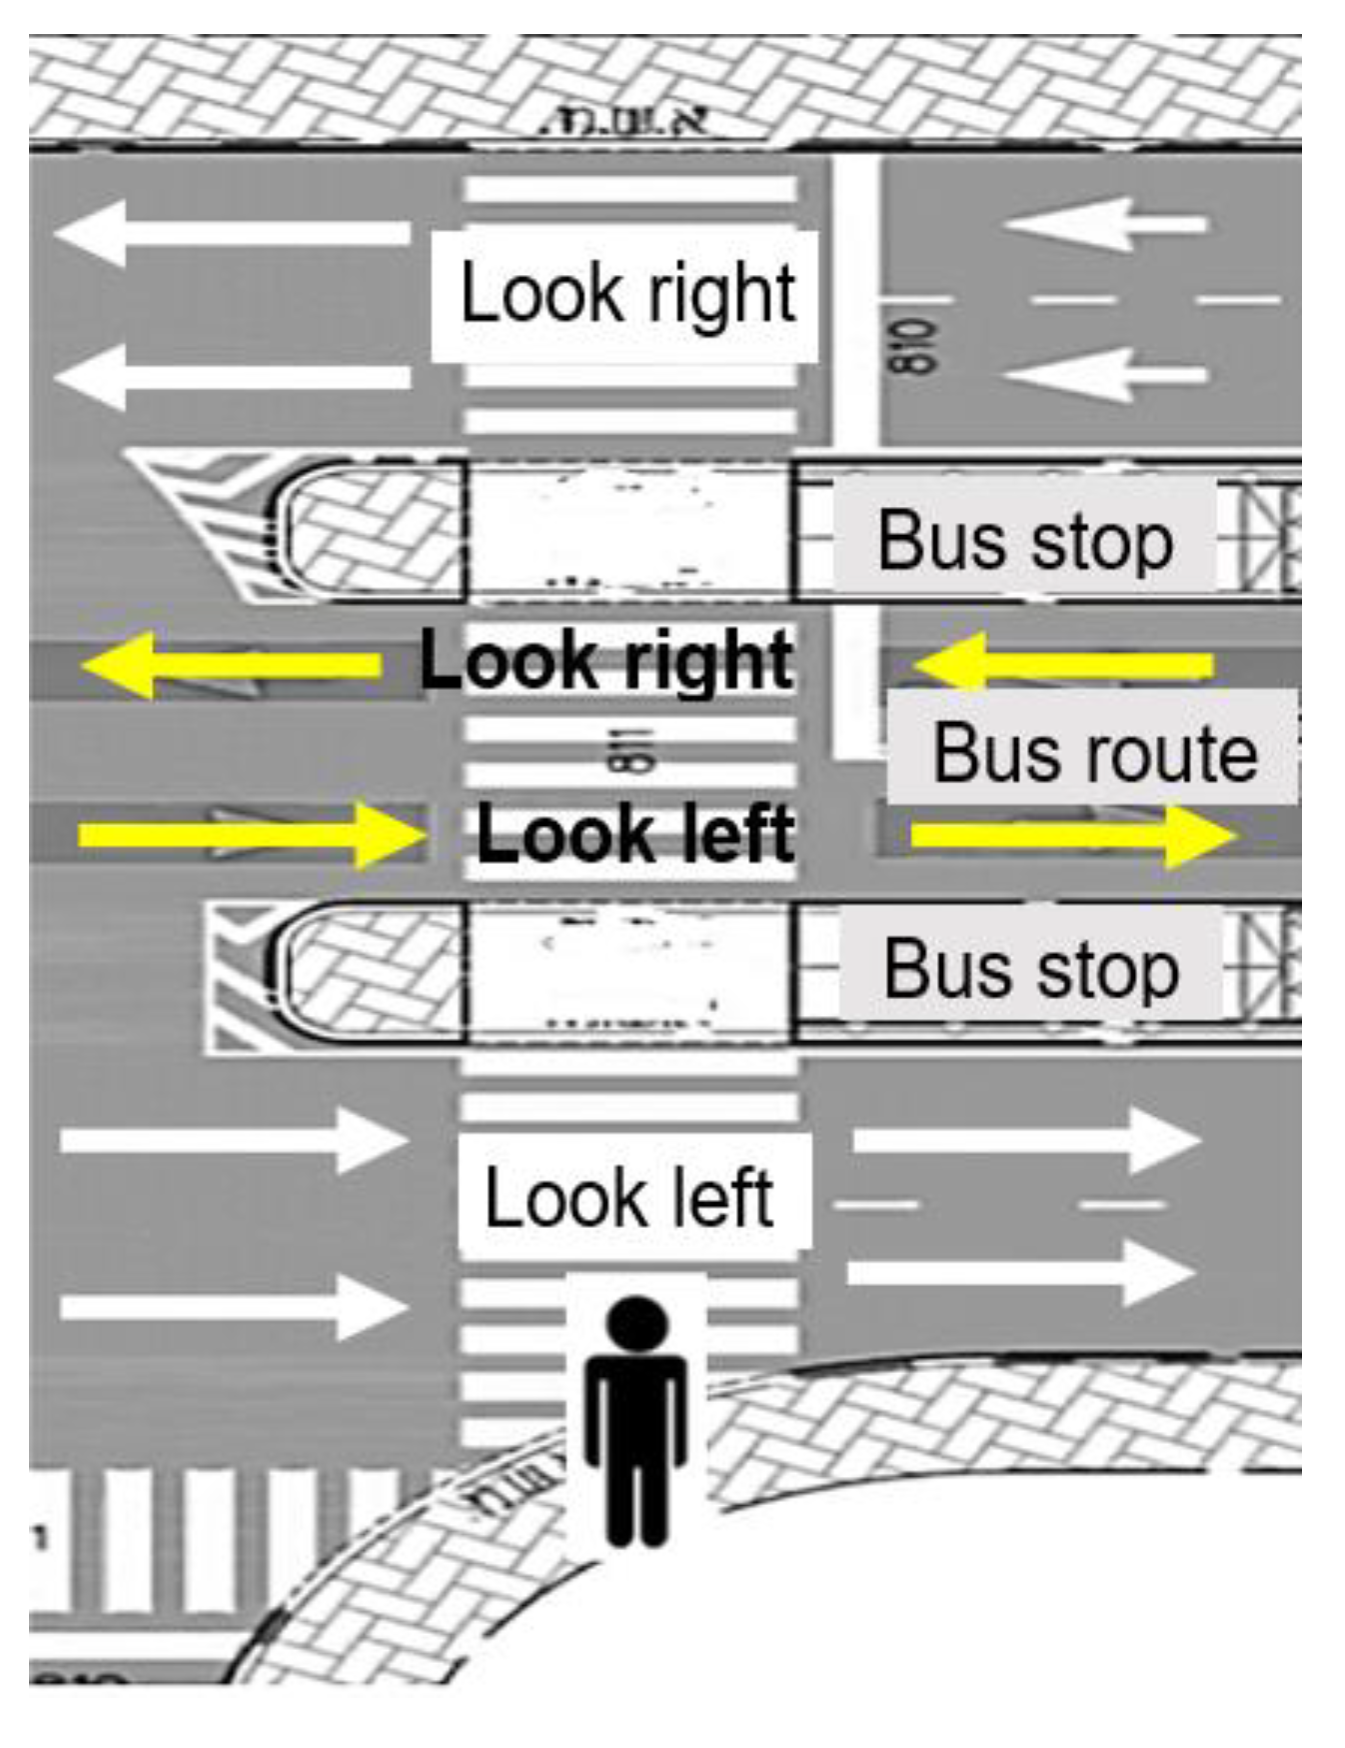
Figure 3.
Definition of crossing destinations at intersections with CL BPRs (bus stops' location on one side of the intersection).
Figure 3.
Definition of crossing destinations at intersections with CL BPRs (bus stops' location on one side of the intersection).
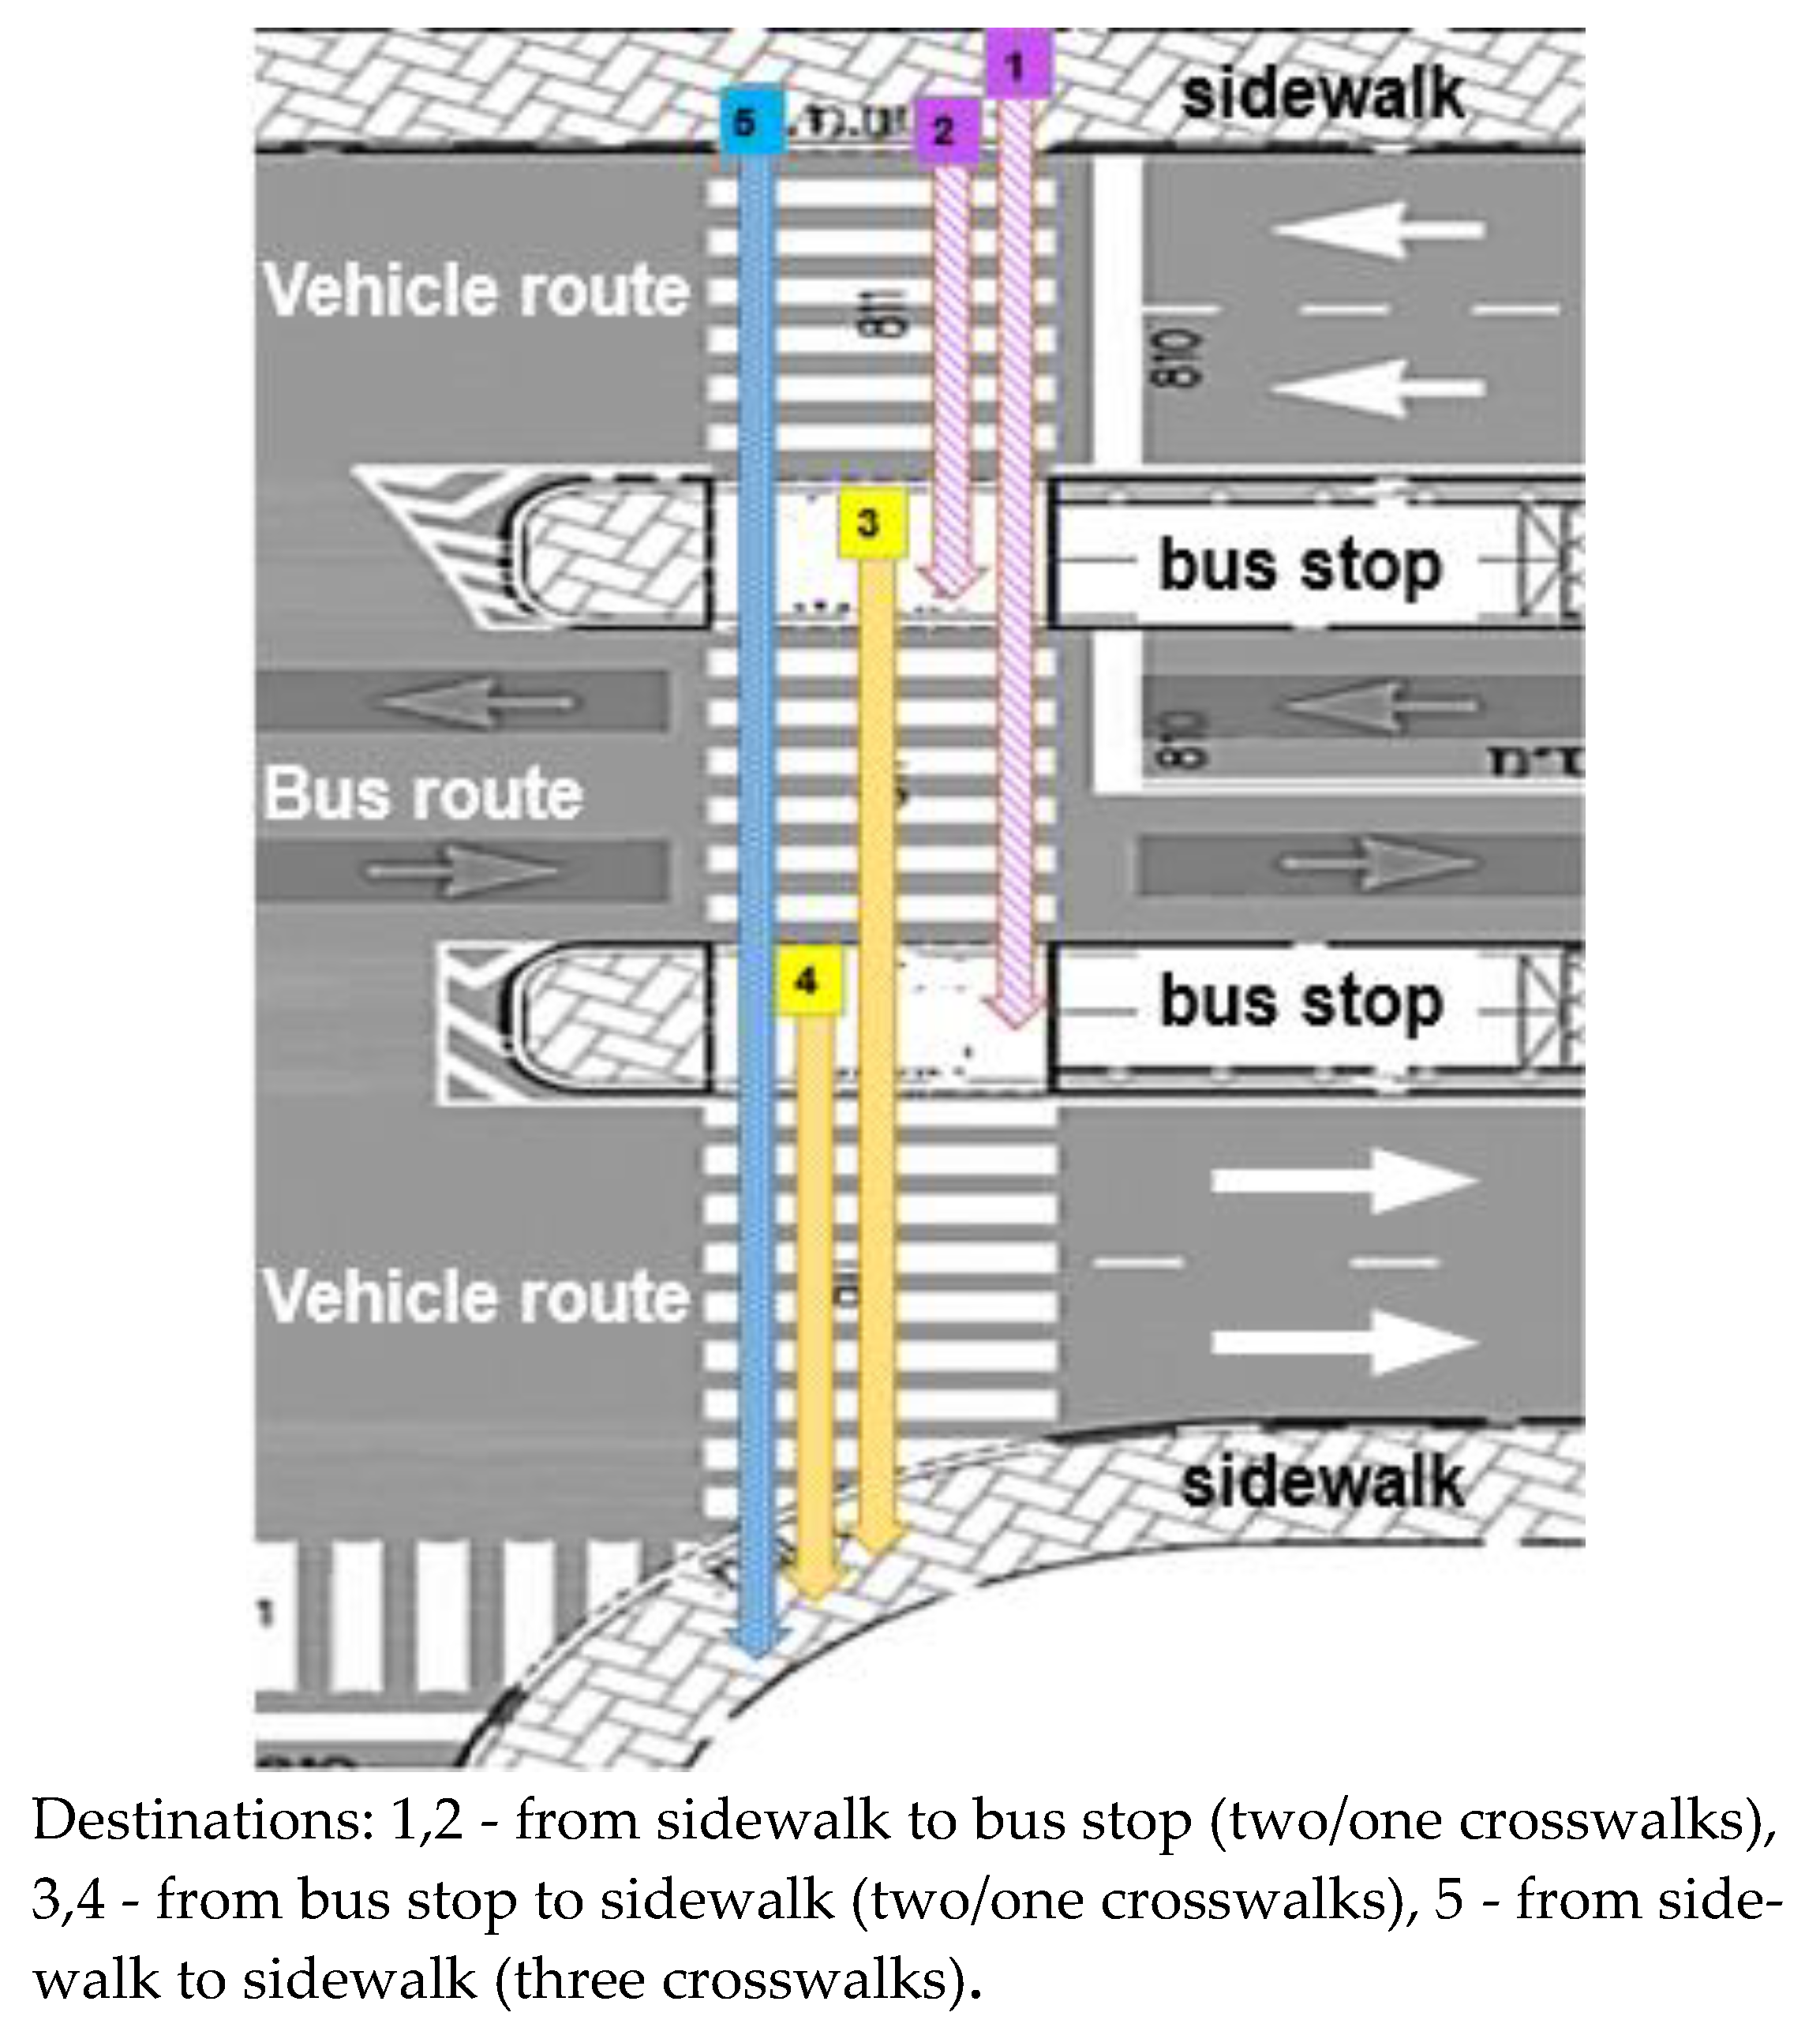
Figure 6.
Subdivision of pedestrians who crossed on red at CL BPRs, by crossing part, destination and checking traffic before crossing (N=113; in parentheses, destination types 1-5 are indicated).
Figure 6.
Subdivision of pedestrians who crossed on red at CL BPRs, by crossing part, destination and checking traffic before crossing (N=113; in parentheses, destination types 1-5 are indicated).
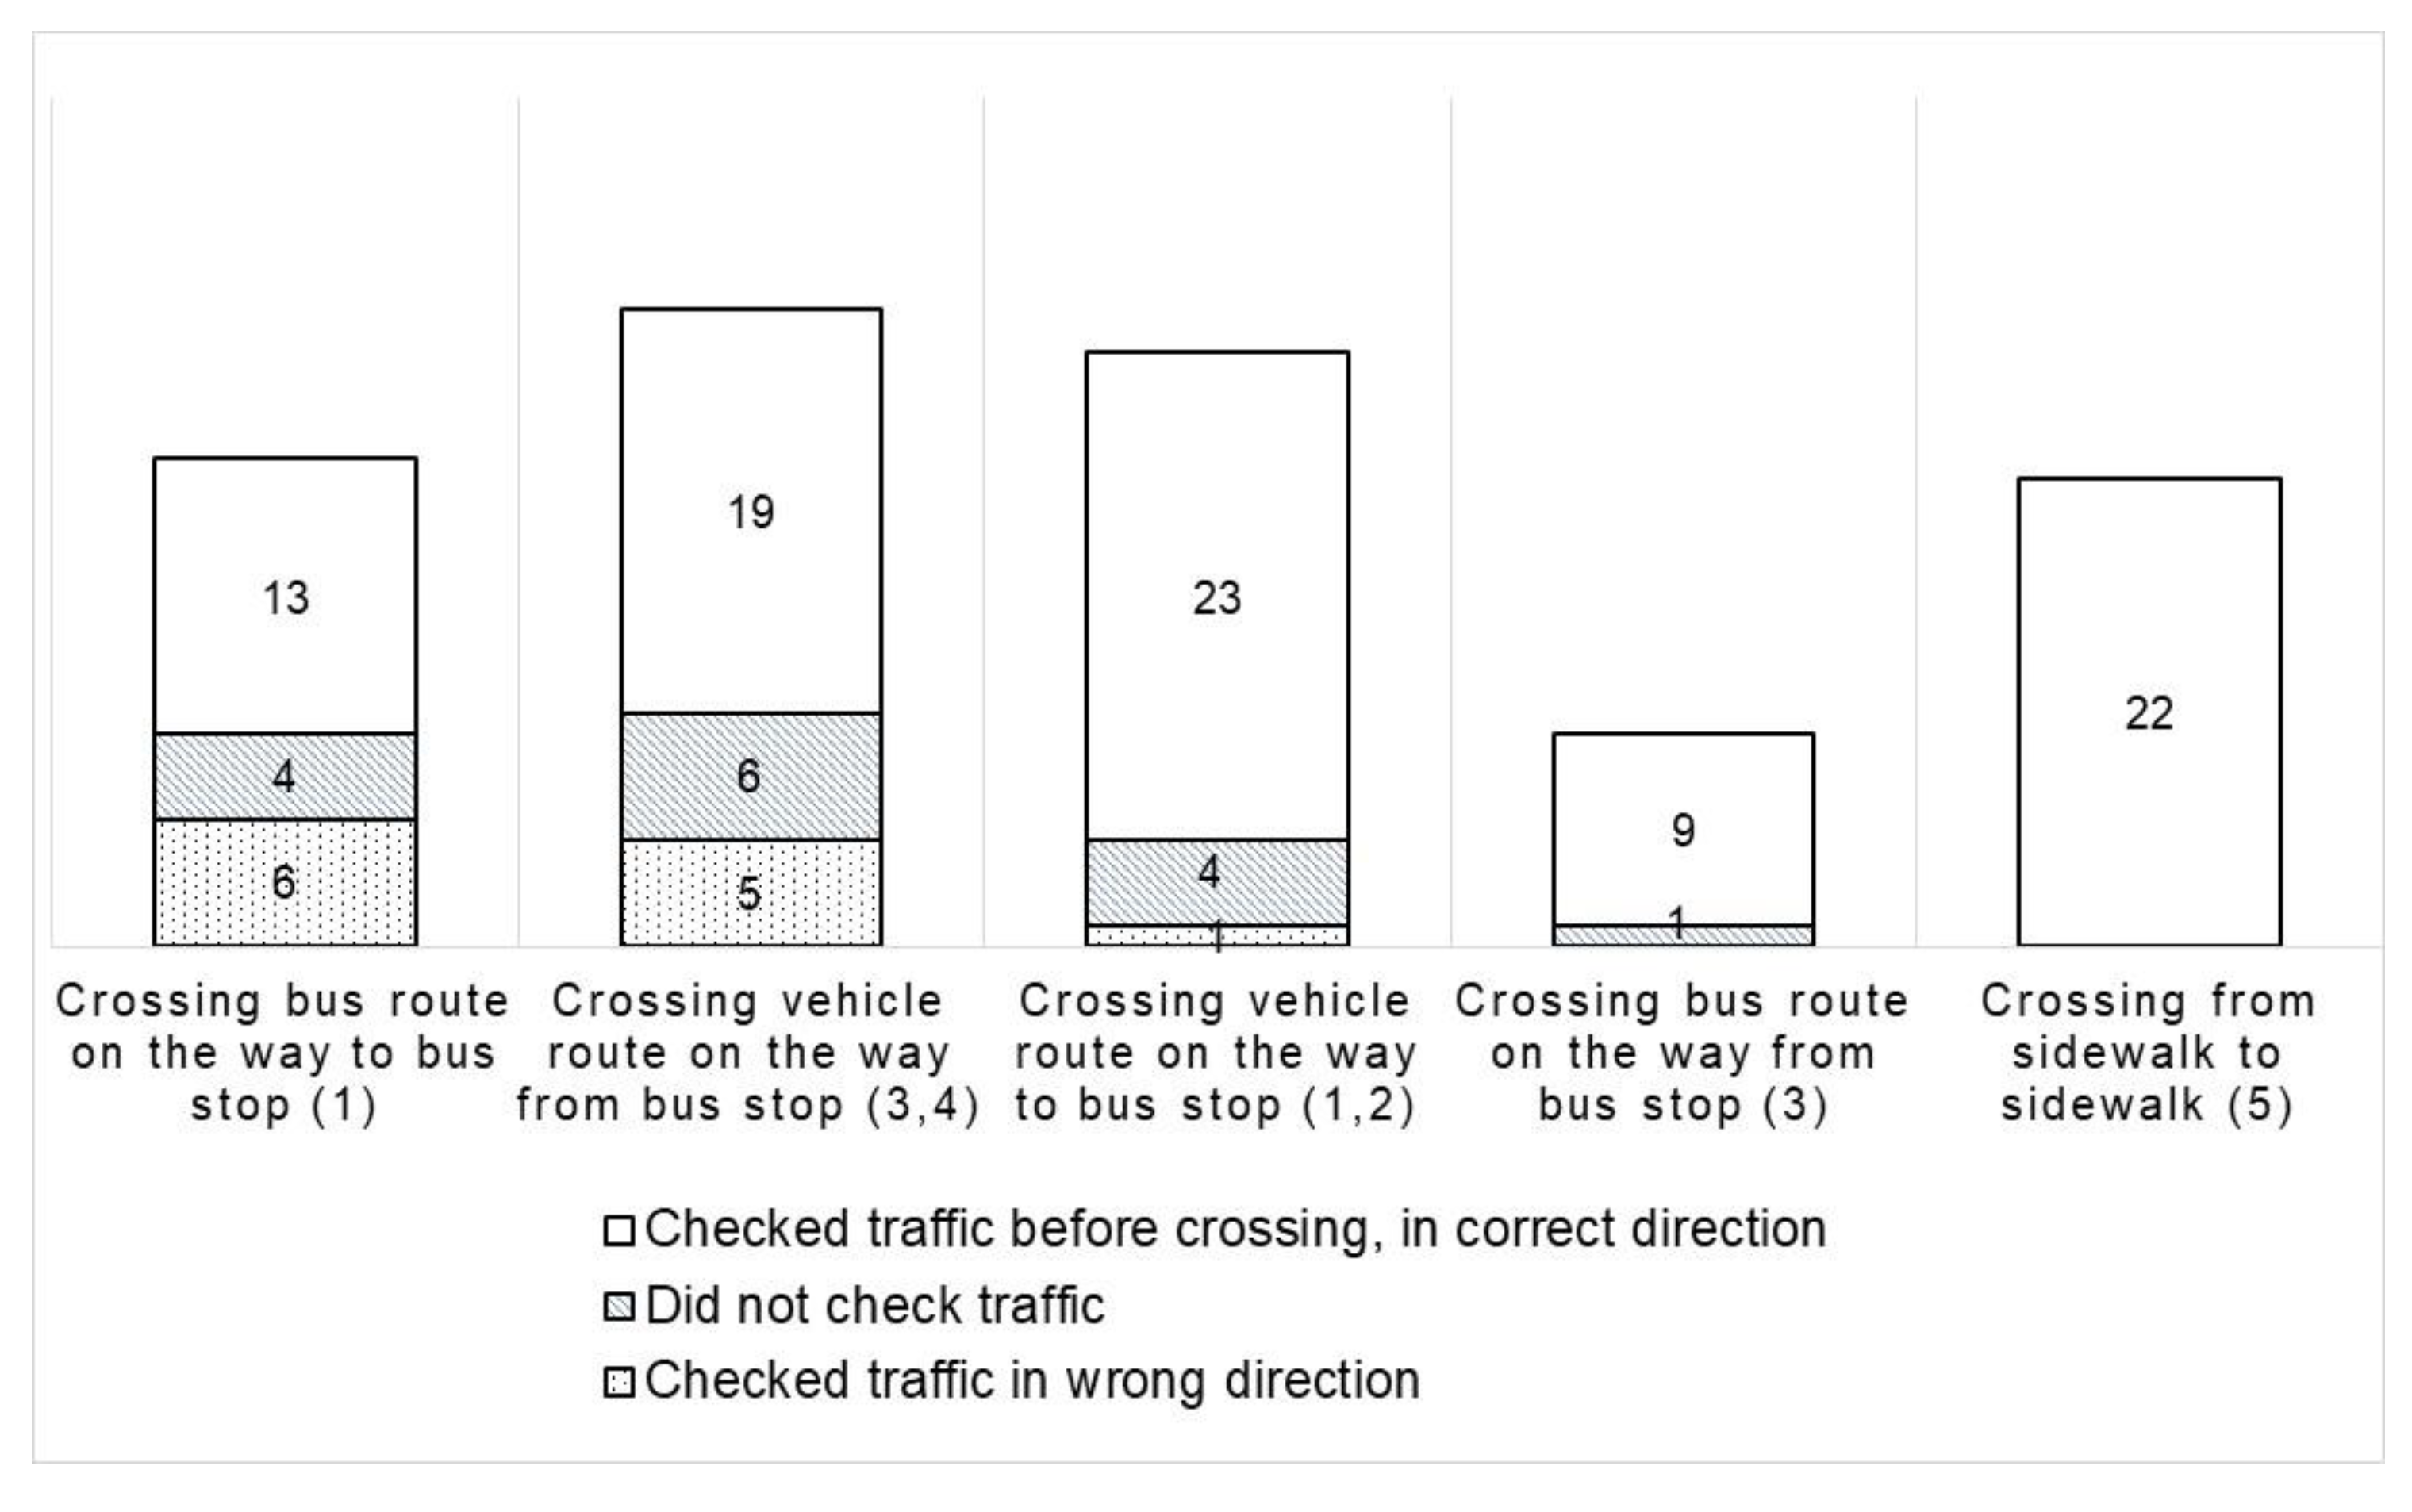

Table 1.
Descriptive statistics of the study observations.
| Characteristic | At sites with CL BPRs (N=592*) | At sites with CS BPRs (N=530*) |
| No of observations per site | 86-137 | 87-131 |
| Pedestrian age-groups | Below 18 (8%), 18-64 (86%), 65+ (6%) | Below 18 (6%), 18-64 (83%), 65+ (11%) |
| Pedestrian gender | Males (42%), females (58%) | Males (41%), females (59%) |
| Hourly number of crossing pedestrians: mean (s.d.) | 239 (106) | 179 (66) |
| Hourly bus volume in BPR: mean (s.d.) | 29 (17) | 50 (21) |
| Red light duration for pedestrians, sec: mean (s.d.) | In first crosswalk - 82.6 (20.1), in second crosswalk - 63.5 (27.1) | In first crosswalk - 42.3 (6.8), in second crosswalk -30.6 (10.7) |
| Pedestrian crossing destination | To bus stop (37%), from bus stop (28%), to another sidewalk (35%) | To another sidewalk (100%) |
| No of pedestrians approaching the crosswalk on red (% of crossings on red) | In first crosswalk - 353 (19%), in BPR crosswalk -188 (30%), in third crosswalk - 84 (28%) | In first crosswalk - 354 (6%), in second crosswalk - 290 (12%) |
| Among pedestrians who crossed on red: % of not checking traffic, % of checking traffic in wrong direction | In first crosswalk: 12%, 6%; in BPR crosswalk: 11%, 11%; in third crosswalk: 6%, 0% | In first crosswalk: 30%, 5%; in second crosswalk: 26%, 6% |
| Use of distracting devices by crossing pedestrians | Wearing headphones (9%), talking on the phone (16%), looking at the phone (15%) | Wearing headphones (12%), talking on the phone (9%), looking at the phone (10%) |
* No of pedestrians recorded.
Table 2.
Binary logistic regression models for the probability of crossing on red at intersections with CL BPRs.
Table 2.
Binary logistic regression models for the probability of crossing on red at intersections with CL BPRs.
| a - In the first crosswalk | ||||||||
| Variables | B | S.E. | Wald | Sig. | Exp(B) | 95% C.I. for Exp(B) | ||
| Lower | Upper | |||||||
| Males vs. females | .272 | .272 | .997 | .318 | 1.313 | .770 | 2.238 | |
| Using distracting devices vs. not | -.244 | .316 | .594 | .441 | .784 | .422 | 1.457 | |
| Crossing to bus stop vs. from side to side | .381 | .348 | 1.202 | .273 | 1.464 | .741 | 2.894 | |
| Crossing from bus stop vs. from side to side | .915 | .359 | 6.502 | .011 | 2.497* | 1.236 | 5.047 | |
| Direction of crossing | -.236 | .280 | .710 | .400 | .790 | .456 | 1.368 | |
| Presence of other pedestrians vs. alone | -.733 | .293 | 6.272 | .012 | .480* | .271 | .853 | |
| Bus present at bus stop vs. not | -.268 | .274 | .959 | .327 | .765 | .447 | 1.308 | |
| Bus stops' location: on one side vs. both sides | .543 | .326 | 2.780 | .095 | 1.721# | .909 | 3.258 | |
| Hour of observation | .194 | .091 | 4.555 | .033 | 1.214* | 1.016 | 1.451 | |
| Constant | -3.292 | 1.033 | 10.151 | .001 | .037 | |||
| b - In the BPR crosswalk | ||||||||
| Variables | B | S.E. | Wald | Sig. | Exp(B) | 95% C.I. for Exp(B) | ||
| Lower | Upper | |||||||
| Males vs. females | 1.059 | .347 | 9.304 | .002 | 2.883** | 1.460 | 5.693 | |
| Using distracting devices vs. not | -.750 | .397 | 3.560 | .059 | .472# | .217 | 1.029 | |
| Crossing to bus stop vs. from side to side | .957 | .411 | 5.429 | .020 | 2.603* | 1.164 | 5.819 | |
| Crossing from bus stop vs. from side to side | .096 | .462 | .043 | .836 | 1.100 | .445 | 2.723 | |
| Direction of crossing | .045 | .390 | .013 | .908 | 1.046 | .487 | 2.248 | |
| Presence of other pedestrians vs. alone | -.130 | .411 | .100 | .752 | .878 | .392 | 1.965 | |
| Bus present at bus stop vs. not | .333 | .374 | .791 | .374 | 1.395 | .670 | 2.903 | |
| Bus stops' location: on one side vs. both sides | .174 | .410 | .181 | .670 | 1.191 | .533 | 2.658 | |
| Hour of observation | .128 | .121 | 1.122 | .289 | 1.137 | .897 | 1.442 | |
| Constant | -3.019 | 1.398 | 4.663 | .031 | .049 | |||
| c - In at least one crosswalk | ||||||||
| Variables | B | S.E. | Wald | Sig. | Exp(B) | 95% C.I. for Exp(B) | ||
| Lower | Upper | |||||||
| Males vs. females | .664 | .222 | 8.941 | .003 | 1.943** | 1.257 | 3.003 | |
| Using distracting devices vs. not | -.211 | .247 | .726 | .394 | .810 | .499 | 1.315 | |
| Crossing to bus stop vs. from side to side | .522 | .269 | 3.759 | .053 | 1.686# | .994 | 2.858 | |
| Crossing from bus stop vs. from side to side | .764 | .290 | 6.927 | .008 | 2.146** | 1.215 | 3.789 | |
| Direction of crossing | -.238 | .229 | 1.072 | .301 | .789 | .503 | 1.236 | |
| Presence of other pedestrians vs. alone | -.515 | .248 | 4.333 | .037 | .597* | .368 | .970 | |
| Bus present at bus stop vs. not | -.279 | .225 | 1.539 | .215 | .756 | .487 | 1.176 | |
| Bus stops' location: on one side vs. both sides | .213 | .254 | .701 | .402 | 1.237 | .752 | 2.034 | |
| Hour of observation | .080 | .073 | 1.199 | .273 | 1.083 | .939 | 1.249 | |
| Constant | -1.770 | .824 | 4.613 | .032 | .170 | |||
Model statistics: (a) N=353; Nagelkerke R2=0.121, correct prediction=77.6%, McFadden pseudo R2=0.08. (b) N=188; Nagelkerke R2=0.171, correct prediction=75.5%, McFadden pseudo R2=0.11. (c) N=430; Nagelkerke R2=0.094, correct prediction=70.2%, McFadden pseudo R2=0.06. Significant variables: *p<0.05, **p<0.01, #p<0.1.
Table 3.
Binary logistic regression models for the probability of crossing on red at intersections with CS BPRs.
Table 3.
Binary logistic regression models for the probability of crossing on red at intersections with CS BPRs.
| a - In the first crosswalk | ||||||||||
| Variables | B | S.E. | Wald | Sig. | Exp(B) | 95% C.I. for Exp(B) | ||||
| Lower | Upper | |||||||||
| Males vs. females | .617 | .500 | 1.523 | .217 | 1.853 | .696 | 4.936 | |||
| Young vs. elderly | -.135 | .968 | .019 | .889 | .874 | .131 | 5.824 | |||
| Adults vs. elderly | -.972 | .660 | 2.172 | .141 | .378 | .104 | 1.378 | |||
| Using distracting devices vs. not | .447 | .574 | .606 | .436 | 1.563 | .508 | 4.815 | |||
| Direction of crossing | -.088 | .530 | .028 | .868 | .916 | .324 | 2.589 | |||
| Presence of other pedestrians vs. alone | -1.820 | .501 | 13.196 | <.001 | .162** | .061 | .433 | |||
| Hour of observation | -.121 | .192 | .396 | .529 | .886 | .609 | 1.291 | |||
| Constant | .042 | 2.229 | .000 | .985 | 1.043 | |||||
| b - In at least one crosswalk | ||||||||||
| Variables | B | S.E. | Wald | Sig. | Exp(B) | 95% C.I. for Exp(B) | ||||
| Lower | Upper | |||||||||
| Males vs. females | .677 | .303 | 4.979 | .026 | 1.968* | 1.086 | 3.568 | |||
| Young vs. elderly | .535 | .671 | .636 | .425 | 1.707 | .458 | 6.359 | |||
| Adults vs. elderly | .097 | .475 | .042 | .837 | 1.102 | .435 | 2.796 | |||
| Using distracting devices vs. not | -.668 | .411 | 2.635 | .105 | .513 | .229 | 1.148 | |||
| Direction of crossing | .212 | .353 | .361 | .548 | 1.236 | .619 | 2.470 | |||
| Presence of other pedestrians vs. alone | -.741 | .337 | 4.825 | .028 | .477* | .246 | .923 | |||
| Hour of observation | -.137 | .114 | 1.430 | .232 | .872 | .697 | 1.091 | |||
| Constant | -.626 | 1.346 | .216 | .642 | .535 | |||||
Model statistics: a) N=354; Nagelkerke R2=0.158, correct prediction=94.4%, McFadden pseudo R2=0.13. (b) N=477; Nagelkerke R2=0.073, correct prediction=88.9%, McFadden pseudo R2=0.05. Significant variables: *p<0.05, **p<0.001.
Table 4.
Combined model: binary logistic regression model for the probability of crossing on red, in the first crosswalk, at intersections with CL and CS BPRs, together.
Table 4.
Combined model: binary logistic regression model for the probability of crossing on red, in the first crosswalk, at intersections with CL and CS BPRs, together.
| Variables | B | S.E. | Wald | Sig. | Exp(B) | 95% C.I. for Exp(B) | |
| Lower | Upper | ||||||
| Males vs. females | 0.352 | 0.232 | 2.311 | 0.129 | 1.422 | 0.903 | 2.240 |
| Young vs. elderly | 1.317 | 0.639 | 4.242 | 0.039 | 3.732* | 1.066 | 13.070 |
| Adults vs. elderly | 0.831 | 0.500 | 2.761 | 0.097 | 2.295# | 0.862 | 6.115 |
| Using distracting devices vs. not | -0.186 | 0.274 | 0.462 | 0.496 | 0.830 | 0.486 | 1.419 |
| Direction of crossing | -0.095 | 0.232 | 0.169 | 0.681 | 0.909 | 0.577 | 1.432 |
| Presence of other pedestrians vs. alone | -0.940 | 0.246 | 14.603 | 0.000 | 0.391** | 0.241 | 0.633 |
| Hour of observation | 0.193 | 0.087 | 4.967 | 0.026 | 1.213* | 1.024 | 1.438 |
| Duration of red light | -0.009 | 0.007 | 1.517 | 0.218 | 0.991 | 0.978 | 1.005 |
| Type of BPR: CL vs. CS | 1.721 | 0.379 | 20.666 | 0.000 | 5.589** | 2.662 | 11.737 |
| Constant | -4.500 | 1.051 | 18.343 | 0.000 | 0.011 | ||
Model statistics: N=707; Nagelkerke R2=0.173, correct prediction=86.4%, McFadden pseudo R2=0.12. Significant variables: *p<0.05, **p<0.001, #p<0.1.
Disclaimer/Publisher’s Note: The statements, opinions and data contained in all publications are solely those of the individual author(s) and contributor(s) and not of MDPI and/or the editor(s). MDPI and/or the editor(s) disclaim responsibility for any injury to people or property resulting from any ideas, methods, instructions or products referred to in the content. |
© 2024 by the authors. Licensee MDPI, Basel, Switzerland. This article is an open access article distributed under the terms and conditions of the Creative Commons Attribution (CC BY) license (http://creativecommons.org/licenses/by/4.0/).
Copyright: This open access article is published under a Creative Commons CC BY 4.0 license, which permit the free download, distribution, and reuse, provided that the author and preprint are cited in any reuse.


