
Submitted:
08 March 2024
Posted:
08 March 2024
You are already at the latest version
Abstract
Globally, road traffic collisions cause over a million deaths annually, with pedestrians accounting for nearly one-quarter (23%) of these fatalities. This casualty proportion highlights the critical importance of adhering to traffic regulations. This study analyzes the factors influencing driver yielding behavior at midblock crosswalk improvements, comparing (1) a typical zebra crossing (C1) and (2) an intelligent signalized crosswalk (C2). The study used video-based observational data to investigate driver behaviors and factors influencing driver behaviors. The study applied multinomial logistic regression to formulate yielding behavior models. The results indicate that the number of traffic lanes, width of the traffic lanes, width and length of the crosswalk, vulnerable group, the number of pedestrian crossings, pedestrian crossing time, the number of vehicles approaching a crosswalk, speed of vehicle, headway, the post-encroachment time (PET) between vehicles and pedestrian, and roadside parking are the significant factors influence yielding behavior. These findings provide a better understanding of the factors influencing driver yielding behavior and propose measures to set proper physical improvements (e.g., curb extensions, raised pedestrian platforms, and pedestrian fencing), enforcement (e.g., parking restriction, speed violation detection), public awareness campaigns, and education initiatives.
Keywords:
Driver yielding behavior
; Midblock crosswalk
; Pedestrian safety
; Multinomial logistic regression.
1. Introduction
Globally, pedestrian-involved traffic crashes present a significant road safety issue, especially in developing countries [1,2]. With a dramatic increase in urban traffic flow, the primary threat to pedestrians occurs from frequent interactions when conflicts between pedestrians and vehicles at crosswalks. These conflicts become more likely and difficult to avoid when vehicle drivers fail to yield to the pedestrians, especially in the midblock crosswalks [3]. In road traffic collisions, pedestrians are more vulnerable to harm than vehicles, as even a low-speed impact can result in serious injuries or fatalities [4,5]. The recent report on the global status of road safety [6] highlighted a staggering figure of approximately 1.19 million road traffic deaths in 2021, corresponding to a rate of 15 deaths per 100,000 population. Notably, pedestrians accounted for 23% of these fatalities, with over 90% of pedestrian deaths occurring in low-income and middle-income countries [5,6].
In Thailand, road traffic crashes have a high human toll. In 2021 alone, 16,957 people died as a result of road injury [6]. Since 2022, pedestrian safety has been a primary concern after a medical doctor was killed while crossing a midblock crosswalk on an urban arterial road. According to the statistics, a pedestrian casualty rate accounts for 2.5 deaths per 100,000 people across the country. This figure represents approximately 8% of all road crash casualties. Almost all losses occur when pedestrians are crossing the roads [5]. Over the past years, the number of pedestrian fatalities, especially on national highways, has increased dramatically from 2018 to 2022, with an alarming increase of 6.3% per year [7], resulting in an approximate toll of 350 pedestrian deaths per year [8]. The top two contributing factors to vehicle-pedestrian collisions are vehicles exceeding the speed limit (accounting for 70% of cases), followed by drivers not complying with the crosswalk rules (e.g., yielding to pedestrians) [7,8]. The high casualty rate among pedestrians underscores the vulnerability of this road user group. Against this backdrop, as Thailand aims to move toward zero road deaths [9], emphasizing the urgent need for pedestrian safety measures and improving driver yielding to pedestrians are expected to decrease the number of pedestrian crashes, injuries, and fatalities.
Among the array of driver-oriented engineering measures, the following can be listed: pedestrian crossing signs and pedestrian-activated flashing beacons designed to warn and guide drivers at crosswalks. Additionally, deploying high-visibility markings, optical speed bars (OSB), zig-zag lines, red-painted areas, curb extensions, and raised pedestrian crosswalks is pivotal in enhancing driver visibility and optimizing the pedestrian’s line of sight. The application of various pedestrian signals serves as a crucial tool to enhance pedestrian safety, and their diversity includes fixed time signals, rectangular rapid flashing beacons (RRFB), pelican, puffin, pedestrian hybrid beacons (PHB), and high-intensity activated crosswalk (HAWK) beacon. A recent addition to these measures is the implementation of actuated intelligent signalized crosswalks, which can detect both the traffic flow of vehicles entering the crosswalk and the movement of pedestrians crossing [10,11]. The effectiveness of these countermeasures has shown a positive effect on reducing pedestrian crashes [12], traffic speed, and an increase in the rates of driver yielding behavior [12,13,14,15].
The extent drivers yield to pedestrians varies depending on the implemented countermeasures. It is notably influenced by diverse factors such as the driver’s characteristics, attitude towards yielding, and behavior-related factors [15,16,17]. Extensive research underscores the significance of drivers not yielding to pedestrians as a primary factor contributing to pedestrian crashes [12,15,16,17]. In pedestrian crashes, more than 95% result from traffic violations [15], and 19% of drivers disagree with yielding to pedestrians [12,15]. Unfortunately, drivers often fail to recognize pedestrian safety, and not complying with crosswalk rules by yielding to pedestrians is one of the most dangerous driving behaviors and significant safety problems [12,14]. This risky behavior significantly undermines the effectiveness of safety countermeasures at such locations. Therefore, an essential strategy for achieving a safe traffic system for pedestrians is encouraging driver yielding behavior and minimizing instances of drivers not complying with crosswalk rules.
Previous research has primarily focused on evaluating the measures of effectiveness (MOEs), in terms of safety, for midblock crosswalk improvements progressing from a typical zebra crossing (C1) to an intelligent signalized crosswalk (C2) that can detect both the traffic flow of vehicles entering the crosswalk and the movement of pedestrians crossing the road [18,19]. These studies have revealed different positive safety impacts, in which the C2 led to a notable reduction in vehicle speeds; the percentage of drivers yielding to pedestrians was less than 30% for C1. At the same time, for C2, there was a statistically significant increase of approximately 100% in the yielding rate. The C2 increases drivers’ visibility and can detect the traffic flow of vehicles entering the crossing. Drivers reduce their speed and finally stop their cars for pedestrian crossing. However, the variation in the percentages of drivers yielding to pedestrians between C1 and C2 underscores the need for a comprehensive exploration into the factors influencing driver yielding behavior toward pedestrians for C1 compared to C2, which had not previously been investigated and thus was the focus of the current study to reduce the knowledge gap and answer the question about the factors influencing driver yielding behavior which becomes imperative in the persistent challenges in pedestrian safety.
This study, therefore, aims to fill the existing research gap by undertaking a comprehensive analysis of the intricate relationship between various factors influencing driver yielding behavior toward pedestrians. The midblock crosswalks before and after the improvements, from a typical zebra crossing (C1) to an intelligent signalized crosswalk (C2) at four sites in Thailand passing through a growing urban area, were selected as a case study, which provides a comprehensive and empirical view of the problem and allows us to gauge how yielding behavior is related to each factor. The findings of this study can lead to an understanding of factors that influence yielding behavior in the safety of midblock crosswalks and can help propose guidelines for tailoring effective countermeasures to improve pedestrian safety and encourage driver yielding behavior in mixed traffic conditions between pedestrians and vehicles, especially in developing countries.
The rest of this paper is structured as follows: following this introduction, Section 2 gives a review of the findings of previous research on the factors influencing yielding behavior. Section 3 presents the research methodology used in this study, and section 4 presents a comprehensive discussion of the key findings based on this study. Finally, section 5 summarizes the significant contributions and suggests future research directions.
2. Literature Review
This section presents a review of literature mainly related to driver yielding behavior and factors influencing driver yielding behavior at the midblock crosswalk. The details are explained in the following sub-sections.
2.1. Driver Yielding Behavior
Drivers yielding behavior is inconsistently defined both conceptually and operationally. Much safety research has focused on treatments to improve vehicle yielding rates (using varying definitions of yielding). Some studies use yielding strictly to mean that road users follow traffic laws [2,20]. Alternatively, yielding has been based on which a road user passed first [21], sometimes accounting for the feasibility of vehicle stopping based on speed and distance [2,22]. Vehicle slowing or stopping has also been used to define yielding [23].
A pedestrian-driver interaction event is a pedestrian arriving in the crosswalk area while a driver is approaching the crosswalk. The driver knows that an event sequence will occur at the crosswalk from the onset of a pedestrian-driver interaction event. The pedestrian intends to cross the road (waiting on the sidewalk and looking for a gap in traffic to cross). The driver knows the pedestrian’s intention and must respond (decide to slow down or continue through the crosswalk) [2]. Accordingly, the drivers’ behaviors can be grouped into two main behavior classes:
Not yielding to pedestrian (Not Yield: NY): The driver decides not to yield to the pedestrian, in which the driver goes through the crosswalk area or conflict zone without yielding to the pedestrian and keeping the speed unchanged [2,20,21,22,23].
Yielding to pedestrian (Yield: Y): The driver yields to a pedestrian by adjusting the speed and decelerating at a crosswalk area to accommodate the pedestrian and waiting until the pedestrian has cleared the lanes on the driver’s side of the street [2,20,21,22,23].
In this case, another specification must be done: the driver can yield to the pedestrian by a soft slowing down (Soft Yield: SY; in this event, the driver slows down to a minimum speed that is higher than 10 km/h to allow the pedestrian to pass) or by a hard slowing down (Hard Yield: HY; in this event, the driver slows down to a minimum speed lower than 10 km/h to allow the pedestrian to pass) [19,22,23].
2.2. Contributing Factors on Driver Yielding Behaviors
The act of yielding, a behavioral factor inherent in the interactions among road users, is consistently recognized as a pivotal component of pedestrian safety and comfort [24,25]. In recent years, there has been a notable surge in studies focusing on driver yielding behavior at midblock crosswalks under mixed traffic conditions, consisting of a mix of pedestrians, cyclists, motorcycles, and other vehicles sharing the same roadway. Some studies related to the factors influencing driver yielding behavior have been identified and can be systematically categorized into four components: (1) roadway characteristics, (2) pedestrian characteristics, (3) traffic characteristics, and (4) environmental factors. The details are as follows.
2.2.1. Roadway Characteristics
Regarding roadway characteristics, research has illuminated key insights into driver yielding behavior on urban roads, revealing lower yielding rates on local roadways [26]. Notably, locations where pedestrian-involved crashes are most prevalent pose a heightened risk, particularly in urban areas where 69% of pedestrian fatalities occur [27]. The width of the roadway and the number of traffic lanes have emerged as critical factors influencing driver-pedestrian interactions [28,29]. The simultaneous circulation of vehicles in multiple lanes can obscure areas of driver visibility, impeding their ability to detect pedestrians [30]. Furthermore, the increased sense of safety and comfort experienced by drivers on such roads often leads to higher driving speeds [31]. In road user safety, the absence of crosswalks has been identified as a significant risk factor, with roads lacking designated crosswalks being 1.5-2.0 times more likely to collide with pedestrians than roads equipped with crosswalks [31,32]. However, the placement of crosswalks is essential, and careful consideration is to ensure their installation in locations where pedestrians and drivers are more likely to adhere to them [32]. Drivers approaching a crosswalk area with pedestrian refuge islands exhibited a 1.63 times greater likelihood of yielding than those approaching a crosswalk area without pedestrian refuge islands [33]. These findings underscore the multifaceted impact of roadway characteristics on driver yielding behavior and highlight the importance of thoughtful infrastructure design in promoting pedestrian safety.
In examining various types of crosswalks, numerous studies have focused on the driver yielding behavior associated with specific design elements. The effectiveness of different crosswalk types is contingent upon a complex interplay between pedestrian and driver behaviors [30,34,35,36,37]. Studies on zebra crossings indicate that drivers are more inclined to yield to pedestrians within marked areas than unmarked sections (OR = 7.15) [37]. However, the overall willingness of drivers to yield at zebra crossings remains relatively low, ranging from 4% to 40% [36,37]. Additionally, it was noted that driver yielding behavior at zebra crossings could occasionally lead to traffic disruptions, delays, and risk of injury or fatality [38,39]. Enhancing pedestrian safety through incorporating design elements, such as stripes, colored/textured surfaces, optical lane narrowing, and ramps, has demonstrated substantial efficacy. Introducing these elements substantially increased the likelihood of the first vehicle and any subsequent vehicles coming to a stop, resulting in a significant surge in yielding rates from 20% to an impressive 97% [36]. Similarly, the presence of a raised crosswalk and overhead flasher led to a noteworthy 50% increase in the rate of yielding after installation [29]. It significantly elevated the rate of driver yielding (OR = 20.76) [37]. In contrast, installing a crosswalk with a traffic signal boasted the highest driver-yielding rate, averaging an impressive 98%. The driver-yielding rate for a rectangular rapid-flashing beacon (RRFB) stood at 86%, while a pedestrian hybrid beacon (PHB) achieved a rate of 89% [30].
2.2.2. Pedestrian Characteristics
Numerous studies have contributed to a more comprehensive understanding of pedestrian characteristics and their crossing behavior, a significant factor influencing yielding behavior. Gender differentials have emerged, indicating that male pedestrians exhibit a higher likelihood of unlawful crossing than their female counterparts [40,41]. Interestingly, mature pedestrians display the highest proportion of illegal crossing behavior within age groups compared to young and elderly individuals [42,43]. Noteworthy is the finding that drivers exhibit a higher likelihood of yielding to older pedestrians than the younger [44]. Additionally, the number of pedestrian crossings was a factor that increased drivers’ willingness to yield [36]. Specifically, when a group of pedestrians, comprising more than three individuals, is poised to cross the curb, drivers tend to yield in 46% of cases [45]. Examining the size of pedestrian crossing groups further, drivers are more inclined to yield when more than one person aims to cross (OR = 1.92) [37]. Furthermore, a significant majority of drivers (77.1%) exhibit proximity to the crosswalk area when pedestrians are either waiting at the curb, stopping to stay, or entering the street, resulting in drivers yielding to pedestrians [33]. Moreover, drivers are 1.83 times more likely to yield when pedestrians are still on the crosswalk compared to instances where pedestrians have already entered the sidewalk [33].
2.2.3. Traffic Characteristics
Various studies have underscored the significant influence of traffic characteristics on yielding behavior, where factors such as vehicle speed, type of vehicle, and the number of vehicles approaching a crosswalk emerge as crucial predictors of compliance with pedestrian crosswalk laws and yielding behavior [46]. Recognizing that speed constitutes a primary contributor to road fatalities [47] and pedestrian crashes [48,49,50,51,52,53], it is well-established that pedestrian safety at crosswalks is positively correlated with lower vehicle speeds [46,47,48,49,50,51,52,53,54]. Drivers traveling at higher speeds may encounter difficulties detecting pedestrians, diminishing their capacity to yield effectively [54]. A notable observation is that only 17% of drivers yielded to pedestrians, even as approximately half of them reduced their speed [45]. The likelihood of conflict escalates with higher vehicle speeds and heavy traffic, with a substantial proportion of drivers (36%) failing to yield to pedestrians in such conditions [45,55]. Conversely, relatively lighter traffic conditions empower drivers to be more confident in yielding to pedestrians, resulting in an approximately 2.5 times increase in the likelihood of yielding. This increased confidence is primarily attributed to the lower probability of rear-end collisions in such scenarios [37]. Regarding vehicle type, motorcycles demonstrated a lower propensity to yield to pedestrians compared to passenger cars (OR = 0.63) [37]. Notably, drivers of passenger cars revealed a 1.82 times higher likelihood of yielding than drivers of other vehicle types, including trucks, vans, and SUVs [33].
2.2.4. Environmental Factors
Environmental and various contextual factors have been identified as influencing yielding behavior, encompassing elements such as roadside parking, bus stop, crosswalk distance, crosswalks with a history of vehicle-pedestrian crashes, land use, and the time of day [34,35,36,39,41,55]. The impact of land use on yielding behavior is particularly noteworthy, with drivers demonstrating a heightened willingness to yield at crosswalks near bus stops [27,35,55]. However, the presence of bus stops and roadside parking spaces may decrease yielding behavior, potentially obstructing the view of pedestrians and drivers [35,55].
2.2.5. A Comprehensive Review Related to the Factors Influencing Driver Yielding Behavior
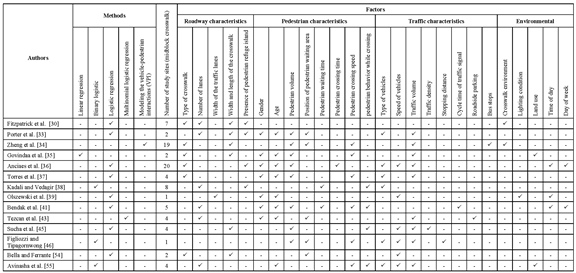
A comprehensive review of the factors influencing driver yielding behavior is summarized in Table 1; it is evident that each driver’s behavior is unique, e.g., occurs dissimilarly and is influenced by different factors. Consequently, each behavioral group responds differently to the countermeasure. Understanding the driver’s risky behaviors and contributing factors is essential for the most vulnerable road users in mixed traffic conditions. To the best of our knowledge, the previous research [28,29,30,31,32,33,34,35,36,37,38,39,40,41,42,43,44,45,46,47,48,49,50,51,52,53,54,55] still treated driver yielding behavior as one single behavior and provided limited insight into the factors to change the behavior. It also seeks to reveal the associated factors for each behavior characteristic.
From the research mentioned earlier, the identified factors discussed above have been proven to be critical contributors to influencing driver yielding behavior, thereby enhancing pedestrian crossing safety. Previous studies, as illustrated in Table 1, predominantly utilized linear regression, binary logistic, and logistic regression methods. To address these gaps in the literature, the present study employed multinomial logistic regression analysis (MNL) to describe the chance of occurrence for each sub-behavioral group (Yield: Y and Soft Yield: SY) compared to Not Yield: NY.
As highlighted in the preceding section, most prior studies on pedestrian traffic safety have primarily concentrated on identifying factors contributing to accidents, often relying on crash databases. Nevertheless, in Thailand, crash data tends to be underreported, rendering them insufficient for comprehensive approaches to addressing pedestrian safety issues. This limitation arises due to various reasons. Consequently, there is a need to explore alternative avenues to bridge these gaps. In response to these challenges, the current study delves into the intricate details of factors influencing yielding behavior, focusing on variables that have not been extensively explored. This includes an examination of the type of crosswalk, a highly vulnerable group of pedestrians, speed of Motorcycle (MC) and Passenger Car (PC), vehicle headway, the post-encroachment time (PET) between vehicles and pedestrians, and roadside parking, as well as the probability estimates for the driver yielding a pedestrian. The results would help to understand more insightful information and could help design tailored countermeasures to improve pedestrian safety in mixed traffic conditions. The details of the research methodology are presented in the next section.

Table 1.
Summary of literature reviews on the factors influencing driver yielding behavior.
 |
3. Research Methodology
This study analyzed the factors influencing driver yielding behavior at crosswalks before and after improvements. The comparison involved a typical zebra crossing and an intelligent signalized crosswalk. Detailed information regarding the research methodology is presented in this section.
3.1. Scope of the Study
3.1.1. Study Areas
This study was conducted on four midblock crosswalks on arterial urban streets under mixed traffic conditions in three provinces across Thailand, as shown in Figure 1. The midblock crosswalk improvements progressed from a typical zebra crossing (C1) to an intelligent signalized crosswalk (C2), following the guidelines on pedestrian crossing warrants [9,10]. The study sites selected were the crossings with pedestrian volume of over 135 persons per hour, average daily traffic (ADT) exceeding 12,000, and a posted speed limit greater than 30 km/h on multi-lane roadways.
The details of the study areas with observed pedestrian volume and traffic volume of motorcycles and passenger cars obtained in both directions are presented in Table 2. Traffic data collection was recorded at two hours on weekdays and weekends under fair weather conditions during the morning peak hours (7:00 a.m.-9:00 a.m.) and the afternoon peak hours (4:00 p.m.-6:00 p.m.). Additionally, data were collected for two hours during the off-peak hours (11:00 a.m.-1:00 p.m.). Meanwhile, the proportion of vehicles at all sites during peak vehicle traffic was considered, and it was observed that passenger cars accounted for more than 50% of the vehicles traveling through the crosswalk, followed by motorcycles and other vehicles, respectively. The effect of peak-hour traffic volume on pedestrian safety and driver behavior changes is significant because of the higher traffic density and increased congestion levels, leading to limited crossing time and increased conflicts between pedestrians and drivers.
3.1.2. Types of Crosswalks
This study identified and selected two types of crosswalks for analysis: a typical zebra crossing (C1) and an intelligent signalized crosswalk (C2). The first type, the zebra crossing (Figure 1 (a)), is characterized by longitudinal stripes on the road, alternating black and white stripes, and white stop lines across the street. In contrast, an intelligent signalized crosswalk (Figure 1 (b)) is equipped with more detailed markings and traffic signals. This layout includes additional elements, such as OSB, zig-zag lines, a red-painted area, and flashing warning lights. Moreover, an intelligent signalized system is installed. The system detects both pedestrian and vehicle traffic flows. It uses this data to determine the signal timing when a pedestrian does not wait too long and can cross safely, corresponding to the traffic conditions of vehicles entering the crosswalk.
3.2. Data Collection
3.2.1. Driver Yielding Behavior
Field observations were conducted to survey driver yielding behavior at the crosswalk area in both traffic directions. These observations included collecting road user behaviors using video recordings of pedestrian and driver interactions at the crosswalk area. Each video recording was two hours during the daytime (morning) and two hours during the evening. The data collection on driver yielding behavior was carried out before improvements, specifically in the case of zebra crossing (C1). In the case of an intelligent signalized crosswalk (C2), the driver’s yielding behavior was collected, spanning three months to six months after installation. This allows for a comprehensive examination of the changes in driver yielding behavior following its implementation. Nevertheless, it is imperative to conduct further research to investigate the yield rates in the long term following the performance of C2.
We directly observed drivers’ behaviors toward pedestrians at crosswalks from the preliminary survey results. This study examined how drivers approached crosswalks by analyzing and categorizing their behaviors into three classes: not yield (NY), soft yield (SY), and yield (Y) to pedestrians, following the previous research [2,20,21,22,23].
However, the definitions of SY and Y were revised and elicited anew in this study, ensuring clarity in characterizing drivers’ actions at crosswalks, which enhances the study’s overall methodology consistency and comparability with existing research. The definitions of each driving behavior characteristic are described in detail in Table 3.
The study defines interactions between pedestrians and drivers of vehicles, considering an event when a pedestrian or a group of pedestrians starts a crossing stage on the road, attempting to cross from the footway to the first lane of traffic and crossing the area to another sidewalk. This study investigated whether there was an interaction in an event if the pedestrian crossed and at least one vehicle was approaching. Therefore, the driver had to decide to yield. Subsequently, for each event with interaction, it was recorded whether the first vehicle approached the crossing and if any car (the first or any subsequent vehicles) yielded to pedestrians.
3.2.2. Roadway Characteristics
A comprehensive examination of the physical attributes of the road section was conducted, as shown in Table 4. This investigation encompassed a detailed assessment of various factors, such as the width and length of traffic lanes, median, sidewalks, and shoulders. Additionally, the road surface conditions, road markings, width and length of the crosswalk, state of stop lines, warning signs, speed limit signs, pedestrian refuge island, roadside parking, and the surrounding land use.
3.2.3. Pedestrian Characteristics
The pedestrian characteristics of the road section under study were investigated, as shown in Table 4. The investigation included gender, age, and number of pedestrian crossings. The video recording gives information on various aspects, including the position of the pedestrian waiting area, waiting times of pedestrians, the duration pedestrians take to cross the road, and the observable pedestrian crossing behavior, distinguishing whether individuals cross alone or in groups.
3.2.4. Traffic Characteristics
Field observations were conducted at each site, involving the collection of traffic characteristics through video recordings focused on drivers at the crosswalk area. Our attention was dedicated to scrutinizing various traffic parameters, including the categorization of vehicle types, the speed of motorcycles and passenger cars, the number of vehicles approaching the crosswalk, the headway of vehicles, and the post-encroachment time (PET) between motorcycles and passenger cars and pedestrians. Note that the PET is defined as the difference in time between pedestrians and vehicles arriving at the potential conflict point at a crosswalk, which is a vital predictor of the crash risk potential and the severity levels in the case of a collision. Additionally, the study examined drivers’ adherence to roadside parking regulations within crosswalk areas, assessing the degree to which drivers observed safe crossing rules, as detailed in Table 4.
3.2.5. Variables Influencing Driver Yielding Behavior
The significant variables incorporated into the model were categorized as dichotomous data and continuous variables. When employed as independent variables, dichotomous variables typically set values of 0 or 1. Continuous variables, on the other hand, are directly integrated into the model. Each model was built upon a dataset comprising at least 800 samples, ensuring an ample dataset for thoroughly analyzing variables considered in this study. The selection of explanatory variables was informed by prior knowledge derived from midblock crosswalk studies, as acquired through an extensive literature review [28,29,30,31,32,33,34,35,36,37,38,39,40,41,42,43,44,45,46,47,48,49,50,51,52,53,54,55]. Table 4 consolidates a comprehensive array of factors influencing yielding behavior, including roadway, pedestrian, and traffic characteristics.
Table 4.
Variables influencing driver yielding behavior.
| Variables | Coding/Category/Description | Type of variables |
Reference |
|---|---|---|---|
| Driver behavior characteristics (Y) | |||
| Not Yield (NY) | 0= Not Yield (reference category) | Dichotomous | [2,20,21,22,23] |
| Soft Yield (SY) | 1= Soft Yield | Dichotomous | [2,20,21,22,23] |
| Yield (Y) | 2= Yield | Dichotomous | [2,20,21,22,23] |
| Roadway characteristic | |||
| Number of traffic lanes (X1) | Number of traffic lanes in the road section | Continuous | [28,29,33,38,41,43] |
| Width of the traffic lanes (m.) (X2) | Width of the traffic lanes in the road section | Continuous | [30] |
| Width of the crosswalk (m.) (X3) | Width of the midblock crosswalk in the road section | Continuous | [33,34,35,45] |
| Length of the crosswalk (m.) (X4) | Size of the midblock crosswalk in the road section | Continuous | [34] |
| Presence of pedestrian refuge island (X5) | 0=No | Dichotomous | [33,38,39] |
| 1=Yes | Dichotomous | ||
| Pedestrian characteristics | |||
| Vulnerable group (X6) | 0= Non-vulnerable group (male and adult) | Dichotomous | [33,35,36,37,38,39,41,43,55] |
| 1= Vulnerable group (female, children, and elderly) | Dichotomous | ||
| Number of pedestrian crossings (person) (X7) | The number of pedestrians crossing the road during a specific time | Continuous | [33,34,35,36,41,45,46] |
| Position of pedestrian waiting area (X8) | 0= No (shoulder and traffic lane) | Dichotomous | [33,34,43,46] |
| 1= Yes (sidewalk) | Dichotomous | ||
| Pedestrian waiting time (s) (X9) | Pedestrian waiting time at the curbside or median during the road crossing process. Wait until traffic has stopped or the road is clear before crossing. | Continuous | [38,41,45] |
| Pedestrian crossing time (s) (X10) | The duration it takes pedestrians to complete their crossing is measured from when they initially step onto the road or designated crosswalk to when they safely reach the opposite side. This duration does not include pedestrian waiting time. | Continuous | [36] |
| Traffic characteristics | |||
| Type of vehicles* (X11) | 0= Motorcycle (MC) | Dichotomous | [33,36,37,38,46,48] |
| 1= Passenger car (PC) | Dichotomous | ||
| Speed of MC (km/h) (X12) | The spot speed of every vehicle passing within 25 meters from the stop line to a marked line | Continuous | [36,39,45,46,54,55] |
| Speed of PC (km/h) (X13) | Continuous | ||
| Number of vehicles approaching crosswalk (vehicle) (X14) | Number of vehicles passing through the crosswalk in all traffic lanes | Continuous | [33,34,35,36,37,43,45,46,47] |
| Headway (s) (X15) | The duration between vehicles is measured in time | Continuous | - |
| PET between MC and pedestrian (s) (X16) | The time difference between a vehicle leaving the area of encroachment and a conflicting vehicle entering the crossing area | Continuous | - |
| PET between PC and pedestrian (s) (X17) | Continuous | ||
| Roadside parking** (X18) | 0=No | Dichotomous | [43] |
| 1=Yes | Dichotomous | ||
Note: * In this study, motorcycles and passenger cars are the primary vehicles traveling through the crosswalk and are involved in incidents where pedestrians are struck while crossing the midblock crosswalk [5,6,7,8]. ** Roadside parking within a crosswalk area is prohibited, and drivers should refrain from parking or stopping along the road within a distance of 3.0 meters from a crosswalk.
3.3. Data Analysis
The data analysis is divided into two parts: the descriptive statistics of variables and multinomial logistic regression analysis, which was employed to explain the multinomial response variable of driver yielding behavior. The details are as follows.
3.3.1. Descriptive Statistics of Observation Variables
Descriptive statistics of the collected variables were employed to predict the likelihood of a driver yielding to a pedestrian. This summary encompassed vital measures, including frequency distribution, central tendency (mean), and variability (standard deviation).
3.3.2. Modelling Yielding Behavior
In this study, we developed a series of multinomial logistic regression (MNL) models to identify roadway characteristics, pedestrian characteristics, and traffic characteristics associated with a driver’s probability of yield (not yield or soft yield) to pedestrians crossing based on the data collected.
In an MNL model, the dependent variable is categorical, with more than two categories for predicting driver yielding behavior at a crosswalk. The values of the dependent variable have three types: not yield, soft yield, and yield to pedestrians. These categories are typically coded numerically for analysis: 0, 1, and 2, respectively. Interpreting the coefficients allows us to understand the impact of each predictor variable on the log odds of being in a particular yielding behavior category compared to the reference category (usually the category with code 0, which is not yielding in this study). The multinomial logistic regression model that returns the log odds [56,57] of drivers yielding a pedestrian is defined as:
where Pi is the probability of a driver yielding to a pedestrian that yi = 1, for k explanatory variables, i = 1,…,n observations, β0 is the model constant, and the β1… βk are the parameters corresponding with the explanatory variables (Xk, k=1,..., K is the set of independent variables).
The parameters in Equation (1) are typically determined using maximum likelihood estimation. The following equation provides the probability estimates for the driver’s yield response:
The model in (2) allows for determining the effect of each predictor on the odds of Y. More specifically, the odds ratio (OR) value represents the multiplicative factor of the odds of Y when the independent variable xi increases by one unit, with all other factors remaining constant. In other words, the odds ratio indicates the relative amount by which the odds of an outcome increase (OR > 1) or decrease (OR < 1) when the value of the corresponding independent variable increases by one unit [56,57]. The odds of the event or outcome are calculated using equation (3).
The modeling was completed in two stages. In the first stage, predictors that should be used to develop an MNL model were identified through hypothesis testing. Pearson Chi-square tests assessed associations between the factors and driver yield behavior. The factors with significance at 0.05 were selected for further regression analysis.
Predictors found to be significant, at least at the 95% confidence level (p < 0.05) in hypothesis testing, were considered for the MNL model estimation in the second stage. After developing the model, the model's fitness with data was checked by examining the results of the model statistics and the Hosmer-Lemeshow test [58,59].
This study designated the MNL models, which include S1 (Hwy No. 306 Km. 4+970), S2 (Hwy No. 3242 Km. 11+625), S3 (Hwy No. 3242 Km. 18+110), and S4 (Hwy 407 Km. 24+700), and S5 integrates the data from all four sites (S1 to S4) for a comprehensive analysis. For each model (S1, S2, S3, S4), no fewer than 800 data samples were utilized, ensuring sufficiency for analyzing the variables considered in the research. The details of the study results are presented in the next section.
4. Results and Discussion
This section is divided into three subsections. The first part presents the distribution of driver behavior characteristics. The second part presents the descriptive statistics of observed variables. The last part presents the factors influencing driver yield behavior. The details are explained in the following sub-sections.
4.1. Distribution of Driver Behavior Characteristics
The study involved observing 800 vehicle drivers for each of the S1-S4 models. Additionally, the S5 model, which combines data from all four sites (S1 to S4), included observations of 3,200 vehicle drivers. The comprehensive dataset allowed for a detailed analysis of driver yielding behavior at specific locations (S1 to S4) and a broader examination collectively encompassing all observed areas (S1 to S4) in the S5 model. The increased sample size in the S5 model enhances the statistical power and reliability of the findings, providing a more robust understanding of the factors influencing driver behavior.
Figure 2 presents descriptive statistics of driver yielding behavior, revealing that the yielding behavior rate showed a statistically significant difference between the two crosswalk layouts. For C1, the data indicates that over 70% of drivers do not yield at the crosswalk, less than 15% yield softly, and fewer than 18% yield. In contrast, C2 exhibits a notable improvement trend, signifying a substantial positive impact on drivers’ yielding behavior across diverse locations. The findings reveal a nearly 100% increase in the percentage of drivers yielding, accompanied by a considerable decrease in drivers not yielding before reaching the crosswalk. This observed improvement underlines the effectiveness of interventions associated with C2 and emphasizes its potential to positively influence driver behavior at various locations. This finding implies that differences in driving behavior at the two crosswalk sections are due to the different perceptions that might prompt them to be more cautious and are caused exclusively by the driver’s behavior at the approach to the crosswalk, especially when the timing of the traffic signal plays a significant role in influencing driver behavior. If the signal provides sufficient time for pedestrians to cross safely and is well-coordinated with the traffic flow, drivers are more likely to yield.
The results of the driver behaviors observed indicate that a minority of drivers for C2 still engage in risky behaviors. These behaviors include disobeying traffic rules before reaching the crosswalk area and accelerating during the yellow light or at the beginning of the red-light phase. During the initial phase of the red light, a subset of vehicles exhibited behaviors that enhanced pedestrian safety, particularly during peak hours. Some drivers opted to slow down and wait for pedestrians to cross the road to a divided median with a pedestrian refuge island. Subsequently, they carefully assessed for a safe gap at the signal stage before deciding to proceed through a midblock crosswalk. However, the outcomes related to yielding behavior underscored that implementing C2 significantly increased visibility, prompting drivers to be more attentive and responsive to pedestrians. Using cameras or sensors enhances the enforcement of traffic laws, fostering compliance with designated traffic rules and regulations.
Moreover, this study demonstrates the 85th percentile speeds of MC and PC to describe the different driving behaviors of the drivers while approaching crosswalks for both C1 and C2, as presented in Table 5. For C1, the 85th percentile speeds of MC exceeded 70, 65, and 58 km/h in the case of NY, SY, and Y, respectively. Similarly, for PC in C1, the 85th percentile speeds exceeded 85, 77, and 68 km/h for NY, SY, and Y, respectively. After the installation of C2, enhancements such as painted markings, traffic signs, and traffic signal lamps improved clear driving visibility. Consequently, drivers consistently and significantly reduced their vehicle travel speeds. The 85th percentile speeds of MC exceeded 60, 50, and 41 km/h in the case of NY, SY, and Y, respectively. Likewise, for PC, the 85th percentile speeds consecutively exceeded 70, 64, and 53 km/h for NY, SY, and Y. The changes in the 85th percentile speed suggest that they may still be high due to various factors, including drivers' non-compliance with the posted speed limit, insufficient implementation of traffic calming measures, and shortcomings in enforcing traffic regulations.
Notably, the minimum speed drivers adopt to yield to a pedestrian in the case of C1 and C2 are still far from the safe speed for pedestrians (i.e., 30 km/h). This finding implies that significant differences in driving behavior approaching C1 and C2 are due to the different speeds but are caused exclusively by the driver’s conditioning at the approach to the crosswalk (last 25 meters) and roadway characteristics. It should be noted that the distance of 25 meters from the stop line to a marked line was defined to measure the spot speed of each vehicle because, beyond this distance, there are some entrances/exits and roadside activities that could affect the vehicle’s speed.
4.2. Descriptive Statistics of Observed Variables
The results of descriptive statistics of observed variables in Table 6 show that the percentage of the vulnerable group (female, children, and elderly) was considerably higher than the non-vulnerable group (male and adult). Examining the distribution of pedestrian waiting areas on sidewalks revealed proportions ranging from 58.2% to 78.6%. The proportion of vehicles, i.e., MCs and PCs, at all sites during peak vehicle traffic was observed. The PCs accounted for more than 60% of the vehicles traveling through the crosswalk, followed by MCs, respectively. Additionally, in the case of C1, most drivers exhibited behavior indicating that roadside parking near a crosswalk was expected, with more than 52.4% of drivers engaging in this practice. Subsequently, after the upgrade to C2, the impact on driver behavior, particularly their adherence to traffic laws and regulations, was evident. There was a significant reduction in the percentage of roadside parking, ranging from 28.6% to 31.7%.
The result of the temporal distribution of continuous variables presented in Table 7 shows that the average number of pedestrian crossings at crosswalks ranged from 2.1 to 3.7 people at a time. The waiting time and pedestrian crossing time at crosswalks in the case of C1 as longer waiting times at midblock crosswalks increase the trend of risky behavior. In this regard, the C2 system includes sensors that detect pedestrians waiting to cross, optimizing pedestrian signal phases and significantly reducing waiting times. The average speed results for MCs and PCs in the C1 and C2 installations indicated that they decreased substantially after the C2 improvements. The number of vehicles approaching and traversing the crosswalk ranged from 2.5 to 4.5 vehicles at a time. The headway of vehicles in the case of C2 consistently measured more than C1, posing decreased challenges for drivers in terms of identifying suitable gaps and times to yield to pedestrians. Additionally, the post-encroachment time (PET) between vehicles (i.e., MC and PC) and pedestrians after the installation of C2 contributed to reducing the crash risk and the severity level in the case of a collision.
4.3. Factors Influencing Driver Yielding Behavior of C1 and C2
This section presents the significant factors influencing drivers’ yielding behavior, and a comparative analysis of the results sheds light on the influence of factors across different types of crosswalks (C1 and C2), presented in Table 8 and Table 9.
It is evident that several factors played a significant role in influencing the yielding behavior of pedestrians in both crosswalks of C1 and C2: number of traffic lanes (X1), width of the traffic lanes (X2), width of the crosswalk (X3), length of the crosswalk (X4) vulnerable group of pedestrians (X6), the number of pedestrian crossings (X7), the speed of vehicles (i.e., MC (X12)/PC (X13)), the number of vehicles approaching a crosswalk (X14), headway (X15), the post-encroachment time (PET) between vehicles and pedestrians (i.e., MC (X16)/PC (X17)), and roadside parking (X18), were identified as the most influential factors affecting yielding behavior, demonstrating statistical significance in predicting the probability of drivers yielding (Y), and soft yield (SY) compared to not yield (NY).
Moreover, the resulting factor demonstrates distinctions in pedestrian crossing time (X10) as a significant factor influencing the yielding behavior of C1 but showing insignificance in the case of C2. The design and timing of signalized crosswalks may be optimized to facilitate efficient traffic flow. When pedestrian crossing time is well-coordinated with traffic signal phases, drivers may not perceive it as a significant factor influencing their yielding behavior and, as a result, may not alter their behavior based on this factor.
Table 8 and Table 9 also show the proportion of driver behaviors and the results of the Pearson Chi-square test. It reveals that most observed factors correlate significantly with yield behavior occurrences. These factors were further used to describe the chance of NY, SY, and Y occurrences based on MNL models (i.e., S1-S5), as shown in Table 10 and Table 11. To validate the model consistency, the driver yielding behavior of S1-S5 models. The data extracted from the obtained model were evaluated. A comparison of the results from the prediction by the model and the actual observation showed that the model of the driver yielding behavior could predict correctly to over 85%. The Hosmer-Lemeshow test (p-value), the coefficient estimates, their t-statistics, and the parameters for the utility functions confirmed that the model was well-fitted. Moreover, the ρ2 values in the table indicated strong models regarding the overall goodness of fit.
The factors that consistently influence predicting driver yielding behavior across all S1-S4 models include the vulnerable group (X6), the speed of MC (X12) and PC (X13), headway of vehicles (X15), the post encroachment time (PET) between a vehicle (i.e., MC (X16) and PC (X17)), and roadside parking (X18). This influence is mainly derived from the perception and displaying similar behavioral characteristics. However, there are differences in the result of factors such as the number of pedestrian crossings (X7), pedestrian crossing time (X10), and the number of vehicles approaching crosswalks (X14). One likely reason for these differences is the roadway characteristics (i.e., the number of traffic lanes, the width of the traffic lanes, crosswalk distance, and the presence of a pedestrian refuge island), as well as environmental factors (i.e., roadside activities, and land use of the road section).
The factors significantly correlated with yield behavior occurrences across all S1-S4 models were consistent with the S5 model. S5 can be considered representative in explaining overall behavior at all sites due to its consistency and comparability of data. This conclusion is supported by the results of the Pearson Chi-square test, p-value, coefficient estimates, and the parameters for the utility functions, all of which confirmed that the model was well-fitted.
The results of the S5 model revealed that the factors related to roadway characteristics, such as the number of traffic lanes (X1), the width of the traffic lanes (X2), the width of the crosswalk (X3), and the length of the crosswalk (X4) are significantly associated with driver behavior. In the case of C1, the positively signed coefficients are statistically significantly associated with driver Y and SY behaviors compared to NY, which possibly causes a potential risk of a pedestrian crash. In urban areas, arterial roadways provide multiple lanes and overly wide lane widths (more than 3.0 meters). Similarly, the C2 is the positively signed coefficient statistically significantly associated with driver Y and SY behaviors compared to NY. The presence of OSB and zig-zag lines may serve as a visual cue for drivers to yield to pedestrians, and red-painted areas on the crosswalk lead to an improvement in clear driving visibility when approaching the crosswalk area. The installation of C2 significantly and positively impacted drivers’ yielding behavior across various locations designed to manage multi-lane traffic and the physical characteristics of the crosswalk, which are effective in accommodating mixed traffic conditions.
The presence of pedestrian refuge islands (X5) did not significantly influence predicting driver yielding behavior, which could be attributed to drivers perceiving refuge islands as a standard feature of crosswalks, and their presence may not considerably alter driver behavior. The effectiveness of a refuge island in influencing driver behavior may depend on its visibility and design. If the island is not visible or well-integrated into the road environment, drivers may not recognize it as a significant factor affecting their behavior.
The key findings highlight those three pedestrian characteristics, namely the presence of a vulnerable group (X6), the number of pedestrian crossings (X7), and pedestrian crossing time (X10), which are statistically significantly associated with driver behaviors. The non-vulnerable group tended to perform Y (compared to NY) at 0.521 and 0.658 times in the case of C1 and C2, respectively. At the same time, the non-vulnerable group tended to perform SY at 0.596 and 0.689 times in the case of C1 and C2, respectively. Results consistently show drivers tend to yield more to the vulnerable group, indicating a lower risk. The vulnerability of these individuals triggers a protective response in drivers, fostering a heightened sense of responsibility for their safety.
Meanwhile, the number of pedestrian crossings (X7) significantly influenced the probability of yielding behavior. It tended to perform Y (compared to NY) at 0.552 and 0.639 times in the case of C1 and C2, respectively. The number of pedestrian crossings tended to perform SY at 0.582 and 0.607 times in the case of C1 and C2, respectively. It was observed that pedestrians crossing groups tended to walk slower than when crossing alone. In addition, the frequency of pedestrians attempting to cross the crossing area can influence how drivers respond to these crossing events and become more cautious.
Regarding the pedestrian crossing time (X10) of C1, it significantly influenced the probability of yielding behavior and tended to perform Y and SY, compared to NY, at 0.684 and 0.471 times, respectively. The timing of pedestrian crossings can affect their visibility to drivers. If a pedestrian crosses quickly, drivers may perceive the crossing as less risky, potentially leading to a greater likelihood of yielding. Moreover, pedestrians crossing with larger groups walked at slower crossing time, on average, than those crossing with smaller groups or alone. One likely reason for that is the reliance of pedestrians on groups to guide them while taking less time to perceive the environment (i.e., looking at the pedestrian crossing and for incoming traffic). However, it’s essential to consider the various factors that impact pedestrian crossing time as it is a complex interplay of multiple variables, including traffic conditions, pedestrian age, physical ability, the specific circumstances of the crossing, and long crosswalks may disrupt the flow of traffic, potentially leading to differences in driver behavior.
The remaining pedestrian characteristic variables, including the position of the pedestrian waiting area (X8) and pedestrian waiting time (X9), did not significantly influence the prediction of driver yielding behavior. The unmarked area and visibility in the pedestrian waiting area, possibly obscured by barriers, may render its specific position less critical. Drivers are more inclined to respond to visible signals, such as traffic lights and pedestrian signals, rather than placing significant importance on the part of the pedestrian waiting area. The pedestrian waiting time is not communicated to drivers, or if the waiting room is not highly visible, drivers may not be aware of the time when pedestrians have been waiting. This lack of awareness can reduce the impact of waiting time on driver behavior. Drivers may prioritize other immediate factors, such as road conditions, the presence of different vehicles, and the traffic flow, which may have influenced the importance of pedestrian waiting time.
Regarding traffic characteristics, type of vehicles (X11) did not significantly influence the probability of yielding behavior. Regardless of their vehicle type, drivers tend to exhibit similar compliance with traffic rules. Also, the overall behavior of the driver, rather than the specific vehicle type, might be more noticeable in their perception.
One worrying and widespread behavior observed in the current study was that the predictors related to the primary cause of vehicle-pedestrian collisions and yielding behavior are the speed of MC (X12) and PC (X13) in the case of C1 and C2. As expected, positive signed coefficients of the speed of MC tended to perform Y (compared to NY) at almost 0.720 times and SY at nearly 0.670 times. For PC's speed, it tended to perform Y at almost 0.720 times and SY at almost 0.710 times. At higher speeds, drivers may have limited reaction time, leading to a reduced stopping sight distance for safe detection and reaction to pedestrians and an increased stopping distance required for vehicles.
The number of vehicles approaching crosswalks (X14) significantly influenced the probability of Y and SY behaviors compared to NY. In congested traffic conditions, drivers may have opportunities to give way to pedestrians due to the slow-moving traffic flow. They may be more willing to Y or SY to pedestrians. In situations with more vehicles, drivers are more confident to yield to pedestrians, mainly because it would lessen the likelihood of rear-end crashes. Higher yielding rates were observed when another vehicle followed the leading vehicle. For instance, when the first vehicle’s driver yielded, it caused the vehicle behind it to stop.
An interesting finding from this study is that the headway of vehicles (X15), which refers to the distance or gap between successive vehicles, influences the probability of Y and SY behaviors. It tended to perform Y (compared to NY) at 0.336 and 0.852 times in the case of C1 and C2, respectively. The headway of vehicles tended to perform SY at 0.458 and 0.609 times in the case of C1 and C2, respectively. This finding may be attributed to the more significant headway in maintaining safe distances between vehicles and avoiding crashes, allowing drivers sufficient time to respond by yielding appropriately. The shorter headway between vehicles makes it difficult for drivers to find a gap and time to yield to pedestrians. Vehicles are likely to be closely spaced, and drivers may feel compelled to maintain the pace of traffic and keep up with its flow. In contrast, a longer headway allows drivers more time and space to notice pedestrians and safely yield to them. This allows drivers as it enables drivers to be more aware of their surroundings, including that of pedestrians.
A general look at the post encroachment time (PET) between a vehicle (i.e., MC (X16) and PC (X17)) and pedestrians showed that it influenced the drivers' tending Y and SY behaviors, which influenced the proximity and interaction between pedestrians and vehicles. This finding may be associated with a conflict that reflects the level of pedestrian safety at a crosswalk area. The PET is essential and significantly influences the probability of yielding behavior because it indicates the time available for a driver to respond and the severity of traffic conflicts.
Our results also hold implications for roadside parking (X18) as one of the main factors influencing the drivers' tending Y and SY behaviors at the crosswalk area. The MNL model's results revealed that the drivers without roadside parking at the crosswalk area of C1 and C2 tended to perform Y at almost 0.670 times and SY at nearly 0.600 times, higher than those with roadside parking. One likely reason for the absence of roadside parking at the crosswalk area is associated with improved visibility for drivers observing pedestrians crossing. Unobstructed visibility is crucial for drivers to detect pedestrians and anticipate their movements.
This study analyzed the factors influencing drivers' yielding behavior and compared the findings with previous research. Our results align with prior studies regarding the number of traffic lanes [28,29,33,38,41,43]. Similarly, the width of traffic lanes (as indicated by previous research [30]), along with the width and length of the crosswalk [33,34,35], were identified as factors that affect drivers' inclination to yield. It's worth noting that, in the case of C2, these factors contribute to drivers being more likely to yield, which is consistent with existing literature.
Regarding the vulnerable group, this finding is consistent with the results of previous studies [40,41], which found that conflicts between males and vehicles were significantly higher than those with females. Higher conflicts imply that drivers exhibit less yielding behavior towards male pedestrians. This result could be explained from both the observed pedestrian and driver perspectives. Male pedestrians might be perceived as more careless, and from the driver’s perspective, they may yield more toward female pedestrians because of their helpful attitude. However, further studies are required to explore the effect of pedestrian gender on drivers' psychology, motivations, perceptions, and attitudes.
Regarding the number of pedestrian crossings, drivers tended to yield more when more than one person waited. A pedestrian group of more than one person and the significant distance between the vehicle and the pedestrian reduces the likelihood of conflicts between them. This finding is consistent with that of a previous study [33,34,35,36,37,41,45,46].
Concerning the pedestrian crossing time of the crosswalk, they significantly increased the rate of driver yielding. This result is consistent with the previous research [36], which observed an increase of 50% in the yielding rate.
The speed of a vehicle has a significant impact on the behavior of drivers towards pedestrians. This finding is in line with the conclusions of previous studies [36,39,45,46,54,55]. A vehicle moving at high speeds can make it difficult for the driver to perceive their surroundings, including pedestrians at crosswalks. The reduced visibility associated with increased speeds increases the risk of drivers failing to notice pedestrians.
Earlier research papers such as [33,34,36,37,43,46] illustrate that the number of vehicles approaching crosswalks can impact the yielding behavior of drivers, which is consistent with the findings of the current study. In areas with a higher concentration of vehicles, drivers may face traffic congestion or slower traffic flow. Under such circumstances, drivers might be more inclined to stop and let pedestrians cross the road while navigating through the traffic.
A few factors were found to have a statistically significant impact on driver yielding behavior toward pedestrians. One was roadside parking, consistent with previous research [43] that showed drivers were more likely to yield to pedestrians when their visibility was obstructed. This is because reduced visibility can create a potential hazard for pedestrians.
However, this study found that the position of the pedestrian waiting area and the presence of a pedestrian refuge island did not significantly influence driver yielding behavior. This finding contrasts with previous studies conducted in the USA [33], India [38], and Poland [39]. The inconsistency may be due to differences in enforcement practices and adherence to traffic rules across countries.
In Thailand, the position of the pedestrian waiting area had no significant influence on driver behavior, which was inconsistent with previous studies [33,34,43,46]. It is possible that the locations in those studies had specific design elements and regulations that were more effective in shaping driver conduct. The lack of influence in Thailand may be due to a combination of factors, including insufficiently compelling design elements in the pedestrian infrastructure and different behavioral norms among drivers.
The pedestrian waiting time is inconsistent with a previous study in India [38], UAE [41], and the Czech Republic [45]. Drivers in Thailand may have different behaviors, and the effectiveness of enforcement practices and the overall compliance level with traffic regulations may not prioritize waiting times as a crucial factor in shaping driver behavior.
The findings regarding the type of vehicles are inconsistent with previous research [33,36,37,38,46,48], which found that attributed to variations in the level of compliance among drivers, the prevalence of different vehicle types in mixed traffic conditions, and differences in the perceived roles of various vehicles in traffic.
An exciting discovery from this study is that new factors, which were not previously identified in existing research, influence drivers' tendency to yield to pedestrians. Among these newly identified factors are the headway of vehicles and the post-encroachment time (PET) between vehicles and pedestrians.
The headway of vehicles may influence drivers' yielding behavior at pedestrian crossings, as it reflects the spacing and traffic flow. This finding suggests that the timing and spacing of vehicles play a role in influencing driver behavior at pedestrian crossings, which emphasizes the complexity of factors that contribute to drivers' decisions to yield to pedestrians. Therefore, it highlights the need for a comprehensive understanding of traffic dynamics in the context of pedestrian safety in mixed traffic conditions.
The post-encroachment time (PET) between vehicles and pedestrians is also essential. It offers valuable insights into the complex interaction between a vehicle's movement and the presence of pedestrians in the crosswalk. The recognition of post-encroachment time as a novel influencing factor underscores its importance, contributing to a deeper understanding of how the timing of vehicle movements, in relation to pedestrians, shapes yielding behavior.
5. Conclusions and Recommendations
This study examined driver behavior at midblock crosswalks and factors influencing yielding behavior in mixed traffic. The study compared a typical zebra crossing (C1) and an intelligent signalized crosswalk (C2). The results indicated that C1 often leads to drivers either not yielding or showing soft-yielding behavior, which does not significantly improve yielding behavior. However, C2 showed a noticeable positive trend in influencing the yielding behavior of pedestrians. The coefficients of the variables and odds ratios (OR) further support the superiority of C2 over C1.
Several factors influence the yielding behavior of pedestrians in crosswalks C1 and C2, including the number and width of traffic lanes, the width and length of the crosswalk, the presence of vulnerable groups, the number of pedestrian crossings, the speed and number of vehicles approaching the crosswalk, the headway, post-encroachment time (MC and PC), and roadside parking. Pedestrian crossing time is a significant factor influencing yielding behavior in C1 but shows insignificance in C2, suggesting that the impact of pedestrian crossing time varies between the two types of crosswalks.
This study proposes measures to encourage driver yielding behavior on mixed-traffic urban arterial roads in developing countries. Several conditions indicate the need for improvement from C1 to C2, including multilane roadway crossings with a pedestrian volume of more than 140 persons per hour, an average daily traffic exceeding 13,000, and a posted speed limit greater than 30 km/h. The study also considers road traffic crash statistics, pedestrian crash data, and reports of drivers not yielding to pedestrians.
Effective countermeasures for C1 should consider the number and width of traffic lanes to ensure soft yield and yield behavior. Physical improvements like red-painted areas, warning lights, street bars, rumble strips, and pavement marking can help. Measures like curb extensions and dropped curbs can also reduce crossing distance. Educating vulnerable pedestrian groups about traffic laws, awareness campaigns, and education initiatives that can highlight their vulnerability is important.
Pedestrian crossings at crosswalks can be a basis for implementing enhancements like curb extensions, color contrast or tactile warnings, and improved lighting. Focusing on pedestrian crossing time can improve crossings with staged crossings, pedestrian fencing, and refuge islands, effectively reducing crossing time.
To improve road safety, it is recommended to implement traffic calming measures like raised pedestrian platforms and enforcement measures such as radar speed signs. Narrow road design with visual elements like road markings can be helpful in managing vehicles approaching a crosswalk. Moreover, enforcing roadside parking with land use management strategies like restricting driveways and roadside parking at crosswalk areas can also contribute to safer roads.
To enhance the safety of C2, consider the number and width of traffic lanes. Physical improvements like signs and rumble strips can help narrow the roadway with dropped curbs and curb extensions. Education initiatives, public awareness campaigns, and traffic laws can also help address drivers' yielding behavior. An intelligent signalized crosswalk system can improve safety by reminding drivers to adhere to signals and respect pedestrian right-of-way. Sensors can be used to detect the number of pedestrian crossings.
When addressing the speed of vehicles (MC and PC), headway, and post-encroachment time (PET) between vehicles and pedestrians, it is crucial to consider implementing additional traffic calming measures. These measures may involve a combination of physical improvements and enforcement strategies to enhance safety for pedestrians. Such efforts include raised pedestrian platforms with traffic signals, pedestrian hybrid beacons (PHB), pelican crossings, and puffin crossings. Enforcement measures include violation detection cameras, radar speed signs, license plate recognition (LPR), and other monitoring tools. These enforcement mechanisms aim to reduce vehicle speeds, control the headway between vehicles, and minimize conflicts between vehicles and pedestrians. Educational and campaign measures should improve drivers' attitudes toward obeying speed limits, mainly urban speed limits.
To address the number of vehicles approaching a crosswalk, it is recommended to implement measures, such as narrowing lanes, which can help reduce vehicle overtaking. Implementing sensors or intelligent technology to detect traffic flow can contribute to real-time monitoring and management of vehicle movements. Regarding roadside parking, the primary focus should be on enforcing traffic regulations. Therefore, it is vital that road safety policymakers and police officers ensure the measure's effectiveness, enhance pedestrian safety, and encourage driver yielding behavior, particularly in terms of enforcement and educational efforts.
The study had limitations as it only considered the effects under typical weather and daylight conditions without investigating various factors that could influence the results. To better understand driver yielding behavior, further investigation is needed to understand the motivations for pedestrians’ and drivers’ risky crossing behaviors. Additional research is required to gain a comprehensive understanding of these areas.
Author Contributions
Conceptualization, writing, P.P., L.P., J.S., and K.N.; methodology, P.P., L.P., and J.S.; validation, P.P., L.P., and J.S.; formal analysis, P.P.; data curation, P.P.; writing—original draft preparation, P.P., L.P., J.S., and K.N.; writing—review and editing, P.P., L.P., J.S., and K.N. All authors have read and agreed to the published version of the manuscript.
Funding
The first author would like to thank the Faculty of Engineering at the Prince of Songkla University for granting a 2022 student graduate scholarship.
Institutional Review Board Statement
Not applicable.
Informed Consent Statement
Not applicable.
Data Availability Statement
Data are contained within the article. The datasets utilized and analyzed during the present study are available on reasonable request from the corresponding author.
Conflicts of Interest
The authors declare no conflicts of interest. The funders had no role in the study's design, in the collection, analyses, or interpretation of data, in the writing of the manuscript, or in the decision to publish the results.
References
- Saha, K.; Tishi, R.; Islam, S.; Mitra, K. Pedestrian behavioral pattern and preferences in different road crossing systems of Dhaka city. Journal of Bangladesh Institute of Planners. 2013, 6, 149–160. [Google Scholar]
- Fu, T.; Miranda-Moreno, L.; Saunier, N. A novel framework to evaluate pedestrian safety at non-signalized locations. Accident Analysis & Prevention. 2018, 111, 23–33. [Google Scholar]
- Huseyin, T.; Mahmoud, E.; Goker, A. Pedestrian crossing behavior at midblock crosswalks. Journal of Safety Research. 2019, 71, 49–57. [Google Scholar]
- World Health Organization (WHO). Pedestrian safety: A road safety manual for decision-makers and practitioners; World Health Organization: Geneva, 2013; Available online: https://www.who.int/publications/i/item/pedestrian-safety-a-road-safety-manual-for-decision-makers-and-practitioners (accessed on 25 October 2023).
- World Health Organization (WHO). Global status report on road safety 2018; WHO: Geneva, 2018; Available online: https://www.who.int/publications/i/item/9789241565684 (accessed on 25 October 2023).
- World Health Organization (WHO). Global status report on road safety 2023; WHO: Geneva, 2023; Available online: https://www.who.int/publications/i/item/9789240086517 (accessed on 25 October 2023).
- Department of Highways. Traffic accidents on national highways; Bureau of Highway Safety, Department of Highways. Ministry of Transport: Thailand, 2018–2022; Available online: http://bhs.doh.go.th/download/accident (accessed on 30 October 2023).
- Department of Disease Control. Road accident fatalities 2011-2022; Road accident fatalities integration system (3 bases). Injury Prevention Division. Department of Disease Control, Thailand, 2022.
- Road Safety Administration Center. Thailand Road Safety Master Plan 2022-2027. Department of Disaster Prevention and Mitigation. Ministry of Interior, Thailand, 2023.
- Department of Highways. A study on guidelines for the installation of safe pedestrian crossings; Bureau of Highway Safety, Department of Highways. Ministry of Transport: Thailand, 2023; Available online: http://www.doh.go.th/project/detail/66334 (accessed on 30 October 2023).
- Federal Highway Administration (FHWA). Guide for Improving Pedestrian Safety at Uncontrolled Crossing Locations; Washington, DC, USA, 2018; Report No. FHWA-SA-17-072. [Google Scholar]
- Schneider, J.; Sanders, L. Pedestrian safety practitioners’ perspectives of driver yielding behavior across North America. Transportation Research Record. 2015, 2519, 39–50. [Google Scholar] [CrossRef]
- Siddiqui, A.; Chu, X.; Guttenplan, M. Crossing locations, light conditions, and pedestrian injury severity. Transportation research record: Journal of the transportation research board. 2006, 1982, 141–149. [Google Scholar] [CrossRef]
- Paulo, A.; Giovanni, G.; Peter, J. Factors explaining driver yielding behaviour towards pedestrians at courtesy crossings. Transportation Research Part F. 2020, 73, 453–469. [Google Scholar]
- Zegeer, V.; Stewart, R.; Huang, H.; Lagerwey, P. Safety effects of marked versus unmarked crosswalks at uncontrolled locations; Final Report and Recommended Guidelines; Federal Highway Administration: Washington, DC, USA, 2005; Report no. FHWA-HRT-04-100. [Google Scholar]
- Papantoniou, P.; Yannis, G.; Christofa, E. Which factors lead to driving errors? A structural equation model analysis through a driving simulator experiment, IATSS Res. 2019, 43, 44–50. [Google Scholar]
- Zegeer, V. Development of crash modification factors for uncontrolled pedestrian crossing treatments. NCHRP, 2017. Report no. 841.
- Pechteep, P.; Luathep, P.; Kronprasert, N.; Jaensirisak, S. Safety effectiveness of an upgraded midblock pedestrian crossing on an urban arterial road. Asia-Pacific Journal of Science and Technology (APST). 2023, 28, 1–12. [Google Scholar]
- Pechteep, P.; Luathep, P.; Kronprasert, N.; Jaensirisak, S. Effectiveness of intelligent signalized pedestrian crossing at midblock locations on urban arterial roads in Thailand. In Proceedings of the 15th International Conference of Eastern Asia Society for Transportation Studies, Kuala Lumpur, Malaysia, 4–7 September 2023. [Google Scholar]
- Turner, S.; Fitzpatrick, K.; Brewer, M.; Park, S. Motorist Yielding to Pedestrians at Unsignalized Intersections: Findings from a National Study on Improving Pedestrian Safety. Transportation Research Record. 2006, 1982, 1–12. [Google Scholar] [CrossRef]
- Goddard, T.; Kahn, B.; Adkins, A. Racial bias in driver yielding behavior at crosswalks. Transportation Research Part F: Traffic Psychology and Behaviour. 2015, 33, 1–6. [Google Scholar] [CrossRef]
- Huybers, S.; Houten, V.; Malenfant, L. Reducing Conflicts Between Motor Vehicles and Pedestrians: The Separate and Combined Effects of Pavement Markings and a Sign Prompt. Journal of Applied Behavior Analysis. 2004, 37, 445–456. [Google Scholar] [CrossRef]
- Zhuang, X.; Wu, C. Pedestrian gestures increase driver yielding at uncontrolled mid-block road crossings. Accident Analysis & Prevention. 2014, 70, 235–244. [Google Scholar]
- Yannis, G.; Nikolaou, D.; Laiou, A.; Stürmer, Y.; Buttler, I.; Jankowska-Karpa, D. Vulnerable Road users: Cross-cultural perspectives on performance and attitudes. IATSS Res. 2020, 44, 220–229. [Google Scholar] [CrossRef]
- Dinh, D.; Vũ, N.; McIlroy, R.; Plant, K.; Stanton, N. Effect of attitudes towards traffic safety and risk perceptions on pedestrian behaviours in Vietnam. IATSS Res. 2020, 44, 238–247. [Google Scholar] [CrossRef]
- European Commission. Road safety in the European Union: Trends, Statistics, and Main Challenges, November 2018. Available online: https://road-safety.transport.ec.europa.eu/system/files/2021-07/vademecum_2018.pdf (accessed on 29 October 2023).
- Schneider, J.; Sanatizadeh, A.; Shaon, R.; He, Z.; Qin, X. Exploratory analysis of driver yielding at low-speed, uncontrolled crosswalks in Milwaukee, Wisconsin. Transportation Research Record. 2018, 2672, 21–32. [Google Scholar] [CrossRef]
- Garder, E. The impact of speed and other variables on pedestrian safety in Maine. Accident Analysis & Prevention. 2004, 36, 533–542. [Google Scholar]
- Huang, F.; Stewart, R.; Zegeer, V. Evaluation of lane reduction “road diet” measures on crashes and injuries. Transportation Research Record. 2002, 1784, 80–90. [Google Scholar] [CrossRef]
- Fitzpatrick, K.; Brewer, A.; Avelar, R. Driver yielding at traffic control signals, pedestrian hybrid beacons, and rectangular rapid-flashing beacons in Texas. Transportation Research Record: Journal of the Transportation Research Board. 2014, 2463, 46–54. [Google Scholar] [CrossRef]
- Zegeer, V.; Bushell, M. Pedestrian crash trends and potential countermeasures from around the world. Accident Analysis & Prevention. 2012, 44, 3–11. [Google Scholar]
- Martin, A. Factors Influencing Pedestrian Safety: A Literature Review; TRL: Wokingham, Berks, UK, 2006. [Google Scholar]
- Porter, E.; Neto, I.; Balk, I.; Jenkins, K. Investigating the effects of Rectangular Rapid Flash Beacons on pedestrian behavior and driver yielding on 25 mph streets: A quasi-experimental field study on a university campus. Transportation Research Part F. 2016, 42, 509–521. [Google Scholar] [CrossRef]
- Zheng, Y.; Chase, T.; Elefteriadou, L.; Schroeder, B.; Sisiopiku, P. Modeling vehicle-pedestrian interactions outside crosswalks. Simulation Modelling Practice and Theory. 2015, 59, 89–101. [Google Scholar] [CrossRef]
- Govindaa, L.; Abhignab, D.; Nairc, M.; Shankar, R. Comparative Study of Pedestrian Crossing Behaviour at Uncontrolled Intersection and Midblock Locations. Transportation Research Procedia. 2020, 48, 698–706. [Google Scholar] [CrossRef]
- Anciaes, P.; Guardo, D.; Jones, P. Factors explaining driver yielding behaviour towards pedestrians at courtesy crossings. Transportation Research Part F. 2020, 73, 453–469. [Google Scholar] [CrossRef]
- Torres, C.; Sobreira, L.; Castro-Neto, M.; Cunto, F.; Vecino-Ortiz, A.; Allen, K.; Hyder, A.; Bachani, A. Evaluation of pedestrian behavior on mid-block crosswalks: A case study in Fortalezad-Brazil. Frontiers in Sustainable Cities. 2020, 2, 1–8. [Google Scholar] [CrossRef]
- Kadali, R.; Vedagir, P. Role of number of traffic lanes on pedestrian gap acceptance and risk taking behaviour at uncontrolled crosswalk locations. Journal of Transport & Health. 2020, 19, 100950. [Google Scholar]
- Olszewski, P.; Szagałaa, P.; Wolanski, M.; Zielinska, A. Pedestrian fatality risk in accidents at unsignalized zebra crosswalks in Poland. Accident Analysis and Prevention. 2015, 84, 83–91. [Google Scholar] [CrossRef] [PubMed]
- Koh, P.; Wong, D.; Chandrasekar, P. Safety evaluation of pedestrian behavior and violations at signalized pedestrian crossings. Safety Science. 2014, 70, 143–152. [Google Scholar] [CrossRef]
- Bendak, S.; Alnaqbi, M.; Alzarooni, Y.; Aljanaahi, M.; Alsuwaidi, J. Factors affecting pedestrian behaviors at signalized crosswalks: An empirical study. Journal of Safety Research. 2021, 76, 269–275. [Google Scholar] [CrossRef]
- Papadimitriou, E.; Theofilatos, A.; Yannis, G. Patterns of pedestrian attitudes, perceptions and behavior in Europe. Safety Science. 2013, 53, 114–122. [Google Scholar] [CrossRef]
- Tezcan, O.; Elmorssy, M.; Aksoy, G. Pedestrian crossing behavior at midblock crosswalks. Journal of Safety Research. 2019, 71, 49–57. [Google Scholar] [CrossRef]
- Dileep, R.; Koshy, I.; Sam, S. Study on driver yielding to pedestrians at unsignalized crosswalks. International Journal of Scientific & Engineering Research. 2016, 7, 306–311. [Google Scholar]
- Sucha, M.; Dostal, D.; Risser, R. Pedestrian-driver communication and decision strategies at marked crossings. Accident Analysis & Prevention. 2017, 102, 41–50. [Google Scholar]
- Figliozzi, A.; Tipagornwong, C. Pedestrian Crosswalk Law: A study of traffic and trajectory factors that affect non-compliance and stopping distance. Accident Analysis and Prevention. 2016, 96, 169–179. [Google Scholar] [CrossRef]
- Tankasem, P.; Satiennam, T.; Satiennam, W.; Jaensirisak, S.; Rujopakarn, W. Effects of automated speed control on speeding intention and behavior on mixed-traffic urban arterial roads. IATSS Res. 2022, 46, 492–498. [Google Scholar] [CrossRef]
- Nikolaou, D.; Ntontis, A.; Michelaraki, E.; Ziakopoulos, A.; Yannis, G. Pedestrian safety attitudes and self-declared behaviour in Greece. IATSS Res. 2023, 47, 14–24. [Google Scholar] [CrossRef]
- Kröyer, H. Is 30 km/h a ‘safe’ speed? Injury severity of pedestrians struck by a vehicle and the relation to travel speed and age. IATSS Res. 2015, 39, 42–50. [Google Scholar] [CrossRef]
- Tanishita, M.; Sekiguchi, Y.; Sunaga, D. Impact analysis of road infrastructure and traffic control on the severity of pedestrian-vehicle crashes at intersections and non-intersections using bias-reduced logistic regression. IATSS Res. 2023, 47, 233–239. [Google Scholar] [CrossRef]
- Dinh, D.; Kubota, H. Drivers’ perceptions regarding speeding and driving on urban residential streets with a 30 km/h speed limit. IATSS Res. 2013, 37, 30–38. [Google Scholar] [CrossRef]
- Singh, M.; Pathivada, B.; Rao, K.; Perumal, V. Driver behaviour modelling of vehicles at signalized intersection with heterogeneous traffic. IATSS Res. 2022, 46, 236–246. [Google Scholar] [CrossRef]
- Yoh, K.; Okamoto, T.; Inoi, H.; Doi, K. Comparative study on foreign drivers’ characteristics using traffic violation and accident statistics in Japan. IATSS Res. 2017, 41, 94–105. [Google Scholar] [CrossRef]
- Bella, F.; Ferrante, C. Drivers’ Yielding Behavior in Different Pedestrian Crossing Configurations: A Field Survey. Journal of Advanced Transportation. 2021, 2021, 1–10. [Google Scholar] [CrossRef]
- Avinasha, C.; Goreb, N.; Shriniwasc, A.; Gaurangd, J.; Manoranjan, P. Choice crossing behaviour model for Safety Margin of pedestrian at mid-blocks in India. Transportation Research Procedia. 2020, 48, 2329–2342. [Google Scholar] [CrossRef]
- Washington, P.; Karlaftis, G.; Mannering, F.L. Statistical and Econometric Methods for Transportation Data Analysis; CRC Press Company: Boca Raton, FL, USA, 2003. [Google Scholar]
- Washington, S. Iteratively specified tree-based regression models: Theoretical development and example applied to trip generation. Journal of Transportation Engineering. 2000, 126, 482–491. [Google Scholar] [CrossRef]
- Hosmer, D.; Lemeshow, S. Applied Logistic Regression; Wiley Series in Probability and Statistics; John Wiley & Sons: New York, NY, USA, 2000. [Google Scholar]
- McFadden, D. Conditional logit analysis of qualitative choice behavior. In Frontiers in Economics; Academic Press: New York, NY, USA, 1974; pp. 105–142. ISBN 0-12-776150-0. [Google Scholar]
- McFadden, D.; Train, K. Mixed MNL models for discrete response. Journal of Applied Econometrics. 2000, 15, 447–470. [Google Scholar] [CrossRef]
Disclaimer/Publisher’s Note: The statements, opinions, and data contained in all publications are solely those of the individual author(s) and contributor(s) and not of MDPI and/or the editor(s). MDPI and/or the editor(s) disclaim responsibility for any injury to people or property resulting from any ideas, methods, instructions, or products referred to in the content. |
Figure 1.
The study areas.
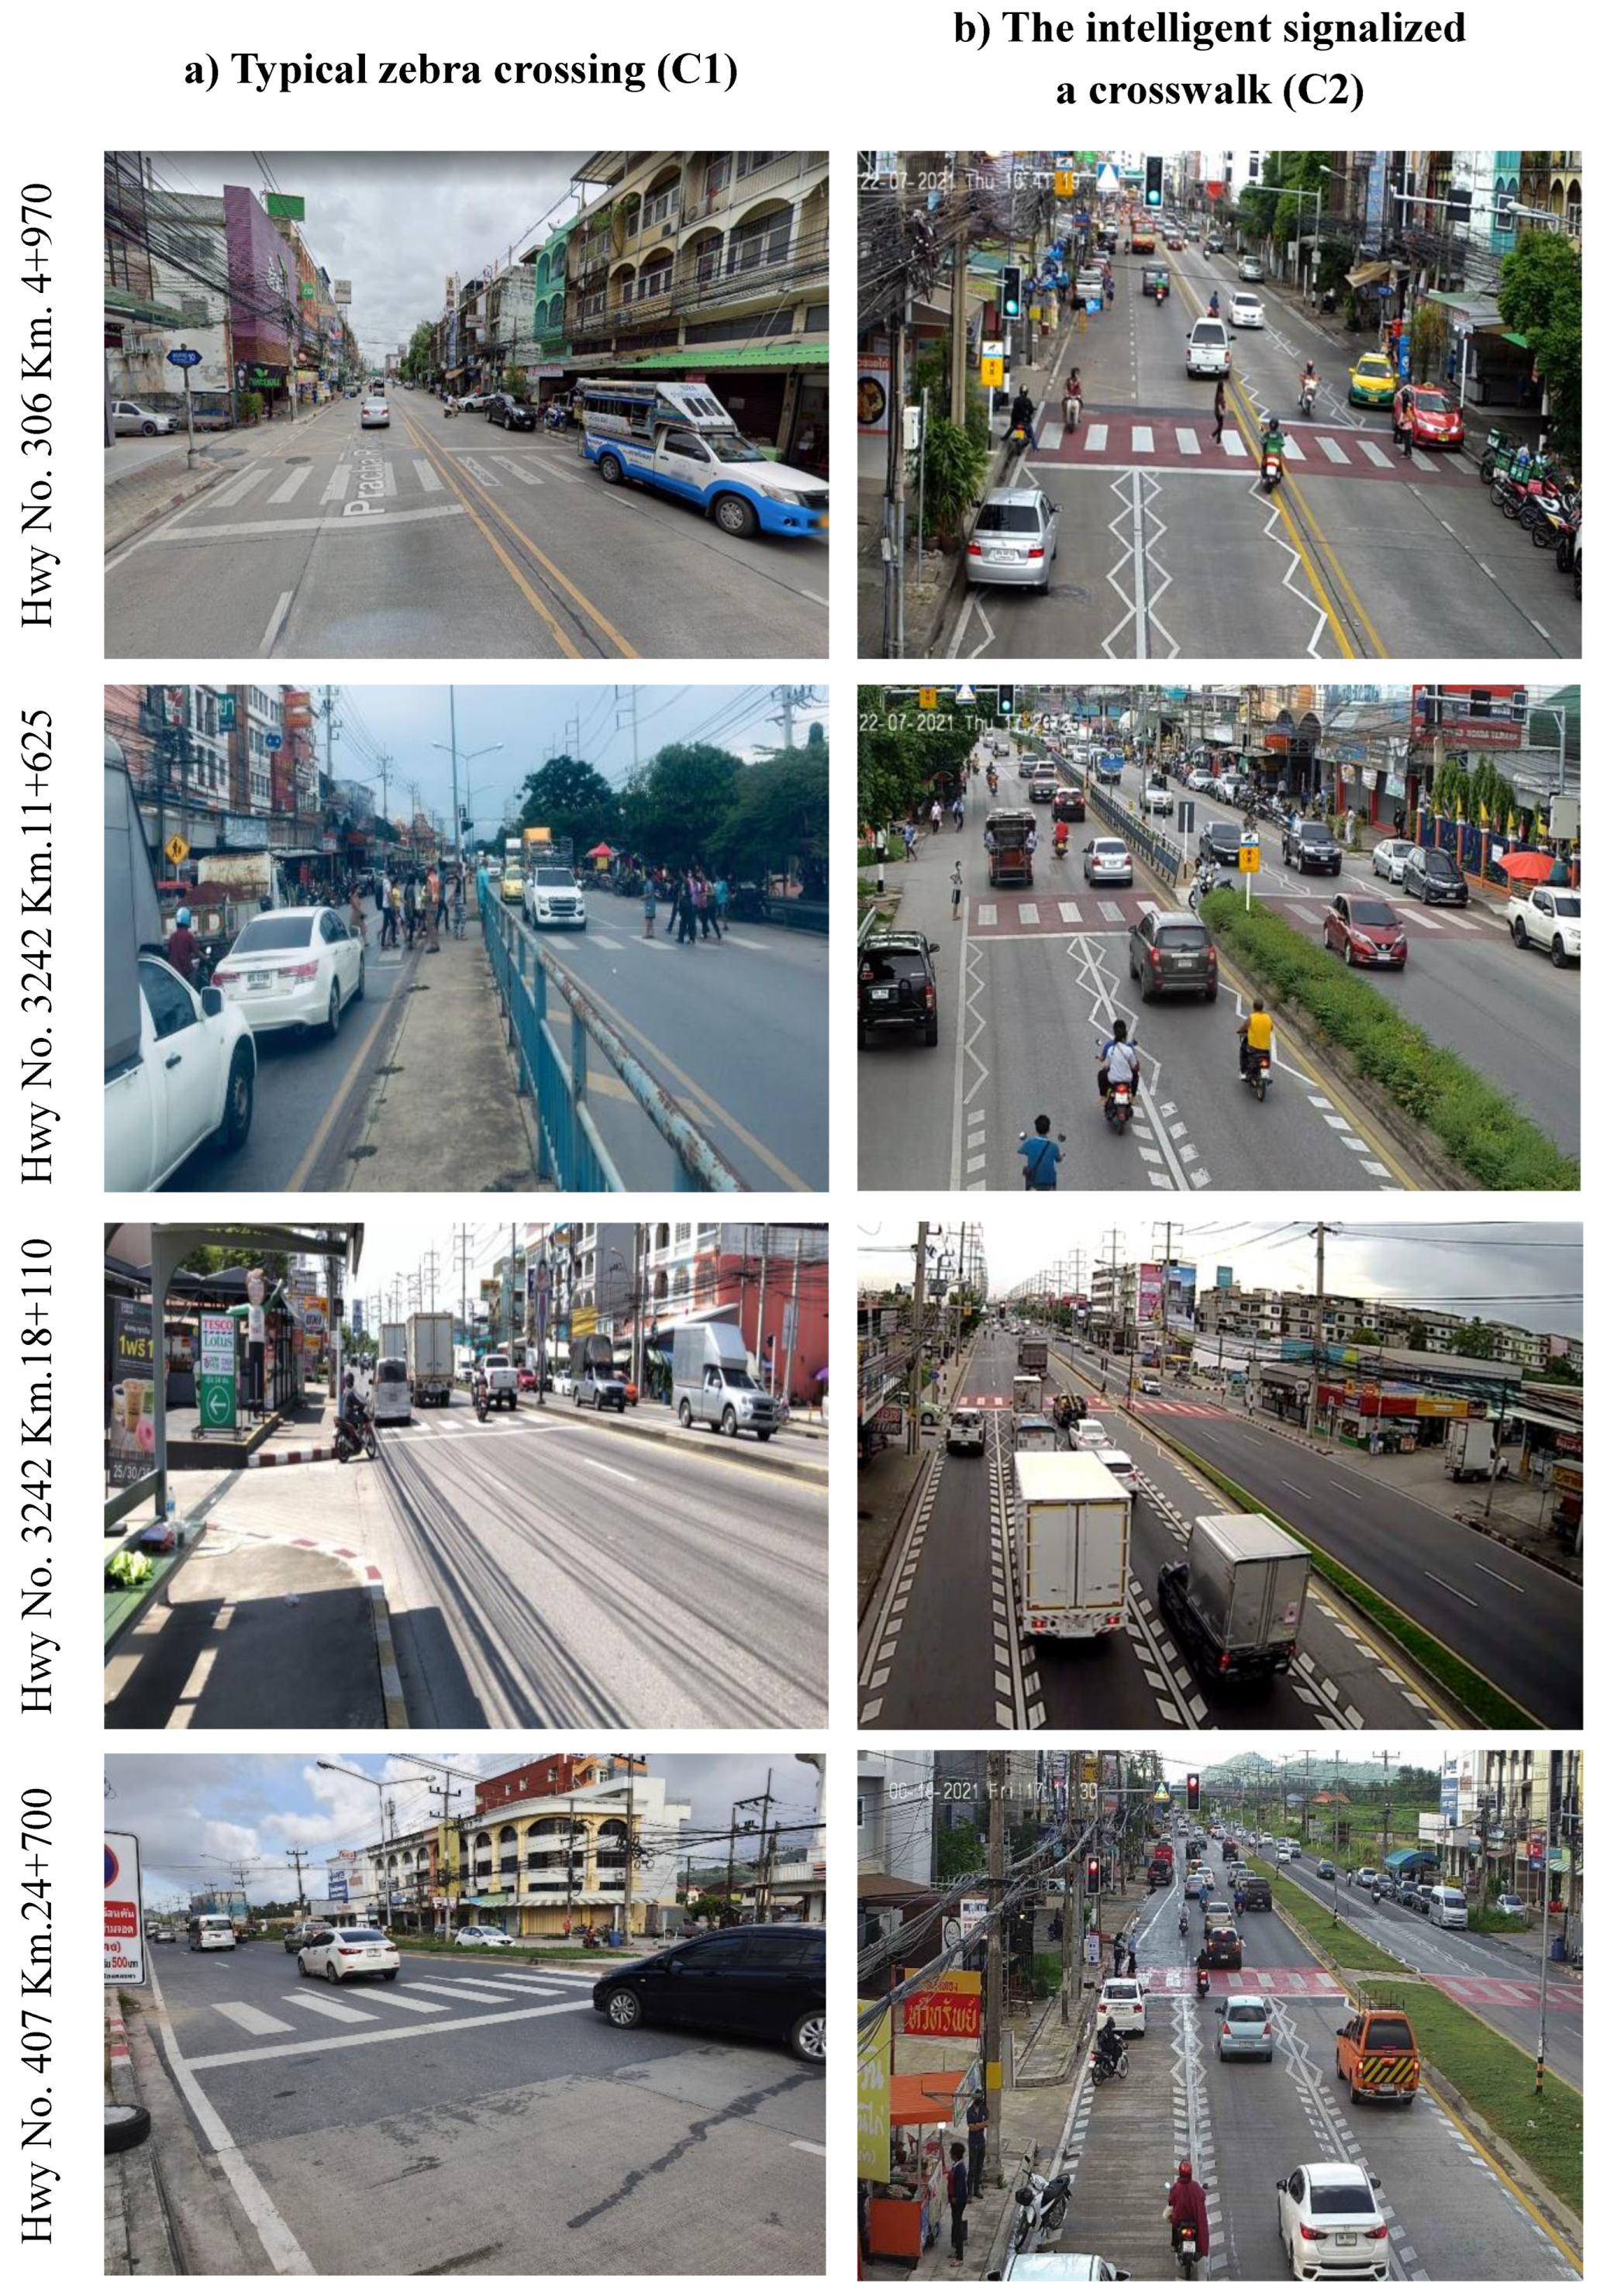
Figure 2.
Descriptive statistics of driver behaviors.
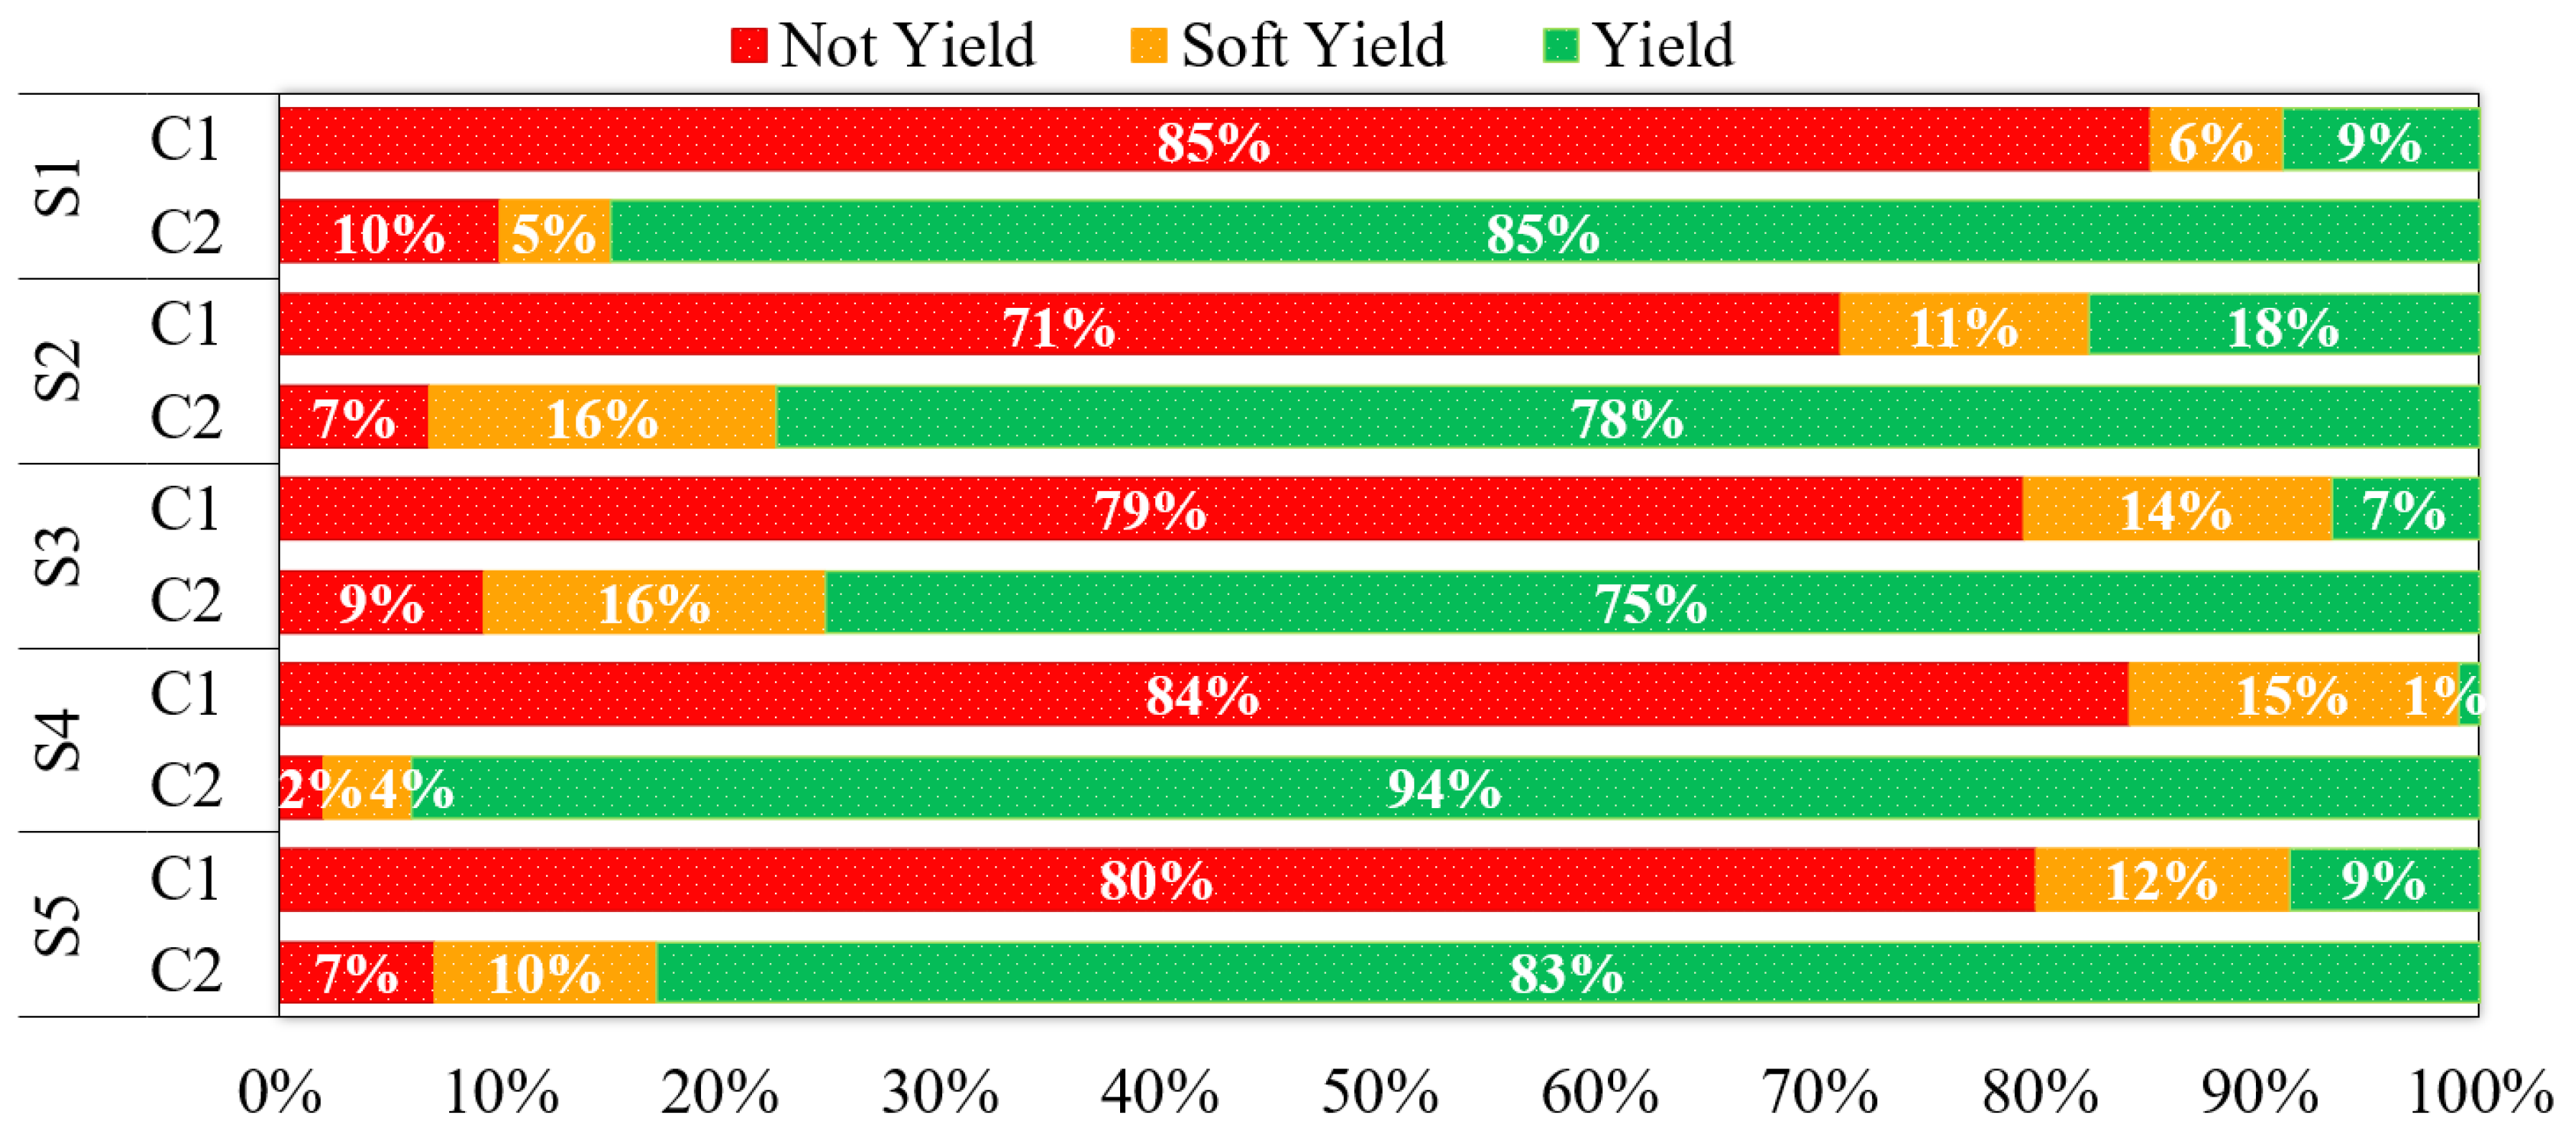
Table 2.
Traffic volume and the number of pedestrian crossings of the four study sites.
| Study site | Number of traffic lanes |
Width of the traffic lanes (m/lane) | Width of the crossing area (m) |
Presence of pedestrian refuge island (m) |
Average traffic volume (Vehicles per hour) |
Pedestrians volume (Persons per hour) |
||
|---|---|---|---|---|---|---|---|---|
| C1 | C2 | C1 | C2 | |||||
| Hwy No. 306 Km.4+970 | 4 (2 lanes per direction) |
3.5 | 4.0 | No | 4,638 | 3,985 | 197 | 218 |
| Hwy No. 3242 Km.11+625 | 4 (2 lanes per direction) |
3.0 | 5.5 | Yes (1.3 m) | 6,124 | 4,802 | 210 | 225 |
| Hwy No. 3242 Km.18+110 | 6 (3 lanes per direction) |
3.5 | 3.0 | Yes (1.8 m) | 4,228 | 5,874 | 145 | 156 |
| Hwy No. 407 Km.24+700 | 4 (2 lanes per direction) |
3.5 | 6.0 | Yes (3.3 m) | 4,552 | 3,863 | 190 | 184 |
Table 3.
Definition of driving behavior characteristics.
| Driving behavior | Description |
|---|---|
| Not Yield (NY) | The driver kept the speed unchanged without yielding to pedestrians crossing at the crosswalk area. |
| Soft Yield (SY) | The driver can yield to the pedestrian by a soft slowing down before reaching the crosswalk area, where the driver slows down to a minimum speed higher than 40 km/h to allow the pedestrian to pass. |
| Yield (Y) | The driver yielded to the pedestrian by coming to a complete stop before the white stop lines across the road. The driver slows to a minimum speed lower than 40 km/h to allow pedestrians to pass. |
Table 5.
85th percentile speeds of C1 and C2.
| Sites | Vehicle types | 85th percentile speeds (km/h) | |||||
|---|---|---|---|---|---|---|---|
| Typical zebra crossing (C1) | Intelligent signalized crosswalk (C2) | ||||||
| NY | SY | Y | NY | SY | Y | ||
| S1 | MC | 70 | 65 | 58 | 66 | 55 | 41 |
| PC | 89 | 81 | 70 | 74 | 67 | 53 | |
| S2 | MC | 72 | 67 | 60 | 64 | 58 | 45 |
| PC | 85 | 77 | 68 | 71 | 64 | 60 | |
| S3 | MC | 75 | 70 | 64 | 60 | 50 | 44 |
| PC | 95 | 87 | 79 | 72 | 69 | 55 | |
| S4 | MC | 71 | 66 | 61 | 68 | 53 | 47 |
| PC | 90 | 84 | 71 | 70 | 64 | 59 | |
| S5 (S1-S4) |
MC | 70-75 | 65-70 | 58-64 | 60-68 | 50-58 | 41-47 |
| PC | 85-95 | 77-87 | 68-79 | 70-74 | 64-69 | 53-60 | |
Table 6.
Descriptive statistics of dichotomous variables.
| Variables | Models | |||||||||
|---|---|---|---|---|---|---|---|---|---|---|
| S1 | S2 | S3 | S4 | S5 | ||||||
| C1 | C2 | C1 | C2 | C1 | C2 | C1 | C2 | C1 | C2 | |
| Vulnerable group (X6) | ||||||||||
| Non-vulnerable group | 40.8% | 45.2% | 34.8% | 39.7% | 48.3% | 40.2% | 37.1% | 36.2% | 40.3% | 40.3% |
| Vulnerable group | 59.1% | 54.8% | 65.2% | 60.3% | 51.6% | 59.8% | 62.8% | 63.8% | 59.7% | 59.7% |
| Position of pedestrian waiting area (X8) | ||||||||||
| No | 33.5% | 29.6% | 30.8% | 23.5% | 24.1% | 22.9% | 41.8% | 21.4% | 32.5% | 24.3% |
| Yes | 66.5% | 70.4% | 69.2% | 76.5% | 75.9% | 77.1% | 58.2% | 78.6% | 67.4% | 75.7% |
| Type of vehicles (X11) | ||||||||||
| MC | 33.3% | 36.3% | 36.8% | 33.1% | 30.8% | 37.8% | 39.1% | 35.2% | 34.7% | 35.6% |
| PC | 66.7% | 63.7% | 63.2% | 66.9% | 69.2% | 62.2% | 61.9% | 64.8% | 65.2% | 64.4% |
| Roadside parking (X18) | ||||||||||
| No | 47.6% | 70.1% | 36.7% | 68.3% | 35.7% | 71.4% | 35.5% | 69.6% | 38.8% | 69.8% |
| Yes | 52.4% | 29.9% | 63.3% | 31.7% | 64.3% | 28.6% | 64.5% | 30.4% | 61.1% | 30.2% |
Table 7.
Descriptive statistics of continuous variables.
| Variables | Average (SD) | |||||||||
|---|---|---|---|---|---|---|---|---|---|---|
| S1 | S2 | S3 | S4 | S5 | ||||||
| C1 | C2 | C1 | C2 | C1 | C2 | C1 | C2 | C1 | C2 | |
| Number of pedestrian crossings (persons) (X7) | 2.8 (0.8) | 3.1 (0.6) | 3.5 (0.7) | 3.7 (0.5) | 2.5 (0.6) | 2.1 (0.8) | 3.6 (0.9) | 3.2 (0.3) | 3.6 (0.7) | 3.3 (0.8) |
| Pedestrian waiting time (s) (X9) | 30.4 (12.1) | 22.1 (10.2) | 25.2 (9.6) | 19.5 (11.6) | 38.5 (10.3) | 30.5 (13.1) | 40.6 (8.9) | 35.2 (13.1) | 29.7 (10.2) | 25.2 (11.7) |
| Pedestrian crossing time (s) (X10) | 45.5 (13.2) | 40.6 (10.7) | 51.8 (12.6) | 53.4 (14.6) | 44.6 (15.2) | 40.1 (12.3) | 48.4 (11.2) | 43.9 (14.4) | 49.6 (13.1) | 44.8 (12.9) |
| Speed of MC (km/h) (X12) | 65.9 (10.2) | 58.1 (15.6) | 63.4 (10.9) | 55.2 (14.7) | 69.5 (10.1) | 60.5 (12.5) | 64.2 (11.4) | 59.7 (10.8) | 65.7 (10.6) | 57.4 (11.9) |
| Speed of PC (km/h) (X13) | 79.8 (12.3) | 65.4 (14.6) | 75.5 (11.4) | 66.8 (12.8) | 85.6 (14.5) | 69.1 (15.6) | 83.7 (11.5) | 68.5 (13.2) | 79.4 (12.4) | 67.5 (13.1) |
| Number of vehicles approaching crosswalk (vehicles) (X14) | 3.5 (0.7) | 2.7 (0.5) | 2.9 (0.6) | 3.4 (0.3) | 2.5 (1.0) | 2.8 (0.7) | 4.5 (1.1) | 3.6 (0.9) | 3.4 (0.8) | 3.1 (0.5) |
| Headway (s) (X15) | 9.7 (8.4) | 10.5 (4.6) | 8.8 (5.8) | 13.5 (4.2) | 4.9 (5.1) | 6.9 (3.9) | 6.0 (3.4) | 8.5 (4.1) | 7.4 (5.6) | 9.2 (4.4) |
| PET between MC and pedestrian (s) (X16) | 2.4 (0.8) | 3.5 (0.2) | 2.1 (0.9) | 3.3 (0.5) | 3.1 (1.5) | 3.0 (1.0) | 2.6 (1.6) | 3.6 (1.1) | 2.6 (1.2) | 3.5 (0.4) |
| PET between PC and pedestrian (s) (X17) | 1.5 (0.6) | 2.9 (0.3) | 1.4 (0.7) | 3.1 (0.5) | 1.2 (0.8) | 3.2 (0.6) | 1.8 (1.0) | 2.9 (0.8) | 1.4 (0.8) | 3.2 (0.6) |
Table 8.
Factors influencing driver behaviors in Y compared to NY of the C1 and C2.
| Variables | Y vs NY | |||||||||
|---|---|---|---|---|---|---|---|---|---|---|
| MNL models | ||||||||||
| S1 | S2 | S3 | S4 | S5 | ||||||
| C1 | C2 | C1 | C2 | C1 | C2 | C1 | C2 | C1 | C2 | |
| p-value | p-value | p-value | p-value | p-value | p-value | p-value | p-value | p-value | p-value | |
| X1 | 0.005* | 0.001* | ||||||||
| X2 | 0.003* | 0.005* | ||||||||
| X3 | 0.005* | 0.002* | ||||||||
| X4 | 0.005* | 0.008* | ||||||||
| X5 | 0.147 | 0.138 | ||||||||
| X6 | 0.005* | 0.009* | 0.004* | 0.003* | 0.010* | 0.005* | 0.006* | 0.005* | 0.002* | 0.006* |
| X7 | 0.001* | 0.000* | 0.004* | 0.000* | 0.097 | 0.104 | 0.066 | 0.114 | 0.002* | 0.001* |
| X8 | 0.079 | 0.087 | 0.125 | 0.214 | 0.185 | 0.118 | 0.068 | 0.105 | 0.124 | 0.091 |
| X9 | 0.145 | 0.548 | 0.227 | 0.077 | 0.114 | 0.214 | 0.098 | 0.254 | 0.274 | 0.314 |
| X10 | 0.004* | 0.102 | 0.113 | 0.078 | 0.205 | 0.119 | 0.089 | 0.095 | 0.007* | 0.098 |
| X11 | 0.074 | 0.087 | 0.102 | 0.127 | 0.098 | 0.091 | 0.075 | 0.102 | 0.110 | 0.096 |
| X12 | 0.001* | 0.006* | 0.002* | 0.005* | 0.005* | 0.003* | 0.006* | 0.003* | 0.001* | 0.002* |
| X13 | 0.000* | 0.000* | 0.001* | 0.003* | 0.003* | 0.001* | 0.001* | 0.001* | 0.000* | 0.005* |
| X14 | 0.004* | 0.001* | 0.079 | 0.088 | 0.103 | 0.115 | 0.003* | 0.007* | 0.004* | 0.001* |
| X15 | 0.009* | 0.003* | 0.006* | 0.001* | 0.001* | 0.000* | 0.007* | 0.009* | 0.002* | 0.001* |
| X16 | 0.010* | 0.000* | 0.007* | 0.001* | 0.005* | 0.000* | 0.006* | 0.001* | 0.001* | 0.003* |
| X17 | 0.000* | 0.001* | 0.001* | 0.001* | 0.005* | 0.001* | 0.002* | 0.001* | 0.001* | 0.000* |
| X18 | 0.001* | 0.010* | 0.001* | 0.008* | 0.003* | 0.009* | 0.001* | 0.002* | 0.009* | 0.007* |
| N | 400 | 400 | 400 | 400 | 400 | 400 | 400 | 400 | 1,600 | 1,600 |
Note: The names of the variables (X) are listed in Table 4. The reference category is non-compliance to law-obeying (i.e., not yield). *Statistically significant is set at a 5% level.
Table 9.
Factors influencing driver behaviors in SY compared to NY of the C1 and C2.
| Variables | SY vs NY | |||||||||
|---|---|---|---|---|---|---|---|---|---|---|
| MNL models | ||||||||||
| S1 | S2 | S3 | S4 | S5 | ||||||
| C1 | C2 | C1 | C2 | C1 | C2 | C1 | C2 | C1 | C2 | |
| p-value | p-value | p-value | p-value | p-value | p-value | p-value | p-value | p-value | p-value | |
| X1 | 0.005* | 0.001* | ||||||||
| X2 | 0.006* | 0.010* | ||||||||
| X3 | 0.010* | 0.008* | ||||||||
| X4 | 0.009* | 0.004* | ||||||||
| X5 | 0.116 | 0.168 | ||||||||
| X6 | 0.003* | 0.005* | 0.010* | 0.010* | 0.003* | 0.003* | 0.008* | 0.001* | 0.004* | 0.001* |
| X7 | 0.000* | 0.001* | 0.000* | 0.001* | 0.085 | 0.097 | 0.110 | 0.091 | 0.001* | 0.005* |
| X8 | 0.214 | 0.106 | 0.154 | 0.089 | 0.116 | 0.163 | 0.211 | 0.162 | 0.109 | 0.151 |
| X9 | 0.224 | 0.314 | 0.105 | 0.325 | 0.098 | 0.241 | 0.196 | 0.228 | 0.152 | 0.332 |
| X10 | 0.008* | 0.125 | 0.006* | 0.154 | 0.224 | 0.174 | 0.096 | 0.104 | 0.005* | 0.116 |
| X11 | 0.078 | 0.107 | 0.096 | 0.124 | 0.108 | 0.213 | 0.075 | 0.103 | 0.082 | 0.077 |
| X12 | 0.000* | 0.000* | 0.000* | 0.001* | 0.001* | 0.000* | 0.003* | 0.000* | 0.001* | 0.005* |
| X13 | 0.000* | 0.008* | 0.001* | 0.003* | 0.000* | 0.001* | 0.001* | 0.001* | 0.006* | 0.004* |
| X14 | 0.006* | 0.009* | 0.085 | 0.064 | 0.094 | 0.101 | 0.001* | 0.005* | 0.004* | 0.001* |
| X15 | 0.001* | 0.002* | 0.007* | 0.001* | 0.002* | 0.005* | 0.001* | 0.007* | 0.001* | 0.005* |
| X16 | 0.004* | 0.001* | 0.002* | 0.001* | 0.001* | 0.001* | 0.002* | 0.000* | 0.005* | 0.002* |
| X17 | 0.000* | 0.000* | 0.001* | 0.005* | 0.000* | 0.001* | 0.000* | 0.000* | 0.003* | 0.002* |
| X18 | 0.008* | 0.009* | 0.004* | 0.001* | 0.005* | 0.007* | 0.002* | 0.001* | 0.008* | 0.004* |
| N | 400 | 400 | 400 | 400 | 400 | 400 | 400 | 400 | 1,600 | 1,600 |
Note: The names of the variables (X) are listed in Table 4. The reference category is non-compliance to law-obeying (i.e., not yield). *Statistically significant is set at a 5% level.
Table 10.
Coefficient and Odds ratio of the factors influencing yielding behaviors.
| Variables | Y vs NY | |||||||||||||||||||
|---|---|---|---|---|---|---|---|---|---|---|---|---|---|---|---|---|---|---|---|---|
| MNL models | ||||||||||||||||||||
| S1 | S2 | S3 | S4 | S5 | ||||||||||||||||
| C1 | C2 | C1 | C2 | C1 | C2 | C1 | C2 | C1 | C2 | |||||||||||
| β | OR | β | OR | β | OR | β | OR | β | OR | β | OR | β | OR | β | OR | β | OR | β | OR | |
| X1 | 0.15 | 0.521 | 0.35 | 0.440 | ||||||||||||||||
| X2 | 0.10 | 0.663 | 0.41 | 0.397 | ||||||||||||||||
| X3 | 0.07 | 0.478 | 0.29 | 0.568 | ||||||||||||||||
| X4 | 0.03 | 0.503 | 0.18 | 0.517 | ||||||||||||||||
| X6 | ||||||||||||||||||||
| Non-vulnerable group | 0.11 | 0.623 | 0.21 | 0.524 | 0.17 | 0.741 | 0.20 | 0.663 | 0.24 | 0.714 | 0.11 | 0.695 | 0.21 | 0.589 | 0.19 | 0.522 | 0.28 | 0.521 | 0.18 | 0.658 |
| Vulnerable Group | 1.000 | 1.000 | 1.000 | 1.000 | 1.000 | 1.000 | 1.000 | 1.000 | 1.000 | 1.000 | ||||||||||
| X7 | 0.21 | 0.783 | 0.27 | 0.335 | 0.20 | 0.882 | 0.22 | 0.714 | 0.35 | 0.552 | 0.27 | 0.639 | ||||||||
| X10 | 0.18 | 0.528 | 0.28 | 1.225 | 0.11 | 0.684 | ||||||||||||||
| X12 | 0.11 | 0.583 | 0.10 | 0.669 | 0.14 | 0.668 | 0.08 | 0.654 | 0.22 | 0.665 | 0.11 | 0.698 | 0.28 | 0.417 | 0.21 | 0.663 | 0.35 | 0.559 | 0.12 | 0.714 |
| X13 | 0.13 | 0.669 | 0.19 | 0.741 | 0.22 | 0.771 | 0.10 | 0.779 | 0.35 | 0.711 | 0.19 | 0.881 | 0.11 | 0.632 | 0.39 | 0.574 | 0.29 | 0.662 | 0.35 | 0.711 |
| X14 | 0.20 | 0.797 | 0.25 | 0.574 | 0.19 | 0.558 | 0.21 | 0.668 | 0.33 | 0.459 | 0.41 | 0.692 | ||||||||
| X15 | 0.10 | 0.658 | 0.11 | 0.723 | 0.09 | 0.865 | 0.13 | 0.882 | 0.11 | 0.693 | 0.38 | 0.417 | 0.13 | 0.691 | 0.10 | 0.701 | 0.28 | 0.336 | 0.31 | 0.852 |
| X16 | 0.33 | 0.517 | 0.33 | 0.662 | 0.36 | 0.721 | 0.47 | 0.761 | 0.22 | 0.521 | 0.32 | 0.585 | 0.19 | 0.774 | 0.29 | 0.609 | 0.39 | 0.669 | 0.41 | 0.771 |
| X17 | 0.47 | 0.624 | 0.55 | 0.574 | 0.41 | 0.569 | 0.46 | 0.632 | 0.26 | 0.417 | 0.41 | 0.649 | 0.19 | 0.639 | 0.19 | 0.524 | 0.27 | 0.559 | 0.33 | 0.621 |
| X18 | ||||||||||||||||||||
| No | 0.47 | 2.114 | 1.00 | 0.671 | 0.33 | 0.417 | 1.12 | 0.528 | 0.27 | 0.721 | 0.38 | 0.663 | 0.26 | 0.554 | 1.07 | 0.654 | 0.38 | 0.580 | 0.25 | 0.662 |
| Yes | 1.000 | 1.000 | 1.000 | 1.000 | 1.000 | 1.000 | 1.000 | 1.000 | 1.000 | 1.000 | ||||||||||
| Intercept | -2.15 1109.52 0.12 400 |
-2.11 1089.25 0.13 400 |
-2.36 1100.22 0.11 400 |
-2.41 1107.21 0.14 400 |
-2.10 1147.99 0.12 400 |
-2.54 1033.63 0.16 400 |
-2.21 1183.25 0.11 400 |
-2.04 1112.35 0.13 400 |
-2.63 1025.34 0.15 1600 |
-2.55 1251.14 0.19 1600 |
||||||||||
| -2LL | ||||||||||||||||||||
| ρ2 | ||||||||||||||||||||
| N | ||||||||||||||||||||
Note: The names of the variables (X) are listed in Table 4. The reference category is non-compliance to law-obeying (not yielding). β is the coefficient of the variables, and OR is the odds ratio. The variables presented are statistically significant at a 5% level.
Table 11.
Coefficient and Odds ratio of the factors influencing soft yielding behaviors.
| Variables | SY vs NY | |||||||||||||||||||
|---|---|---|---|---|---|---|---|---|---|---|---|---|---|---|---|---|---|---|---|---|
| MNL models | ||||||||||||||||||||
| S1 | S2 | S3 | S4 | S5 | ||||||||||||||||
| C1 | C2 | C1 | C2 | C1 | C2 | C1 | C2 | C1 | C2 | |||||||||||
| β | OR | β | OR | β | OR | β | OR | β | OR | β | OR | β | OR | β | OR | β | OR | β | OR | |
| X1 | 0.11 | 0.635 | 0.21 | 0.639 | ||||||||||||||||
| X2 | 0.19 | 0.479 | 0.28 | 0.775 | ||||||||||||||||
| X3 | 0.14 | 0.338 | 0.17 | 0.521 | ||||||||||||||||
| X4 | 0.21 | 0.425 | 0.24 | 0.700 | ||||||||||||||||
| X6 | ||||||||||||||||||||
| Non-vulnerable group | 0.06 | 0.521 | 0.11 | 0.665 | 0.09 | 0.441 | 0.04 | 0.601 | 0.08 | 0.641 | 0.03 | 0.520 | 0.11 | 0.440 | 0.10 | 0.602 | 0.14 | 0.596 | 0.21 | 0.689 |
| Vulnerable Group | 1.000 | 1.000 | 1.000 | 1.000 | 1.000 | 1.000 | 1.000 | 1.000 | 1.000 | 1.000 | ||||||||||
| X7 | 0.17 | 0.621 | 0.21 | 0.471 | 0.18 | 0.429 | 0.10 | 0.525 | 0.22 | 0.582 | 0.32 | 0.607 | ||||||||
| X10 | 0.12 | 0.665 | 0.23 | 1.825 | 0.18 | 0.471 | ||||||||||||||
| X12 | 0.25 | 0.714 | 0.19 | 0.660 | 0.27 | 0.685 | 0.18 | 0.521 | 0.15 | 0.885 | 0.19 | 0.625 | 0.14 | 0.785 | 0.16 | 0.632 | 0.29 | 0.609 | 0.39 | 0.662 |
| X13 | 0.21 | 0.521 | 0.14 | 0.705 | 0.15 | 0.547 | 0.12 | 0.638 | 0.28 | 0.632 | 0.15 | 0.417 | 0.10 | 0.714 | 0.19 | 0.774 | 0.25 | 0.585 | 0.47 | 0.704 |
| X14 | 0.10 | 0.632 | 0.09 | 0.664 | 0.09 | 0.669 | 0.11 | 0.603 | 0.29 | 0.647 | 0.38 | 0.659 | ||||||||
| X15 | 0.11 | 0.521 | 0.11 | 0.552 | 0.13 | 0.477 | 0.13 | 0.471 | 0.09 | 0.679 | 0.10 | 0.702 | 0.14 | 0.801 | 0.12 | 0.596 | 0.27 | 0.458 | 0.19 | 0.609 |
| X16 | 0.17 | 0.632 | 0.17 | 0.447 | 0.14 | 0.509 | 0.18 | 0.762 | 0.14 | 0.552 | 0.21 | 0.663 | 0.10 | 0.731 | 0.19 | 0.479 | 0.21 | 0.741 | 0.29 | 0.762 |
| X17 | 0.15 | 0.478 | 0.21 | 0.630 | 0.13 | 0.741 | 0.19 | 0.446 | 0.11 | 0.601 | 0.22 | 0.509 | 0.12 | 0.558 | 0.15 | 0.336 | 0.14 | 0.459 | 0.17 | 0.699 |
| X18 | ||||||||||||||||||||
| No | 0.11 | 0.702 | 0.14 | 0.882 | 0.15 | 0.680 | 0.10 | 0.632 | 0.10 | 0.547 | 0.18 | 0.458 | 0.13 | 0.663 | 0.12 | 0.479 | 0.25 | 0.478 | 0.37 | 0.585 |
| Yes | 1.000 | 1.000 | 1.000 | 1.000 | 1.000 | 1.000 | 1.000 | 1.000 | 1.000 | 1.000 | ||||||||||
| Intercept | -2.15 1109.52 0.12 400 |
-2.11 1089.25 0.13 400 |
-2.36 1100.22 0.11 400 |
-2.41 1107.21 0.14 400 |
-2.10 1147.99 0.12 400 |
-2.54 1033.63 0.16 400 |
-2.21 1183.25 0.11 400 |
-2.04 1112.35 0.13 400 |
-2.63 1025.34 0.15 1600 |
-2.55 1251.14 0.19 1600 |
||||||||||
| -2LL | ||||||||||||||||||||
| ρ2 | ||||||||||||||||||||
| N | ||||||||||||||||||||
Note: The names of the variables (X) are listed in Table 4. The reference category is non-compliance to law-obeying (not yielding). β is the coefficient of the variables, and OR is the odds ratio. The variables presented are statistically significant at a 5% level.
Disclaimer/Publisher’s Note: The statements, opinions and data contained in all publications are solely those of the individual author(s) and contributor(s) and not of MDPI and/or the editor(s). MDPI and/or the editor(s) disclaim responsibility for any injury to people or property resulting from any ideas, methods, instructions or products referred to in the content. |
© 2024 by the authors. Licensee MDPI, Basel, Switzerland. This article is an open access article distributed under the terms and conditions of the Creative Commons Attribution (CC BY) license (http://creativecommons.org/licenses/by/4.0/).
Copyright: This open access article is published under a Creative Commons CC BY 4.0 license, which permit the free download, distribution, and reuse, provided that the author and preprint are cited in any reuse.


